Article

The Effects of Munsell Neutral Grey Backgrounds on the Colour of Chrysoprase and the Application of AP Clustering to Chrysoprase Colour Grading

1
School of Gemmology, China University of Geosciences, Beijing 100083, China
2
Department of Science and Technology, China University of Geosciences, Beijing 100083, China
3
School of Information Engineering, China University of Geosciences, Beijing 100083, China
*
Author to whom correspondence should be addressed.
Minerals 2021, 11(10), 1092; https://doi.org/10.3390/min11101092
Submission received: 4 August 2021 / Revised: 29 September 2021 / Accepted: 1 October 2021 / Published: 4 October 2021
(This article belongs to the Special Issue Colours in Minerals and Rocks)

Abstract

:
Chrysoprase is a popular gemstone with consumers because of its charming apple green colour but a scientific classification of its colour has not yet been achieved. In this research, we determined the most effective background of the Munsell Chart for chrysoprase colour grading under a 6504K fluorescent lamp and applied an affinity propagation (AP) clustering algorithm to the colour grading of coloured gems for the first time. Forty gem-quality chrysoprase samples from Australia were studied using a UV-VIS spectrophotometer and Munsell neutral grey backgrounds. The results determined the effects of a Munsell neutral grey background on the observed colour. It was found that the Munsell N9.5 background was the most effective for colour grading in this case. The observed chrysoprase colours were classified into five groups: Fancy Light, Fancy, Fancy Intense, Fancy Deep and Fancy Dark. The feasibility of the colour grading scheme was verified using the colour difference formula DE2000.

1. Introduction

Chrysoprase is an apple green fine crystalline variety of polycrystalline quartz. It is found all over the world but the best quality gems come from Australia. The origin of its particular colour has always been a controversial topic. Based on previous studies on its mineralisation and colour properties, there are two main forms of chromogenic substances in chrysoprase. One hypothesis associates the colour of chrysoprase with the presence of fine dispersed nickel-bearing layered silicate minerals such as willemseite [1], kerolite [2,3] and pimelite [4,5], which usually occur in the chrysoprase deposits. An alternative hypothesis is that the colour is due to the presence of evenly distributed bunsenite (NiO) [6,7]. The evidence for this phase comes from the weak reflection of the X-ray pattern of Kazakhstan chrysoprase at 2.39 Å [7].
The physical source of the colour of chrysoprase is not the only topic open for investigation. The colour itself can also be affected by the colour properties of the background on which the sample rests, the observer, the illuminance and the colour temperature of the light source. The greenness of chrysoprase can form a gradual series of graded colours that are of great value in the study of colourimetry. This paper presents the effects of Munsell neutral grey backgrounds on the colour of chrysoprase and determines the best classification background. An affinity propagation (AP) clustering algorithm was used to grade the colour of chrysoprase.
In 1994, King et al. [8] proposed a colour classification method for coloured diamonds and introduced the Munsell colour card. The Gem Trade Laboratory (GTL) colour ring was created and the colour description method was defined. A 6504K fluorescent lamp was used as the lighting source and the coloured diamonds were graded in a standard illumination box. This diamond colour grading method was accepted and has been widely used around the world since it was announced. In the following years, the Gemological Institute of America (GIA) successively introduced colour classification methods for blue diamonds [9], pink diamonds [10], yellow diamonds [11] and colourless diamonds [12]. Although the colour classification of diamonds has matured significantly, the classification of other coloured gems and jade remains an open problem to be solved.
To ensure the accuracy of the grading of coloured gems, it is essential to determine their grading environment. In gemology, most of the initial research on the effects of backgrounds on the colour of gemstones has focused on subjective descriptions such as using the naked eye and colour chips to compare colours. The colour of chrysoprase was first quantified by Sachanbiński [3] based on the CIE1931 colour space system but the geometric distance between two colours in this system is inconsistent with human visual perception. In order to solve this problem, the CIE1976 L*a*b* uniform colour space was introduced and applied to the study of gem colours, particularly colour-change garnet [13,14,15,16], tourmaline [17,18], sapphire [19], alexandrite [20], peridot [21,22], cubic zirconia [23], blue amber [24], jadeite-jade [25,26,27,28,29], citrine [30] and amethyst [31]. Tang et al. [21] analysed the colour appearance of peridot applying nine Munsell neutral grey backgrounds based on the CIE1976 L*a*b* uniform colour space system and found that the colours of peridot were much easier to distinguish in the high lightness background. To eliminate the influence of subjective factors and increase the universality of the experimental results, we used the CIE1976 L*a*b* uniform colour space system to quantitatively analyse the colour of chrysoprase on different backgrounds with all 37 Munsell neutral colour chips (glossy edition) being used as test backgrounds.
The clustering algorithm is often used to ensure the objectivity and accuracy of gem colour classification [5,18,21,25,26,27,28,29,31]. Clustering is a discovery process that groups a set of data such that the intracluster similarity is maximised and the intercluster similarity is minimised [32]. Generally, clustering has two aims: (a) to develop a primary understanding of the raw data and (b) to reduce the size of a huge amount of raw data [33]. Most previous works have used k-means clustering to classify the colours of gems [5,18,21,25,26,27,28,29,31] but this method has limitations. The clustering number of the k-means clustering algorithm needs to be artificially set and it is sensitive to the initial clustering centre. Jiang et al. [5] once classified chrysoprase colours into three groups by k-means clustering. However, they did not stipulate why the number of clusters was three; when different initial exemplars were selected, the classification results changed accordingly. The problem is therefore to understand how this technique can be applied to the actual colour grading of precious stones. Affinity propagation (AP) is a relatively new clustering algorithm, introduced by Frey and Dueck [34]. Unlike traditional iterative algorithms such as k-means, AP does not require you to choose k initial exemplars. The core idea of AP is to regard all the data points as potential exemplars. Only pairwise similarities of data points are needed. Messages are exchanged between the data points until a high-quality set of exemplars emerges. The number of exemplars is automatically generated [35]. Due to its effectiveness and simplicity, AP has been applied in areas such as treatment portfolio design [36], region of interest (ROI) detection [37], tissue clustering [38], image categorisation [39] and subspace division [40].
In this article, we investigate chrysoprase colouring using a UV-VIS spectrophotometer and applying the CIE1976 L*a*b* uniform colour space. The apparent colour of the chrysoprase was studied with an X-Rite SP62 spectrophotometer and by using all 37 Munsell neutral grey backgrounds to determine the most effective background for chrysoprase colour classification. The colour of the chrysoprase was classified by the AP clustering algorithm. The method given in this paper is also suitable for the evaluation of other gems.

2. Materials and Methods
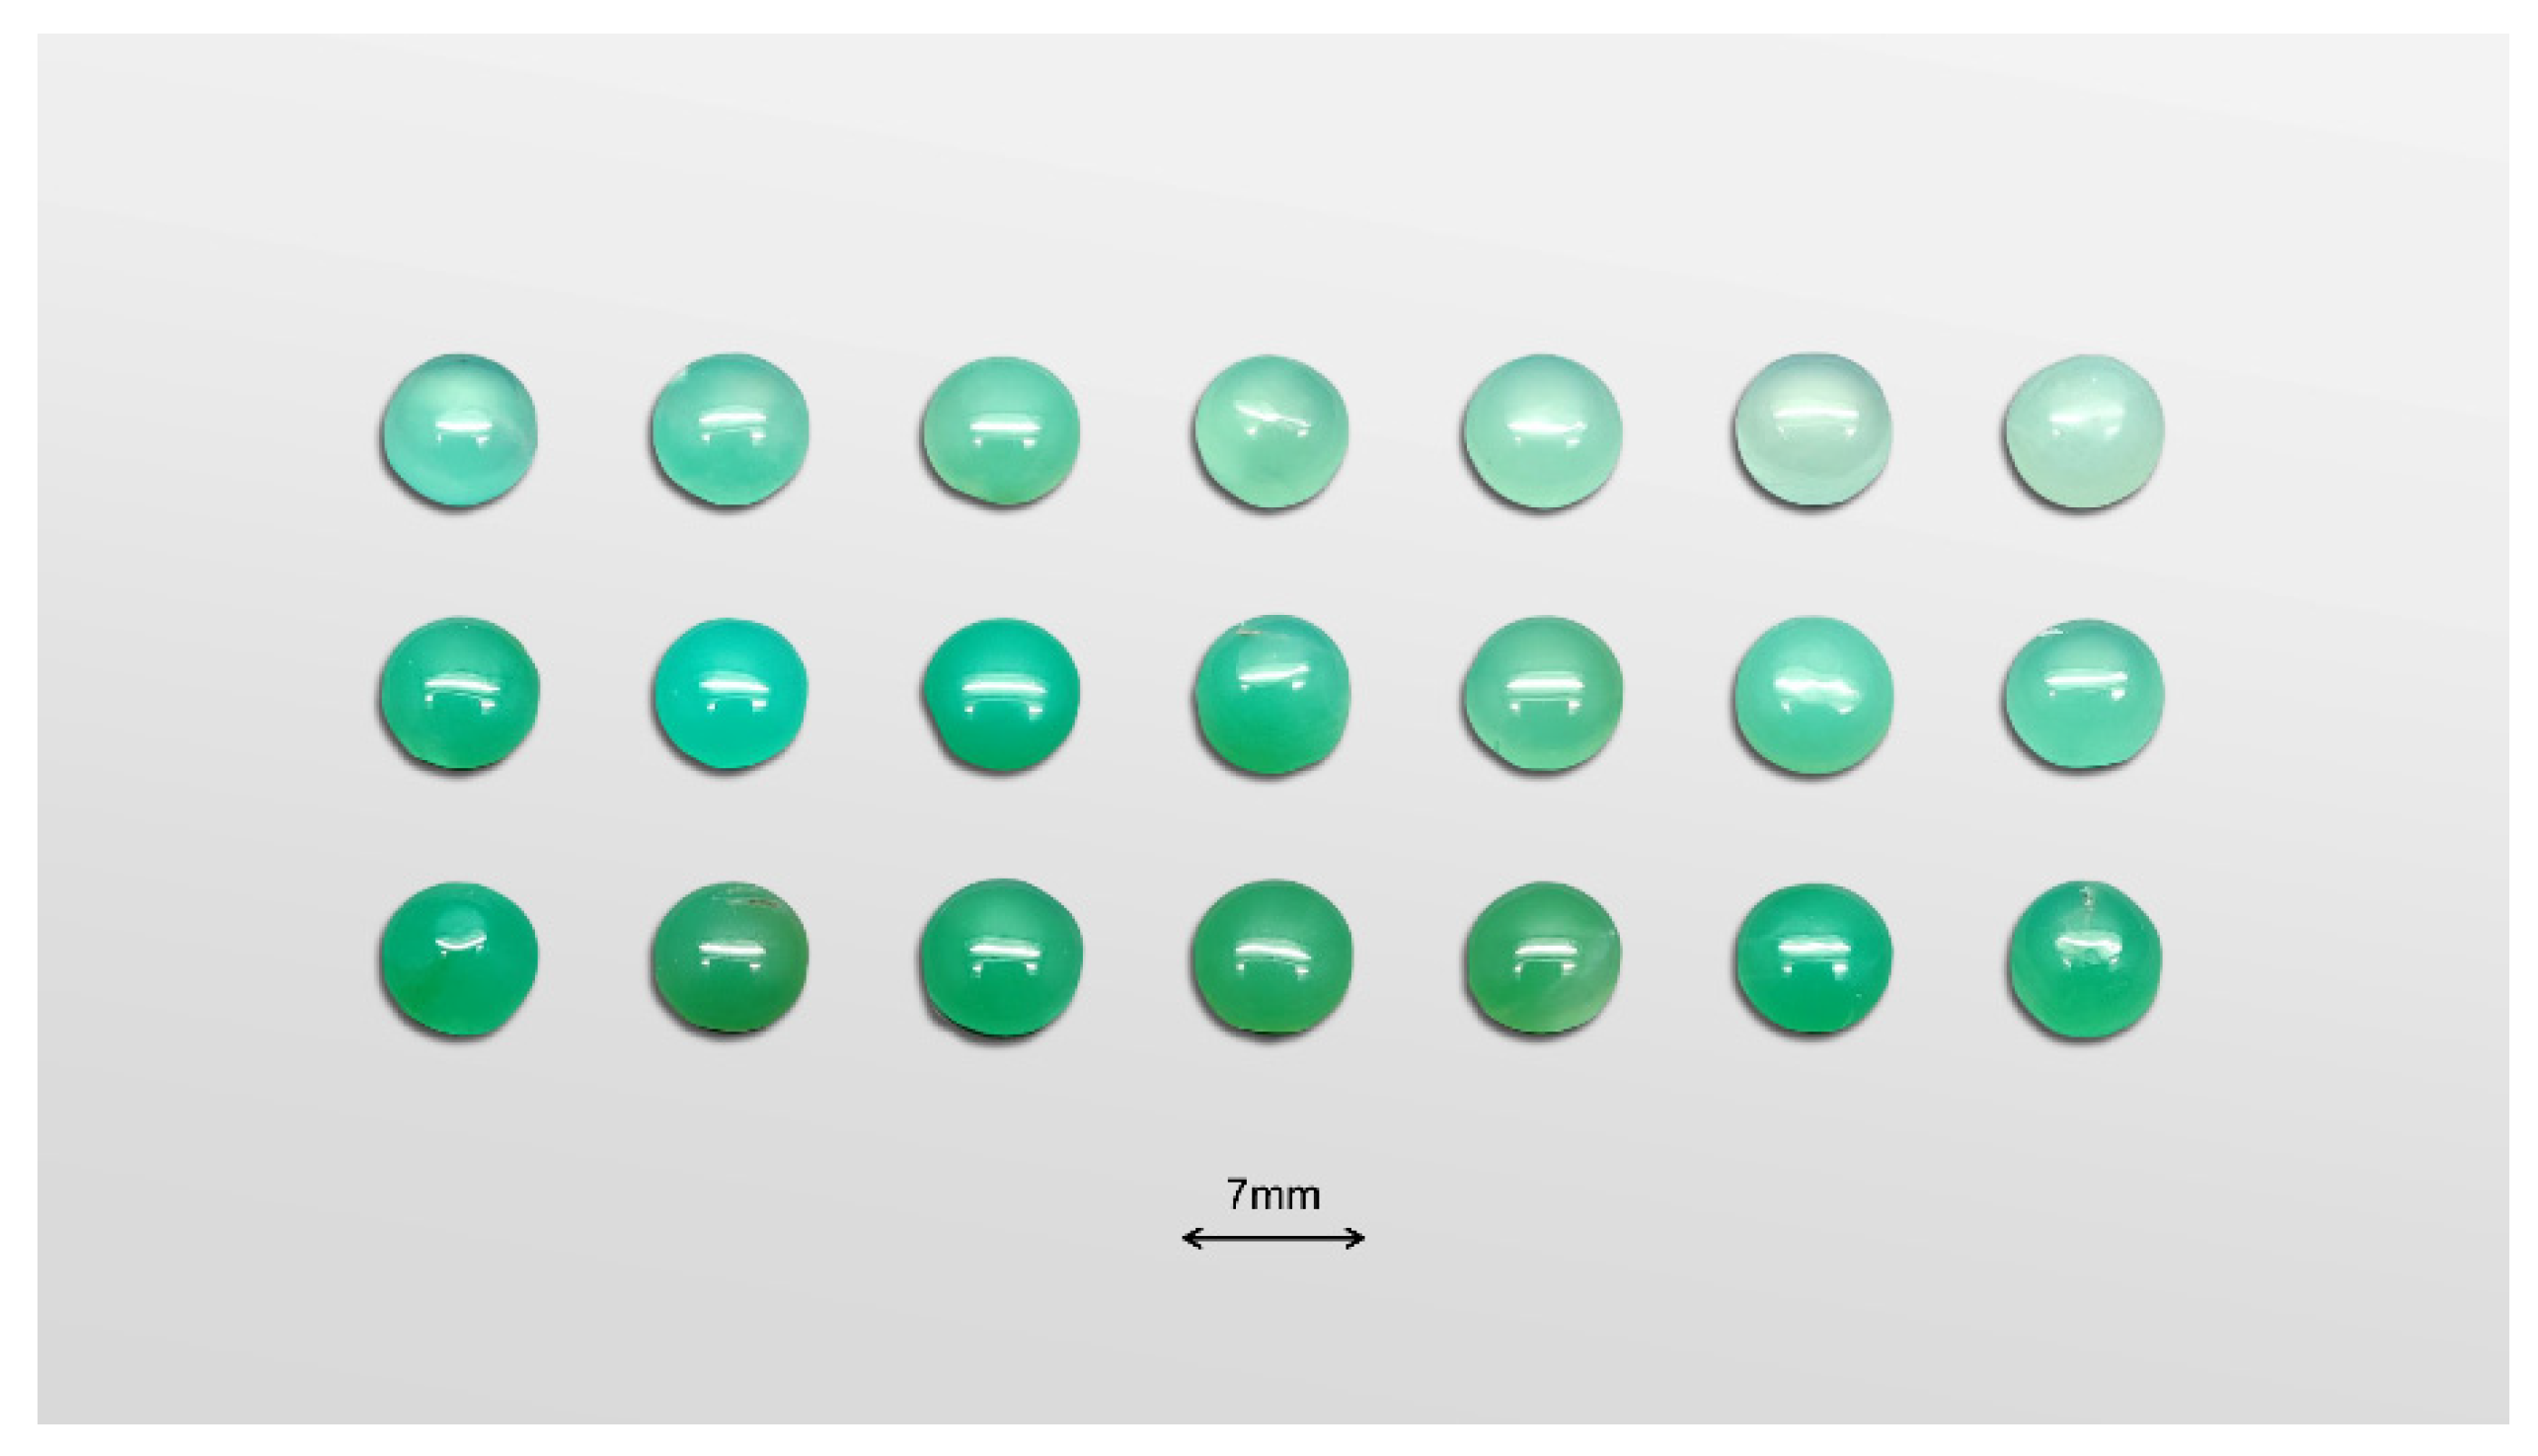
2.1. Samples

A total of 40 natural chrysoprase samples from Australia were selected for this study with colours ranging progressively from pale to bright green. Each sample was cut into a polished cabochon with a diameter of 7 mm. A few of the samples are shown in Figure 1.

2.2. UV-VIS Spectroscopy
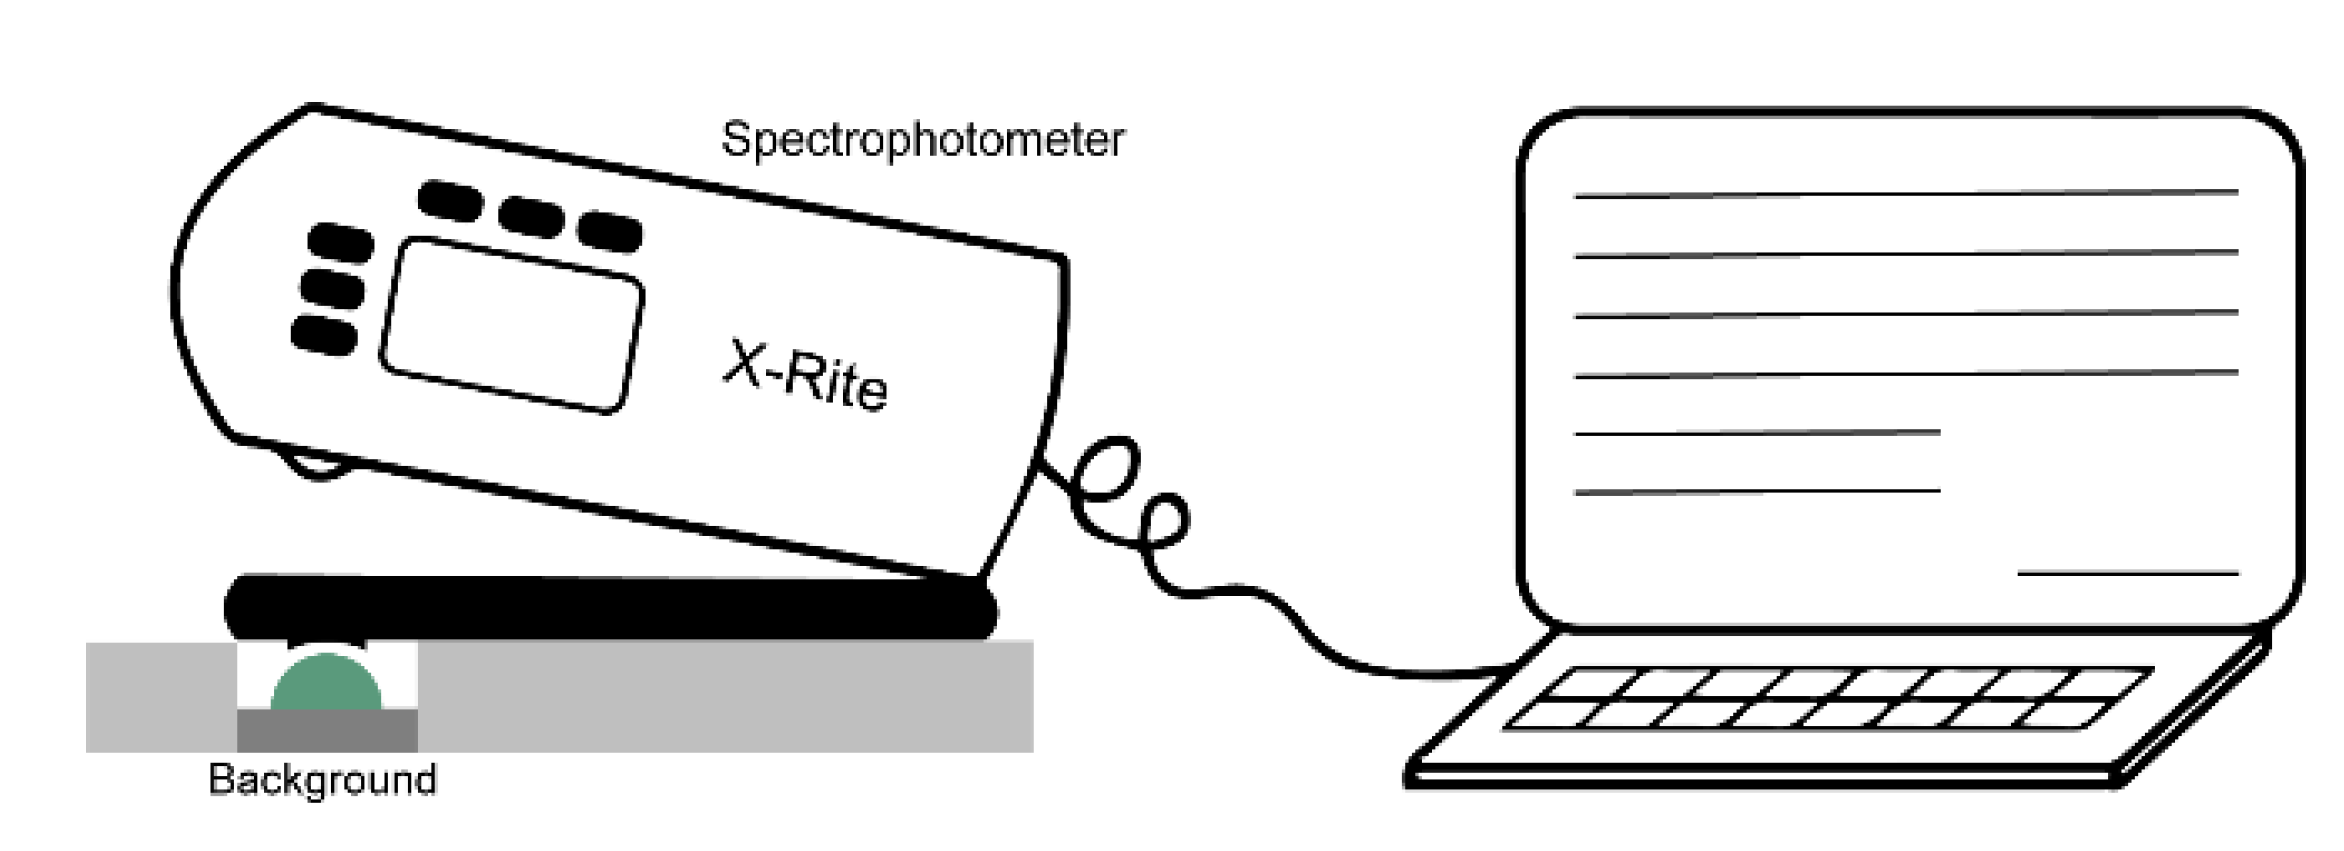
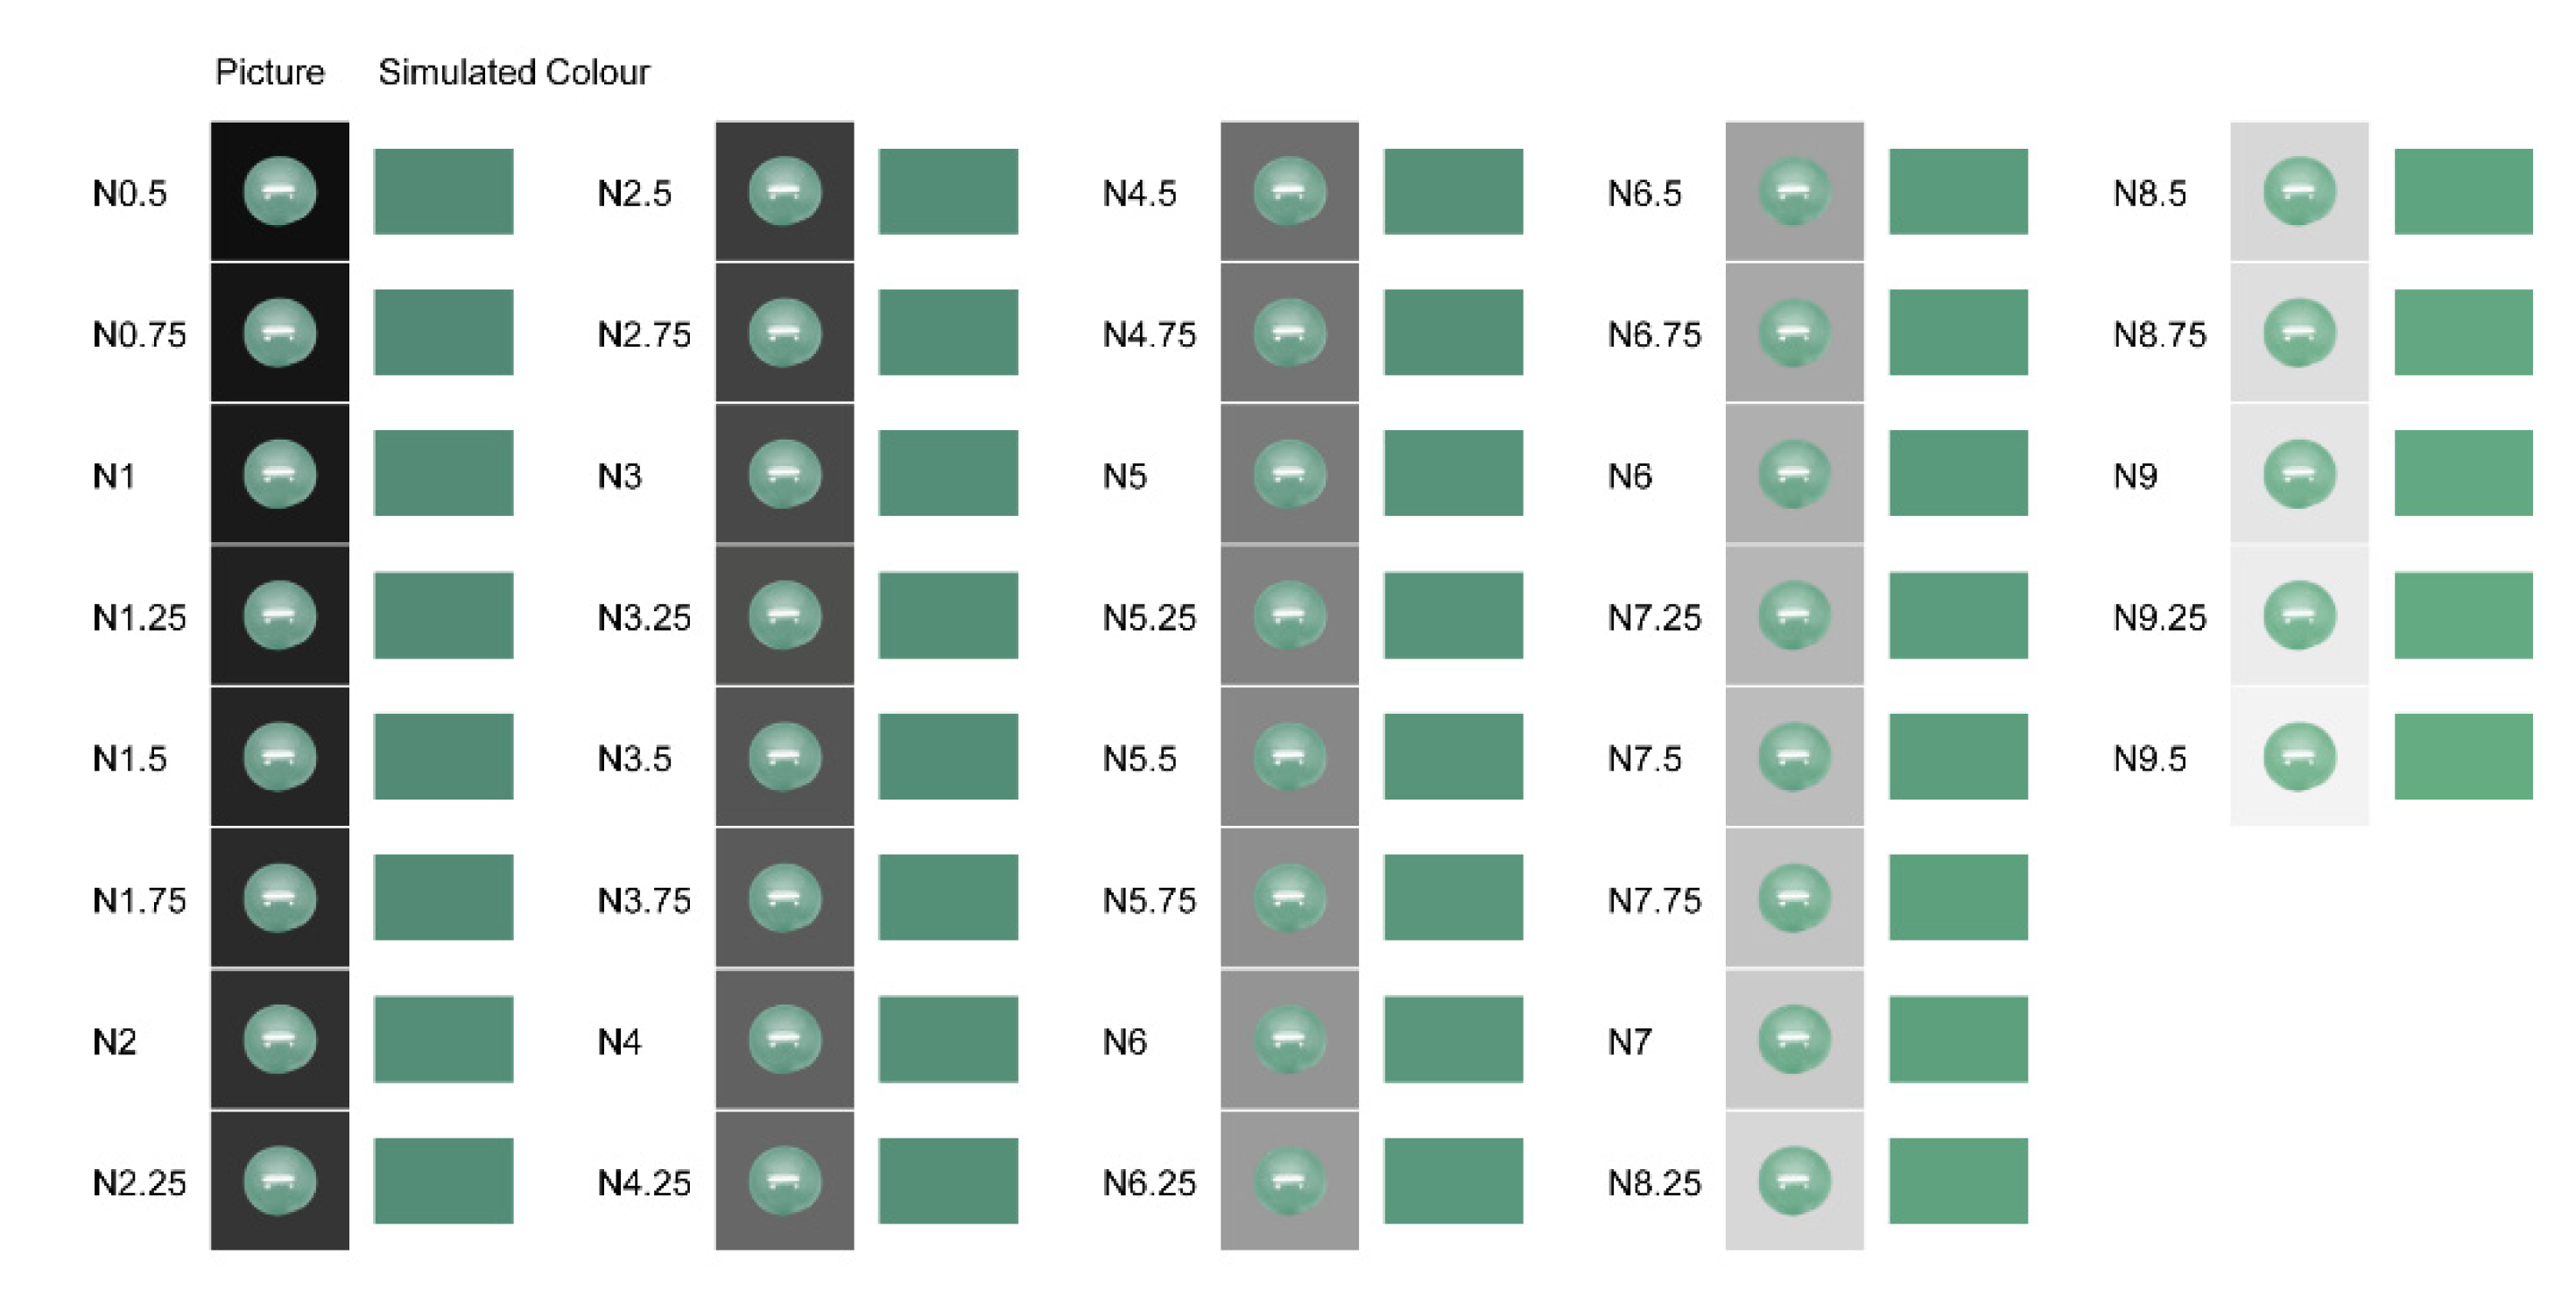
Absorption and transmission spectra in the ultraviolet to visible (UV-VIS) range were recorded with a UV-3600 UV-VIS spectrophotometer (SHIMADZU, Kyoto, Japan). The wavelength range for the test was 300–900 nm, the scanning speed was set to ‘high’, the sampling interval was 1.0 s and the scanning mode was ‘single’.

2.3. Backgrounds

Munsell neutral grey colour chips (glossy edition) were used as backgrounds for the chrysoprase. These chips are composed of 37 neutral grey colours with different lightnesses from N0.5 to N9.5. The measurement of the colour of chrysoprase on different neutral backgrounds was conducted in a standard illumination box with a fluorescent lamp (CCT 6504K, PHILIPS MASTER TL-D90 DeLuxe18W/965, Amsterdam, The Netherlands).

2.4. Colourimetric Analysis

Using different neutral grey backgrounds, an X-Rite SP62 spectrophotometer (X-Rite, Grand Rapids, MI, USA) was used to collect reflective signals from the chrysoprase surface via the integrating sphere (Figure 2). The test conditions can be summarised as follows: CIE standard illumination, D65; reflection, not including the specular reflection; observer view of 2°; measurement range of 400–700 nm; measurement time of less than 2.5 s; voltage of 220 V and a frequency of 50–60 Hz. The final colour data were averaged three times for testing.

2.5. CIE1976 L*a*b* Colour System

The CIE1976 L*a*b* colour system is composed of the colourimetric coordinates a* and b* and a lightness L*. Chroma C* and the hue angle h° can be calculated using a* and b* as:
C = a 2 + b 2 .
h ˚ = arctan b a .
To measure the difference in the colour of chrysoprase on different neutral grey backgrounds, we chose the DE2000 colour difference formula, which is known to provide better visual uniformity than CIELAB.
Δ E 00 = Δ L K L S L 2 + Δ C K c S c 2 + Δ H K c S c 2 + R T Δ C K c S c 2 Δ H K H S H
where ΔL’, ΔC’ and ΔH’ are the differences in lightness, chroma and hue angle, respectively. RT is a function to reduce the interaction between chroma and hue in the blue area and SL, SC and SH are functions to calibrate the absence of visual uniformity in the CIELAB formula. KL, KC and KH are parameters to correct for the environment with two useful combinations of (KL, KC, KH) known as CIE DE2000 (1:1:1) and CIE DE2000 (2:1:1). The CIE DE2000 (1:1:1) parameter set was chosen to evaluate the colour differences because it provides a better perceptibility performance.

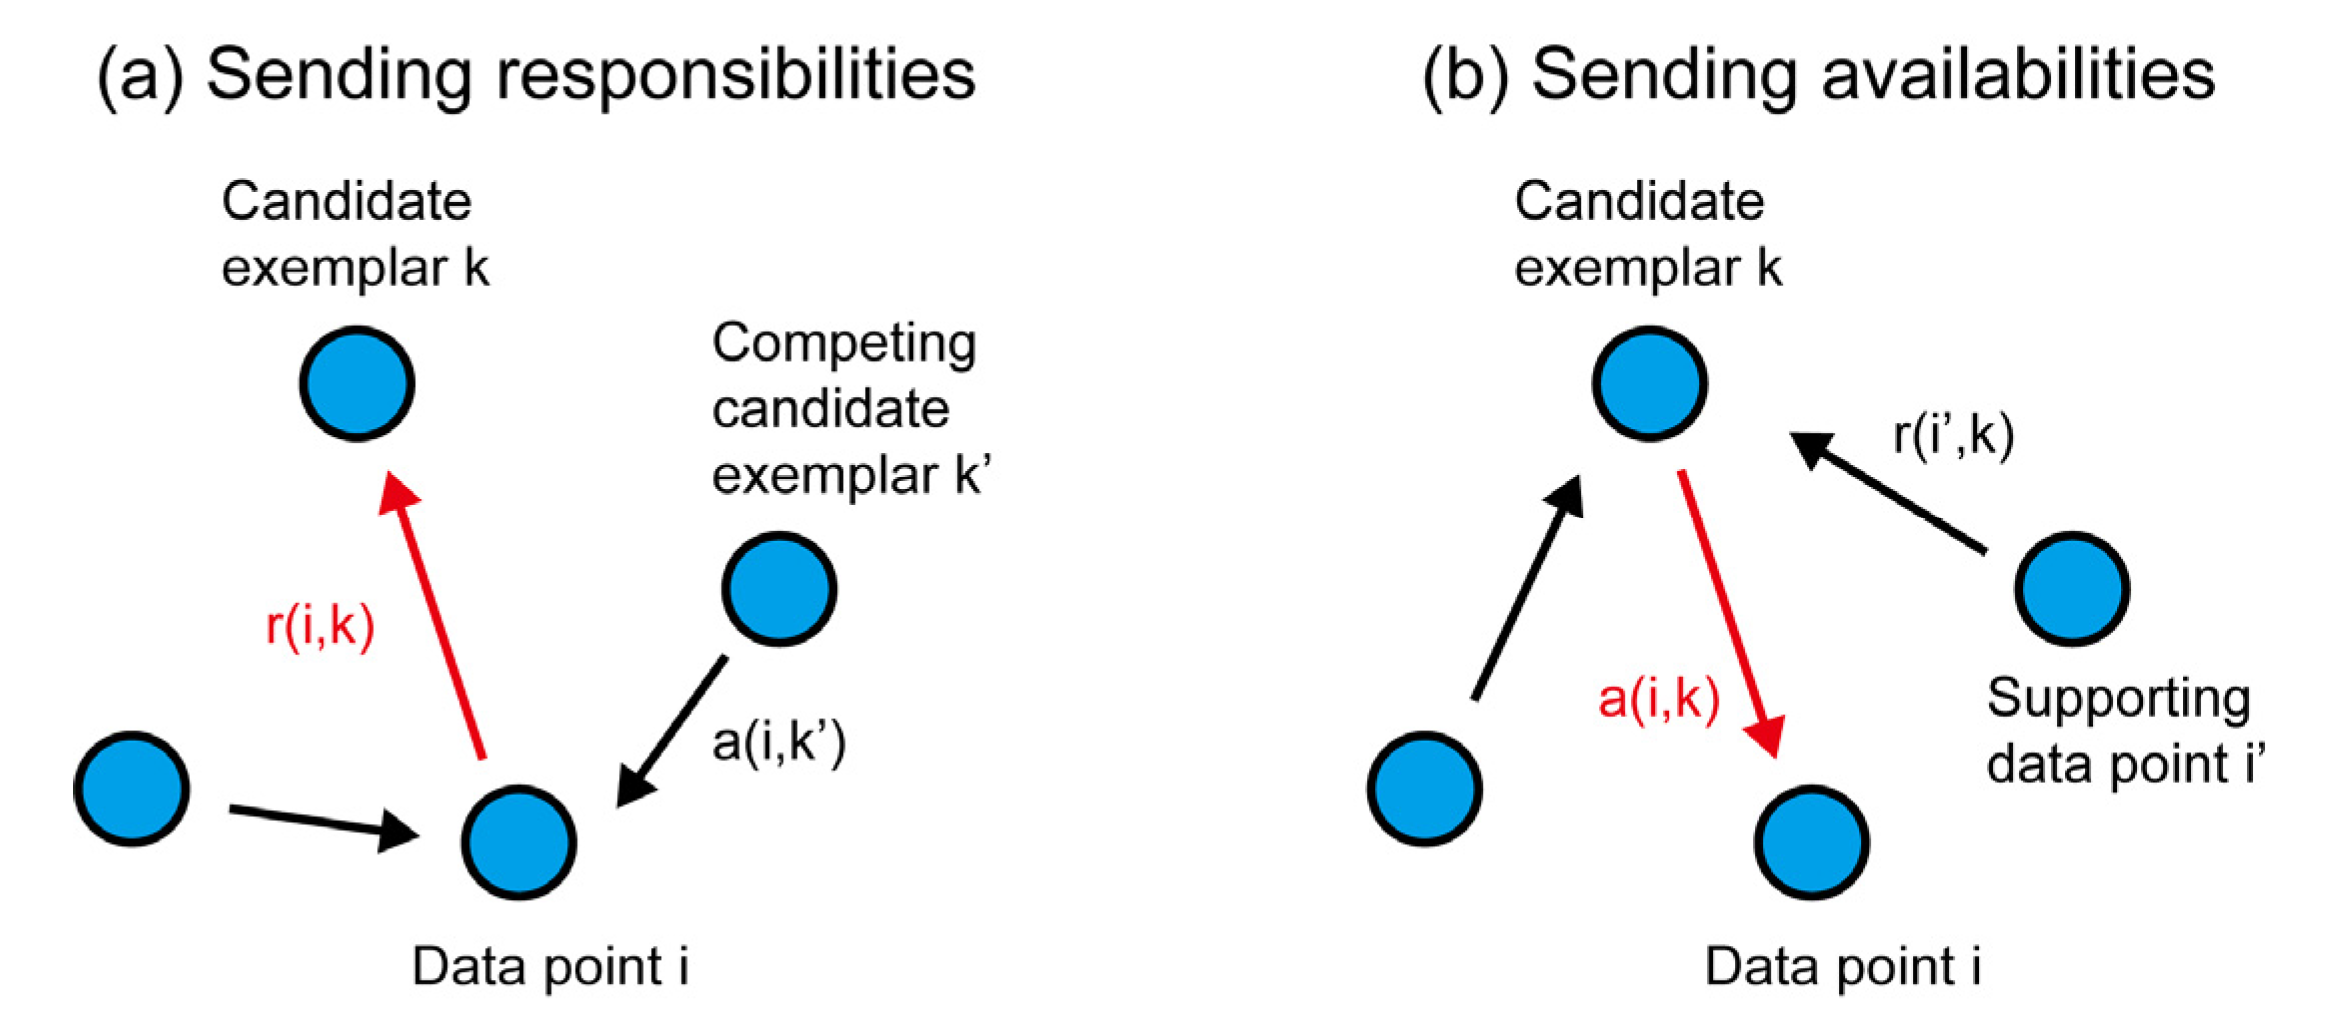
2.6. Affinity Propagation (AP) Clustering Algorithm

The AP clustering algorithm is a subtly designed algorithm that takes as the input the measures of similarity between pairs of data points. All data points are considered simultaneously as potential exemplars. Messages are exchanged between the data points until a high-quality set of exemplars and corresponding clusters gradually emerge.
The similarity s(i,k)indicates how well the data point k is suited to be the exemplar for data point i, where k and i indicate the different data point index. The similarity is calculated by Equation (4):
s i , k = d i j = || x i x j || 2 .
s(k,k) is taken as the input for each data point k; it is set to a common value p named the preference parameter. In the AP clustering algorithm, we consider points with higher values of s(k,k) more likely to be chosen as exemplars. In most cases, this shared value would be the median of the input similarities.
The messages sent between the points belong to one of two categories. The first is the responsibility r(i,k), which is the accumulated evidence that sample k should be the exemplar for sample i, as shown in Figure 3a. The second is the availability a(i,k), which is the accumulated evidence that sample i should choose sample k to be its exemplar and considers the values for all other samples that k should be an exemplar, as shown in Figure 3b. The details of the two types of information are described as follows:
r i , k = s i , k m a x k k a i , k   +   s i , k .
a i , k = m i n 0 , r k , k   +   m a x ( 0 , r i ' , k , i k max 0 , r i ' , k , i = k .
In the message-passing procedure, the “responsibility” r(i,k) and the “availability” a(i,k) are updated by Equations (7) and (8). In case of numerical oscillations that arise in a few circumstances, the AP clustering algorithm introduces a damping factor (λ∈(0,1)) to update the information.
r t + 1 i , k   =   λ r t i , k   +   1 λ r t + 1 i , k
a t + 1 i , k   =   λ a t i , k   +   1 λ a t + 1 i , k
where t indicates the iteration times.
Decision matrix E represents whether point i chooses point k as its exemplar or not. It is calculated after each update.
E k   =   arg max k a i , k   +   r i , k .
The clustering method does not stop until the iteration times reach the maximum number or the clustering results are stable for several times.

3. Results

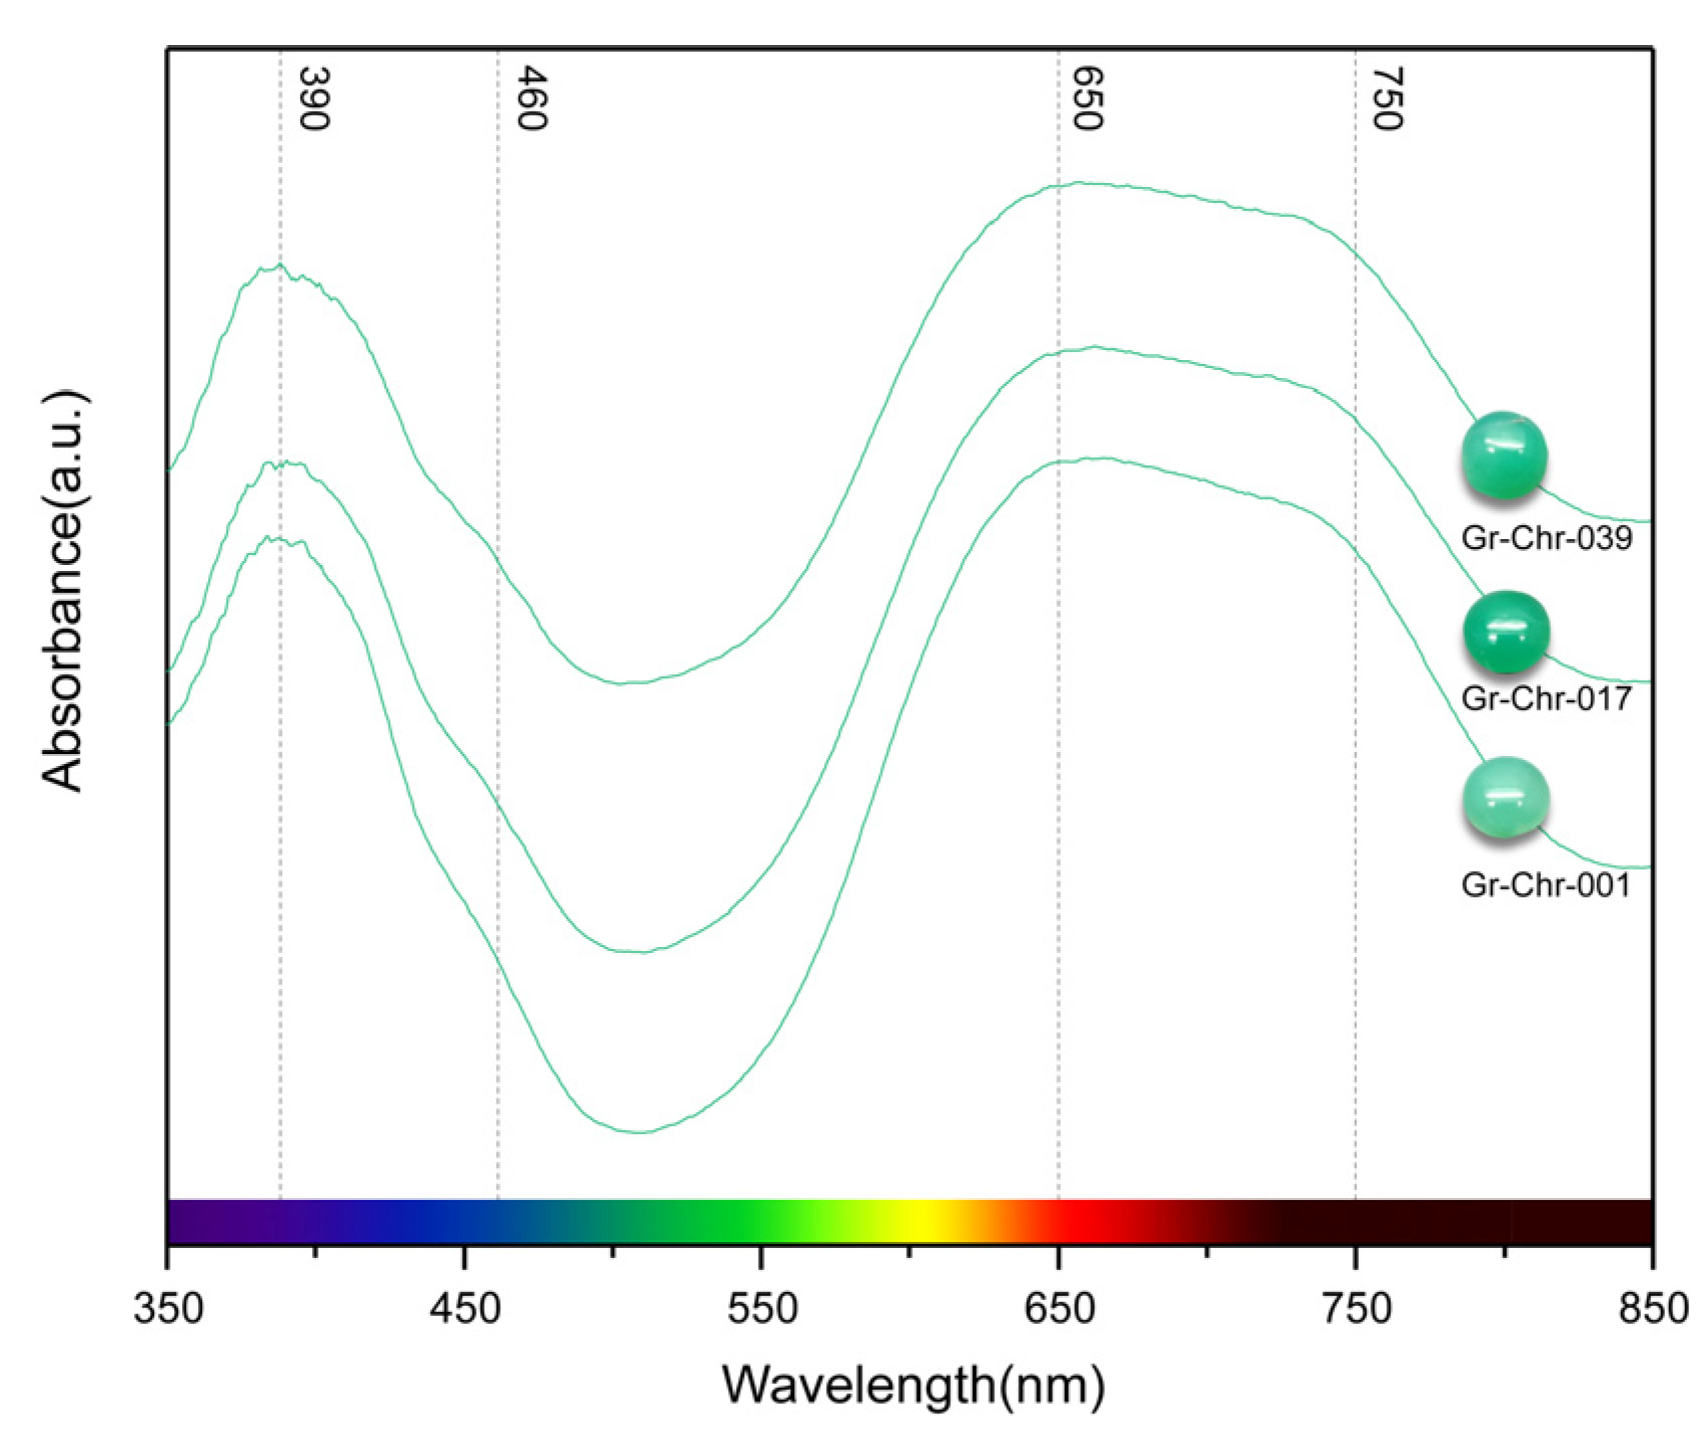
3.1. UV-VIS Spectrum Analysis

The UV-VIS spectra of the chrysoprase samples (Figure 4) were characterised in terms of their absorption bands at 390, 460, 650 and 750 nm (see Table 1 for the relevant assigned transitions). All the spectra were consistent with the presence of octahedrally coordinated Ni2+ ions and agreed with the spectra of other nickel-containing minerals in the literature [41,42,43,44], confirming that nickel is mainly responsible for the observed colouration. The bands near 390 and 650 nm corresponded with spin-allowed d–d transitions and the shoulders near 460 and 750 nm corresponded with spin-forbidden d–d transitions [44,45].

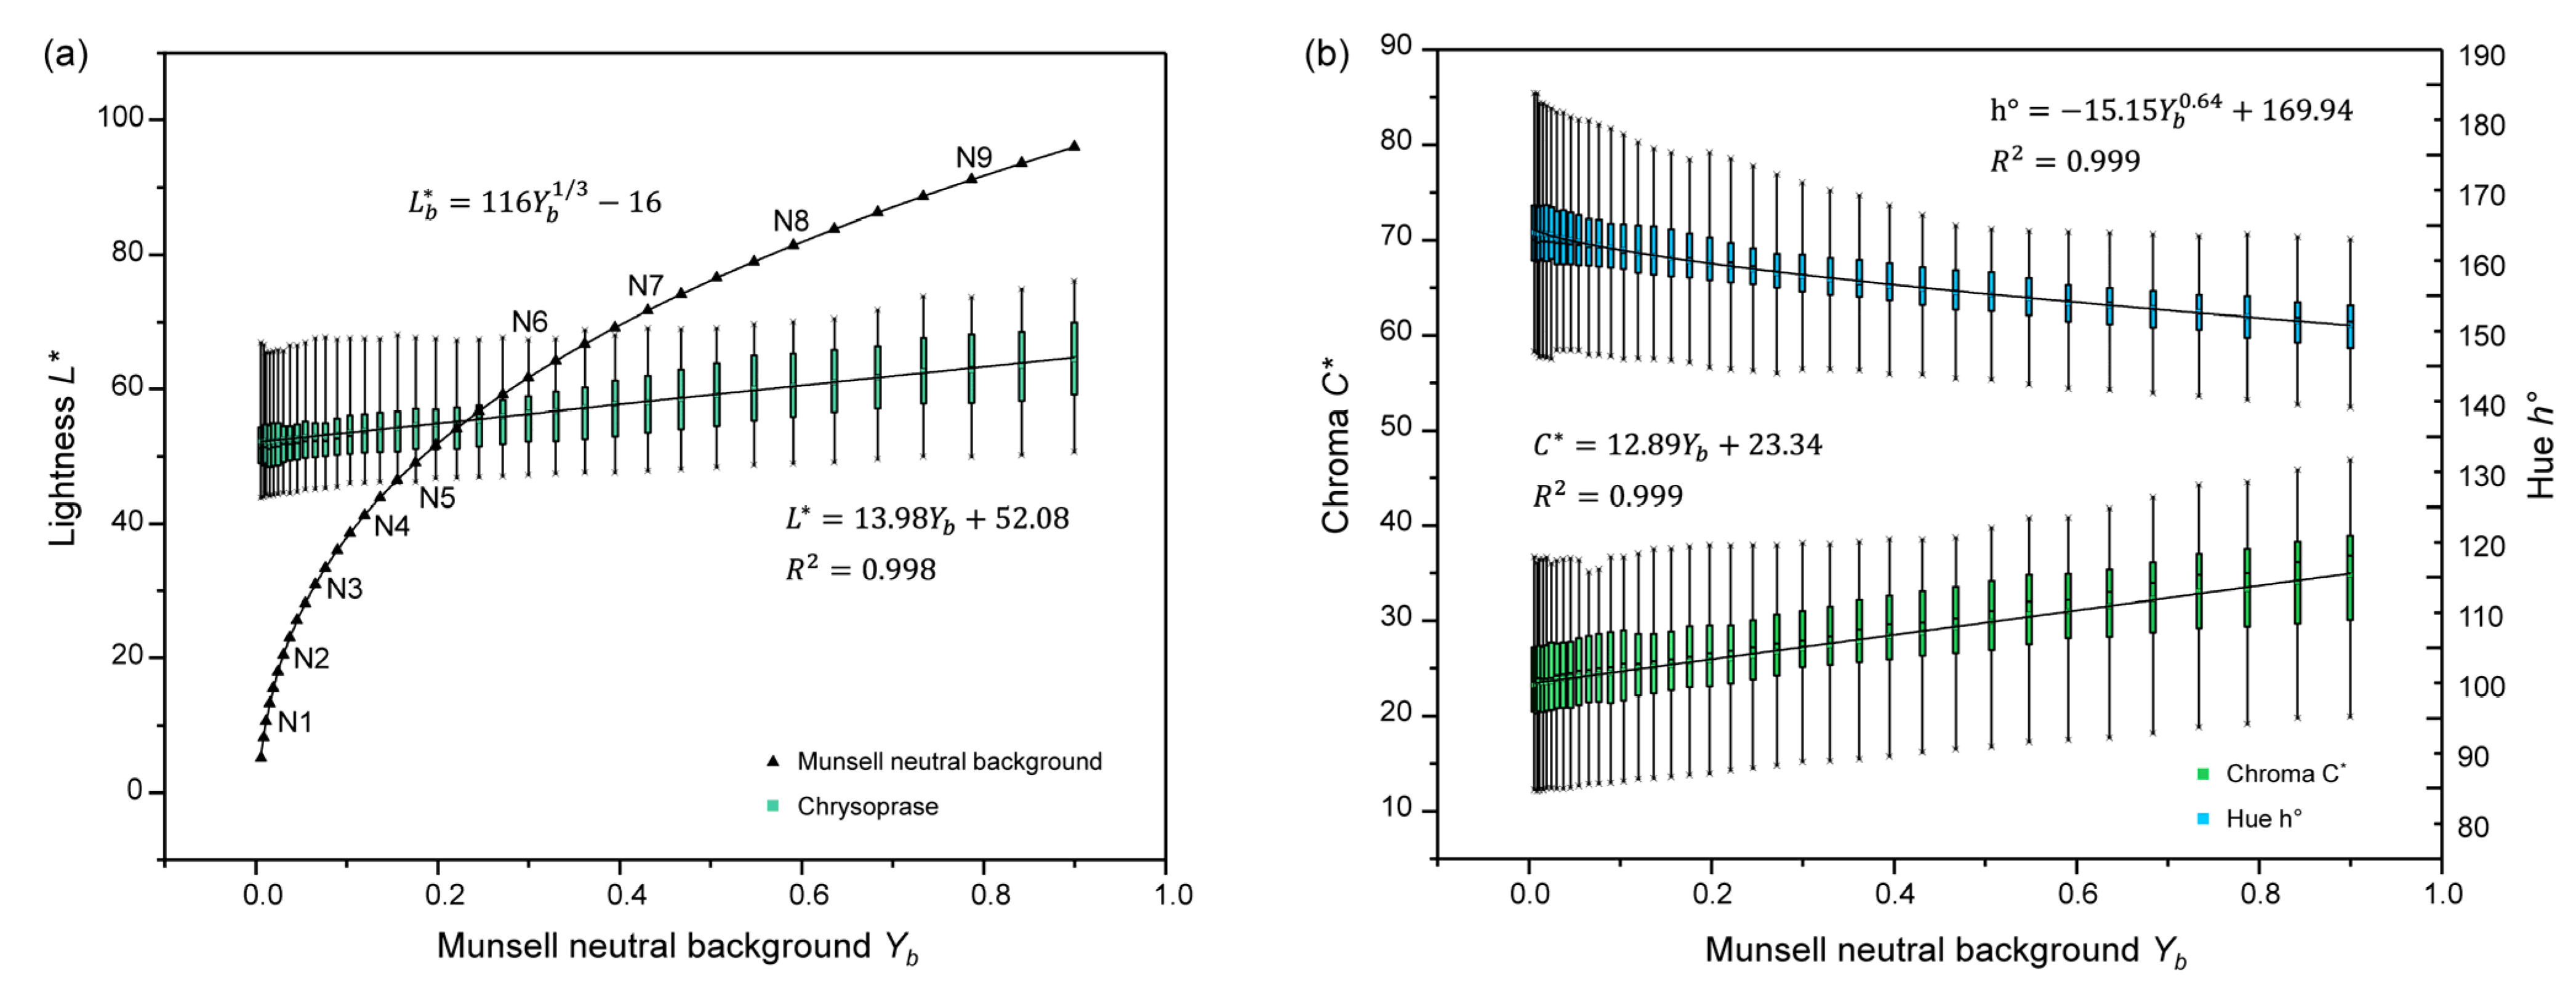
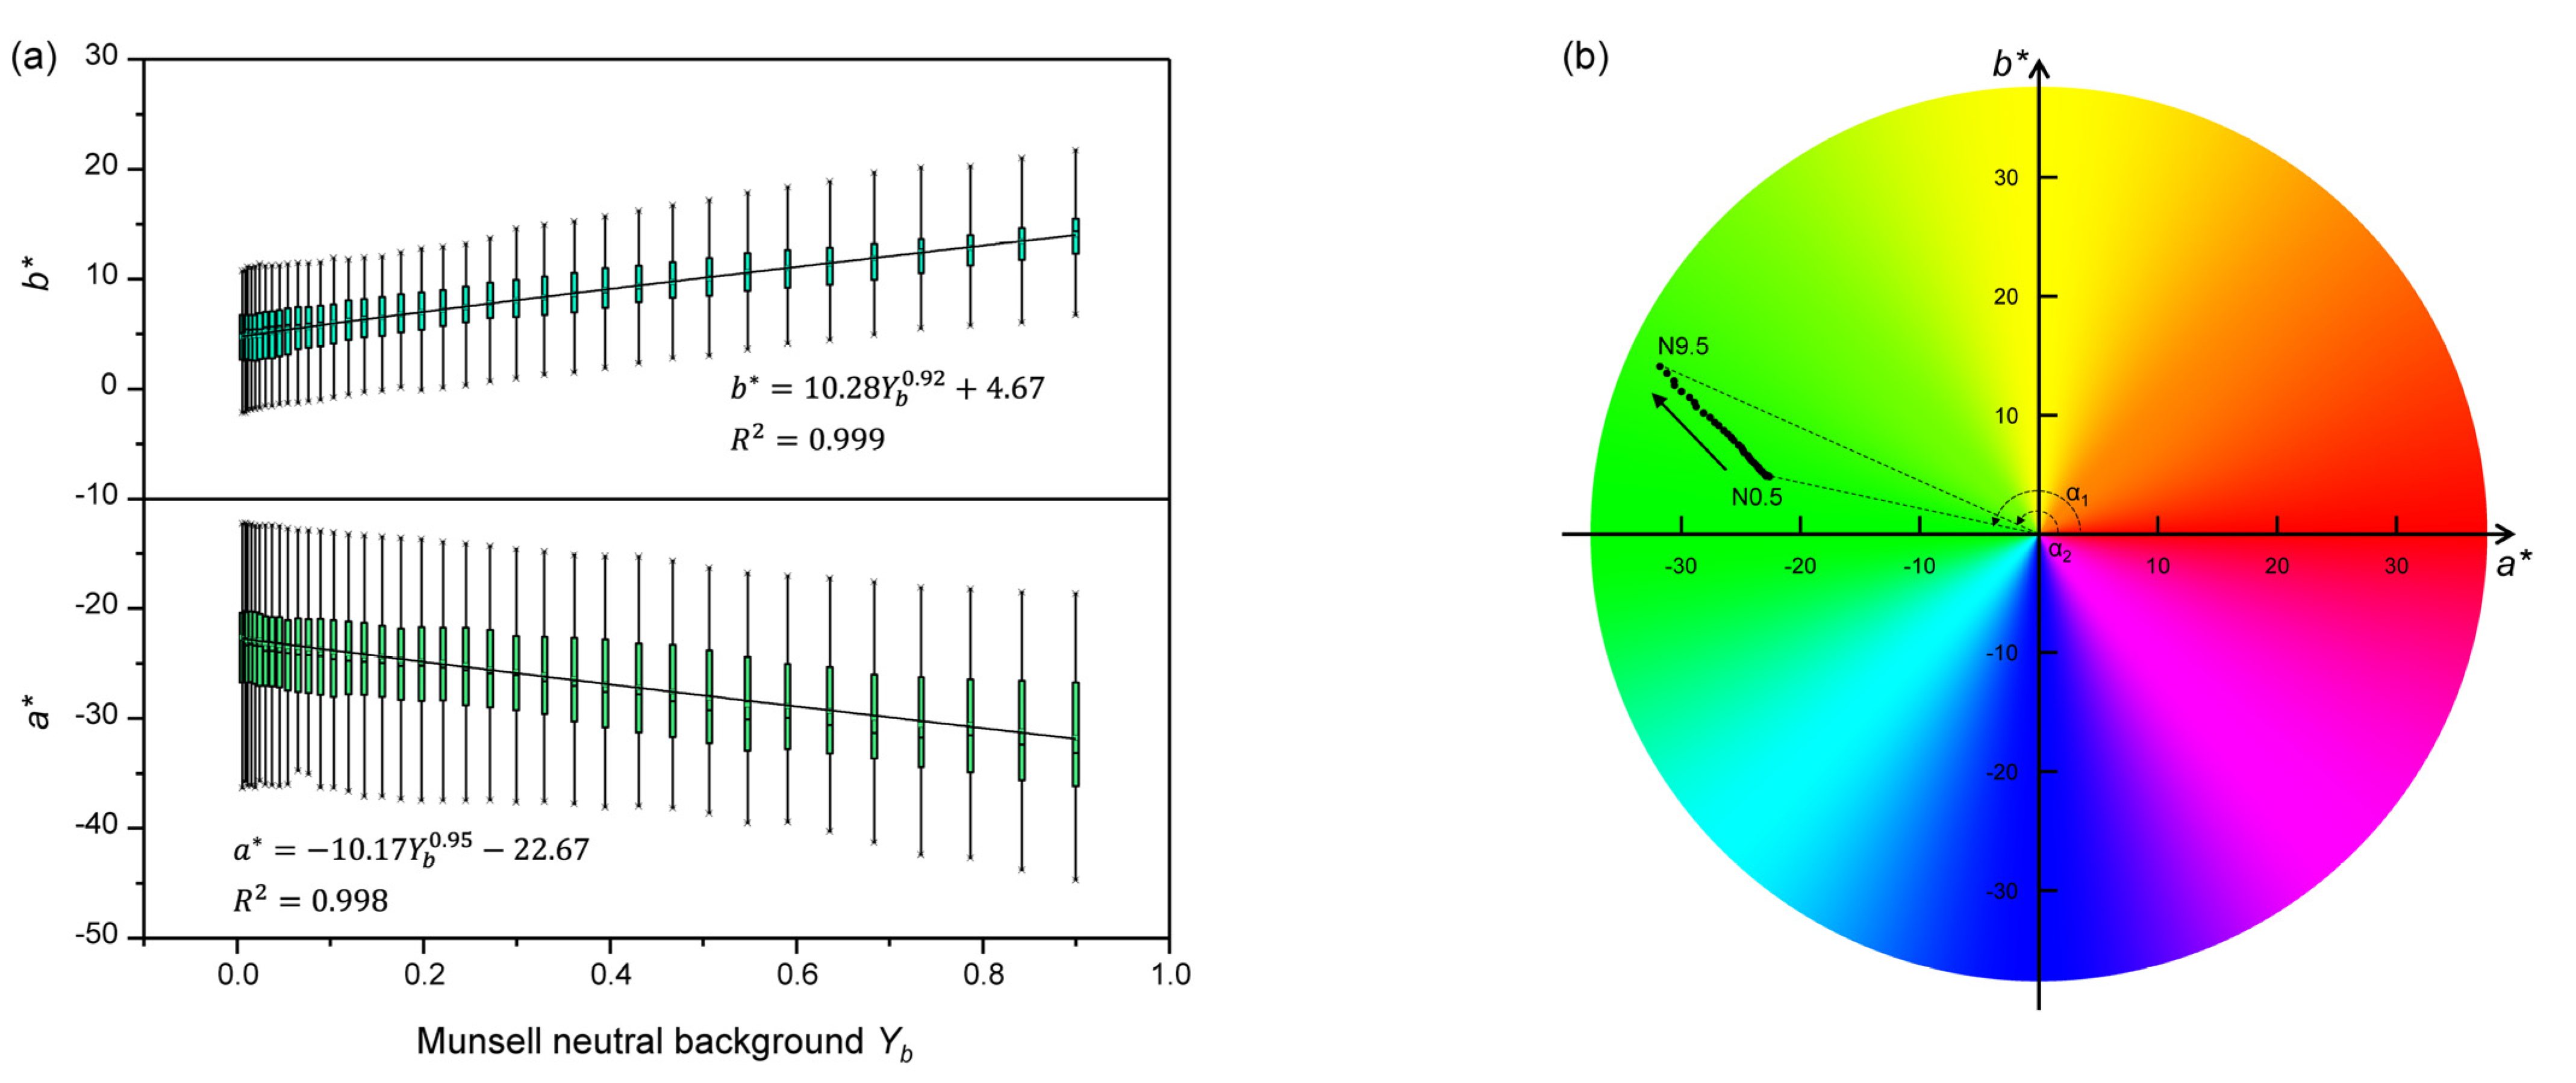
3.2. Effects of Neutral Grey Backgrounds on the Colour of Chrysoprase

Due to the glossy lustre and a certain degree of transparency of chrysoprase, even neutral backgrounds with different shades of grey can result in a significant difference in the apparent colour. The apparent colours of gemstones are also influenced by light sources [26,27]; therefore, we performed this study with a single fixed light source. According to the Chinese national standard GB/T 20146-2006 CIE Standard Illuminator for Colourimetry, the standard light source D65 (6504K) represents the average sunlight in the northern hemisphere and is used as the standard light source for international colour evaluations [46]. We therefore used it as the sole light source in this study.
The colours of 40 pieces of chrysoprase were tested against 37 Munsell neutral backgrounds under a 6504K fluorescent lamp. The resulting colour changes are shown in Figure 5.
Munsell neutral backgrounds are divided into 37 lightness levels from 0 to 100. With n = 0.25 as an interval, the levels range from N0.5 to N9.5. The lightness of each level corresponds with its luminance factor (Yb) in daylight. The relationship between the lightness Lb* and luminance factor Yb of Munsell neutral backgrounds is given as:
L b = 116 Y b 1 / 3 .
The lightness of the background has a great influence on the lightness of the gem. The lightness of chrysoprase increased as the background brightness increased, as shown in Figure 6a. The test data of lightness L* on 37 Munsell neutral grey backgrounds are shown in Table S1. By fitting the curves of the chrysoprase colour parameters against the luminance factor Yb of the Munsell neutral backgrounds, a functional relationship was obtained. The following fit for the relationship between L* and Yb was obtained:
L = 13 . 98 Y b + 52 . 08 ( R 2 = 0 . 998 ) .
Figure 6b shows how chroma C* and the hue angle h° of the chrysoprase changed as the background lightness changed. The test data of chroma C* and hue angle h° on 37 Munsell neutral grey backgrounds are shown in Tables S2 and S3. With an increasing background lightness, chroma increased whereas the hue angle decreased. Functions relating to these parameters and Yb were obtained as follows:
C = 12.89 Y b + 23.34 R 2 = 0.999 .
h ° = 15.15 Y b 0.64 + 1169.94 R 2 = 0.999 .

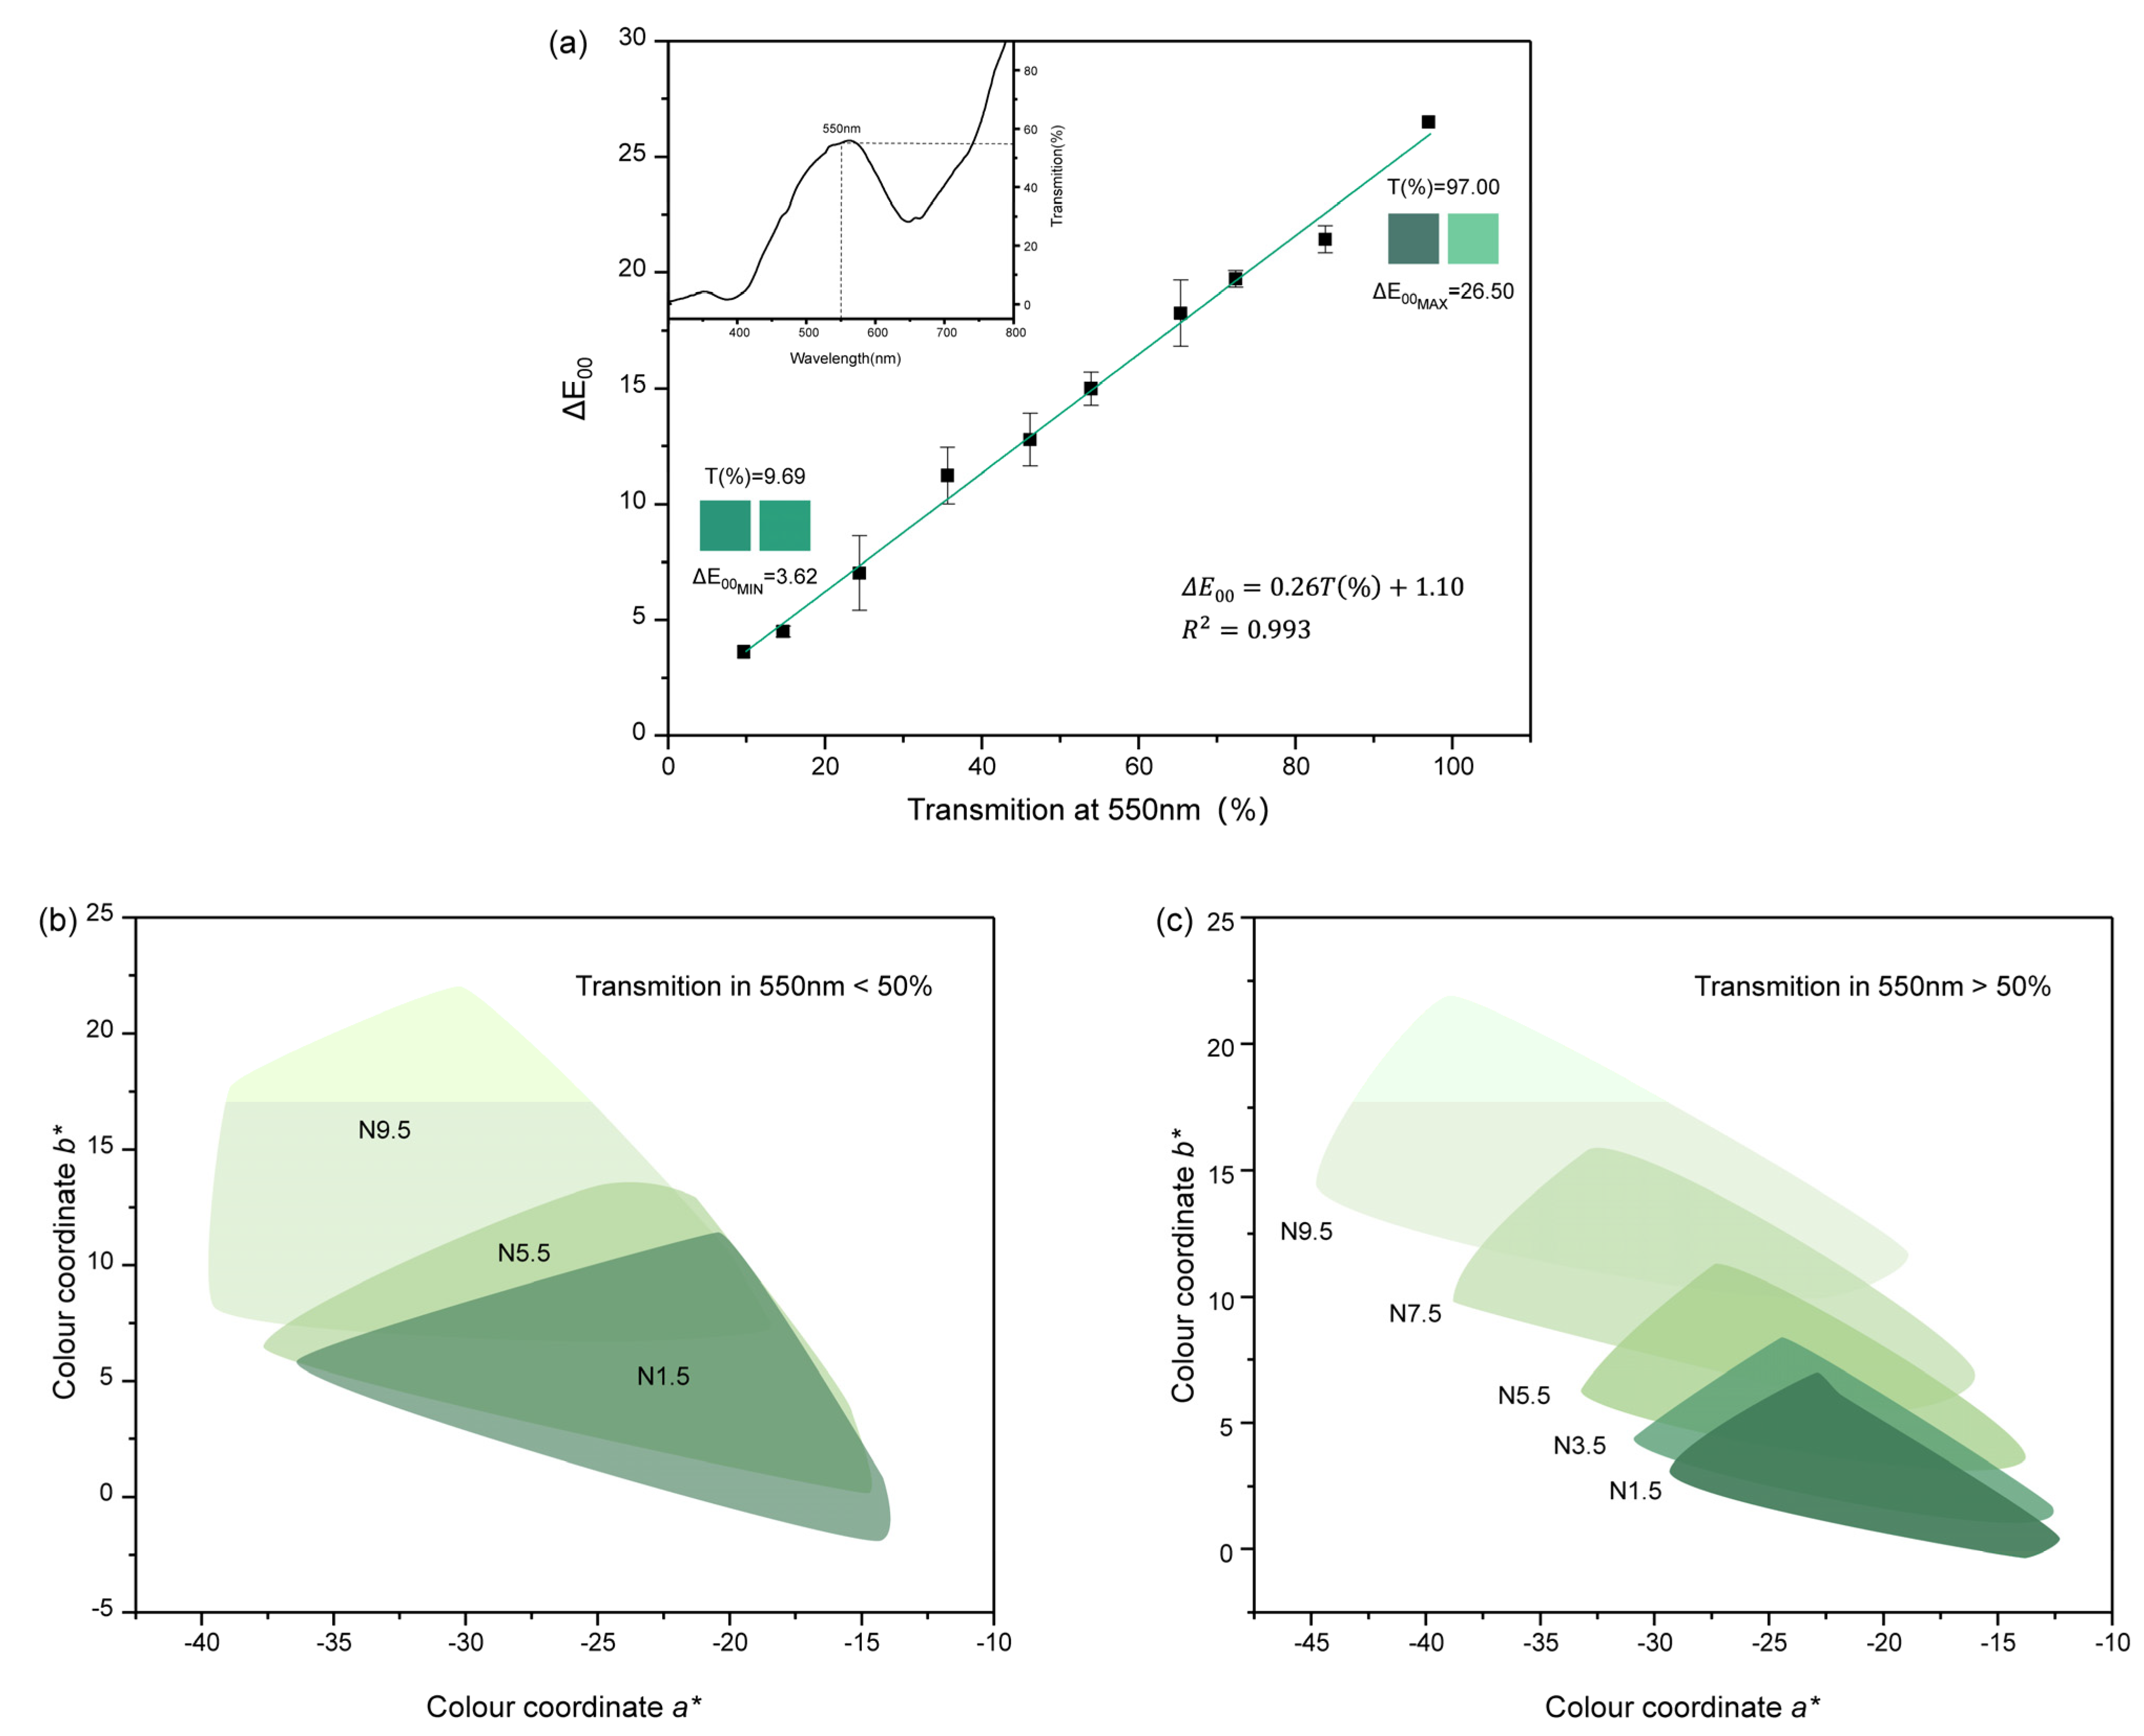
3.3. The Effect of Transparency on the Colour of Chrysoprase on Different Backgrounds

As the luminance of the Munsell neutral backgrounds increased, the lightness L* and chroma C* of chrysoprase increased whereas the hue angle h° decreased. However, this was only the overall trend of 40 samples and different samples were affected differently by the various backgrounds. It was therefore necessary to consider the effect of transparency on the colour of the chrysoprase.
As the human eye is most sensitive to light at a wavelength of 550 nm, the transmittance of the samples at this wavelength was used as the reference standard for the quantification of the transparency [47,48]. To calculate the colour difference between the chrysoprase on N0.5 and N9.5 neutral backgrounds, we chose the CIE DE2000 (1:1:1) formula (Equation (3)). The relationship between the transmittance at a wavelength of 550 nm and the colour difference of 40 chrysoprase samples is shown in Figure 7a. The test data of the sample transmittance at 550 nm (%) and the colour difference are shown in Table S4. We observed that the higher the transmittance at the wavelength of 550 nm, the greater the colour difference, which demonstrated that the transmittance at a wavelength of 550 nm could be used as a reference standard for quantifying the transparency of the sample.
The samples were divided into two groups, the first with a transmittance at 550 nm of over 50% and the second with less than 50%. These colours were cast in the CIE1976 L*a*b* uniform colour space system, as shown in Figure 7b,c. For the group with a transmittance at 550 nm of over 50%, the ranges of a* and b* became wider as the background lightness increased, indicating that the colour of chrysoprase dispersed as the background became lighter. Therefore, it was easier to distinguish the colour of chrysoprase with a high transparency on a lighter background. For samples with a transmittance at 550 nm of less than 50%, the range of a* and b* did not expand with an increasing background lightness. Therefore, it is recommended that a high brightness background is selected for the colour grading of gems with a high transparency. The high brightness background magnifies the small differences in the colour of the gems and thus improves the accuracy of the colour grading.

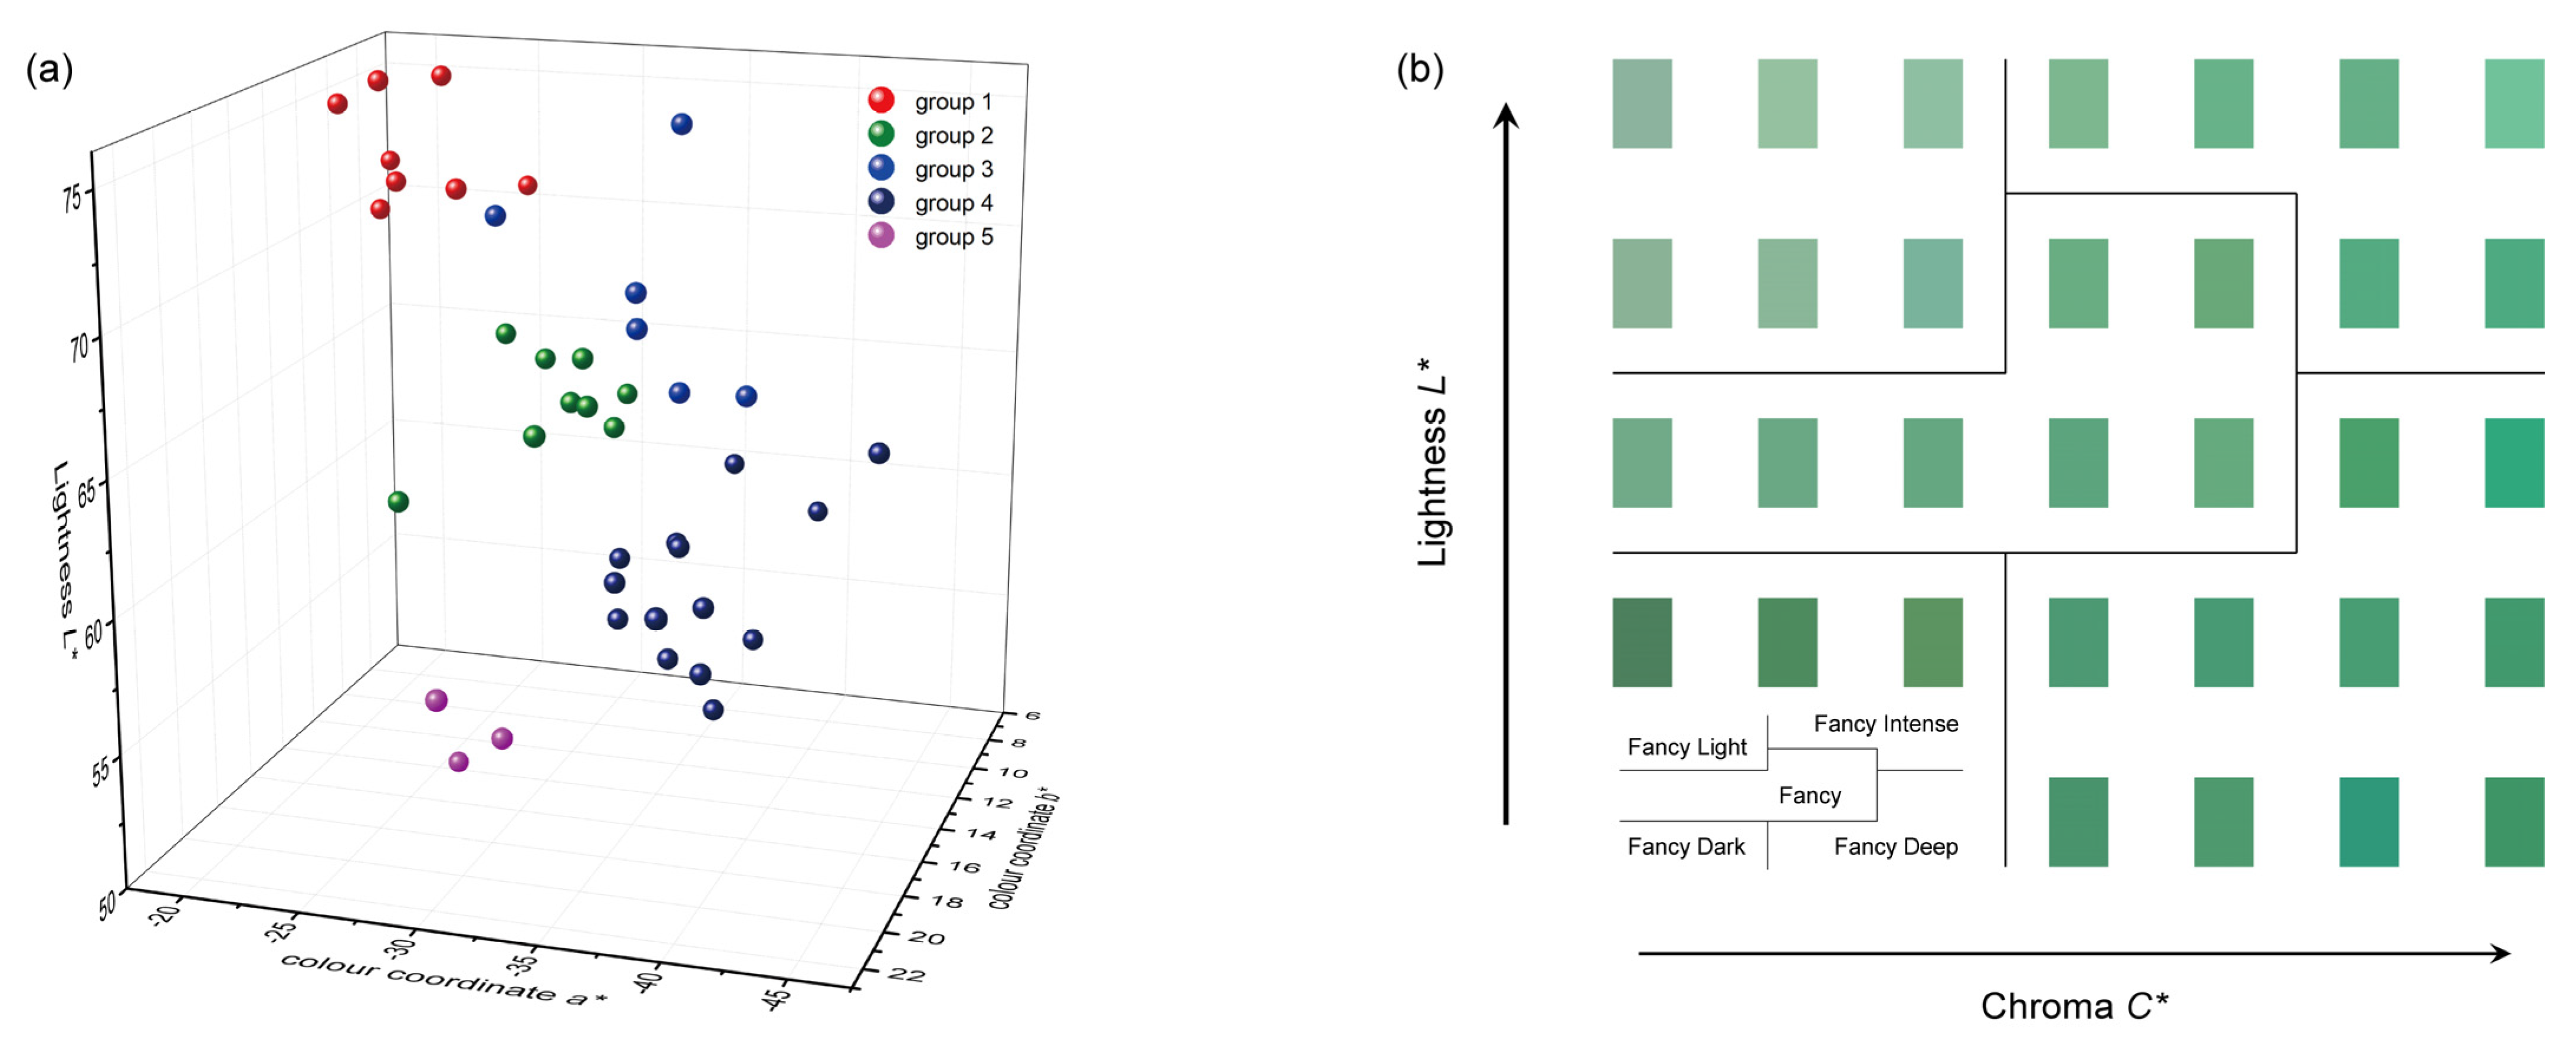
3.4. Colour Grading of Chrysoprase on an N9.5 Background

The background has a significant influence on gemstone colour grading. To ensure an accurate grading, the background should be a neutral colour without any hue. The Munsell neutral grey colour chips are therefore very suitable for this purpose. Although the effect of the background on the colour of chrysoprase differs with the transparency, it is still necessary to perform colour grading with a fixed background in practical scenarios. The N9.5 background was chosen because it allowed for the best chromatic discrimination of several chrysoprase samples and therefore improved the accuracy of the classification. In this paper, python 3.9.5 software (https://www.python.org/ (accessed on 14 June 2021)) was used to classify the colour of chrysoprase by AP clustering. The parameters of AP were set to the default value.
Based on the CIE1976 L*a*b* system, the colour of the chrysoprase samples was quantitatively characterised with a Munsell N9.5 neutral grey colour chip as a background. The lightnesses L* and colour coordinates a* and b* of the 40 chrysoprase samples were used as independent variables in the AP clustering. The results are shown in Figure 8a and Table S5 with the colours of the 40 chrysoprase samples divided into five groups. The cluster centres are shown in Table 2. The significant value of the clustering results was less than 0.05 (Table 3), which indicated that the classification scheme was effective. According to these results, by imitating GIA’s colour diamond grading system [8], chrysoprase colours can be divided into five grades: Fancy Light, Fancy, Fancy Intense, Fancy Deep and Fancy Dark, as shown in Figure 8b.

4. Discussion

4.1. Reasons for the Effects of a Neutral Grey Background on the Colour of Chrysoprase

According to the above experimental results, as the luminance of the Munsell neutral background increased, the lightness L* and chroma C* increased whereas the hue angle h° decreased. The change in the lightness of the chrysoprase for different grey backgrounds was due to the transparency of the stone as it was crossed by the light reflected from the background. Therefore, an increase in the background lightness led to an increase in that of the chrysoprase. The variation of chroma C* and the hue angle h° of the chrysoprase can be explained by the variation of the colour coordinates a* and b*. The test data of a* and b* on 37 Munsell neutral grey backgrounds are shown in Tables S6 and S7. As shown in Figure 9a, with an increase in the background luminance, a* decreased and b* increased and the absolute values of a* and b* both increased. According to Equation (1), chroma C* is determined from a* and b*, so chroma of chrysoprase will also then increase. A coordinate system can be established with a* as the X-axis and b* as the Y-axis and the average a* and b* values of the 40 chrysoprase samples on each Munsell background can be used as casting points. The results of this are shown in Figure 9b. When the background gradually changed from low lightness to high lightness levels, the points gradually moved away from the origin O and the angle between the line from the point to the origin and the positive a*-axis, which determined the hue angle h°, gradually decreased. Therefore, when the background brightness increased, the hue angle h° of the chrysoprase decreased.

4.2. Feasibility of the Colour Classification Scheme

To verify the feasibility of the classification scheme, the colour difference between each sample and the five clustering centres was calculated using the colour difference formula CIE DE2000 (Equation (3)) and the clustering centre with the smallest colour difference within the sample determined the category to which that sample was assigned. Comparing the results with the classification given by AP, 3 of the 40 sets of data were inconsistent and the coincidence rate was 92.5%, which proved the feasibility of the colour classification system. The three inconsistent samples were 19, 23 and 32. As shown in Table 4, there was little difference between the colour difference between the sample and the cluster centre to which the classification result given by AP belonged and the minimum colour difference between the sample and the five cluster centres. To improve the accuracy of the colour grading system, more specimens of chrysoprase will be added in the future.

5. Conclusions

The Munsell background has a significant effect on the colour of chrysoprase when using a fluorescent lamp (correlated colour temperature 6504K). As the luminance of the Munsell neutral background increased, the lightness L*, chroma C* and colour coordinate b* of chrysoprase increased whereas its hue angle h° and colour coordinate a* decreased. The variation of chroma C* and the hue angle h° of chrysoprase can be explained by the variation in the colour coordinates a* and b*.
For chrysoprase with a high transparency, a high brightness background will magnify small differences in the colour of the gems and improve the accuracy of the colour grading; therefore, the Munsell N9.5 background was chosen as the best option for chrysoprase colour grading.
The evaluation of the colour of the samples with the Munsell N9.5 background and the processing of the obtained data with the affinity propagation (AP) clustering algorithm allowed us to classify the chrysoprase colours into five groups: Fancy Light, Fancy, Fancy Intense, Fancy Deep and Fancy Dark. The feasibility of this colour grading scheme was verified by calculating the colour difference between the samples and the AP cluster centres.
Although chrysoprase is not a precious gemstone, it has a unique apple green colour, which is different from emerald, jadeite-jade, tourmaline and other green gemstones. Studying the colour of chrysoprase can fill the gap of gemstone colourimetry in this unique green colour. The colour grading method in this paper can also provide a reference for other gemstone varieties. As the samples used in the study were polished cabochon and the influence of cutting on the colour of gemstones was not considered, the method introduced in this paper may not be suitable for faceted gemstones. The number of samples was also limited. In the future, we will add more chrysoprase samples with different colours to enhance the universality of the research.

Supplementary Materials

The following are available online at https://www.mdpi.com/article/10.3390/min11101092/s1. Table S1: The test data of lightness L* on 37 Munsell neutral grey backgrounds. Table S2: The test data of chroma C* on 37 Munsell neutral grey backgrounds. Table S3: The test data of hue angle h° on 37 Munsell neutral grey backgrounds. Table S4: The test data of sample transmittance at 550 nm (%) and the colour difference of chrysoprase on N0.5 and N9.5 neutral backgrounds. Table S5: The result of AP clustering. Table S6: The test data of colour coordinate a* on 37 Munsell neutral grey backgrounds. Table S7: The test data of colour coordinate b* on 37 Munsell neutral grey backgrounds.

Author Contributions

Conceptualisation, Y.J.; methodology, Y.J. and Y.G.; software, S.L.; validation, Y.J., Y.G., Y.Z., X.L. and S.L.; formal analysis, Y.J.; investigation, Y.J., Y.G., Y.Z., X.L. and S.L.; resources, Y.J. and Y.G.; data curation, Y.J., S.L.; writing—original draft preparation, Y.J., Y.Z.; writing—review and editing, Y.G. and X.L.; visualization, Y.J.; supervision, Y.G. and X.L.; project administration, Y.G. All authors have read and agreed to the published version of the manuscript.

Funding

This research received no external funding.

Data Availability Statement

All data are contained within the article and Supplementary Tables.

Acknowledgments

The experiments in this research were conducted in the lab of the Gemological Institute, China University of Geosciences, Beijing. We would like to thank Haoyun Jiang, Yan Qiu and Bowen Zhao for kind help in our experiments.

Conflicts of Interest

The authors declare no conflict of interest.

References

  1. Eggleton, R.A.; Gerald, J.F.; Foster, L. Chrysoprase from Gumigil, Queensland. Aust. J. Earth Sci. 2011, 58, 767–776. [Google Scholar] [CrossRef]
  2. Nagase, T.; Akizuki, M.; Onoda, M.; Sato, M. Chrysoprase from Warrawanda, Western Australia. Neues Jahrb. Mineral. Mon. 1997, 7, 289–300. [Google Scholar] [CrossRef]
  3. Sachanbinski, M.; Janeczek, J.; Platonov, A.; Rietmeijer, F.J.M. The origin of colour of chrysoprase from Szklary (Poland) and Sarykul Boldy (Kazakhstan). Neues Jahrb. Mineral.-Abh. 2001, 177, 61–76. [Google Scholar] [CrossRef]
  4. Cermakova, Z.; Hradil, D.; Bezdika, P.; Hradilova, J. New data on “kerolite-pimelite” series and the colouring agent of Szklary chrysoprase, Poland. Phys. Chem Miner. 2017, 44, 193–202. [Google Scholar] [CrossRef]
  5. Jiang, Y.; Guo, Y. Genesis and influencing factors of the colour of chrysoprase. Sci. Rep. 2021, 11, 9939. [Google Scholar] [CrossRef] [PubMed]
  6. Heflik, W.; Kwiecinska, B.; Natkaniec-Nowak, L. Colour of chrysoprase in light of mineralogical studies. Aust. Gemmol. 1989, 17, 43–46. [Google Scholar]
  7. Barsanov, G.; Yakovleva, M. Mineralogical investigations of some precious and semiprecious varieties of cryptocrystalline silica. New Mineral. Data USSR Acad. Sci. 1981, 29, 1981. [Google Scholar]
  8. King, J.; Moses, T.; Shigley, J.; Liu, Y. Color grading of colored diamonds in the GIA Gem Trade Laboratory. Gem Gemol. 1994, 30, 220–242. [Google Scholar] [CrossRef]
  9. King, J.M.; Moses, T.M.; Shigley, J.E.; Welbourn, C.M.; Lawson, S.C.; Cooper, M. Characterizing natural-color type IIb blue diamonds. Gems Gemol. 1998, 34, 246–268. [Google Scholar] [CrossRef]
  10. King, J.M.; Shigley, J.E.; Guhin, S.S.; Gelb, T.H.; Hall, M. Characterization and grading of natural-color pink diamonds. Gems Gemol. 2002, 38, 128–147. [Google Scholar] [CrossRef] [Green Version]
  11. King, J.; Shigley, J.; Gelb, T.; Guhin, S.; Hall, M.; Wang, W. Characterization and grading of natural-color yellow diamonds. Gems Gemol. 2005, 41, 88–115. [Google Scholar] [CrossRef]
  12. King, J.M.; Geurts, R.H.; Gilbertson, A.M.; Shigley, J.E. Color grading “d-to-z” diamonds at the gia laboratory. Gems Gemol. 2008, 44, 296–321. [Google Scholar] [CrossRef]
  13. Sun, Z.; Palke, A.; Renfro, N.; Breitzmann, H.; Hand, D.; Muyal, J. Discovery of color-change chrome grossular garnets from Ethiopia. Gems Gemol. 2018, 54, 33–236. [Google Scholar]
  14. Sun, Z.; Palke, A.C.; Renfro, N. Vanadium-and chromium-bearing pink pyrope garnet: Characterization and quantitative colorimetric analysis. Gems Gemol. 2015, 51, 348–369. [Google Scholar] [CrossRef] [Green Version]
  15. Schmetzer, K.; Bernhardt, H.-J.; Bosshart, G.; Hainschwang, T. Colour-change garnets from Madagascar: Variation of chemical, spectroscopic and colorimetric properties. J. Gemmol. 2009, 31, 235–282. [Google Scholar] [CrossRef]
  16. Krzemnicki, M.S.; Hanni, H.; Reusser, E. Colour change garnets from Madagascar: Comparison of colorimetric with chemical data. J. Gemmol. 2001, 27, 395–408. [Google Scholar] [CrossRef]
  17. Liu, Y.; Shigley, J.; Halvorsen, A. Colour hue change of a gem tourmaline from the Umba Valley, Tanzania. J. Gemol. Lond. 1999, 26, 386–396. [Google Scholar] [CrossRef]
  18. Guo, Y. Quality evaluation of tourmaline red based on uniform color space. Clust. Comput. 2017, 20, 3393–3408. [Google Scholar] [CrossRef]
  19. Han, J.; Guo, Y.; Liu, S. Environmental Issues on Color Quality Evaluation of Blue Sapphire based on GemdialogueTM Color Comparison Charts. Ekoloji Derg. 2018, 1365–1376. [Google Scholar]
  20. Liu, Y.; Shigley, J.; Fritsch, E.; Hemphill, S. The “alexandrite effect” in gemstones. Color. Res. Appl. 1994, 19, 186–191. [Google Scholar] [CrossRef]
  21. Tang, J.; Guo, Y.; Xu, C. Metameric effects on peridot by changing background color. JOSA A 2019, 36, 2030–2039. [Google Scholar] [CrossRef]
  22. Tang, J.; Guo, Y.; Xu, C. Light pollution effects of illuminance on yellowish green forsterite color under CIE standard light source D65. Ekoloji 2018, 27, 1181–1190. [Google Scholar]
  23. Sun, Z.; Renfro, N.; Palke, A.C. Tri-color-change holmium-doped synthetic CZ. Gems Gemol. 2017, 53, 259–260. [Google Scholar]
  24. Liu, Y.; Shi, G.; Wang, S. Color phenomena of blue amber. Gems Gemol. 2014, 50, 2–8. [Google Scholar] [CrossRef]
  25. Guo, Y.; Wang, H.; Du, H. The foundation of a color-chip evaluation system of jadeite-jade green with color difference control of medical device. Multimed. Tools Appl. 2016, 75, 14491–14502. [Google Scholar] [CrossRef]
  26. Guo, Y.; Wang, H.; Li, X.; Dong, S. Metamerism appreciation of jadeite-jade green under the standard light sources D65, A and CWF. Acta Geol. Sin.-Engl. Ed. 2016, 90, 2097–2103. [Google Scholar] [CrossRef]
  27. Guo, Y. Quality grading system of Jadeite-Jade green based on three colorimetric parameters under CIE standard light sources D-65, CWF and A. Bulg. Chem. Commun. 2017, 49, 961–968. [Google Scholar]
  28. Guo, Y.; Zong, X.; Qi, M. Feasibility study on quality evaluation of Jadeite-jade color green based on GemDialogue color chip. Multimed. Tools Appl. 2019, 78, 841–856. [Google Scholar] [CrossRef]
  29. Guo, Y.; Zong, X.; Qi, M.; Zhang, Y.; Wang, H. Feasibility study on color evaluation of jadeite based on GemDialogue color chip images. EURASIP J. Image Video Process. 2018, 2018, 1–9. [Google Scholar] [CrossRef] [Green Version]
  30. Guo, Y.; Zhang, X.; Li, X.; Zhang, Y. Quantitative characterization appreciation of golden citrine golden by the irradiation of [FeO4] 4−. Arab. J. Chem. 2018, 11, 918–923. [Google Scholar]
  31. Cheng, R.; Guo, Y. Study on the effect of heat treatment on amethyst color and the cause of coloration. Sci. Rep. 2020, 10, 14927. [Google Scholar] [CrossRef] [PubMed]
  32. Han, J.; Kamber, M.; Pei, J. Data mining concepts and techniques third edition. Morgan Kaufmann Ser. Data Manag. Syst. 2011, 5, 83–124. [Google Scholar]
  33. Nazari, A.; Dehghan, A.; Nejatian, S.; Rezaie, V.; Parvin, H. A comprehensive study of clustering ensemble weighting based on cluster quality and diversity. Pattern Anal. Appl. 2019, 22, 133–145. [Google Scholar] [CrossRef]
  34. Frey, B.J.; Dueck, D. Clustering by passing messages between data points. Science 2007, 315, 972–976. [Google Scholar] [CrossRef] [PubMed] [Green Version]
  35. Li, Y.; Guo, C.; Sun, L. Fast Clustering by Affinity Propagation Based on Density Peaks. IEEE Access 2020, 8, 138884–138897. [Google Scholar] [CrossRef]
  36. Dueck, D.; Frey, B.J.; Jojic, N.; Jojic, V.; Giaever, G.; Emili, A.; Musso, G.; Hegele, R. Constructing treatment portfolios using affinity propagation. In Proceedings of the Annual International Conference on Research in Computational Molecular Biology, Singapore, 30 March–2 April 2008; pp. 360–371. [Google Scholar]
  37. Huang, T.-H.; Cheng, K.-Y.; Chuang, Y.-Y. A collaborative benchmark for region of interest detection algorithms. In Proceedings of the 2009 IEEE Conference on Computer Vision and Pattern Recognition, Miami, FL, USA, 20–25 June 2009; pp. 296–303. [Google Scholar]
  38. Verma, R.; Wang, P. On detecting subtle pathology via tissue clustering of multi-parametric data using affinity propagation. In Proceedings of the 2007 IEEE 11th International Conference on Computer Vision, Rio de Janeiro, Brazil, 14–21 October 2007; pp. 1–8. [Google Scholar]
  39. Dueck, D.; Frey, B.J. Non-metric affinity propagation for unsupervised image categorization. In Proceedings of the 2007 IEEE 11th International Conference on Computer Vision, Rio de Janeiro, Brazil, 14–21 October 2007; pp. 1–8. [Google Scholar]
  40. Zhao, Z.-Q.; Gao, J.; Glotin, H.; Wu, X. A matrix modular neural network based on task decomposition with subspace division by adaptive affinity propagation clustering. Appl. Math. Model. 2010, 34, 3884–3895. [Google Scholar] [CrossRef]
  41. Reddy, B.J.; Frost, R.L. Electronic and vibrational spectra of gaspeite. Neues Jahrb. Mineral.—Mon. 2004, 2004, 525–536. [Google Scholar] [CrossRef]
  42. Shigley, J.E.; Laurs, B.M.; Renfro, N.D. Chrysoprase and prase opal from Haneti, Central Tanzania. Gems Gemol. 2009, 45, 271–279. [Google Scholar] [CrossRef]
  43. Faye, G. Optical absorption spectrum of Ni (super 2+) in garnierite; a discussion. Can. Mineral. 1974, 12, 389–393. [Google Scholar]
  44. Rao, J.L.; Purandar, K. Optical absorption spectrum of Ni2+ in zinc cesium sulphate hexahydrate. Spectrochim. Acta Part A Mol. Spectrosc. 1981, 37, 787–792. [Google Scholar] [CrossRef]
  45. Brindley, G.; Bish, D.; Wan, H.-M. Compositions, structures, and properties of nickel-containing minerals in the kerolite-pimelite series. Am. Mineral. 1979, 64, 615–625. [Google Scholar]
  46. Lam, Y.M.; Xin, J.H. Evaluation of the quality of different D65 simulators for visual assessment. Colour Res. Appl. 2002, 27, 243–251. [Google Scholar] [CrossRef]
  47. Chang, C.-W.; Hon, M.-H.; Leu, C. The transmittance and sheet resistance of chemically and heat reduced graphene oxide film. Opt. Quantum Electron. 2019, 51, 4. [Google Scholar] [CrossRef]
  48. Liu, M.; Zhang, Y.; Wu, C.; Xiong, S.; Zhou, C. Chitosan/halloysite nanotubes bionanocomposites: Structure, mechanical properties and biocompatibility. Int. J. Biol. Macromol. 2012, 51, 566–575. [Google Scholar] [CrossRef] [PubMed]
Figure 1. Photograph of a few of the samples used in the present study.
Minerals 11 01092 g001
Figure 2. The experimental device. The background was placed underneath the chrysoprase sample and the colour signals were collected by the spectrophotometer. The colour data were transferred to a computer for analysis.
Minerals 11 01092 g002
Figure 3. How affinity propagation works. (a) “Responsibilities” r(i,k) are sent from then data points to the candidate exemplars and indicate how strongly each data point favours the candidate exemplar over the other candidate exemplars. (b) “Availabilities” a(i,k) are sent from the candidate exemplars to the data points and indicate to what degree each candidate exemplar is available as a cluster centre for the data point.
Minerals 11 01092 g003
Figure 4. The UV-VIS spectra of chrysoprase are characterised by Ni2+ absorption features.
Minerals 11 01092 g004
Figure 5. Pictures of chrysoprase on different neutral backgrounds, shown with the associated simulated colours.
Minerals 11 01092 g005
Figure 6. Changes in the luminance factor Yb of the Munsell neutral backgrounds produces changes in the colour of the chrysoprase. (a) Relationship between the lightness of the chrysoprase (or the background lightness) and the luminance of the background and (b) correlation between the chrysoprase chroma C* or hue angle h° and the luminance of the background.
Minerals 11 01092 g006
Figure 7. Effect of transparency on the colour of chrysoprase on different backgrounds. (a) The higher the transmittance at a wavelength of 550 nm, the greater the colour difference between the chrysoprase on N0.5 and N9.5 neutral backgrounds. The figure in the upper left corner is the ultraviolet-visible transmission spectrum of chrysoprase. (b) For samples with a transmittance at 550 nm of less than 50%, the range of a* and b* does not expand with an increasing background lightness. (c) For the group with a transmittance at 550 nm over 50%, the range of a* and b* becomes wider as the background lightness increases, indicating that the colour is dispersed as the background becomes lighter.
Minerals 11 01092 g007
Figure 8. Colour grading of chrysoprase on an N9.5 background. (a) According to the result of affinity propagation (AP) clustering, the colours of the 40 chrysoprase samples can be divided into five groups. (b) The five groups of chrysoprase colour: Fancy Light, Fancy, Fancy Intense, Fancy Deep and Fancy Dark.
Minerals 11 01092 g008
Figure 9. Changes in the colour coordinates a* and b* with different grey backgrounds. (a) With an increasing background luminance, a* decreases and b* increases. (b) A cast-point diagram of a* and b* mean values for 40 chrysoprase samples on each Munsell background. The average hue angle of the sample for background N0.5 is α1. The average hue angle of the sample for background N9.5 is α2. With an increasing background lightness, the hue angle of the sample gradually decreases.
Minerals 11 01092 g009
Table 1. Relevant visible absorptions and assignments for chrysoprase.
Wavelength (nm)Assignment
3903A2g(F) → 3T1g(P)
4603A2g(F) → 1T2g(D)
6503A2g(F) → 3T1g(F)
7503A2g(F) → 1Eg(D)
Table 2. The five clustering centres of AP clustering.
Cluster CentreL*a*b*Simulated Colour
171.9−21.5111.18 Minerals 11 01092 i001
265.19−31.3814.33 Minerals 11 01092 i002
369.65−34.4614.76 Minerals 11 01092 i003
459.88−35.7213.72 Minerals 11 01092 i004
554.56−30.9418.71 Minerals 11 01092 i005
Table 3. The ANOVA results of AP Clustering.
Colour ParameterClusteringErrorFSig
Mean SquareDfMean SquareDf
L*370.68346.9613553.2490.000
a*327.21248.5583538.2340.000
b*42.43147.626355.5640.001
Table 4. Colour difference between the samples and cluster centres.
Samples/ΔE00Cluster Centre
12345
Minerals 11 01092 i006 Minerals 11 01092 i007 Minerals 11 01092 i008 Minerals 11 01092 i009 Minerals 11 01092 i010
Gr-Chr-019
Minerals 11 01092 i011
16.71210.25813.5145.486 *4.174 **
Gr-Chr-023
Minerals 11 01092 i012
8.8143.184 **3.445 *5.33311.039
Gr-Chr-032
Minerals 11 01092 i013
7.9892.074 **3.073 *5.11010.606
* Colour difference between the samples and the cluster centre to which the classification result given by AP belongs. ** Minimum colour difference between the samples and the five cluster centres.
Publisher’s Note: MDPI stays neutral with regard to jurisdictional claims in published maps and institutional affiliations.

