Article

Carbon-Assisted Bioleaching of Chalcopyrite and Three Chalcopyrite/Enargite-Bearing Complex Concentrates

1
Department of Earth Resources Engineering, Kyushu University, Fukuoka 819-0395, Japan
2
Sumitomo Metal Mining, Co. Ltd., Ehime 792-0002, Japan
*
Author to whom correspondence should be addressed.
These authors contributed equally to this work.
Minerals 2021, 11(4), 432; https://doi.org/10.3390/min11040432
Submission received: 24 March 2021 / Revised: 12 April 2021 / Accepted: 16 April 2021 / Published: 19 April 2021
(This article belongs to the Special Issue Bio-recovery of Copper, Lead and Zinc)

Abstract

:
Overcoming the slow-leaching kinetics of refractory primary copper sulfides is crucial to secure future copper sources. Here, the effect of carbon was investigated as a catalyst for a bioleaching reaction. First, the mechanism of carbon-assisted bioleaching was elucidated using the model chalcopyrite mineral, under specified low-redox potentials, by considering the concept of Enormal. The carbon catalyst effectively controlled the Eh level in bioleaching liquors, which would otherwise exceed its optimal range (0 ≤ Enormal ≤ 1) due to active regeneration of Fe3+ by microbes. Additionally, Enormal of ~0.3 was shown to maximize the carbon-assisted bioleaching of the model chalcopyrite mineral. Secondly, carbon-assisted bioleaching was tested for three types of chalcopyrite/enargite-bearing complex concentrates. A trend was found that the optimal Eh level for a maximum Cu solubilization increases in response to the decreasing chalcopyrite/enargite ratio in the concentrate: When chalcopyrite dominates over enargite, the optimal Eh was found to satisfy 0 ≤ Enormal ≤ 1. As enargite becomes more abundant than chalcopyrite, the optimal Eh for the greatest Cu dissolution was shifted to higher values. Overall, modifying the Eh level by adjusting AC doses to maximize Cu solubilization from the concentrate of complex mineralogy was shown to be useful.

1. Introduction

To satisfy the world’s increasing copper demand, refractory primary copper sulfides, represented by chalcopyrite (CuFeS2), are now also considered a critical copper source. Despite its refractoriness, chalcopyrite constitutes a dominant component of porphyry copper deposits and accounts for approx. 70% of the world’s copper reserves [1]. Therefore, researchers have been trying to overcome chalcopyrite’s slow-leaching kinetics through a number of chemical leaching studies using a variety of lixiviant. While the formation of secondary minerals, such as elemental sulfur (S0), disulfide (S22−), polysulfide (Sn2−) (metal deficient sulfide) and Fe oxyhydroxide (jarosite-like species), have been proposed [2], the nature of the chalcopyrite surface transition is still debated. On the one hand, such surface passivation layers were suggested to hinder chalcopyrite chemical leaching (e.g., [3,4,5]). On the other hand, it was suggested that porous S0 layers do not impede the leaching efficiencies [4,6,7,8]. Nonetheless, it is generally recognized that one of the most critical factors ruling the chalcopyrite leaching efficiency is the solution redox potential (Eh).
It was suggested by Viramontes-Gamboa et al. [5,9] that chalcopyrite leaching with ferric sulfate is in its active state at <685 mV (SHE), regardless of impurities in the chalcopyrite or the acidity and temperature of the reaction. In the range of 685–755 mV (SHE), chalcopyrite is in its bistable state (either passive or active, depending on how it was brought to that potential). Chalcopyrite leaching comes in its passive state at >755 mV (SHE) due to a strong passivation effect [5,9].
A series of electrochemical/chemical leaching studies of chalcopyrite by Hiroyoshi et al. [10,11] proposed the Eh-controlled chalcopyrite dissolution mechanism, in which chalcopyrite leaching in ferric sulfate is promoted by Fe2+ and Cu2+ to form intermediate chalcocite (Cu2S) at low Eh (1). Cu2S is then oxidized by Fe3+ to yield Cu2+ (2):
CuIFeIIIS−II2 (chalcopyrite) + 3Cu2+ + 3Fe2+ → 2CuI2S−II (chalcocite) + 4Fe3+
Cu2S (chalcocite) + 4Fe3+ → 2Cu2+ + S0 + 4Fe2+
Copper dissolution is promoted within the range of Eox < Eh < Ec, with an optimal Eh of 630 mV (SHE) [10,12], where Ec (“critical potential”): the equilibrium redox potential of the formation of the intermediate chalcocite from chalcopyrite
( E c   ( V )   =   E c 0   +   RT 4 F   ln   a C u 2 + 3 a F e 2 + )
Eox (“oxidation potential”): the equilibrium redox potentials of the subsequent oxidation of chalcocite
Cu 2 +   ( E ox   ( V )   =   E ox 0   +   RT 4 F   ln   a C u 2 + 2 )
Here, experimental conditions (i.e., metal ion concentrations, solid/liquid ratios and co-existing minerals) can affect the optimal Eh value for Cu solubilization, causing misleading interpretation of data produced under different conditions [10,11,13,14]. To define the optimal Eh regardless of such conditional differences, the “normalized redox potential (Enormal)” was proposed, with its optimal range being 0 ≤ Enormal ≤ 1 (greatest Cu solubilization rate achieved at Enormal ≈ 0.43 at 30 °C [10,11,13,14]:
Enormal = (EhEox)/(EcEox)
In the case of bioleaching studies of chalcopyrite, Gericke et al. [15] and Ahmadi et al. [16,17] reported the advantages of Eh control (via electrochemical reduction or oxygen arrest) at 600–650 mV (SHE), owing to the suppression of pyrite oxidation and thereby preventing jarosite passivation. These were followed by our Eh-controlled bioleaching study using “weak” Fe2+-oxidizing microorganisms [18]. Masaki et al. [18] reported the reaction rate-limiting step being dependent on Eh and successfully clarified the chalcopyrite bioleaching efficiency by incorporating the concept of Enormal: Controlling the optimal Eh level to satisfy 0 ≤ Enormal ≤ 1 (especially at Enormal = ~0.35 at 45 °C) was critical in promoting steady Cu solubilization by a surface chemical reaction.
So far, other studies on AC-assisted bioleaching of chalcopyrite attributed the effect of AC to the galvanic interaction between electrically nobler AC and electrically poorer chalcopyrite, as well as the lowered Eh level as the driving force for the mineral dissolution [19,20,21,22,23]. Still, its detailed mechanism is unclear, and the concept of Enormal has yet to be verified in the AC-assisted bioleaching system of chalcopyrite. Hence, the first objective of the present study was set to clarify the catalytic function of AC in bioleaching of the model chalcopyrite, especially in the viewpoint of Enormal as well as a possible galvanic effect.
In practice, multiple mineral types co-exist in ore concentrates. Enargite (Cu3AsS4) is another refractory primary copper sulfide often concomitant with chalcopyrite. The fundamental difference between the two is that unlike chalcopyrite leaching, which favors the controlled Eh level, the dissolution of the enargite mineral itself prefers a strong oxidizing condition [24]. Therefore, in such situations where chalcopyrite and enargite co-exist in the concentrate, the interpretation of AC’s catalytic function can become complicated. So far, the Enormal theory has been proposed only for the chalcopyrite leaching behavior [10,11,13,14] but not for enargite.
Ahead of the present study on chalcopyrite, we have reported the catalytic mechanism of AC-assisted bioleaching of enargite concentrate (37.4% enargite and 47.3% pyrite) with moderately thermophilic microorganisms at 45 °C [25]. The enargite mineral itself favored higher Eh for solubilization. However, the dissolution of co-existing pyrite, which also favors high Eh, immediately hindered enargite dissolution through the surface passivation. The AC surface functioned as an electron mediator to couple RISCs’ oxidation and Fe3+ reduction, thus lowering the Eh by offsetting microbial Fe3+ regeneration. By controlling at Eh < 700 mV, the pyrite dissolution was largely suppressed, which in turn enabled a steady and continuous dissolution of enargite [25]. By combining these findings on the AC-assisted enargite bioleaching mechanism [25], the second objective of the present study was set to test three types of chalcopyrite/enargite-bearing complex concentrates for the AC-assisted bioleaching in order to compare and clarify their leachability with regard to the Eh profile.

2. Materials and Methods

2.1. Minerals

Nearly pure chalcopyrite with pyrite as a minor constituent (S 37.1%, Cu 32.7% and Fe 28.8% [18]; D50 = 25 μm) was used as a model mineral. Additionally, three types of chalcopyrite/enargite-bearing complex concentrates, D3 (D50 = 39 μm), Eb (D50 = 81 μm) and Ea (D50 = 49 μm), were used (Figure 1). Chalcopyrite was washed with 1 M HNO3, deionized water and 100% ethanol, followed by freeze-drying overnight and sterilization by autoclaving prior to use. Other concentrates were used as received, without washing and sterilization.

2.2. Microorganisms

Four moderately thermophilic, acidophilic microorganisms were used as different mixed cultures in this study: (i) Fe-oxidizing archaeon, Acidiplasma sp. Fv-Ap; (ii) S-oxidizing bacterium, Acidithiobacillus (At.) caldus KU (DSM 8584T); (iii) Fe-oxidizing bacterium, Acidimicrobium (Am.) ferrooxidans ICP (DSM 10331T); (iv) Fe/S-oxidizing bacterium Sulfobacillus (Sb.) sibiricus N1 (DSM 17363T). They were maintained and pre-grown aerobically at 45 °C in heterotrophic basal salts (HBS) medium [25] (pH 1.5 adjusted with 1 M H2SO4). For Acidiplasma sp. Fv-Ap, Am. ferrooxidans ICP, and Sb. sibiricus N1 and 0.02% (w/v) yeast extract plus 10 mM Fe2+ (added as FeSO4 7H2O) were added. For At. caldus KU, 0.1% (w/v) S0 plus 0.1% (v/v) of trace elements stock solution (10 mg/L ZnSO4 7H2O, 1 mg/L CuSO4 5H2O, 1.09 mg/L MnSO4 5H2O, 1 mg/L CoSO4 7H2O, 0.39 mg/L Cr2(SO4)3 7H2O, 0.6 mg/L H2BO3, 0.5 mg/L Na2MoO4 2H2O, 0.1 mg/L NaVO3, 1 mg/L NiSO4 6H2O, 0.51 mg/L Na2SeO4, 0.1 mg/L Na2WO4 2H2O) were added.

2.3. Carbon-Assisted Bioleaching Tests of the Model Chalcopyrite

Bioleaching tests were conducted in 500 mL flasks containing 200 mL HBS media (pH 1.5 adjusted with 1 M H2SO4) with 5 mM Fe2+ (as FeSO4 7H2O), 0.01% (w/v) S0 and 1% (w/v) chalcopyrite. Pre-grown cells (as described in Section 2.2) of Acidiplasma sp. Fv-Ap and At. caldus KU were harvested at the early stationary phase by centrifugation (9000 rpm, 10 min at 4 °C), washed with fresh medium and inoculated to an initial cell density of 1.0 × 10⁷ cells/mL (2.0 × 10⁷ cells/mL in total). The mixed culture of the two strains was shown to exhibit high Eh (>800 mV) during the bioleaching of chalcopyrite [18]. In order to first compare two different carbon materials, namely, powdery activated carbon (AC; Wako; 46.5 µm, 1400 m2/g) and milled carbon fiber (CF; CFMP-30X, Nippon Polymer; 30.6 µm; 6.2 m2/g), chalcopyrite bioleaching tests were conducted at different AC (0%, 0.025%, 0.05% or 0.1% (w/v) and CF (0%, 0.5%, 1.0% or 2.0% (w/v)) doses. The flasks were incubated aerobically and shaken at 45 °C and 150 rpm. Cell-free flasks were set up in parallel. All tests were done in duplicate flasks.

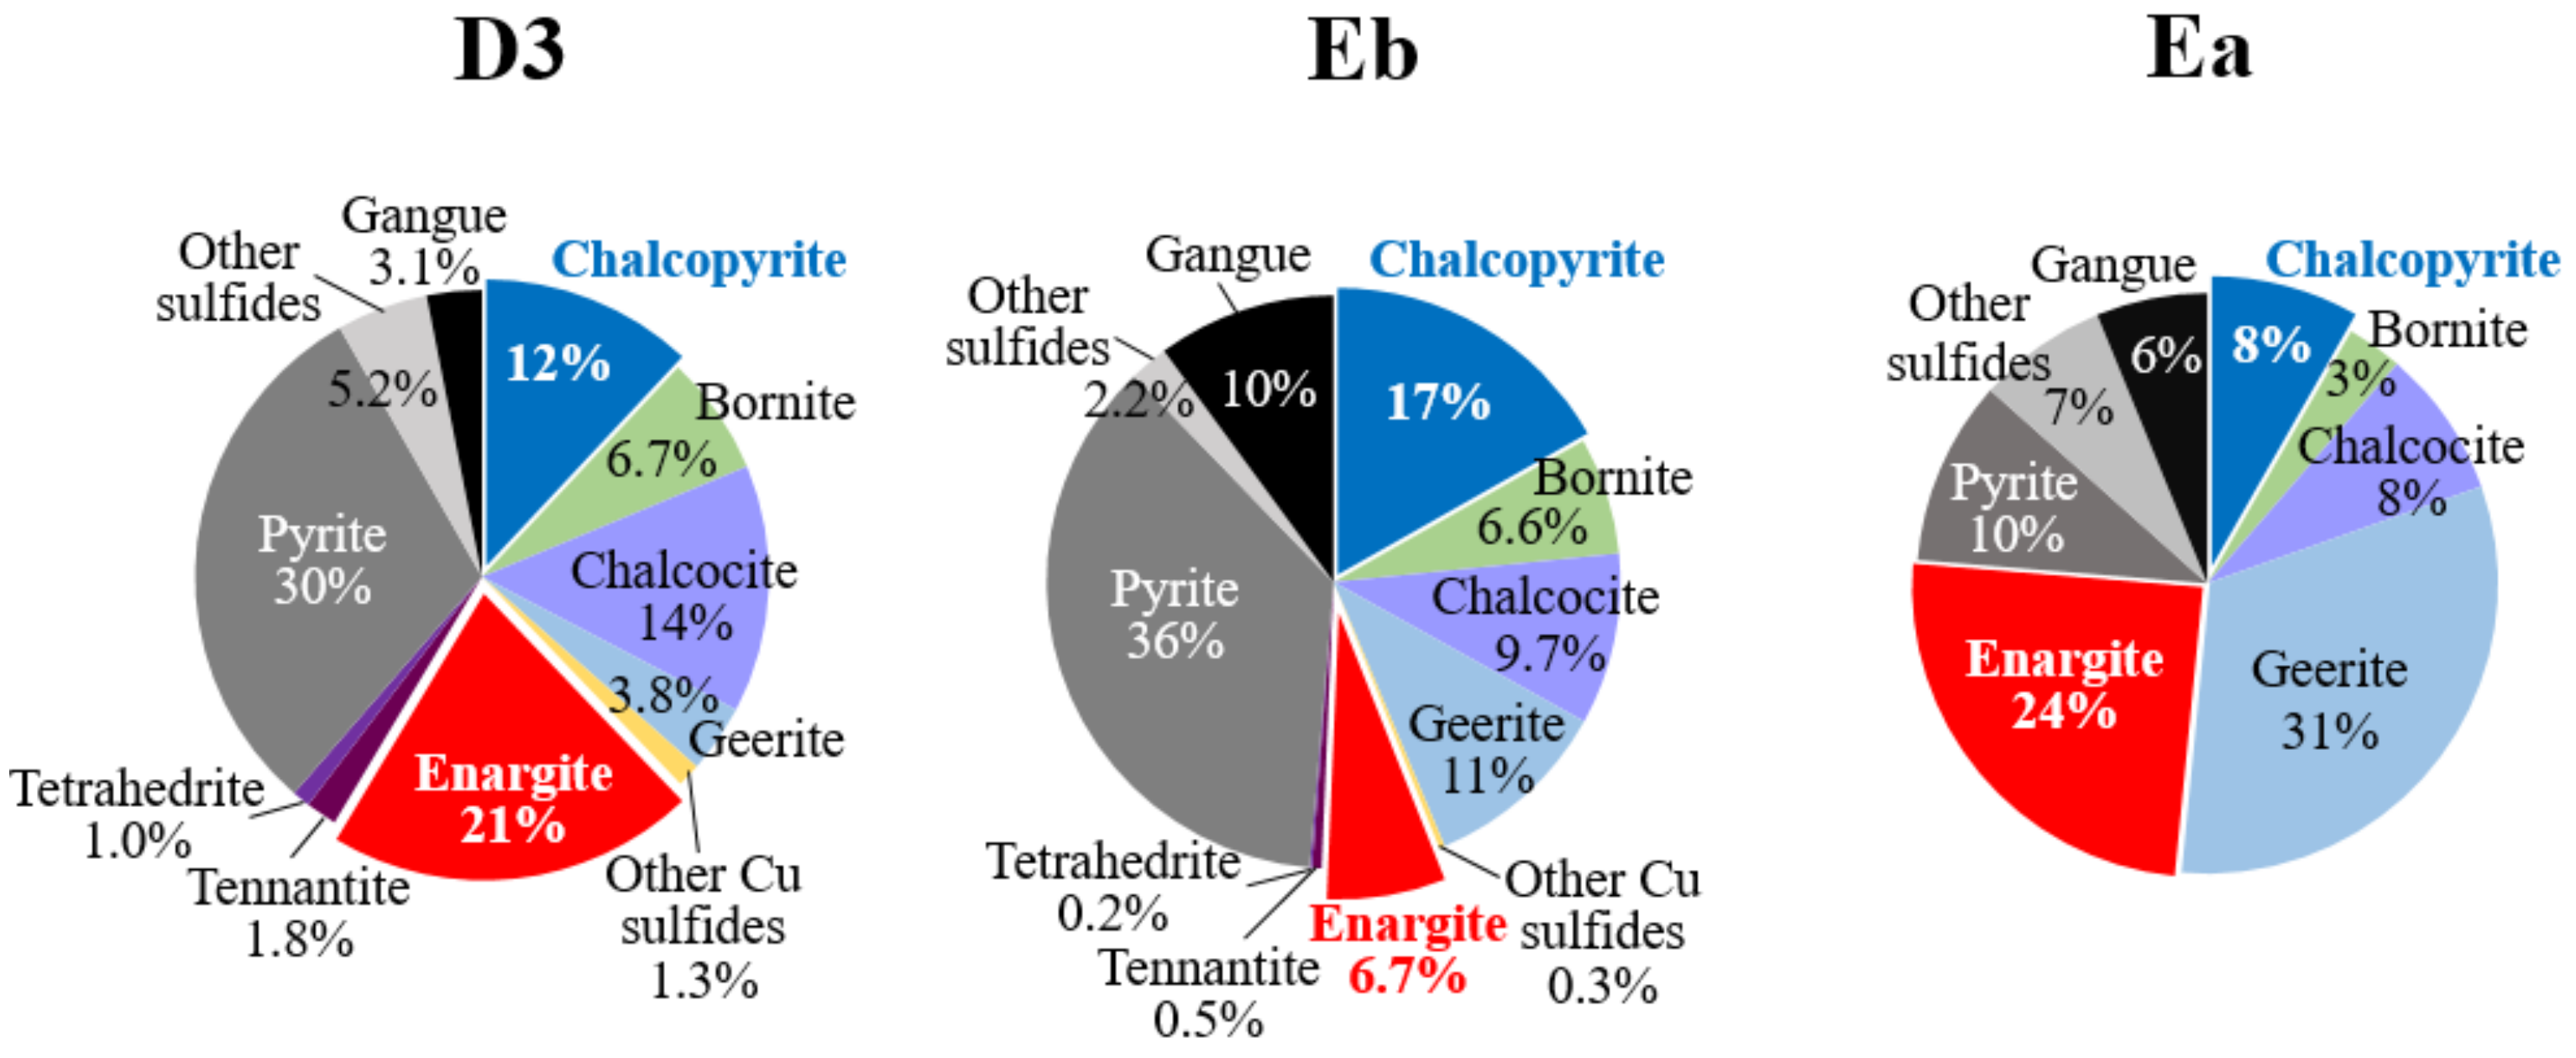
2.4. Activated Carbon-Assisted Bioleaching of Three Types of Chalcopyrite/Enargite-Bearing Complex Concentrates (D3, Eb and Ea Concentrates)

Bioleaching tests were conducted in 500 mL flasks containing 200 mL HBS media (pH 1.5 adjusted with 1 M H2SO4) with 5 mM Fe2+ (as FeSO4 7H2O), 0.01% (w/v) S0, 0.01% (w/v) yeast extract and 1% (w/v) D3, Eb or Ea concentrate. Pre-grown cells (as described in Section 2.2) of Acidiplasma sp. Fv-Ap, Am. ferrooxidans ICP, Sb. sibiricus N1 and At. caldus KU were harvested at the early stationary phase by centrifugation (9000 rpm, 10 min at 4 °C), washed with fresh medium and inoculated to an initial cell density of 1.0 × 10⁷ cells/mL (4.0 × 10⁷ cells/mL in total). The mixed culture of the latter three strains was shown to exhibit high Eh (>800 mV) during the bioleaching of chalcopyrite and was effective in the oxidative dissolution of arsenopyrite while releasing over 15 mM total arsenic [26]. Powdery activated carbon (Section 2.3) was added at 0% or 0.05% (w/v) to D3 concentrate and at 0%, 0.05% or 0.3% (w/v) to Eb and Ea concentrates. The flasks were incubated aerobically and shaken at 45 °C and 150 rpm. The culture pH was manually adjusted (using H2SO4) to 1.5 twice on days 2 and 3 for the D3 concentrate and once on day 4 for the Eb concentrate. No manual pH re-adjustment was done for the Ea concentrate. Cell-free flasks were set up in parallel. All tests were done in duplicate flasks.

2.5. Solution and Solid Residue Analyses

Liquid samples were regularly taken to monitor pH, Eh (vs. SHE), cell density (direct count of planktonic cells using a Thoma cell-counting chamber) and concentrations of total soluble Cu, As, Fe (Inductively Coupled Plasma Optical Emission Spectrometry (ICP-OES); PerkinElmer Optima 8300 DV) and Fe2+ (o-phenanthroline method). Leaching residues were collected at the end of the experiment and freeze-dried overnight for X-Ray Diffraction (XRD; Ultima IV, Rigaku; CuKα 40 mA, 40 kV) analysis and Scanning Electron Microscope (SEM; VE-9800, KEYENCE) observation.

2.6. Electrochemical Galvanic Current Measurement

Three mineral electrodes (1 cm3 cube of pure chalcopyrite, pasted and solidified AC or CF) were prepared and polished by emery-paper to provide a fresh flat surface before each measurement. Solutions with varying Eh values were prepared using 0.1 M H2SO4 solution containing 0.1 M Fe with different Fe2+/Fe3+ ratios, to adjust Eh to 0.56, 0.62, 0.68, 0.74 and 0.8 V (vs. SHE). The Eh values were measured with the Ag/AgCl reference electrode and the Pt working electrode. The Pt electrode was then replaced with each of the mineral electrodes to measure mineral potentials (ECp, EAC and ECF, respectively, for 300 s) using the electrochemical analyzer (1280C, Solartron Analytical). The ΔEAC−Cp and ΔECF−Cp values were defined as the galvanic electromotive force between the two minerals. The galvanic current between the two minerals (IAC−Cp or ICF−Cp) was measured (300 s) by connecting the chalcopyrite electrode to either the CF electrode or the AC electrode, which was done by applying the galvanic electromotive force (ΔECp−AC or ΔECp−CF) to simulate the galvanic interaction between the two minerals. All tests were done in duplicate flasks.

3. Results and Discussion

3.1. Carbon-Assisted Bioleaching of the Model Chalcopyrite

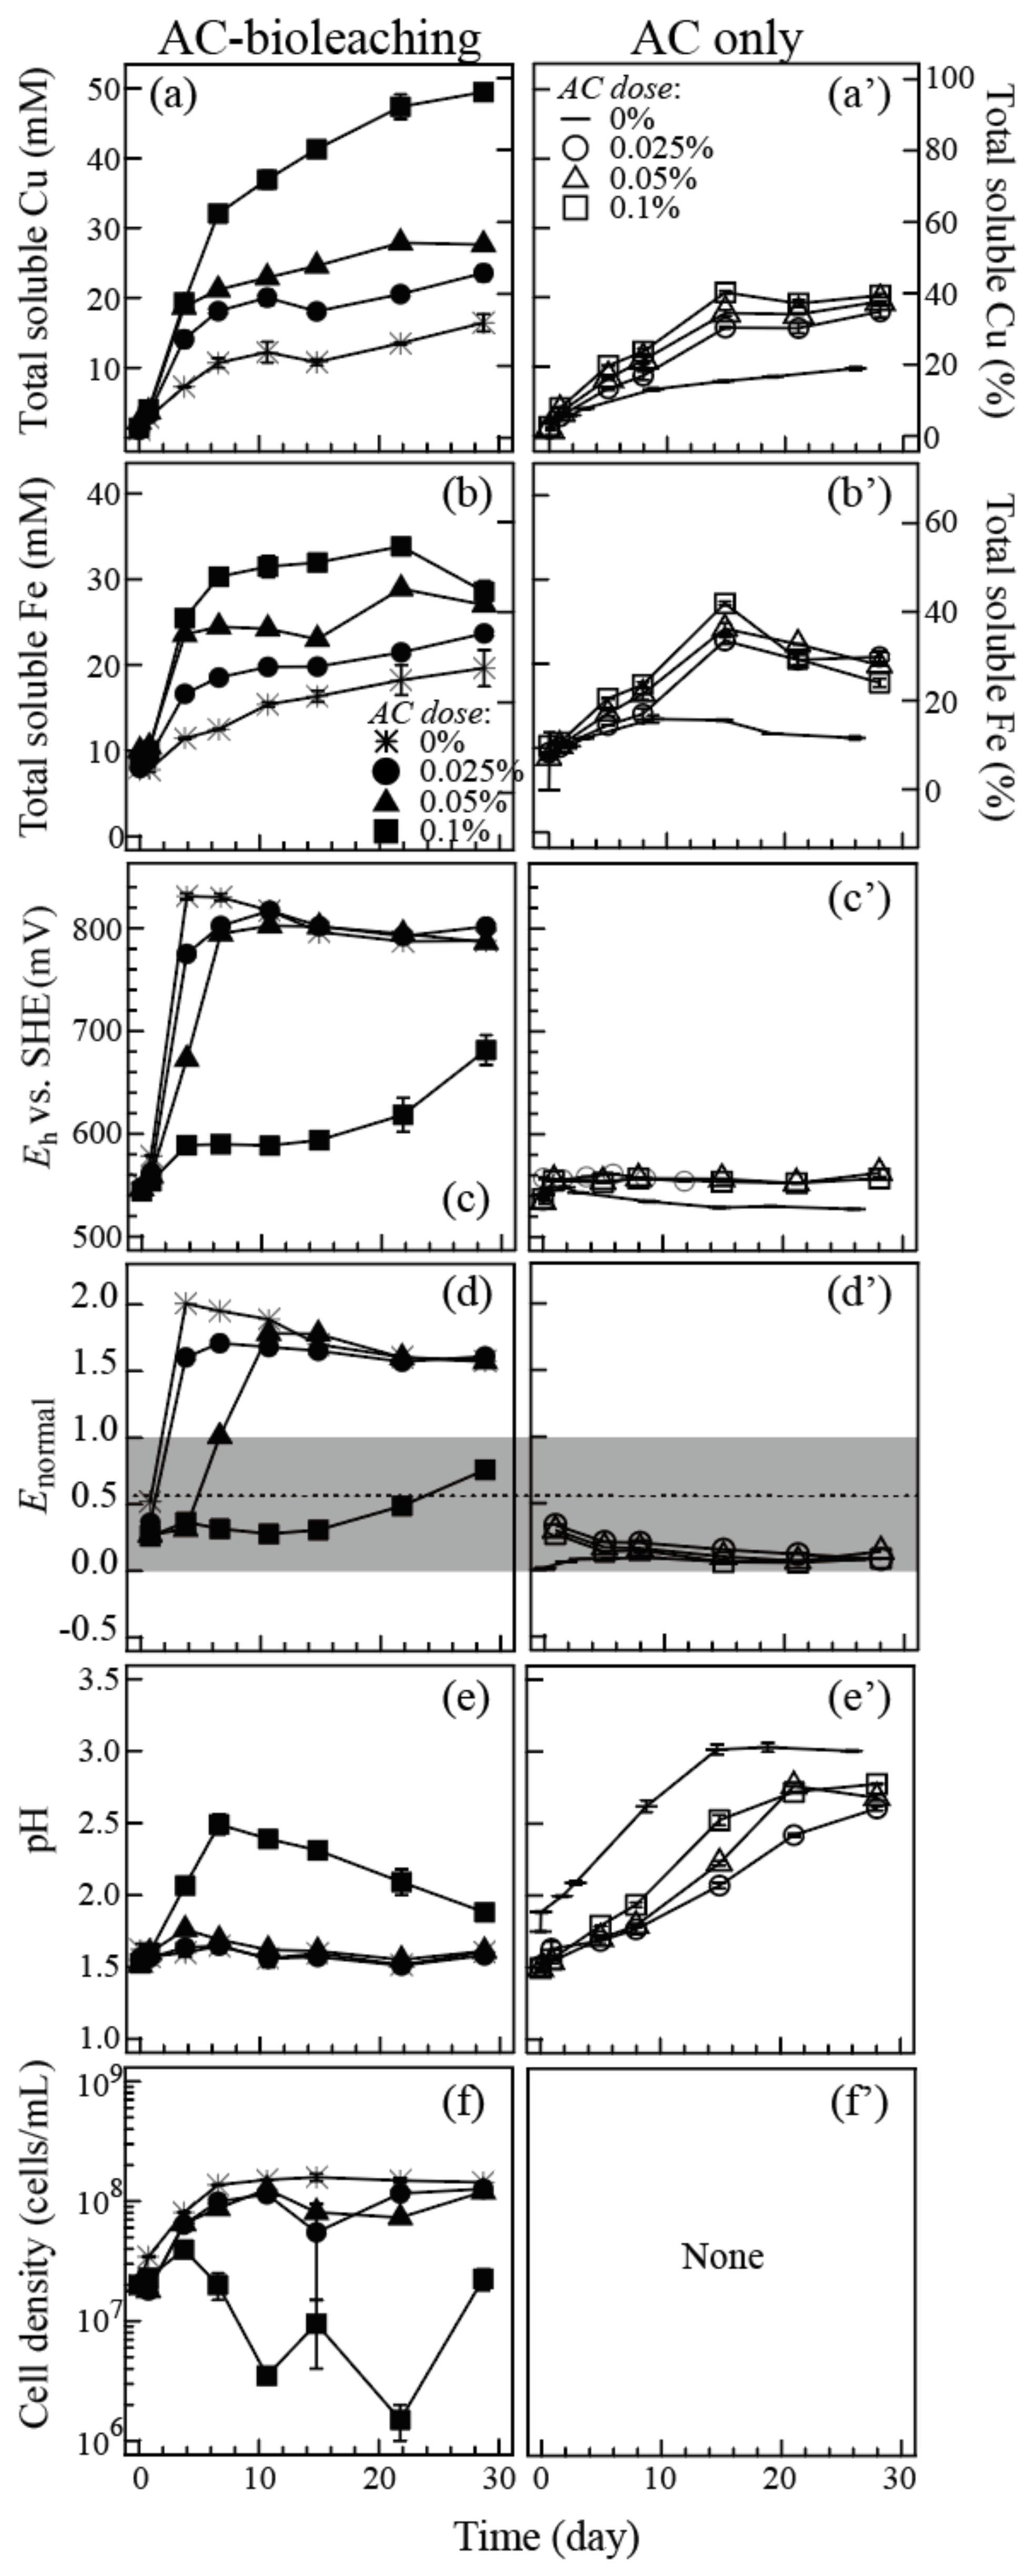
3.1.1. Synergistic Effect of Carbon Material and Microorganisms

The AC-assisted leaching behavior of chalcopyrite was compared with and without bioleaching microorganisms in Figure 2. Real-time concentrations of Fe2+ and Cu2+ were incorporated into Equations (3) and (4) to calculate the Enormal value defined by Equation (5).
In AC-free bioleaching cultures, Eh rapidly jumped to >800 mV (Enormal~2) due to the active microbial Fe2+ oxidation (Figure 2c,d), consequently leading to the least Cu and Fe dissolutions from the mineral (Figure 2a,b). By elevating the AC dose, the Eh was increasingly suppressed, and the Enormal remained in its optimal range (0 ≤ Enormal ≤ 1) at 0.1% AC throughout the leaching period (Figure 2d). As a result, Cu readily dissolved to near completion at 0.1% AC (Figure 2a). The pH profiles seen in AC-bioleaching cultures are the net result of H+ consumption (by chalcopyrite dissolution and Fe2+ oxidation reactions) and H+ production (by microbial sulfur oxidation). The net pH increase from 1.5 to 2.5 was seen only at the highest AC dose of 0.1%, where the extensive chalcopyrite dissolution was promoted (Figure 2e). The planktonic cell count was unstable and even decreased at the highest AC dose of 0.1% AC, likely reflecting the attachment of cells on the AC surface as well as AC’s possible inhibitory effect on the cell growth (Figure 2f).
In the cell-free control tests, the presence of AC exhibited a slight chemical Fe2+ oxidation (coupled with the reduction of atmospheric oxygen on the AC surface), as can be seen from the Eh and Enormal profiles (Figure 2c,d, respectively). This promoted some chalcopyrite dissolution, but the Eh levels were generally too low to enable extensive chalcopyrite dissolution even at the highest AC dose of 0.1% (Figure 2a). A much more apparent pH increase was seen in cell-free controls due to the lack of microbial culture acidification (Figure 2e’).
Overall, a similar observation was made when CF, instead of AC, was added as a catalyst (Supplementary Materials Figure S1). However, the much larger specific surface area of AC (1400 m2) rather than CF (6.2 m2) made the former much more effective and practical in controlling the Eh level at lower doses. Both AC and CF were shown to start losing their catalytic effect during the bioleaching reaction due to the jarosite passivation onto the surface (Figure S2). Having a smaller surface area than AC, CF lost its Eh-controlling effect midway even at the highest dose of 2.0% (Figure S1d).
The above results suggest that carbon materials themselves possess some chemical Fe2+ oxidation ability, which induces abiotic chalcopyrite leaching but only to a limited extent. The synergistic combination of bioleaching microorganisms and carbon materials (especially AC with a larger specific surface area) exhibit the greatest chalcopyrite leaching efficiency, wherein the AC dose should be fixed to fit the culture Eh within the range of 0 ≤ Enormal ≤ 1 (“active region” for chalcopyrite dissolution) [10,11].

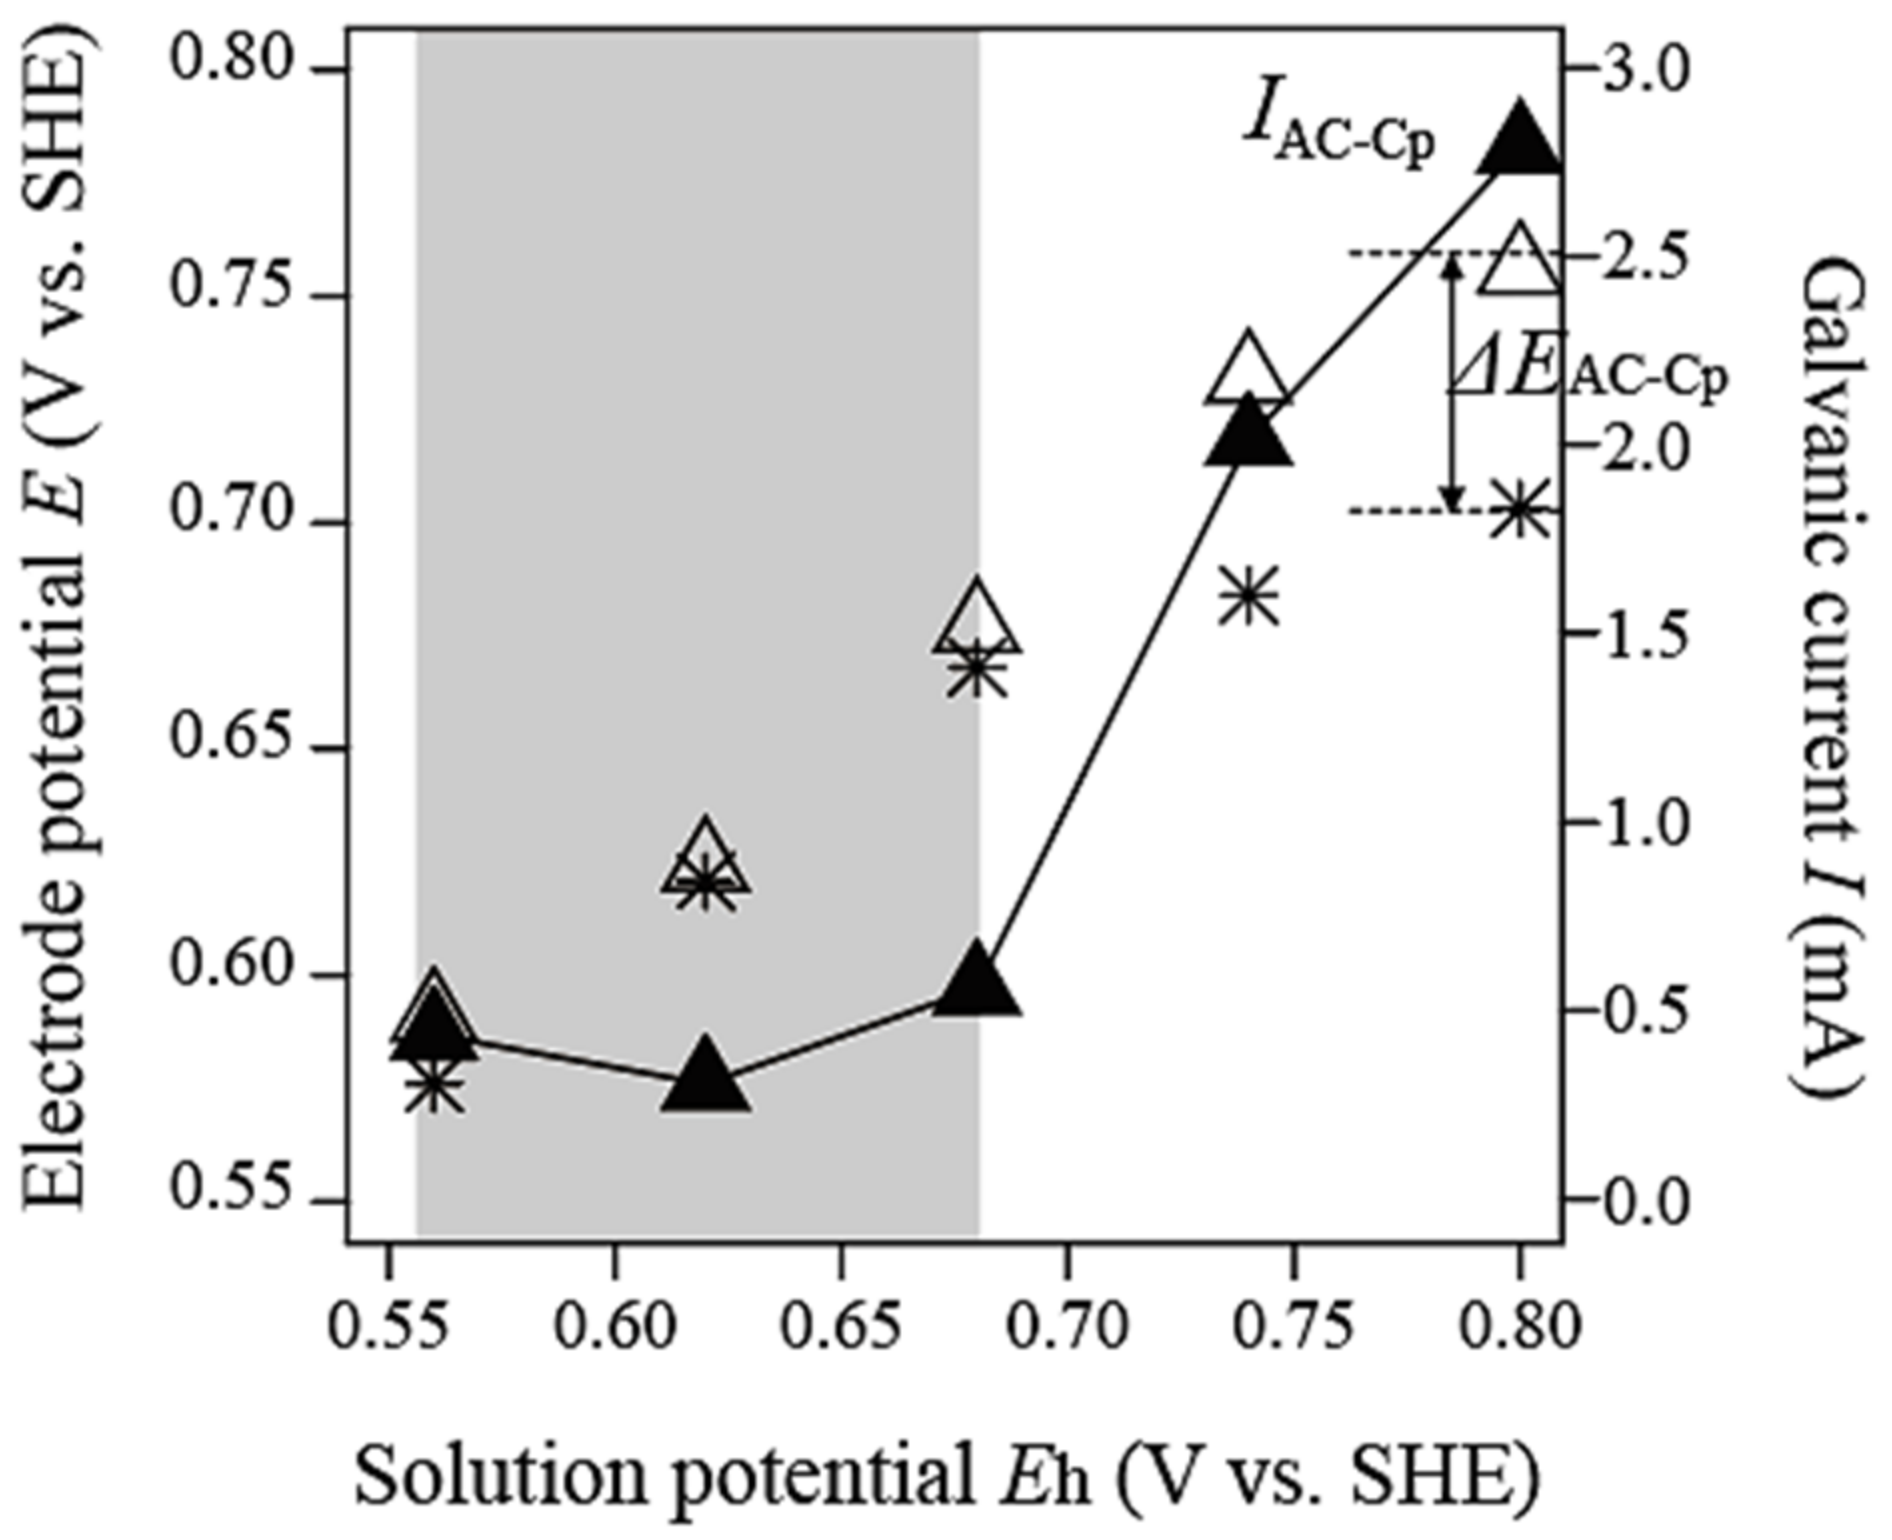
3.1.2. Galvanic Interaction between Carbon Material and Chalcopyrite

As the catalytic mechanism of AC, other researchers suggested the contribution of galvanic interaction between the surface of chalcopyrite and AC during bioleaching [19,20,21]. However, whether or not such galvanic interaction can significantly add extra leaching effect under the Eh-controlled leaching situation is unclear.
Figure 3 shows that the electrode potential of chalcopyrite (ECp) and AC (EAC) are nearly identical and equaled Eh in the Eh range of 0.55–0.68 V, but then ECp started to level off at higher Eh. This indicates that the electromotive force generated between chalcopyrite and AC (ΔEAC−Cp) is negligible at 0.55 ≤ Eh ≤ 0.68 V but becomes noticeable at Eh > 0.68 V. This trend was consistent with that of galvanic currents measured between chalcopyrite and AC (IAC−Cp). A similar observation was made using CF (Figure S3). According to this result (Figure 3), Cu solubilization behaviors observed under the elevated Eh level (i.e., ~800 mV at 0%, 0.025% and 0.05% AC; Figure 2a,c) in bioleaching cultures should have received the greatest galvanic effect. However, the extent of Cu solubilization in such high Eh-bioleaching cultures was still significantly lesser than that in the Eh-controlled bioleaching culture using 0.1% AC.
These results suggest that the primary catalytic role of AC is to control the Eh level by its Fe3+-reducing ability to provide the optimal Eh range (0 ≤ Enormal ≤ 1, “active region”) and facilitate chalcopyrite dissolution. Under such an Eh–controlled condition, the galvanic interaction seemed to make a minor (if any) contribution to its catalytic mechanism.

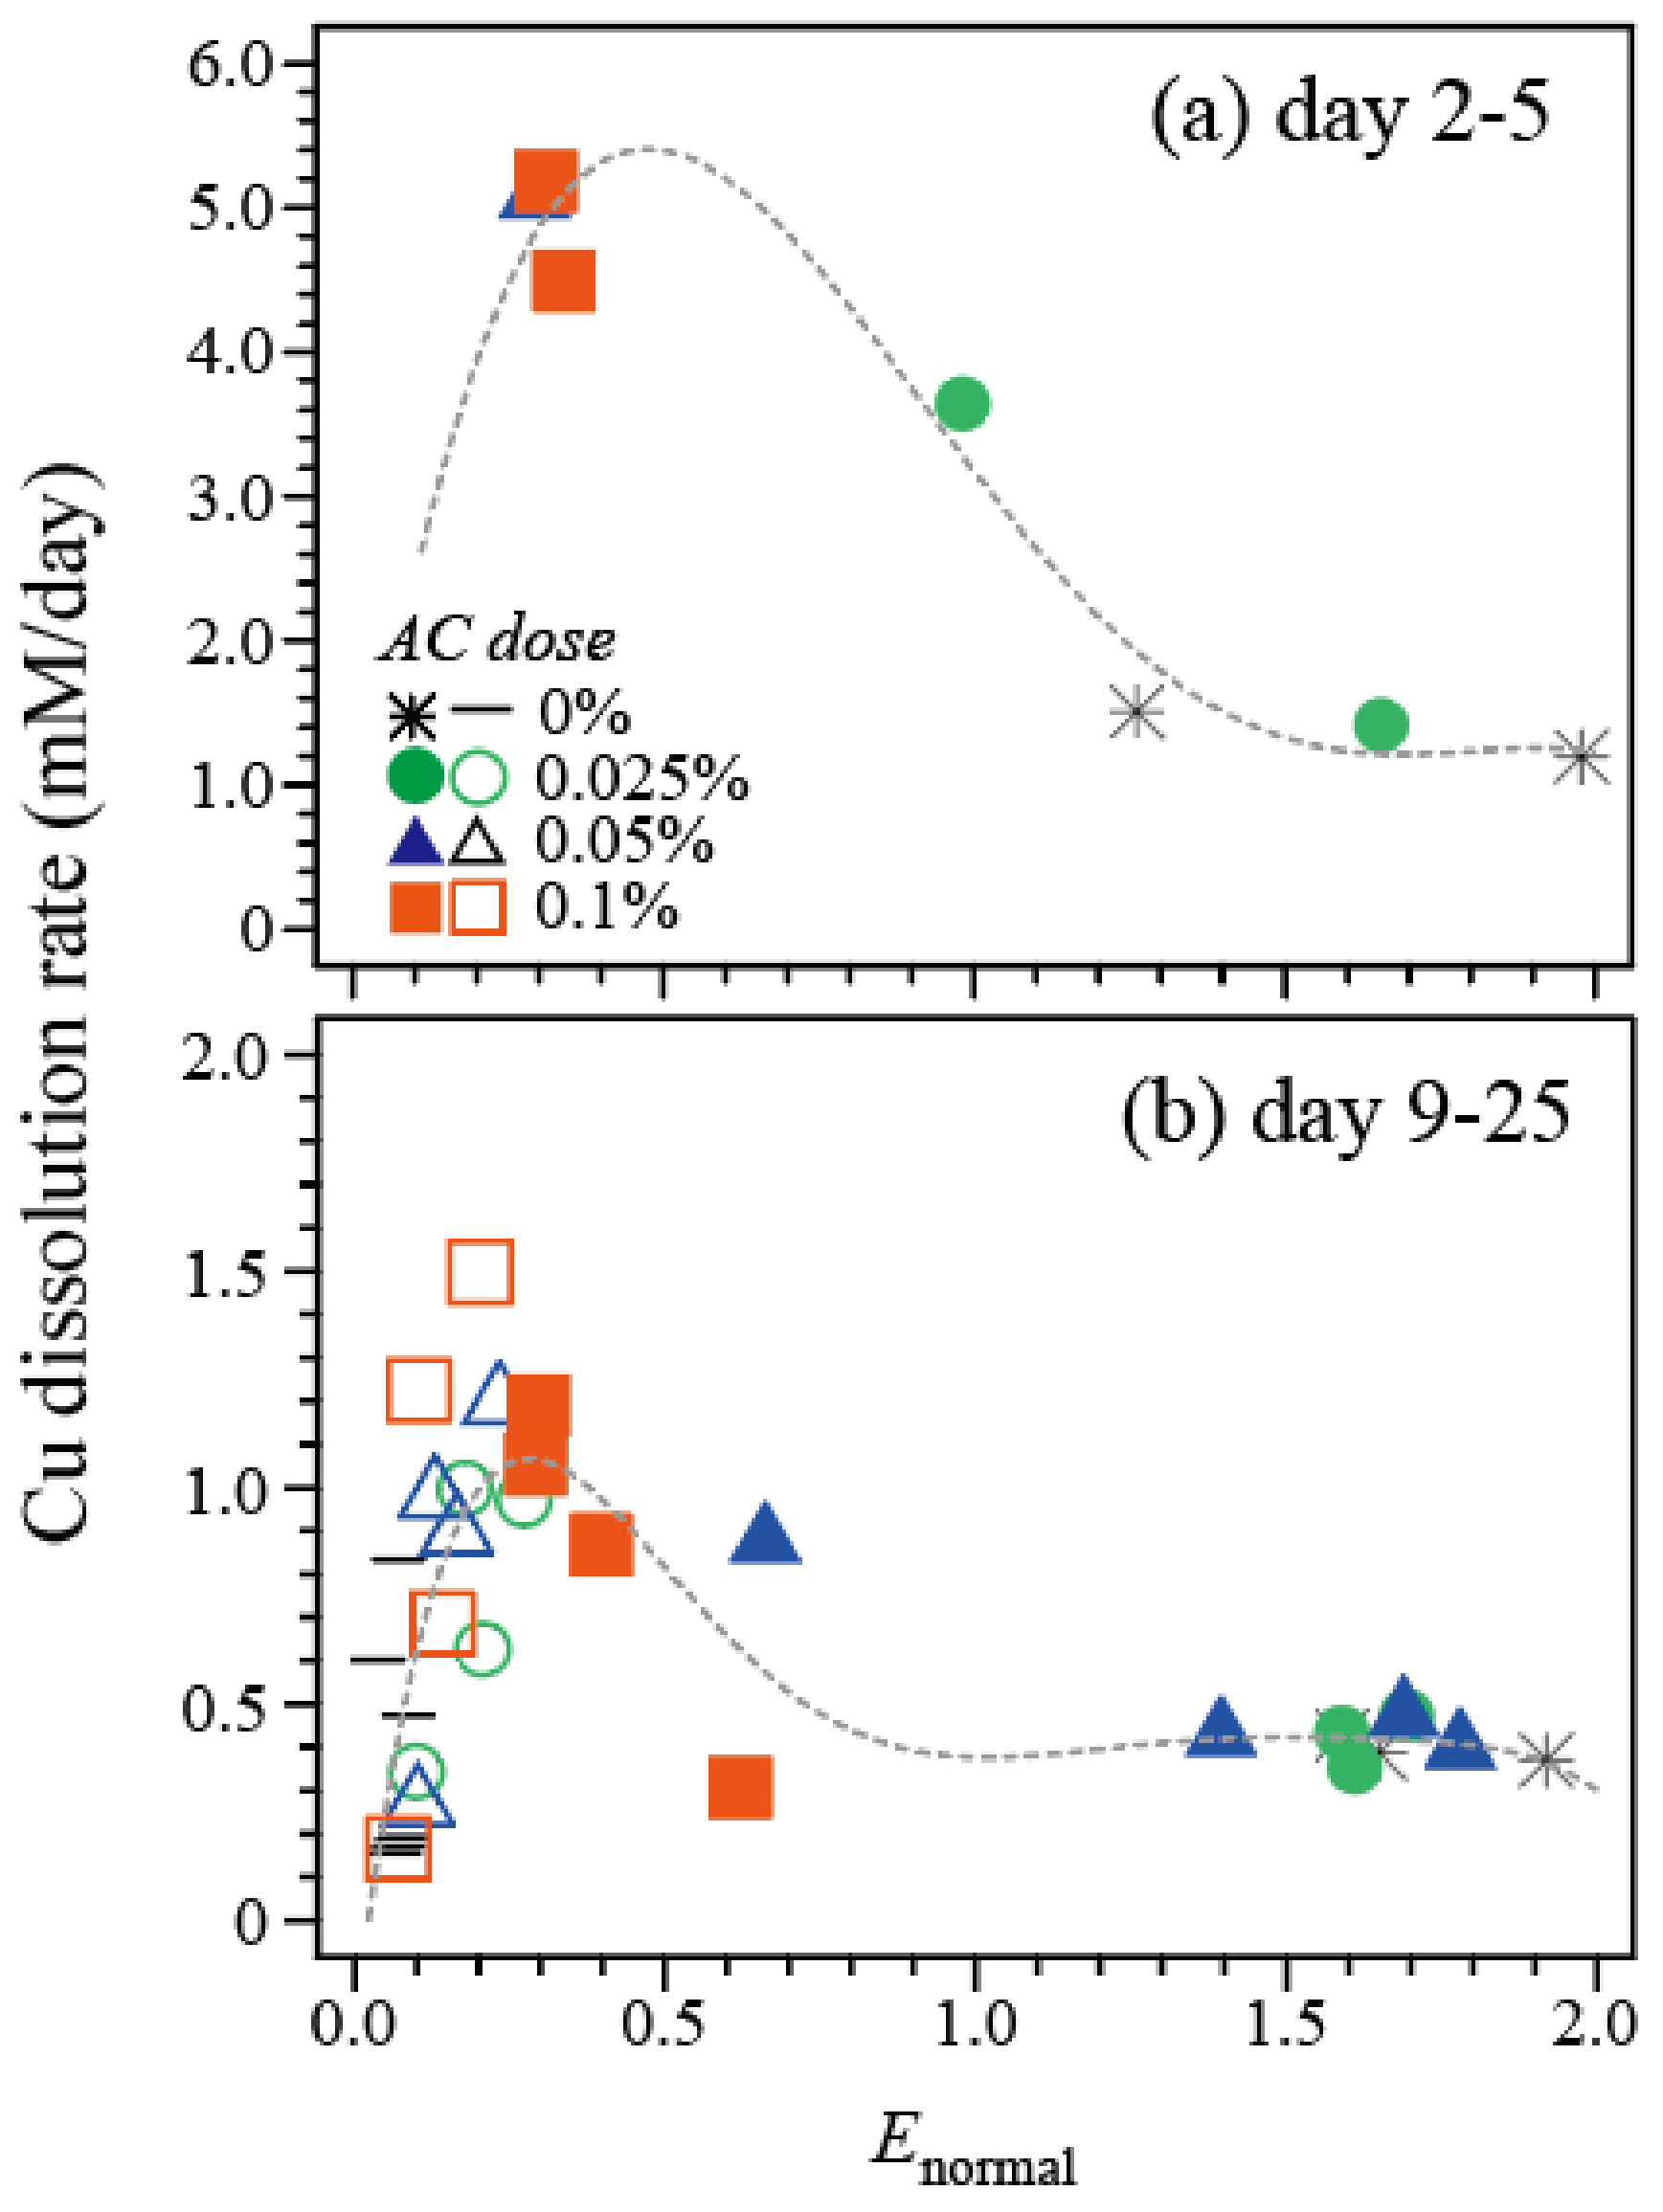
3.1.3. Correlation between the Cu Dissolution Rate and Enormal

The correlation between the Cu dissolution rate versus Enormal is summarized in Figure 4. The maximum Cu dissolution rate was achieved at around Enormal = 0.4–0.5 at the initial leaching phase (day 2–5; Figure 4a) and Enormal = ~0.3 at the mid–end leaching phase (day 9–25; Figure 4b). The higher optimum (0.4–0.5) shown at the former leaching phase (Figure 4a) might have resulted from the presence of a minor amount of Cu oxides/secondary Cu sulfides.
Compared to the optimum Enormal = 0.43 initially reported by Hiroyoshi et al., (using 30 °C) [10,11], the value was lower in this study (~0.3) and our previous study (~0.35) [18] (both using 45 °C). The difference was likely caused by the higher temperature and the activity of moderately thermophilic microorganisms used for the leaching test, which facilitated the kinetics of chalcocite-intermediate reactions at even lower Eh levels. Masaki et al. [18] found that the bioleaching efficiency of chalcopyrite can be effectively evaluated on the basis of Enormal, and that microbial Eh control is possible using a “weak” Fe2+-oxidizing microorganism [18]. However, natural ecosystems existing in the real bioleaching situations generally raise Eh when active, and artificially modifying such indigenous microbial consortium is unpractical. The findings of this study indicate that AC dosing is indeed a useful approach in modifying the Eh level in bioleaching cultures, where the Eh level otherwise exceeds the optimal range due to active microbial Fe2+-oxidation.

3.2. Activated Carbon (AC)-Assisted Bioleaching of Three Types of Chalcopyrite/Enargite-Bearing Complex Concentrates

The carbon-assisted bioleaching mechanism of chalcopyrite was described in Section 3.1 by using nearly pure chalcopyrite as a model mineral. In practice, however, multiple mineral types often co-exist in ore concentrates. Enargite (Cu3AsS4) is another refractory primary copper sulfide often concomitant with chalcopyrite.
Our previous AC-assisted bioleaching study on enargite concentrate [25] suggested that the overall Cu dissolution from enargite is governed mainly by the AC’s Eh-suppressing effect rather than the galvanic interaction under the Eh control at <700 mV. Together with the results obtained in Section 3.1, it can be said that the primary function of AC in the dissolution of both minerals is its Eh-controlling effect rather than its galvanic interaction with them. Nevertheless, the degree of Eh control needed for chalcopyrite and enargite is different. The concept of Enormal has been proposed for chalcopyrite [10,11], but not for enargite. Controlling at Enormal = 0.3–0.35 was shown to be optimal for the chalcopyrite bioleaching when using moderately thermophilic microorganisms at 45 °C (this study and [18]). On the other hand, while enargite mineral itself prefers higher Eh for dissolution, controlling the Eh < 700 mV was essential for enargite leaching so as to avoid its surface passivation, which immediately hinders its solubilization [25]. In this section, three types of chalcopyrite/enargite-bearing concentrates were chosen to see how the Eh control by AC affects the bioleaching efficiency of the concentrates of such complex mineralogy. The overall mineral compositions of the three concentrates are shown in Figure 1. All three concentrates contain several different Cu minerals, including both relatively amenable (geerite, chalcocite and bornite) and refractory Cu sulfides (chalcopyrite and enargite) as major components. Theoretical Cu atomic % deriving from each Cu mineral upon its complete dissolution was calculated and summarized in Figure 5. The chalcopyrite/enargite ratio (Cha/Ena) ranges in descending order, from 2.5 (wt)/5.4 (mol) (Eb concentrate), 0.6 (wt)/1.2 (mol) (D3 concentrate) to 0.3 (wt)/0.7 (mol) (Ea concentrate).
Activated carbon-assisted bioleaching profiles of the three concentrates are shown in Figure 6 and Figure S4. As was the case with the model chalcopyrite (Section 3.1), the constantly low Eh level (<600 mV) observed in all sterile control cultures (Figure 6b,b’,b”) indicates that microbial activity is an essential component in the AC-leaching system.

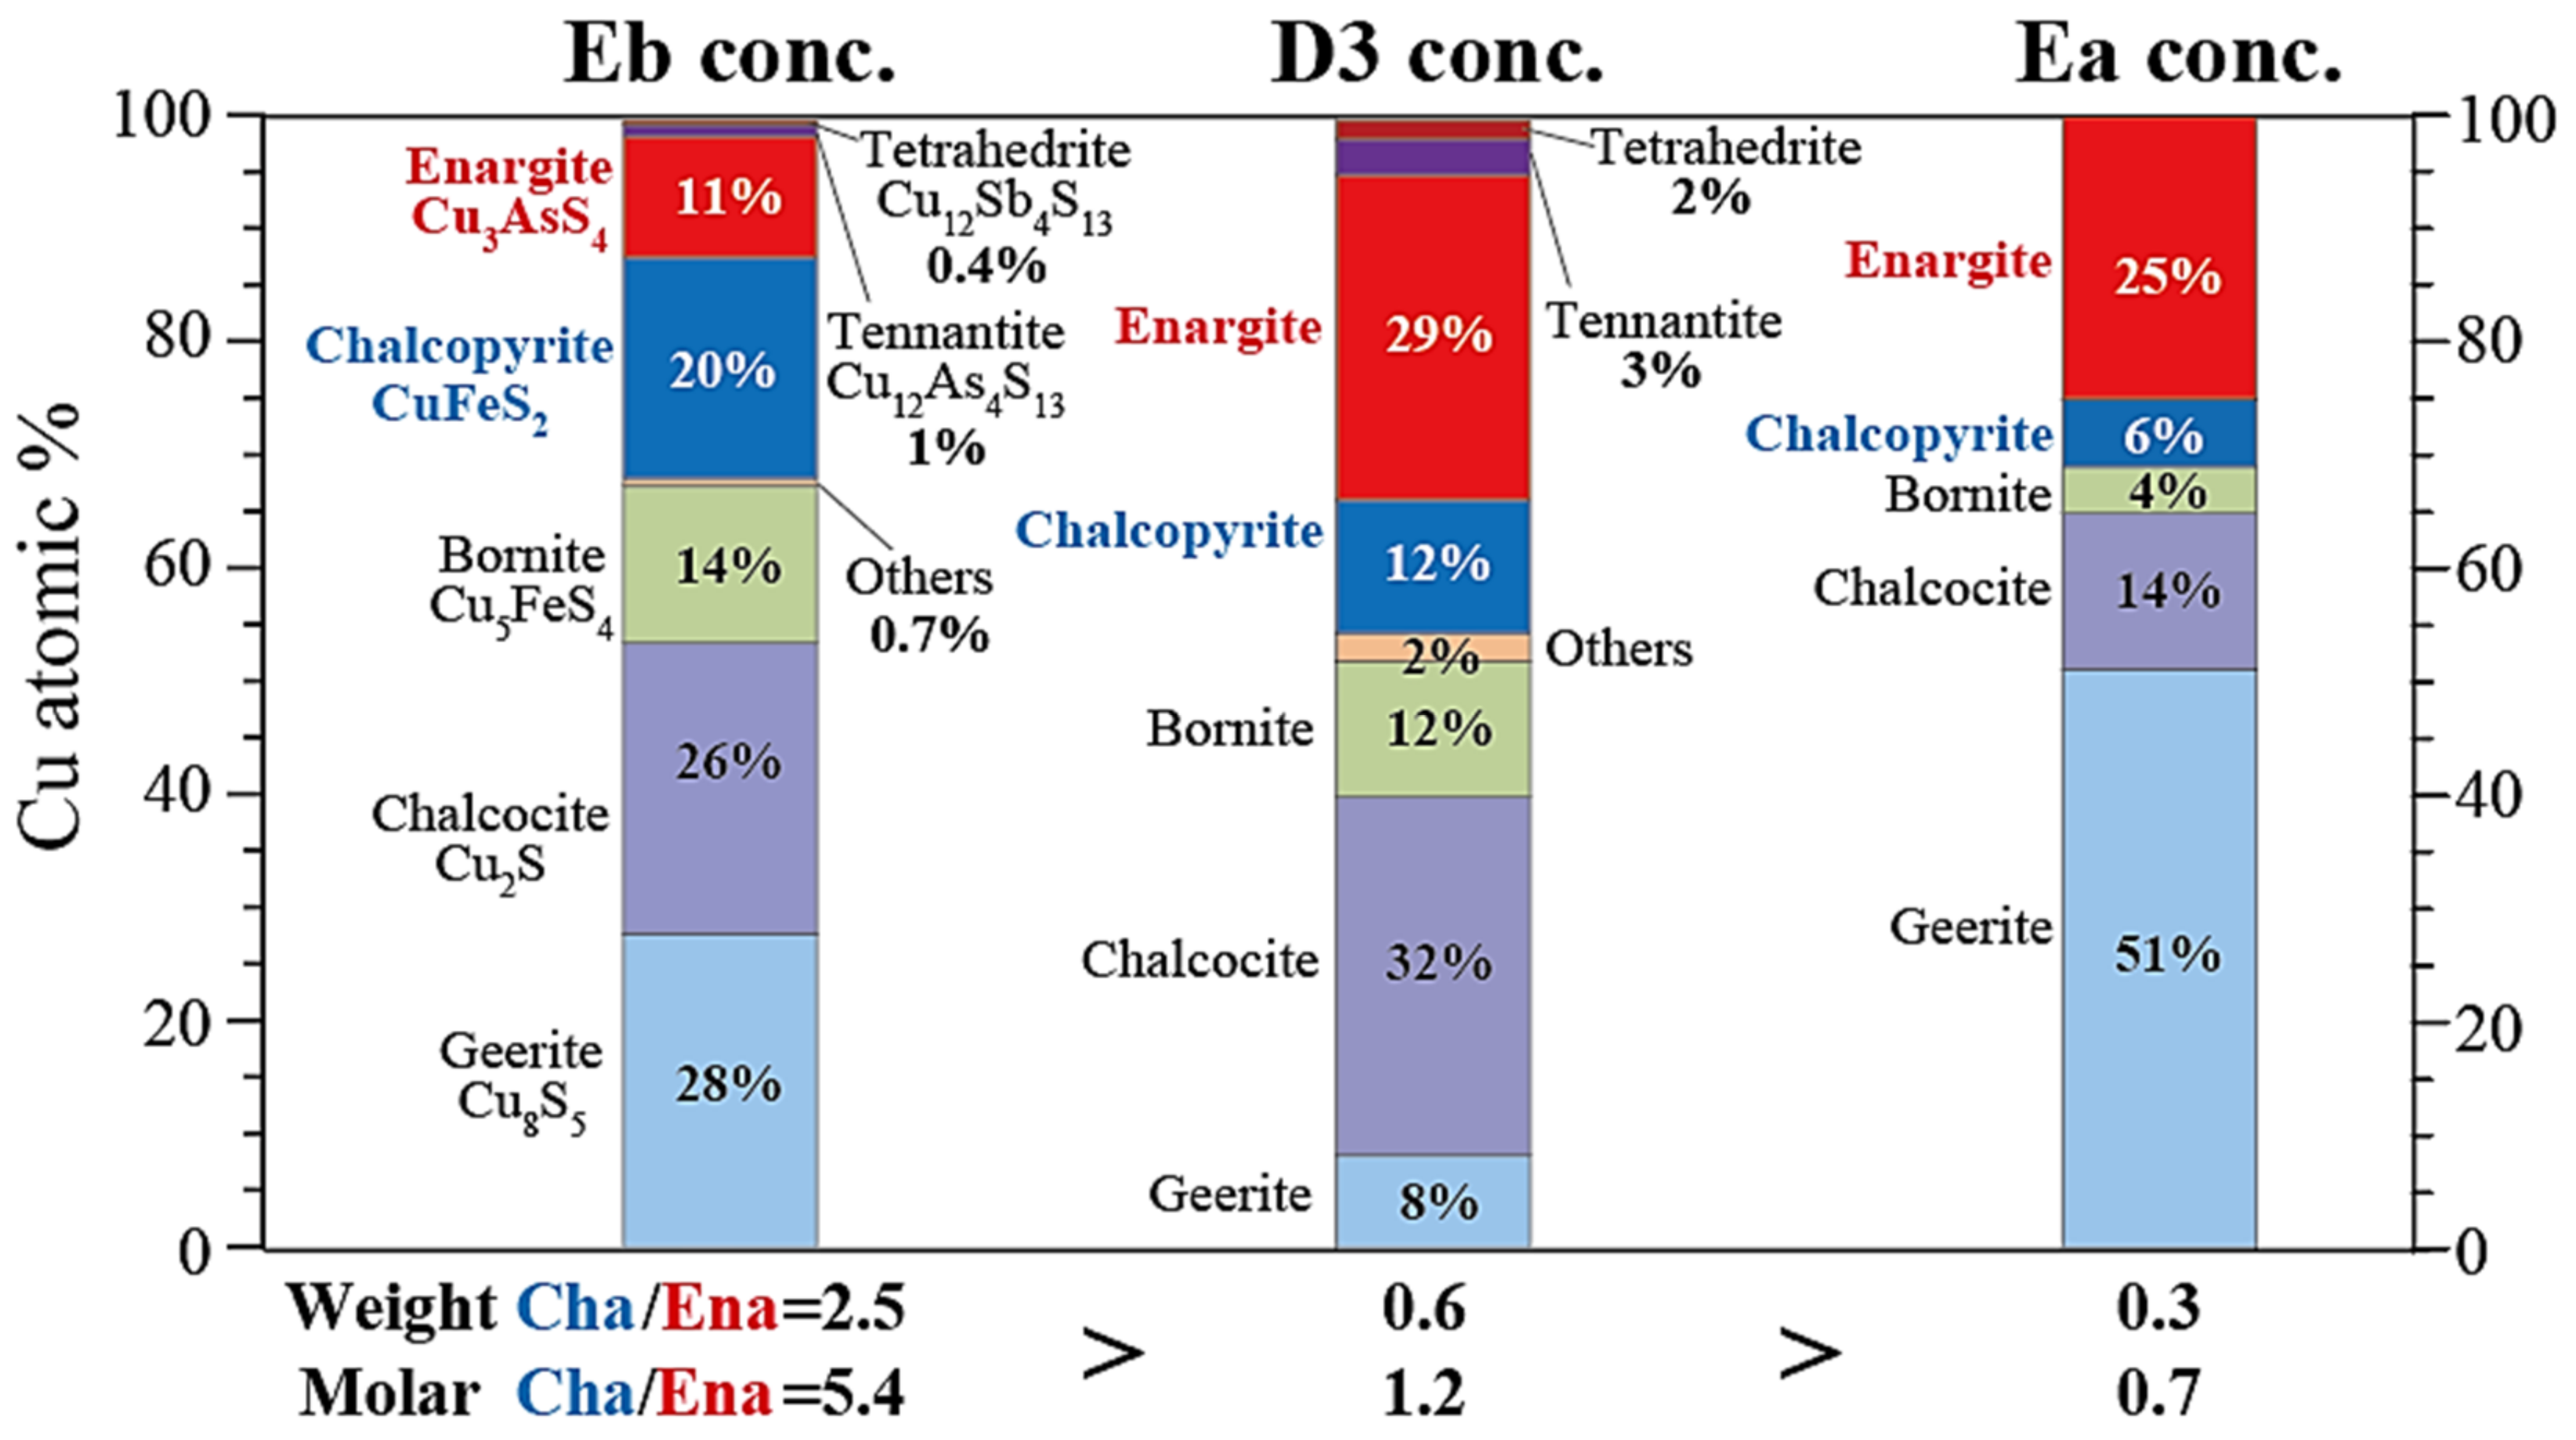
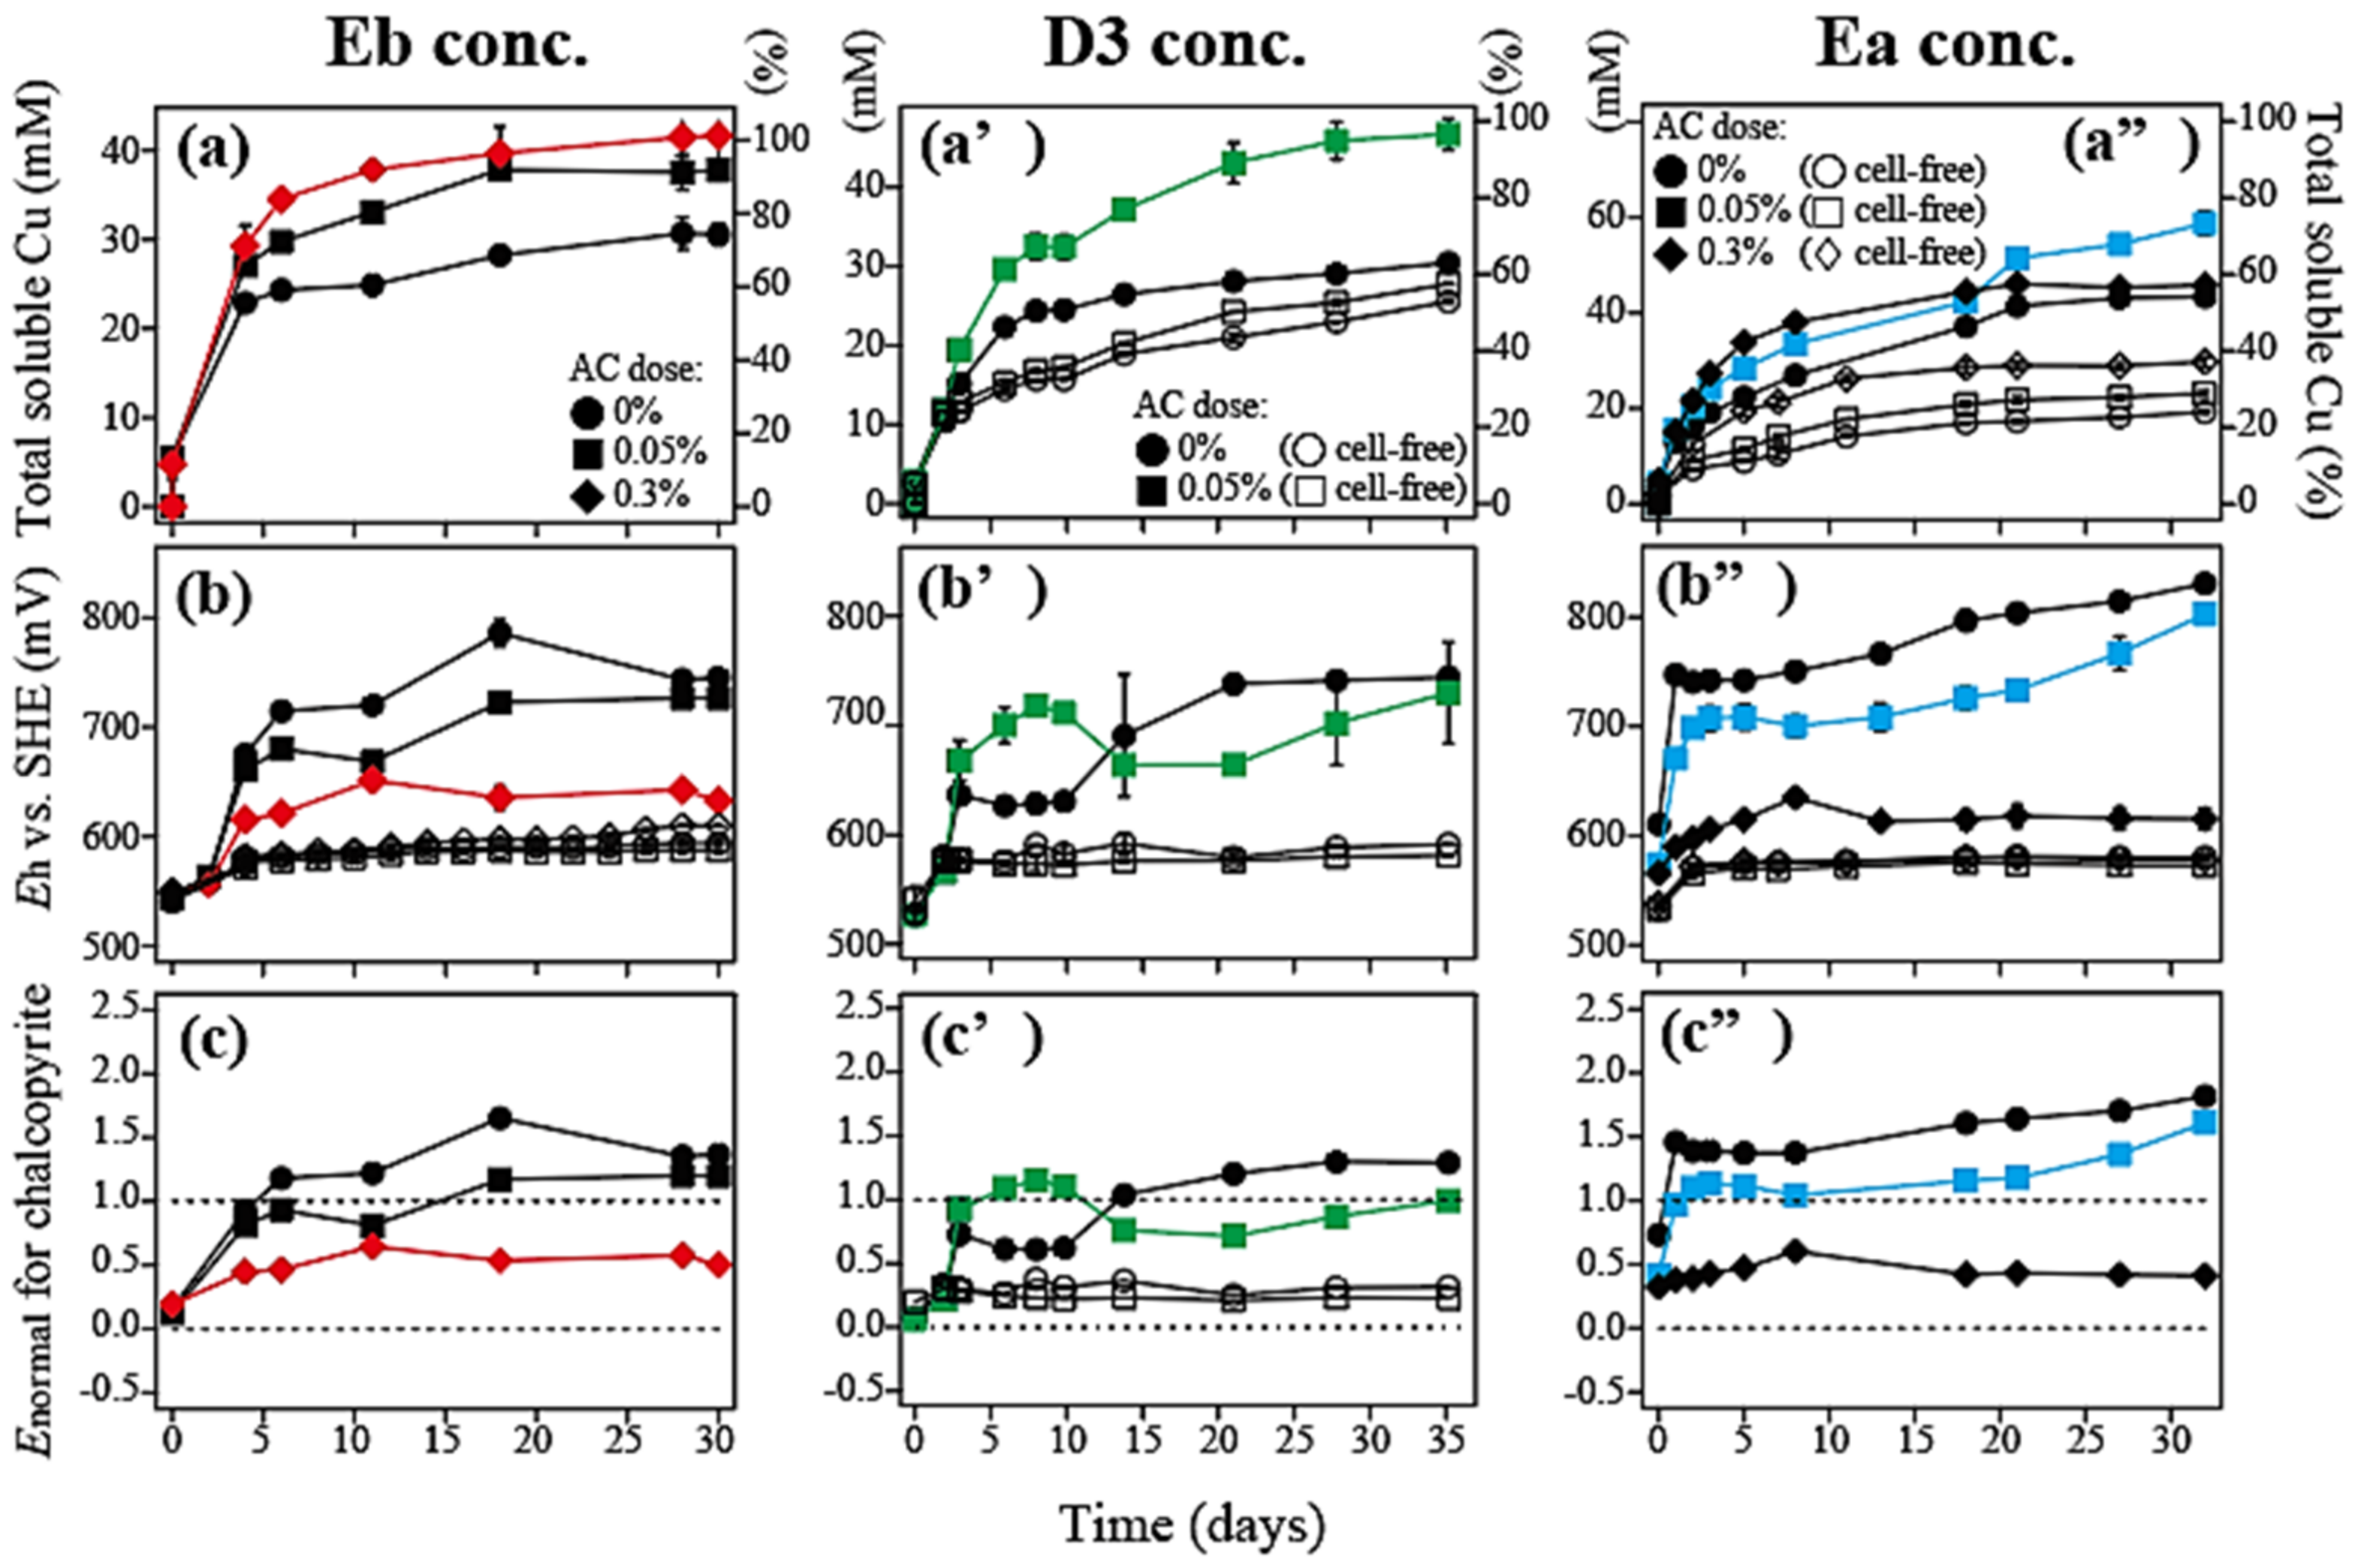
3.2.1. Eb Concentrate (Weight Cha/Ena Ratio = 2.5)

Eb concentrate had the highest weight Cha/Ena ratio of 2.5. In AC-free bioleaching cultures, Eh quickly rose to >700 mV (Figure 6b) to exceed Enormal (for chalcopyrite) of 1 (Figure 6c), resulting in the lowest final Cu dissolution of 74% (on day 30; Figure 6a). Most of the dissolved Cu in this AC-free bioleaching reaction was likely derived from relatively amenable minerals such as geerite, chalcocite and bornite (Figure 5). It can be expected that most of the amenable minerals were dissolved in all conditions at the initial bioleaching phase (by around day 4) since nearly 60% Cu was already dissolved by then (Figure 6a).
The AC dose clearly affected the Cu solubilization speed at the later bioleaching phase, where more refractory minerals were likely subjected to dissolution. The addition of 0.05% or 0.3% AC was effective in suppressing the Eh level to the average during day 4–30 of ~700 mV or ~630 mV, respectively (Figure 6b). This Eh control increasingly facilitated bioleaching of more refractory Cu sulfides (chalcopyrite and enargite) to achieve the final Cu dissolution of 92% and 100%, respectively (on day 30; Figure 6a). Under the best condition using 0.3% AC, Enormal (for chalcopyrite) stayed at around 0.5 (Figure 6c), slightly higher than its optimal (0.3–0.35; Section 3.1; [18]). Since chalcopyrite is more dominant than enargite in the Eb concentrate, adjusting the Eh level within the “active region” for chalcopyrite (0 ≤ Enormal ≤ 1) was effective in completing the leaching reaction.

3.2.2. D3 Concentrate (Weight Cha/Ena Ratio = 0.6)

In the case of D3 concentrate with the weight Cha/Ena ratio of 0.6, about half of Cu in the leachate is estimated to derive from amenable Cu minerals (Figure 5). It is likely that these amenable Cu sulfides were preferably dissolved in all conditions, including cell-free controls (Figure 6a’). In AC-free bioleaching culture, Eh initially leveled off at ~630 mV (day 3–10) and then further increased to >700 mV, where Cu dissolution plateaued at just over 60% (Figure 6a’). At 0.05% AC, on the other hand, Eh initially bumped (day 3–10) but later pulled down to 660 mV before re-increasing towards the end (>700 mV) (Figure 6b’): Despite such Eh fluctuation, this AC-mediated Eh control (at an average during day 3–35 of ~690 mV) facilitated Cu dissolution to near completion on day 35 (Figure 6a’). Such bumpy Eh behavior is often observed when the mineral concentrate carries some inhibitory substance to microbial cells (e.g., toxic metals or flotation chemicals; Okibe, unpublished data). In fact, the cell growth was found to be weaker in this concentrate, compared to that in the other two concentrates (Figure S4d’). The use of higher AC doses than 0.05% did not further improve the Cu dissolution behavior (Okibe, unpublished data). The Enormal (for chalcopyrite) was shown to fluctuate around 0.8–1.1, generally higher than that observed for Eb concentrate.

3.2.3. Ea Concentrate (Weight Cha/Ena Ratio = 0.3)

In the case of Ea concentrate with the lowest weight Cha/Ena ratio of 0.3, about 70% of total Cu are expected to derive from amenable Cu minerals (Figure 5). However, the overall Cu dissolution speed was slower with this concentrate than that of the other two (Figure 6a”). This could be partly due to: (i) the lack of additional sulfuric acid dosing as a manual pH re-adjustment at the early bioleaching phase (while the other two concentrates received a pH re-adjustment); (ii) the higher quantity of Cu ions dissolved in the leachate, which tends to slow down further Cu dissolution according to the chemical equilibrium theory. In the case of AC-free bioleaching of Ea concentrate, Eh immediately rose to ~750 mV and further increased to >800 mV towards the end (Figure 6b”), resulting in the final Cu dissolution of 54% (Figure 6a”). The addition of 0.05% or 0.3% AC pulled down the Eh level to varying extents (at an average during day 2–32 of ~720 mV or ~610 mV, respectively). Suppressing the Enormal down to ~0.5 (“active region” for chalcopyrite) by the addition of 0.3% AC was most effective for Cu dissolution only until the halfway point (Figure 6a”). Eventually, greater Cu dissolution was seen at 0.05% AC under lesser Eh suppression (Enormal for chalcopyrite fluctuated at 1–1.5; Figure 6c”). Since enargite dominated over chalcopyrite in this concentrate, the overall Cu dissolution was found to be greater at the Eh range set more preferable for enargite than for chalcopyrite. At a higher AC dose (0.3%), the planktonic cell counts decreased partly due to cells’ attachment onto the mineral surface or some cell growth inhibition (Figure S4d”).
As a general trend with all three concentrates, controlling the Eh level by AC facilitated the Cu dissolution while suppressing the Fe dissolution (compared to the AC-free controls; Figure S4b,b’,b”). The trend of As dissolution was correlated with that of Cu, and roughly 60% of As was leached (Figure S4a,a’,a”) while the rest was expected to form amorphous Fe-As precipitates [26,27]. The sustainable Eh-controlling effect was reported to be critical not only to enable longer Cu dissolution from enargite but also for the stabilization of Fe-As precipitates [25,27].
Based on the overall results with three chalcopyrite/enargite-bearing complex concentrates, a trend was found that the optimal Eh level for a maximum Cu solubilization increased as the ratio of Cha/Ena in the concentrate decreased: Eb concentrate (Cha/Ena = 2.5, ~630 mV); D3 concentrate (Cha/Ena = 0.6, ~690 mV); Ea concentrate (Cha/Ena = 0.3, ~720 mV). When chalcopyrite dominates over enargite, the optimal Eh was found to satisfy 0 ≤ Enormal ≤ 1 (“active region” for chalcopyrite [10,11]). As enargite becomes more abundant than chalcopyrite, the optimal Eh for the greatest Cu dissolution was shifted to higher values, where Enormal exceeds 1 to head into the “passive region” for chalcopyrite [10,11] but still controlled ideally at around 700 mV for maximized Cu solubilization [25]. It was shown possible to modify the Eh level to varying extents to make it optimal for the concentrate of different mineralogy.

4. Conclusions

  • The carbon catalyst (AC and CF) effectively controlled the Eh level in bioleaching liquors, which would otherwise exceed its optimal range (0 ≤ Enormal ≤ 1) due to regeneration of Fe3+ by microbial activity.
  • Enormal of ~0.3 was shown to maximize the AC-assisted bioleaching of the model chalcopyrite mineral.
  • When three types of chalcopyrite/enargite-bearing complex concentrates were tested, the optimal Eh level for a maximum Cu solubilization increased in response to the decreasing chalcopyrite/enargite ratio in the concentrate.
  • Modification of the Eh level by adjusting AC doses was useful to maximize Cu solubilization from the concentrate of complex mineralogy.

Supplementary Materials

The following are available online at https://www.mdpi.com/article/10.3390/min11040432/s1, Figure S1: Carbon Fiber (CF)-assisted chalcopyrite leaching with (af) or without (a’f’) bioleaching microorganisms. Changes in the total soluble Cu concentration (a,a’), total soluble Fe concentration (b,b’), Eh (c,c’), Enormal (d,d’), pH (e,e’) and planktonic cell density (f,f’) at different CF doses are shown: 0% (*, -), 0.5% (●, ○), 1.0% (▲, △) and 2.0% (■, □). The grey shadow in (d) and (d’) indicates the “active region” for chalcopyrite dissolution [10,11]. The error bars depicting averages are not visible in some cases as they are smaller than the data point symbols. Figure S2. X-ray diffraction patterns of chalcopyrite before bioleaching (a) and after bioleaching with 2.0% CF (b) or with 0.1% AC (c). C: chalcopyrite (CuFeS2; PDF No. 01-075-6866), P: pyrite (FeS2; PDF No. 00-042-1340), J: jarosite (K(Fe3(SO4)2(OH)6); PDF No. 01-076-0629). SEM images of the surface of AC and CF are also presented. Figure S3. The mineral electrode potential of chalcopyrite (Cp) (*) and carbon fiber (CF) (▽) as the function of Eh: ⊿ indicates the amount of galvanic electromotive force created between chalcopyrite and CF. The galvanic current created between chalcopyrite and CF (▼) is also shown as the function of Eh. The grey zone depicts the Eh range wherein galvanic interaction between chalcopyrite and CF is considered minor. Figure S4. Activated Carbon (AC)-assisted bioleaching of chalcopyrite/enargite-bearing concentrates, Eb (ad), D3 (a’d’) and Ea (a”d”). Changes in the total soluble As concentration (a,a’,a”), total soluble Fe concentration (b,b’,b”), pH (c,c’,c”) and planktonic cell density (d,d’,d”) at different AC doses are shown: 0% (●, ○), 0.05% (■, □) and 0.3% (◆, ◇). The error bars depicting averages are not visible in some cases as they are smaller than the data point symbols.

Author Contributions

Conceptualization, N.O.; methodology, N.O.; validation, N.O. and K.O.; formal analysis, N.O. and K.O.; investigation, K.T., K.H. and K.O.; resources, N.O.; data curation, N.O. and K.O.; writing—original draft preparation, K.T. and K.O.; writing—review and editing, N.O.; visualization, N.O. and K.O.; supervision, N.O.; project administration, N.O., T.H., Y.A. and S.K.; funding acquisition, N.O., T.H., Y.A. and S.K. All authors have read and agreed to the published version of the manuscript.

Funding

This research was partly funded by the Japan Oil, Gas and Metals National Corporation (JOGMEC).

Institutional Review Board Statement

Not applicable.

Data Availability Statement

Not applicable.

Acknowledgments

Chalcopyrite was kindly provided by JX Nippon Mining & Metals. Ea concentrate sample was kindly provided by Gde Pandhe Wisnu Suyantara (Kyushu University). We are thankful to Hajime Miki (Kyushu University) for valuable advice for the electrochemical analysis.

Conflicts of Interest

The authors declare no conflict of interest. The funders had no role in the design of the study; in the collection, analyses, or interpretation of data; in the writing of the manuscript, or in the decision to publish the results.

References

  1. Sillitoe, R.H. Porphyry copper systems. Econ. Geol. 2010, 105, 3–41. [Google Scholar] [CrossRef] [Green Version]
  2. Li, Y.; Kawashima, N.; Li, J.; Chandra, A.; Gerson, A.R. A review of the structure, and fundamental mechanisms and kinetics of the leaching of chalcopyrite. Adv. Colloid Interface Sci. 2013, 197, 1–32. [Google Scholar] [CrossRef] [PubMed]
  3. Stott, M.; Watling, H.; Franzmann, P.; Sutton, D. The role of iron-hydroxy precipitates in the passivation of chalcopyrite during bioleaching. Miner. Eng. 2000, 13, 1117–1127. [Google Scholar] [CrossRef]
  4. Córdoba, E.; Muñoz, J.; Blázquez, M.; González, F.; Ballester, A. Passivation of chalcopyrite during its chemical leaching with ferric ion at 68 °C. Miner. Eng. 2009, 22, 229–235. [Google Scholar] [CrossRef]
  5. Viramontes-Gamboa, G.; Peña-Gomar, M.M.; Dixon, D.G. Electrochemical hysteresis and bistability in chalcopyrite passivation. Hydrometallurgy 2010, 105, 140–147. [Google Scholar] [CrossRef]
  6. Parker, A.; Paul, R.; Power, G. Electrochemistry of the oxidative leaching of copper from chalcopyrite. J. Electroanal. Chem. Interfacial Electrochem. 1981, 118, 305–316. [Google Scholar] [CrossRef]
  7. Antonijević, M.; Janković, Z.; Dimitrijević, M. Investigation of the kinetics of chalcopyrite oxidation by potassium dichromate. Hydrometallurgy 1994, 35, 187–201. [Google Scholar] [CrossRef]
  8. Córdoba, E.; Muñoz, J.; Blázquez, M.; González, F.; Ballester, A. Leaching of chalcopyrite with ferric ion. Part II: Effect of redox potential. Hydrometallurgy 2008, 93, 88–96. [Google Scholar] [CrossRef]
  9. Viramontes-Gamboa, G.; Rivera-Vasquez, B.F.; Dixon, D.G. The active-passive behavior of chalcopyrite: Comparative study between electrochemical and leaching responses. J. Electrochem. Soc. 2007, 154, C299. [Google Scholar] [CrossRef]
  10. Hiroyoshi, N.; Tsunekawa, M.; Okamoto, H.; Nakayama, R.; Kuroiwa, S. Improved chalcopyrite leaching through optimization of redox potential. Can. Metall. Q. 2008, 47, 253–258. [Google Scholar] [CrossRef]
  11. Hiroyoshi, N.; Kitagawa, H.; Tsunekawa, M. Effect of solution composition on the optimum redox potential for chalcopyrite leaching in sulfuric acid solutions. Hydrometallurgy 2008, 91, 144–149. [Google Scholar] [CrossRef]
  12. Hiroyoshi, N.; Miki, H.; Hirajima, T.; Tsunekawa, M. A model for ferrous-promoted chalcopyrite leaching. Hydrometallurgy 2000, 57, 31–38. [Google Scholar] [CrossRef]
  13. Okamoto, H.; Nakayama, R.; Hiroyoshi, N.; Tsunekawa, M. Redox potential dependence and optimum potential of chalcopyrite leaching in sulfuric acid solutions. J. MMIJ 2004, 120, 592–599. (In Japanese) [Google Scholar] [CrossRef] [Green Version]
  14. Okamoto, H.; Nakayama, R.; Kuroiwa, S.; Hiroyoshi, N.; Tsunekawa, M. Normalized redox potential used to assess chalcopyrite column leaching. J. MMIJ 2005, 121, 246–254. (In Japanese) [Google Scholar] [CrossRef] [Green Version]
  15. Gericke, M.; Govender, Y.; Pinches, A. Tank bioleaching of low-grade chalcopyrite concentrates using redox control. Hydrometallurgy 2010, 104, 414–419. [Google Scholar] [CrossRef]
  16. Ahmadi, A.; Schaffie, M.; Manafi, Z.; Ranjbar, M. Electrochemical bioleaching of high grade chalcopyrite flotation concentrates in a stirred bioreactor. Hydrometallurgy 2010, 104, 99–105. [Google Scholar] [CrossRef]
  17. Ahmadi, A.; Schaffie, M.; Petersen, J.; Schippers, A.; Ranjbar, M. Conventional and electrochemical bioleaching of chalcopyrite concentrates by moderately thermophilic bacteria at high pulp density. Hydrometallurgy 2011, 106, 84–92. [Google Scholar] [CrossRef]
  18. Masaki, Y.; Hirajima, T.; Sasaki, K.; Miki, H.; Okibe, N. Microbiological redox potential control to improve the efficiency of chalcopyrite bioleaching. Geomicrobiol. J. 2018, 35, 648–656. [Google Scholar] [CrossRef]
  19. Nakazawa, H.; Fujisawa, H.; Sato, H. Effect of activated carbon on the bioleaching of chalcopyrite concentrate. Int. J. Miner. Process. 1998, 55, 87–94. [Google Scholar] [CrossRef]
  20. Zhang, W.-M.; Gu, S.-F. Catalytic effect of activated carbon on bioleaching of low-grade primary copper sulfide ores. Trans. Nonferr. Met. Soc. China 2007, 17, 1123–1127. [Google Scholar] [CrossRef]
  21. Liang, C.-L.; Xia, J.-L.; Zhao, X.-J.; Yang, Y.; Gong, S.-Q.; Nie, Z.-Y.; Ma, C.-Y.; Zheng, L.; Zhao, Y.-D.; Qiu, G.-Z. Effect of activated carbon on chalcopyrite bioleaching with extreme thermophile Acidianus manzaensis. Hydrometallurgy 2010, 105, 179–185. [Google Scholar] [CrossRef]
  22. Ma, Y.-L.; Liu, H.-C.; Xia, J.-L.; Nie, Z.-Y.; Zhu, H.-R.; Zhao, Y.-D.; Zheng, L.; Hong, C.-H.; Wen, W. Relatedness between catalytic effect of activated carbon and passivation phenomenon during chalcopyrite bioleaching by mixed thermophilic Archaea culture at 65 °C. Trans. Nonferr. Met. Soc. China 2017, 27, 1374–1384. [Google Scholar] [CrossRef]
  23. Hao, X.; Liu, X.; Zhu, P.; Chen, A.; Liu, H.; Yin, H.; Qiu, G.; Liang, Y. Carbon material with high specific surface area improves complex copper ores’ bioleaching efficiency by mixed moderate thermophiles. Minerals 2018, 8, 301. [Google Scholar] [CrossRef] [Green Version]
  24. Lattanzi, P.; Da Pelo, S.; Musu, E.; Atzei, D.; Elsener, B.; Fantauzzi, M.; Rossi, A. Enargite oxidation: A review. Earth-Sci. Rev. 2008, 86, 62–88. [Google Scholar] [CrossRef]
  25. Oyama, K.; Shimada, K.; Ishibashi, J.-I.; Sasaki, K.; Miki, H.; Okibe, N. Catalytic mechanism of activated carbon-assisted bioleaching of enargite concentrate. Hydrometallurgy 2020, 196, 105417. [Google Scholar] [CrossRef]
  26. Tanaka, M.; Yamaji, Y.; Fukano, Y.; Shimada, K.; Ishibashi, J.-I.; Hirajima, T.; Sasaki, K.; Sawada, M.; Okibe, N. Biooxidation of gold-, silver, and antimony-bearing highly refractory polymetallic sulfide concentrates, and its comparison with abiotic pretreatment techniques. Geomicrobiol. J. 2015, 32, 538–548. [Google Scholar] [CrossRef]
  27. Oyama, K.; Shimada, K.; Ishibashi, J.-I.; Miki, H.; Okibe, N. Silver-catalyzed bioleaching of enargite concentrate using moderately thermophilic microorganisms. Hydrometallurgy 2018, 177, 197–204. [Google Scholar] [CrossRef]
Figure 1. The mineral composition (wt%) of three chalcopyrite/enargite-bearing complex concentrates: D3, Eb and Ea.
Minerals 11 00432 g001
Figure 2. Activated Carbon (AC)-assisted chalcopyrite leaching with (af) or without (a’f’) bioleaching microorganisms. Changes in the total soluble Cu concentration (a,a’), total soluble Fe concentration (b,b’), Eh (c,c’), Enormal (d,d’), pH (e,e’) and planktonic cell density (f,f’) at different AC doses are shown: 0% (*, -), 0.025% (●, ○), 0.05% (▲, △) and 0.1% (■, □). The grey shadow in (d) and (d’) indicate the “active region” for chalcopyrite dissolution [10]. The error bars depicting averages are not visible in some cases as they are smaller than the data point symbols.
Minerals 11 00432 g002
Figure 3. The mineral electrode potential of chalcopyrite (Cp) (*) and activated carbon (AC) (△) as the function of Eh: ⊿ indicates the amount of galvanic electromotive force created between chalcopyrite and AC. The galvanic current created between chalcopyrite and AC is also shown as the function of Eh (▲). The grey zone depicts the Eh range wherein galvanic interaction between chalcopyrite and AC is considered minor (0.55 ≤ Eh ≤ 0.68 V).
Minerals 11 00432 g003
Figure 4. Relationship between the Cu dissolution rate and Enormal in the AC-assisted chalcopyrite bioleaching cultures (solid symbols) or in sterile control cultures (open symbols) at different AC doses: 0% (*, -), 0.025% (●, 〇), 0.05% (▲, △) or 0.1% (■, □). Data from Figure 2 were used for the calculation. (a) The initial leaching phase on day 2–5. (b) The mid to final leaching phase on day 9–25.
Minerals 11 00432 g004
Figure 5. Comparison of three chalcopyrite/enargite-bearing concentrates, Eb, D3 and Ea, based on the theoretical Cu atomic % deriving from each Cu mineral type upon its complete dissolution. Their overall mineral compositions (wt%) are shown in Figure 1. The weight and molar ratios of chalcopyrite to enargite (Cha/Ena) are also shown.
Minerals 11 00432 g005
Figure 6. Activated carbon (AC)-assisted bioleaching of chalcopyrite/enargite-bearing concentrates, Eb (ac), D3 (a’c’) and Ea (a”c”). Changes in the total soluble Cu concentration (a,a’,a”), Eh (b,b’,b”) and Enormal (c,f,i) (c,c’,c”) at different AC doses are shown: 0% (●, ○), 0.05% (■, □) and 0.3% (◆, ◇). The dotted lines in (c,c’,c”) indicate the “active region” for chalcopyrite dissolution [10]. The error bars depicting averages are not visible in some cases as they are smaller than the data point symbols. The data with the greatest Cu dissolution are colored in red (Eb concentrate), green (D3 concentrate) or blue (Ea concentrate).
Minerals 11 00432 g006
Publisher’s Note: MDPI stays neutral with regard to jurisdictional claims in published maps and institutional affiliations.

