
The Temporal Variation of Magma Plumbing System of the Kattadake Pyroclastics in the Zao Volcano, Northeastern Japan

Abstract
:1. Introduction
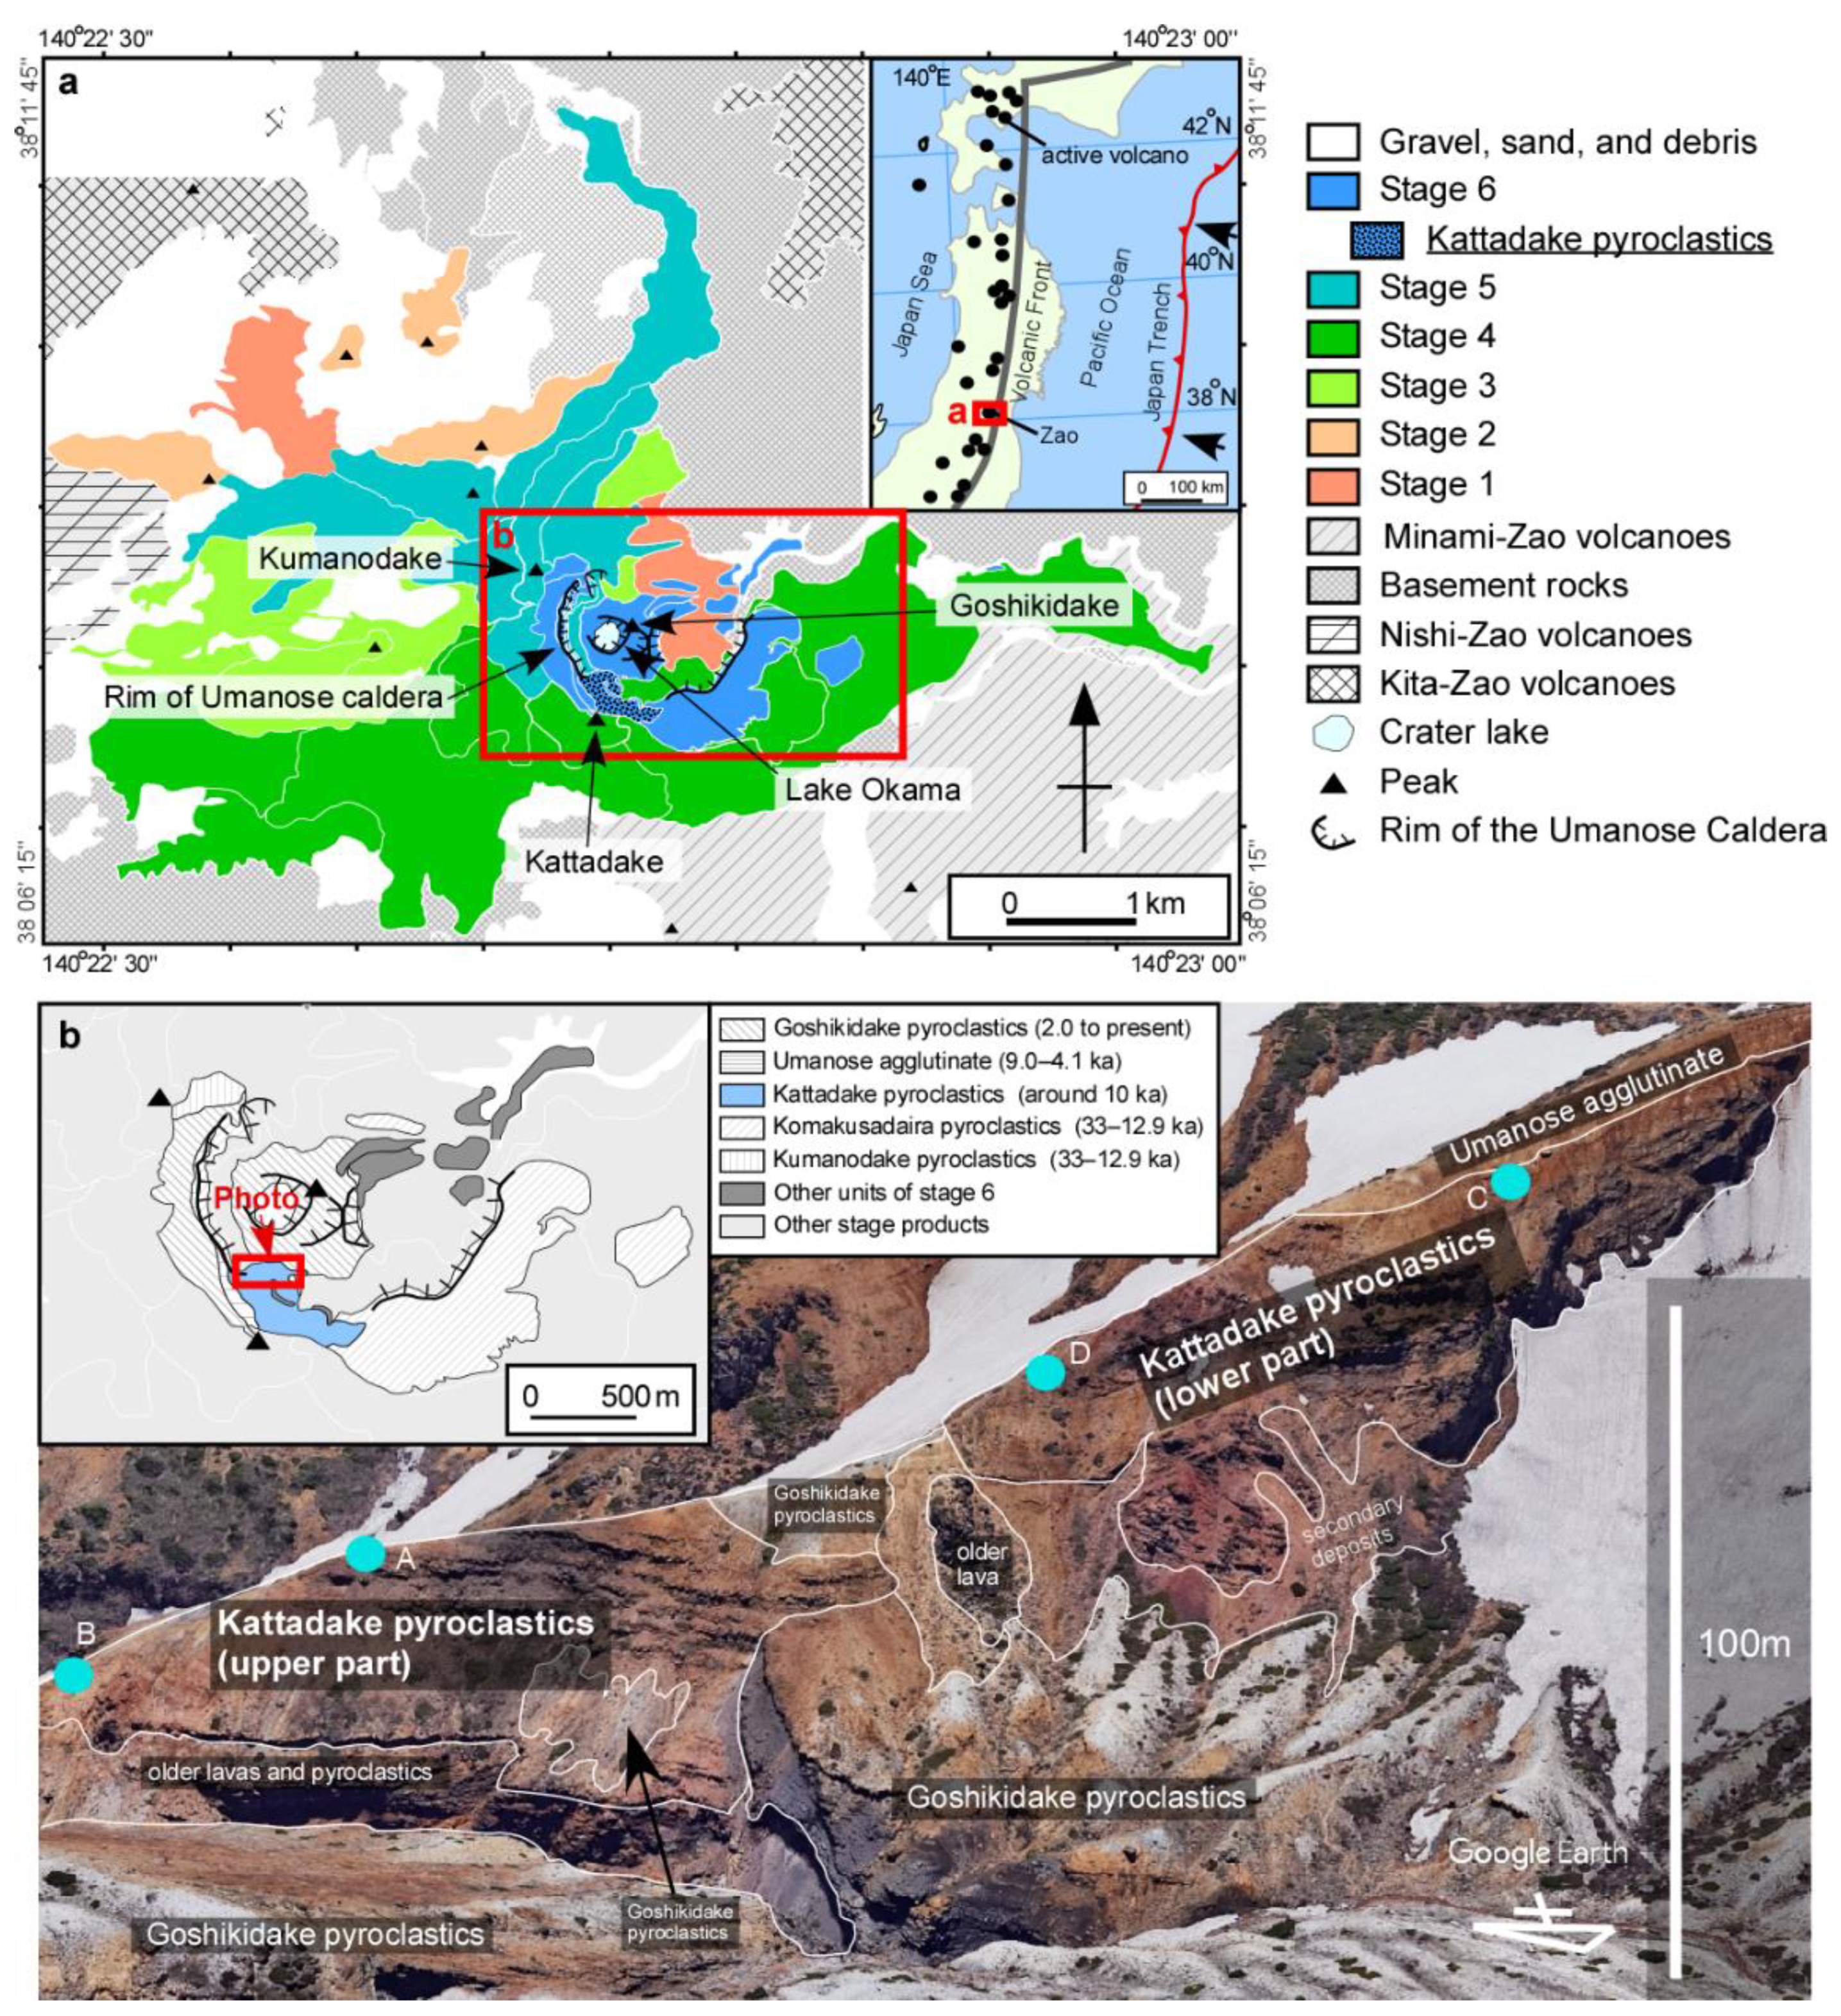
2. Geologic Setting
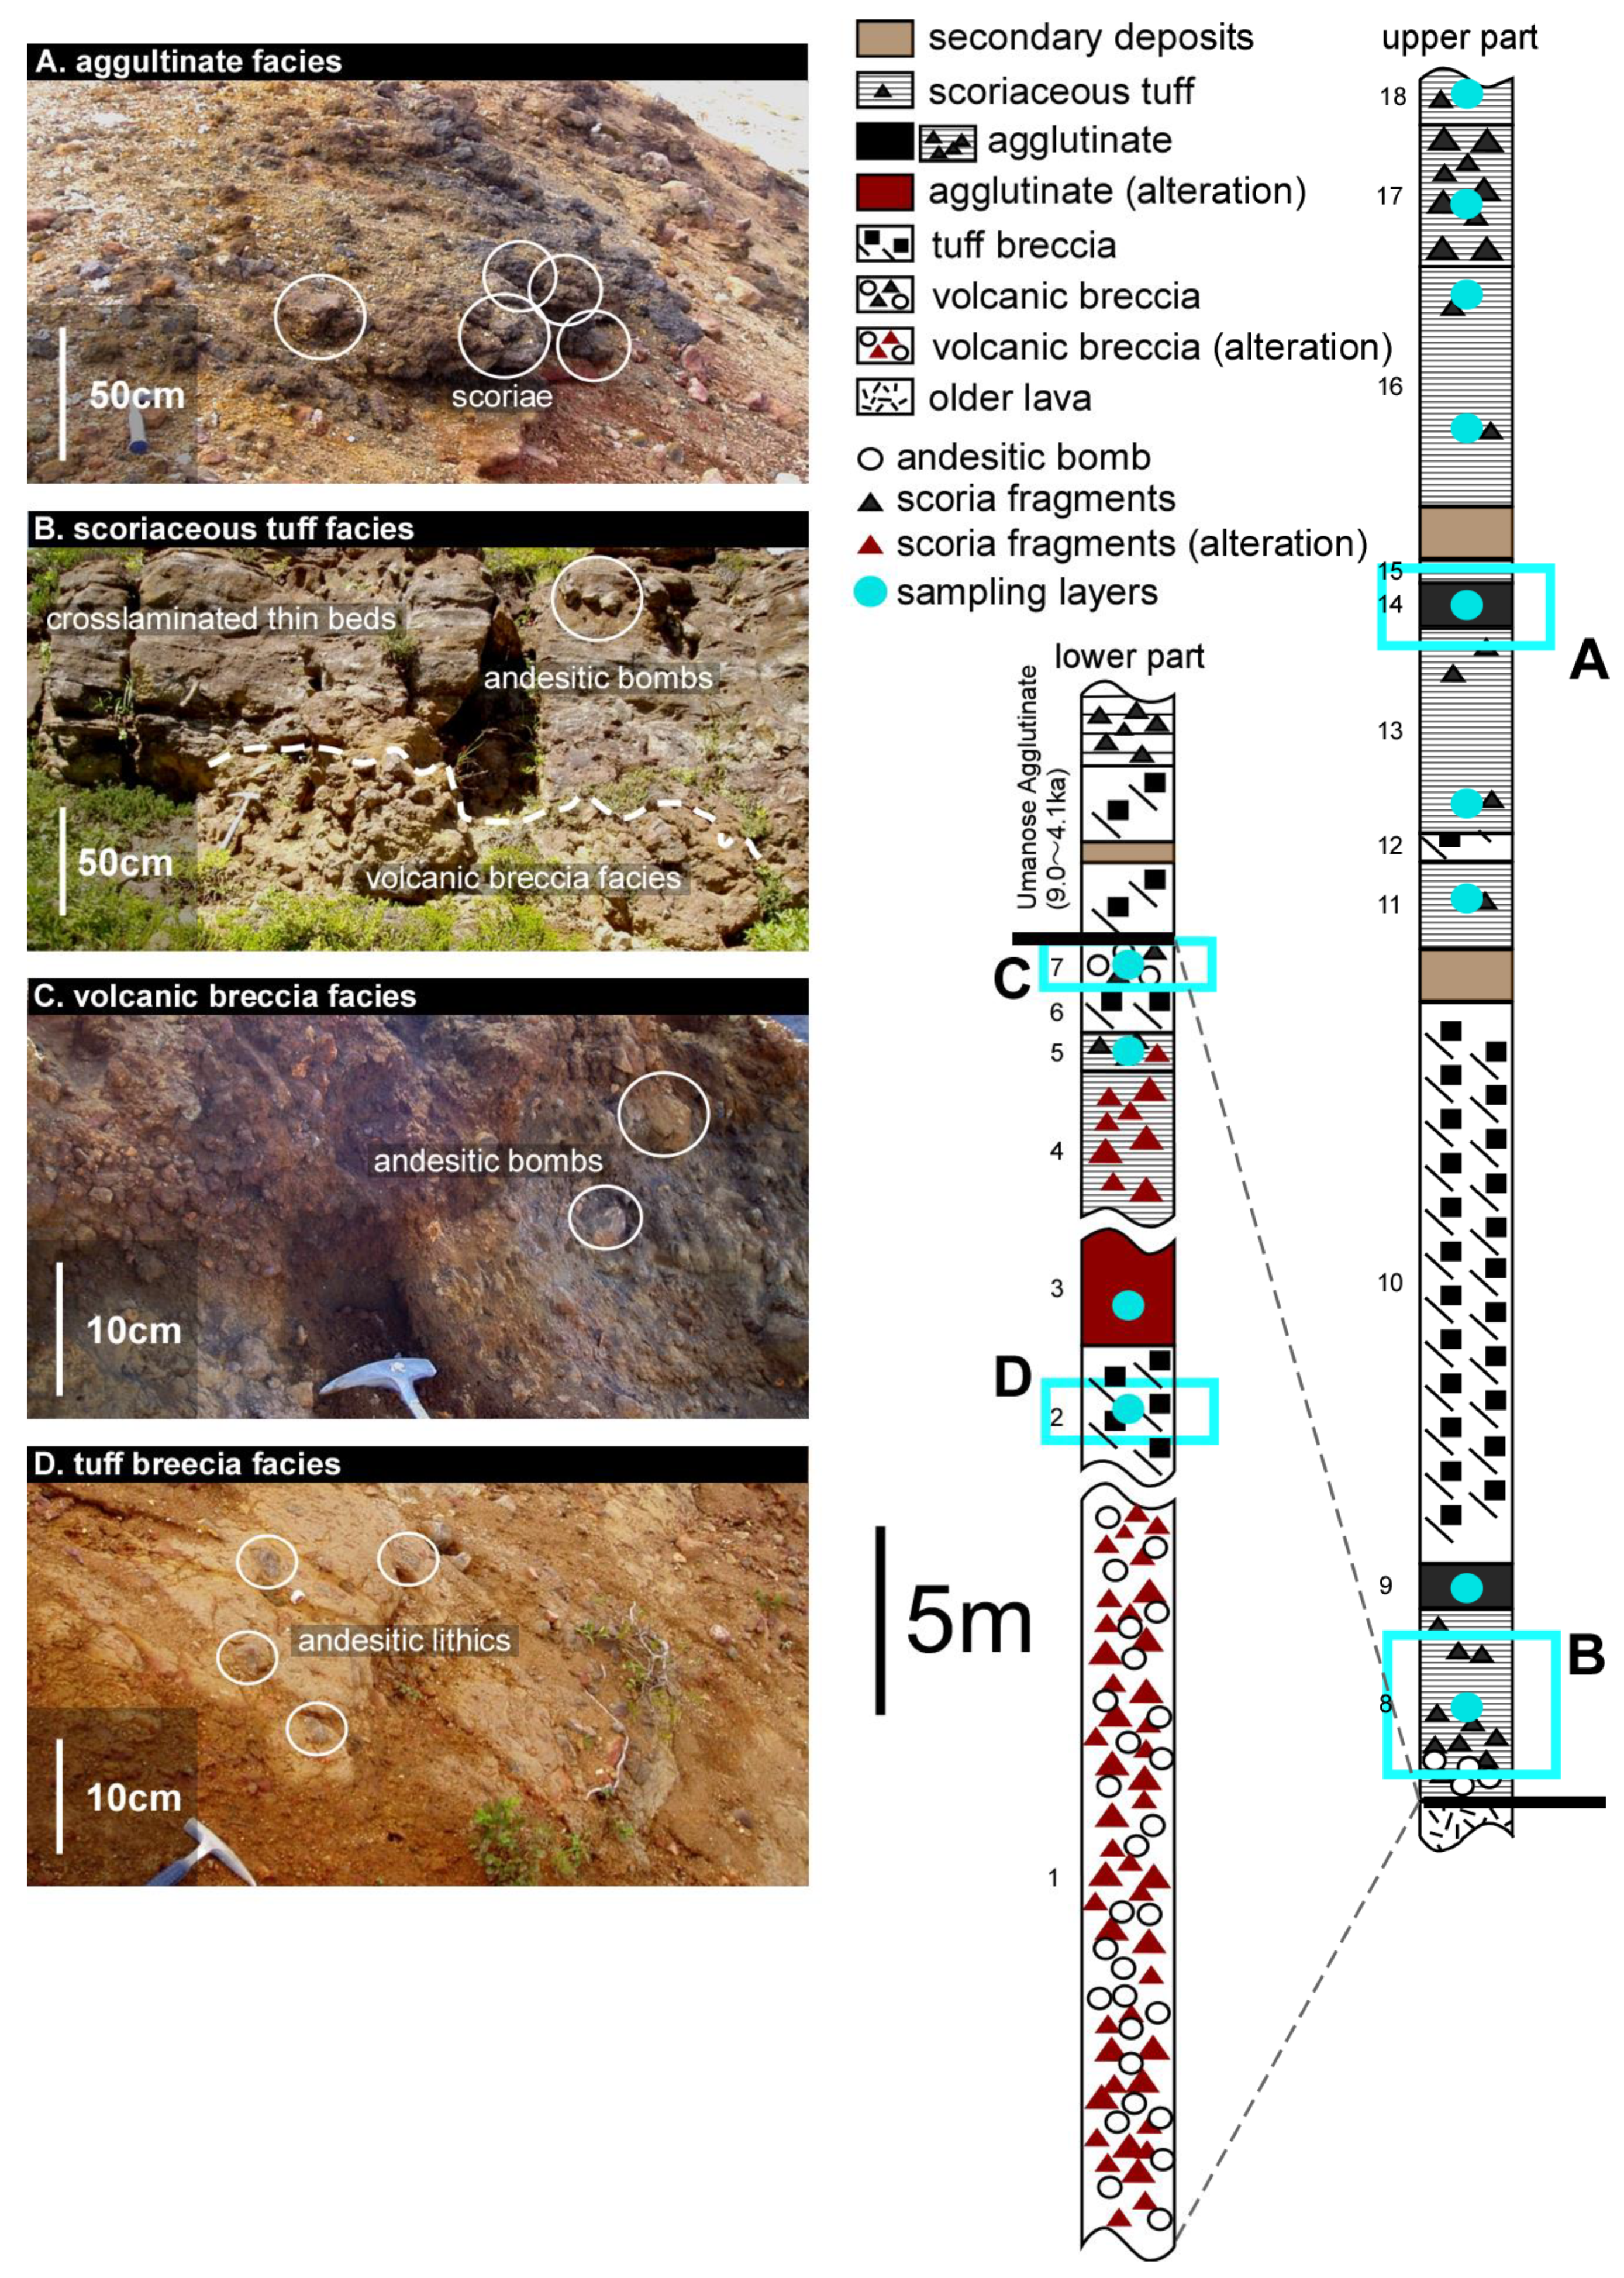
3. Materials and Methods
4. Results
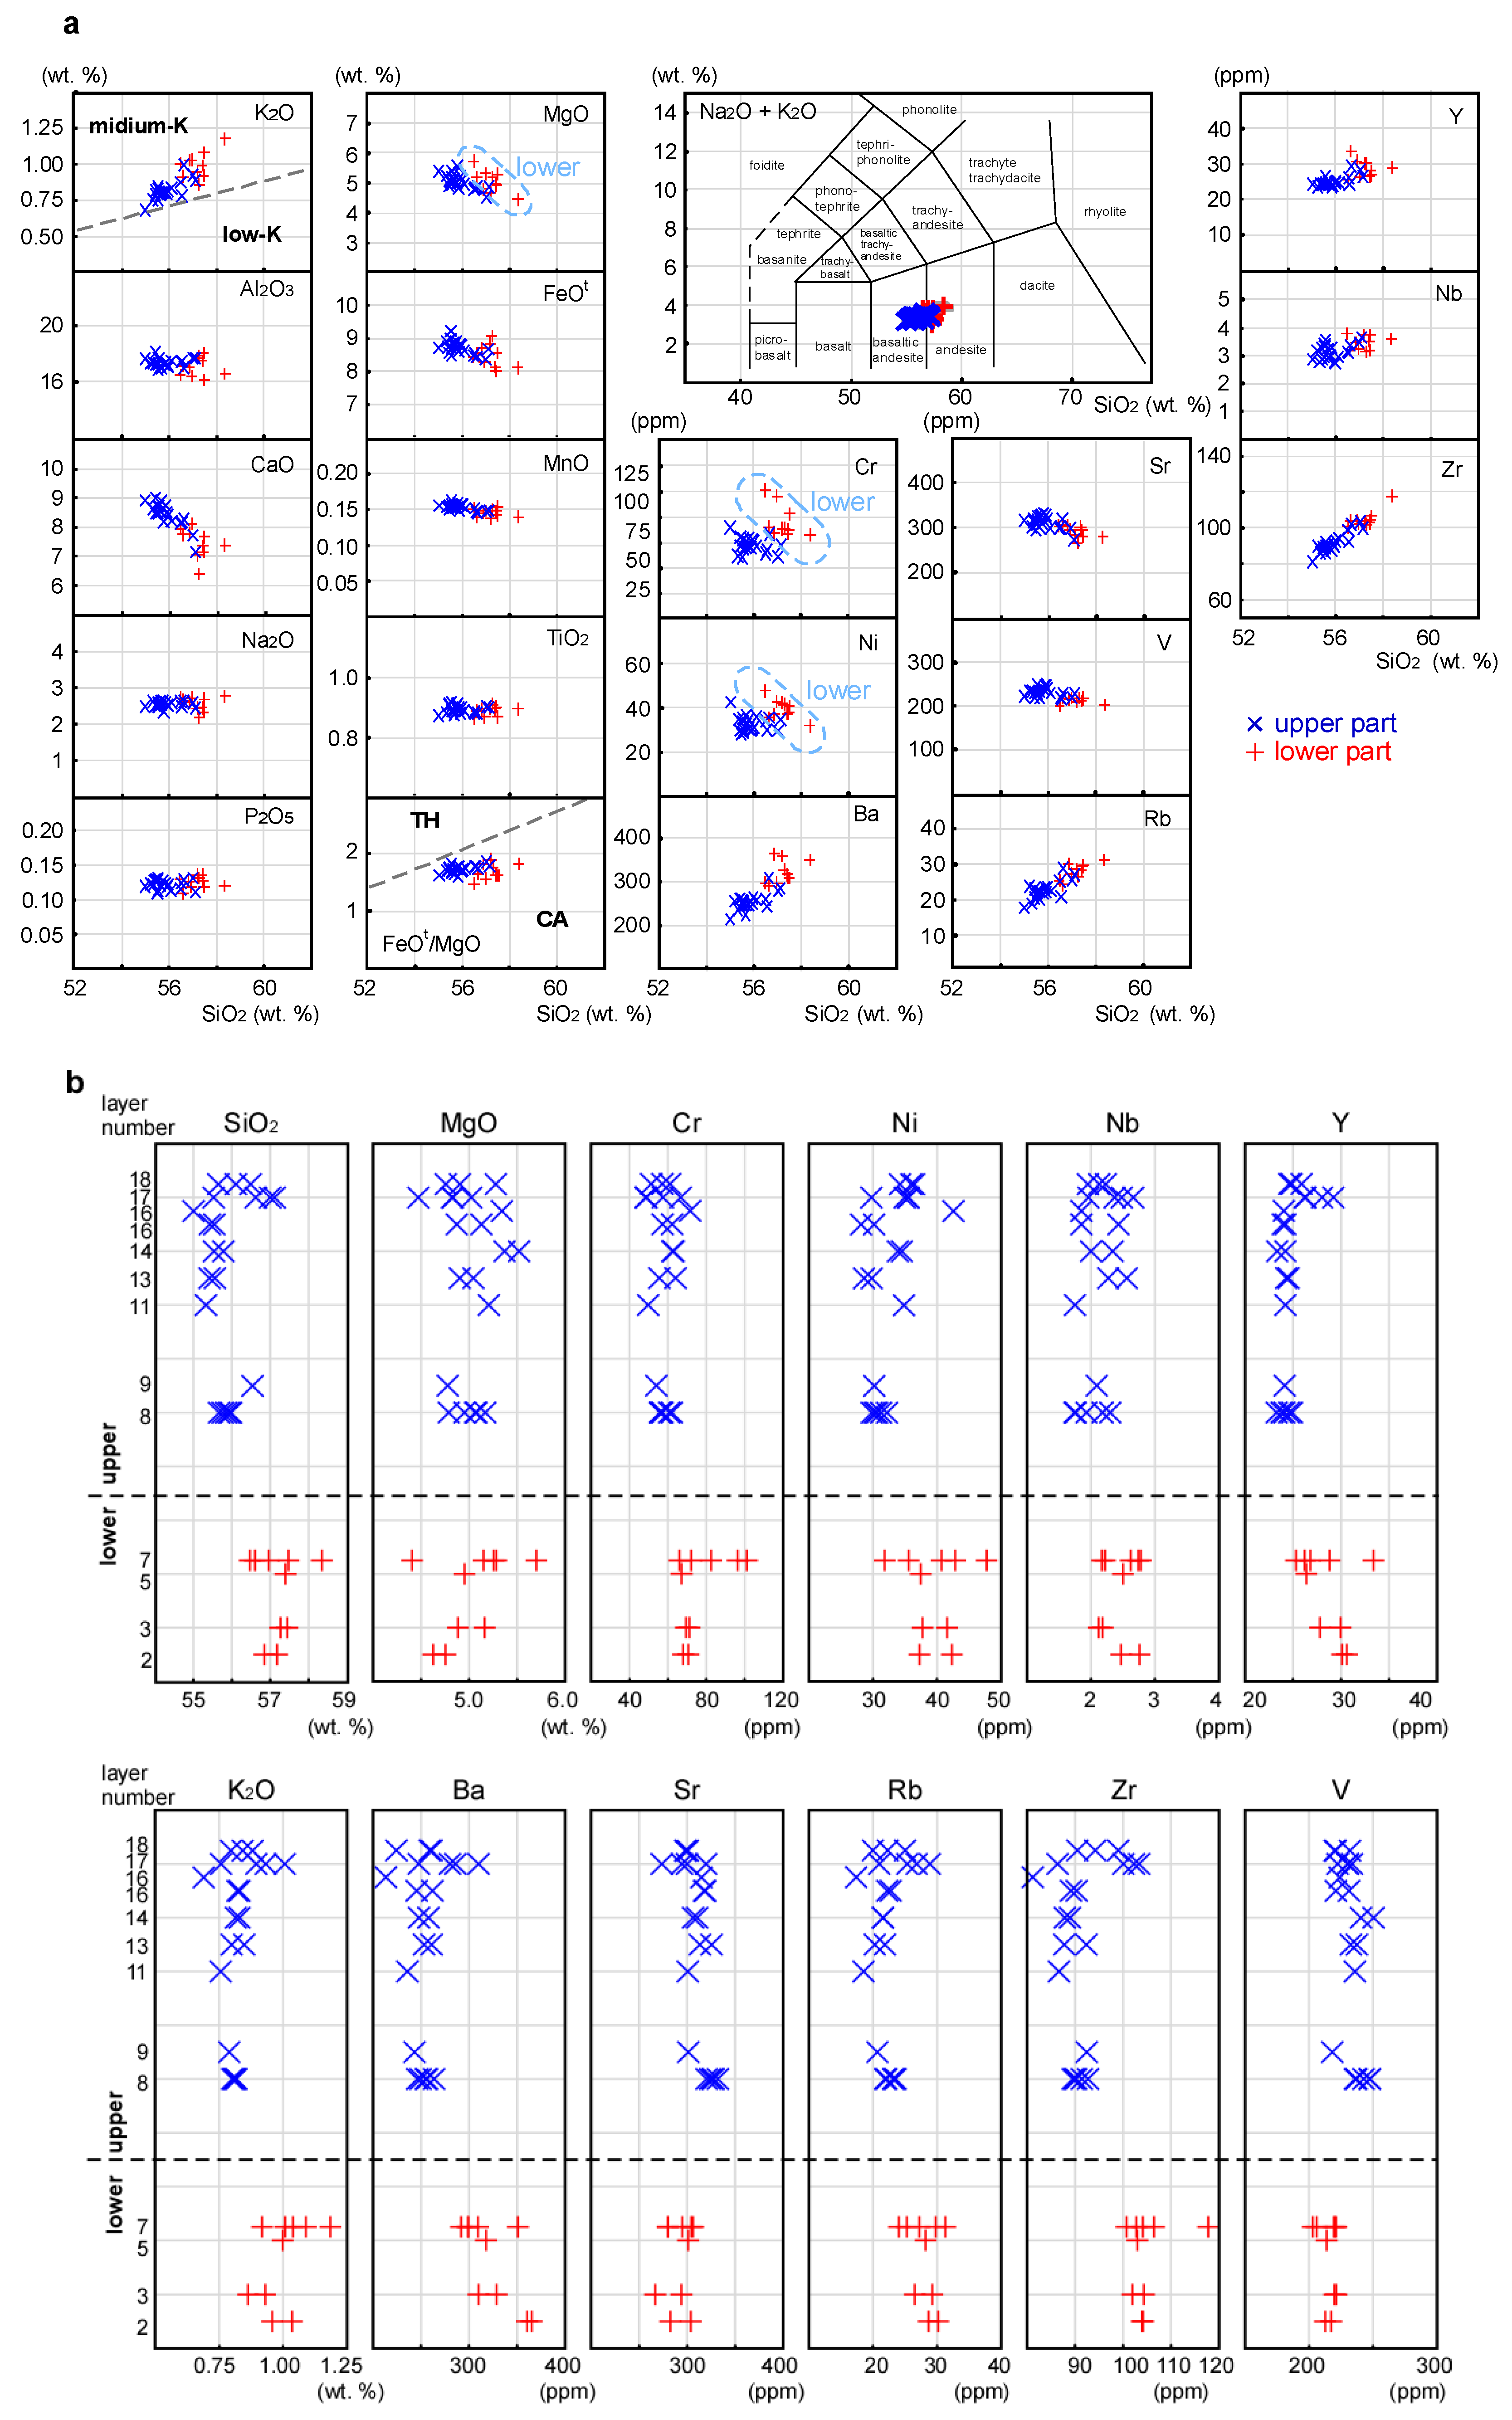
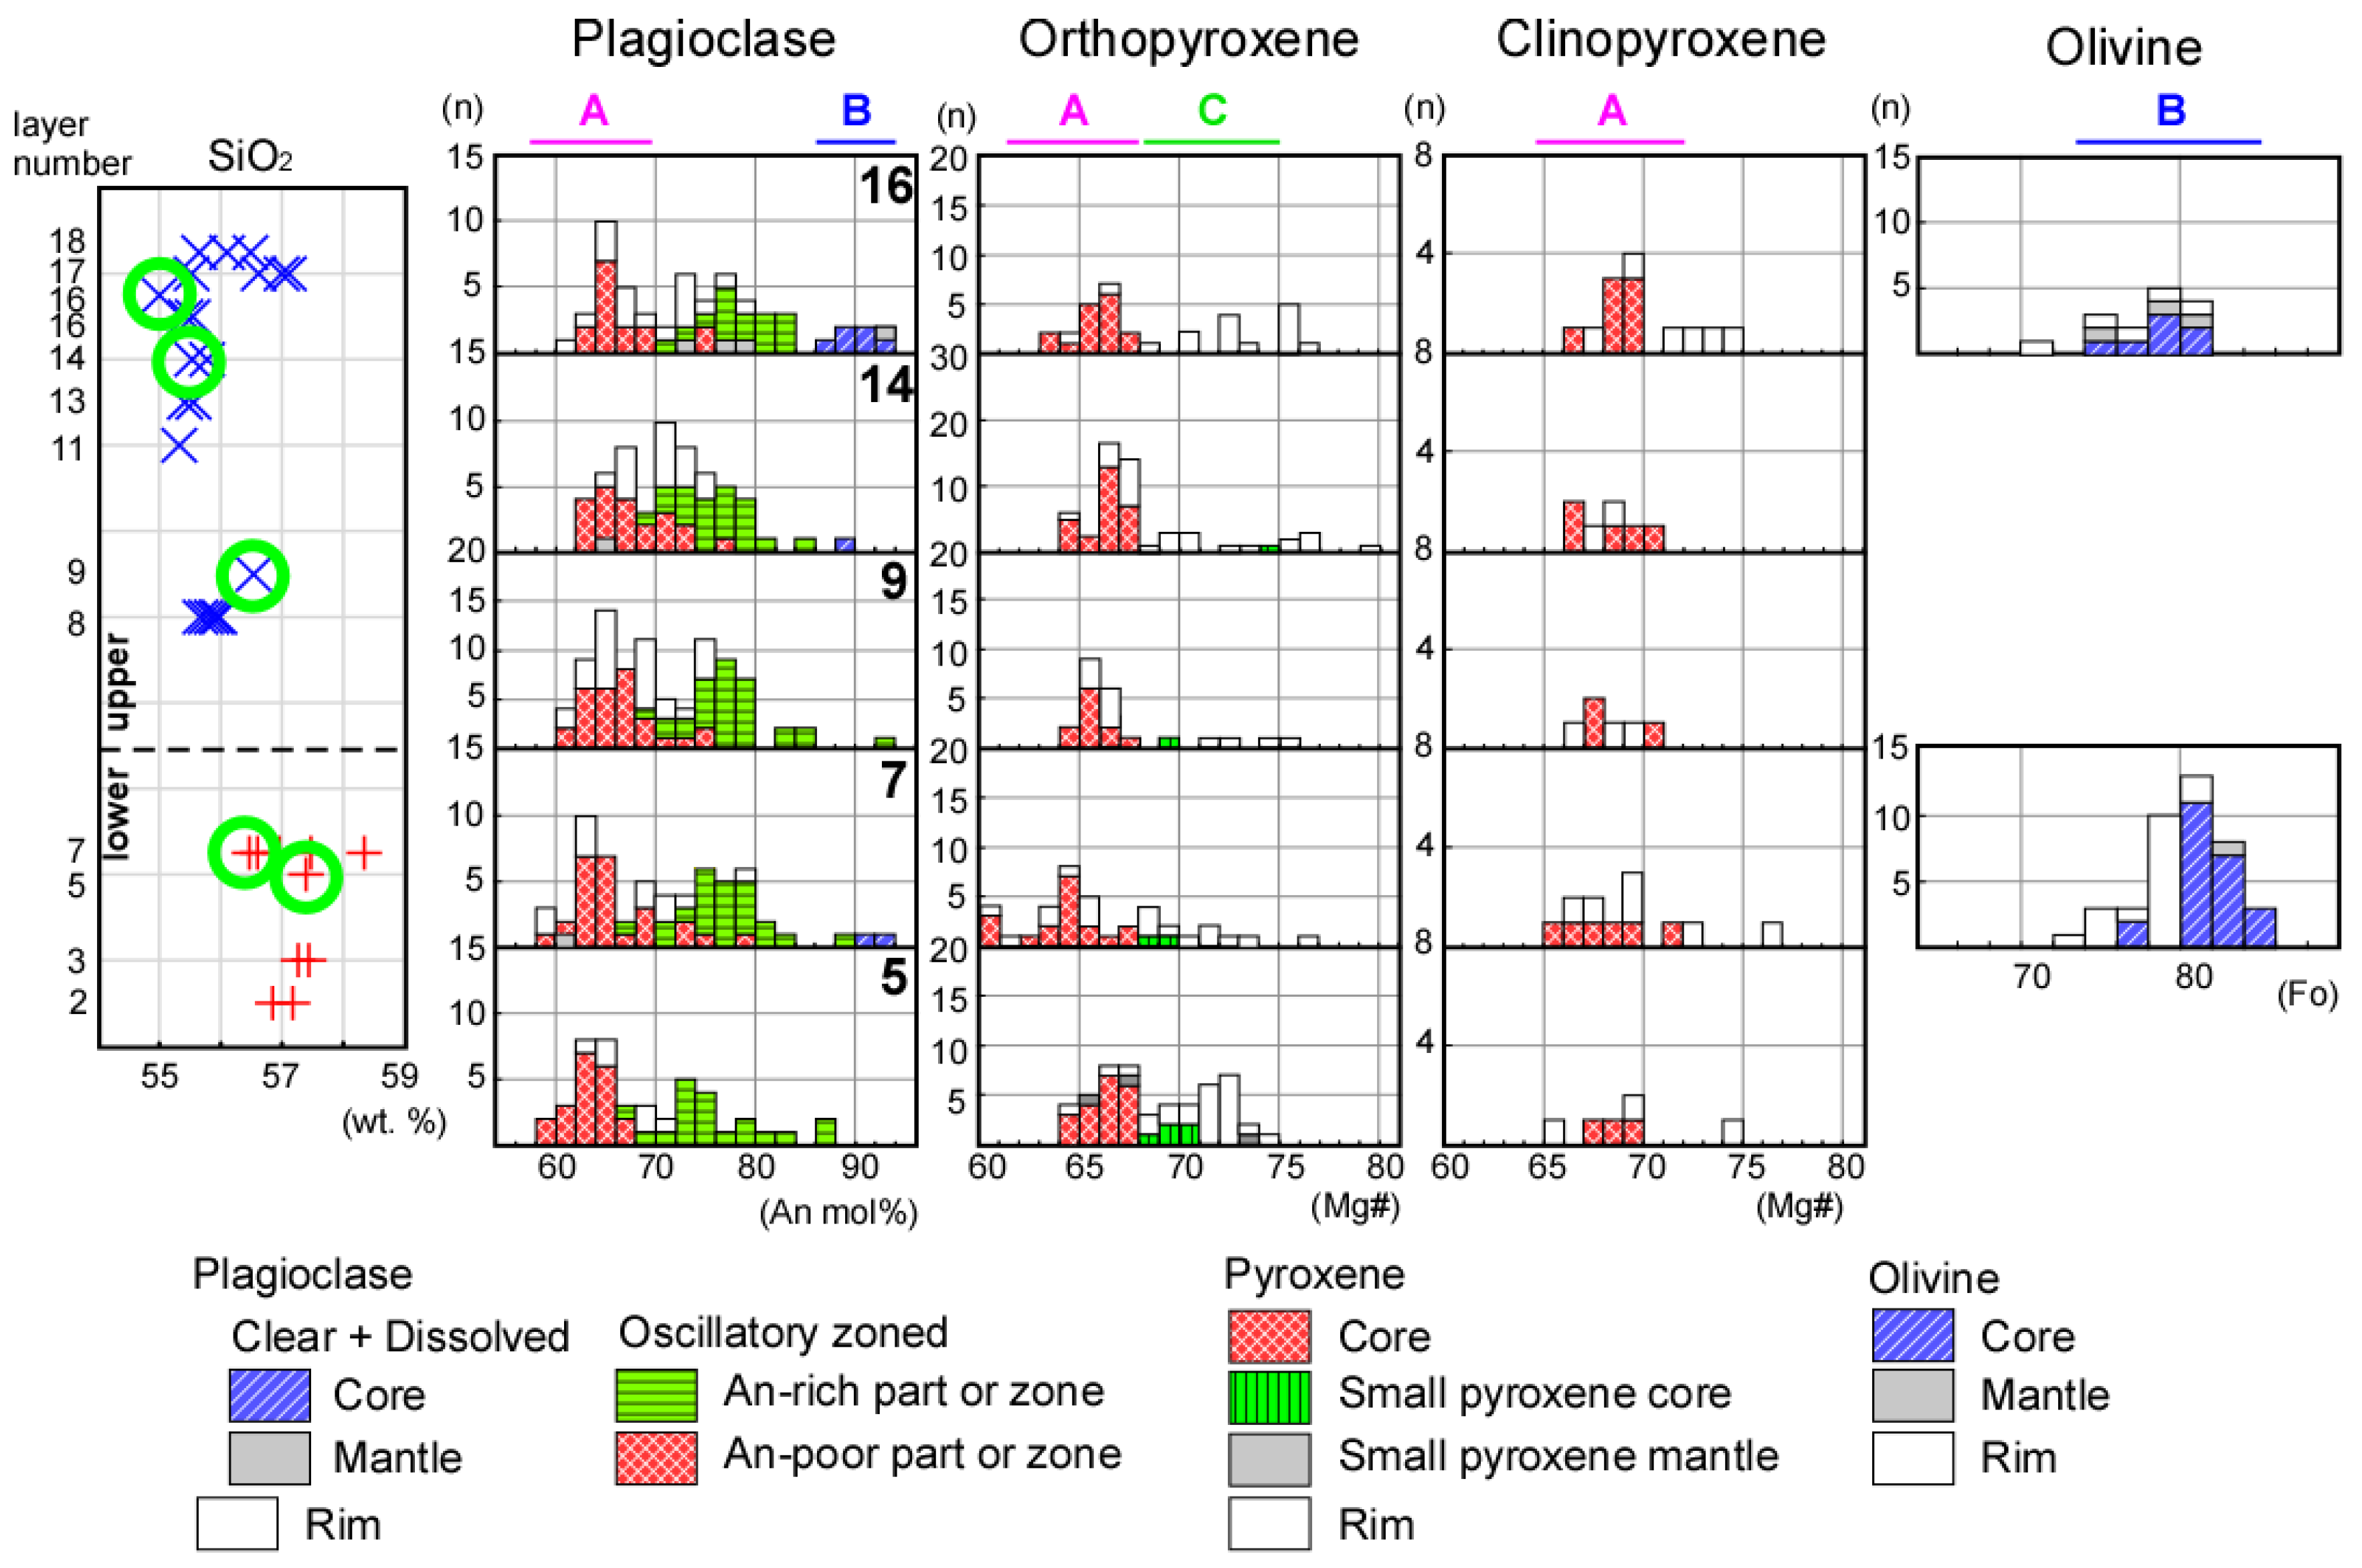
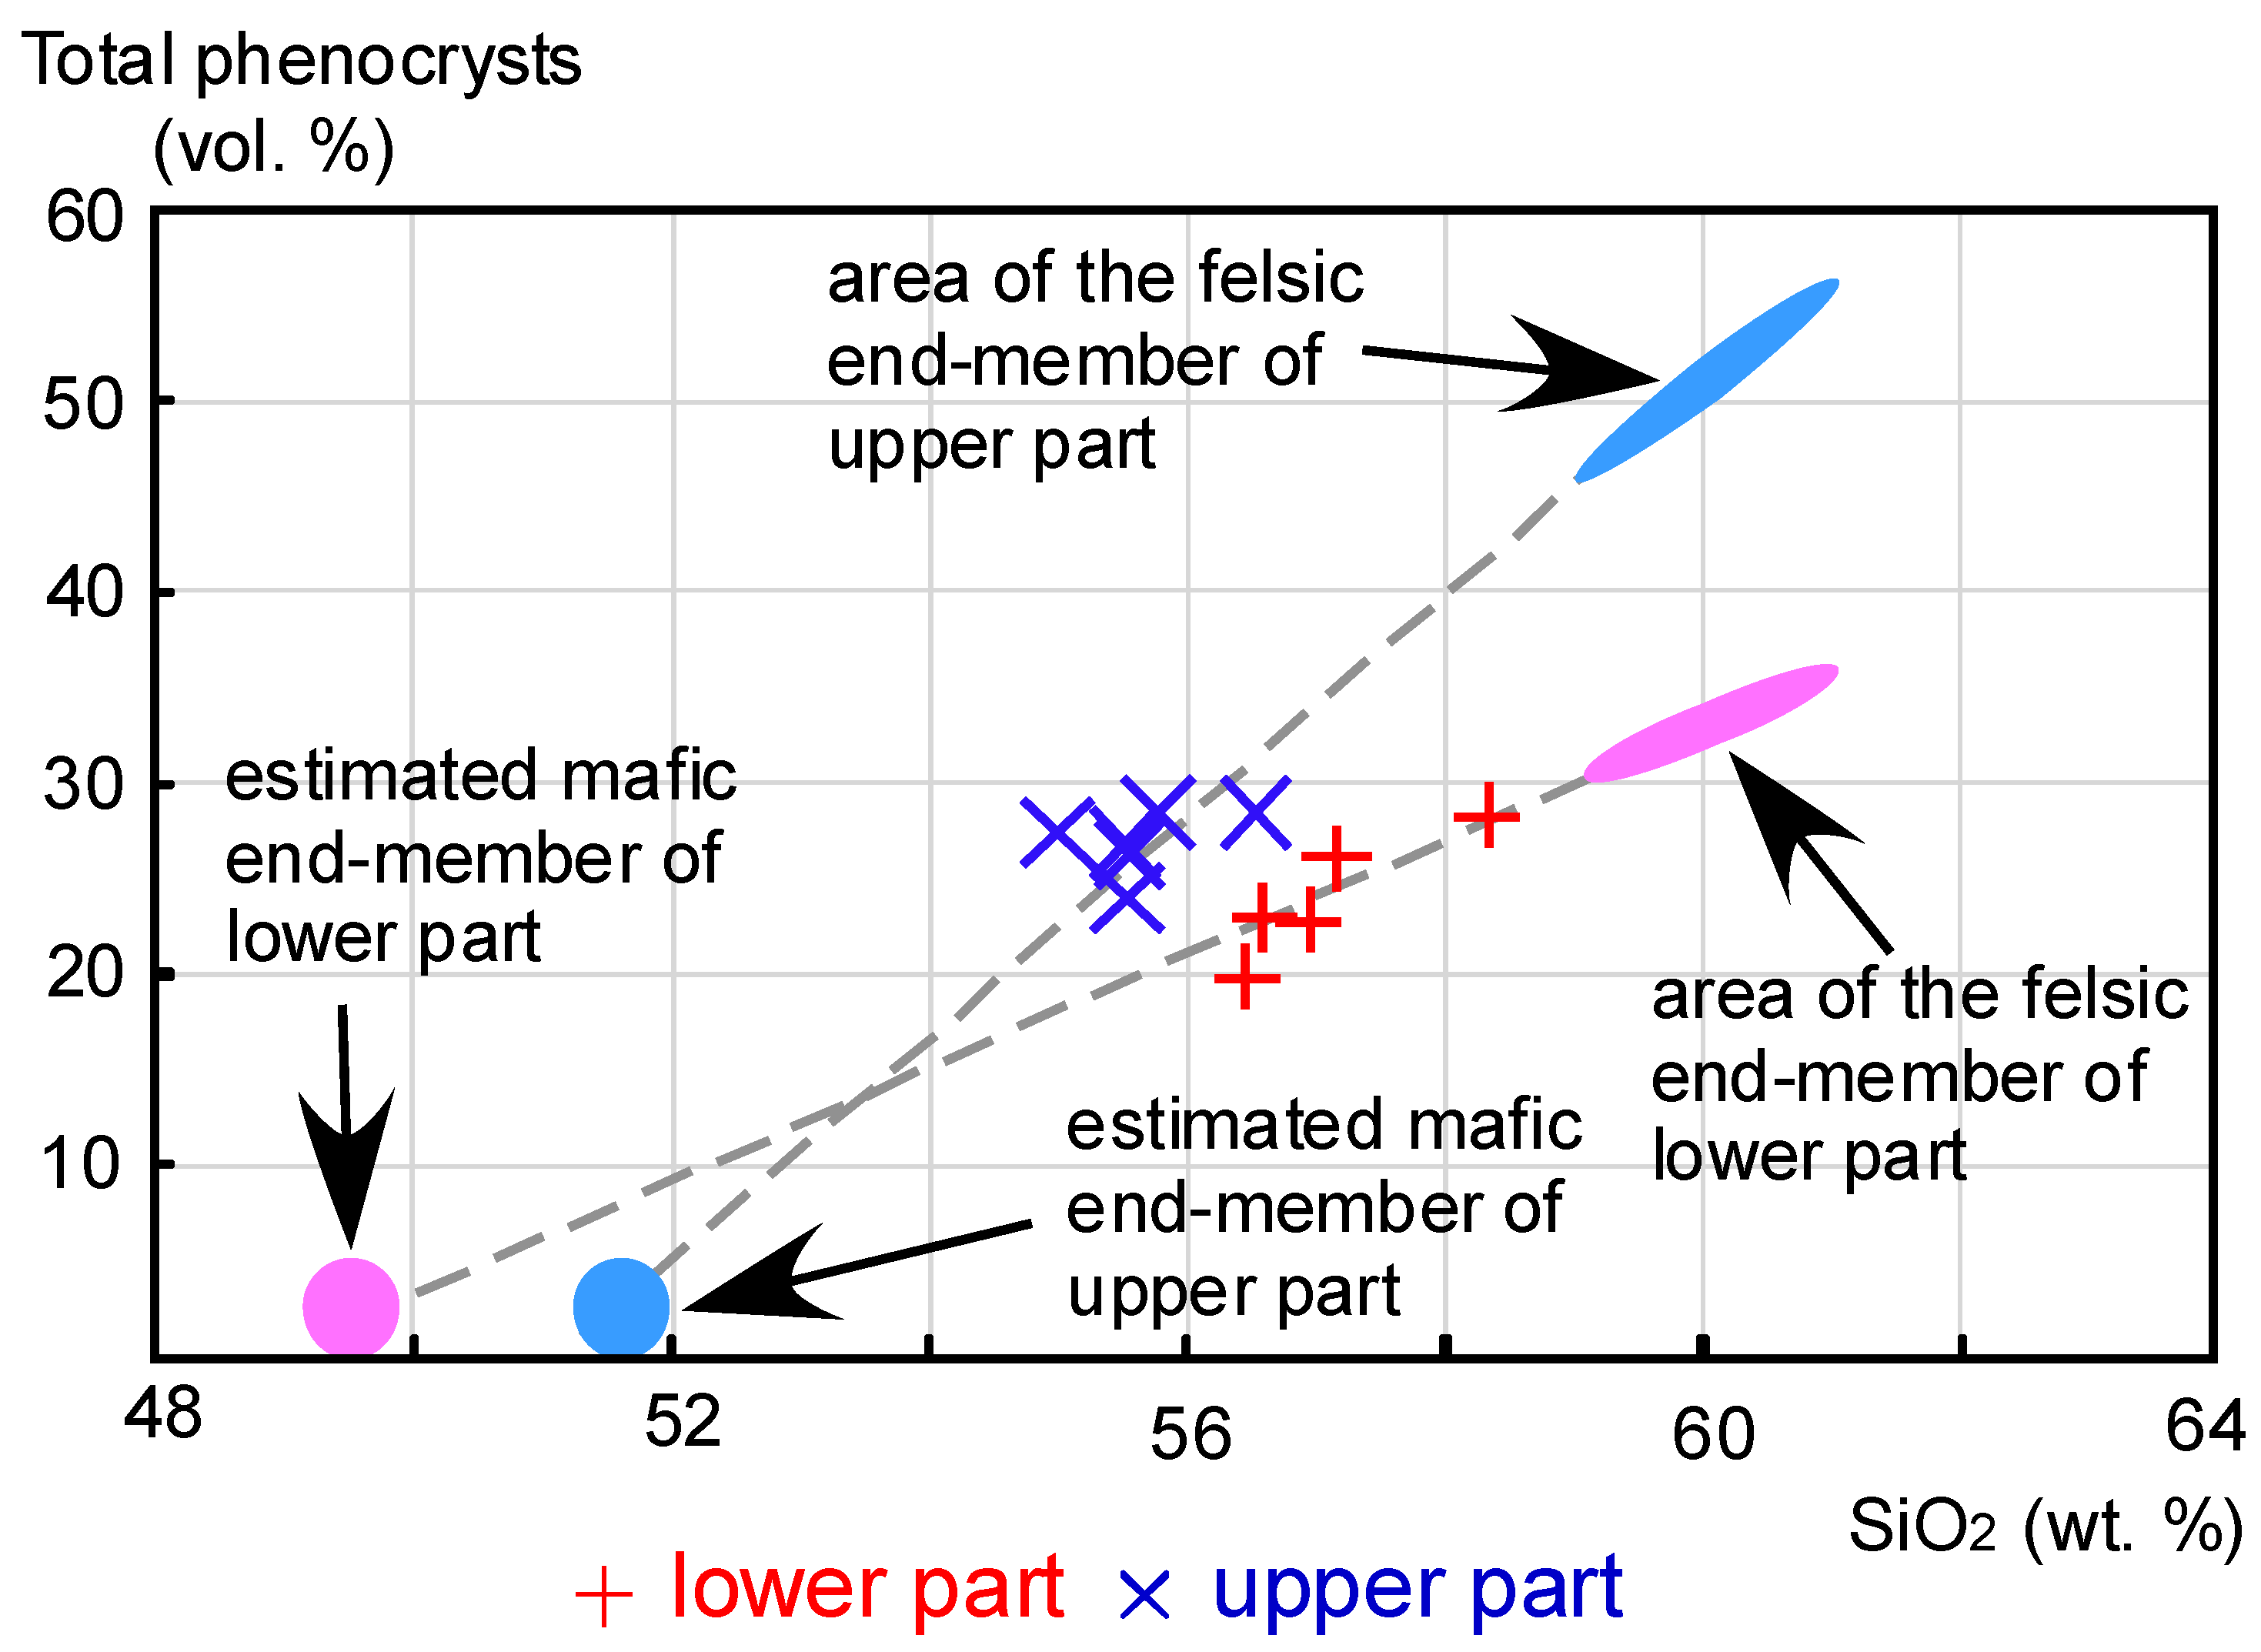
4.1. Modal and Whole Rock Compositions
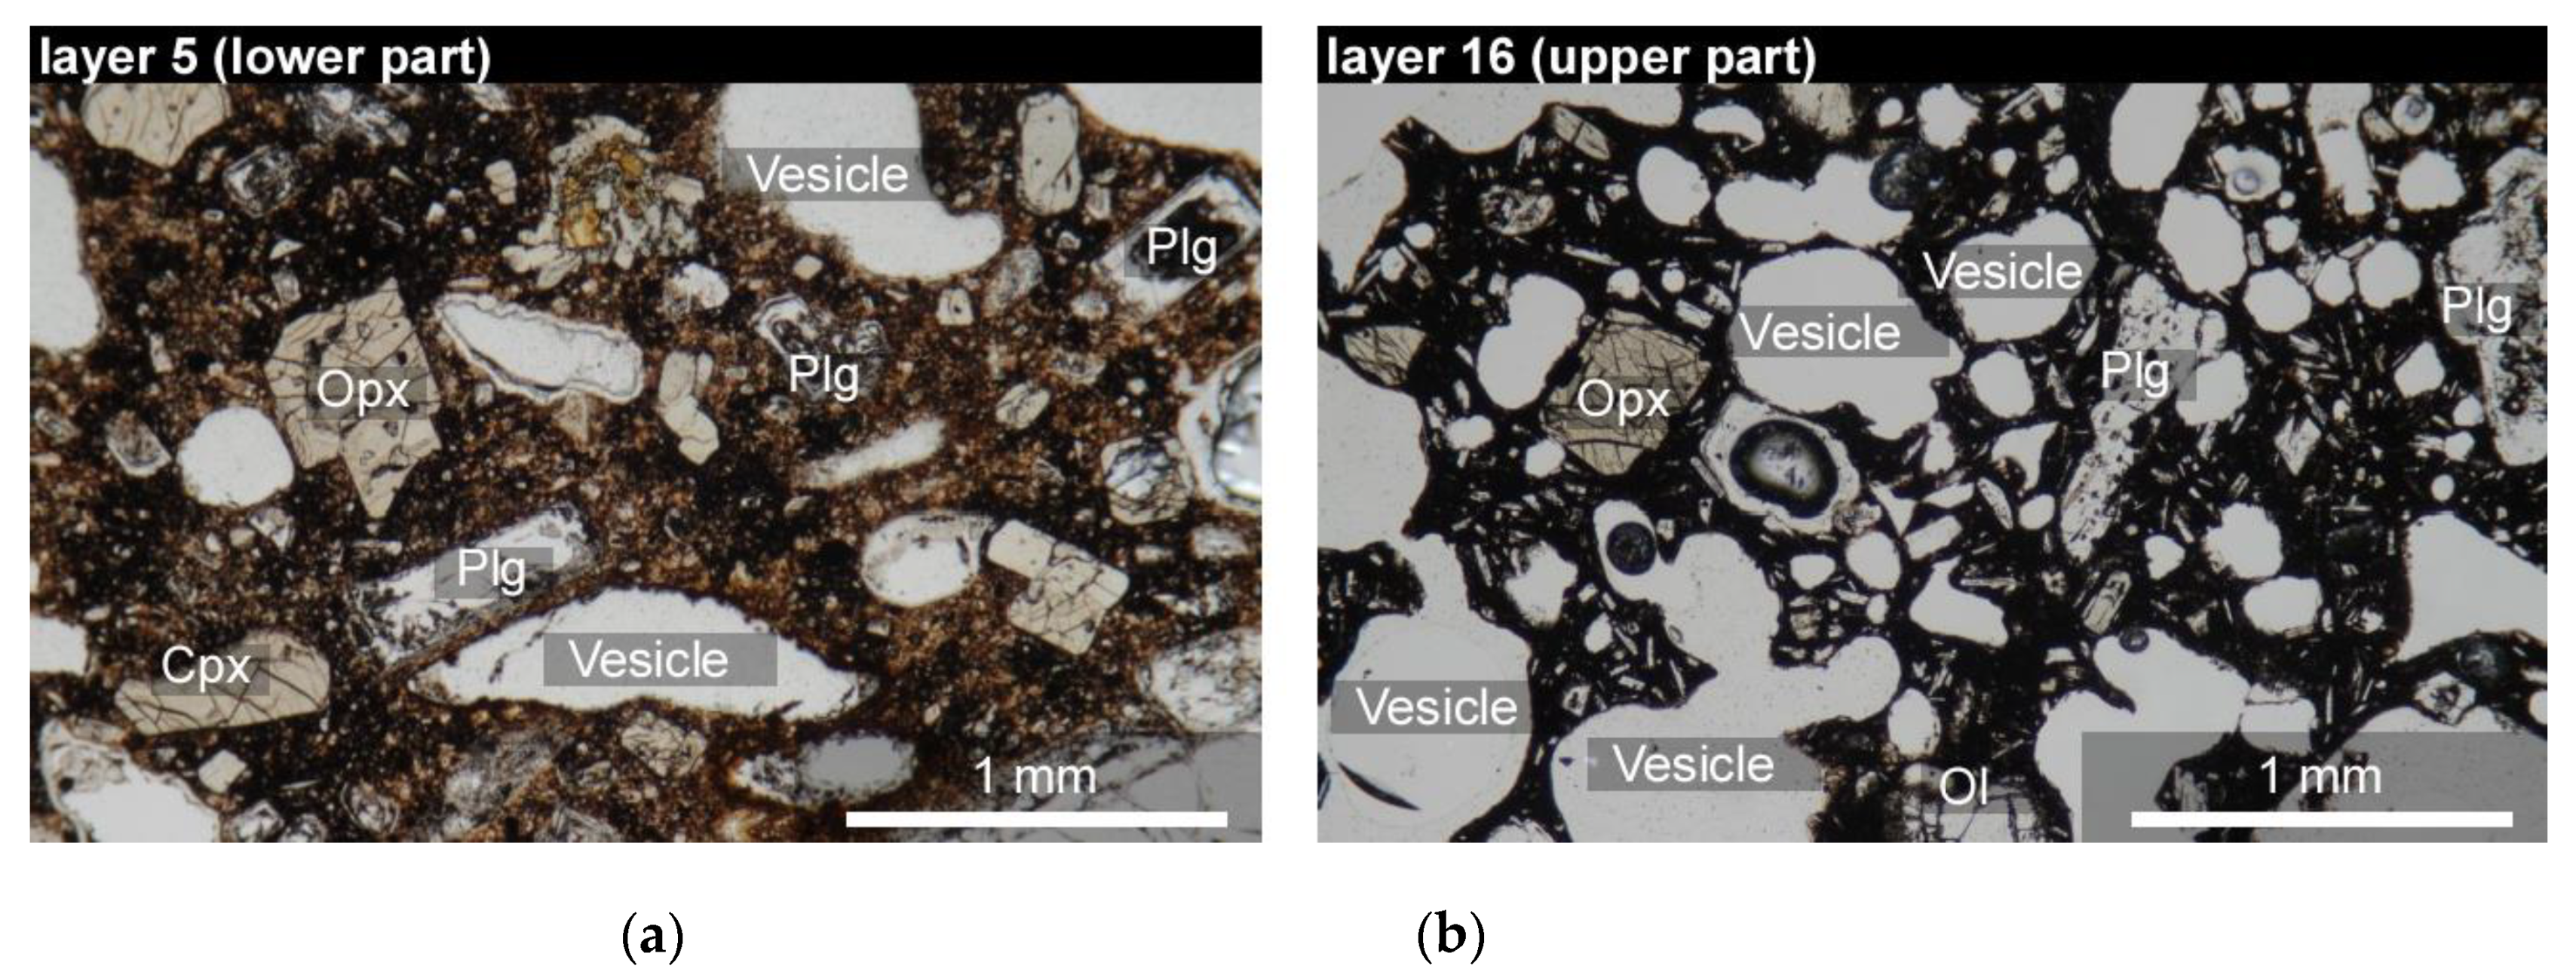
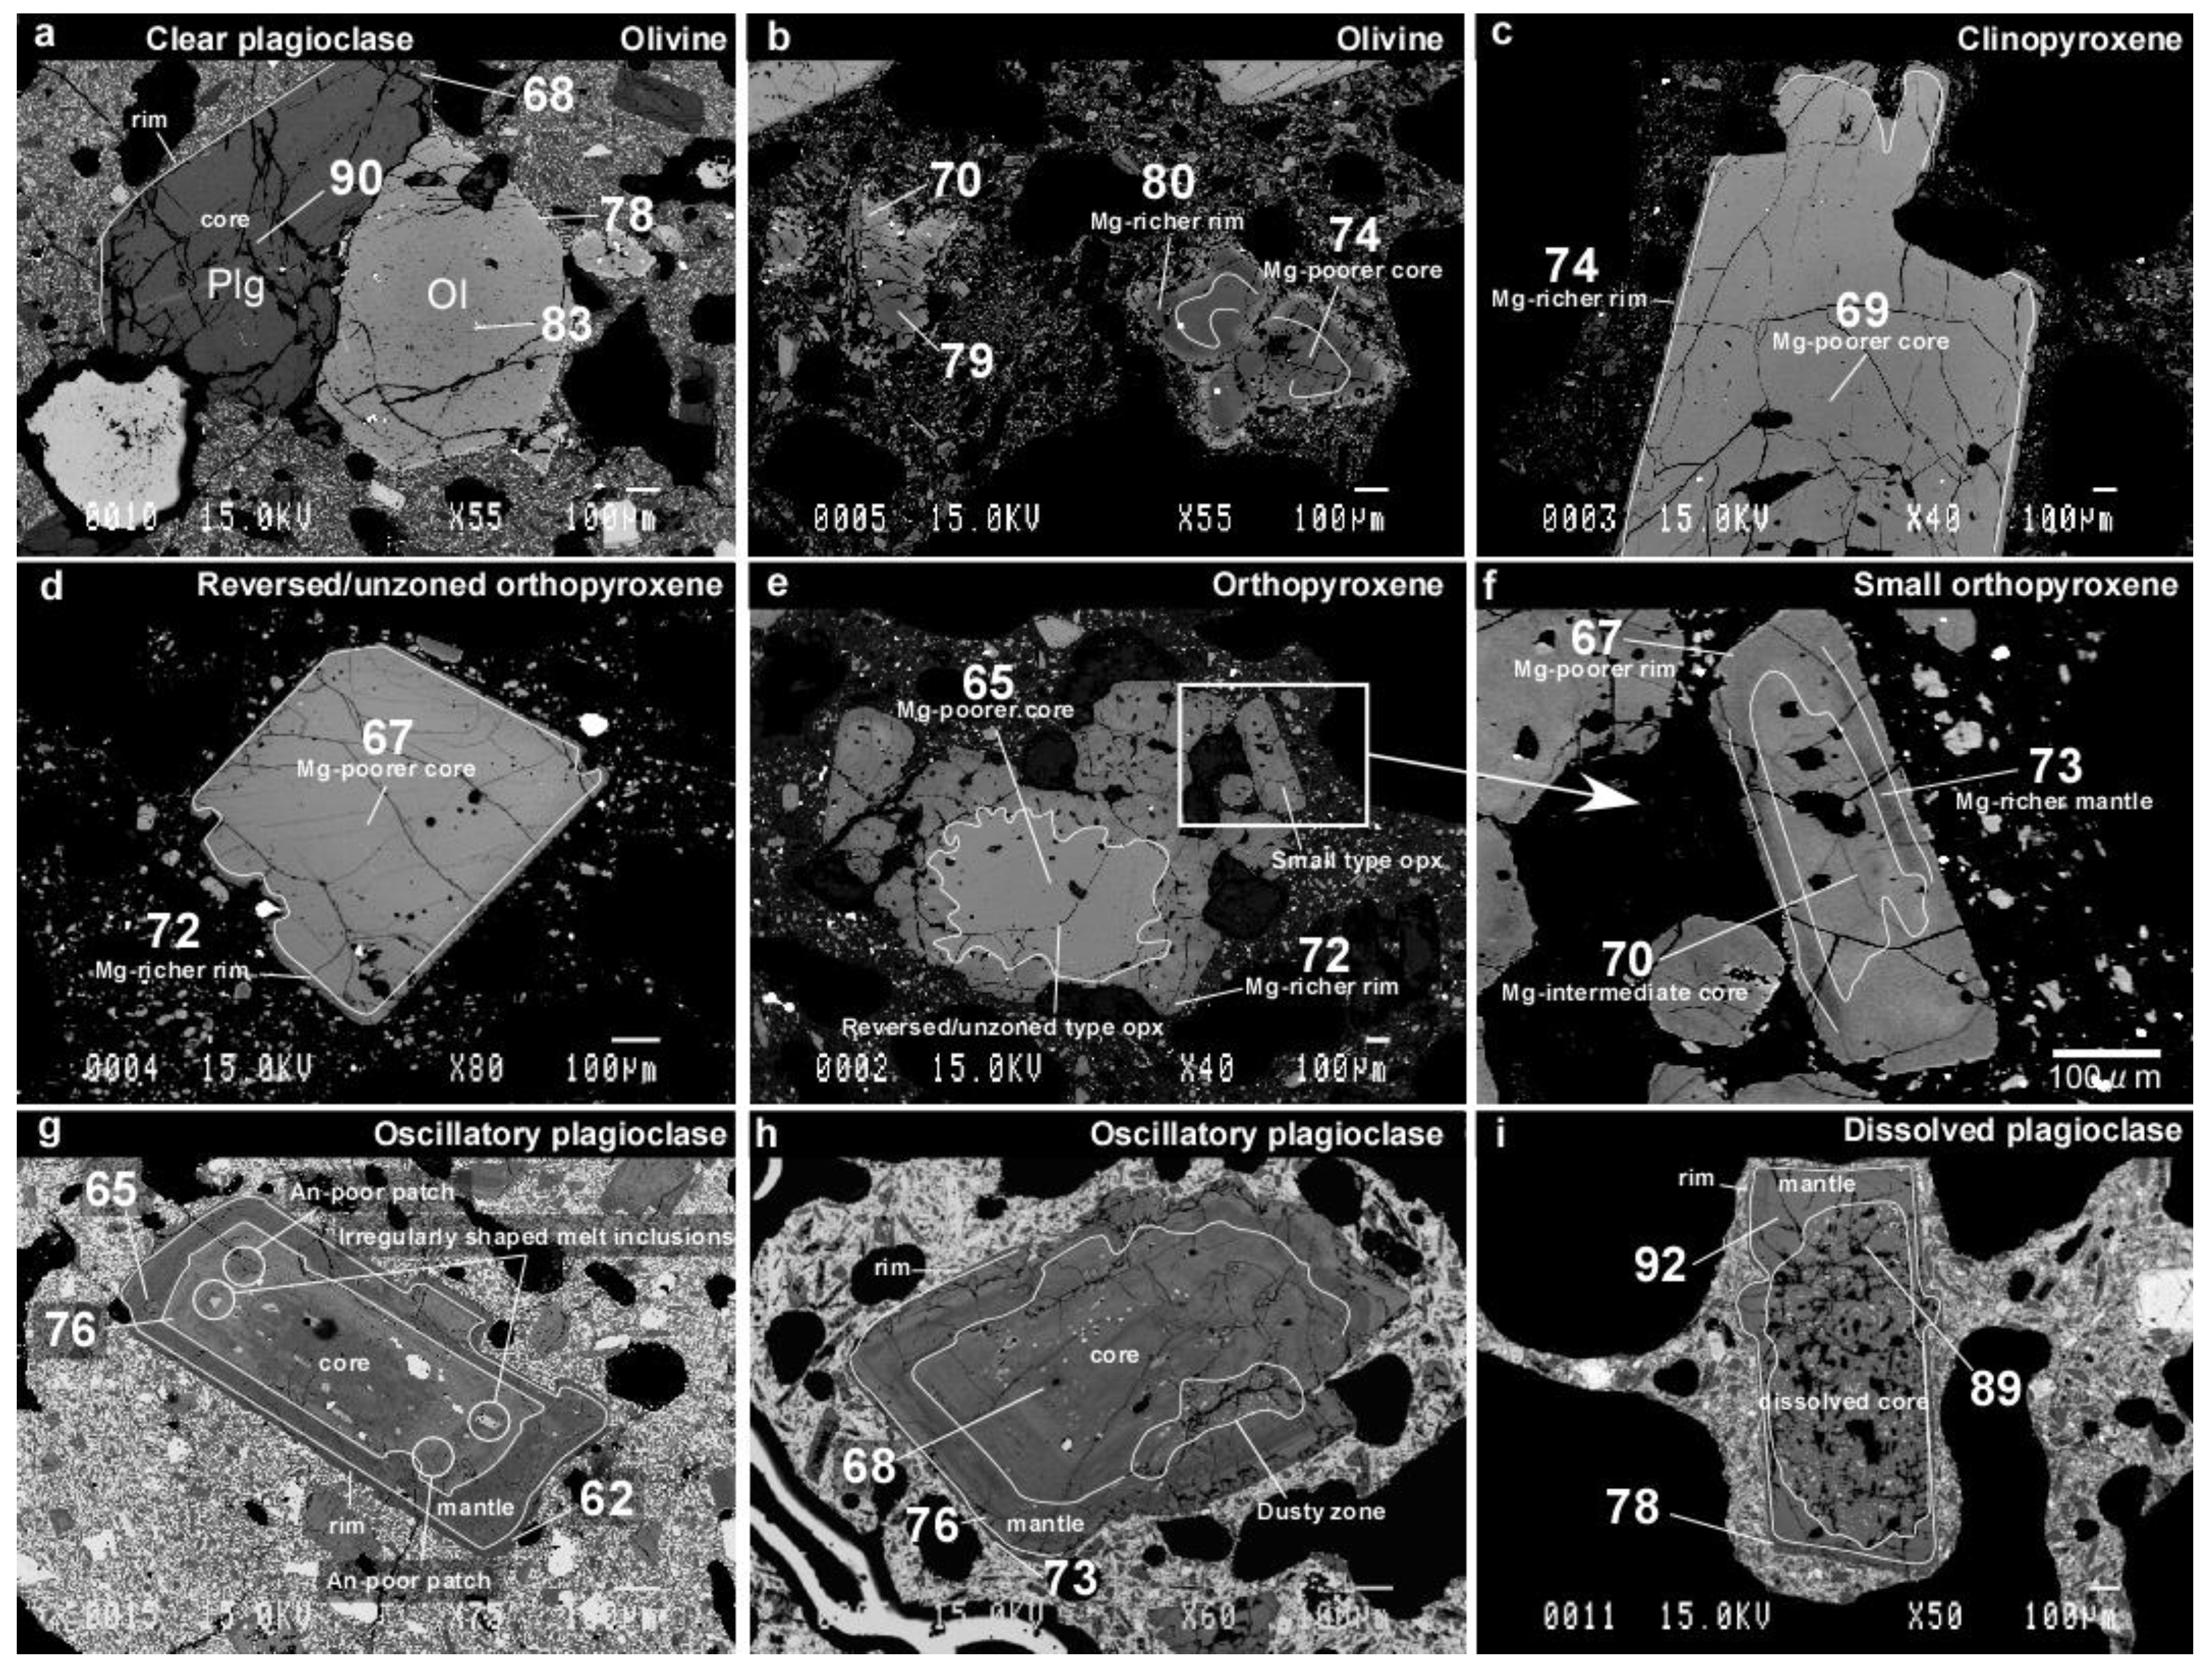
4.2. Textural and Compositional Features of Phenocrysts
4.2.1. Olivine
4.2.2. Clinopyroxene
4.2.3. Orthopyroxene
4.2.4. Plagioclase
5. Discussion
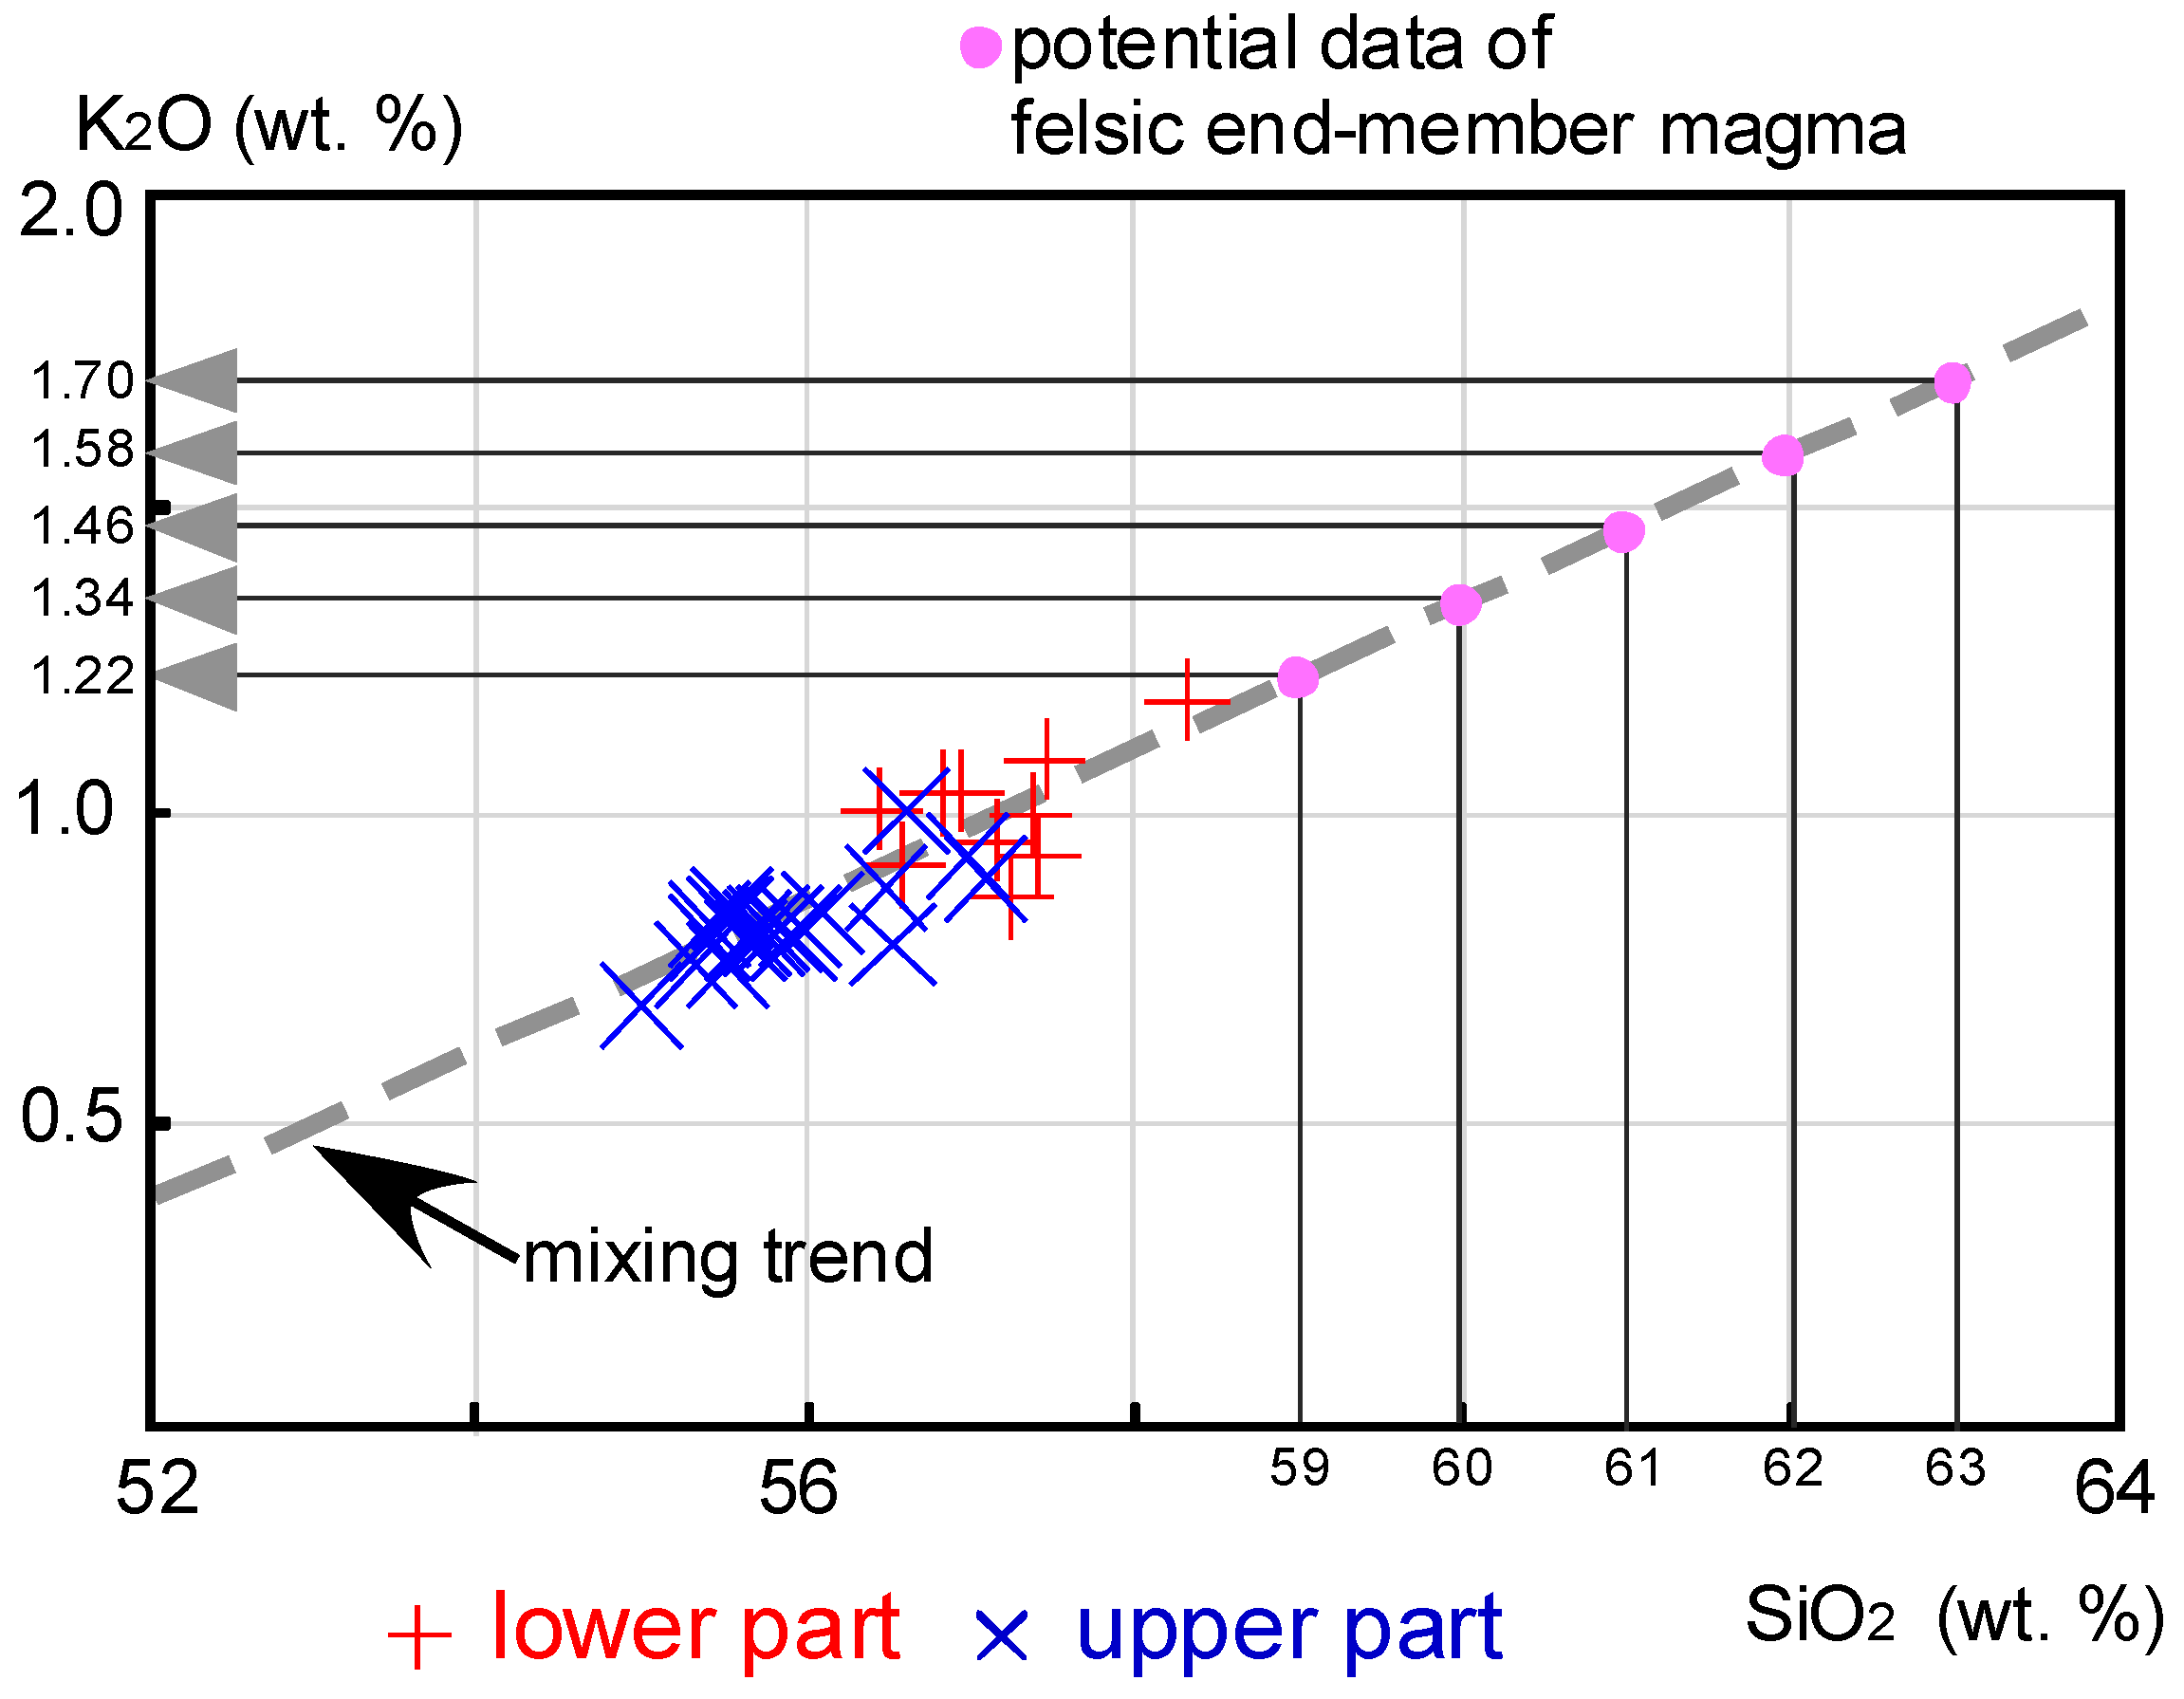
5.1. Mixing of Two End-Member Magmas Produced the Variable Petrological Features of the Kattadake Pyroclastics
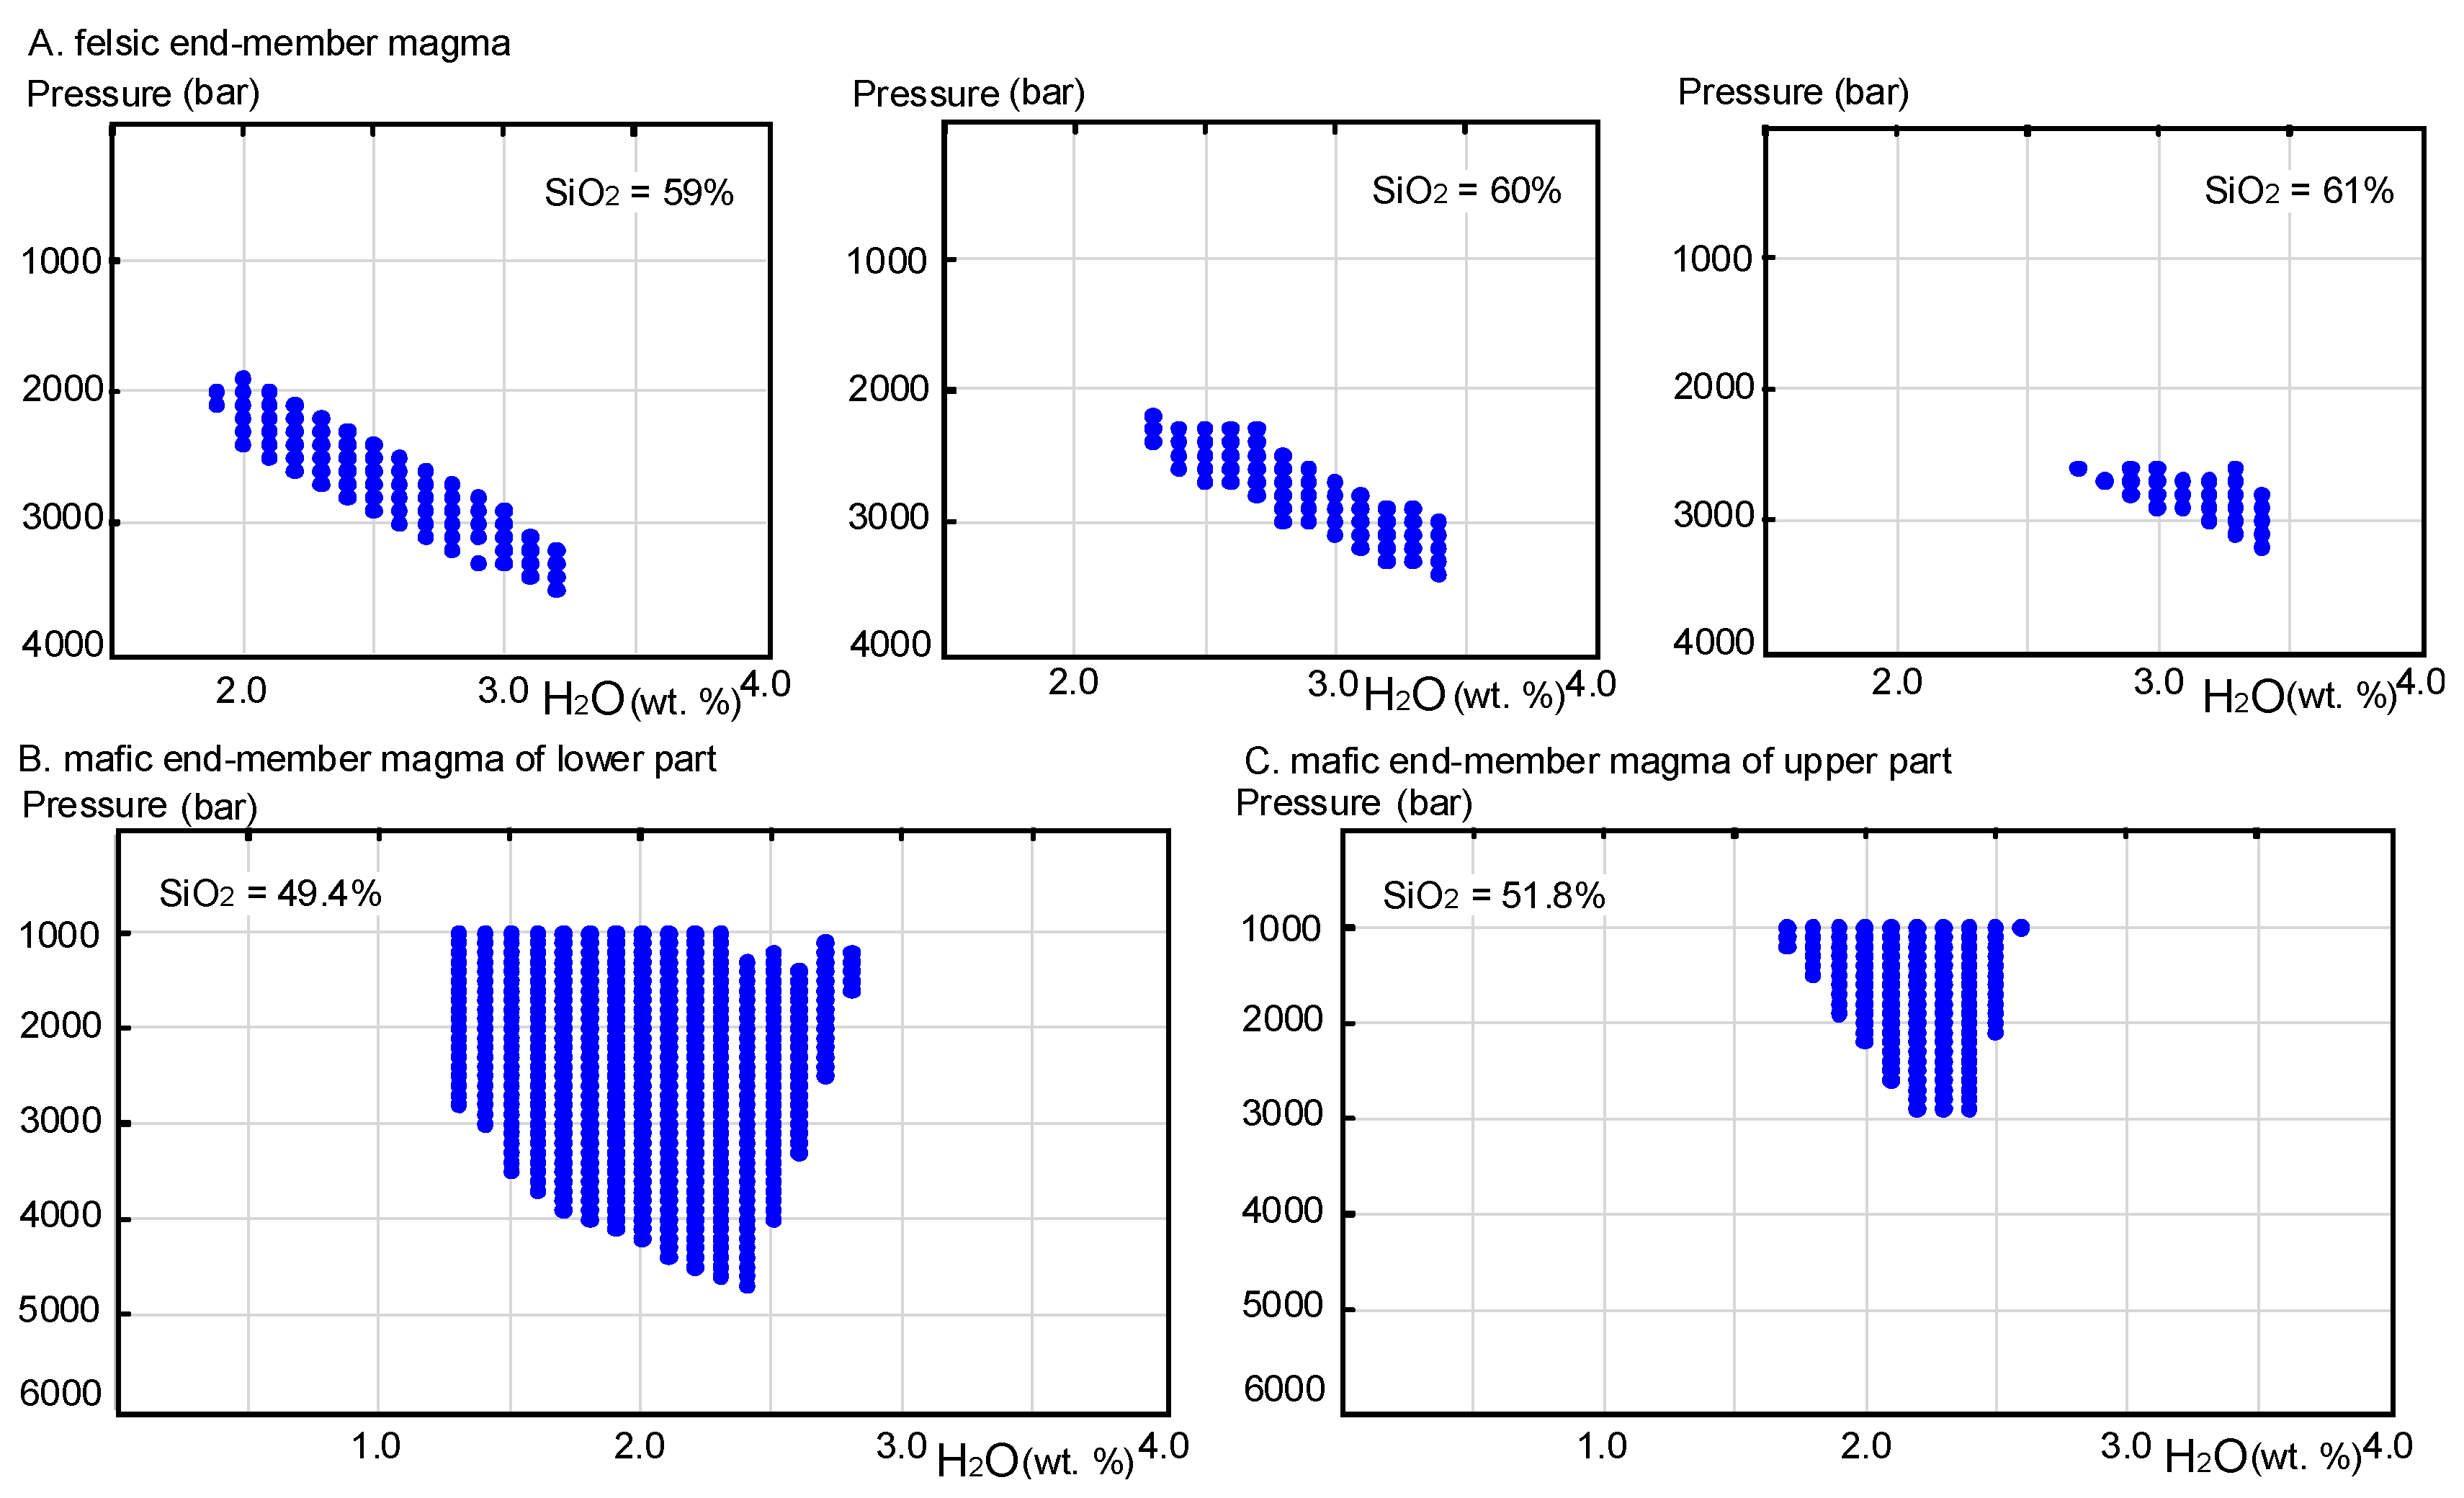
5.2. Composition and T-P-H2O Conditions of the Felsic End-Member Magma
5.3. Composition and T-P-H2O Conditions of the Mafic End-Member Magma
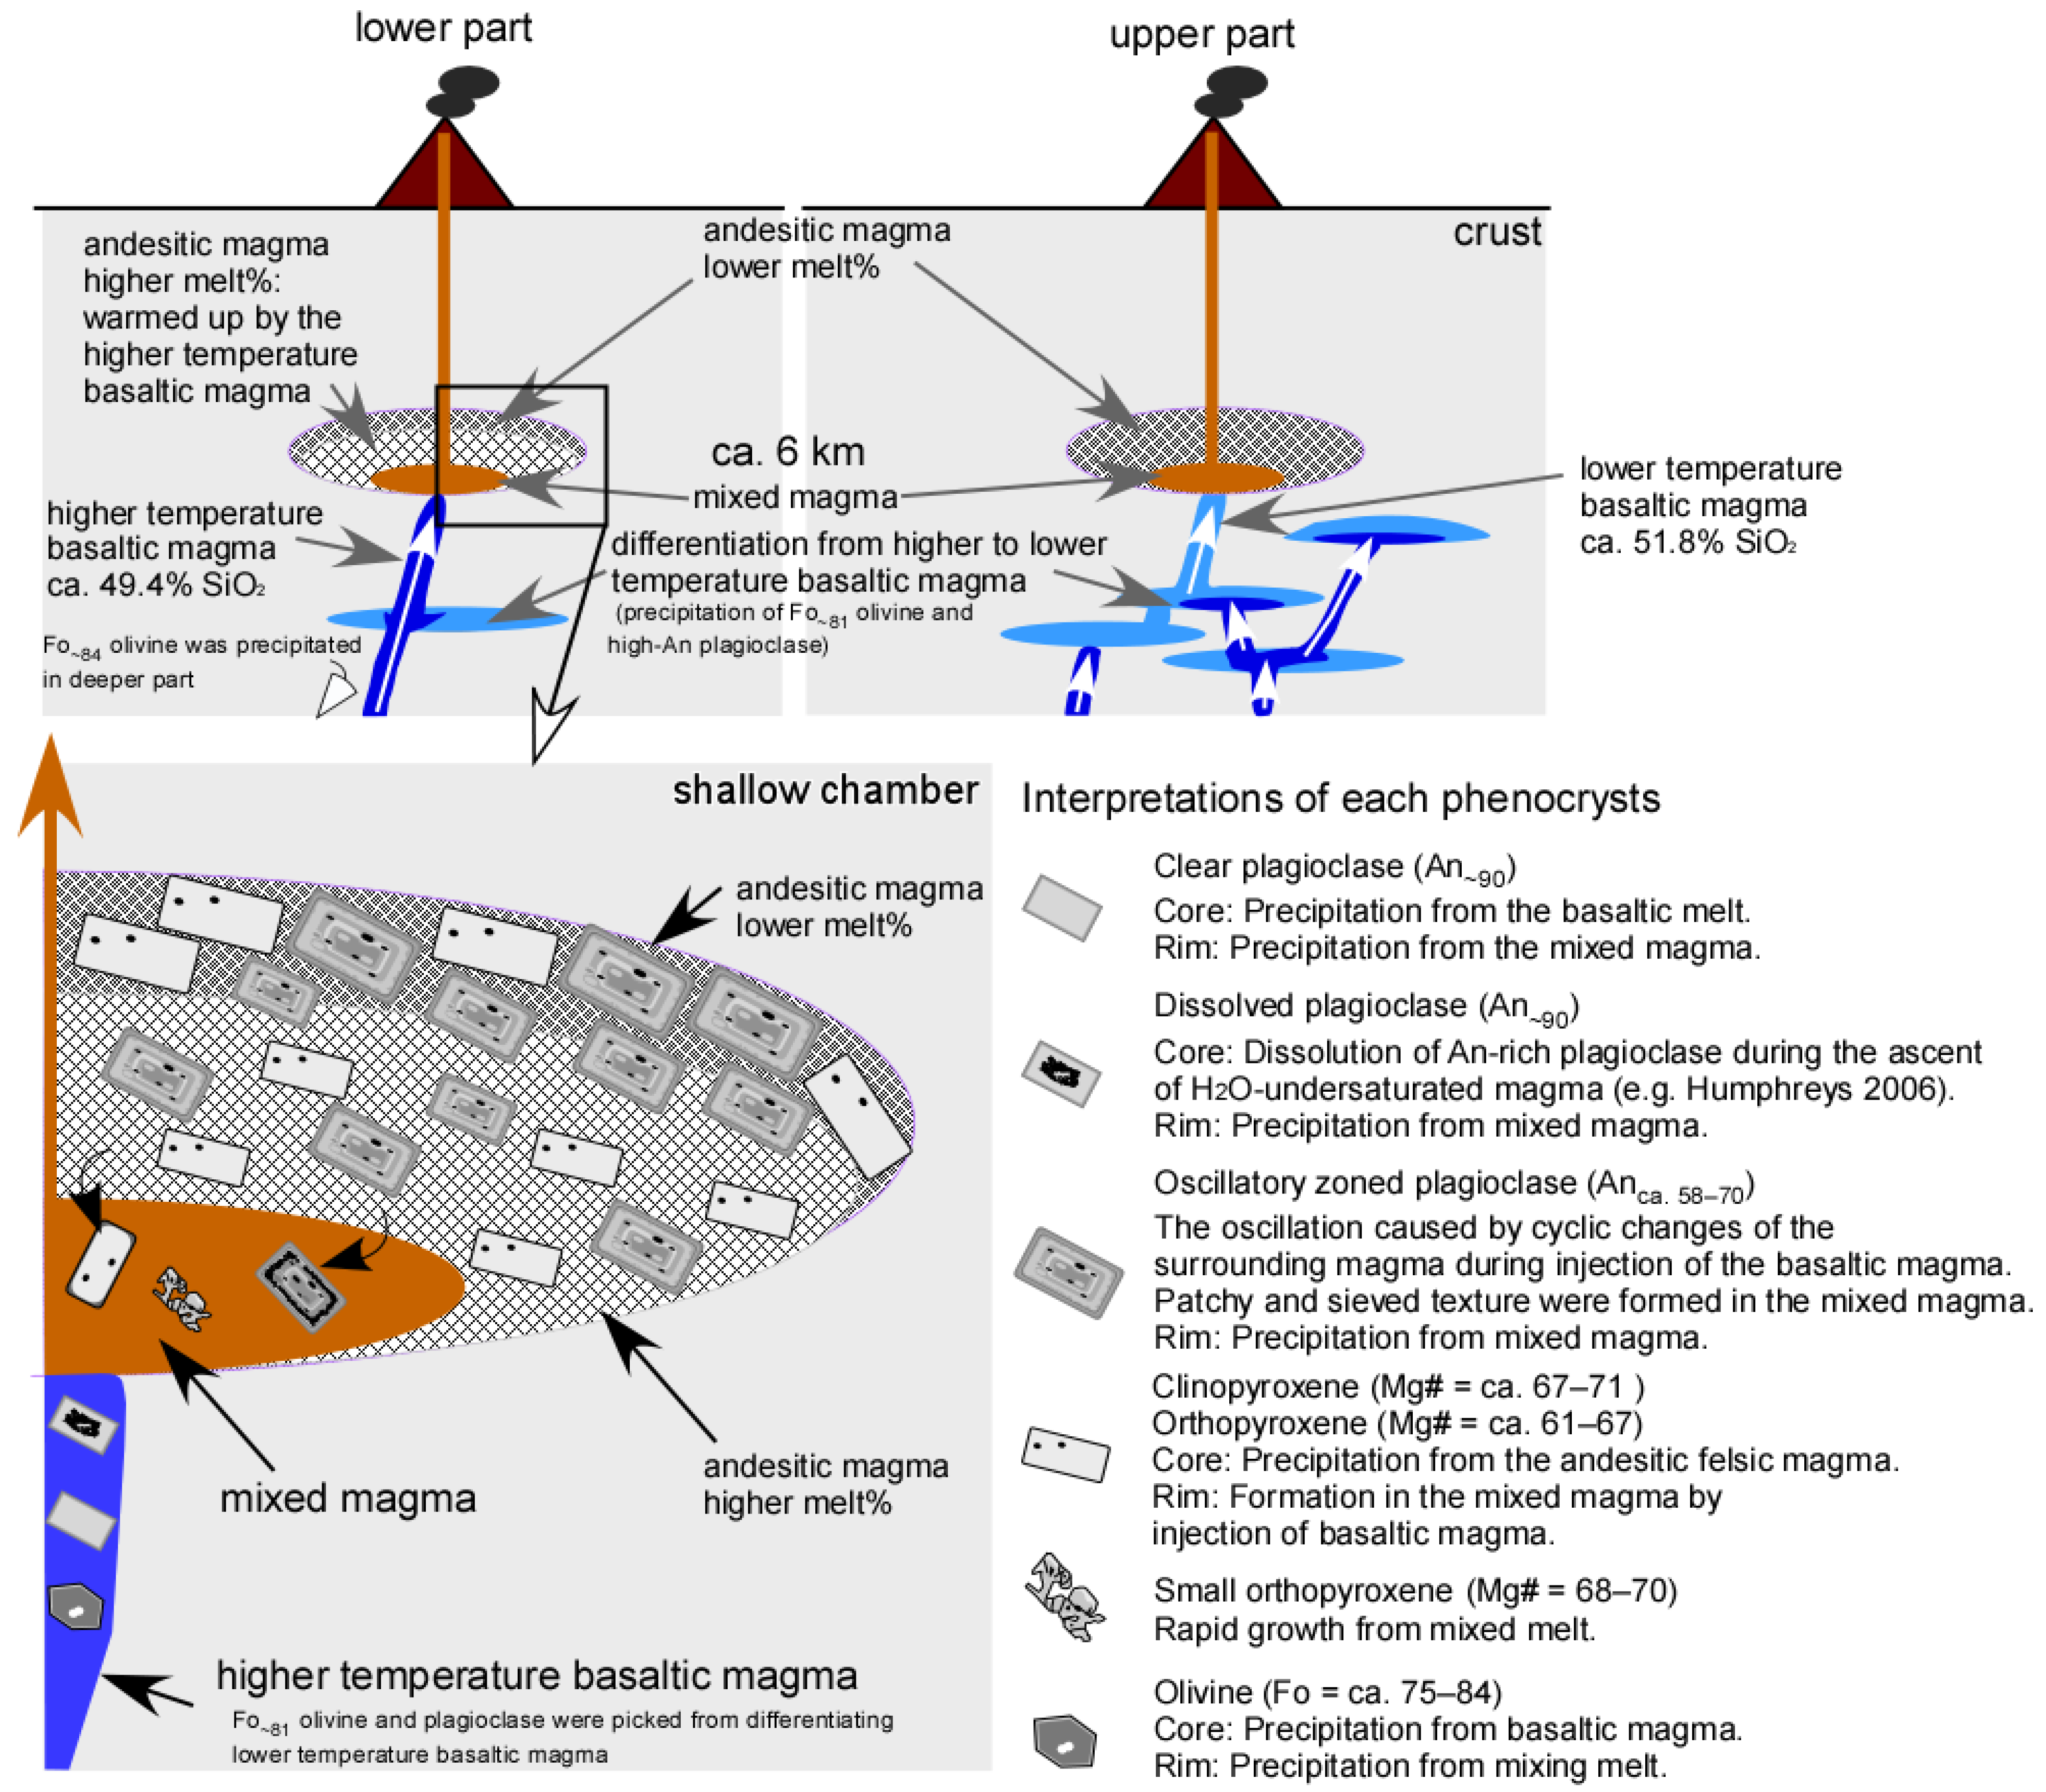
5.4. Formation of Mixed Magma
5.5. Basic Structure of the Magma Feeding System
5.6. Reactivation of Shallow Chamber of the Kattadake Pyroclastics
6. Conclusions
Supplementary Materials
Author Contributions
Funding
Data Availability Statement
Acknowledgments
Conflicts of Interest
References
- Manrique, N.; Samaniego, P.; Médard, E.; Schiavi, F.; Mariño, J.; Liorzou, C. Pre-eruptive magmatic processes associated with the historical (218 ± 14 aBP) explosive eruption of Tutupaca volcano (southern Peru). Bull. Volcanol. 2019, 82, 6. [Google Scholar] [CrossRef] [Green Version]
- Hodge, K.F.; Jellinek, A.M. The Influence of Magma Mixing on the Composition of Andesite Magmas and Silicic Eruption Style. Geophys. Res. Lett. 2020, 47, 13. [Google Scholar] [CrossRef]
- Murphy, M.D.; Sparks, R.S.J.; Barclay, J.; Carroll, M.R.; Brewer, T.S. Remobilization of andesiticmagma by intrusion of maficmagma at the Soufriere Hills volcano, Montserrat, West Indies. J. Petrol. 2000, 41, 21–42. [Google Scholar] [CrossRef] [Green Version]
- Plail, M.; Edmonds, M.; Woods, A.W.; Barclay, J.; Humphreys, M.C.S.; Herd, R.A.; Christopher, T. Mafic enclaves record syn-eruptive basalt intrusion and mixing. Earth Planet. Sci. Lett. 2018, 484, 30–40. [Google Scholar] [CrossRef] [Green Version]
- Izbekov, P.E.; Eichelberger, J.C.; Ivanov, B.V. The 1996 eruption of Karymsky volcano, Kamchatka: Historical record of basaltic replenishment of an andesite reservoir. J. Petrol. 2004, 45, 2325–2345. [Google Scholar] [CrossRef] [Green Version]
- Patia, H.; Eggins, S.M.; Arculus, R.J.; McKee, C.O.; Johnson, R.W.; Bradney, A. The 1994–2001 eruptive period at Rabaul, Papua New Guinea: Petrological and geochemical evidence for basalt injections into a shallow dacite magma reservoir, and significant SO2 flux. J. Volcanol. Geotherm. Res. 2017, 345, 200–217. [Google Scholar] [CrossRef] [Green Version]
- Eichelberger, J.C. Vesiculation of mafic magma during replenishment of silicic magma reservoirs. Nature 1980, 5790, 446–450. [Google Scholar] [CrossRef]
- Snyder, D. Thermal effects of the intrusion of basaltic magma into a more silicic magma chamber and implications for eruption triggering. Earth Planet. Sci. Lett. 2000, 175, 257–273. [Google Scholar] [CrossRef]
- Cooper, K.M. Time scales and temperatures of crystal storage in magma reservoirs: Implications for magma reservoir dynamics. Philos. Trans. R. Soc. A 2019, 377, 20180009. [Google Scholar] [CrossRef] [Green Version]
- Nishi, Y.; Ban, M.; Takebe, M.; Álvarez-Valero, A.M.; Oikawa, T.; Yamasaki, S. Structure of the shallow magma chamber of the active volcano Mt. Zao, NE Japan: Implications for its eruptive time scales. J. Volcanol. Geotherm. Res. 2019, 371, 137–161. [Google Scholar] [CrossRef]
- Singer, B.S.; Costa, F.; Herrin, J.S.; Hildreth, W.; Firestein, J. The timing of compositionally-zoned magma reservoirs and mafic ‘priming’ weeks before the 1912 Novarupta-Katmai rhyolite eruption. Earth Planet. Sci. Lett. 2016, 451, 125–137. [Google Scholar] [CrossRef] [Green Version]
- Morgado, E.; Morgan, D.J.; Castruccio, A.; Ebmeier, S.K.; Parada, M.; Brahm, R.; Harvey, J.; Gutiérrez, F.; Walshaw, R. Old magma and a new, intrusive trigger: Using diffusion chronometry to understand the rapid-onset Calbuco eruption, April 2015 (Southern Chile). Contrib. Mineral. Petrol. 2019, 174, 61. [Google Scholar] [CrossRef] [Green Version]
- Yamamoto, M.; Miura, S.; Ichiki, M.; Hirahara, S. Shallow long-period seismic events at Zao volcano. In Proceedings of the Abstract Annual Meeting Bull. Volcanological Society Japan, A3–13, Fukuoka, Japan, 2–4 November 2014. (In Japanese). [Google Scholar]
- Ban, M.; Oikawa, T.; Yamasaki, S.; Goto, A.; Yamamoto, M.; Miura, S. Prediction of Eruption Courses in Volcanoes Without Eruptions Under Modern Observation System: Example of Zao Volcano. Bull. Volcanol. Soc. Jpn. 2019, 64, 131–138, (In Japanese with English abstract). [Google Scholar]
- Miura, S.; Yamamoto, M.; Demachi, T.; Ichiki, M. Volcanic deformation around Mt. Zao. In Proceedings of the Abstract Annual Meeting Bull. Volcanological Society Japan, A2–05, Akita, Japan, 26–28 September 2018. (In Japanese). [Google Scholar]
- Ban, M.; Oikawa, N.; Yamazaki, S. Geological Map of Zao Volcano; Geological Survey of Japan, AIST: Tsukuba, Japan, 2015. [Google Scholar]
- Yamada, Y.; Kohno, H.; Murata, M. A low dilution fusion method for major and trace element analysis of geological samples. Advan. X-ray Anal. 1995, 26, 33–44, (In Japanese with English abstract). [Google Scholar]
- Murata, M. Major and trace elements analysis of Korea Institute of Energy and Resources igneous rock reference samples using X-ray fluorescence spectrometer. J. Naruto. Coll. Educ. 1993, 8, 37–50. [Google Scholar]
- Gill, J.B. Orogenic Andesites and Plate Tectonics; Springer: Berlin/Heidelberg, Germany; New York, NY, USA, 1981; pp. 1–392. [Google Scholar]
- Miyashiro, A. Volcanic rock series in island arcs and active continental margins. Am. J. Sci. 1974, 274, 321–355. [Google Scholar] [CrossRef]
- Viccaro, M.; Giacomoni, P.P.; Ferlito, C.; Cristofolini, R. Dynamics of magma supply at Mt. Etna volcano (Southern Italy) as revealed by textural and compositional features of plagioclase phenocrysts. Lithos 2010, 116, 77–91. [Google Scholar] [CrossRef]
- Tsuchiyama, A. Dissolution kinetics of plagioclase in the melt of the system diopside-albite-anorthite, and origin of dusty plagioclase in andesites. Contrib. Mineral. Petrol. 1985, 89, 1–16. [Google Scholar] [CrossRef]
- Andújar, J.; Scaillet, B.; Pichavant, M.; Druitt, T.H. Generation Conditions of Dacite and Rhyodacite via the Crystallization of an Andesitic Magma. Implications for the Plumbing System at Santorini (Greece) and the Origin of Tholeiitic or Calc-alkaline Differentiation Trends in Arc Magmas. J. Petrol. 2016, 57, 1887–1920. [Google Scholar] [CrossRef] [Green Version]
- Hildreth, W. Volcanological perspectives on Long Valley, Mammoth Mountain, and Mono Craters: Several contiguous but discrete systems. J. Volcanol. Geotherm. Res. 2004, 136, 169–198. [Google Scholar] [CrossRef]
- Marsh, B.D. Magma chambers. Ann. Rev. Earth Planet. Sci. 1989, 17, 439–474. [Google Scholar] [CrossRef]
- Matsui, Y.; Nishizawa, O. Iron (II)-magnesium exchange equilibrium between olivine and calcium-free pyroxene over a temperature range 800 °C to 1300 °C. Bull. Soc. Fr. Mineral. Cristallogr. 1974, 97, 122–130. [Google Scholar]
- Obata, M.; Banno, S.; Mori, T. The iron-magnesium partitioning between naturally occurring coexisting olivine and Ca-rich clinopyroxene: An application of the sample mixture model to olivine solid solution. Bull. Soc. Fr. Mineral. Cristallogr. 1974, 97, 101–107. [Google Scholar]
- Humphreys, M.C.S.; Blundy, J.D.; Sparks, R.S.J. Magma evolution and open-system processes at Shiveluch volcano: Insights from phenocryst zoning. J. Petrol. 2006, 47, 2303–2334. [Google Scholar] [CrossRef] [Green Version]
- Gualda, G.A.R.; Ghiorso, M.S.; Lemons, R.V.; Carley, T.L. Rhyolite-MELTS: A modified calibration of MELTS optimized for silica-rich, fluid-bearing magmatic systems. J. Petrol. 2012, 53, 875–890. [Google Scholar] [CrossRef] [Green Version]
- Sack, R.O.; Carmichael, I.S.E.; Rivers, M.; Ghiorso, M.S. Ferric-ferrous equilibria in nature silicate liquids at 1 bar. Contrib. Mineral. Petrol. 1980, 75, 369–376. [Google Scholar] [CrossRef]
- Ban, M.; Sagawa, H.; Miura, K.; Hirotani, S. Evidence for a short lived stratified magma chamber: Petrology of the Z-To 5 tephra layer (c. 5.8 ka) at Zao volcano, NE Japan. In Dynamics of Crustal Magma Transfer, Storage and Differentiation; Annen, C., Zellmer, G.F., Eds.; Geological Society: London, UK, 2008; Volume 304, pp. 149–168. [Google Scholar]
- Brey, G.; Köhler, T. Geothermobarometry in four-phase lherzolites II. New thermobarometers, and practical assessment of existing thermobarometers. J. Petrol. 1990, 31, 1353–1378. [Google Scholar] [CrossRef]
- Sisson, T.W.; Grove, T.L. Experimental investigations of the role of H2O in calc- alkaline differentiation and subduction zone magmatism. Contrib. Mineral. Petrol. 1993, 113, 143–166. [Google Scholar] [CrossRef]


| Part | Lower | Upper | |||||||||||
|---|---|---|---|---|---|---|---|---|---|---|---|---|---|
| Sample Name | 051027-501 | 050916-301 * | 050916-401 | 06KTS10-2 * | TZ2 | Z2-31 * | Z2-32 * | SS32 * | 051027-3 * | SC-1 | 051027-4 * | 0510278-2 | SF-201 * |
| Total phenocryst (vol%) | 27.9 | 26.1 | 24.8 | 22.8 | 19.9 | 22.9 | 28.3 | 28.4 | 26.3 | 20.5 | 24.6 | 26.7 | 26.9 |
| Plagioclase (vol%) | 21.6 | 16.4 | 17.1 | 17 | 12.1 | 15.8 | 18.1 | 18.6 | 22.6 | 13.4 | 16.8 | 14.5 | 20.0 |
| Orthopyroxene + clinopyroxene (vol%) | 5.8 | 9.8 | 7.0 | 5.9 | 4.4 | 7.1 | 10.3 | 9.8 | 3.7 | 7.0 | 7.2 | 7.8 | 6.9 |
| Orthopyroxene (vol%) | 4.1 | - | 5.9 | - | 3.7 | - | - | - | - | 5.2 | - | 4.9 | - |
| Clinopyroxene (vol%) | 1.7 | - | 1.1 | - | 0.7 | - | - | - | - | 1.8 | - | 2.9 | - |
| Olivine (vol%) | 0.5 | 0.0 | 0.6 | trace | 3.4 | trace | trace | 0.0 | 0.0 | 0.0 | 0.0 | 1.8 | 0.0 |
| Fe-Ti oxides (vol%) | 0.1 | trace | 0.6 | trace | trace | trace | trace | trace | trace | trace | trace | 0.2 | trace |
| Part | Lower | Upper | |||||||||||||
| Layer | 2 | 2 | 3 | 5 | 7 | 7 | 7 | 7 | 7 | 8 | 8 | 8 | 8 | 8 | 9 |
| Sample Name | 050916-301 | 06KTS302 | 06KTS8-1 | 0511039-1 | 06KTS10-3 | 06KTS10-2 | Z2-32 | Z2-31 | TZ2 | KT2-201 | KT2-202 | KT2-101 | KT2-102 | KT2-103 | SS32 |
| Longitude(N) | 38°07′56.2″ | 38°07′56.2″ | 38°07′56.1″ | 38°07′55.7″ | 38°07′56.3″ | 38°07′56.3″ | 38°07′56.3″ | 38°07′56.3″ | 38°07′56.3″ | 38°07′54.1″ | 38°07′54.1″ | 38°07′54.1″ | 38°07′54.1″ | 38°07′54.1″ | 38°07′55.1″ |
| Latitude(E) | 140°26′55.4″ | 140°26′55.4″ | 140°26′54.3″ | 140°26′52.6″ | 140°26′50.6″ | 140°26′50.6″ | 140°26′50.6″ | 140°26′50.6″ | 140°26′50.6″ | 140°27′02.0″ | 140°27′02.0″ | 140°27′02.0″ | 140°27′02.0″ | 140°27′02.0″ | 140°27′03.7″ |
| Major (wt%) | |||||||||||||||
| SiO2 | 56.73 | 56.57 | 56.81 | 56.91 | 57.52 | 57.04 | 58.13 | 56.72 | 56.57 | 56.17 | 55.85 | 55.84 | 55.91 | 56.12 | 56.57 |
| TiO2 | 0.89 | 0.89 | 0.89 | 0.89 | 0.87 | 0.87 | 0.89 | 0.89 | 0.87 | 0.90 | 0.90 | 0.88 | 0.89 | 0.90 | 0.88 |
| Al2O3 | 17.61 | >17.03 | >17.90 | >17.40 | >16.16 | >16.47 | >16.57 | >17.25 | >16.58 | >17.28 | >17.39 | >17.03 | >17.04 | >17.53 | >17.58 |
| FeOt | 8.78 | >8.67 | >7.92 | >8.06 | >8.56 | >8.32 | >8.09 | >8.59 | >8.46 | >8.83 | >8.73 | >8.83 | >8.92 | >8.63 | >8.55 |
| MnO | 0.14 | 0.15 | 0.14 | 0.15 | 0.16 | 0.15 | 0.14 | 0.14 | 0.15 | 0.16 | 0.15 | 0.16 | 0.15 | 0.15 | 0.15 |
| MgO | 4.59 | 4.73 | 4.83 | 4.91 | 5.26 | 5.29 | 4.39 | 5.16 | 5.71 | 5.08 | 4.96 | 5.16 | 5.10 | 4.81 | 4.78 |
| CaO | 6.98 | 7.74 | 7.06 | 7.29 | 7.67 | 8.13 | 7.35 | 7.77 | 7.97 | 8.44 | 8.63 | 8.51 | 8.92 | 8.78 | 8.16 |
| Na2O | 2.41 | 2.58 | 2.30 | 2.43 | 2.68 | 2.72 | 2.77 | 2.66 | 2.73 | 2.54 | 2.61 | 2.51 | 2.57 | 2.61 | 2.47 |
| K2O | 0.95 | 1.03 | 0.92 | 0.99 | 1.09 | 1.04 | 1.18 | 0.92 | 1.01 | 0.82 | 0.81 | 0.80 | 0.81 | 0.82 | 0.79 |
| P2O5 | 0.11 | 0.13 | 0.13 | 0.11 | 0.12 | 0.12 | 0.12 | 0.11 | 0.10 | 0.12 | 0.12 | 0.12 | 0.12 | 0.13 | 0.09 |
| Total | 99.22 | 99.51 | 98.90 | 99.15 | 100.08 | 100.14 | 99.63 | 100.21 | 100.18 | 100.34 | 100.16 | 99.83 | 100.43 | 100.48 | 100.05 |
| Trace (ppm) | |||||||||||||||
| Ba | 360 | 365 | 310 | 318 | 309 | 299 | 351 | 292 | 299 | 264 | 255 | 250 | 246 | 256 | 243 |
| Rb | 29 | 30 | 29 | 28 | 30 | 27 | 31 | 24 | 25 | 23 | 24 | 22 | 22 | 23 | 21 |
| Sr | 283 | 304 | 294 | 301 | 280 | 295 | 280 | 306 | 304 | 320 | 327 | 327 | 324 | 332 | 301 |
| Zr | 104 | 104 | 104 | 103 | 107 | 103 | 118 | 104 | 101 | 93 | 90 | 90 | 90 | 91 | 92 |
| Nb | 3.8 | 3.5 | 3.2 | 3.5 | 3.7 | 3.2 | 3.6 | 3.2 | 3.8 | 2.7 | 3.2 | 2.8 | 2.9 | 3.3 | 3.1 |
| Y | 30 | 31 | 28 | 26 | 27 | 26 | 29 | 33 | 25 | 25 | 23 | 25 | 24 | 24 | 24 |
| V | 213 | 217 | 221 | 214 | 220 | 220 | 206 | 221 | 203 | 243 | 236 | 248 | 237 | 248 | 218 |
| Cr | 71 | 68 | 69 | 67 | 83 | 96 | 66 | 72 | 101 | 61 | 57 | 62 | 56 | 56 | 54 |
| Ni | 42 | 37 | 38 | 37 | 41 | 43 | 32 | 36 | 48 | 31 | 31 | 30 | 32 | 30 | 30 |
| Part | Upper | ||||||||||||||
| Layer | 11 | 13 | 13 | 14 | 14 | 15 | 16 | 16 | 17 | 17 | 17 | 17 | 18 | 18 | 18 |
| Sample Name | 051027-1 | 051027-2 | 051027-3 | SC-1 | SC-2 | SD-1 | 051027-4 | 0510278-2 | SF-1 | SF-201 | SF-202 | SF-203 | 0510277-1 | 06KTS7-1B | 06KTS7-1A |
| Longitude(N) | 38°07′55.8″ | 38°07′55.8″ | 38°07′55.8″ | 38°07′56.0″ | 38°07′56.0″ | 38°07′56.3″ | 38°07′56.4″ | 38°07′56.4″ | 38°07′55.9″ | 38°07′55.9″ | 38°07′55.9″ | 38°07′55.9″ | 38°07′55.9″ | 38°07′55.89″ | 38°07′55.9″ |
| Latitude (E) | 140°27′02.0″ | 140°27′02.0″ | 140°27′02.0″ | 140°27′01.0″ | 140°27′01.0″ | 140°26′59.8″ | 140°26′58.5″ | 140°26′58.5″ | 140°26′57.2″ | 140°26′57.2″ | 140°26′57.2″ | 140°26′57.2″ | 140°26′55.5″ | 140°26′55.5″ | 140°26′55.5″ |
| Major (wt%) | |||||||||||||||
| SiO2 | 55.89 | 55.49 | 55.65 | 55.39 | 55.56 | 55.30 | 55.56 | 54.99 | 56.86 | 55.72 | 56.77 | 56.82 | 55.89 | 55.94 | 56.40 |
| TiO2 | 0.88 | 0.91 | 0.92 | 0.90 | 0.89 | 0.91 | 0.92 | 0.87 | 0.90 | 0.89 | 0.89 | 0.88 | 0.88 | 0.89 | 0.88 |
| Al2O3 | 17.26 | 17.31 | 17.71 | 17.14 | 16.92 | 18.10 | 17.37 | 17.69 | 17.70 | 17.30 | 17.61 | 17.08 | 17.26 | 17.50 | 17.42 |
| FeOt | 8.82 | 8.75 | 8.51 | 8.83 | 9.00 | 8.55 | 8.74 | 8.72 | 8.34 | 9.27 | 8.64 | 8.49 | 8.82 | 8.61 | 8.48 |
| MnO | 0.16 | 0.16 | 0.15 | 0.16 | 0.16 | 0.15 | 0.16 | 0.16 | 0.15 | 0.15 | 0.15 | 0.15 | 0.16 | 0.15 | 0.15 |
| MgO | 5.30 | 5.05 | 4.91 | 5.48 | 5.37 | 4.86 | 5.13 | 5.34 | 4.46 | 5.04 | 4.80 | 4.84 | 5.30 | 4.89 | 4.75 |
| CaO | 8.58 | 9.02 | 8.76 | 8.13 | 8.70 | 8.45 | 8.71 | 8.92 | 7.70 | 8.54 | 7.10 | 8.31 | 8.58 | 8.18 | 8.13 |
| Na2O | 2.62 | 2.51 | 2.58 | 2.33 | 2.50 | 2.50 | 2.49 | 2.48 | 2.59 | 2.57 | 2.44 | 2.64 | 2.62 | 2.59 | 2.63 |
| K2O | 0.80 | 0.80 | 0.85 | 0.81 | 0.83 | 0.82 | 0.83 | 0.69 | 0.93 | 0.76 | 0.89 | 1.01 | 0.80 | 0.84 | 0.88 |
| P2O5 | 0.09 | 0.10 | 0.10 | 0.10 | 0.11 | 0.10 | 0.10 | 0.09 | 0.10 | 0.11 | 0.11 | 0.13 | 0.09 | 0.11 | 0.12 |
| Total | 100.43 | 100.13 | 100.17 | 99.30 | 100.04 | 99.77 | 100.03 | 99.98 | 99.76 | 100.35 | 99.40 | 100.35 | 100.43 | 99.70 | 99.84 |
| Trace (ppm) | |||||||||||||||
| Ba | 236 | 261 | 253 | 248 | 258 | 262 | 245 | 213 | 280 | 248 | 286 | 310 | 224 | 259 | 261 |
| Rb | 19 | 20 | 22 | 22 | 22 | 23 | 22 | 17 | 25 | 21 | 27 | 29 | 20 | 22 | 25 |
| Sr | 301 | 313 | 326 | 311 | 306 | 319 | 318 | 315 | 300 | 295 | 274 | 320 | 301 | 299 | 298 |
| Zr | 87 | 88 | 92 | 88 | 89 | 89 | 90 | 81 | 103 | 86 | 100 | 102 | 90 | 94 | 99 |
| Nb | 2.8 | 3.3 | 3.6 | 3.0 | 3.3 | 2.9 | 3.4 | 2.9 | 3.5 | 3.0 | 3.7 | 3.4 | 3.2 | 3.0 | 3.1 |
| Y | 24 | 24 | 25 | 23 | 24 | 24 | 24 | 24 | 28 | 26 | 26 | 29 | 25 | 25 | 26 |
| V | 236 | 233 | 237 | 241 | 250 | 221 | 231 | 224 | 222 | 234 | 231 | 230 | 220 | 232 | 221 |
| Cr | 50 | 64 | 56 | 63 | 62 | 57 | 62 | 72 | 49 | 48 | 57 | 67 | 61 | 57 | 51 |
| Ni | 35 | 30 | 29 | 35 | 34 | 28 | 30 | 43 | 30 | 35 | 35 | 36 | 36 | 36 | 34 |
| Phenocryst | Orthopyroxene | ||||||||
|---|---|---|---|---|---|---|---|---|---|
| Type | Reversed/Unzoned | Reversed/Unzoned | Reversed/Unzoned | Small | |||||
| Layer | 5 | 7 | 14 | 5 | |||||
| Analysis Date | 13 January 2007 | 07 February 2004 | 29 January 2002 | 13 January 2007 | |||||
| Number | 1C | R | 5C | R | 20C | R | 5C | C2 | R |
| Point | Core | Rim | Core | Rim | Core | Rim | Core | Mantle | Rim |
| SiO2 | 53.83 | 54.59 | 53.65 | 53.84 | 52.76 | 54.64 | 53.87 | 54.10 | 54.21 |
| TiO2 | 0.26 | 0.31 | 0.34 | 0.43 | 0.30 | 0.25 | 0.33 | 0.25 | 0.32 |
| Al2O3 | 0.90 | 0.85 | 1.01 | 1.22 | 1.04 | 1.93 | 1.10 | 1.55 | 0.77 |
| FeO | 20.84 | 17.80 | 21.58 | 18.80 | 20.82 | 15.41 | 18.08 | 16.70 | 20.05 |
| MnO | 0.42 | 0.47 | 0.61 | 0.38 | 0.54 | 0.52 | 0.41 | 0.38 | 0.38 |
| MgO | 22.36 | 25.06 | 21.43 | 23.26 | 22.19 | 26.07 | 23.92 | 25.25 | 22.70 |
| CaO | 1.94 | 1.83 | 1.99 | 2.07 | 1.95 | 2.24 | 1.88 | 1.73 | 1.85 |
| Na2O | 0.02 | 0.02 | 0.02 | 0.08 | 0.05 | 0.19 | 0.05 | 0.06 | 0.02 |
| K2O | 0.00 | 0.00 | 0.00 | 0.00 | 0.00 | 0.00 | 0.00 | 0.00 | 0.00 |
| Cr2O3 | 0.01 | 0.03 | 0.02 | 0.02 | 0.00 | 0.05 | 0.05 | 0.16 | 0.00 |
| NiO | 0.00 | 0.00 | 0.00 | 0.04 | 0.00 | 0.11 | 0.00 | 0.03 | 0.00 |
| Total | 100.59 | 100.97 | 100.66 | 100.14 | 99.66 | 101.40 | 99.70 | 100.21 | 100.30 |
| Mg# | 66 | 72 | 64 | 69 | 66 | 75 | 70 | 73 | 67 |
| Phenocryst | Clinopyroxene | Phenocryst | Olivine | |||||||
|---|---|---|---|---|---|---|---|---|---|---|
| Layer | 5 | 5 | Layer | 7 | 16 | |||||
| Analysis Date | 17 January 2007 | 11 January 2000 | Analysis Date | 07 February 2004 | 17 November 2010 | |||||
| Number | 13C | R | 5C | R | Number | 8C | R | 10C | C2 | R |
| Point | Core | Rim | Core | Rim | Point | Core | Rim | Core | Mantle | Rim |
| SiO2 | 51.78 | 51.69 | 52.20 | 52.31 | SiO2 | 41.15 | 39.92 | 38.91 | 39.72 | 39.36 |
| TiO2 | 0.53 | 0.61 | 0.53 | 0.55 | TiO2 | 0.00 | 0.01 | 0.00 | 0.00 | 0.01 |
| Al2O3 | 2.14 | 2.42 | 1.73 | 1.91 | Al2O3 | 0.01 | 0.01 | 0.03 | 0.02 | 0.01 |
| FeO | 12.24 | 9.65 | 11.55 | 9.25 | FeO | 15.23 | 20.46 | 23.21 | 18.18 | 20.25 |
| MnO | 0.34 | 0.28 | 0.31 | 0.32 | MnO | 0.24 | 0.38 | 0.38 | 0.29 | 0.27 |
| MgO | 14.13 | 15.05 | 14.32 | 14.94 | MgO | 44.64 | 40.32 | 38.79 | 43.31 | 41.28 |
| CaO | 18.17 | 18.73 | 19.37 | 19.50 | CaO | 0.15 | 0.20 | 0.13 | 0.17 | 0.15 |
| Na2O | 0.21 | 0.21 | 0.20 | 0.22 | Na2O | 0.00 | 0.01 | 0.00 | 0.00 | 0.01 |
| K2O | 0.00 | 0.00 | 0.00 | 0.00 | K2O | 0.00 | 0.00 | 0.00 | 0.00 | 0.00 |
| Cr2O3 | 0.03 | 0.11 | 0.01 | 0.07 | Cr2O3 | 0.03 | 0.00 | 0.01 | 0.00 | 0.00 |
| NiO | 0.05 | 0.02 | 0.04 | 0.00 | NiO | 0.09 | 0.06 | 0.03 | 0.09 | 0.15 |
| Total | 99.62 | 98.77 | 100.27 | 99.07 | Total | 101.54 | 101.39 | 101.48 | 101.79 | 101.49 |
| Mg# | 67 | 74 | 69 | 74 | Fo% | 84 | 78 | 75 | 81 | 78 |
| Phenocryst | Plagioclase | ||||||||||||||||
|---|---|---|---|---|---|---|---|---|---|---|---|---|---|---|---|---|---|
| Type | Oscillatory | Oscillatory | Oscillatory | Oscillatory | Clear/Dissolved | Clear/Dissolved | |||||||||||
| Layer | 5 | 9 | 14 | 16 | 7 | 7 | |||||||||||
| Analysis Date | 12 December 2006 | 11 November 2006 | 13 October 2006 | 11 October 2006 | 30 August 2006 | 11 October 2006 | |||||||||||
| Number | 12C | C2 | R | 5C | C2 | R | 1C | C2 | R | 8C | C2 | R | 12C | R | 3C | C2 | R |
| Point | An-rich | An-poor | Rim | An-poor | An-rich | Rim | An-poor | An-rich | Rim | An-poor | An-rich | Rim | Core | Rim | Core | Mantle | Rim |
| SiO2 | 48.57 | 51.71 | 49.62 | 51.04 | 47.29 | 53.40 | 52.19 | 49.51 | 51.09 | 49.69 | 48.14 | 48.60 | 45.08 | 51.94 | 44.33 | 52.27 | 52.25 |
| Al2O3 | 30.46 | 28.63 | 29.72 | 28.75 | 31.81 | 28.43 | 28.41 | 30.50 | 29.16 | 29.06 | 30.30 | 30.27 | 33.74 | 29.06 | 34.03 | 27.81 | 28.06 |
| Fe2O3 | 0.78 | 0.76 | 0.83 | 0.99 | 0.88 | 0.99 | 0.94 | 0.88 | 0.93 | 0.82 | 0.85 | 0.98 | 0.63 | 1.11 | 0.58 | 0.81 | 0.96 |
| MgO | 0.08 | 0.09 | 0.11 | 0.11 | 0.07 | 0.09 | 0.10 | 0.10 | 0.11 | 0.10 | 0.08 | 0.08 | 0.08 | 0.17 | 0.04 | 0.10 | 0.09 |
| CaO | 14.67 | 12.66 | 13.96 | 13.36 | 15.95 | 12.33 | 12.79 | 14.76 | 13.25 | 13.84 | 14.88 | 14.70 | 18.00 | 13.57 | 18.62 | 11.85 | 11.59 |
| Na2O | 2.71 | 3.72 | 3.15 | 3.41 | 1.88 | 3.88 | 3.87 | 3.02 | 3.63 | 3.48 | 2.83 | 2.72 | 1.16 | 3.43 | 0.73 | 4.03 | 4.21 |
| K2O | 0.11 | 0.17 | 0.11 | 0.15 | 0.07 | 0.24 | 0.17 | 0.12 | 0.20 | 0.10 | 0.09 | 0.09 | 0.00 | 0.17 | 0.02 | 0.20 | 0.29 |
| Total | 97.37 | 97.75 | 97.50 | 97.80 | 97.95 | 99.37 | 98.47 | 98.89 | 98.37 | 97.09 | 97.16 | 97.43 | 98.69 | 99.46 | 98.37 | 97.07 | 97.45 |
| An% | 74 | 65 | 71 | 68 | 82 | 63 | 64 | 72 | 66 | 68 | 74 | 75 | 90 | 68 | 93 | 61 | 59 |
| Estimated End-Member Compositions | Potential Data Sets for the Felsic End-Member | |||||||
|---|---|---|---|---|---|---|---|---|
| Felsic | Mafic (Lower) | Mafic (Upper) | Felsic 1 | Felsic 2 | Felsic 3 | Felsic 4 | Felsic 5 | |
| Major (wt%) | ||||||||
| SiO2 | 59.00–61.00 | 49.40 | 51.80 | 59.00 | 60.00 | 61.00 | 62.00 | 63.00 |
| TiO2 | 0.89–0.89 | 0.90 | 0.90 | 0.89 | 0.89 | 0.89 | 0.90 | 0.90 |
| Al2O3 | 15.60–16.20 | 19.00 | 18.70 | 16.20 | 15.90 | 15.60 | 15.30 | 15.00 |
| FeOt | 7.65–8.05 | 9.70 | 9.50 | 8.05 | 7.85 | 7.65 | 7.45 | 7.25 |
| MnO | 0.13–0.14 | 0.20 | 0.20 | 0.14 | 0.13 | 0.13 | 0.12 | 0.12 |
| MgO | 3.40–4.20 | 9.10 | 6.50 | 4.20 | 3.80 | 3.40 | 3.00 | 2.60 |
| CaO | 6.60–7.20 | 10.00 | 10.20 | 7.20 | 6.90 | 6.60 | 6.30 | 6.00 |
| Na2O | 2.85–3.09 | 1.60 | 2.10 | 2.85 | 2.97 | 3.09 | 3.21 | 3.33 |
| K2O | 1.22–1.46 | 0.10 | 0.20 | 1.22 | 1.34 | 1.46 | 1.58 | 1.70 |
| P2O5 | 0.13–0.13 | 0.10 | 0.10 | 0.13 | 0.13 | 0.13 | 0.14 | 0.14 |
| Trace (ppm) | ||||||||
| Ba | 450 | 30 | 70 | |||||
| Rb | 40 | 2 | 6 | |||||
| Sr | 200 | 450 | 400 | |||||
| Zr | 150 | 15 | 40 | |||||
| Nb | 5.1 | 1.5 | 1.0 | |||||
| Y | 33 | 15 | 18 | |||||
| V | 180 | 300 | 280 | |||||
| Cr | 45 | 140 | 75 | |||||
| Ni | 28 | 60 | 37 | |||||
| Temp. (℃) | 960–980 | 1170 ± 20 | 1100 ± 30 | |||||
| Pressure (kb) | 1.9–3.5 | 1.0–4.7 | 1.0–2.9 | |||||
| Water (%) | 1.9–3.4 | 1.3–2.8 | 1.7–2.6 | |||||
Publisher’s Note: MDPI stays neutral with regard to jurisdictional claims in published maps and institutional affiliations. |
© 2021 by the authors. Licensee MDPI, Basel, Switzerland. This article is an open access article distributed under the terms and conditions of the Creative Commons Attribution (CC BY) license (https://creativecommons.org/licenses/by/4.0/).
Share and Cite
Takebe, M.; Ban, M.; Sato, M.; Nishi, Y. The Temporal Variation of Magma Plumbing System of the Kattadake Pyroclastics in the Zao Volcano, Northeastern Japan. Minerals 2021, 11, 430. https://doi.org/10.3390/min11040430
Takebe M, Ban M, Sato M, Nishi Y. The Temporal Variation of Magma Plumbing System of the Kattadake Pyroclastics in the Zao Volcano, Northeastern Japan. Minerals. 2021; 11(4):430. https://doi.org/10.3390/min11040430
Chicago/Turabian StyleTakebe, Mirai, Masao Ban, Motohiro Sato, and Yuki Nishi. 2021. "The Temporal Variation of Magma Plumbing System of the Kattadake Pyroclastics in the Zao Volcano, Northeastern Japan" Minerals 11, no. 4: 430. https://doi.org/10.3390/min11040430