
Quadratic Mathematical Modeling of Sustainable Dry Beneficiation of Kaolin

 ,
,
Abstract
:1. Introduction
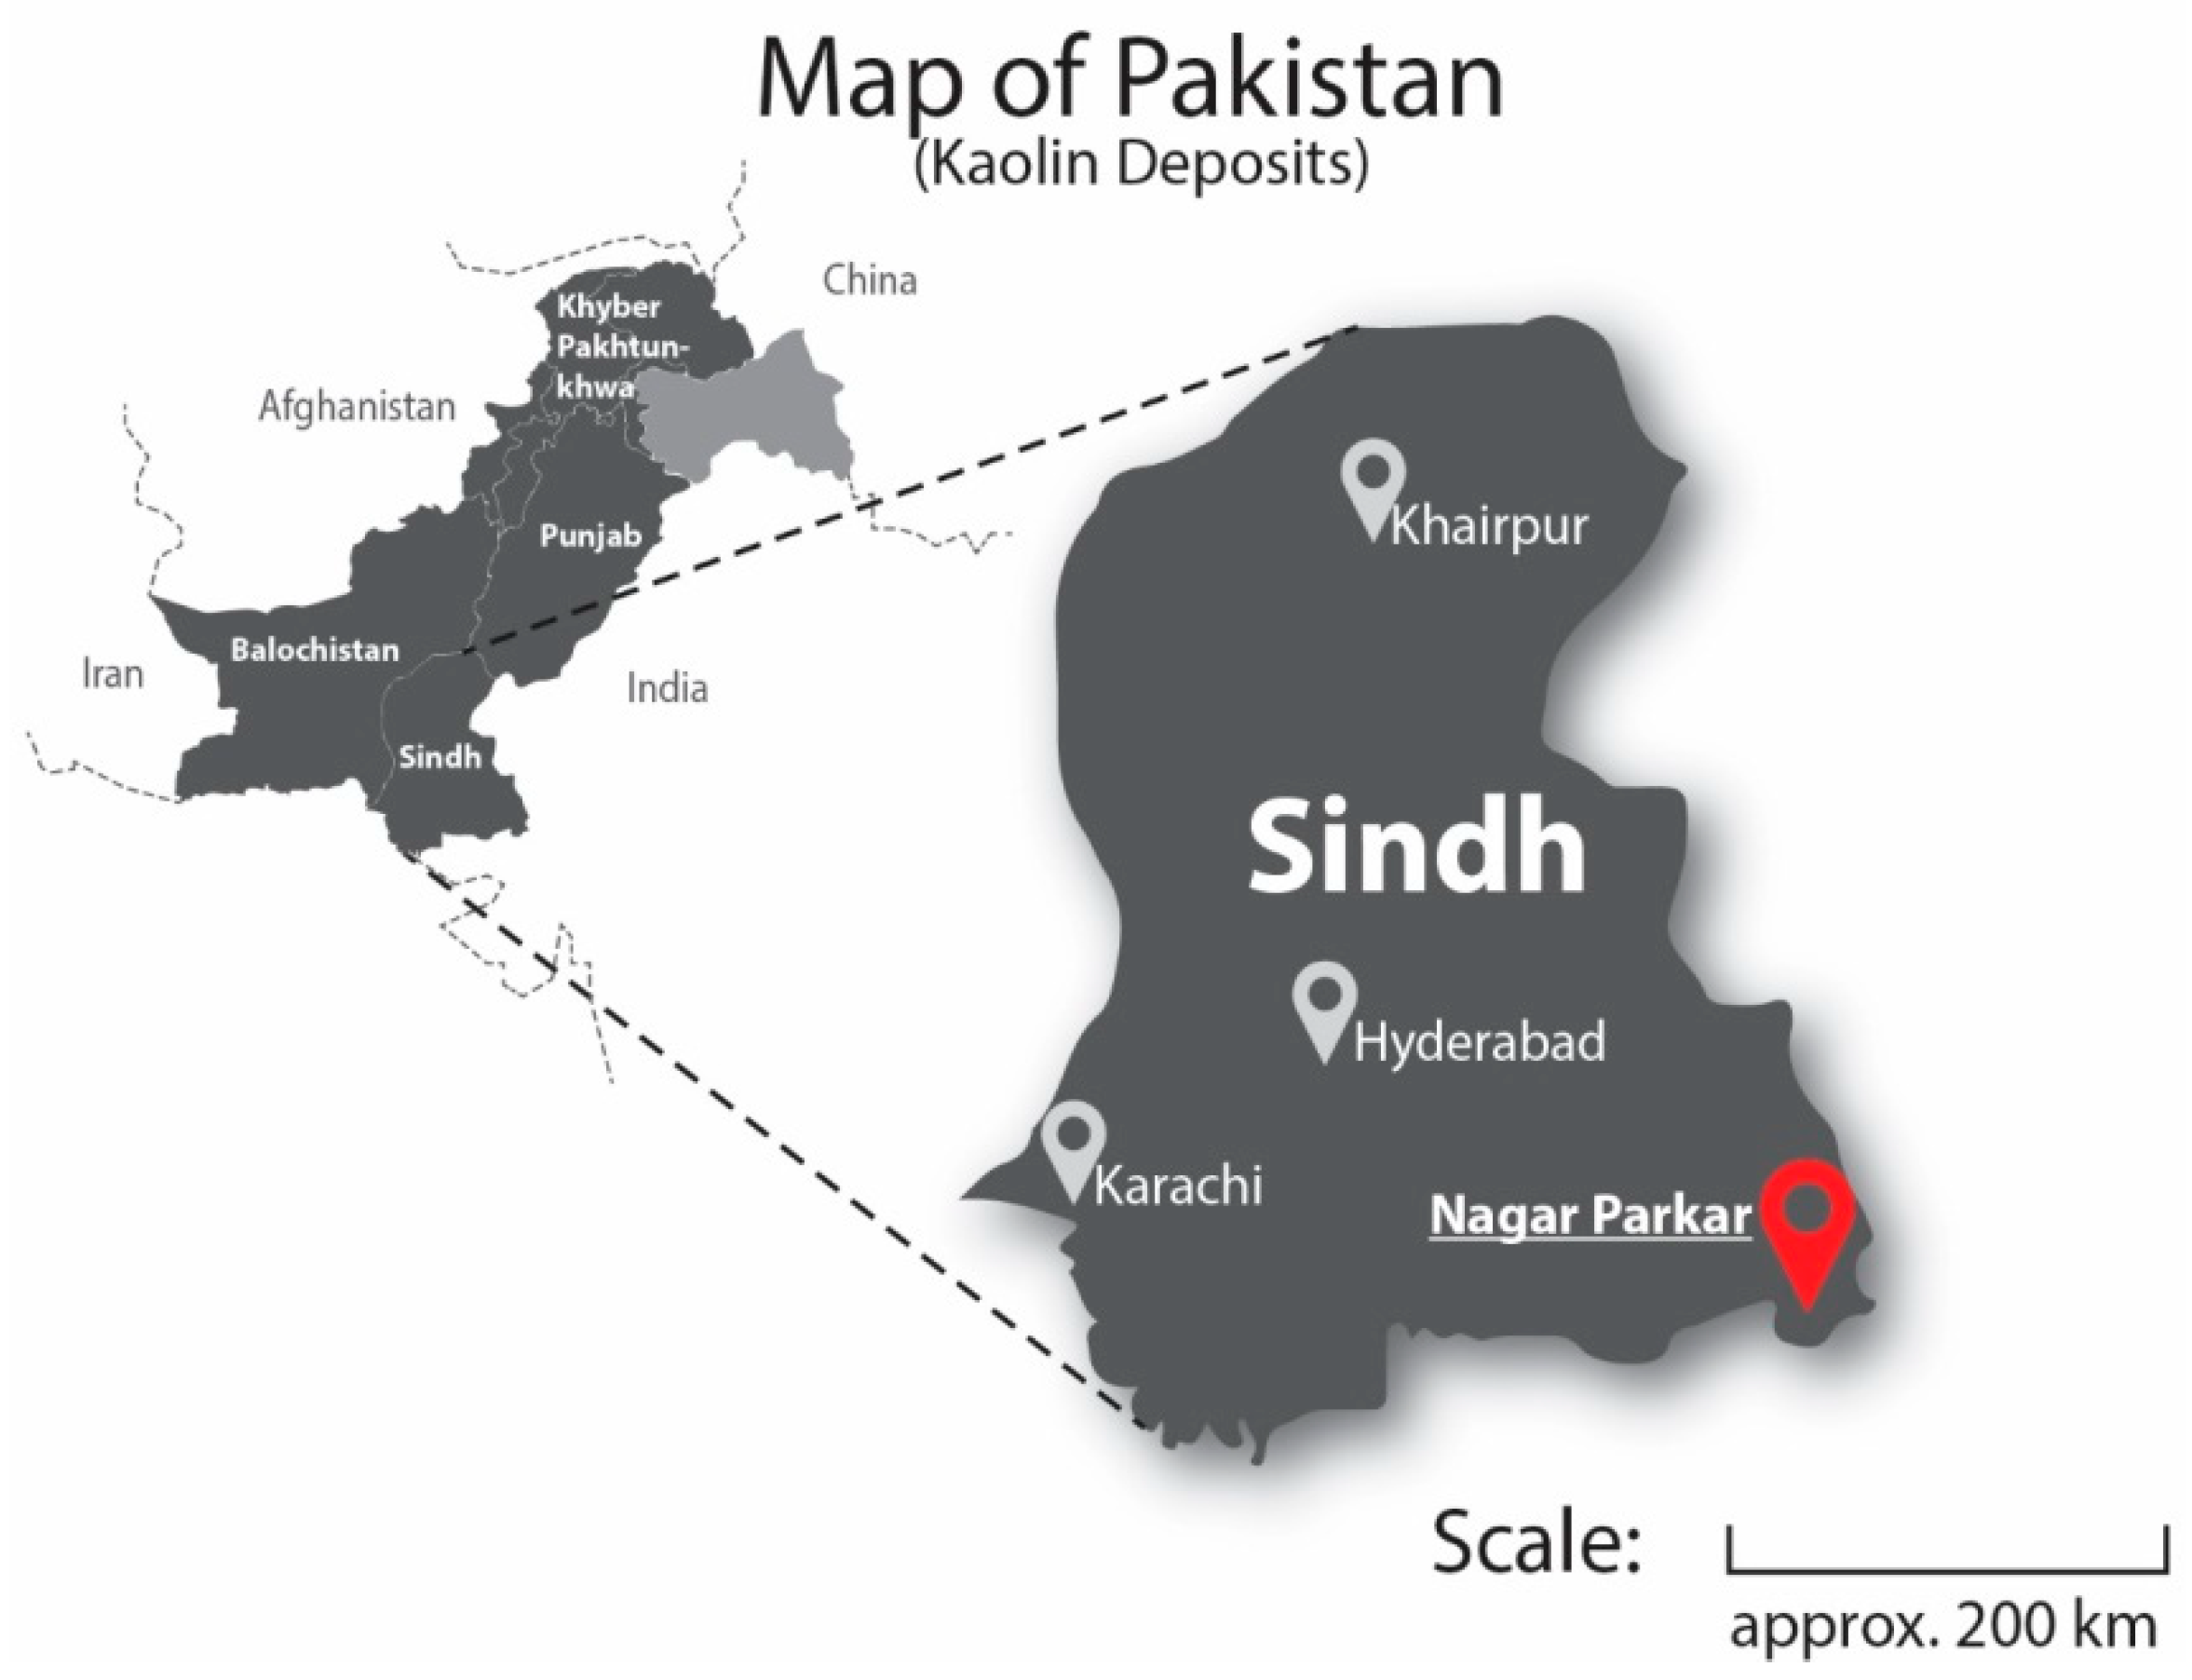
2. Geology of Deposit
3. Materials and Methods
3.1. Materials
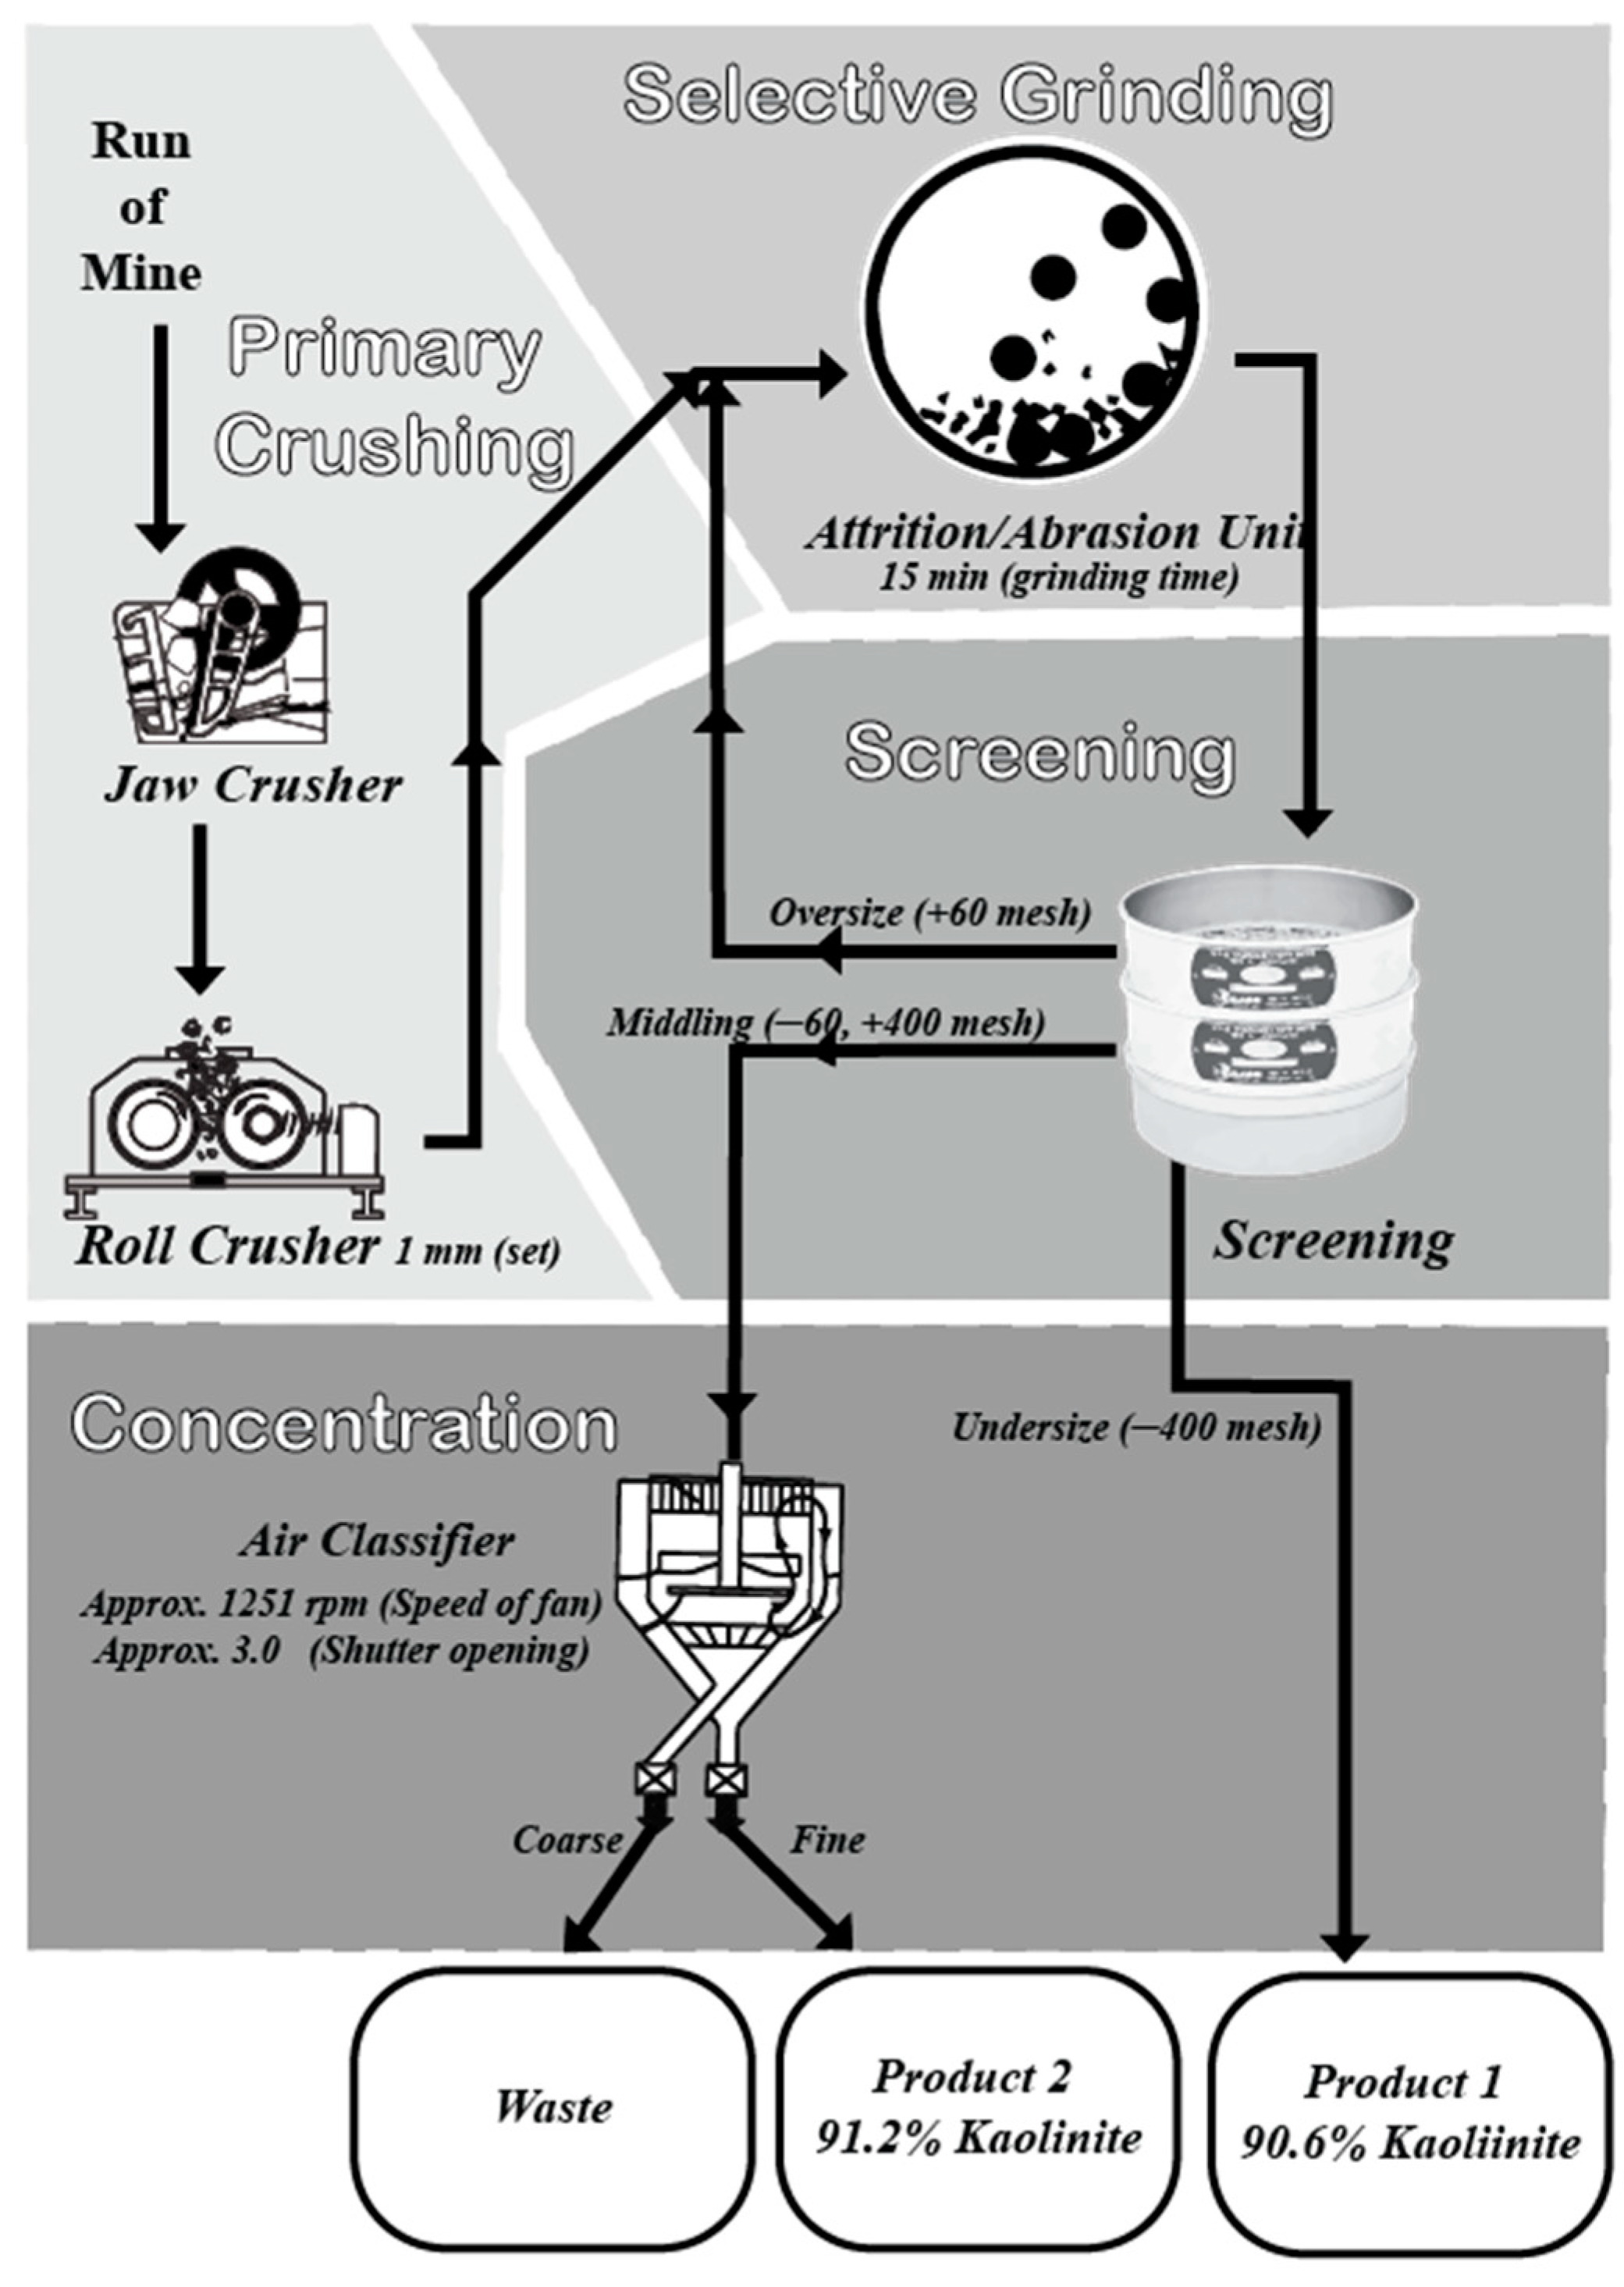
3.2. Procedure
4. Results and Discussion
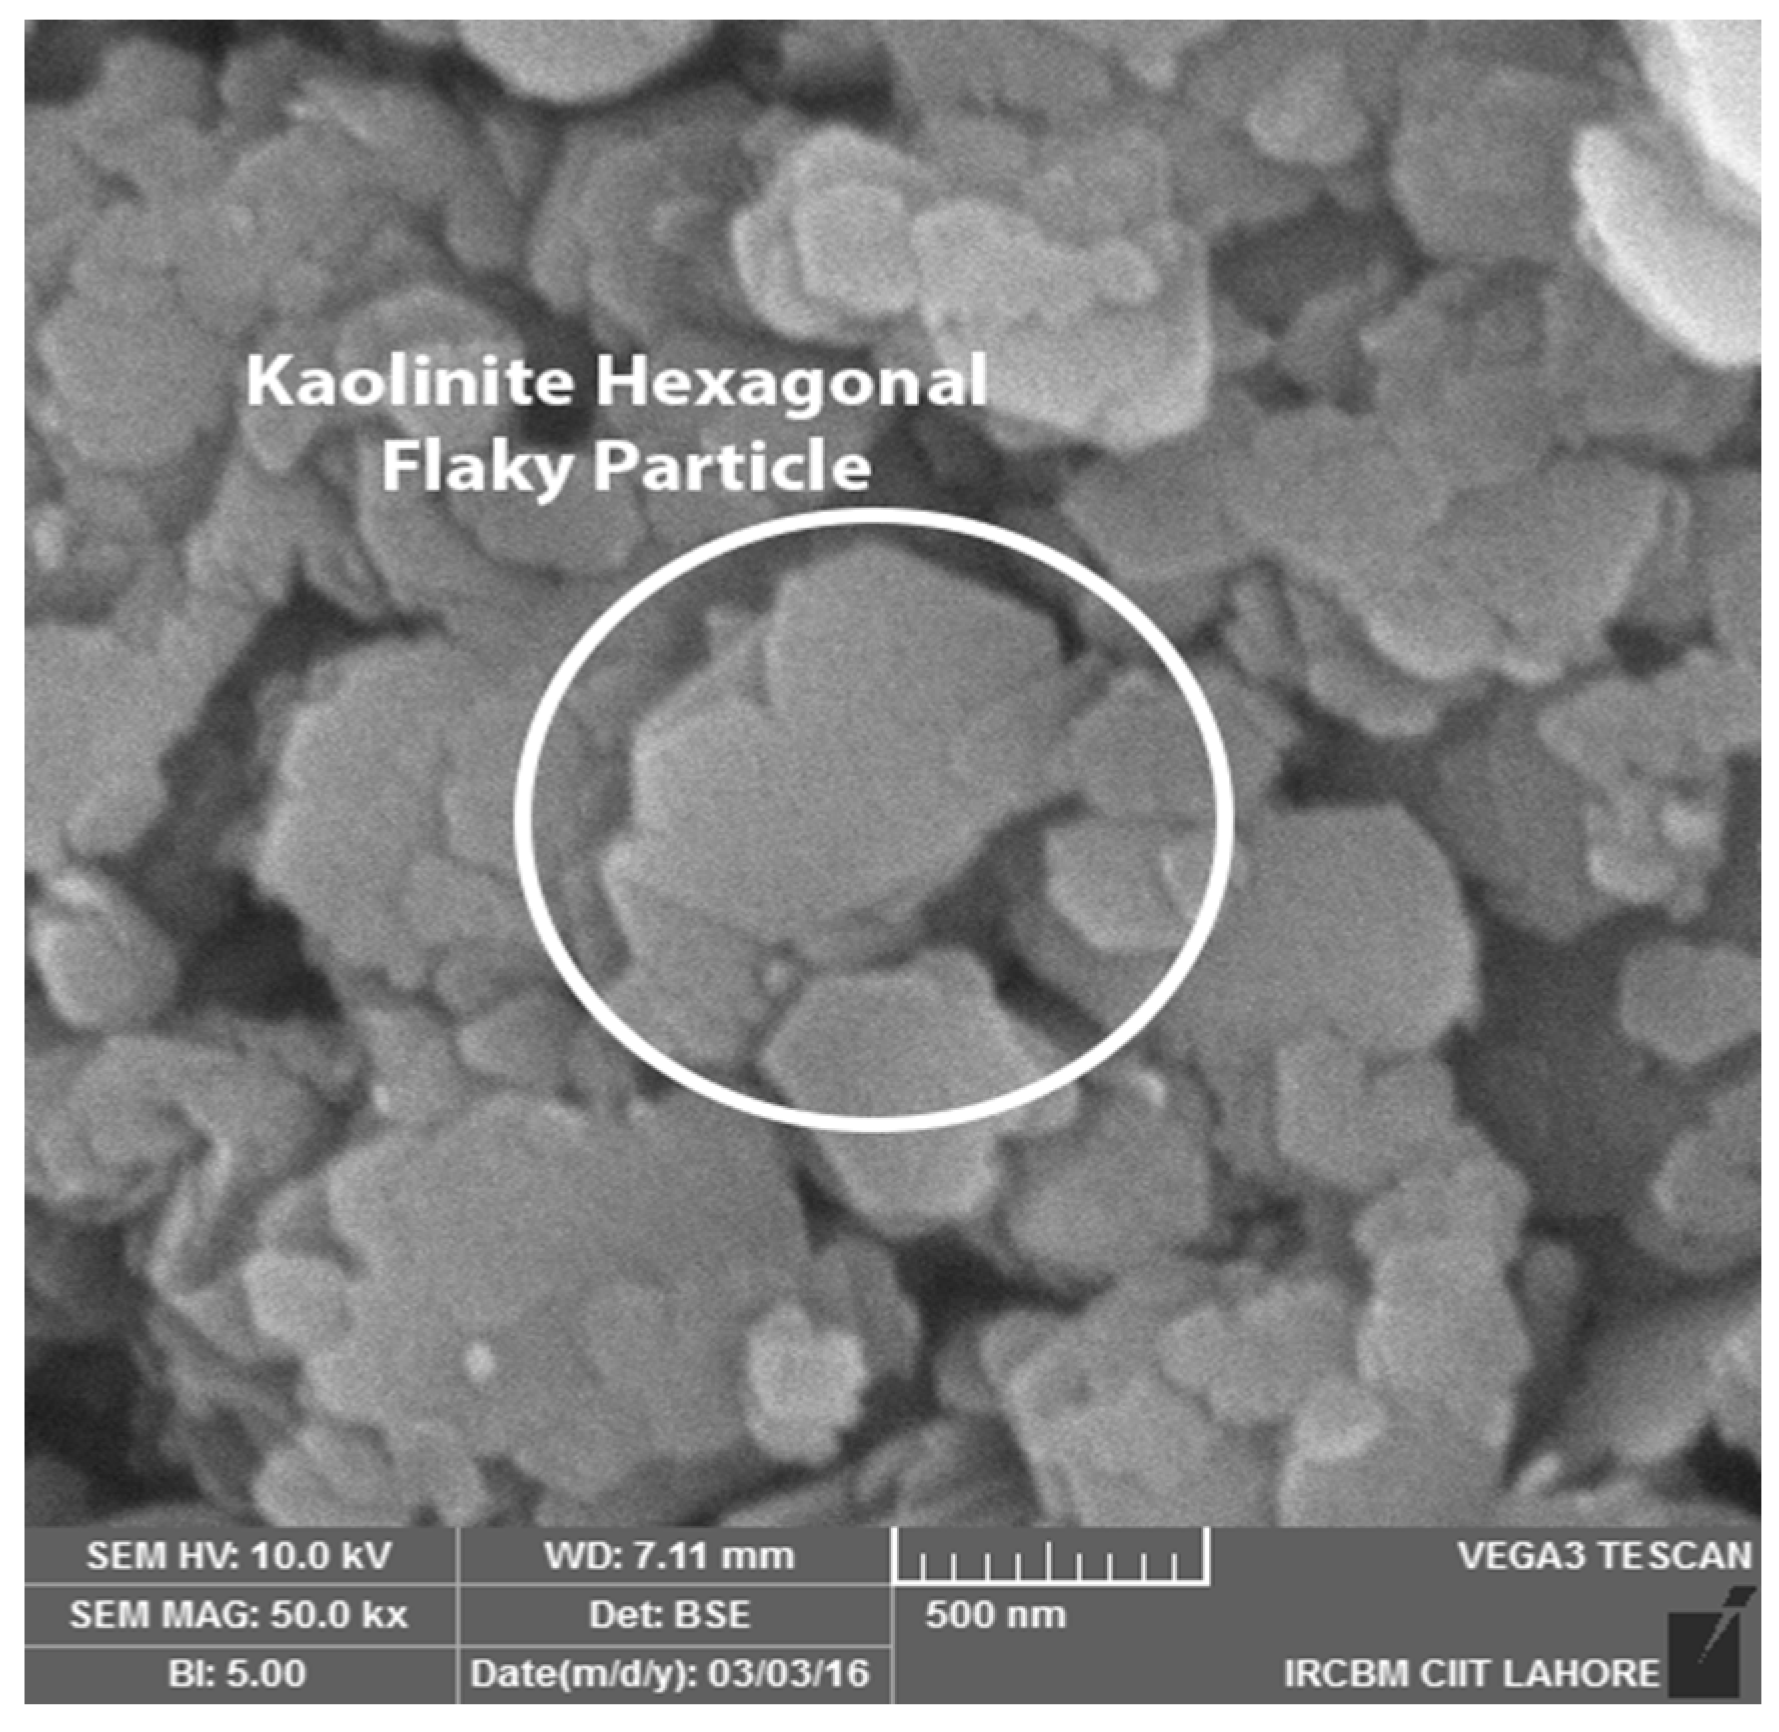
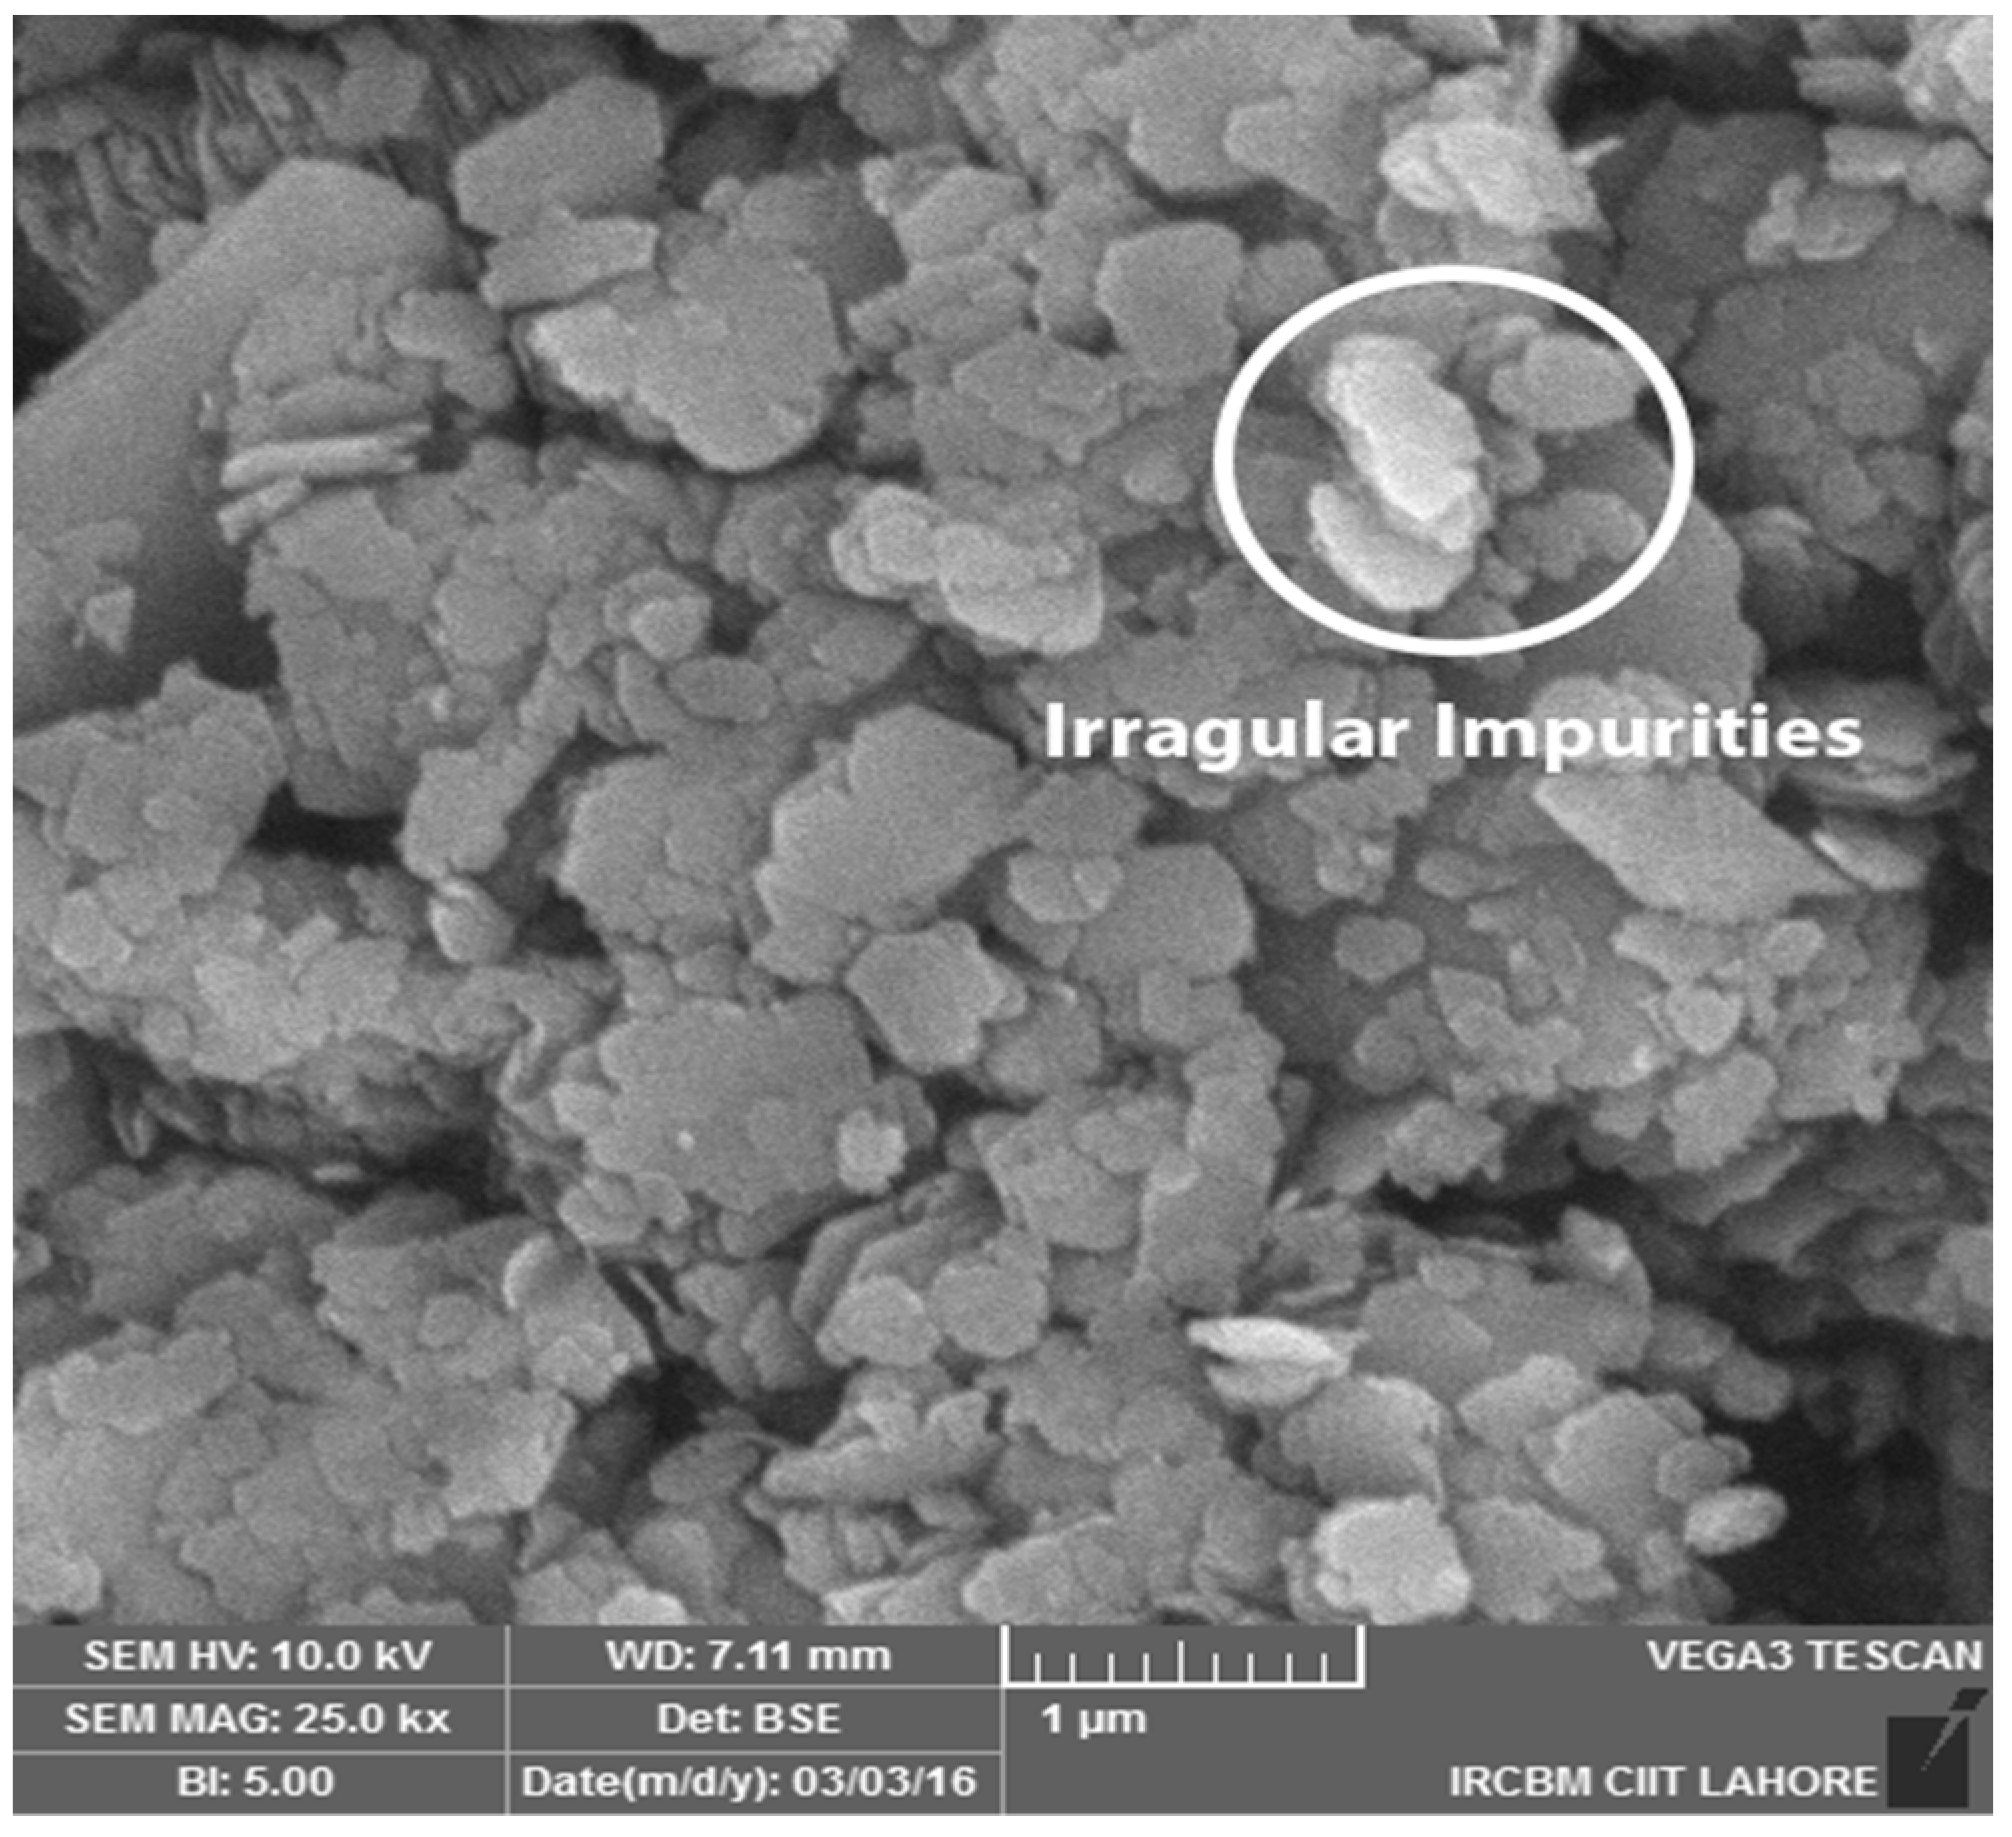
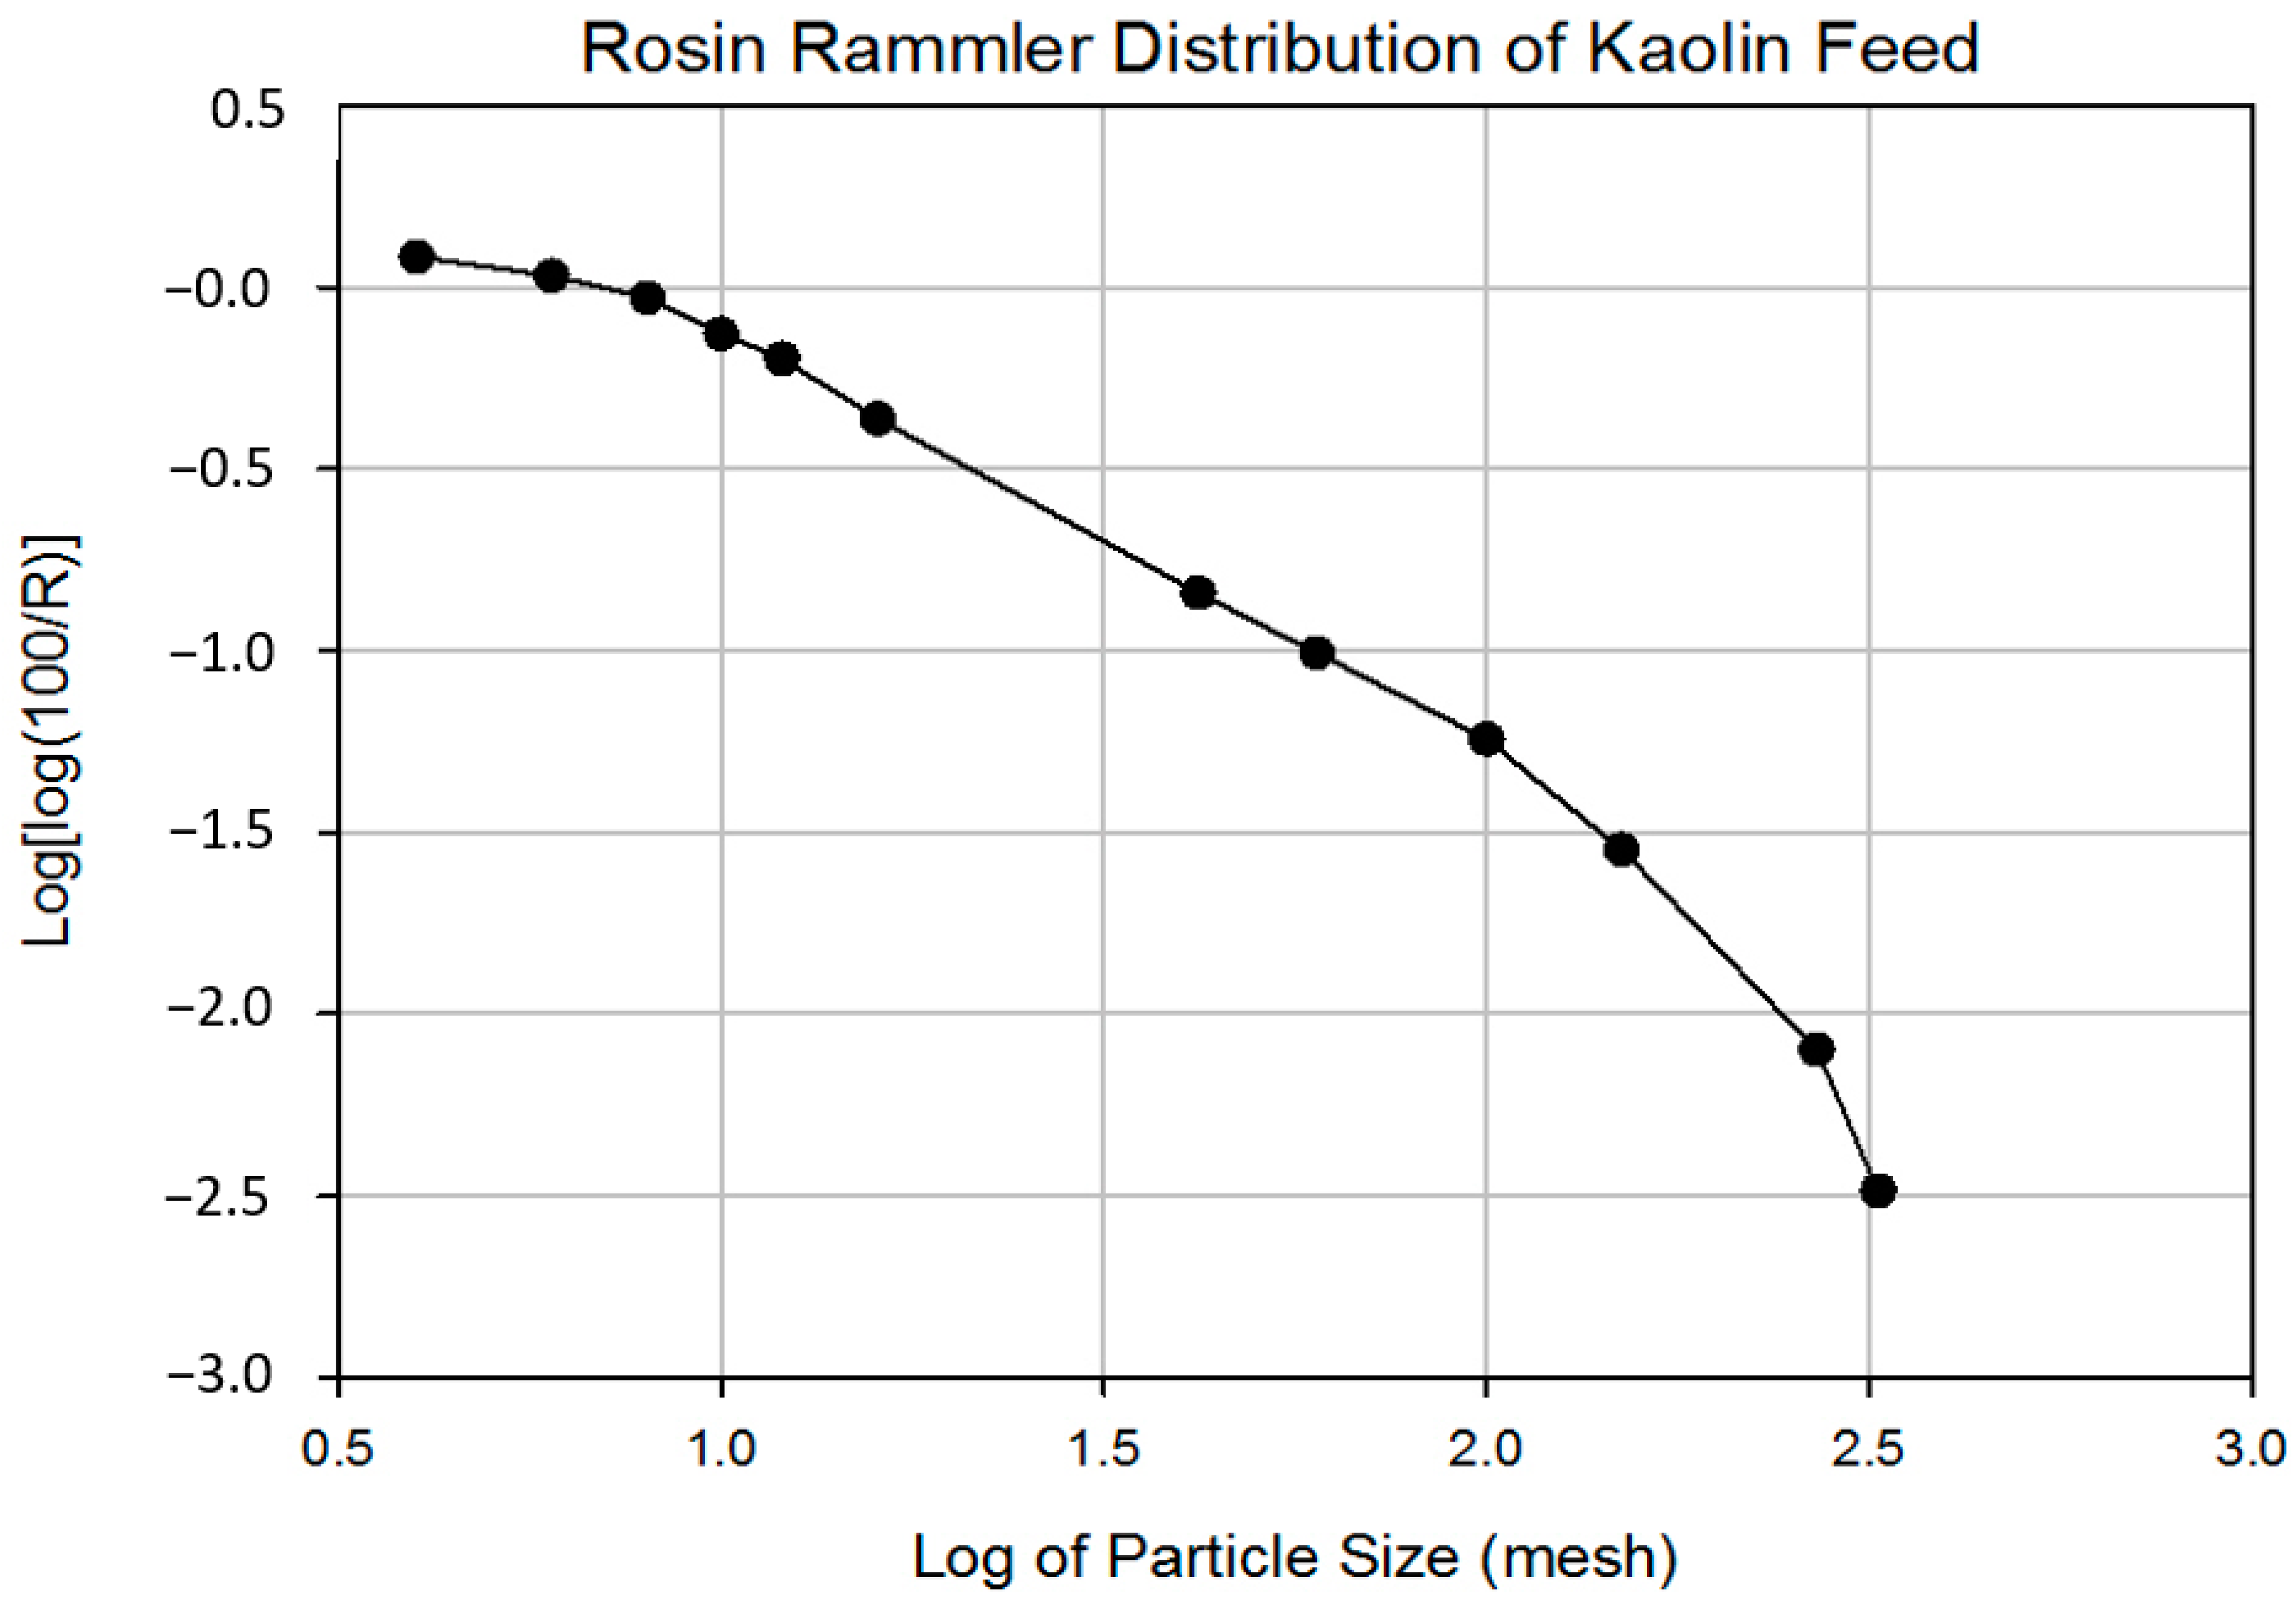
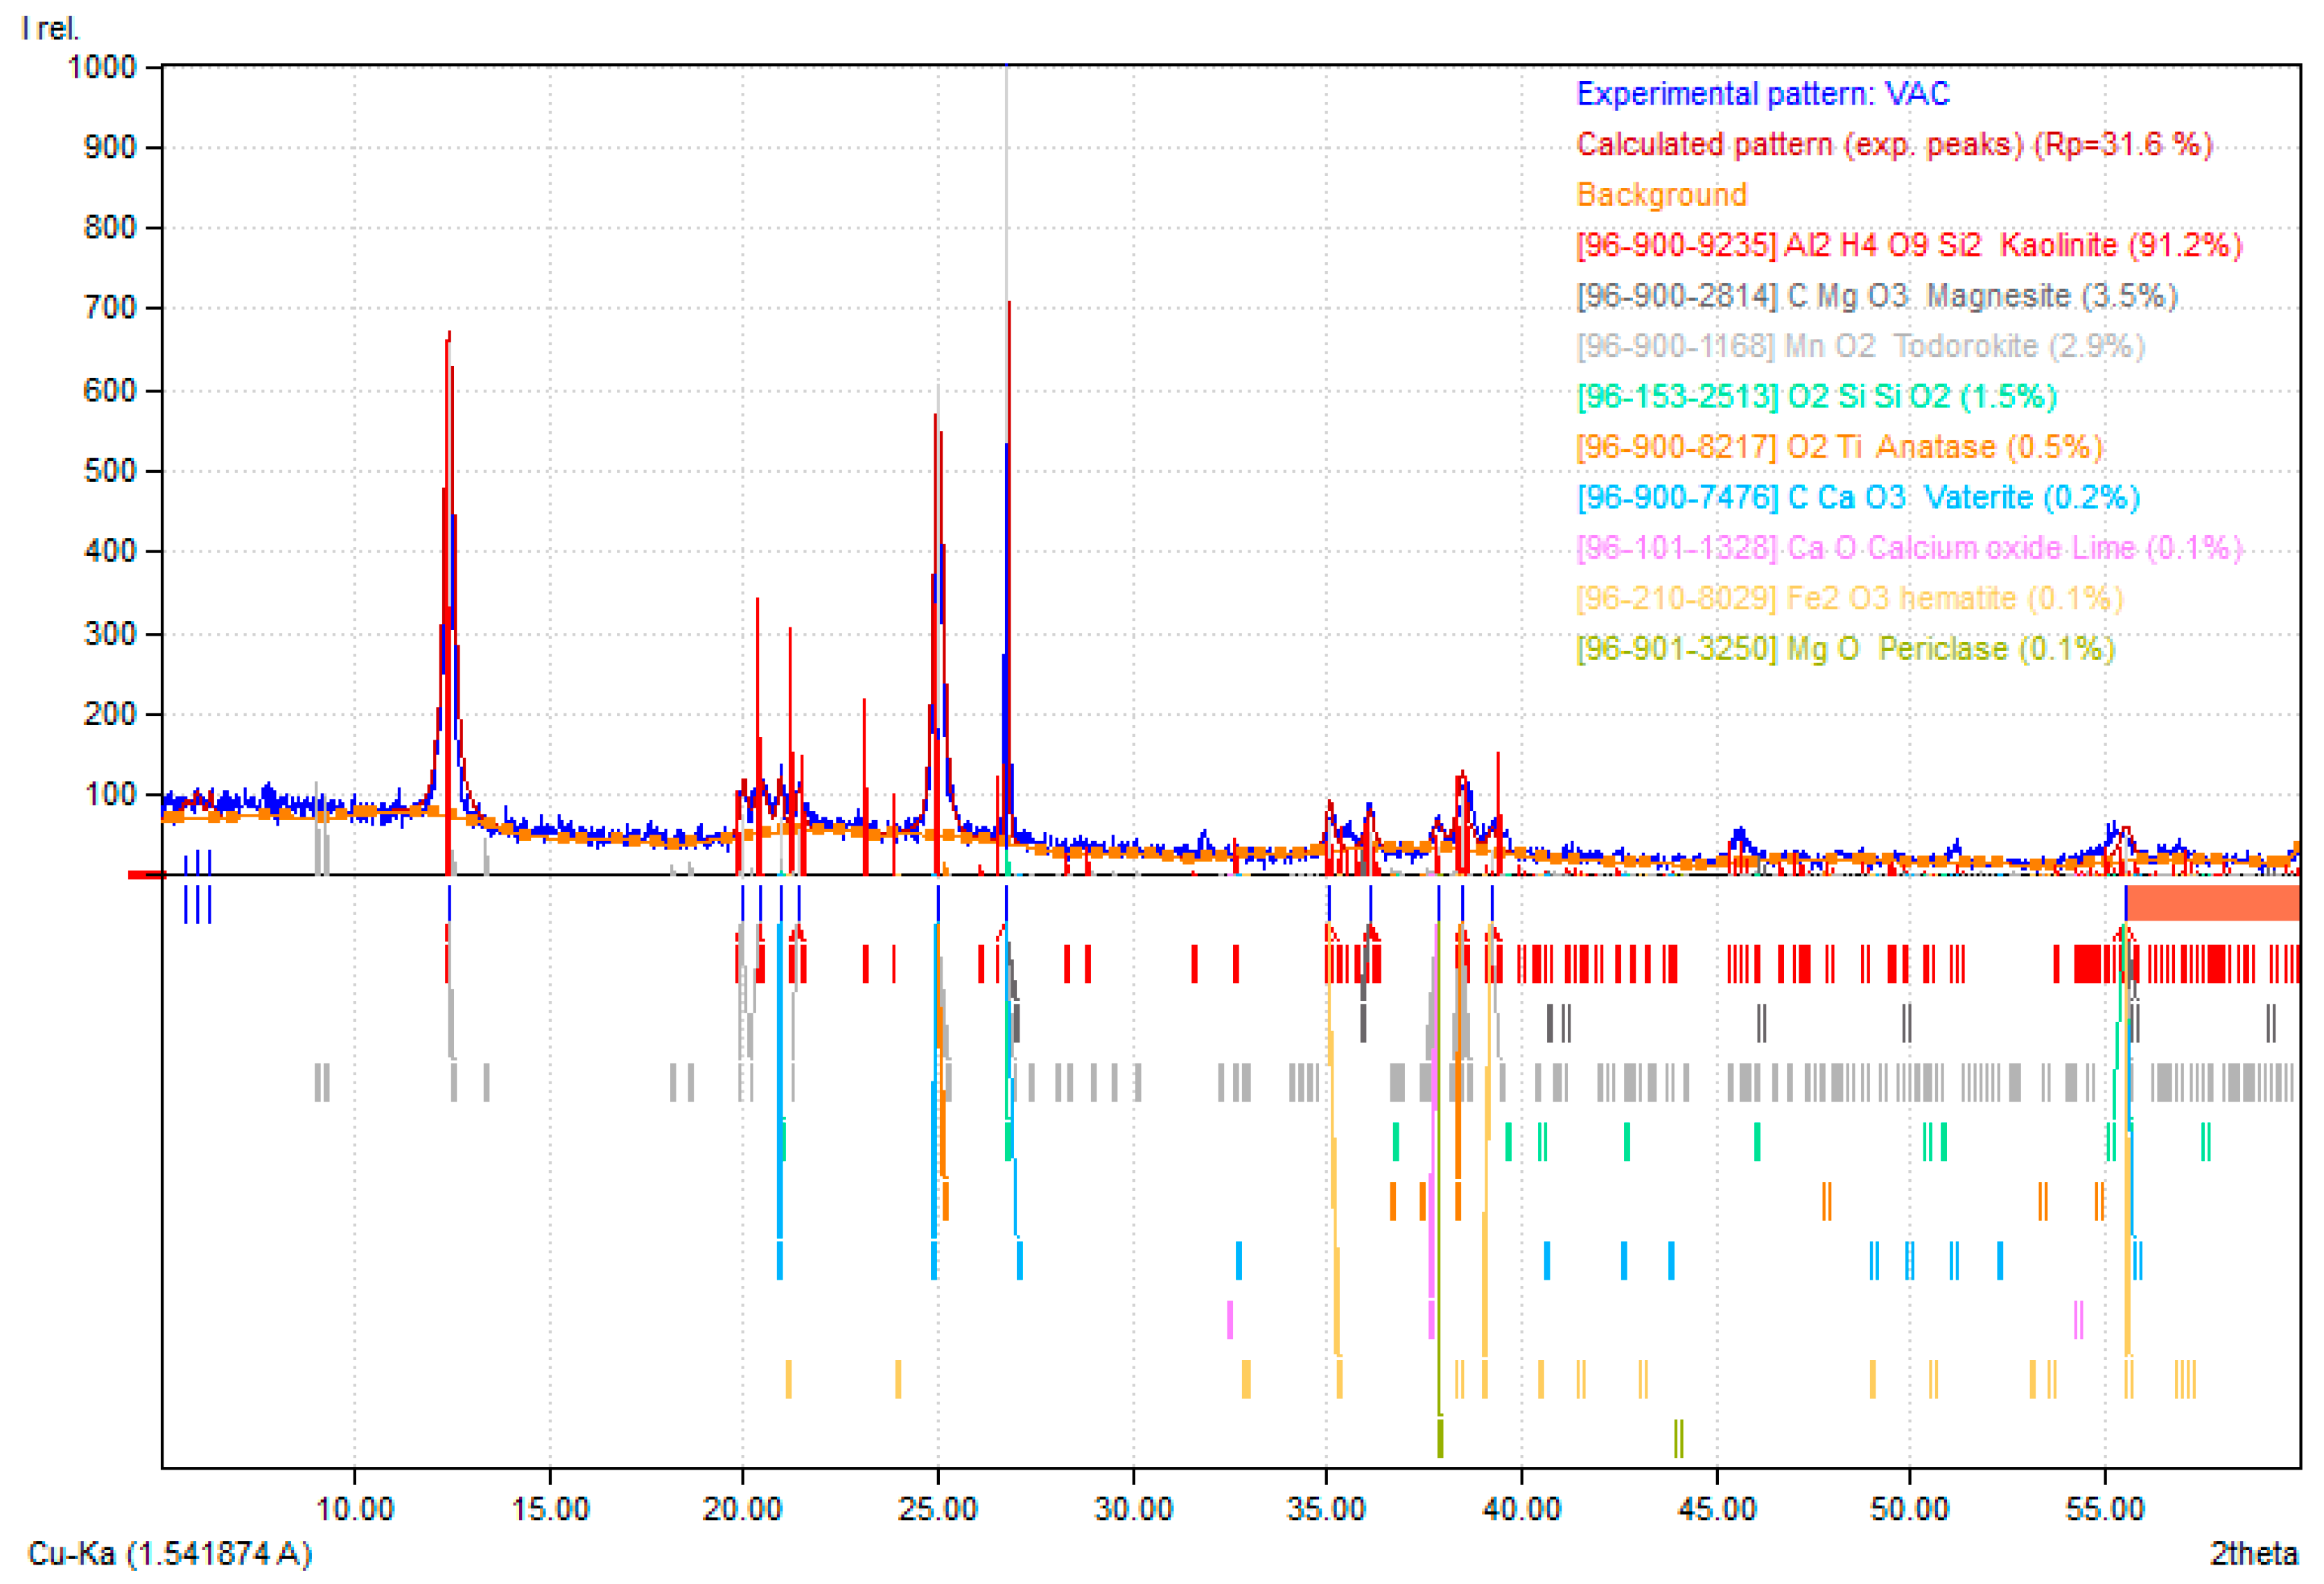
4.1. Feed Characterization
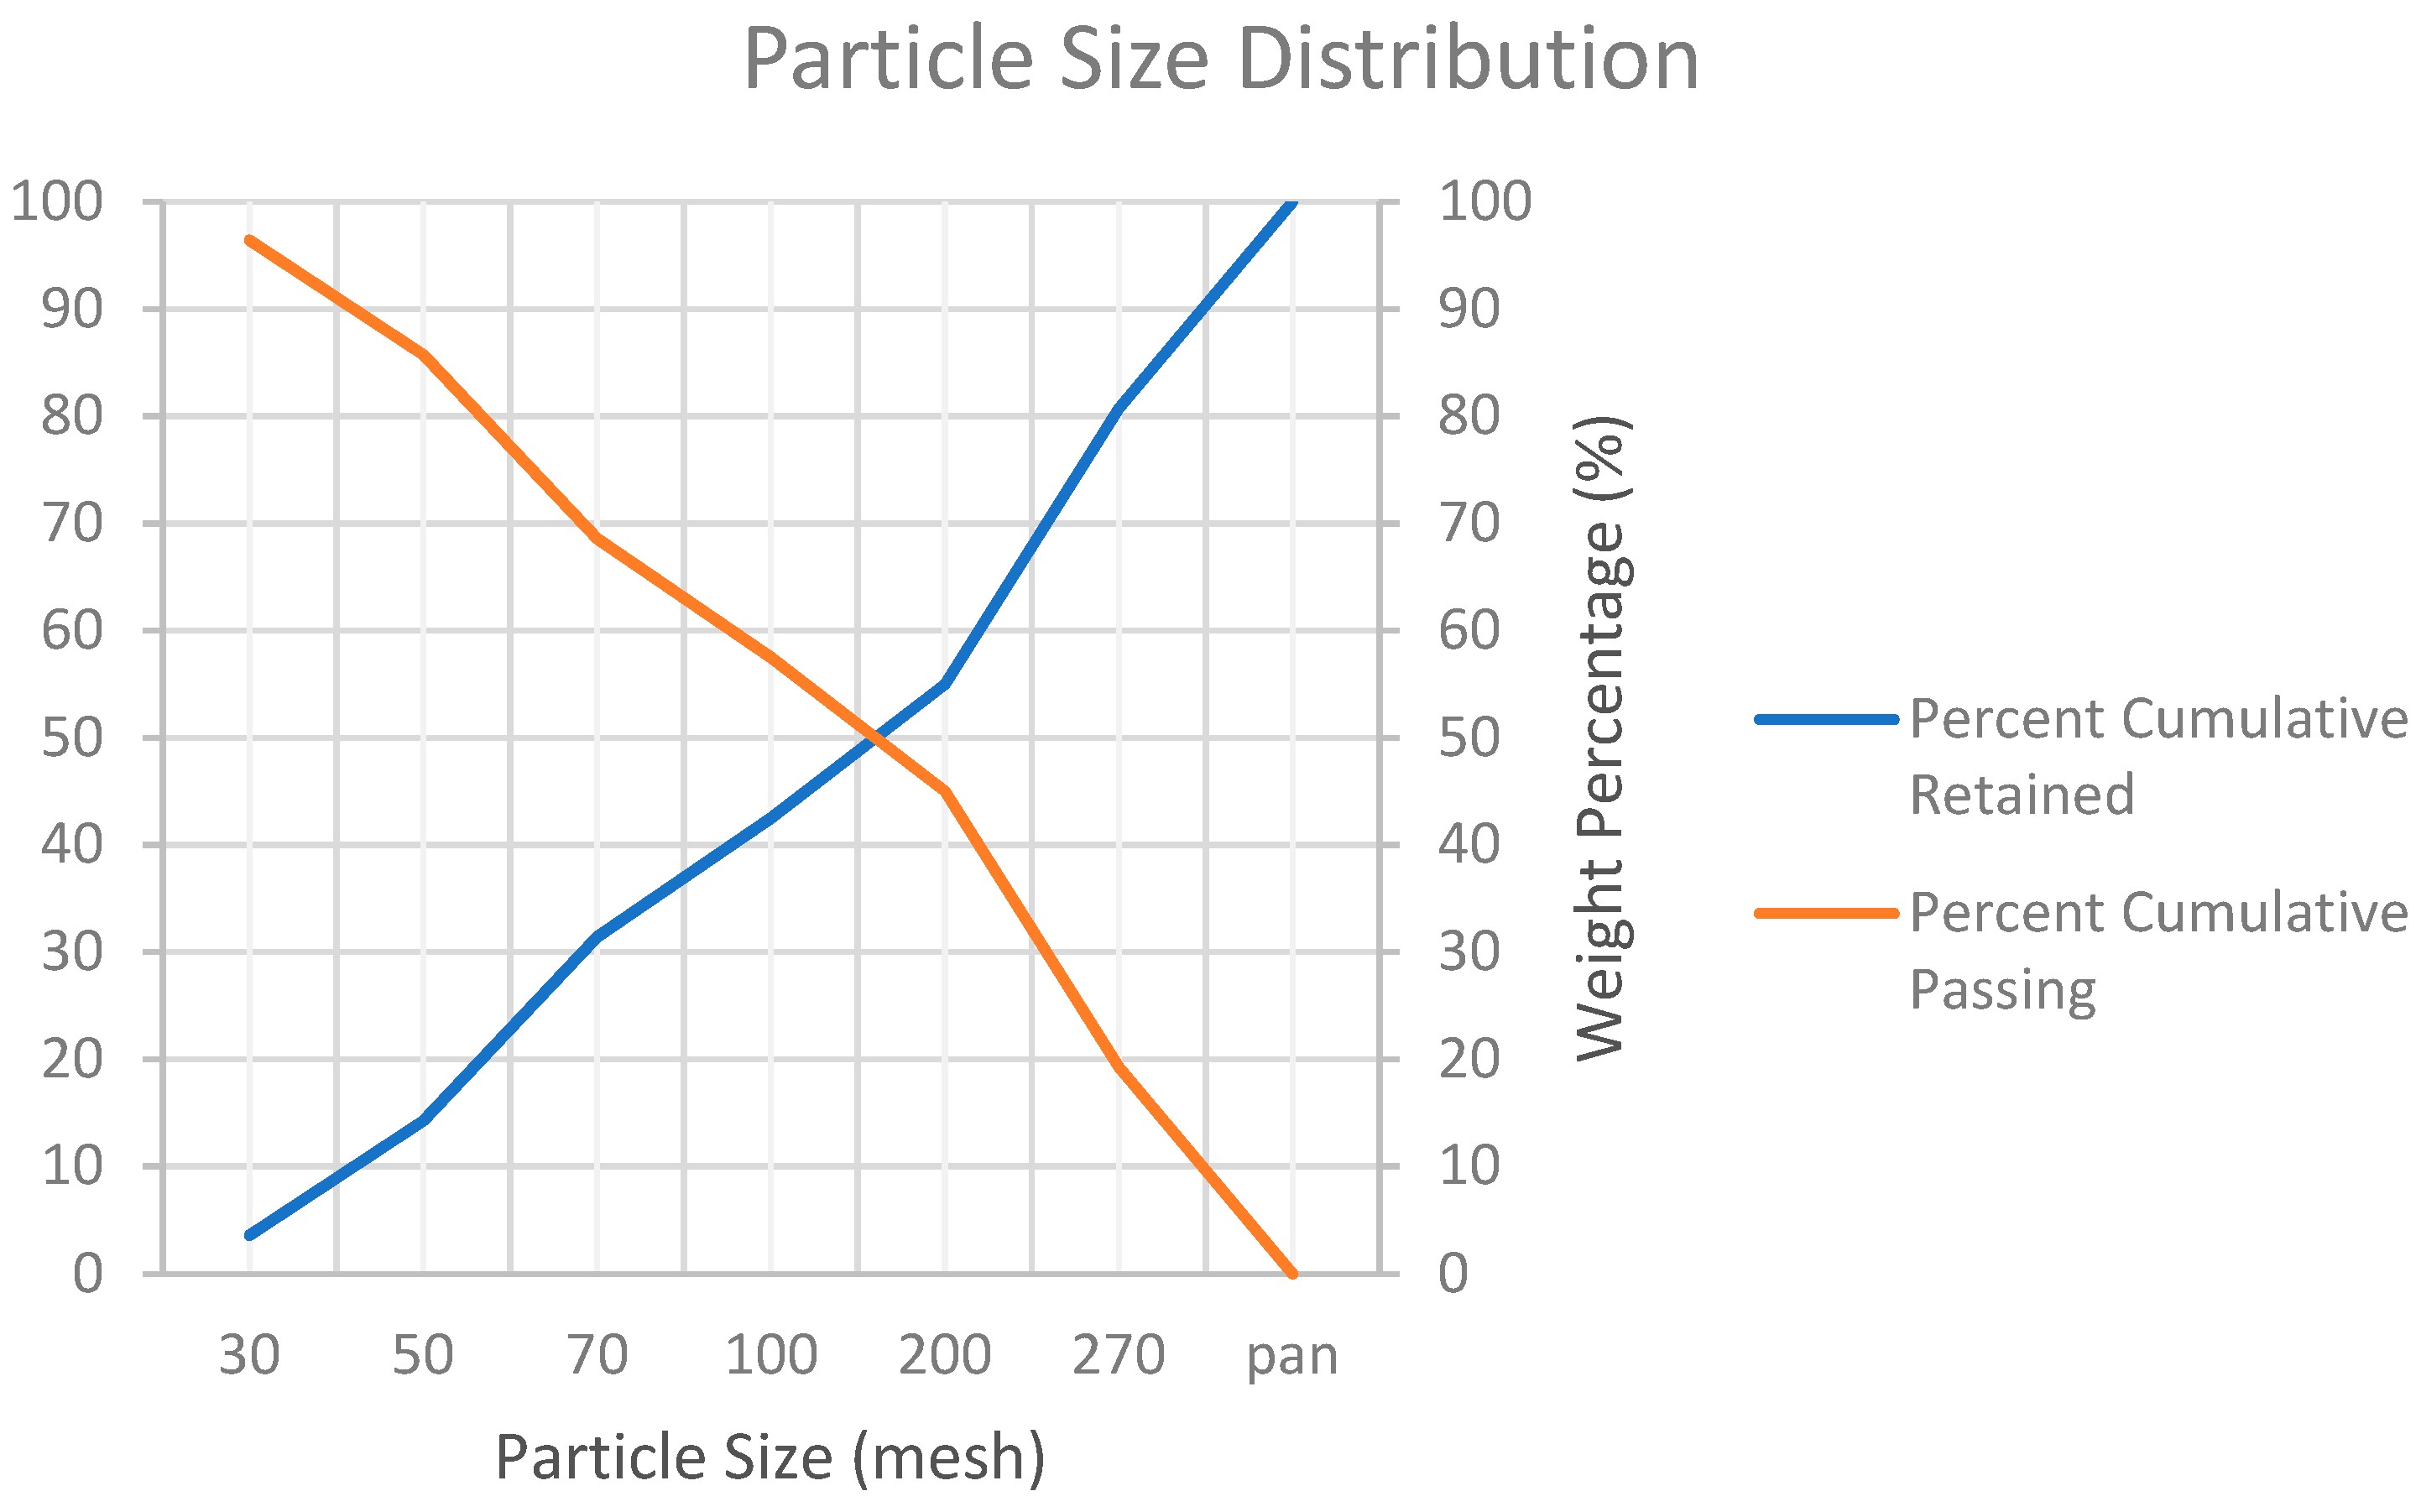
4.2. Screening
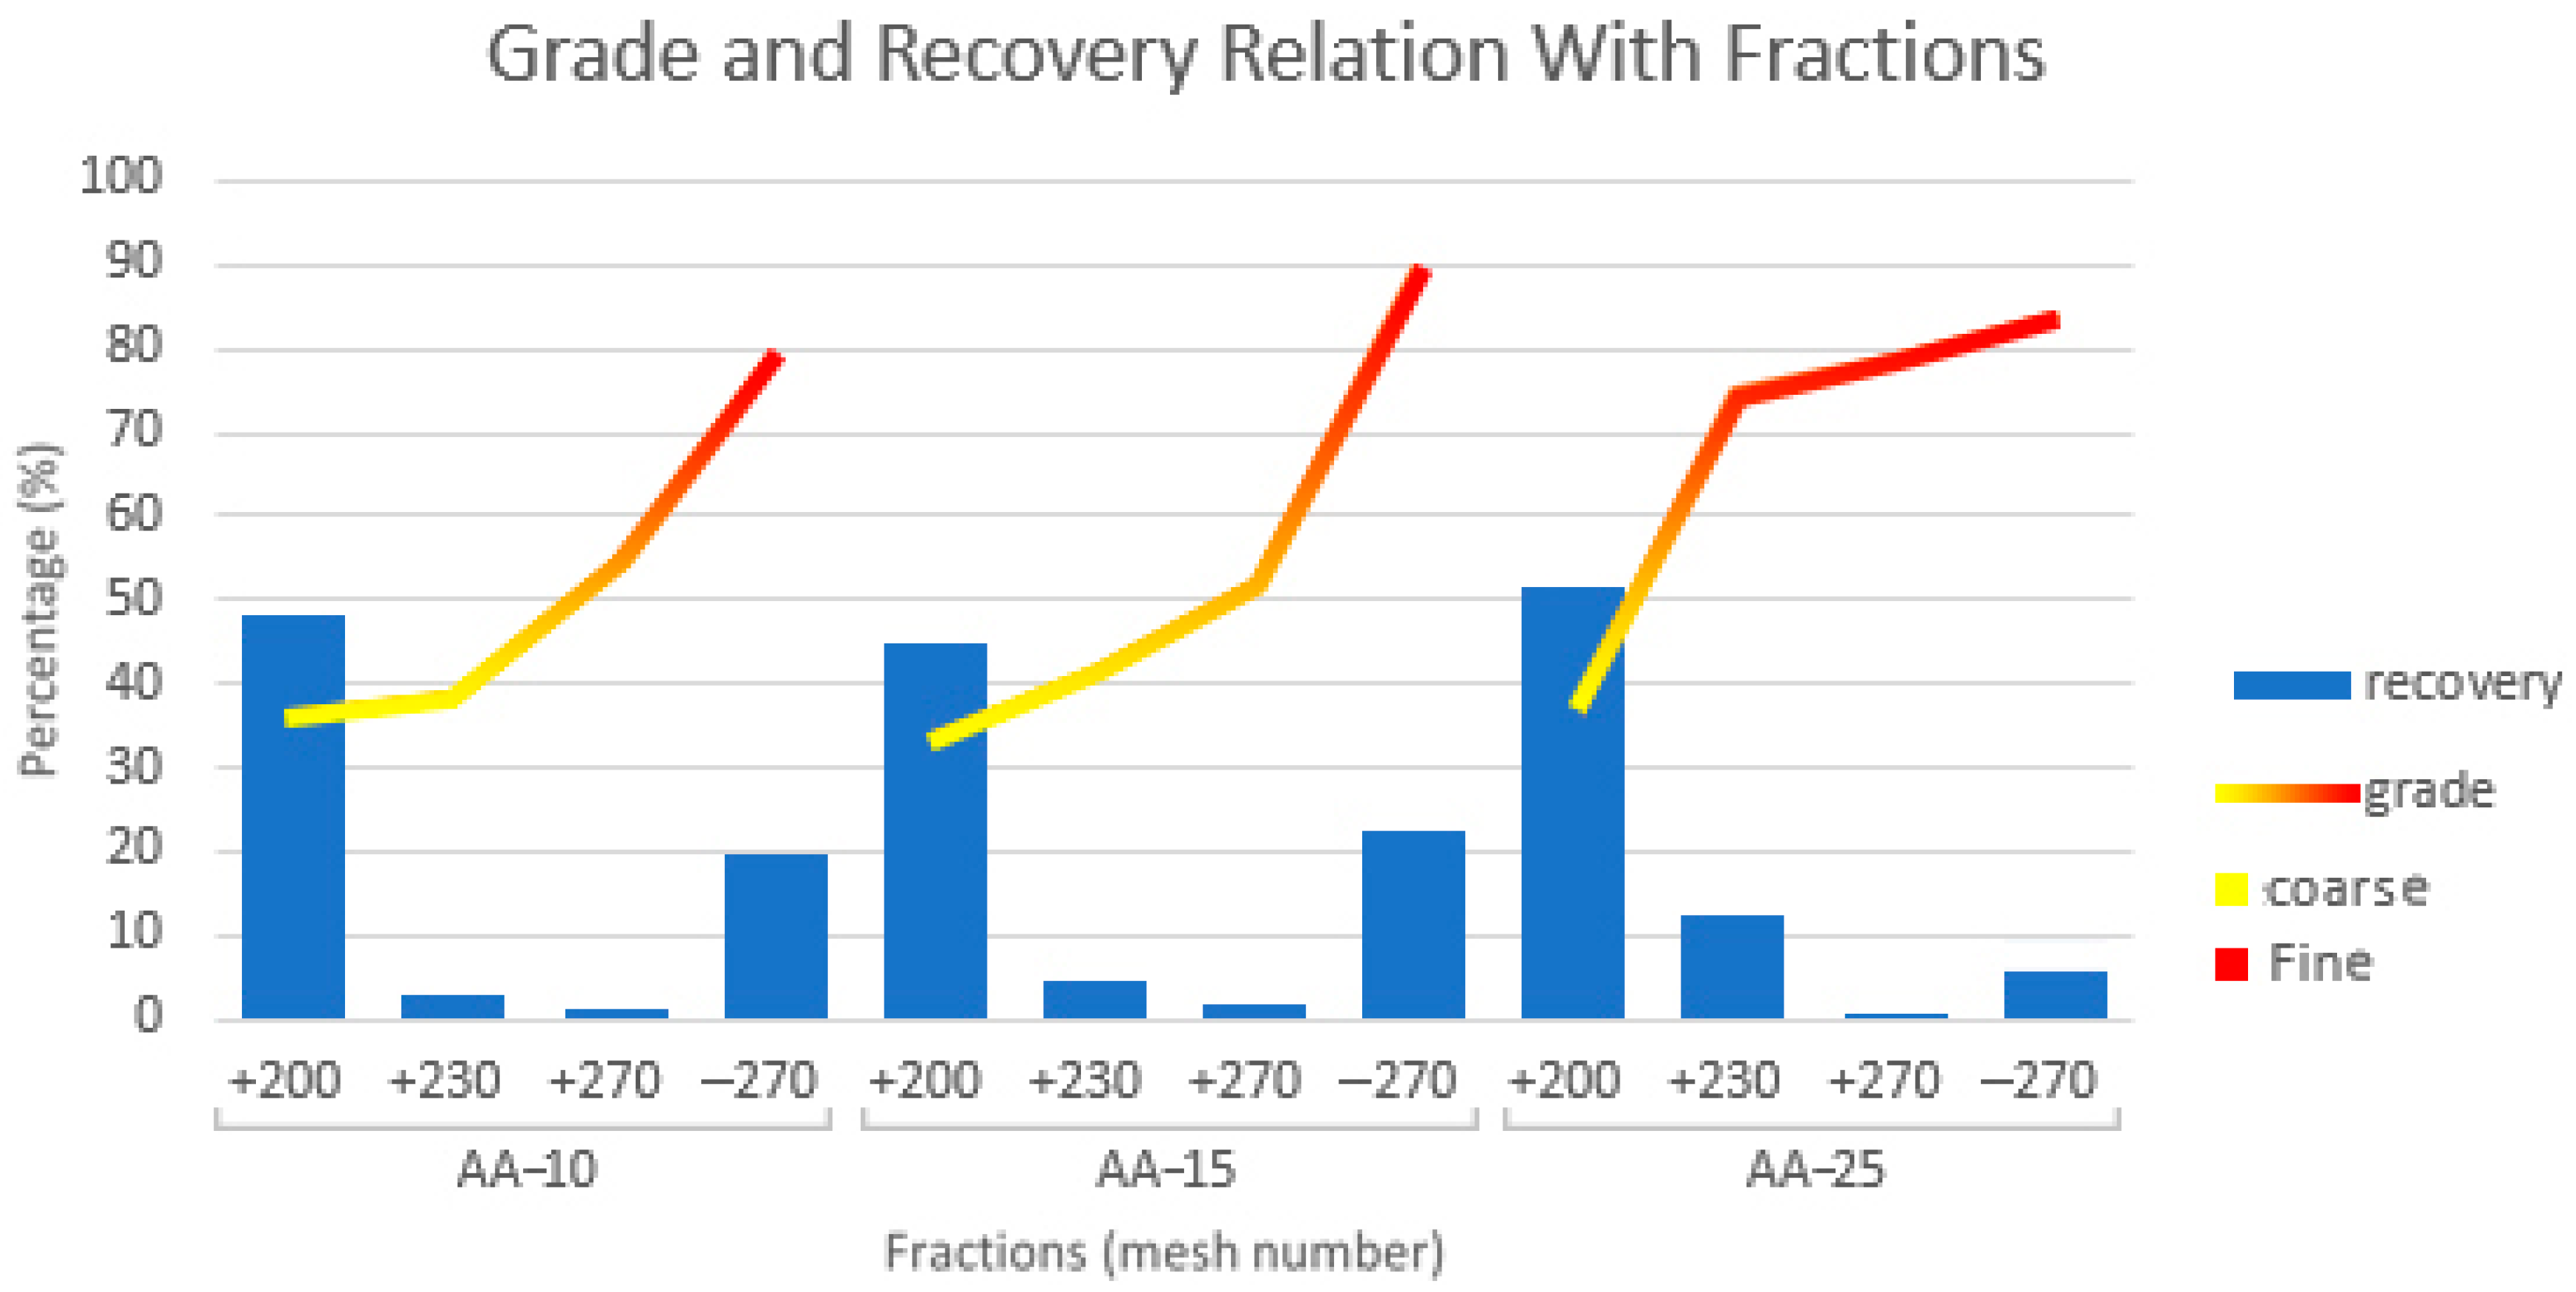
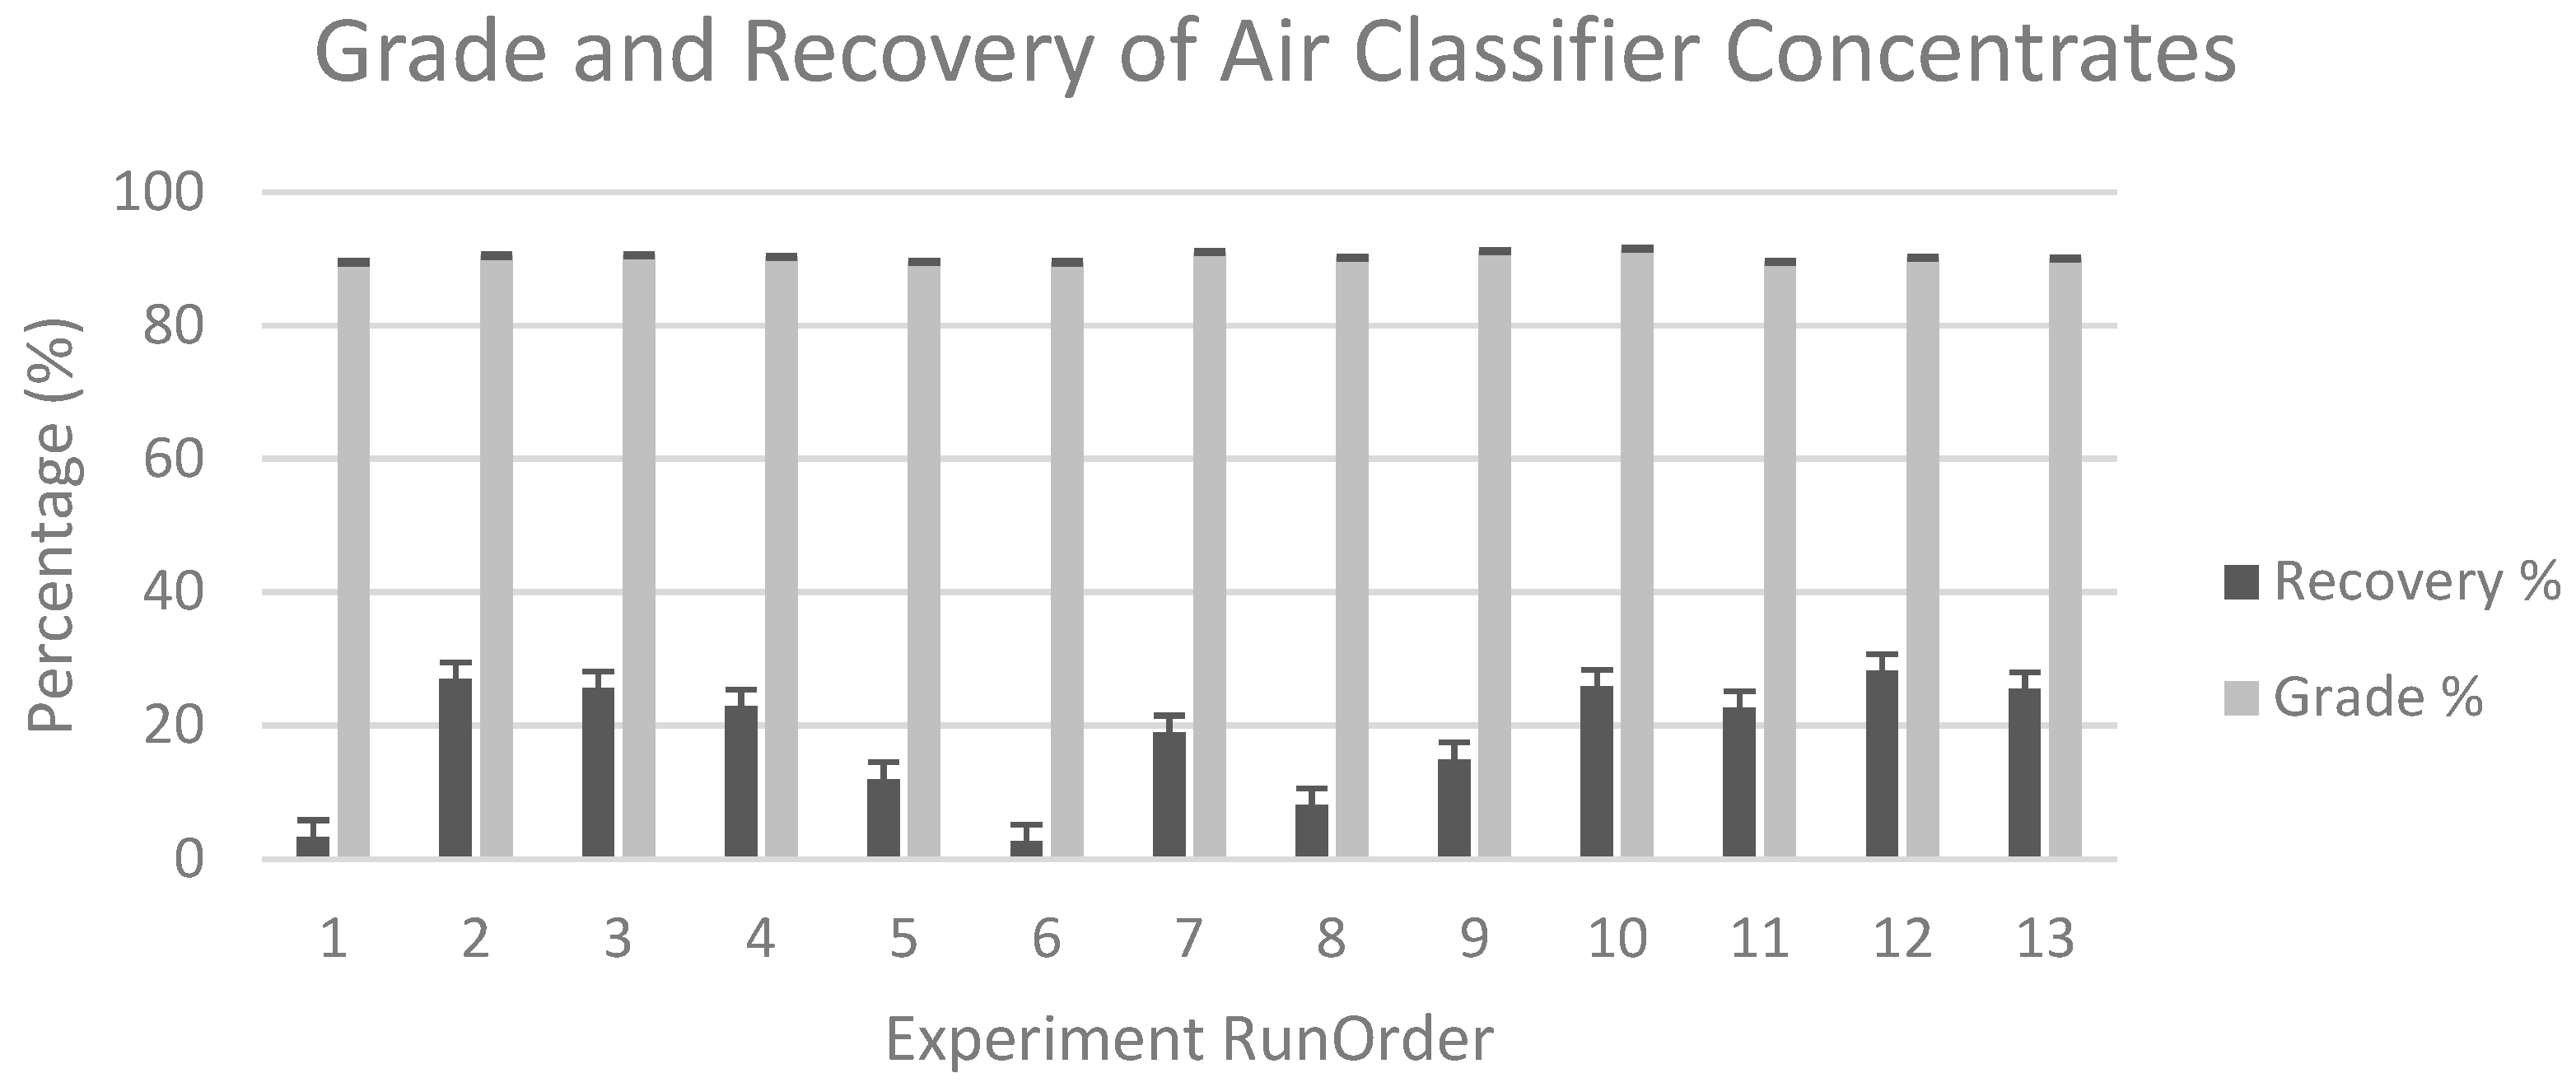
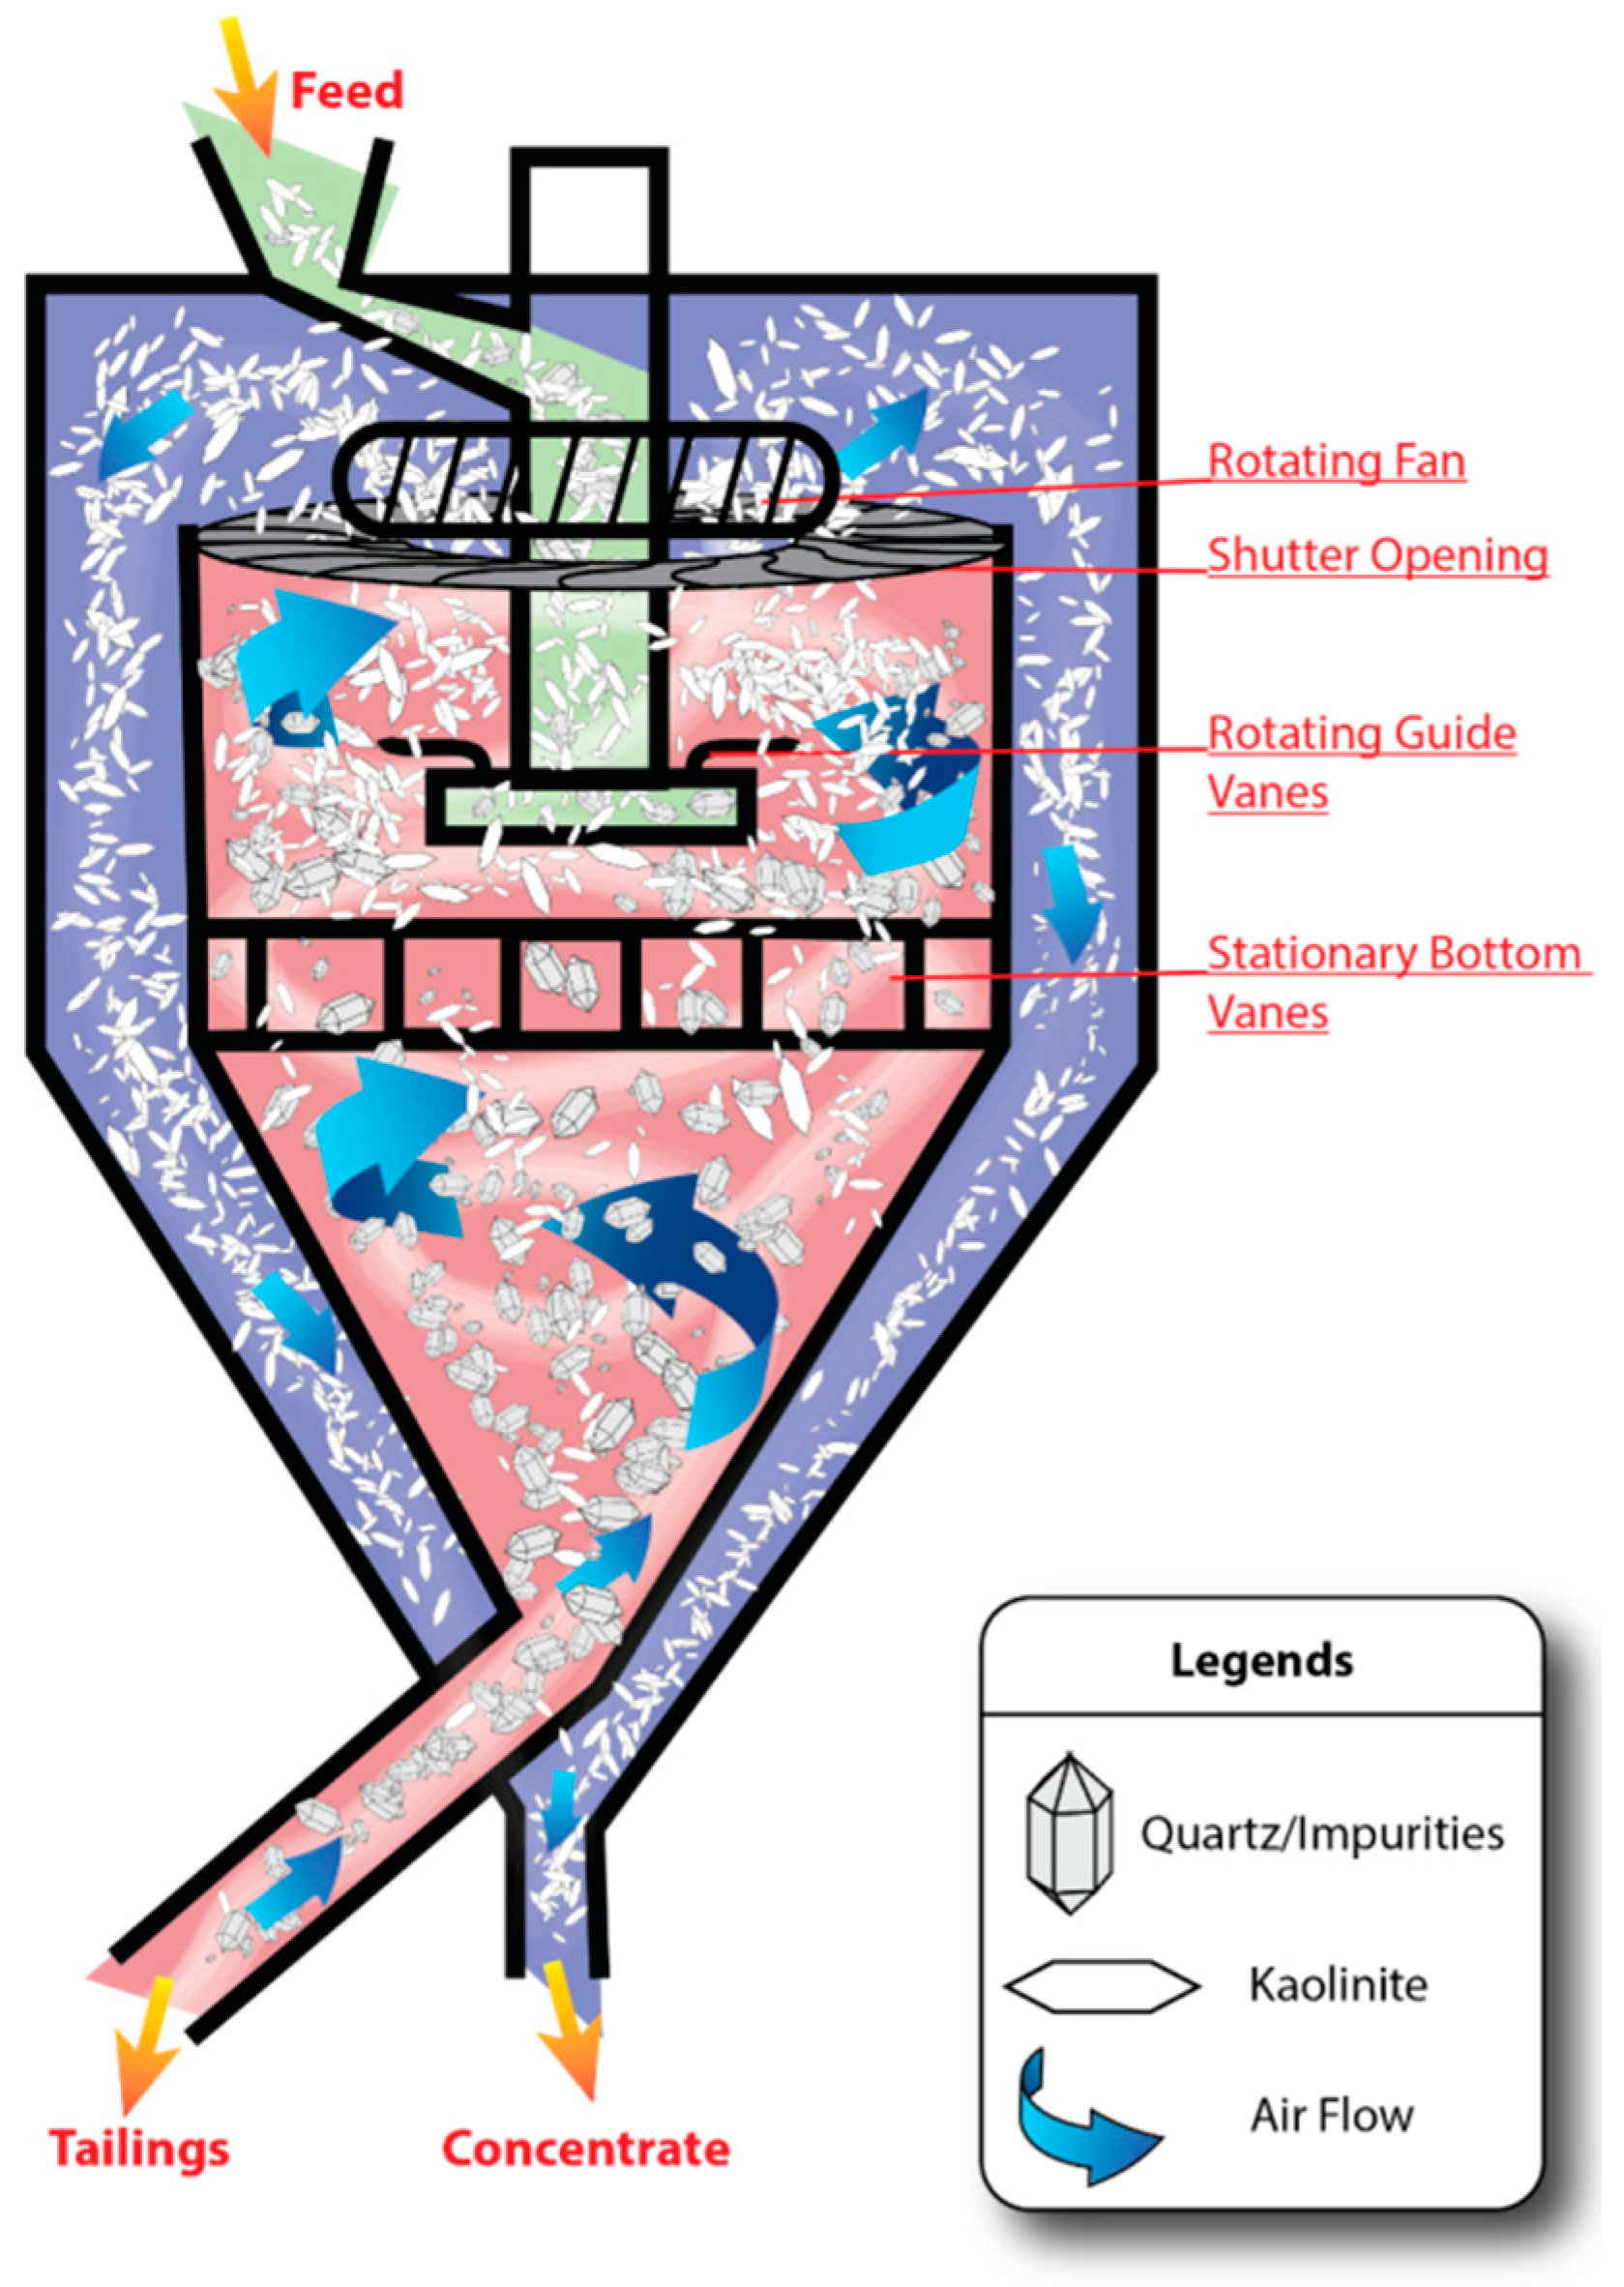
4.3. Air Classifier
4.4. Statistical Analysis
4.4.1. Recovery Model
4.4.2. Grade Model
4.4.3. Optimal Conditions
4.4.4. Validation
5. Conclusions
- Selective grinding worked effectively for kaolinite of hardness 2.5 and quartz of hardness 7.0.
- Undersize screening (−400 mesh) was taken as the product and achieved a grade and recovery of 90.6% and 20.5%, respectively.
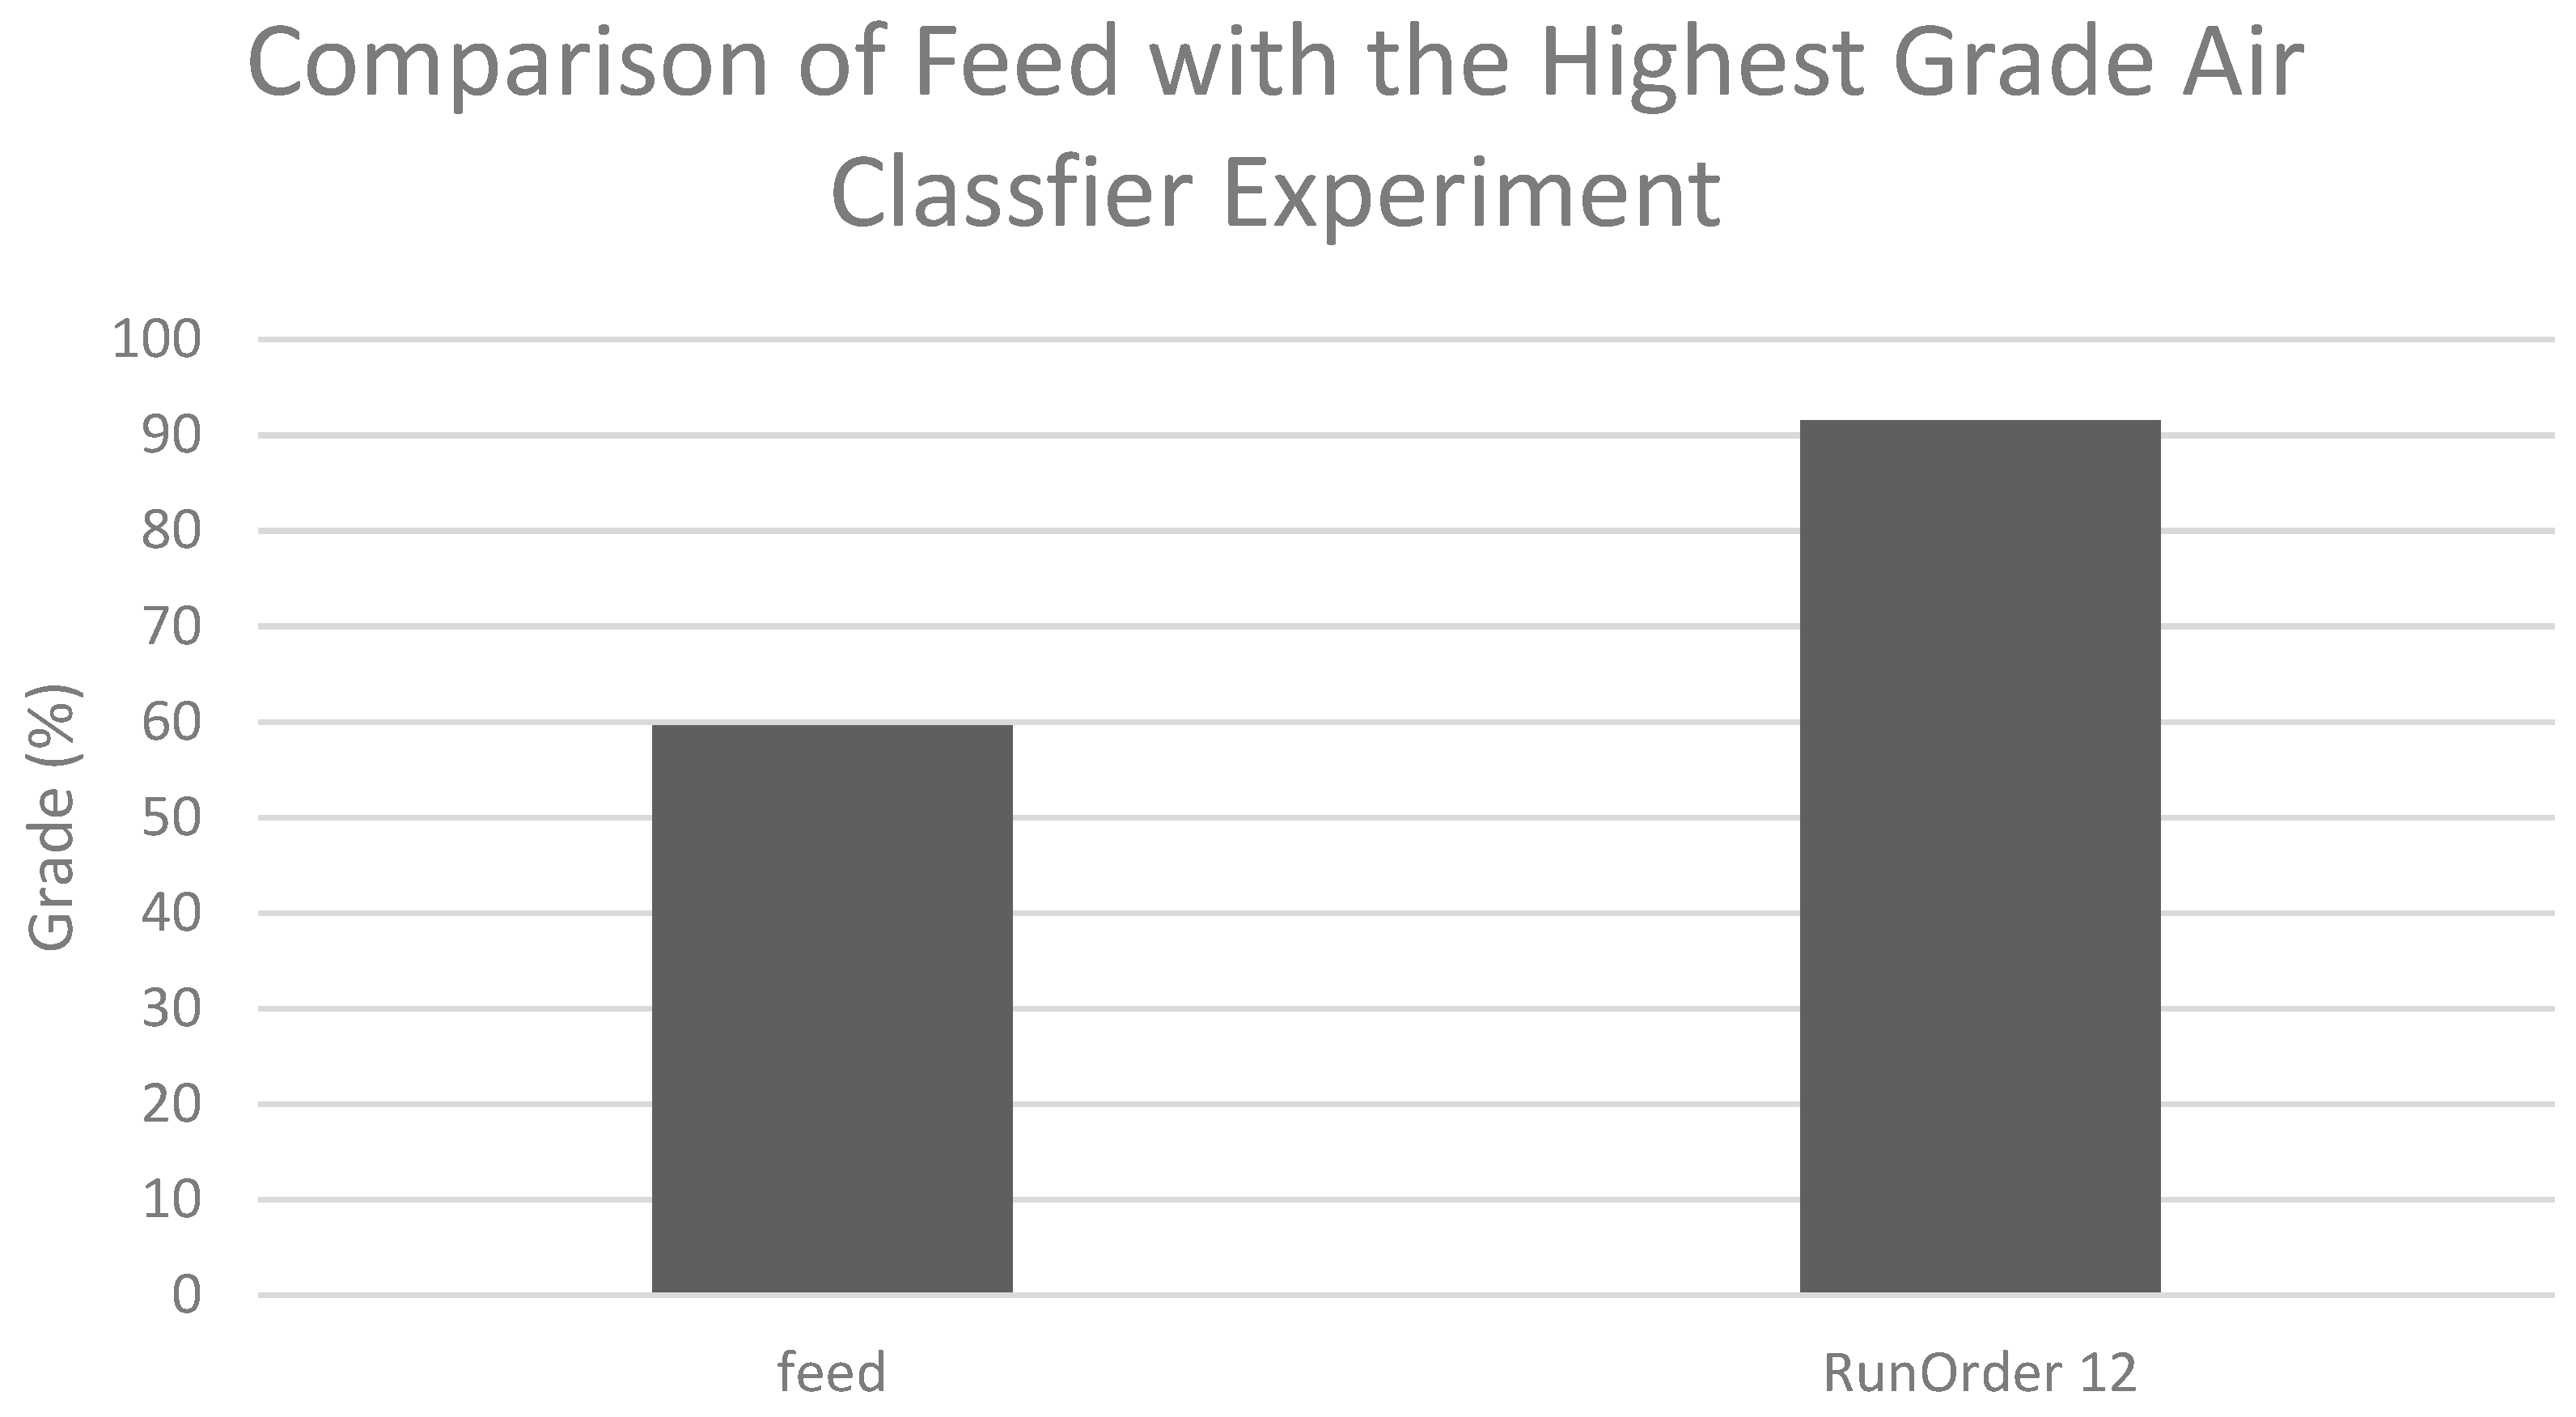
- The highest grade of 91.5% with recovery of 25.8% was achieved in the air classifier experiment at a fan speed of 1200 rpm and shutter opening of 4.0.
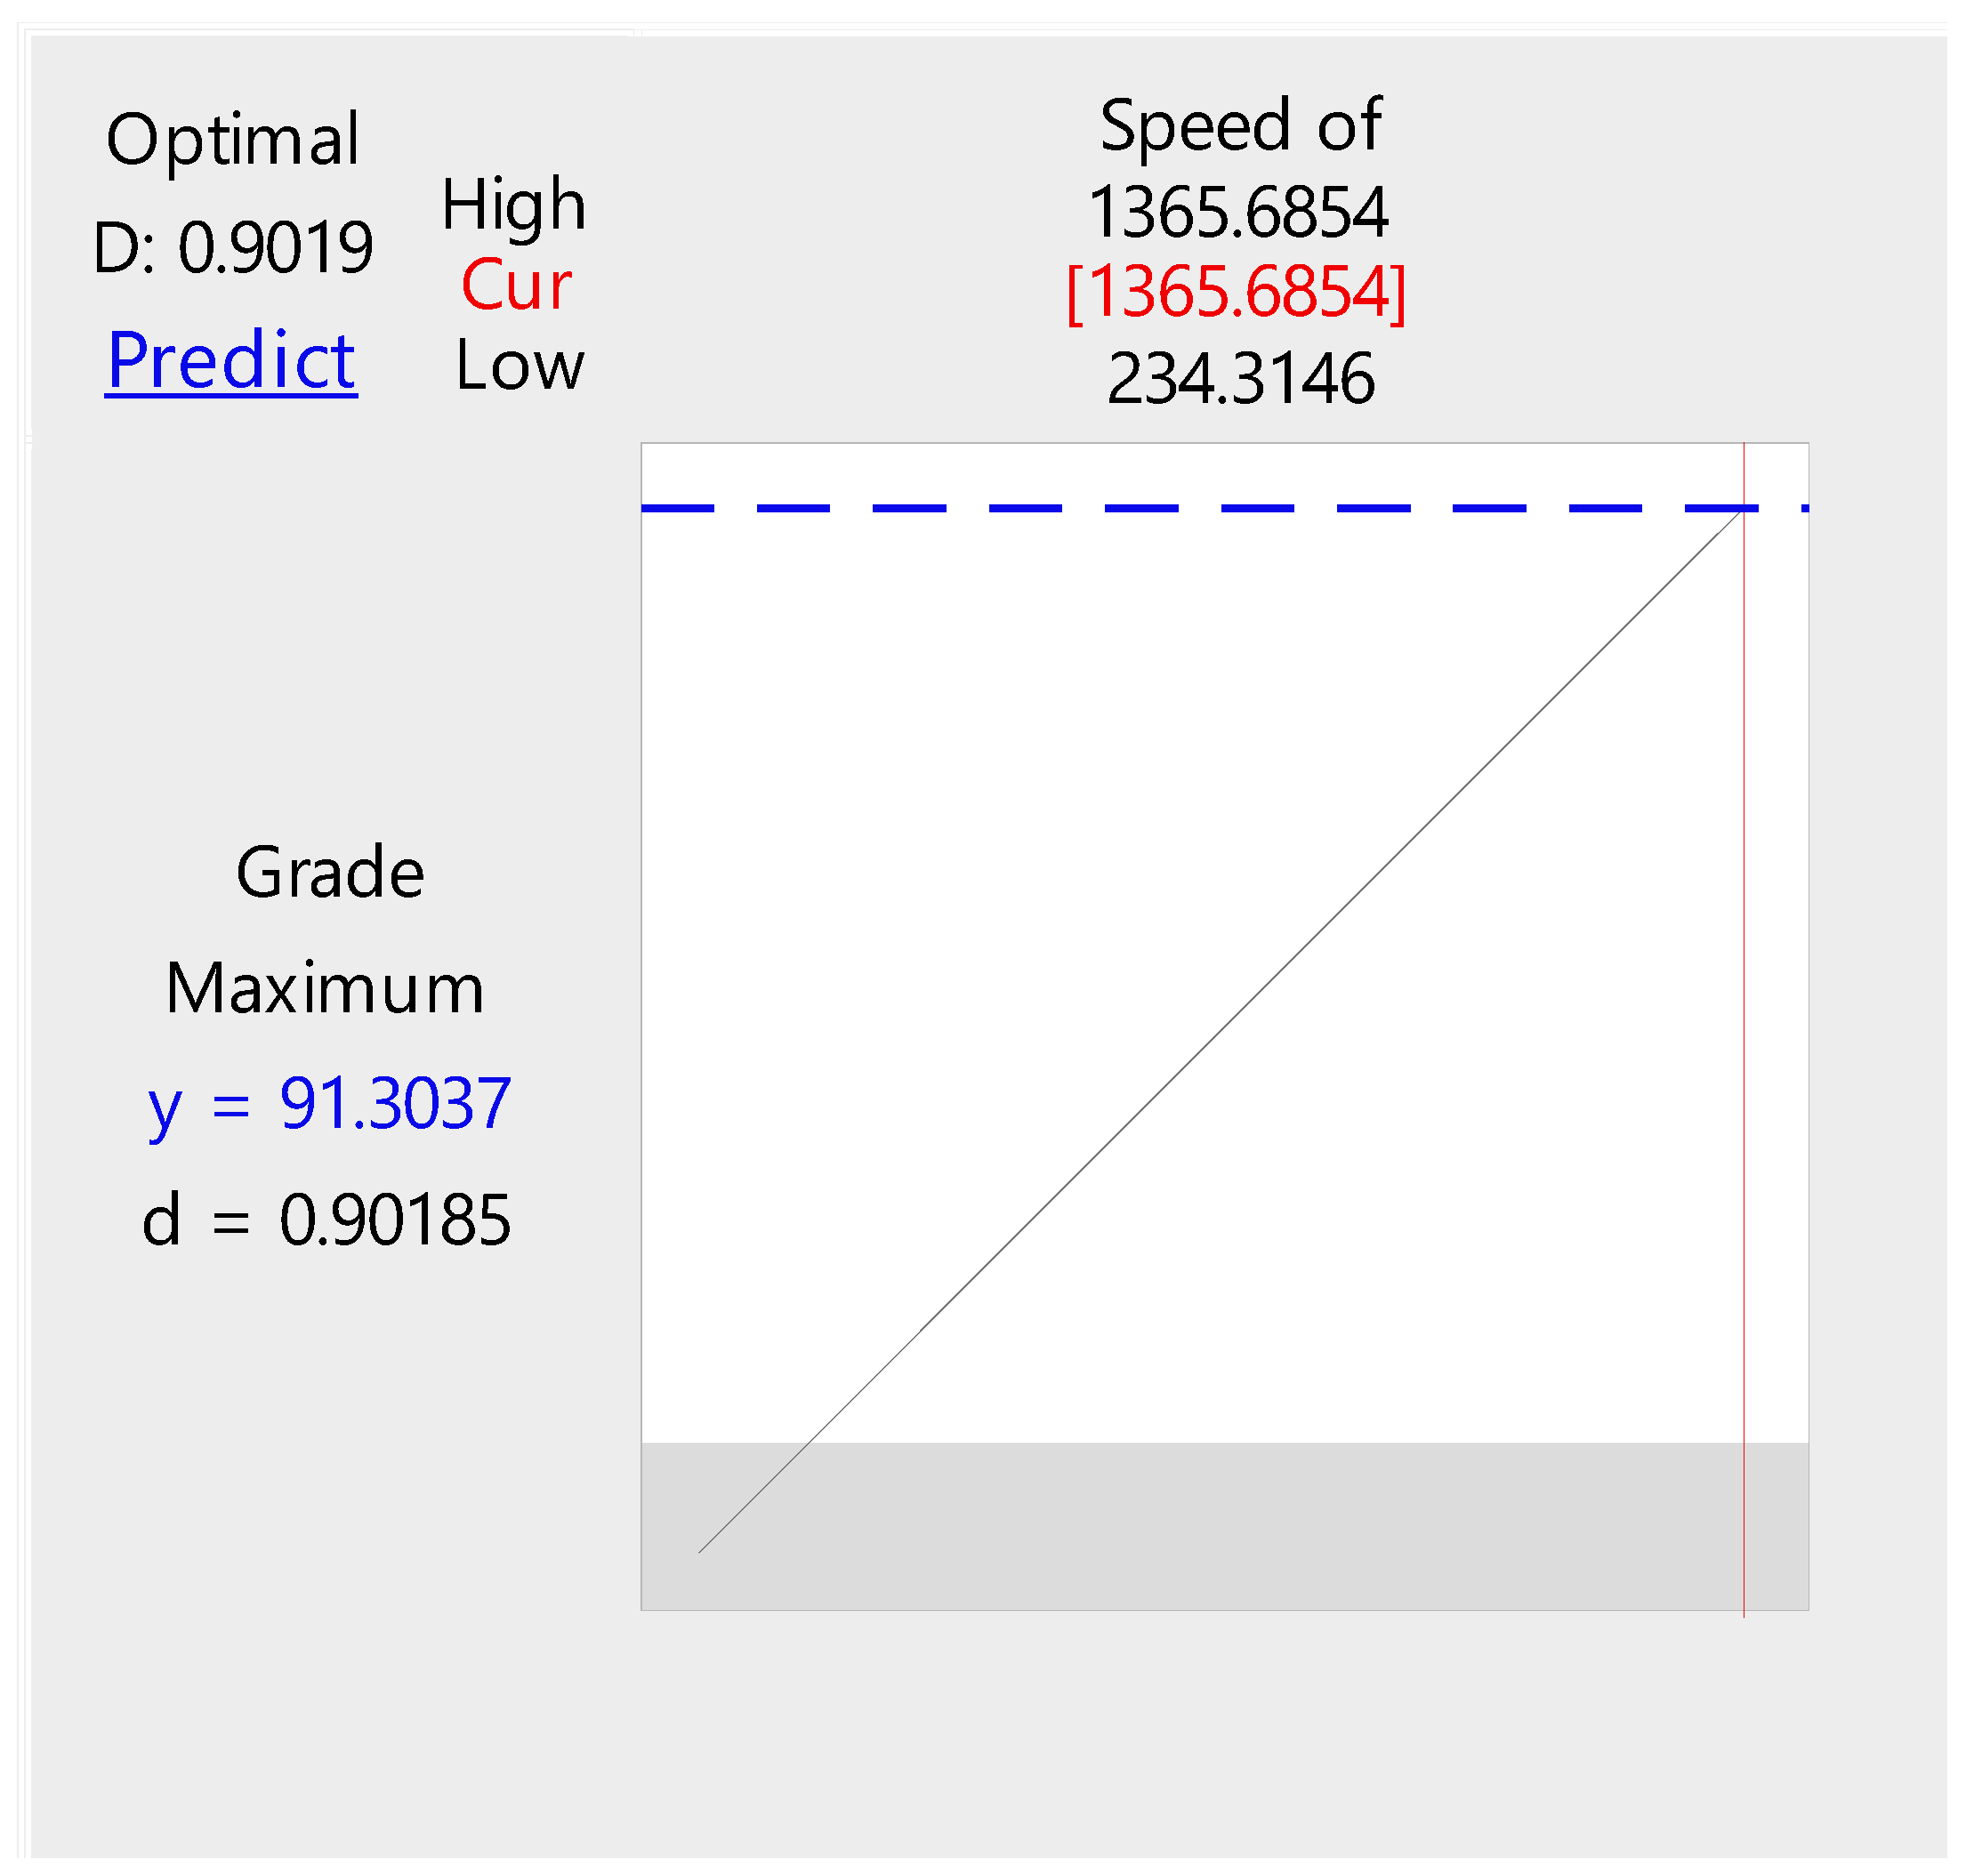
- The statistical model based on air classifier experiments for grade optimized the speed of the fan to be 1366 rpm. The model predicts that the maximum grade will be 91%. The grade was found to only depend upon the speed of fan.
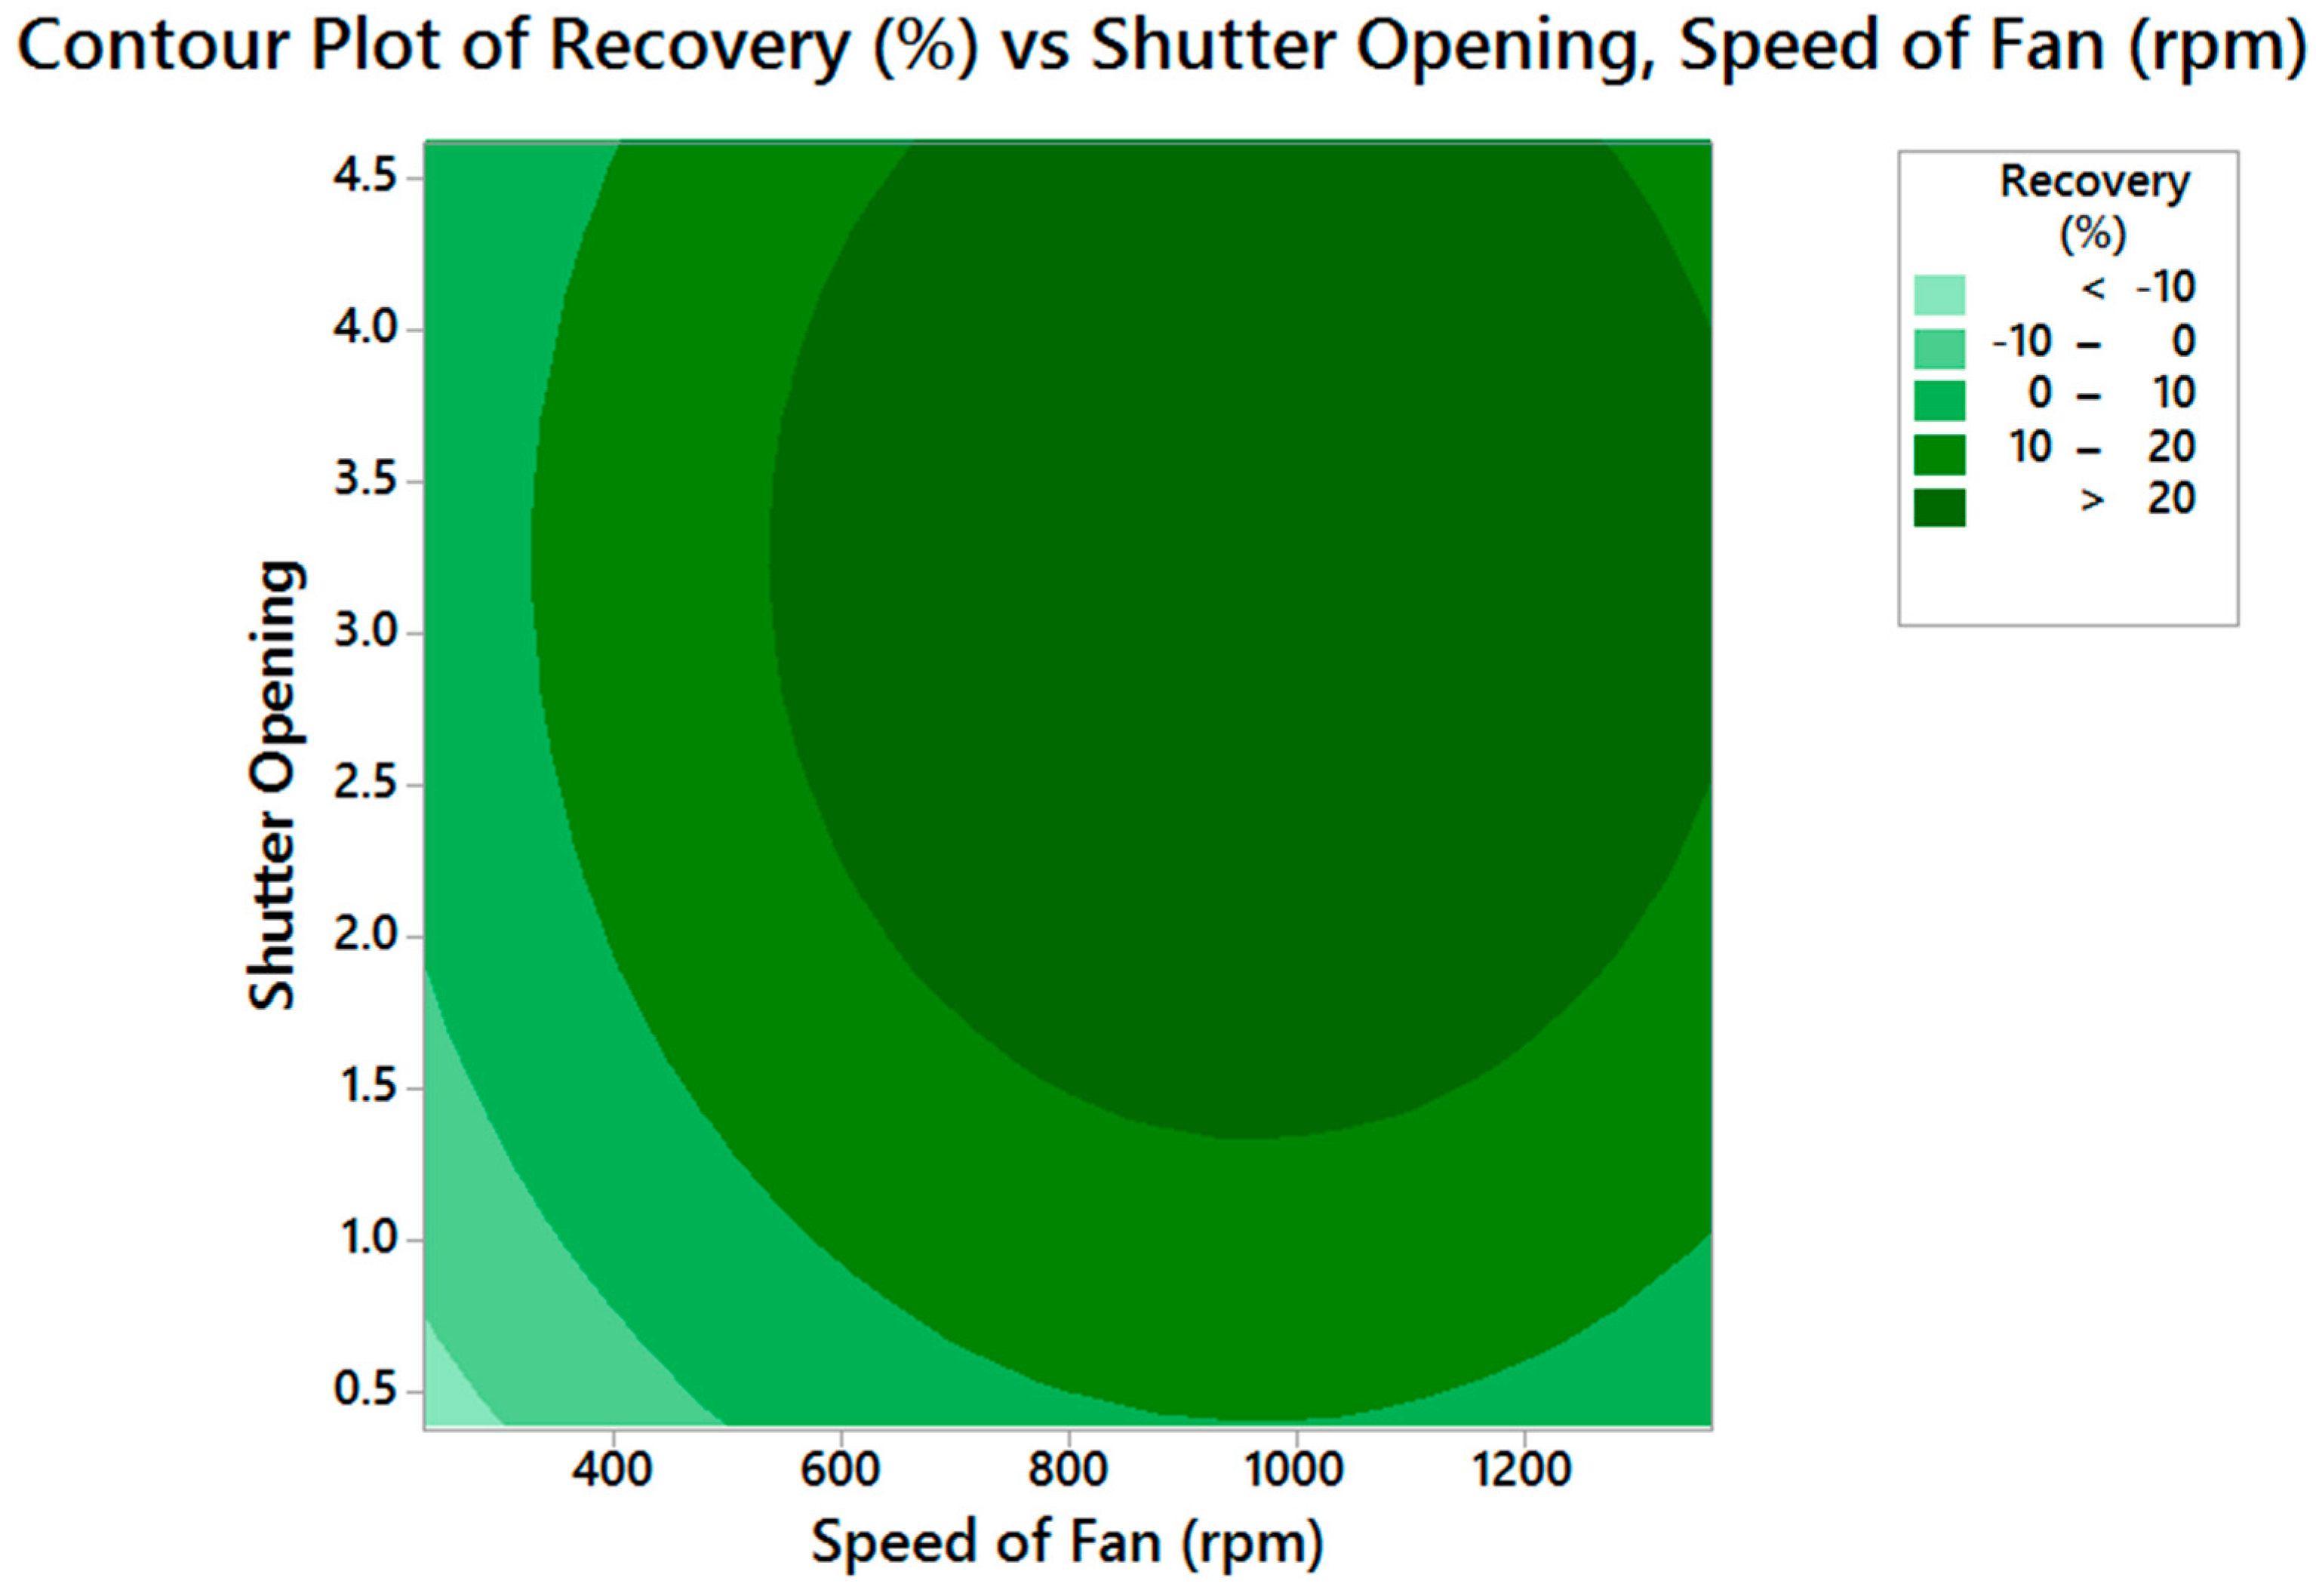
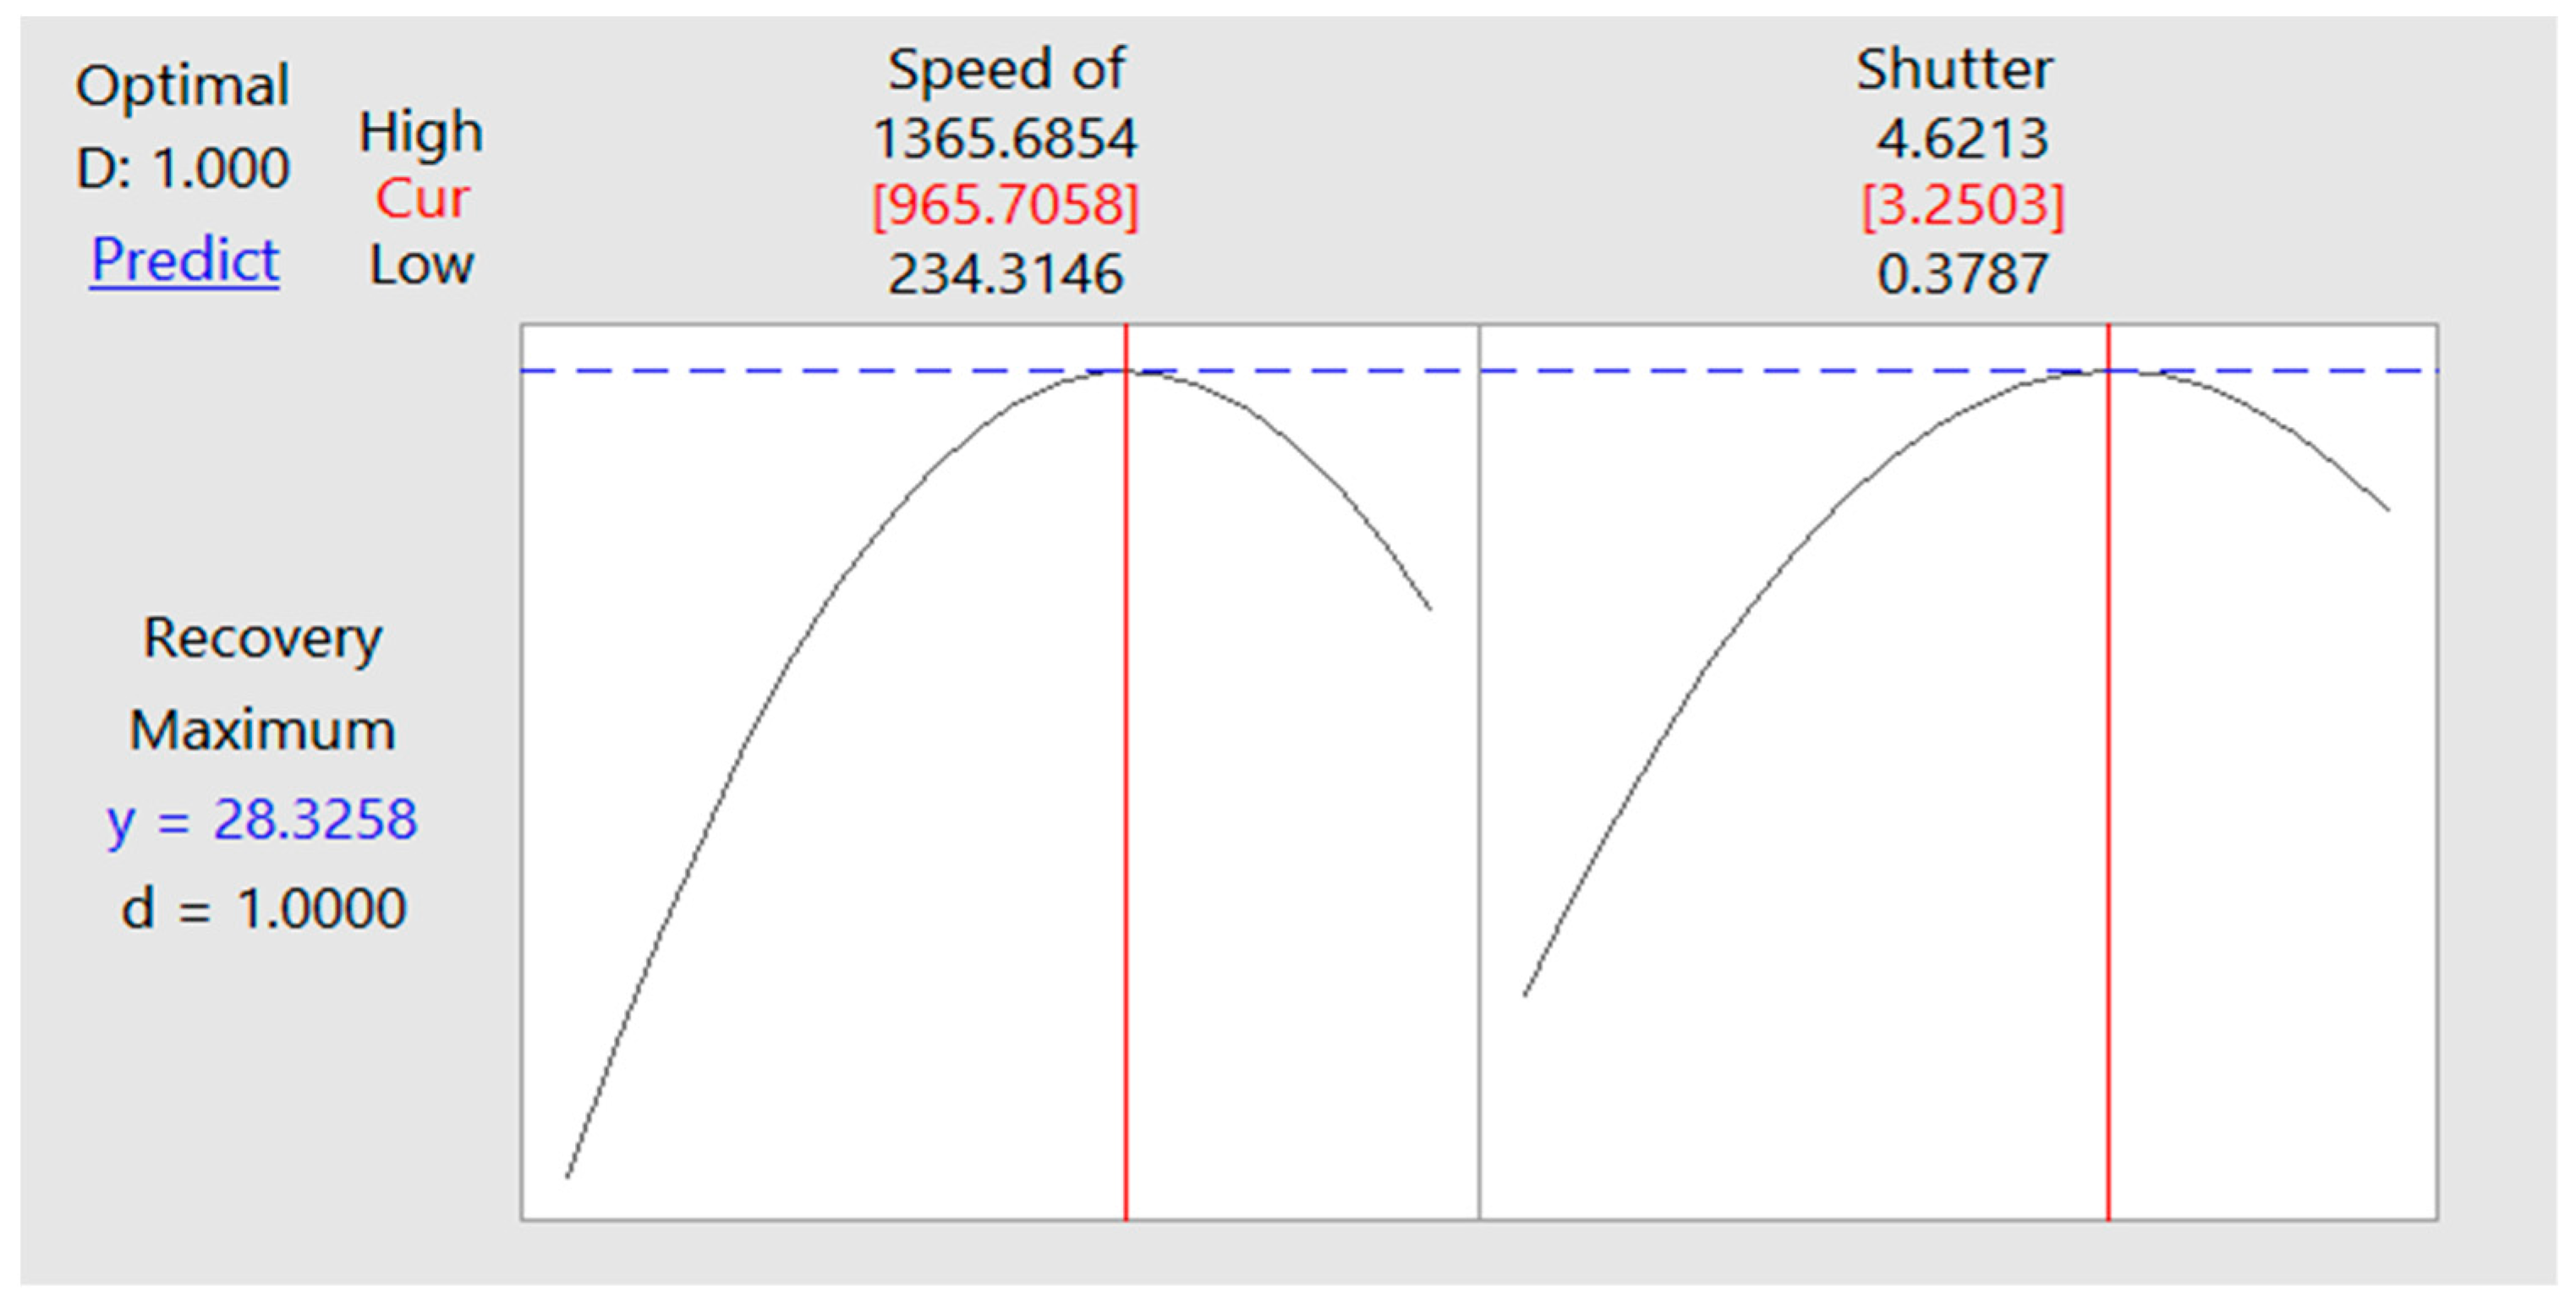
- The statistical model based on air classifier experiments for recovery optimized the speed of the fan at 966 rpm. The shutter opening’s optimized value was 3.2. With these input variables, the model predicts that the maximum recovery of 28.4% will be achieved.
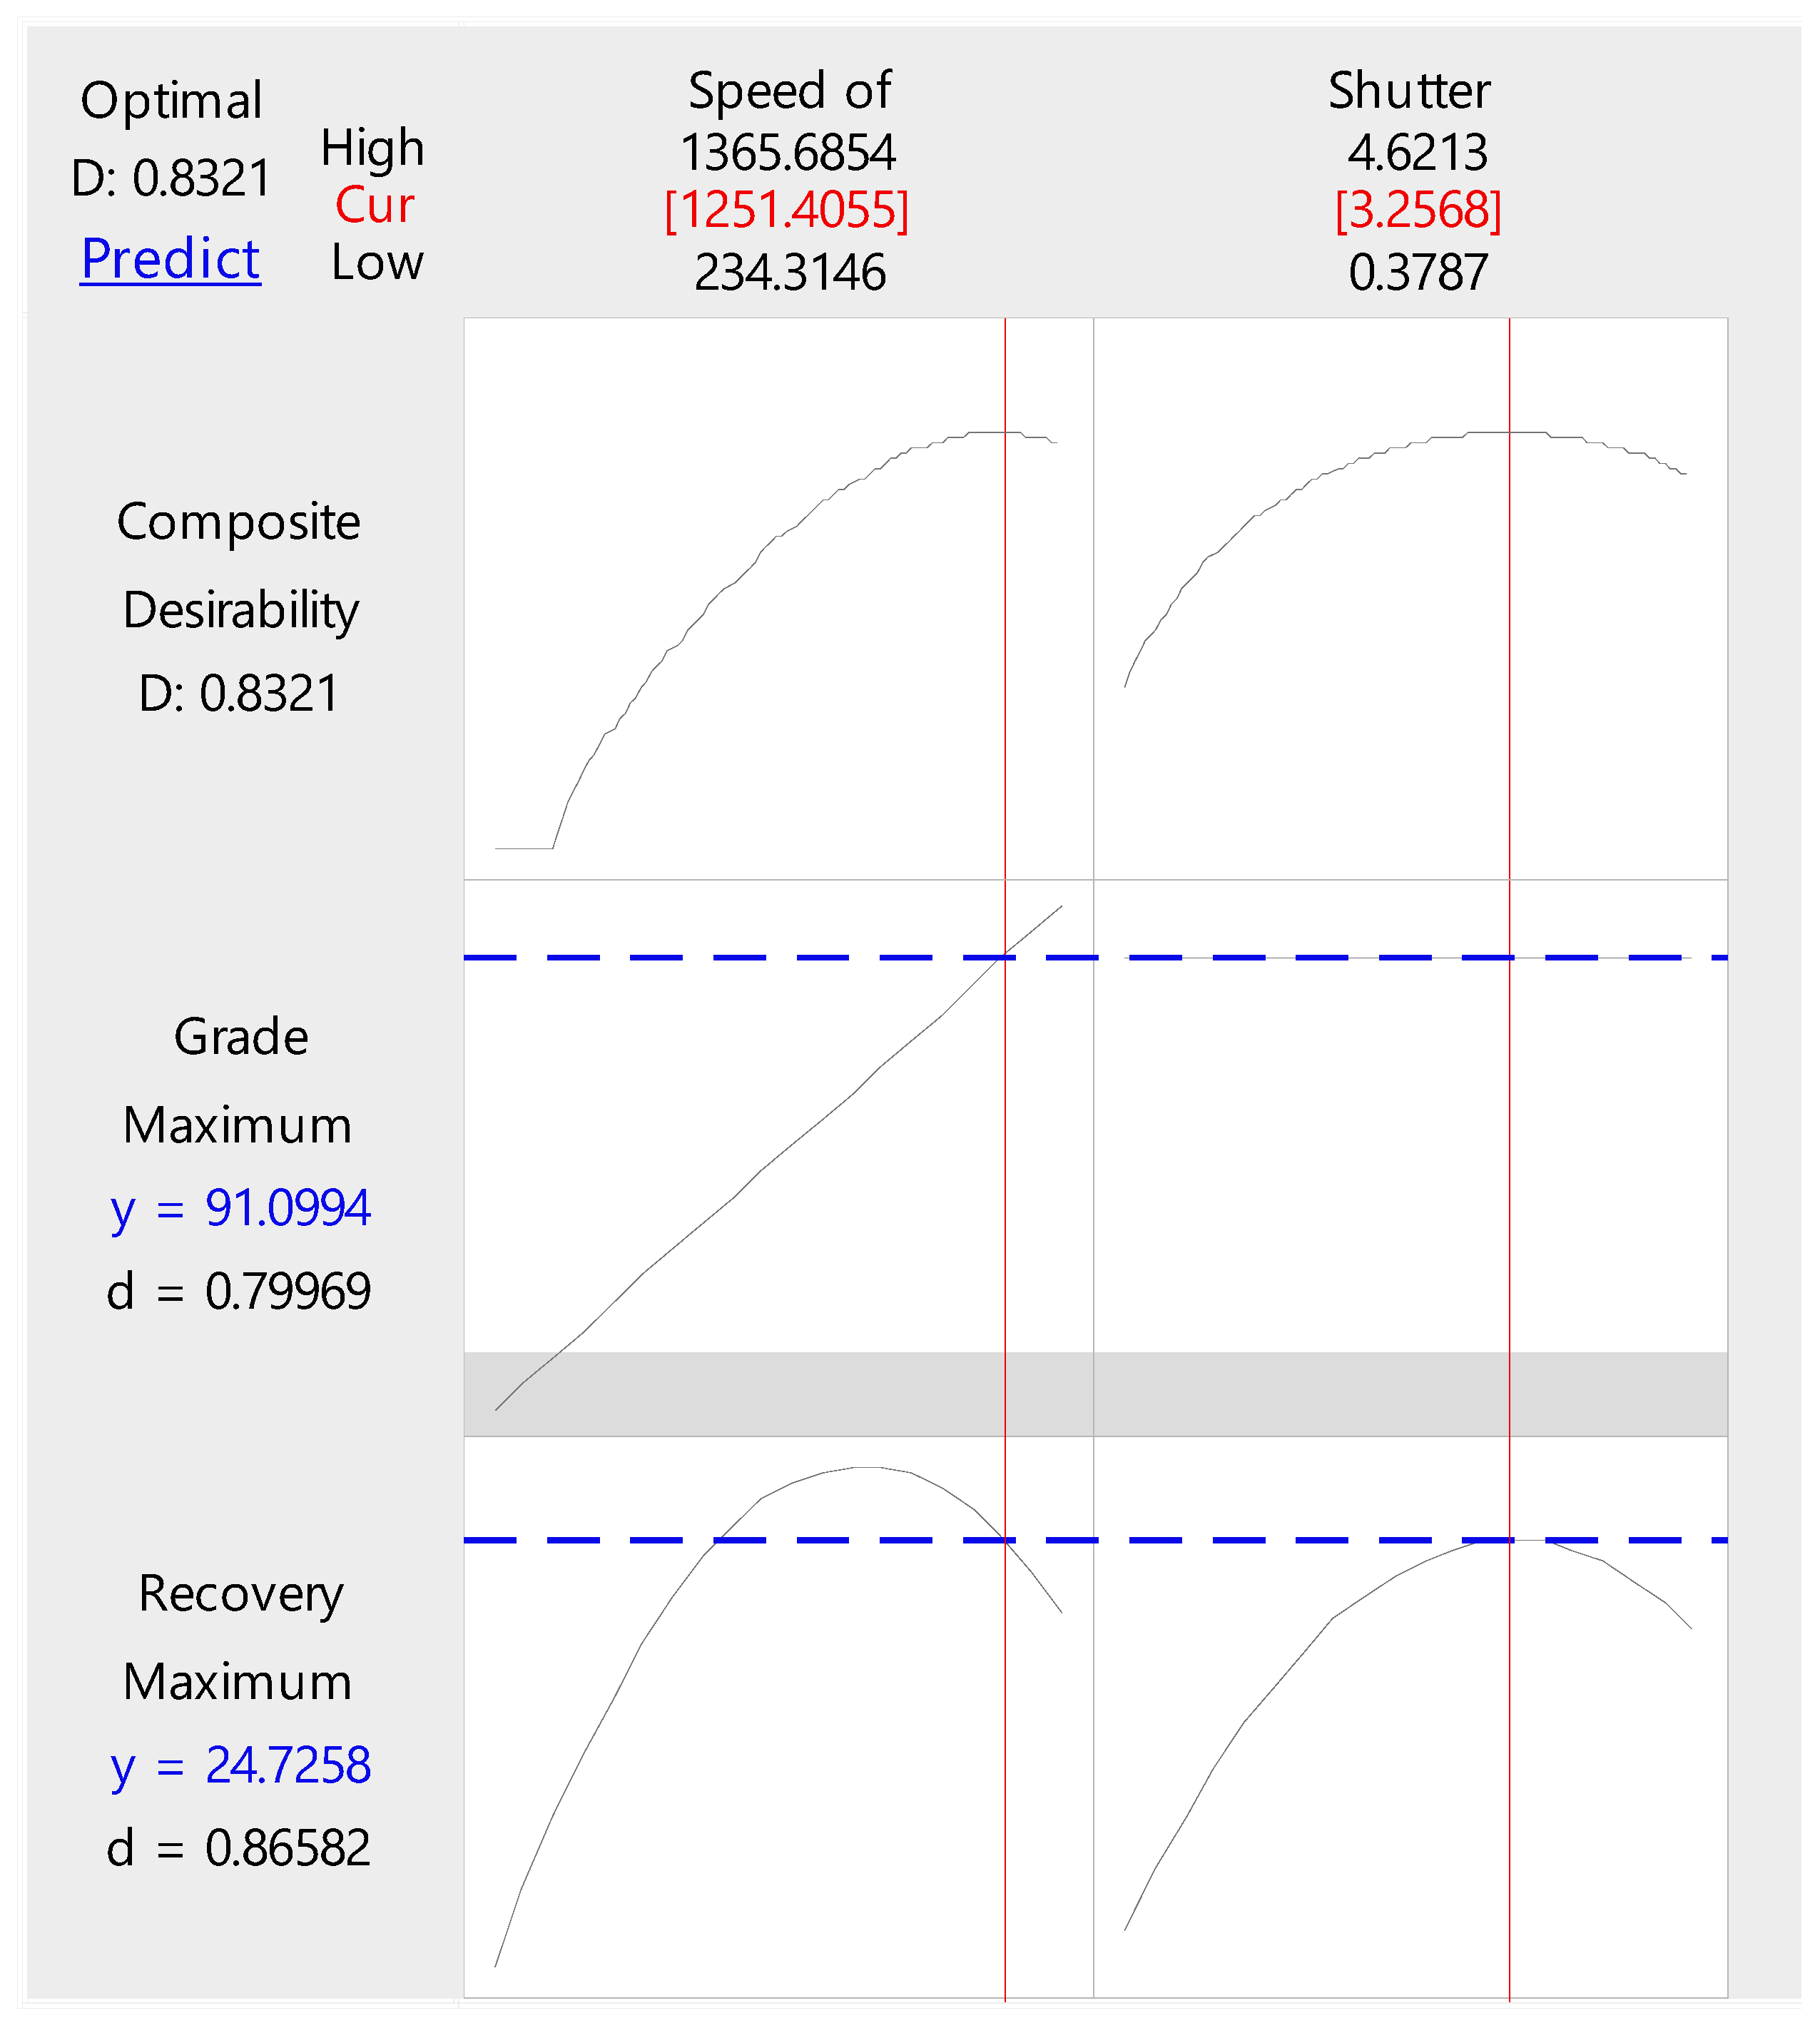
- To optimize both grade and recovery of the air classifier, the models predicted that the fan speed and shutter opening should be 1251 rpm and 3.0, respectively. At these values, the predicted recovery was found to be 24.7% and grade to be 91.1%.
Author Contributions
Funding
Institutional Review Board Statement
Informed Consent Statement
Data Availability Statement
Acknowledgments
Conflicts of Interest
References
- Schroeder, P.A. Kaolin. New Georgia Encyclopedia. 2018. Available online: https://www.georgiaencyclopedia.org/articles/business-economy/kaolin (accessed on 11 January 2019).
- Pohl, W.L. Economic Geology: Principles and Practice; Wiley-Blackwell: Chichester, UK, 2011; ISBN 978-1-4443-3662-7. [Google Scholar]
- Larroyd, F.; Petter, C.O.; Sampaio, C.H. Purification of north Brazilian kaolin by selective flocculation. Miner. Eng. 2002, 15, 1191–1192. [Google Scholar] [CrossRef]
- Agrawal, P.; Misra, S.N.; Sharma, T. Beneficiation of Low Grade Kaolin by High Shear Agitation with Dispersant (HSD) Pre-Treatment for High Yield and Improved Fired Colour. Trans. Indian Ceram. Soc. 2014, 73, 48–57. [Google Scholar] [CrossRef]
- Murray, H.H. Major kaolin processing developments. Int. J. Miner. Process. 1980, 7, 263–274. [Google Scholar] [CrossRef]
- Avadiar, L.; Leong, Y.-K.; Fourie, A. Sedimentation of Kaolin: Effects of Polyethylenimine (Pei) Flocculants and Application of Shear. In Proceedings of the Chemeca 2012: Quality of Life through Chemical Engineering, Wellington, New Zealand, 23–26 September 2012; Engineers Australia: Barton, KS, USA, 2012. [Google Scholar]
- Iannicelli, J.; Pechin, J.; Ueyama, M.; Ohkura, K.; Hayashi, K.; Sato, K.; Lauder, A.; Rey, C. Magnetic Separation of Kaolin Clay Using a High Temperature Superconducting Magnet System. In IEEE Transactions on Applied Superconductivity; IEEE: Piscataway, NJ, USA, 1997; Volume 7. [Google Scholar]
- Abdel-Khalek, N.A.; Selim, K.A.; Yassin, K.E.; Hamdy, A.; Heikal, M.A. Upgrading of low grade egyptian kaolin ore using magnetic separation. J. Basic Environ. Sci. 2017, 4, 247–252. [Google Scholar]
- Luz, A.B.; Middea, A. Purification of kaolin by selective flocculation. In Proceedings of the 43rd Annual Conference of Metallurgist of CIM, Hamilton, ON, Canada, 22–25 August 2004; pp. 243–253. [Google Scholar]
- Kumar, G.; Menon, S.K.; Agrawal, Y.K.; Vora, S.B. Selective flocculation separation of iron and titanium from Kutch kaolins. Indian J. Eng. Mater. Sci. 2001, 8, 170–176. (In Indian) [Google Scholar]
- Yoon, R.-H.; Nagaraj, D.R.; Wang, S.S.; Hildebrand, T.M. Benefication of kaolin clay by froth flotation using hydroxamate collectors. Miner. Eng. 1992, 5, 457–467. [Google Scholar] [CrossRef]
- Luz, A.; Yildirim, I.; Yoon, R.-H. Purification of Brazilian Kaolin Clay by Flotation. Dev. Miner. Process. 2000, 13, C8b-79–C8b-83. [Google Scholar]
- Hosseini, M.R.; Ahmadi, A. Biological Beneficiation of Kaolin: A Review on Iron Removal. Appl. Clay Sci. 2015, 107, 238–245. [Google Scholar] [CrossRef]
- de Mesquita, L.M.S.; Rodrigues, T.; Gomes, S.S. Bleaching of Brazilian kaolins using organic acids and fermented medium. Miner. Eng. 1996, 9, 965–971. [Google Scholar] [CrossRef]
- Zegeye, A.; Yahaya, S.; Fialips, C.I.; White, M.L.; Gray, N.D.; Manning, D.A.C. Refinement of industrial kaolin by microbial removal of iron-bearing impurities. Appl. Clay Sci. 2013, 86, 47–53. [Google Scholar] [CrossRef]
- Maurya, C.B.; Dixit, S.G. Effect of pH on the high-gradient magnetic separation of kaolin clays. Int. J. Miner. Process. 1990, 28, 199–207. [Google Scholar] [CrossRef]
- Guo, M.; Lin, Y.; Xu, X.; Chen, Z. Bioleaching of iron from kaolin using Fe(III)-reducing bacteria with various carbon nitrogen sources. Appl. Clay Sci. 2010, 48, 379–383. [Google Scholar] [CrossRef]
- Cameselle, C.; Ricart, M.T.; Núñez, M.J.; Lema, J.M. Iron removal from kaolin. Comparison between “in situ” and “two-stage” bioleaching processes. Hydrometallurgy 2003, 68, 97–105. [Google Scholar] [CrossRef]
- Prasad, M.S.; Reid, K.J.; Murray, H.H. Kaolin: Processing, properties and applications. Appl. Clay Sci. 1991, 6, 87–119. [Google Scholar] [CrossRef]
- Jankovic, A.; Suthers, S.; Wills, T.; Valery, W. Evaluation of dry grinding using HPGR in closed circuit with an air classifier. Miner. Eng. 2015, 71, 133–138. [Google Scholar] [CrossRef]
- Altun, O.; Benzer, H.; Dundar, H.; Aydogan, N.A. Comparison of open and closed circuit HPGR application on dry grinding circuit performance. Miner. Eng. 2011, 24, 267–275. [Google Scholar] [CrossRef]
- Kogel, J.E. Mining and processing kaolin. Elements 2014, 10, 189–193. [Google Scholar] [CrossRef]
- Northey, S.A.; Mudd, G.M.; Saarivuori, E.; Wessman-Jääskeläinen, H.; Haque, N. Water footprinting and mining: Where are the limitations and opportunities? J. Clean. Prod. 2016, 135, 1098–1116. [Google Scholar] [CrossRef]
- Peng, Y.; Li, Y.; Li, W.; Fang, X.; Liu, C.; Fan, R. Elimination of adverse effects of seawater on molybdenite flotation using sodium silicate. Miner. Eng. 2020, 146, 106108. [Google Scholar] [CrossRef]
- Reyes, C.; Álvarez, M.; Ihle, C.F.; Contreras, M.; Kracht, W. The influence of seawater on magnetite tailing rheology. Miner. Eng. 2019, 131, 363–369. [Google Scholar] [CrossRef]
- Jeldres, R.I.; Arancibia-Bravo, M.P.; Reyes, A.; Aguirre, C.E.; Cortes, L.; Cisternas, L.A. The impact of seawater with calcium and magnesium removal for the flotation of copper-molybdenum sulphide ores. Miner. Eng. 2017, 109, 10–13. [Google Scholar] [CrossRef]
- Aitimbetov, T.; White, D.M.; Seth, I. Biological gold recovery from gold–cyanide solutions. Int. J. Miner. Process. 2005, 76, 33–42. [Google Scholar] [CrossRef]
- Rubio, J.; Souza, M.L.; Smith, R.W. Overview of flotation as a wastewater treatment technique. Miner. Eng. 2002, 15, 139–155. [Google Scholar] [CrossRef]
- Gregory, S. Top 12 Kaolin Exporting Countries—WorldAtlas.com. Economics. 2017. Available online: https://www.worldatlas.com/articles/top-12-kaolin-exporting-countries.html (accessed on 2 December 2018).
- Muslim, M.; Akhtar, T.; Khan, Z.M.; Khan, T. Geology of Nagar Parkar area, Thar Parkar district, Sindh, Pakistan. Geol. Surv. Pak. Inf. Release 1997, 605, 1–21. [Google Scholar]
- Ismail, S.; Husain, V.; Hamid, G.; Bilal, M. Physico-chemical characteristics of Nagar Parkar kaolin deposits, Thar Parkar district, Sindh, Pakistan. J. Himal. Earth Sci. 2015, 48, 50–58. [Google Scholar]
- Holmes, C.G. Grinding Method and Apparatus. Google Patents US1807383A, 26 May 1931. Available online: https://patents.google.com/patent/US1807383 (accessed on 1 December 2019).
- Baláž, P.; Achimovičová, M.; Sanchez, M.; Kammel, R. Attrition Grinding and Leaching of Enargite Concentrate. Metall 1999, 53, 53–56. [Google Scholar]
- Piga, L.; Marruzzo, G. Preconcentration of an Italian talc by magnetic separation and attrition. Int. J. Miner. Process. 1992, 35, 291–297. [Google Scholar] [CrossRef]
- Feng, Y.; Liu, J.; Liu, S. Effects of operating parameters on flow field in a turbo air classifier. Miner. Eng. 2008, 21, 598–604. [Google Scholar] [CrossRef]
- Eswaraiah, C.; Angadi, S.I.; Mishra, B.K. Mechanism of particle separation and analysis of fish-hook phenomenon in a circulating air classifier. Powder Technol. 2012, 218, 57–63. [Google Scholar] [CrossRef]
- Everett, J.; Jeffrey Peirce, J. Effect of feed rate and classifier height on air classification. J. Environ. Eng. 1990, 116, 735–745. [Google Scholar] [CrossRef]
- Danishwar, M.; Hamid, A.; Hayat, M. Quadratic Mathematical Modeling of Sustainable Dry Beneficiation of Kaolin; University of Engineering and Technology: Lahore, Pakistan, 2019. [Google Scholar]
- Davis, S.B.; Dawson, M.F. A laboratory study of attrition grinding. J. S. Afr. Inst. Min. Metall. 1989, 89, 231–241. [Google Scholar]
- Davis, E.G. Beneficiation of Olivine Foundry Sand by Differential Attrition Grinding. U.S. Patent US4039625A, 2 August 1977. [Google Scholar]
- Murray, H.H.; Alves, C.A.; Bastos, C.H. Mining, processing and applications of the Capim Basin kaolin, Brazil. Clay Miner. 2007, 42, 145–151. [Google Scholar] [CrossRef]
- Mukherjee, S. Applied Mineralogy: Applications in Industry and Environment; Springer Science & Business Media, Capital Publishing Company: New Dehli, India, 2012; ISBN 940071162X. [Google Scholar]
- Ahmadi, M.; Vahabzadeh, F.; Bonakdarpour, B.; Mofarrah, E.; Mehranian, M. Application of the central composite design and response surface methodology to the advanced treatment of olive oil processing wastewater using Fenton’s peroxidation. J. Hazard. Mater. 2005, 123, 187–195. [Google Scholar] [CrossRef]
- Box, G.E.P.; Draper, N.R. A Basis for the Selection of a Response Surface Design. J. Am. Stat. Assoc. 1959, 54, 622–654. [Google Scholar] [CrossRef]
- Peduzzi, P.N.; Hardy, R.J.; Holford, T.R. A stepwise variable selection procedure for nonlinear regression models. Biometrics 1980, 36, 511–516. [Google Scholar] [CrossRef] [PubMed]


| Age | Group | Rock/Deposits |
|---|---|---|
| Early Recent to Recent | Unconsolidated Quaternary Deposits | Stream sandstone and food pain de-posits, Playa and evaporate deposit. Outwash deposits, piedmont, and sub-piedmont deposits |
| Unconformity | ||
| Cretaceous to Eocene | Sedimentary Rocks | Acolian sand deposits, Rann of Kutch mud deposits Residual deposits; Laterite/Kaolin Bartala Sedimentary unit |
| Unconformity | ||
| Precambrian | Nagar Parkar Igneous Complex | Basement (metabasites) with acidic basic dykes and pink/grey granite |
| Operating Variables | Operating Values |
|---|---|
| Nature of balls | Rubber balls with iron core |
| Resident Time | 5, 10, 15, 20, 25 and 30 min |
| Ball Volume Percentage | 40% |
| StdOrder | RunOrder | PtType | Blocks | Speed of Fan (rpm) | Shutter Opening |
|---|---|---|---|---|---|
| 5 | 1 | −1 | 1 | 234.3 | 2.5 |
| 9 | 2 | 0 | 1 | 800.0 | 2.5 |
| 10 | 3 | 0 | 1 | 800.0 | 2.5 |
| 12 | 4 | 0 | 1 | 800.0 | 2.5 |
| 3 | 5 | 1 | 1 | 400.0 | 4.0 |
| 1 | 6 | 1 | 1 | 400.0 | 1.0 |
| 6 | 7 | −1 | 1 | 1365.7 | 2.5 |
| 7 | 8 | −1 | 1 | 800.0 | 0.4 |
| 2 | 9 | 1 | 1 | 1200.0 | 1.0 |
| 4 | 10 | 1 | 1 | 1200.0 | 4.0 |
| 8 | 11 | −1 | 1 | 800.0 | 4.6 |
| 13 | 12 | 0 | 1 | 800.0 | 2.5 |
| 11 | 13 | 0 | 1 | 800.0 | 2.5 |
| Compounds | Avg. Percentage |
|---|---|
| Kaolinite | 59.6 |
| SiO2 | 12.0 |
| TiO2 | 1.2 |
| Fe2O3 | 4.8 |
| MgCO3 | 4.8 |
| CaCO3 | 8.3 |
| CaO | 0.8 |
| MgO | 3.4 |
| MnO2 | 5.1 |
| Elements | Wt. Percentage |
|---|---|
| SiO2 | 52.90 |
| TiO2 | 1.69 |
| Al2O3 | 34.23 |
| Fe2O3 | 0.91 |
| MgO | - |
| CaO | 0.24 |
| Na2O | - |
| K2O | 0.20 |
| P2O5 | 0.16 |
| LOI | 9.68 |
| Elements | Wt. Percentage |
|---|---|
| SiO2 | 44.76 |
| TiO2 | 1.64 |
| Al2O3 | 33.49 |
| Fe2O3 | 1.07 |
| MgO | 0.42 |
| CaO | 0.19 |
| Na2O | 2.25 |
| K2O | 0.19 |
| P2O5 | 0.14 |
| LOI | 15.84 |
| Constituent | Feed | Product 1 (−400 Mesh) | Product 2 (Conc. of Air Classifier) |
|---|---|---|---|
| Kaolinite | 59.6% | 90.6% | 91.2% |
| SiO2 | 12.0% | 0.1% | 1.5% |
| TiO2 | 1.2% | 1.1% | 0.5% |
| Fe2O3 | 4.8% | 2.3% | 0.1% |
| MgCO3 | 4.8% | 3.0% | 3.5% |
| CaCO3 | 8.3% | 0.4% | 0.2% |
| CaO | 0.8% | 0.1% | 0.1% |
| MgO | 3.4% | 0.0% | 0.1% |
| MnO2 | 5.1% | 2.4% | 2.9% |
Publisher’s Note: MDPI stays neutral with regard to jurisdictional claims in published maps and institutional affiliations. |
© 2021 by the authors. Licensee MDPI, Basel, Switzerland. This article is an open access article distributed under the terms and conditions of the Creative Commons Attribution (CC BY) license (https://creativecommons.org/licenses/by/4.0/).
Share and Cite
Hayat, M.B.; Danishwar, M.; Hamid, A.; Zaid, M.M.; Emad, M.Z. Quadratic Mathematical Modeling of Sustainable Dry Beneficiation of Kaolin. Minerals 2021, 11, 429. https://doi.org/10.3390/min11040429
Hayat MB, Danishwar M, Hamid A, Zaid MM, Emad MZ. Quadratic Mathematical Modeling of Sustainable Dry Beneficiation of Kaolin. Minerals. 2021; 11(4):429. https://doi.org/10.3390/min11040429
Chicago/Turabian StyleHayat, Muhammad Badar, Muhammad Danishwar, Amna Hamid, Mirza Muhammad Zaid, and Muhammad Zaka Emad. 2021. "Quadratic Mathematical Modeling of Sustainable Dry Beneficiation of Kaolin" Minerals 11, no. 4: 429. https://doi.org/10.3390/min11040429