Article

Interfacial Structure Change and Selective Dissolution of Columbite–(Fe) Mineral during HF Acid Leaching

1
School of Material Science and Engineering, Shanghai University, Shanghai 200444, China
2
State Key Laboratory of Advanced Special Steels, Shanghai University, Shanghai 200444, China
3
Key Laboratory of Modern Metallurgy and Material Preparation, Shanghai University, Shanghai 200444, China
*
Author to whom correspondence should be addressed.
Minerals 2021, 11(2), 146; https://doi.org/10.3390/min11020146
Submission received: 30 December 2020 / Revised: 21 January 2021 / Accepted: 28 January 2021 / Published: 31 January 2021
(This article belongs to the Special Issue Rare Metals Extraction and Processing)

Abstract

:
The goal of the paper is to study the charge transfer and reactions at the columbite-(Fe) (FeNb2O6) mineral surface during the HF leaching process. In this paper, X-ray photoelectron spectroscopy (XPS), leaching experiments, and density functional theory (DFT) calculations were used to study the surface element adsorption, charge distribution, chemical state, and energy changes of the mineral surface during the process of leaching columbite–(Fe) with different concentrations of hydrofluoric acid. The results showed that as the concentration of F atoms was increased during the acid leaching process, the Nb–O bond was more likely to be broken than the Fe–O bond; the amount of charge transferred from Nb atom to F atom (0.78 e–0.94 e/atom) was greater than that from Fe atom to the F atom (0.25 e–0.28 e/atom), so it was determined that compared to Fe atoms, it was easier for the Nb atoms to bind to F. The results of XPS analysis showed that the electron binding energies of Nb5+–O, Fe3+–O, and Fe2+–O bonds on the mineral surface increased sequentially, and the M–O bond broke during the acid leaching process, forming more stable M–F bonds. Therefore, the Nb5+–F bonds were easier to form a stable structure. Combined with the ICP results, it was found that in the filtrate after 5M HF and 10M HF acid leaching minerals, c(Nb)/c(Fe) were 2.69 and 2.95, respectively, and the concentration ratio of Nb to Fe element in the mineral was 2 which was lower than 2.69 and 2.95, confirming the result of DFT calculation and illustrating that Nb atoms in columbite-(Fe) mineral were more soluble than Fe atoms.

1. Introduction

In nature, columbite is a multi-component ore mineral. The (Fe,Mn)(Ta,Nb)2O6 group compounds include columbite–(Fe) (FeNb2O6), columbite–(Mn) (MnNb2O6), tapiolite–(Mn) (MnTa2O6), and tapiolite–(Fe) FeTa2O6. There are two types of FeNb2O6 crystal structures. One is the orthorhombic niobium mineral found in columbite (Fe, Mn) (Nb, Ta)2O6, and the other produced by high temperature modification of ferroniobium mineral in a reducing atmosphere [1,2]. Industrially, the main method of extracting these Nb and Ta from columbite–(Fe)–columbite–(Mn) Series ore is hydrofluoric acid decomposition [3]. In this method, hydrofluoric acid with concentration of 60–70% is used to decompose columbite–(Fe)–columbite–(Mn) series mineral at 90–100 °C. The main advantages of hydrofluoric acid method are as follows: the process is simple, the decomposition temperature is low (90–100 °C), and the decomposition rate of high grade concentrate is high (98–99%). Therefore, hydrofluoric acid method is widely used. A. I. Nikolaev et al. [4] studied the decrease of the hydrofluoric acid concentration in the niobium- and tantalum-containing solutions by their dilution, evaporation, or precipitation of poorly soluble metal fluorides allowing improvement of the extractive separation of tantalum(V) from niobium(V), and studied the efficiency of decomposition of rare-metal concentrate in continuous countercurrent process with several equilibrium decomposition stages. In the HF leaching process of columbite ore, A. Timofeev [5] used the method of measuring the solubility and saturated vapor pressure of synthetic Nb2O5 (solid) in different concentrations of HF at different temperatures, and studied the dissolution of niobium oxide and the distribution of niobium in aqueous solutions containing HF. At low concentrations of HF, niobium is mainly transported as Nb(OH)4+ complex. At high concentrations of HF, niobium mainly exists in the form of NbF2(OH)3. The research results of A. Timofeev’s study showed that in the niobium oxide ion aqueous solution, increasing the HF concentration was beneficial to the dissolution of niobium oxide, and the pH value was the main factor controlling the dissolution of niobium oxide. Majima et al. [6] studied kinetic of columbite–(Fe)–columbite–(Mn) series ore mineral dissolution in hydrofluoric acid medium with both of H+ and F in the leachate. Their experimental results showed that with increasing the concentration of H+ and F and reaction temperature, the dissolution rate can be effectively increased. Agulyanski [7] has conducted an extensive review on the chemical changes of Nb and Ta in fluoride media. Chanturiya [8] used X-ray spectroscopy (XPS) to study the changes in surface composition and electrochemical properties of columbite. In the extraction process of columbite mineral, the relationship between the composition, structure, and characteristics of the mineral interface and its function for selective leaching is very important to improve the utilization of columbite–(Fe) mineral, but there is no detailed report on the above research field.
When XPS or density functional theory (DFT) methods are used, neither of them are directly theoretically analyzed. However, indirect theoretical evidence for surface states can be obtained from valence band of density of states (DOS) and Mulliken population analysis. XPS combined with DFT can study the electronic structure of the bulk mineral and surfaces, and infer the charge distribution on the surface through Mulliken population analysis. G.U von Oertzen et al. [9] used first-principles density functional and mixed functional calculation methods to study the comparison of the electronic structure of pyrite (100) surface caused by fracture with that of pyrite bulk. Compared with the results of XPS experiment. Mulliken layout analysis confirmed the charge distribution on the surface. Jun Wang et al. [10] used density functional theory (DFT) calculation, XPS, and electrochemical analysis to study the dissolution process and passivation mechanism of chalcopyrite under the action of sulfur and iron oxidizing microorganisms, established the mechanism model of the dissolution and passivation of chalcopyrite by sulfur and iron-oxidizing microorganisms. Ittipon Fongkaew et al. [11] used DFT calculation, X-ray photoelectron spectroscopy (XPS), and other methods to study the core-level energy shift of the LaAlO3 (LAO) surface with H and OH adsorbed at different concentrations, and whether oxygen vacancies existed on the surface. Combined with XPS experiment, the material adsorbed on the surface of LAO and its desorption annealing process were studied, atomic bond energy and core-level spectrum were calculated and analyzed as well.
In order to explore the changes in the interfacial dissolution structure of the columbite–(Fe) mineral during the HF leaching process, the interface reaction and dissolution behavior of the metal elements on the surface of the columbite–(Fe) mineral during the leaching process, and reveal the mineral/liquid interface ions’ adsorption state, charge distribution, determine the binding state of each metal ion and anion in the mineral, and the order of dissolution of metal ions, etc., an ab initio density functional theory calculation method was used in this paper to obtain the bonding tendency during the interface dissolution process as Nb atoms were easier to bond with the F atoms than Fe atoms, and the charge on the Nb atoms were easier to transfer to the F atom than the Fe atoms. The binding energy change measured by XPS, and the plane wave as the basis function were used to calculate the charge transfer, Mulliken population analysis and core-level shift (CLS) of the selected surface analysis [12] in this paper. Simulation combined with structural characterization studied the chemical state and electronic structure changes of FeNb2O6(110) before and after acid leaching. Combined with the changes in the electronic binding energy of O, Nb, and F elements, it was judged that the Nb–O bonds in the columbite–(Fe) mineral were more vulnerable than the Fe–O bonds, Nb–F bonds were more stable than Fe–F bonds, so Nb atoms were judged to be more soluble than Fe atoms in minerals.

2. Calculation Method

The calculations in this study were done through the CASTEP module in the Materials Studio calculation software based on density functional theory (DFT) [12,13]. In the calculation of FeNb2O6, the DFT method used Perdew Burke and Erzerhof (PBE) and GGA (generalized gradient approximation) for the exchange correlation function [14], and UItrasoft pseudopotential was used to describe the interaction between electrons. When calculating the core-level spectrum, On the fly was used to describe the interaction between electrons [11]. The DFT Kohn-Sham equation was solved by using the projection augmented plane wave method (PAW) [15]. The FeNb2O6 system was studied using DFT + U method. Since both Fe and Nb are transition elements, when calculating with the DFT method, U value was added to correct the Fermi level. The U value on the d orbital of Nb atoms was 3.5 eV, the U value on the p orbital of Fe atoms was 3.5 eV. Figure 1 shows the calculated total DOS of FeNb2O6. It could be seen from the figure that the calculated band gap was 2.22 eV, which was the same as the experimental value [16].
The valence electrons selected for the pseudopotential calculation of each atom were O 2s22p4, Fe 3d64s2, and Nb 4s24p64d45s1. According to the test results of plane wave cut-off energy, the cut-off energy used for FeNb2O6 bulk model calculation was 450eV. The integration of the Brillouin zone adopted the Monkhorst-pack scheme, the k points was set to 2 × 3 × 1, the Pulay density mixing method was used in the calculation of self-consistent field (SCF), and the convergence accuracy of SCF was set to 5.0 × 10⁻⁵ eV/atom. The Broyden-Fletcher-Goldfarb-Shanno (BFGS) algorithm was used in the structural optimization of the FeNb2O6 bulk model. The optimization parameters included the convergence criterion of the interaction force between atoms, the internal stress in the crystal and the maximum displacement of the atoms, which were set to 0.1 eV/A, 0.2 GPa, and 5 × 10⁻³ Å, respectively. When these three parameters were optimized at the same time, the sign of structural optimization was that these parameters all reached the convergence standard.
The optimized FeNb2O6 bulk lattice parameters were a = 5.117 Å, b = 5.903 Å, and c = 14.519 Å, and were very close to the experimental parameters (a = 5.049 Å, b = 5.733Å, c = 14.266 Å). After optimizing the structure, the most stable geometry corresponded to the lowest energy surface, the (110) plane. This agrees with the experimental X-ray diffraction of this material indicating the FeNb2O6 (110) surface was selected as the reaction surface [16]. After testing the number of atomic layers and the thickness of the vacuum layer, 7 layers of FeNb2O6 (110) surface were built, and the bottom layer of three layers of atoms were fixed. The thickness of the vacuum layer was 29.51 Å.
According to the test results of plane wave cut-off energy, the cut-off energy used for FeNb2O6 surface calculation was 520 eV. The integration of the Brillouin zone adopted the Monkhorst-pack scheme, the k points was set to 3 × 3 × 1, the convergence accuracy of SCF was set to 5.0 × 10⁻⁵ eV/atom. The optimization parameters of the convergence criterion of the interaction force between atoms, the internal stress in the crystal, and the maximum displacement of the atoms, were set to 0.1 eV/A, 0.2 GPa, and 5 × 10⁻³ Å, respectively.
The optimized bulk FeNb2O6 is shown in Figure 2. It could be seen from Figure 2 that the chemical bonds in the crystal structure of FeNb2O6 were basically Fe–O bonds and Nb–O bonds, and there was no direct formation of chemical bonds between Fe and Nb.
In order to ensure that the adsorption model was closer to the real system, five models were used in the calculation: FeNb2O6 (110) system, FeNb2O6 (110) system with one H atom and one F atom (an Nb atom was select, and placed an F atom near the selected Nb atom), and two F atoms (an Fe atom and a Nb atom was select, and place an F atom near them respectively) FeNb2O6(110) system with 3 F atoms (placed two F atoms near the selected Nb, and placed one F atom near Fe) FeNb2O6(110) system and FeNb2O6(110) system with 4 F atoms (placed two F atoms on each selected Nb and Fe) and 6 F atoms (placed three F atoms on each selected Nb and Fe).
Core-level binding energy shift (ECLS) is the change of specific core-level binding energy (BE) of interested atoms and reference atoms
ECLS = BE – BEref
where BE is defined as the energy required to remove the electron from the atom of interest. Initial state (IS) and final state (FS) approximations were developed, depending on the actual situation
BEiIS = −εiIS
The IS approximation ignores the fact that the core electron I of the interested atom may relax and shield after IS is excited, which generally underestimates the BE. Relaxation/shielding is considered by the FS approximation, and the binding energy is calculated by the difference between the total energy of two separations,
BEFSi = E(ni − 1) – E(ni)
where, E(ni – 1) is the total energy of the excited system that removed an electron from a specific nuclear orbital to the valence system (TM surface), and E(ni) is the total energy of the ground state. In this case, the total energy of the excited state system is obtained by minimizing the electron configuration in the presence of nuclear pores and contained the corresponding electron relaxation (FS effect) [17].

3. Material and Experimental Method

The FeNb2O6 used in this paper was natural columbite–(Fe) from Inner Mongolia region, China, with the space group Pbcn, and the lattice parameters were a = 14.266 Å, b = 5.733 Å, and c = 5.049 Å. The particle size of the samples was distributed between 40–80 μm. The columbite–(Fe) mineral powder was leached in different concentrations of aqueous HF acid. All the acid leaching samples were leached for 2 h and then filtered.
In this study, the method of ore selecting is to select ore grains under metallographic microscope, which is adopted to make Fe and Nb relatively enriched and try to select relatively pure Fe,Nb-contained minerals. The picture taken under metallographic microscope is shown in Figure 3.
Specific method for selecting natural columbite–(Fe) ore particles was to spread particles under the metallographic microscope, because the different phases can present different colors, different phases particles can be easily separated under a microscope. After separating different phases under the metallographic microscope, phase detection of these particles was carried out respectively to confirm which kind of particles were relatively enriched in Fe and Nb and then select ore particles according to the characteristics of containing niobium phased particles. Niobium is mainly distributed in ferro-niobium phase FeNb2O6. According to the red diagram of columbite–(Fe) ore by energy dispersive spectrometer (EDS) analysis, the element content distribution of columbite–(Fe) phase is Nb—20.7 at.%, Ta—1.1 at.%, and Fe—8.4 at.%. According to the chemical composition, the formula of the ore is Fe0.84Nb2.07Ta0.11O6.98. The XRD pattern of selected columbite–(Fe) is shown in Figure 4.
From the XRD results in Figure 4, it could be seen that the selected columbite–(Fe) phase was consistent with the structure of FeNb2O6 crystal, so the space group of columbite–(Fe) used in this study was Pbcn, and the lattice parameters were a = 14.266 Å, b = 5.733 Å, and c = 5.049 Å. The metal content leached in the filtrate was detected by inductive coupled plasma emission spectrometer (ICP), and the remaining residue was filtered out for X-ray photoelectron spectroscopy (XPS) analysis. ICP test was carried out with the model PERKINE 7300DV. The ICP equipment used in this paper can detect ion’s concentration as low as 5 ppm in solution, so the ICP is accurate and sensitive enough to detect Fe complexes. XPS has inherent surface sensitivity, providing a 5 nm-thick surface layer structure and the chemical state of its atoms [18], and can study the chemical and structural transformation mechanisms of the material surface under energy treatment [19]. XPS test was carried out with the model ESCALAB 250Xi. Spectra were recorded at the constant pass energy of 10 eV and 0.1 eV/step using Al Ka X-ray source, photon energy hv = 1486.6 eV, voltage –15 kV, current –10 mA. Binding energies were referred to the C 1s level at 284.8 eV and the basic elements of niobium oxide in the leaching process were recorded, such as Fe, Nb, F, O, etc. For the basic elements Fe 2p, Nb 3d, F 1s, O1s, C 1s, the internal electronic spectrum records 40 eV. The bond energy scale (Ebond) passes the basic levels Au 4f5/2 (Ebond = 83.96 eV), Ag 3d5/2 (Ebond = 368.21 eV) and main standard samples (gold, silver, copper), and the calibration accuracy is ±0.03 eV. The detailed analysis of atomic chemical conditions adopts spectral decomposition, considers the peak and sub-peak area of the mixed Lorentz-Gaussian form, optimizes background parameters, and minimizes the number of bands required for the description of the experimental spectrum. The peak position error is ±0.01 eV.

4. Results and Discussion

4.1. Bonding Tendency of HF Acting on Mineral Surface

According to the single-electron approximation method in molecular orbital theory, when the molecular orbital occupies ni (ni = 0, 1, 2) electrons, Mulliken defines his overlapping population MAB(i) as:
M a b ( i ) = 2 n i a A b B C a i S a b C b i
where Sab is the overlap integral between the atomic orbitals φa and φb, and Cai is the combination coefficient of the atomic orbitals φa in ψi. The εi in the formula is the energy of the molecular orbital ψi.
For Equation (4), MAB(i) > 0 means that it is the bonding orbital, MAB(i) = 0 means it is the non-bonding orbital, MAB(i) < 0 is the anti-bonding orbital, and the greater the absolute value of MAB(i), the greater the bonding or antibonding effect [20]. To some extent, the Mulliken population reflects the coordination dissolution tendency of Nb and Fe atoms with F ions on the mineral surface. The Mulliken populations and bond lengths of different surfaces are shown in Table 1.
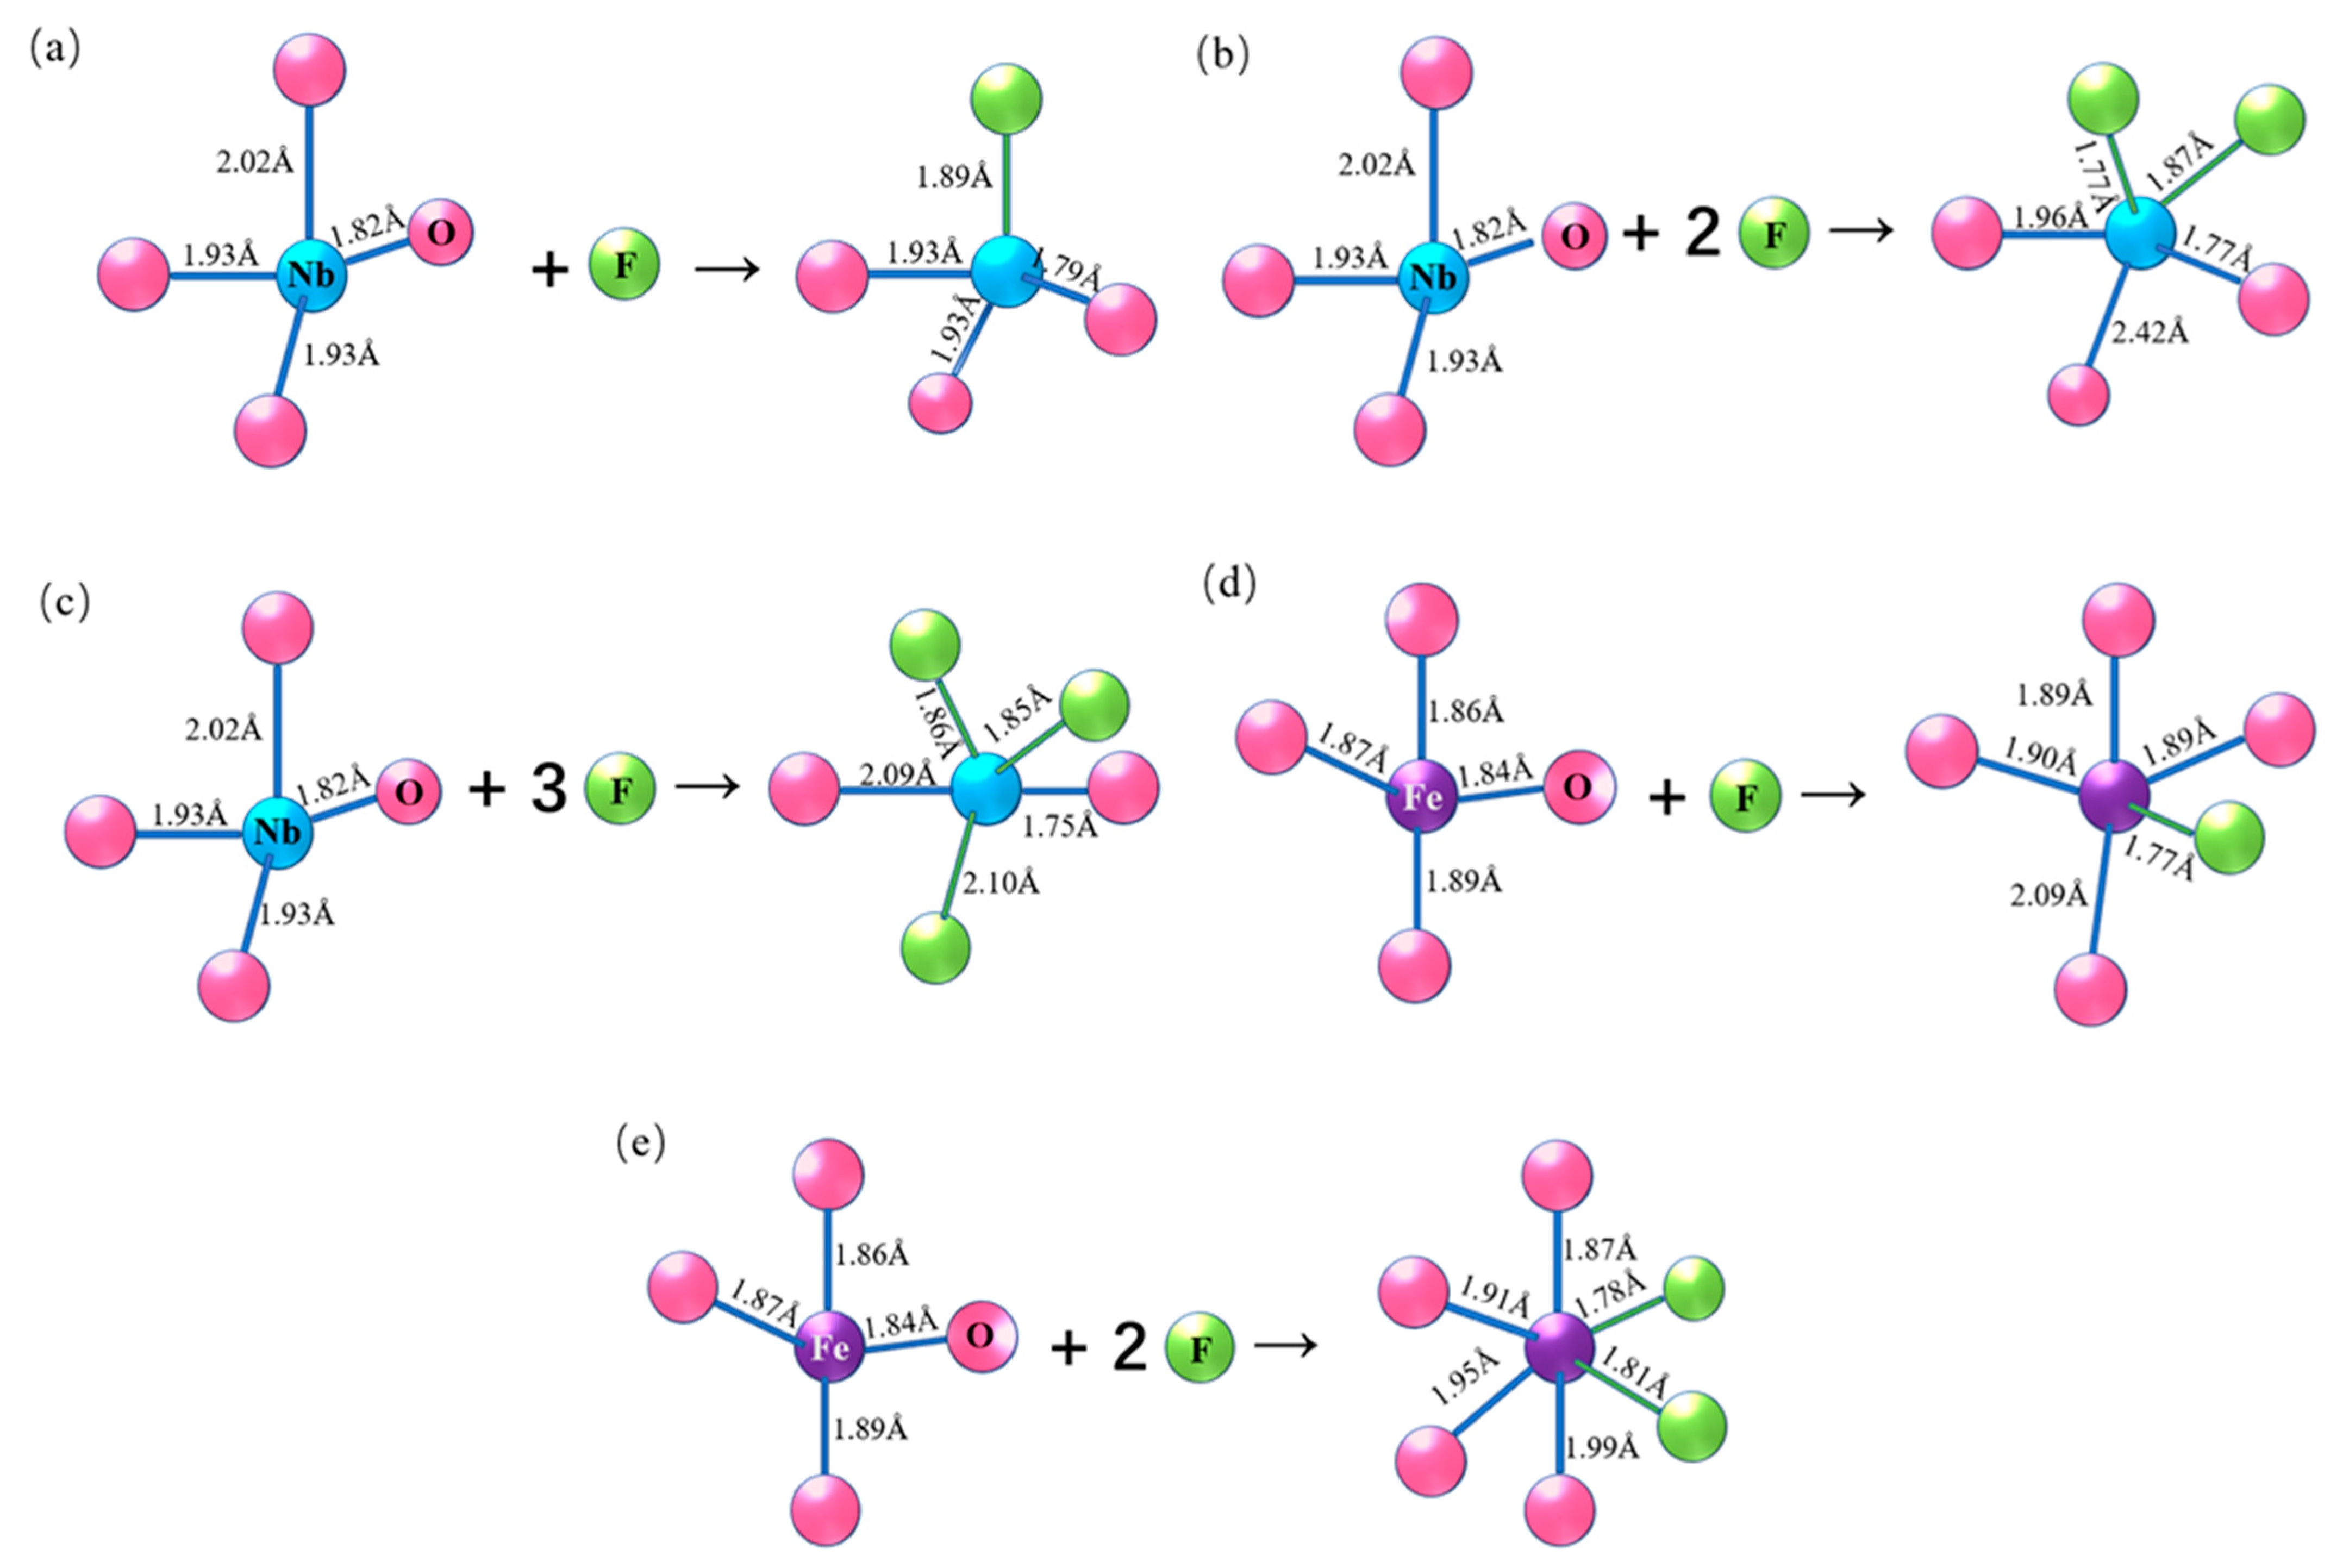
Through Mulliken analysis under different systems, it could be known that after adding H atom and F atom, one of the Nb–O bonds broke, and Nb atom combined with F atom. In the system with two F atoms added, the Fe atom combined with F atom was still combined with 4 O atoms, and the original Fe–O bond was not broken. After adding 3 F atoms (2 placed near a Nb atom, one placed near a Fe atom), Mulliken population analysis showed that the Nb atom bound to 2F atoms was still bound to three O atoms, but one of the Nb–O bonds’ length was much longer than the Nb–O bond’s length before F atom was added (1.82 Å–1.93 Å), which was 2.42 Å. That means this Nb–O bond became extremely unstable. With the addition of F atoms, in the system with 6 F atoms, on the selected Nb atom, the number Nb–O bonds reduced to 1, and the number of Nb–F bonds increased from 1 to 3, the length of Nb–O bonds without fracture were 1.75 Å and 2.09 Å, which were relatively stable. It could be judged that Fe–O bonds were more difficult to break than Nb–O bonds. Figure 5 shows how Nb and Fe atoms form bonds with F atoms under different F concentrations in the acid leaching process.
It is worth noting that when three F atoms were placed near the Fe atom, one of the F atoms would move away from the Fe atom and form a bond with the nearby Nb atom during the optimization of the mineral surface structure. Therefore, when three F atoms were placed near Fe atoms, only two Fe–F bonds could be observed. Therefore, Nb were easier to bond with F and the Nb–F bonds formed were more stable than Fe–F bonds.

4.2. Charge Distribution and Transfer of Mineral/Liquid Interface during the Leaching Process

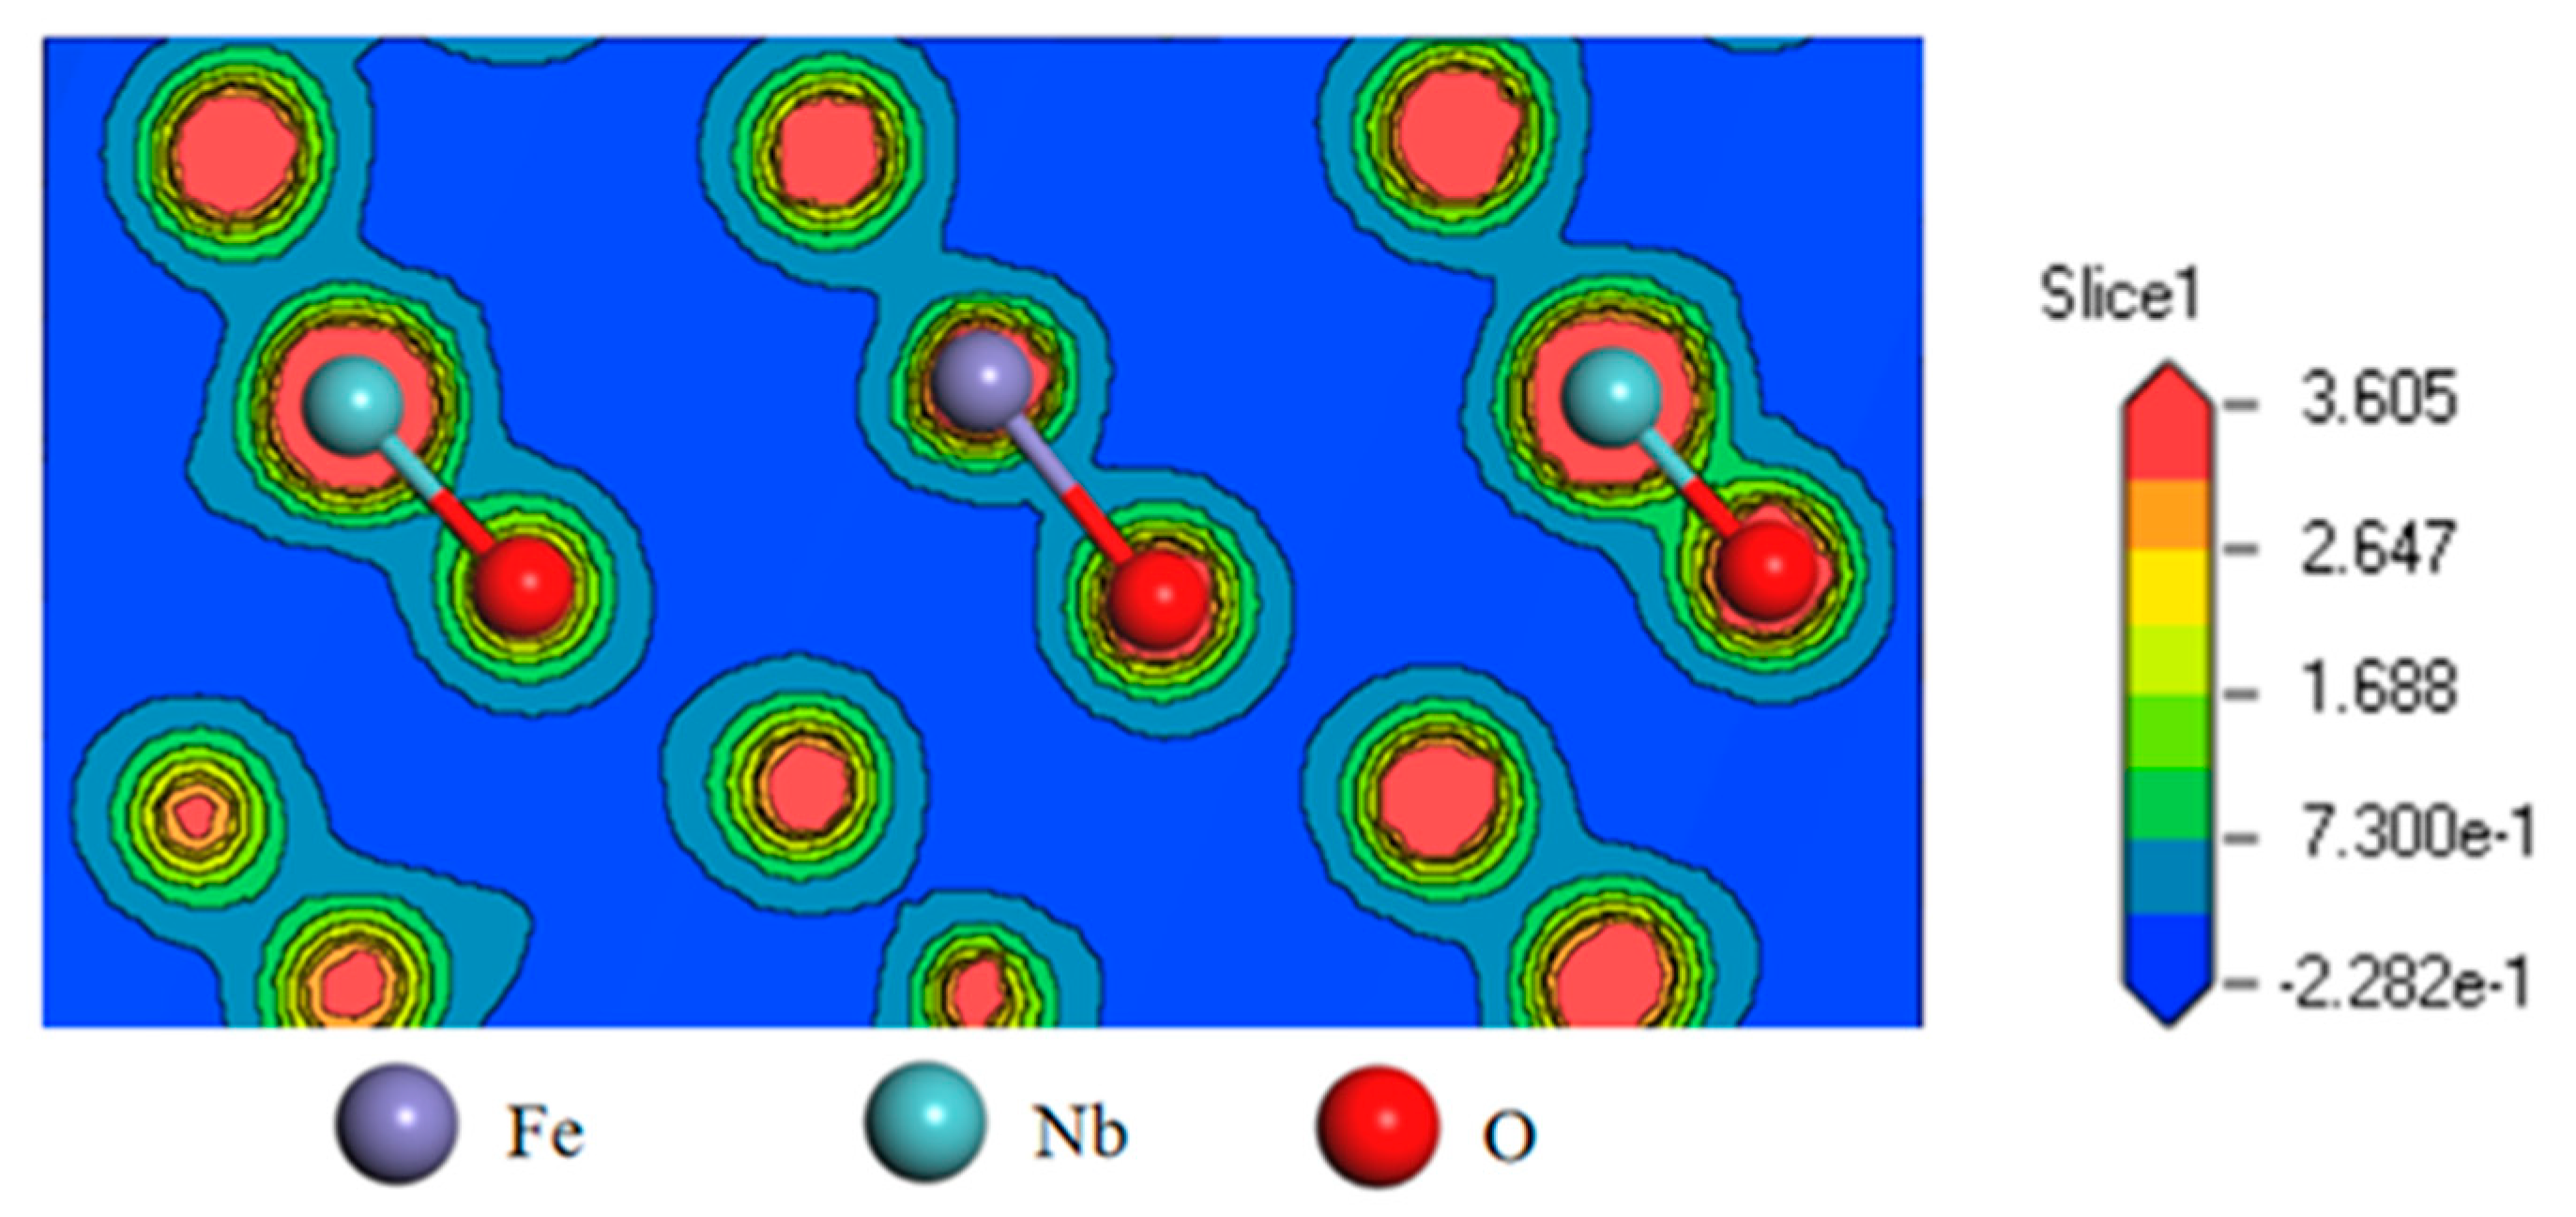
Combined with the DFT calculation, the charge density of FeNb2O6 is shown in Figure 6. The overlapping of the electron clouds in Nb–O indicates a covalent bond, and the smaller overlapping of the electron cloud of Fe–O indicates an ionic bond. According to the Hirshfeld charge analysis, after adding H atom and F atom, the charge of Nb in Nb–F was 1.71 e. Compared with the Nb atom in the Nb–O bond (Nb atom of Nb–O bond had a maximum charge of 1.58 e), Nb atom in Nb–F bond contained more charge. The Mulliken population of Nb–F bonds were less than that of Nb–O, which means that the composition of covalent bonds were significantly reduced, while the composition of ionic bonds increased, the electronegativity difference was greater and the bond energy was greater.
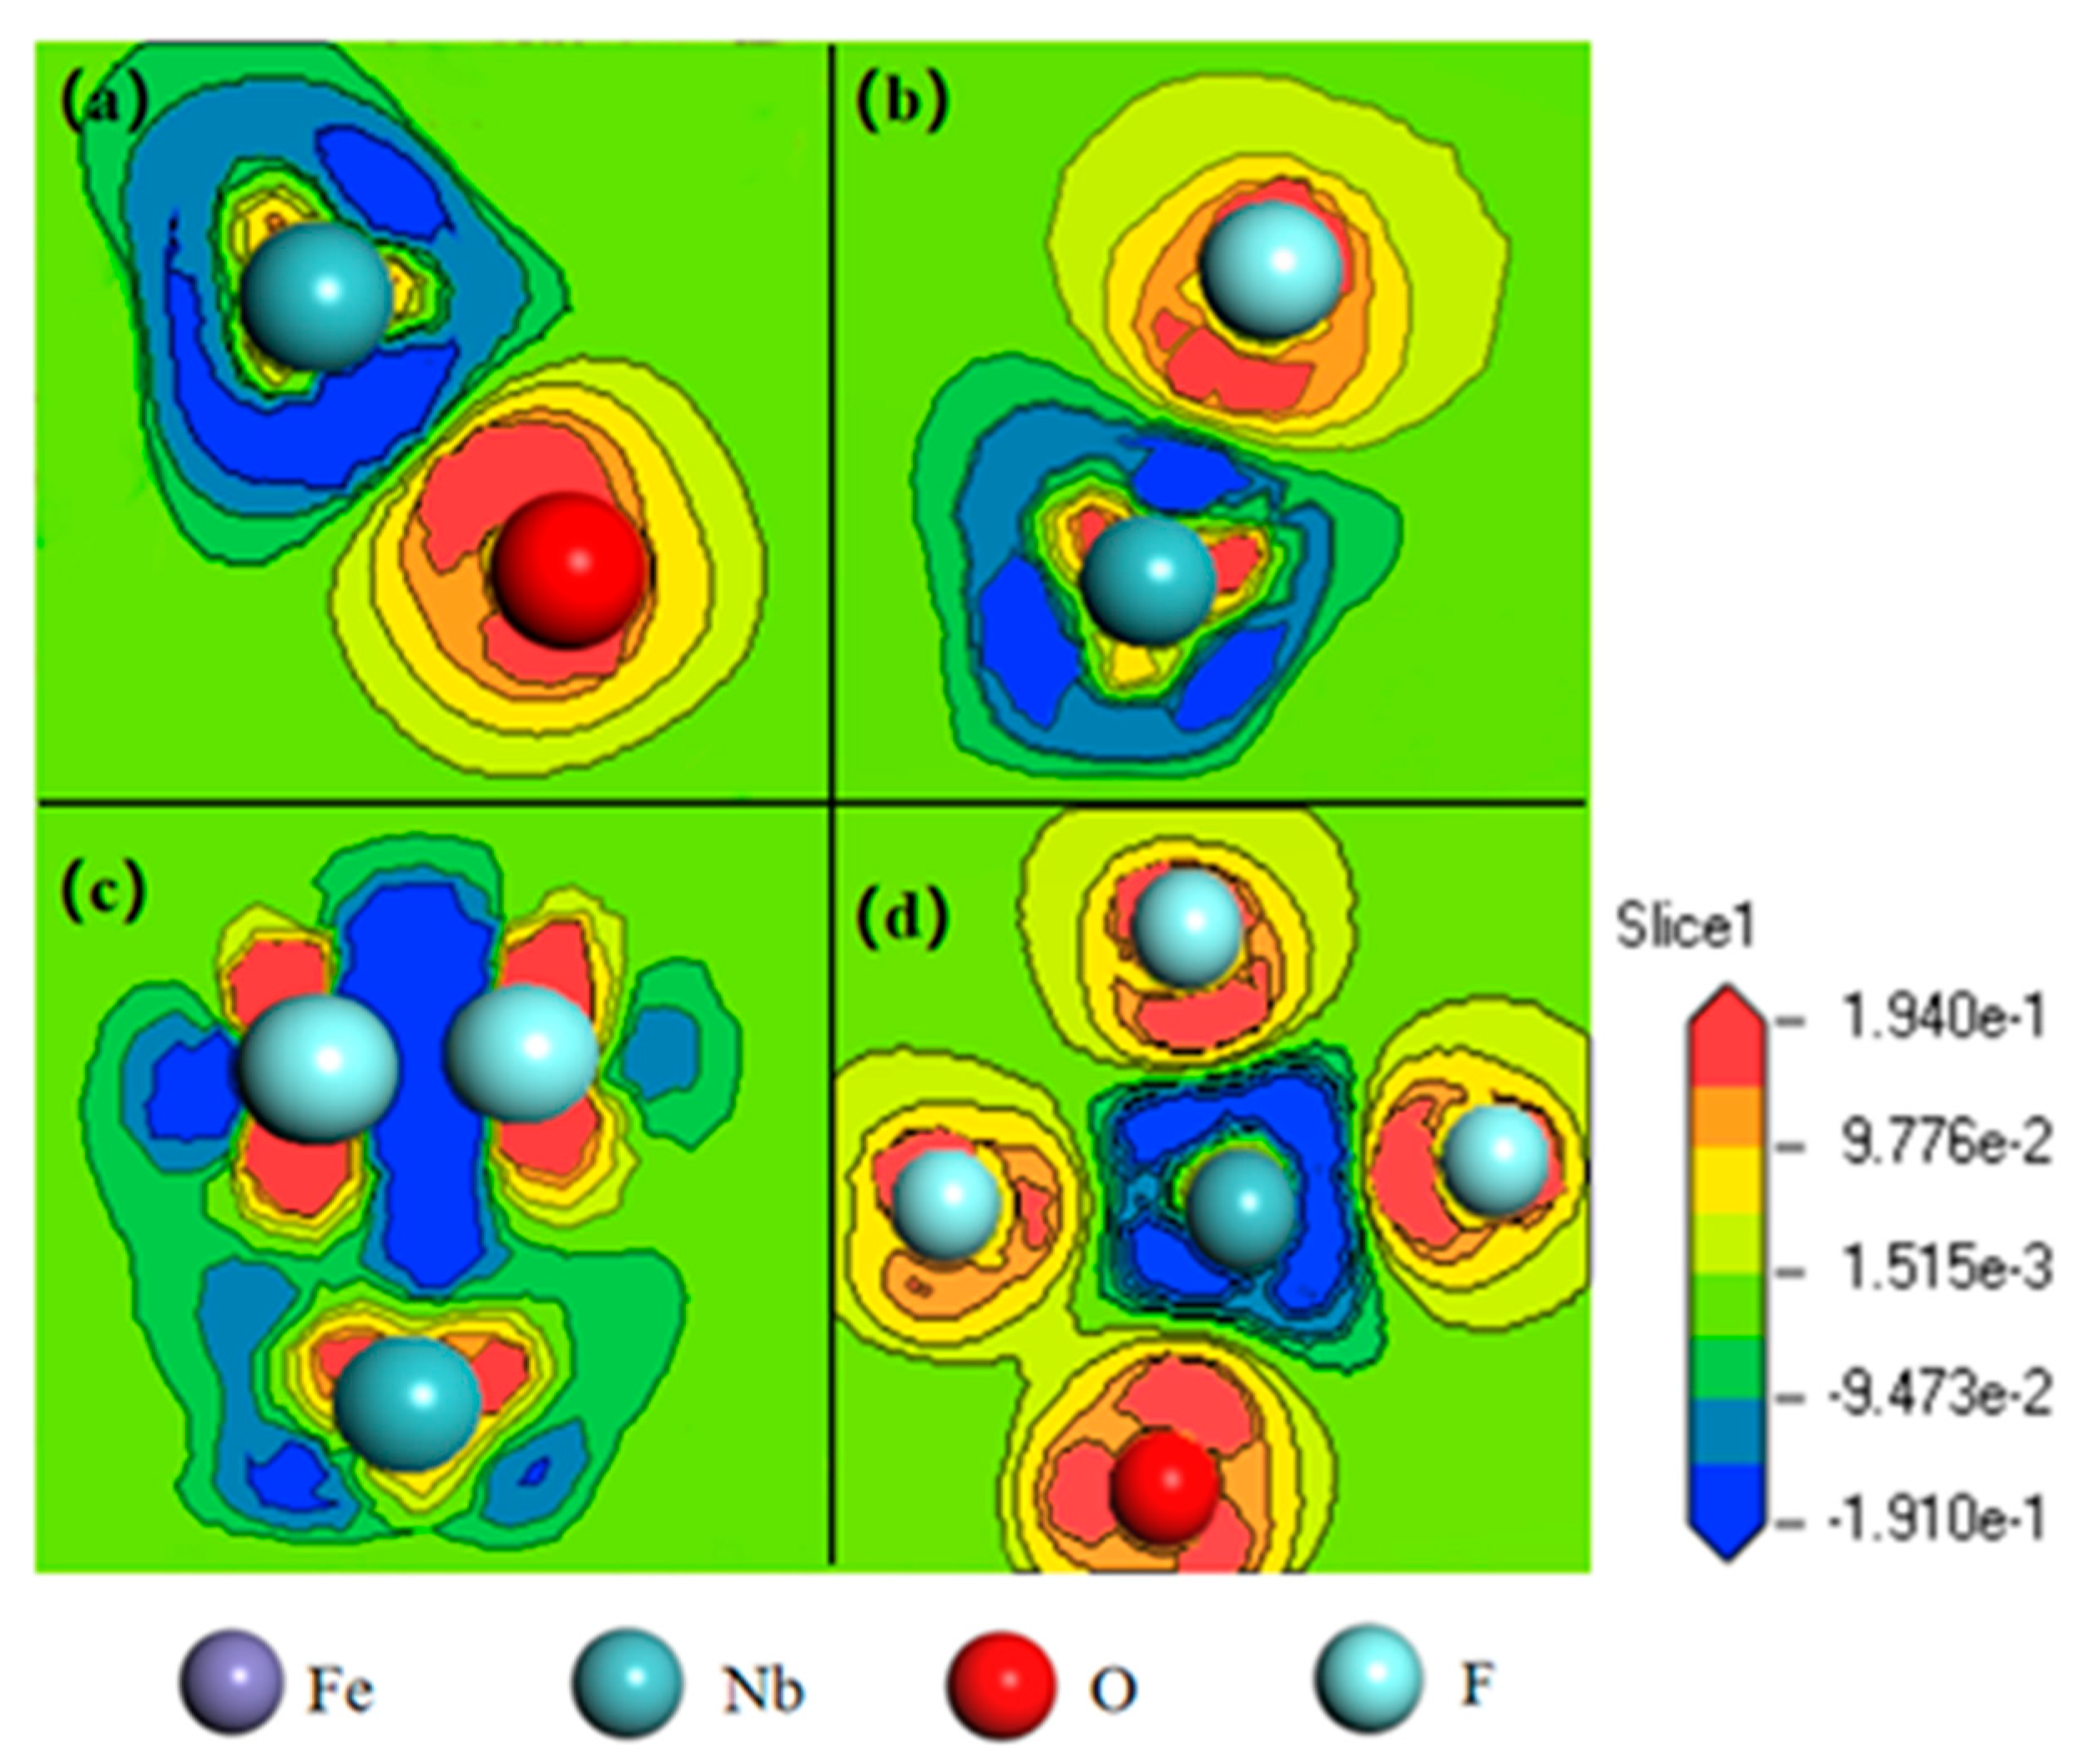
In order to further analyze the charge transfer of Nb before and after adding HF and F atoms, the differential charge density was calculated. The differential charge density diagram is shown in Figure 6 and Figure 7. At the same time, it could be seen in Figure 7 that the electron cloud overlap between Nb atom and F atom could be observed through the differential charge density map, showing that Nb–F bonds were ionic bonds.
It can be seen from Figure 7a–d that after adding F atom, two F atoms and three F atoms near the Nb atom, the electron density clouds around the F atoms were greater than 0, which means it gained electrons, while the electron cloud density around Nb atoms was less than 0, which means it lost electrons. The electrons moved from the orbital of Nb atoms to F atoms, forming new Nb–F bonds between Nb atoms and F atoms. The Nb–F bonds formed by electron transfer indicated that the Nb–F bonds were ionic bonds.
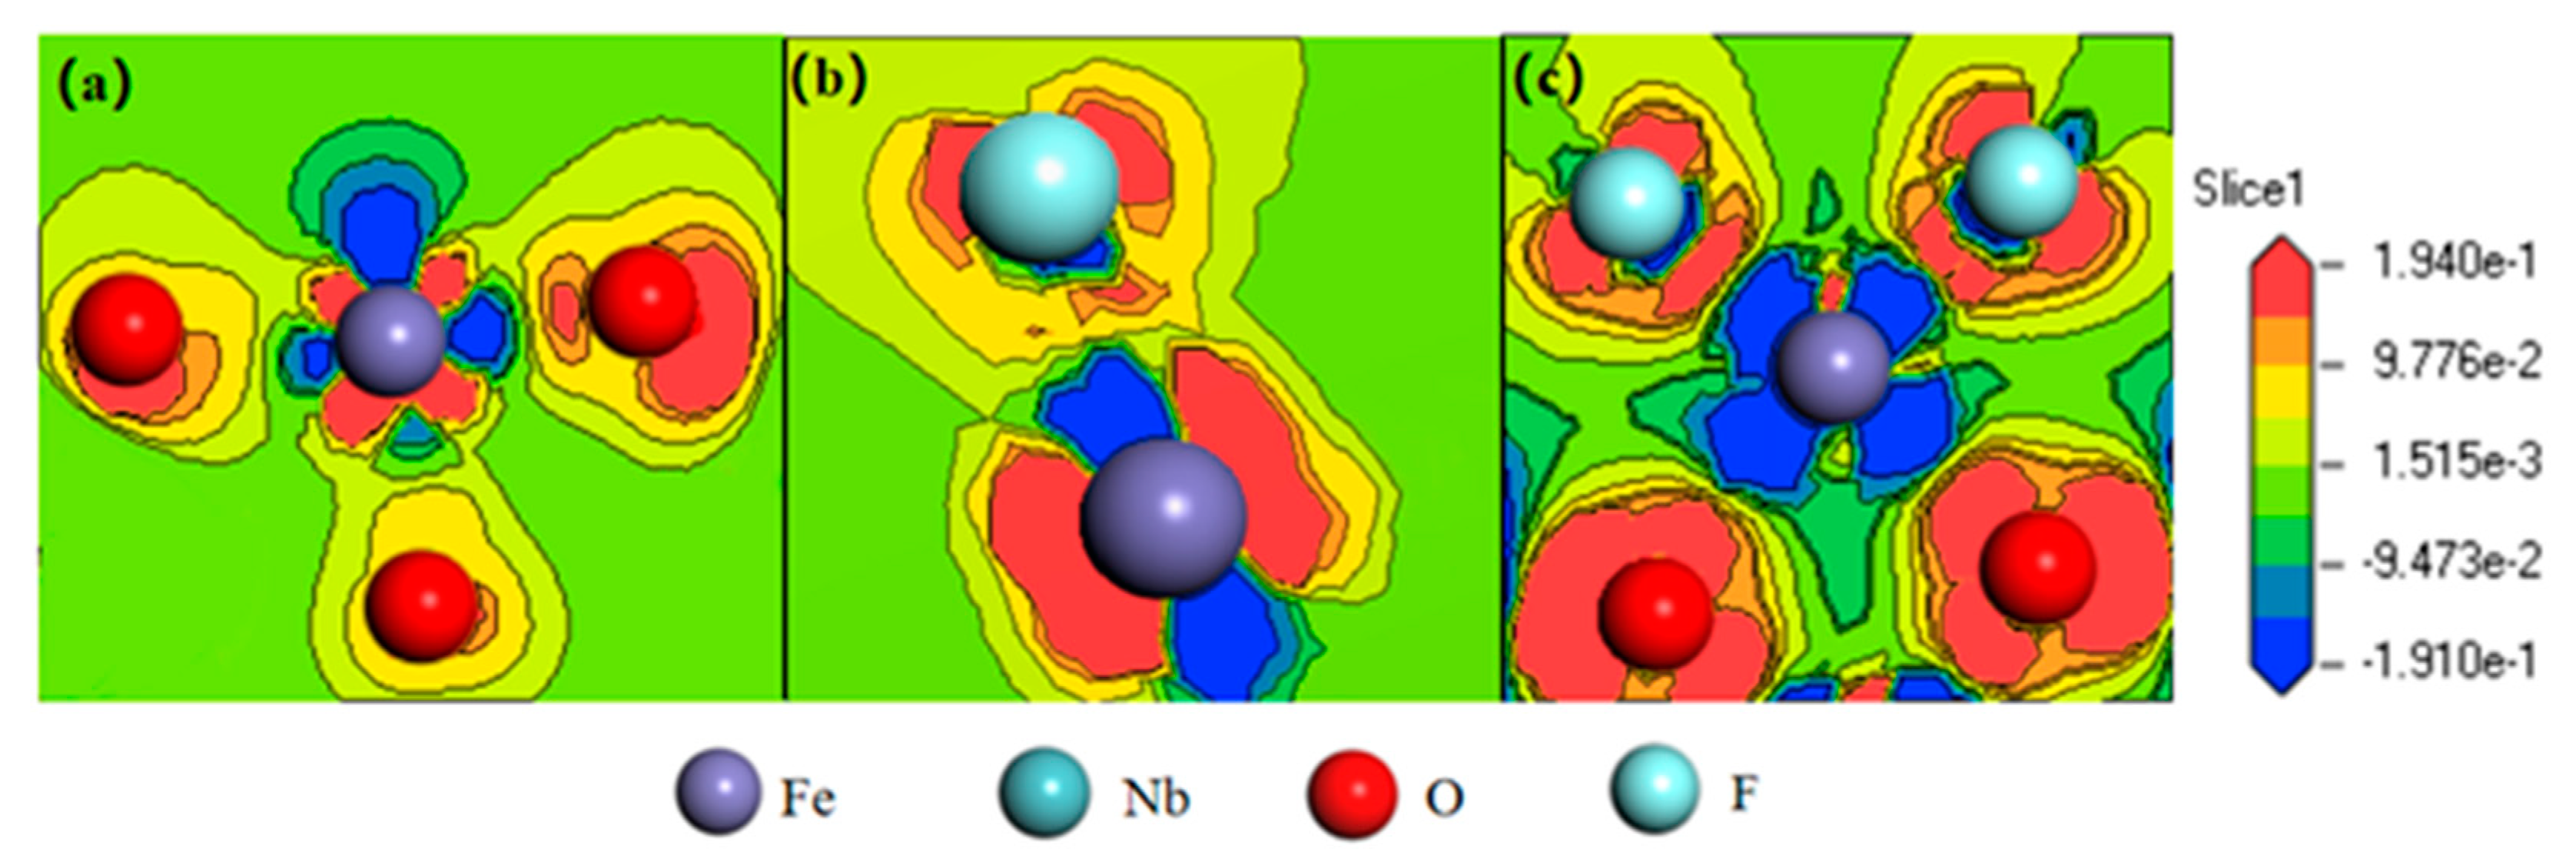
Similarly, in Figure 8 there was an obvious phenomenon of gain and loss of electrons between Fe atoms and F atoms. Fe atoms lost electrons, and electrons moved from Fe atoms to F atoms, that is, Fe–F bonds were also ionic bonds. Therefore, charge transfer could be studied by analyzing the charge density. The Hirshfeld charge analysis is as follows:
It could be seen from Table 2 that after the Fe–F bond was formed, the original Fe–O bond was not broken, and the amount of charge transfer on Fe atom bound to the F atom fluctuated between 0.23 e and 0.28 e, the difference was not obvious. After adding H atom and F atom, one of the Nb–O bond broke and Nb atom combined with the F atom. In the system with 3 F atoms added, after adding two F atoms near Nb atom, there were two Nb–O bonds fractured compared to the system before adding F atoms. Hirshfeld charge analysis showed that the amount of charge transfer on Nb atom bound with 2 F atom increased from 0.78e to 0.94e, indicated that F atom made Nb atom had a larger amount of charge transfer, and F atom contributed more to Nb atom’s dissolution from columbite–(Fe) mineral, so Nb atoms in columbite–(Fe) were more easily dissolved than Fe atoms. The complexation of Nb5+ with anions such as F in the solution phase contributes significantly to the dissolution rate. The different amount of charge transfer between Nb, Fe atoms and F ions on mineral surface reflects the different influence of F ions on metallic elements on mineral surface. The larger effect of F ions on the charge transfer of Nb atom shows that F ion’s concentration is also the driving force of Nb atom dissolution from mineral surface.

4.3. Ion State and Distribution on Mineral/Liquid Interface during the Dissolution Process

In order to study the dissolution mechanism of FeNb2O6 under different concentrations of hydrofluoric acid leaching and the selective dissolution mechanism of elements, the XPS detection method was used to further analyze and study the various elements in the sample. The Fe 2p, Nb 3d, O 1s, and F 1s orbitals in the FeNb2O6 samples after two groups of different concentrations of HF acid leaching were analyzed by XPS spectroscopy. The analysis results are as follows.
5 mol/L HF leached 2 h FeNb2O6 sample and 10 mol/L HF leached 2 h FeNb2O
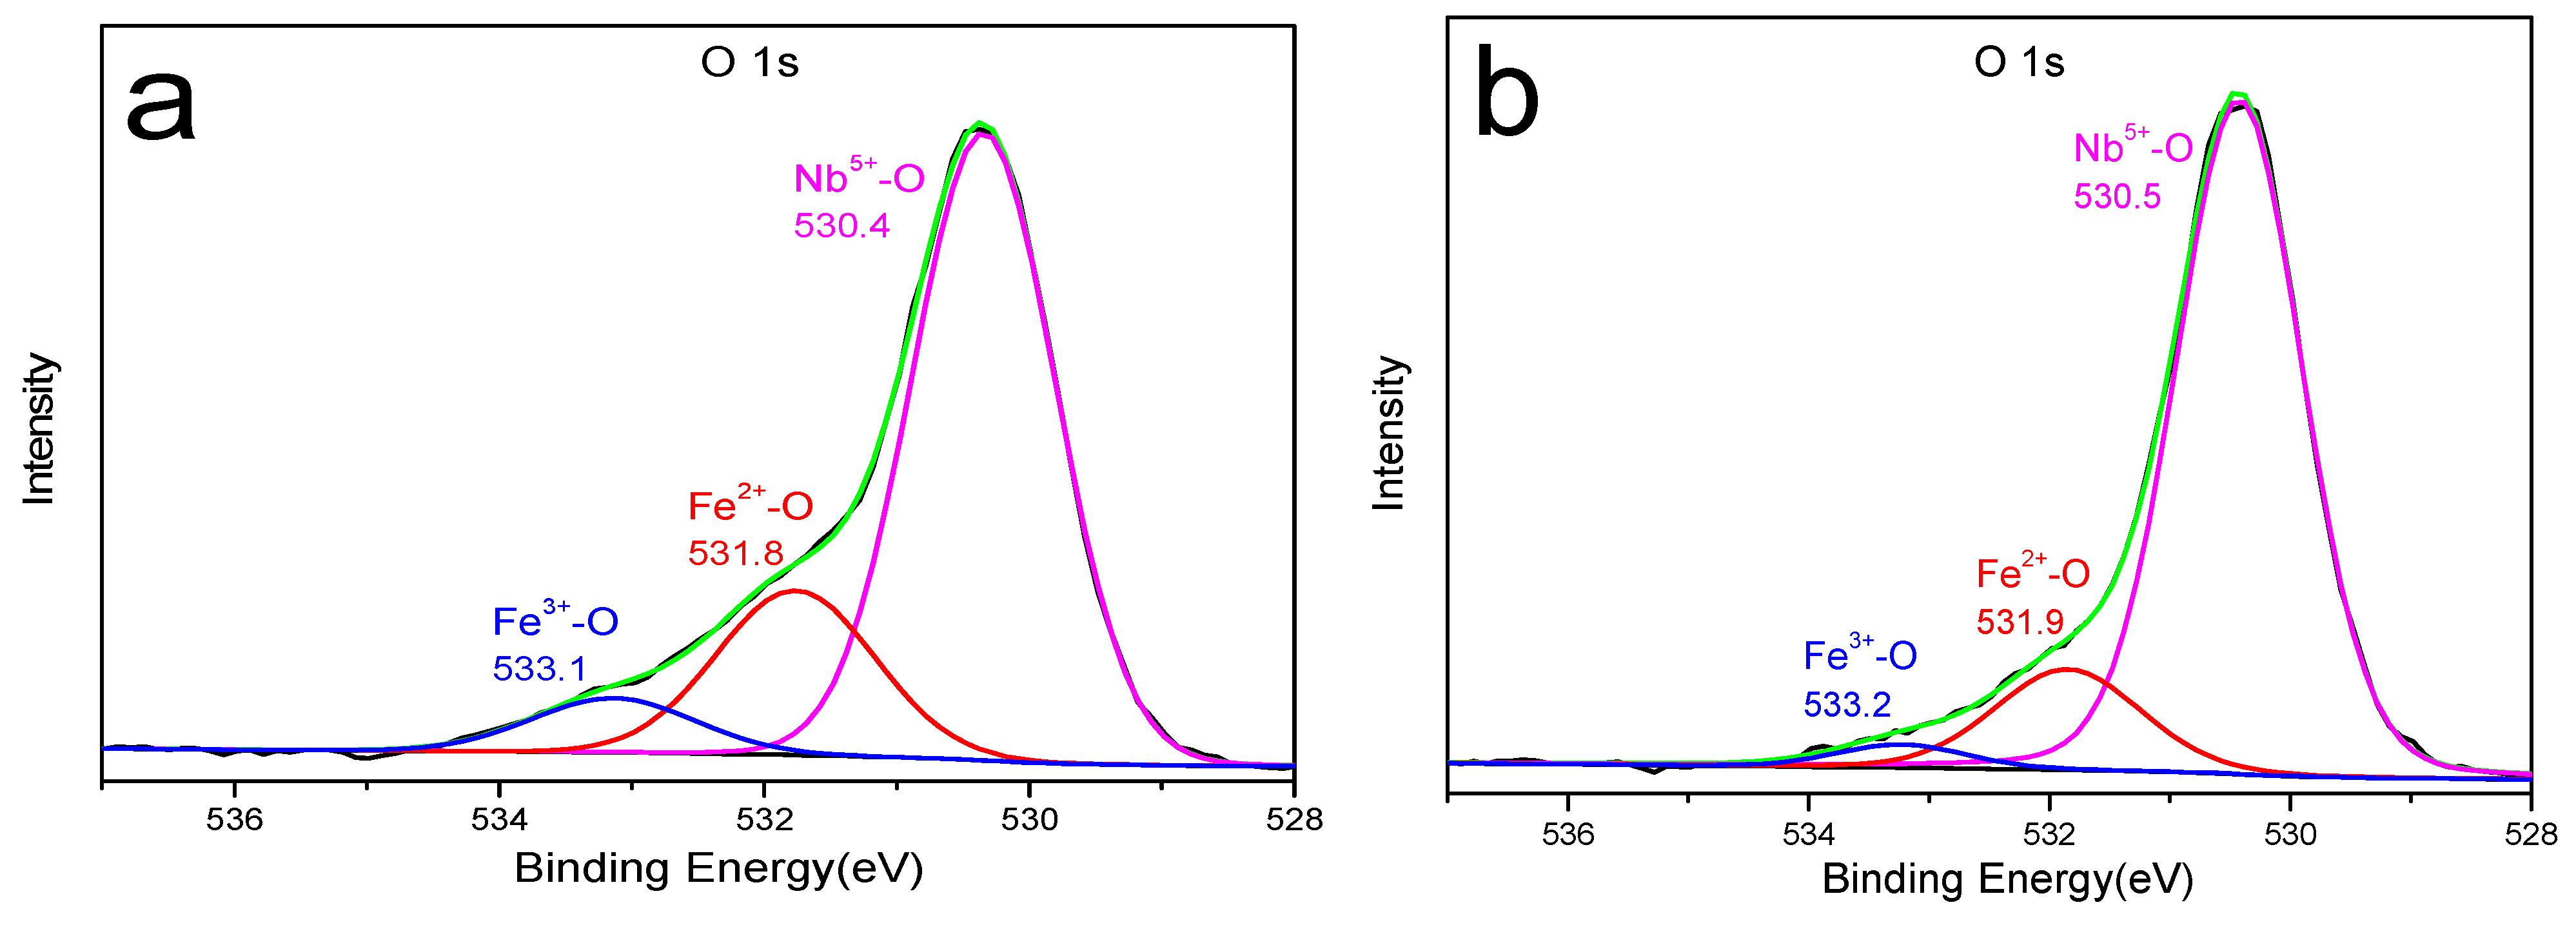
6 sample XPS high-resolution spectra of O 1s orbital peak processing is shown in Figure 9. The 5 mol/L HF acid leaching group can be decomposed into three different energy peaks with the value of 533.1 eV, 531.8 eV, and 530.4 eV, respectively; the 10mol/L HF acid leaching group can be decomposed into three different energy peaks with the value of 533.2 eV, 531.9 eV, and 530.5 eV, respectively. Comparing the electronic binding energy of each component of the O 1s orbital in Figure 8, it could be seen that the electronic binding energy of Nb5+–O bonds was smaller than that of Fe3+–O bonds and Fe2+–O bonds, indicating that Nb–O bonds were easier to be broken during the acid leaching process.
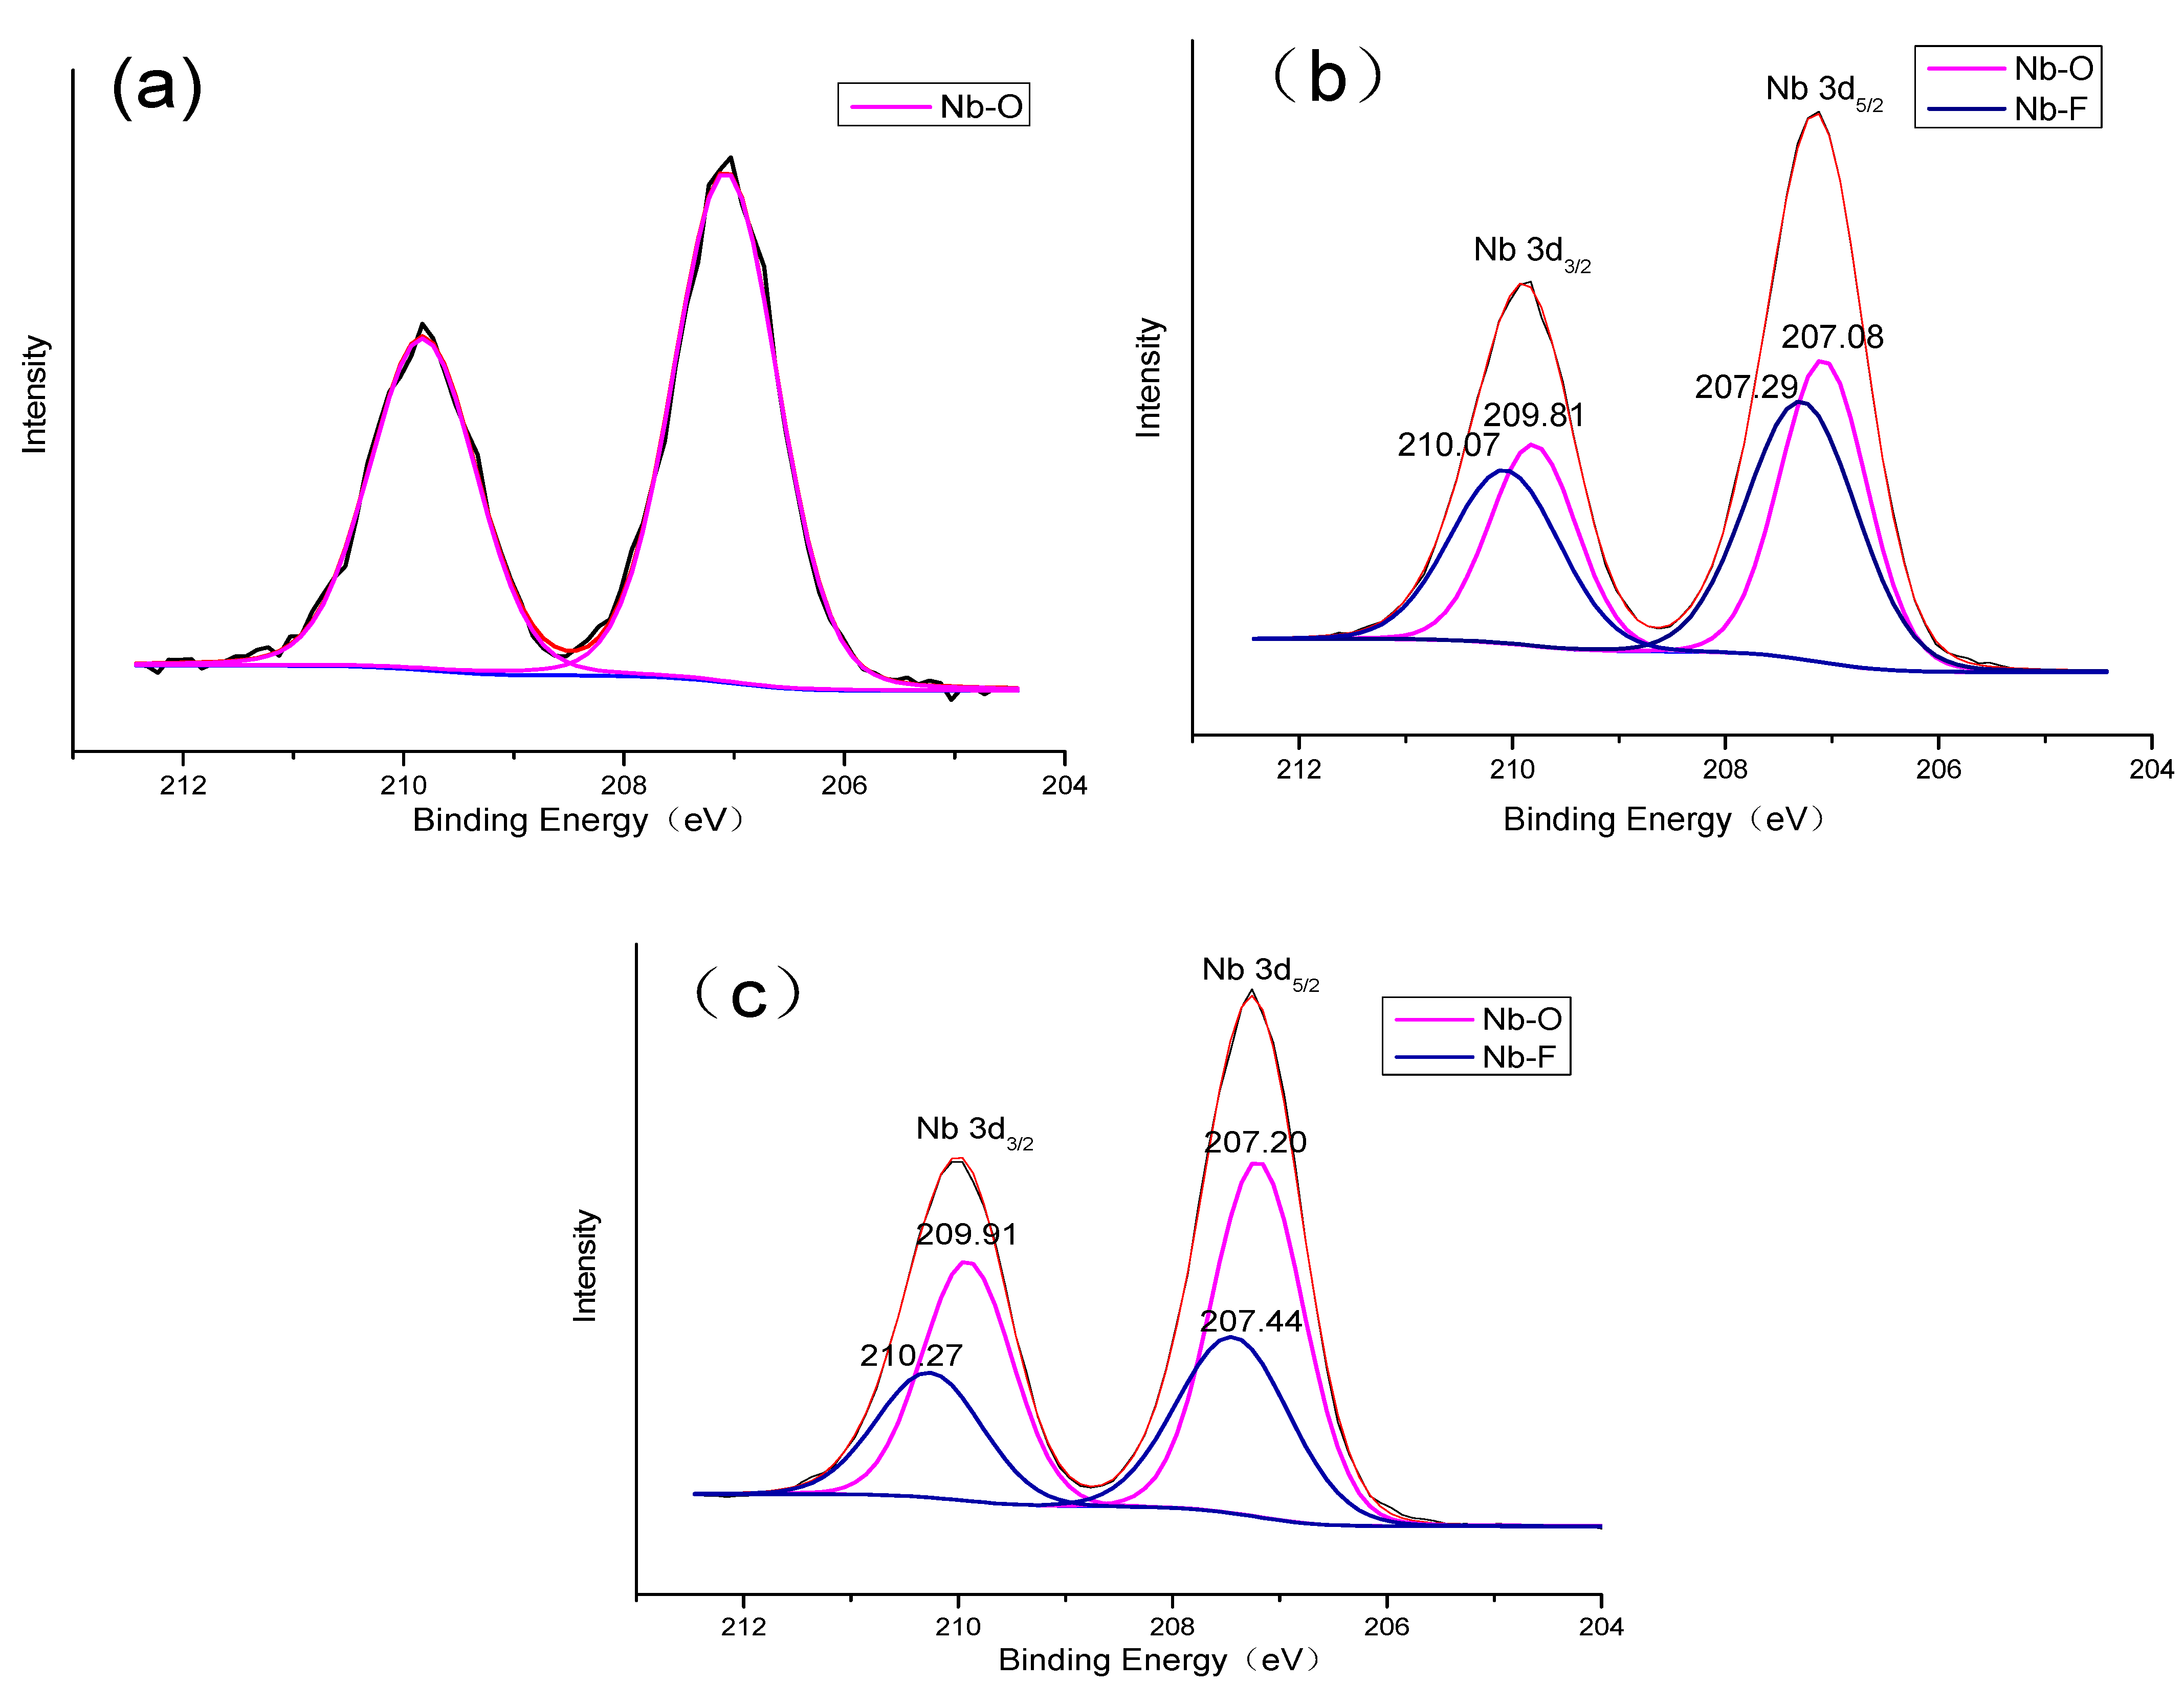
During the HF leaching process of columbite–(Fe), the chemical state of Nb element in the mineral changed during the dissolution process. Figure 10a–c shows the XPS high-resolution spectra of the Nb 3d orbital of FeNb2O6 before and after 5 mol/L HF and 10 mol/L HF acid leaching, respectively. In Figure 10b, the Nb 3d3/2 orbital can be decomposed into two different energy peaks of 210.07 eV and 209.81 eV, and the Nb 3d5/2 orbital can also be decomposed into two peaks with the value of 207.28 eV and 207.09 eV. The two energy peaks with binding energy of 210.07 eV and 207.28 eV corresponded to the fitting peaks of Nb5+–F; the two energy peaks with binding energy of 209.81 eV and 207.09 eV corresponded to the fitting peaks of Nb2O5, namely Nb5+–O in FeNb2O6. In Figure 10c, similar to Figure 10b, the Nb 3d3/2 orbital can be decomposed into two different peaks of 210.27 eV and 209.91 eV, and the Nb 3d5/2 orbital can also be decomposed into 207.44 eV and 207.20 eV. The two energy peaks with binding energies of 210.27 eV and 207.44 eV corresponded to the fitting peaks of Nb5+–F; the two energy peaks with binding energies of 209.91 eV and 207.20 eV corresponded to the fitting peaks of Nb5+–O.
Through calculation, the percentages of different Nb elements on the surface of the samples after two groups of HF acid leaching can be obtained. After 5 mol/L HF acid leaching, Nb–F or fluoroniobium acid complex accounted for 51.9%, and Nb–O accounted for 48.1%; after leaching under 10 mol/L HF condition, Nb–F or fluoroniobium acid complex accounted for 38.1%, and Nb–O accounted for 61.9%. In the case of 5 mol/L HF acid leaching, more Nb–F bonds formed on the surface. In the process of HF acid leaching of columbite–(Fe) mineral FeNb2O6, as far as Nb atoms were concerned, the surface of the mineral changed from Nb–O to Nb–F, and the change was greater under 5mol/L HF acid leaching. Table 3 shows the ICP test results of the solution after different HF acid leaching.
It could be seen from the ICP results that under the HF leaching conditions, the two groups of HF acid leaching experiments showed that the greater the concentration of HF acid, the more Nb and Fe atoms were leached. Based on the ratio of Nb/Fe = 2:1 in FeNb2O6 and Nb/Fe ratio in the HF leaching solution of the two groups, it could be concluded that Nb atoms were more easily leached than Fe atoms under the experimental conditions, thus confirming the above conclusions obtained through the analysis of surface structure and chemical state changes of surface elements.
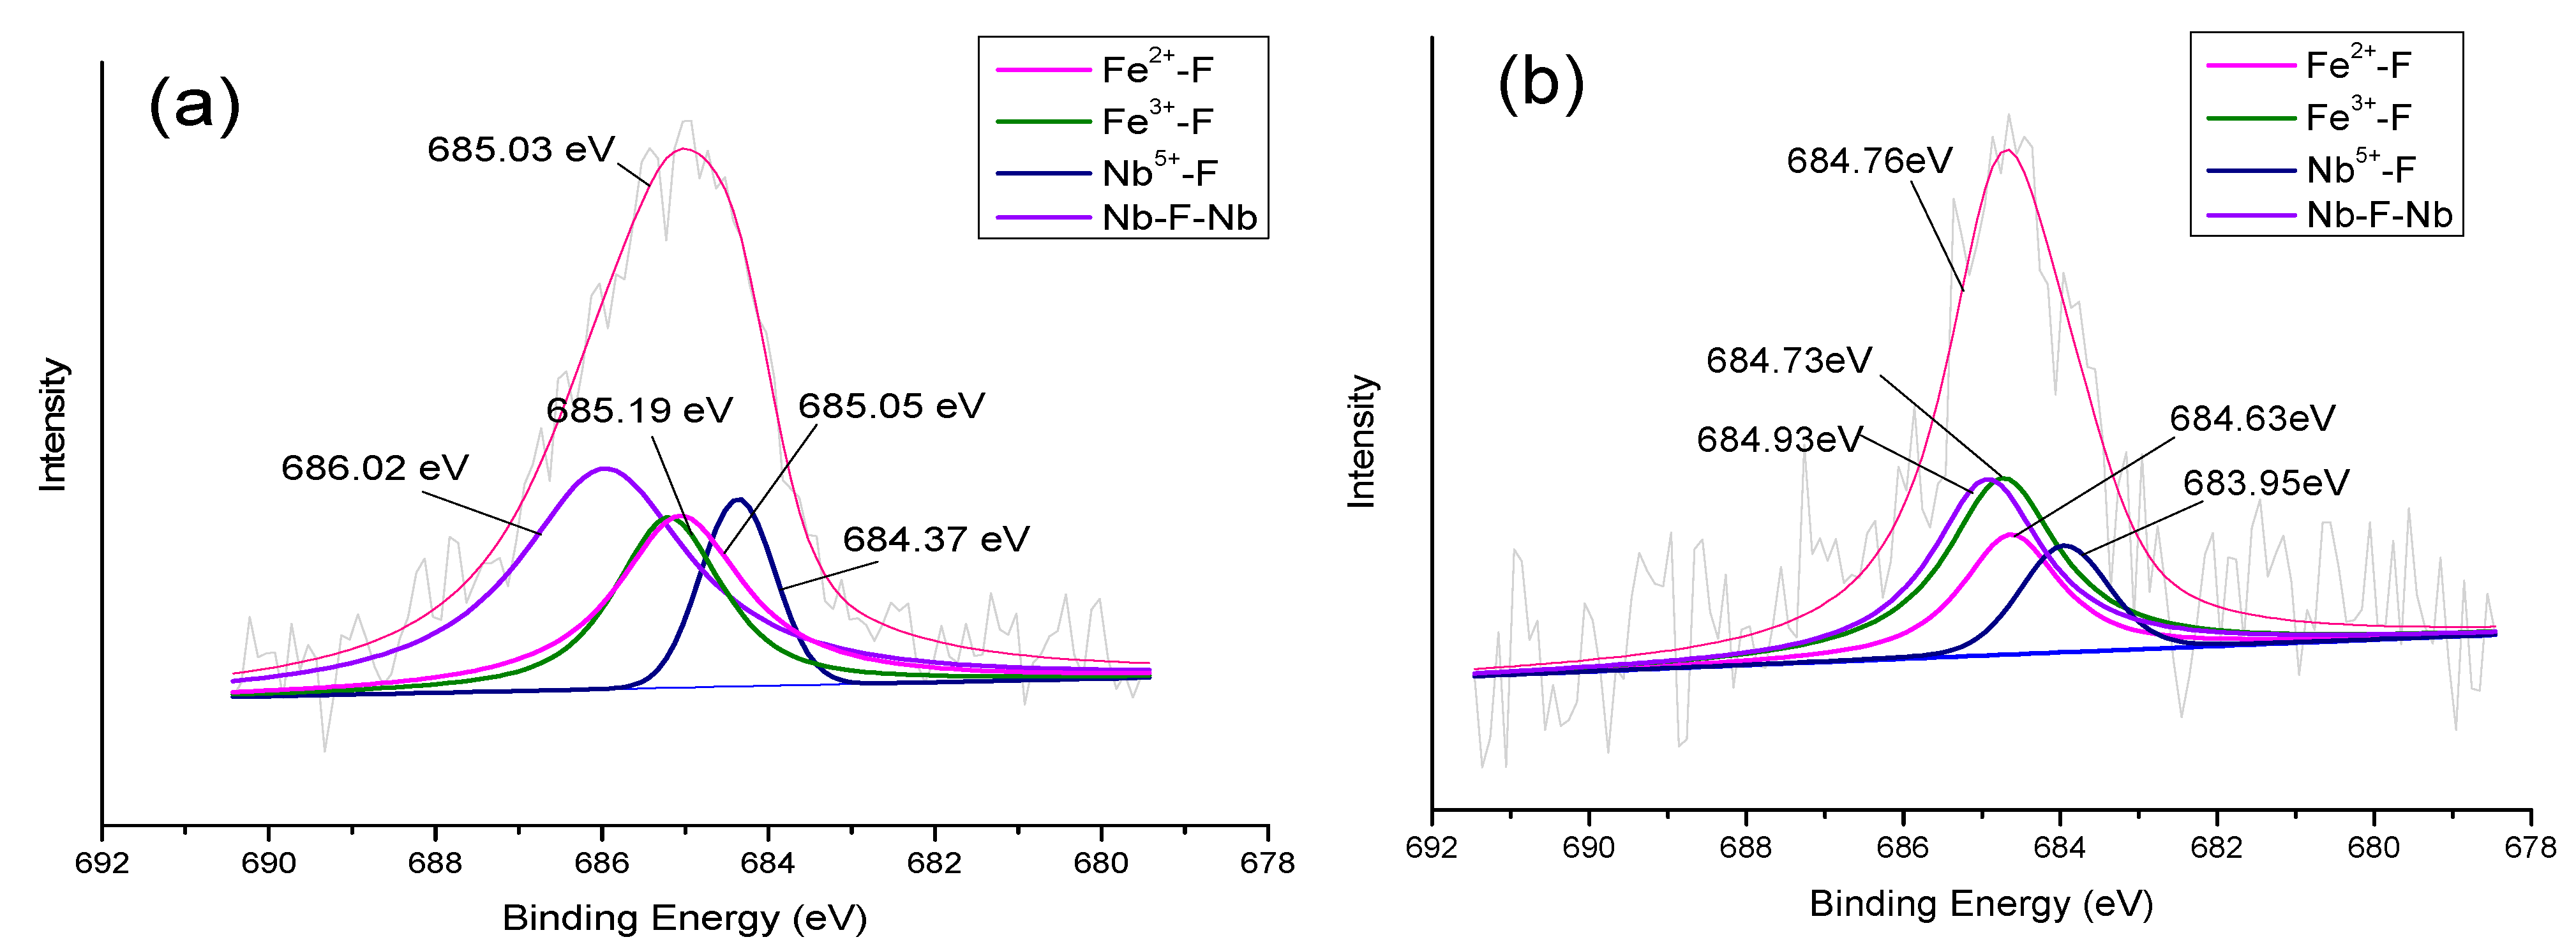
The uncoordinated fluorine ion (F–) corresponds to the lowest binding energy, followed by the signal from the terminal fluorine atom (M–F), and the highest energy comes from the bridging fluorine atom (M–F–M) [21]. According to the XPS F 1s signal assigned to the fluorine ion in a compound with a correctly determined structure, as shown in Figure 8, the electron binding energy of the F1s orbital of the mineral after 5M HF acid leaching was 685.03 eV compared with the F 1s orbital of the mineral. The binding energy decreased to 684.76 eV after 10M HF acid leaching, so it was believed that the fluorine atoms in the product of the reaction between HF and columbite–(Fe) mineral had partial bridging characteristics, and as the HF concentration increased, part of the bridging F converted to terminal F.
It can be seen from Figure 11 that the F 1s orbital binding energy, after 5M and 10M HF acid leaching, was reduced indicating that the connection mode of F and F in the ore with metal ions had changed. The binding energy changed on the F 1s orbital after acid leaching are shown in Table 4.
As the concentration of HF increased, the proportion of F atoms occupied by the terminal F in the product increased. When the HF concentration decreased, the proportion of Nb–F–Nb was larger.
As the HF concentration increased, part of the Nb–F bond broke, F atoms and Nb atoms combined to form new Nb–F and the proportion of the terminal F increased. This is because as the HF concentration increased, the acidity of the solution increased and the Nb–F bonds broke. At the same time, when the HF concentration was low, one F atom combined with two Nb atoms on the surface of the mineral, which could also indicate that when the HF concentration was low, it is more difficult for the F ions to combine with more Nb atoms to dissolve into the solution so that the Nb dissolution rate in the mineral was lower. Therefore, when columbite–(Fe) leaches under 10M HF condition, more Nb–O was converted to Nb–F on the mineral surface, increasing their dissolution rates. Hiroshi Majima et al. [6] studied the dissolution reactions of Nb from columbite in the aqueous solutions of HF and indicated that the presence of both H+ and F ions in a leachant is necessary for the fast dissolution of columbite. The increase in these ion concentrations is effective.
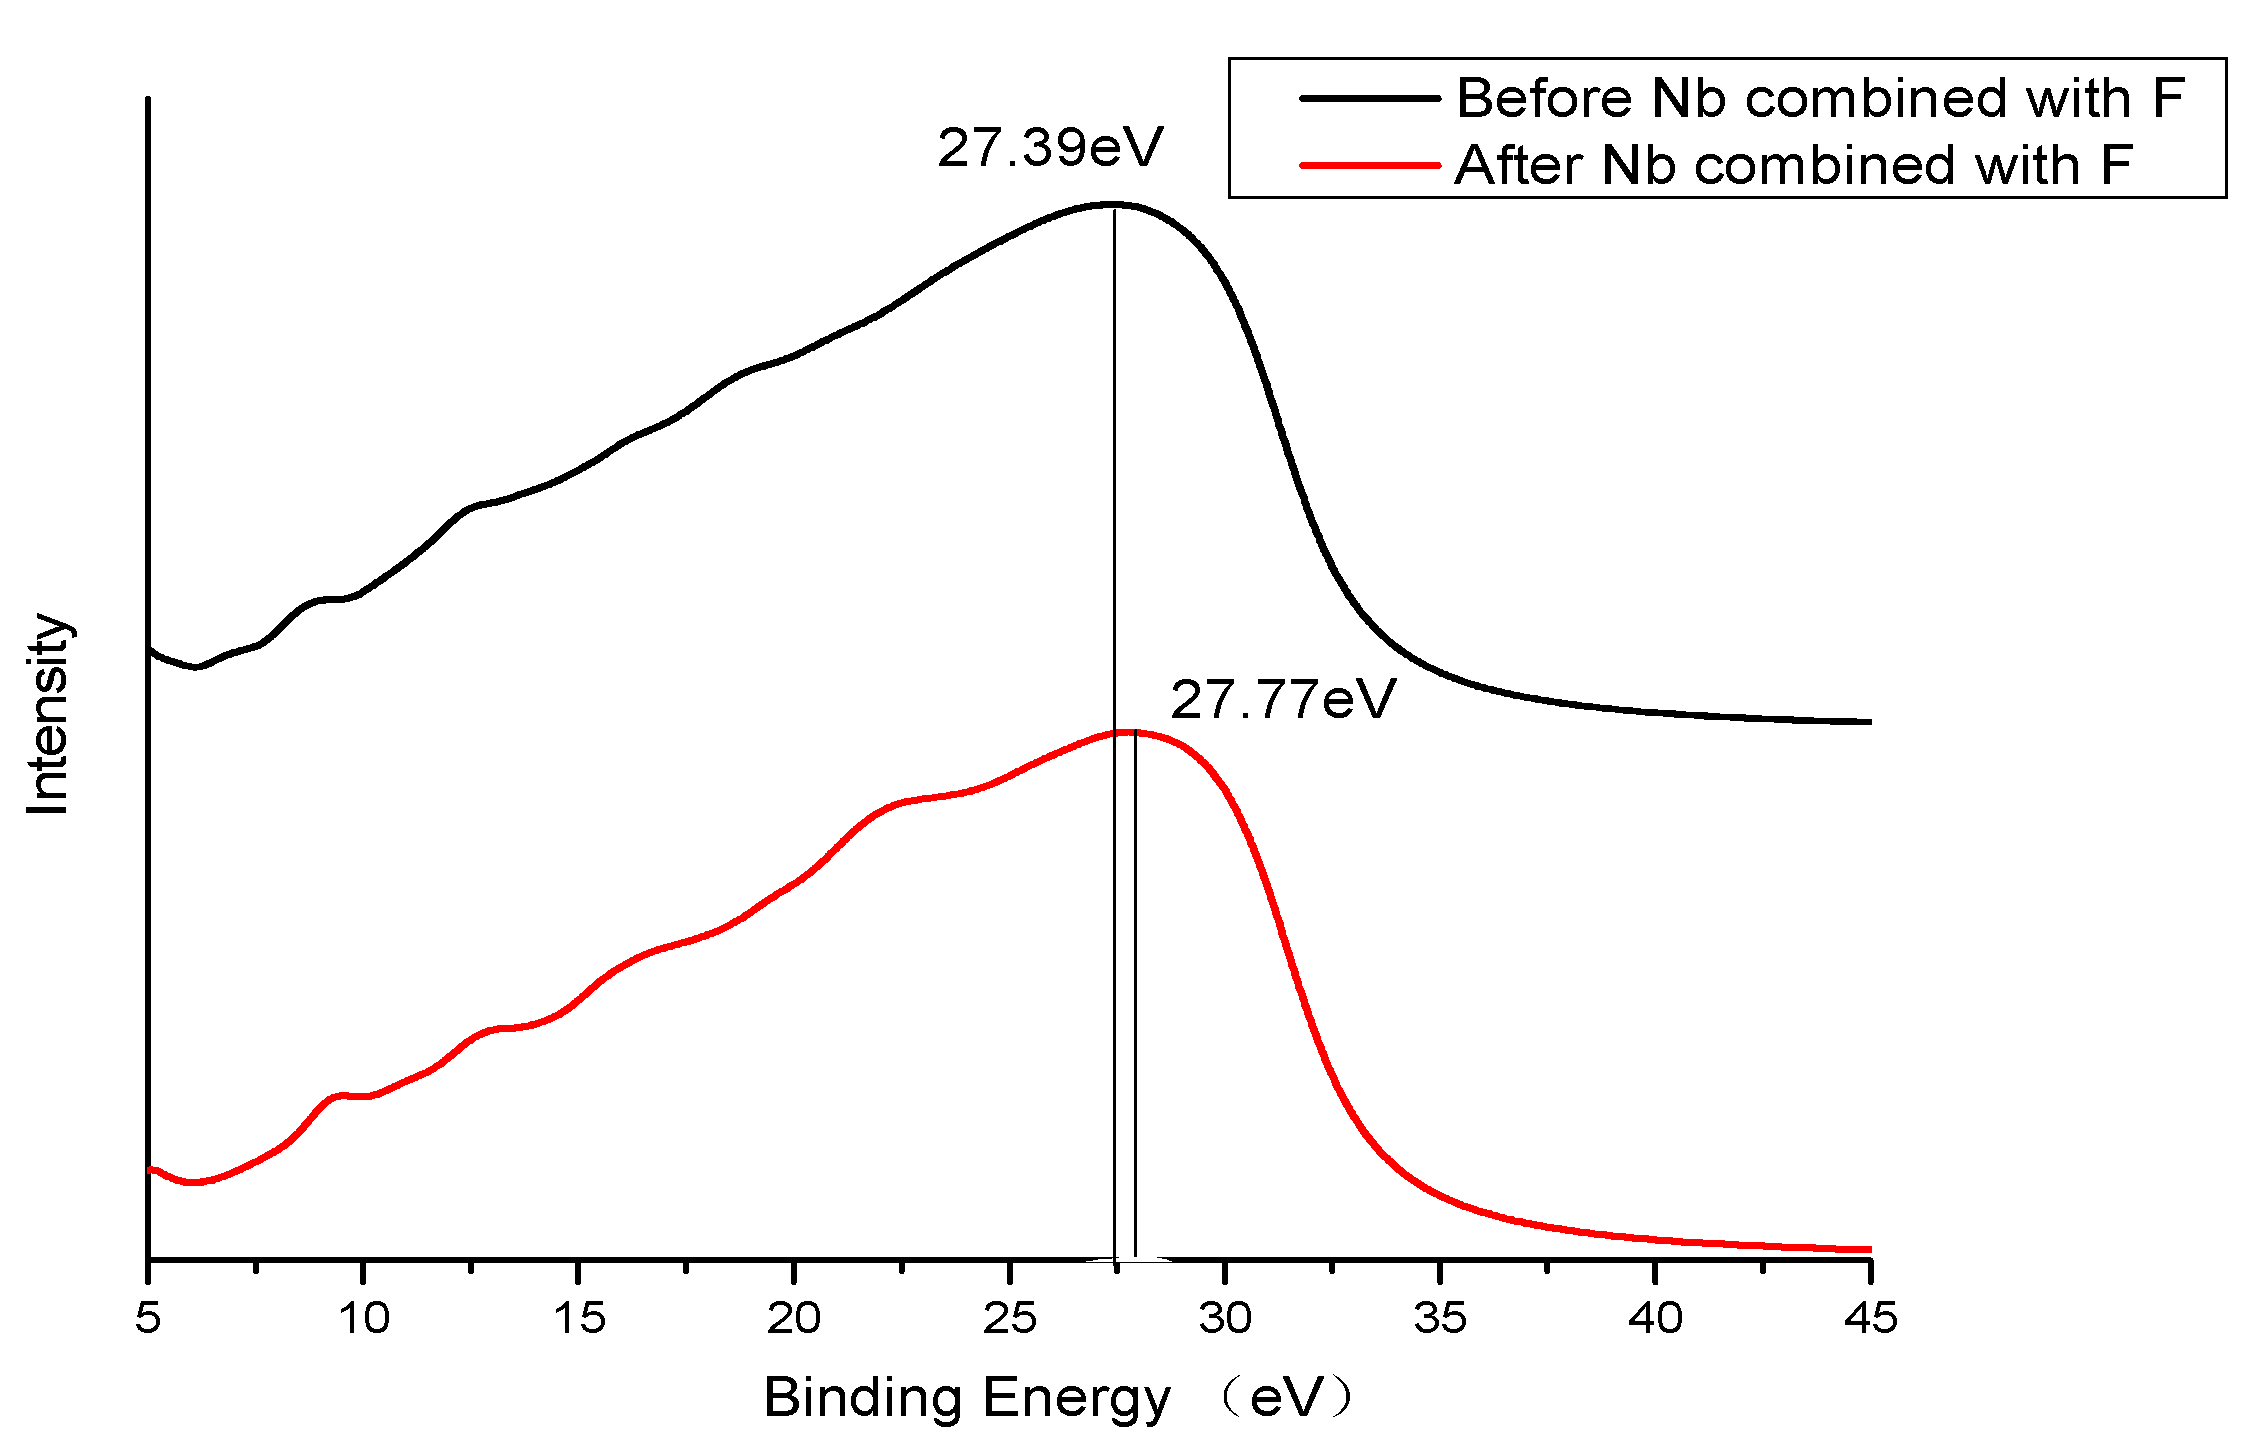
DFT was used to calculate the core-level spectrum, and core holes were set on the 3d orbital of the Nb atom which combined with the F atom and the 2p orbital of the Fe atom which were selected to combine with the F atom. Before and after the combination of F atoms and the Nb atom, the main peak of the EELS spectrum shifted in two states. As shown in Figure 12, the main peaks of the EELS spectrum shifted before and after the combination of F atoms and the Nb atom. The more electrons that were lost in oxidation, the greater the binding energy increased. Before combining with F, the core-level peak of the Nb 3d orbital was 27.39 eV. After combining with F, the main peak moved to 27.77 eV with the increase of 0.38 eV.
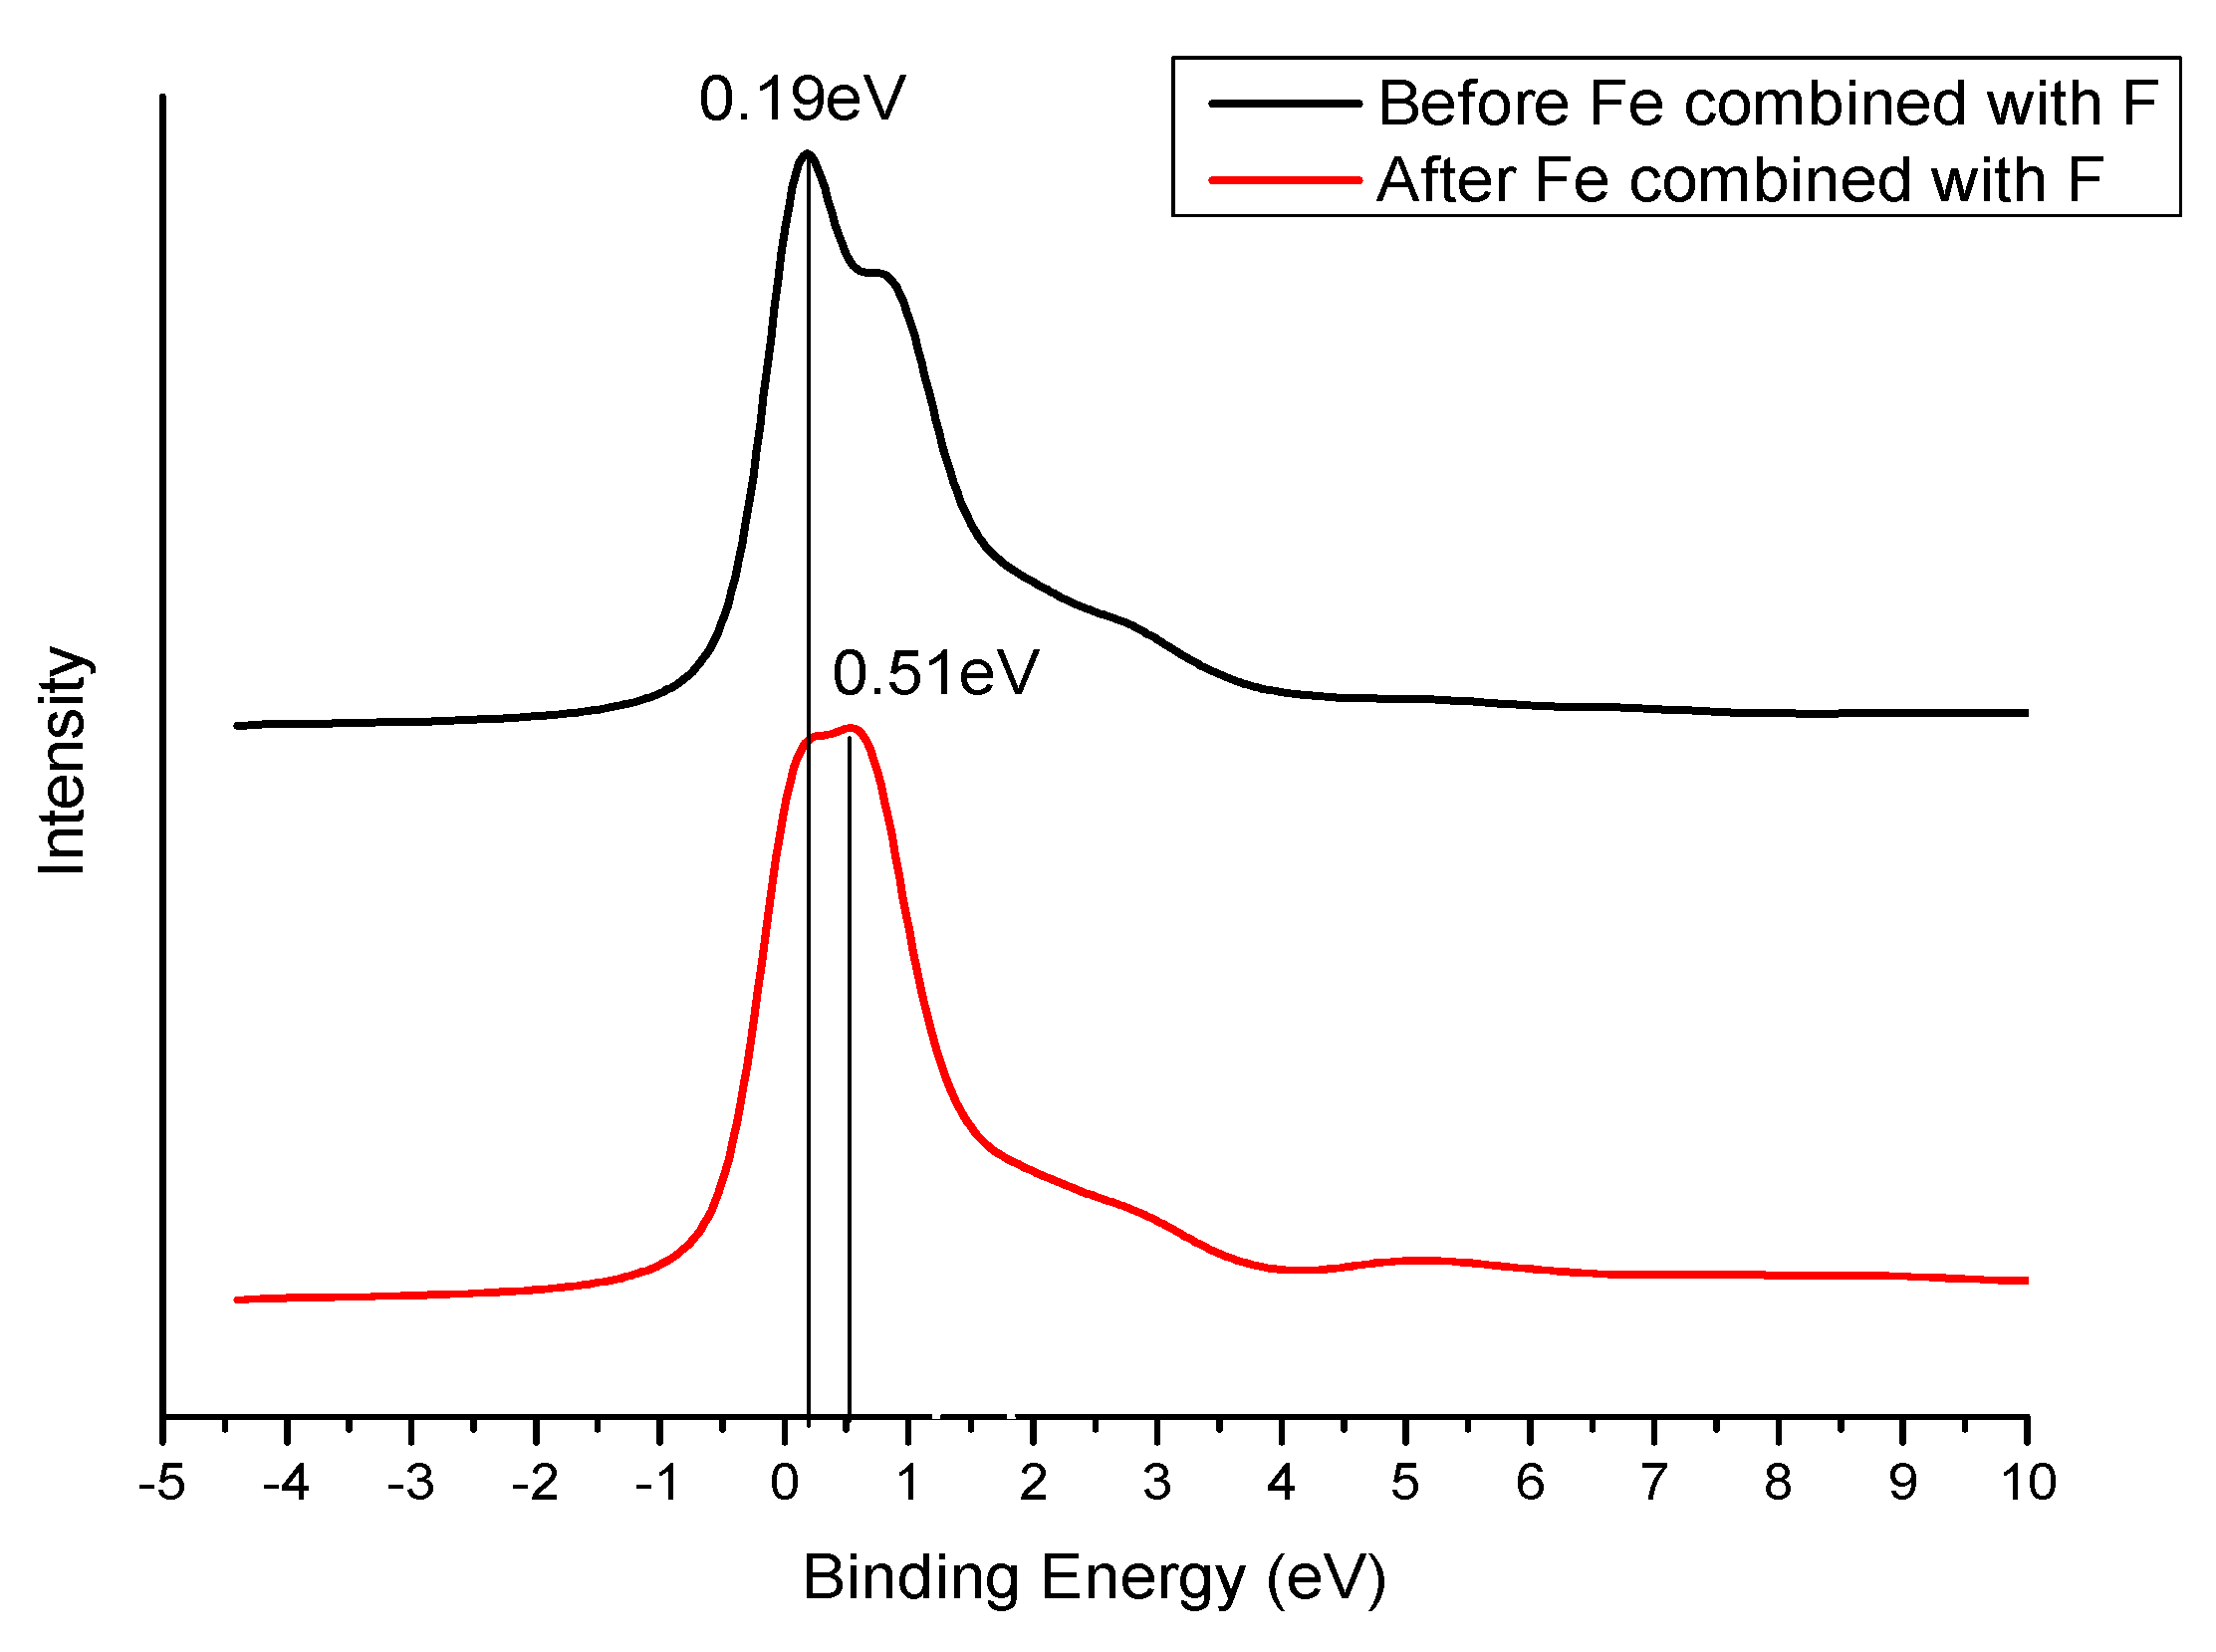
As shown in Figure 13, before and after the combination of the F and Fe atoms, the main peaks of the EELS spectrum shifted to two states, and the EELS spectrum showed that the binding energy of both states increased. The more the number of electrons lost in oxidation, the greater the increase. Before combining with F, the core-level energy peak of Fe 2p orbital was 0.18 eV. After combining with F, the main peak shifted to 0.54 eV with an increase of 0.36 eV. As the number of F atoms bound to Fe increased, the main peak shifted to 1.49 eV, the core-level energy increased by 1.31 eV.
The calculation confirmed the overall trend of CLS: before and after the combination of F and Nb atoms, the main peaks of the EELS spectrum under the two states shifted. Oxidation increased the binding energy of inner electrons. The greater the number of electrons lost during oxidation, the greater the increase; the reduction reduced the binding energy of inner electrons, the more electrons gained during reduction, the greater the decrease in binding energy; for an atom with a valence state electron shell structure, the shift of the binding energy of all inner electrons is almost the same. Before combining with F, the peak core energy level of Nb 3d orbital was 27.39 eV. After combining with F atoms, the main peak shifts to 27.77 eV, which increased 0.38 eV, and the shift was close to the XPS difference between Nb–O bonds and Nb–F bonds in the Nb 3d orbital, indicating that electrons were transferred from Nb atoms. Before combining with F, the peak of core-level energy the Fe 2p orbital was 0.19 eV. After combining with F, the core-level energy shifted to 0.51 eV, with an increase of 0.32 eV, indicating that electrons were transferred from Fe atoms. The binding energy of electrons inside the atoms was related to the electronegativity of the bonding ions. The greater the electronegativity, the stronger the ionic property of the bonds, and therefore the greater the electron binding energy. If these compounds were replaced by ions with different electronegativity, the electron binding energy would change. Compared with the EELS of Nb 3d orbital, the change of electron binding energy on Fe 2p orbital was not as obvious as that on Nb 3d orbital. Therefore, the result of XPS analysis was very consistent with the result of DFT calculation.

4.4. Interfacial Reaction during Columbite–(Fe) Mineral Leaching

The following reactions occurred during the HF acid leaching of FeNb2O6 [8]:
FeNb2O6 + 12HF = 2H2NbOF5 + FeF2 + 4H2O
The thermodynamic data of the reactants and products under 298 K, 100 kPa involved in the reaction are as follows [22,23]:
For Formulas (5) and (6), there were:
Δ r G m Θ = 4 Δ f G m Θ ( H + ( aq ) ) + 2 Δ f G m Θ ( ( NbOF 5 ) 2 ( aq ) ) + Δ f G m Θ ( FeF 2 ) + 4 Δ f G m Θ ( H 2 O ( g ) ) Δ f G m Θ ( F eNb 2 O 6 ( s ) ) 12 Δ f G m Θ ( HF ( l ) )
Δ r G m Θ = 4 Δ f G m Θ ( H + ( aq ) ) + 2 Δ f G m Θ ( ( NbF 7 ) 2 ( aq ) ) + Δ f G m Θ ( FeF 2 ) + 6 Δ f G m Θ ( H 2 O ( g ) ) Δ f G m Θ ( F eNb 2 O 6 ( s ) ) 16 Δ f G m Θ ( HF ( l ) )
Substituting the values in Table 5 in the Formulas (7) and (8), the Gibbs free energy of Reaction (5) was ΔrGmθ= −1902.1 kJ/mol, and the Gibbs free energy of Reaction (6) was ΔrGmθ = −2892.4 kJ/mol, indicating that Reactions (5) and (6) were exothermic reactions. The product system was more stable with lower energy. FeNb2O6 bulk contained two kinds of bonds, namely Nb–O bonds and Fe–O bonds. In the process of HF acid leaching FeNb2O6, Nb–F bonds and Fe–F bonds were formed on the mineral surface. In the crystal, the energy change before and after the reaction could be calculated by calculating the bond energy in Table 6. Each bond energy calculated in Table 6 came from the FeNb2O6 system containing HF and F atoms.
The total energy of each system was the sum of the energy of Nb, Fe, O, F atoms and the energy of Nb–O, Fe–O, Nb–F, and Fe–F bonds in the system, as shown in Formulas (9)–(12):
E1 = 8ENb + 4EFe + 24EO + 48ENb–O + 24EFe–O
E2 = 24ENb + 12EFe + 72EO + 132ENb–O + 64EFe–O
E3 = 24ENb + 12EFe + 72EO + 3EF + 129ENb–O + 64EFe–O + 2ENb–F + EFe–F
E4 = 24ENb + 12EFe + 72EO + 4EF + 128ENb–O + 64EFe–O + 2ENb–F + 2EFe–F
The bond energy data obtained from the data in Table 6 are shown in Table 7:
From the data in Table 7, it can be seen that the Fe–F bond energy is lower than the Nb–O bond energy which was the most unstable bond in the system. Combined with the Mulliken population analysis, Fe atoms were still bound to O atoms even after it combined with F, there was no significant difference in the Fe–O bond length with the addition of F, indicating that Fe atoms in the minerals was less soluble than the Nb atoms. Reactions (5) and (6) were written in the bonding form as follows:
Fe–O + 6Nb–O + 12H–F = 2Fe–F + 10Nb–F + 2Nb–O + 10O–H
Fe–O + 6Nb–O + 16H–F = 2Fe–F + 14Nb–F + 12O–H
Substituting the bond energy in Table 7 into Formulas (13) and (14), the energy change in the obtained system was ΔE1 = −20.912eV = −2010.792 kJ/mol, ΔE2 = −22.316 eV = −2145.820 kJ/mol. The adsorption reaction of hydrogen fluoride with the mineral surface was a self-emitting heat reaction.

5. Conclusions

  • According to Mulliken population analysis and charge density analysis, when Fe atoms in minerals were bound to F atoms, Fe–F bonds formed but the original Fe–O bonds were not broken, and Hirshfeld charge analysis showed that the amount of charge transfer on Fe was still in the range of 0.25 e–0.28 e before and after the combination with F, the change of the amount of charge was not significant. In comparison, after Nb atoms combined with F atoms and formed Nb–F bonds, the original Nb–O bonds broke or became extremely unstable. The charge transfer on Nb atoms increased from 0.78 e before adding F atoms to 0.94 e, and the increased charge was mainly from the newly formed Nb–F bonds. The above results indicate that compared with Fe, Nb atoms in FeNb2O6 were more likely to combine with F atoms in hydrofluoric acid to form Me–F bonds into solution.
  • n HF acid leaching of the columbite–(Fe) mineral FeNb2O6, the electron binding energies of Me–F bonds were larger than the original M–O, indicating that F ions reacted with Fe and Nb atoms to form a more stable complex in solution, which promoted the dissolution reaction. Under this acid leaching condition, the leaching rate of Fe and Nb elements increased with the increase of HF concentration, and Nb atoms were easier than Fe atoms to dissolve. Under the conditions of 5M and 10M HF acid leaching, with the increase of H+ concentration, the bonding mode of F and Nb gradually changed from bridge F (Nb–F–Nb) to terminal F (Nb–F). The ratio of the two increased from 71.74% to 108.29%. Since the amount of Nb atoms carried by the bridge F was twice that of the terminal F, when the HF concentration was lower, the rate of dissolution of Nb atoms from the mineral was slower.
  • According to the calculated bond energies of different FeNb2O6 (110) systems, it can be seen that the Fe–F bond energy was the lowest, which was lower than Nb–O bonds and Nb–F bonds, so they were the most unstable bonds in the system. The Gibbs free energy of the reaction between FeNb2O6 and HF under 298K 100kPa was ΔrGmθ = −1902.1 kJ/mol (produced FeF2 and H2NbOF5), the energy change in the system was ΔE1 = −2010.792 kJ/mol; The Gibbs free energy of the process forming FeF2 and H2NbF7 was ΔrGmθ = −2892.4kJ/mol, the energy change in the system was ΔE2 = −2145.820kJ/mol. The adsorption reactions of hydrogen fluoride with the mineral surface were spontaneous exothermic reactions.

Author Contributions

F.Y.: data curation, writing—original draft, investigation, software; Q.L.: conceptualization, methodology, validation, reviewing, and editing; D.W.: investigation, software; C.Z.: investigation, editing; S.Z.: investigation, reviewing, and editing. All authors have read and agreed to the published version of the manuscript.

Funding

This work is supported by National Natural Science Foundation of China (Grant No. 51974185). This work is supported by Engineering Technology Research Center of Shanghai (No. 19DZ2252900).

Data Availability Statement

Not applicable.

Acknowledgments

We appreciate the High Performance Computing Center of Shanghai University, and Shanghai Engineering Research Center of Intelligent Computing System (No. 19DZ2252600) for providing the computing resources and technical support.

Conflicts of Interest

The authors declare no conflict of interest. The funders had role in the design of the study; in the collection, analyses, the writing of the manuscript, and the decision to publish the results.

References

  1. Publisher’s NoteRodriguez, M.; Quiroga, O.; Ruiz, M.D. Kinetic study of ferrocolumbite dissolution in hydrofluoric acid medium. Hydrometallurgy 2007, 85, 87–94. [Google Scholar] [CrossRef]
  2. Aruga, A.; Tokizaki, E.; Nakai, I.; Sugitani, Y. Structure of iron diniobium hexaoxide, FeNb2O6: An example of metal-disordered trirutile structure. Acta Crystallogr. 2010, 41, 663–665. [Google Scholar] [CrossRef]
  3. Rodriguez, M.H.; Rosales, G.D.; Pinna, E.G.; Suarez, D.S. Extraction of niobium and tantalum from ferrocolumbite by hydrofluoric acid pressure leaching. Hydrometallurgy 2015, 156, 17–20. [Google Scholar] [CrossRef]
  4. Nikolaev, A.I.; Maiorov, V.G.; Baklanova, I.V. Decrease of HF Concentration in Process Solutions before Extractive Separation of Tantalum(V) from Niobium. Russ. J. Appl. Chem. 2002, 75, 1748–1752. [Google Scholar] [CrossRef]
  5. Timofeev, A.; Migdisov, A.A.; Williams-Jones, A.E. An experimental study of the solubility and speciation of niobium in fluoride-bearing aqueous solutions at elevated temperature. Geochim. Cosmochim. Acta 2015, 158, 103–111. [Google Scholar] [CrossRef]
  6. Awakura, Y.; Mashima, M.; Hirato, T. Dissolution of Columbite and Tantalite in Acidic Fluoride Media. Metall. Trans. B 1988, 19, 355–363. [Google Scholar] [CrossRef]
  7. Agulyansky, A. Main principals of the chemistry of tantalum and niobium fluoride compunds. In Chemistry of Tantalum and Niobium Fluoride Compounds; Elsevier: Amsterdam, The Netherlands, 2004; pp. 339–340. [Google Scholar] [CrossRef]
  8. Chanturiya, V.A.; Bunin, I.Z.; Ryazantseva, M.V.; Chanturiya, E.L.; Koporulina, E.V.; Anashkina, N.E. Modifying the physicochemical and electrical properties of tantalite and columbite surfaces under conditions of electrochemical treatment and high-voltage nanosecond pulses. Bull. Russ. Acad. Sci. Phys. 2017, 81, 269–274. [Google Scholar] [CrossRef]
  9. Von Oertzen, G.U.; Skinner, W.M.; Nesbitt, H.W. Ab initio and XPS studies of pyrite (100) surface states. Radiat. Phys. Chem. 2006, 75, 1855–1860. [Google Scholar] [CrossRef]
  10. Wang, J.; Gan, X.; Zhao, H.; Hu, M.; Li, K.; Qin, W.; Qiu, G. Dissolution and passivation mechanisms of chalcopyrite during bioleaching: DFT calculation, XPS and electrochemistry analysis. Miner. Eng. 2016, 98, 264–278. [Google Scholar] [CrossRef]
  11. Fongkaew, I.; Akrobetu, R.; Sehirlioglu, A.; Voevodin, A.; Limpijumnong, S.; Lambrecht, W.R. Core-level binding energy shifts as a tool to study surface processes on LaAlO3 /SrTiO3. J. Electron. Spectrosc. Relat. Phenom. 2017, 218, 21–29. [Google Scholar] [CrossRef]
  12. Valencia-Balvín, C.; Pérez-Walton, S.; Dalpian, G.M.; Osorio-Guillén, J.M. First-principles equation of state and phase stability of niobium pentoxide. Comput. Mater. Sci. 2014, 81, 133–140. [Google Scholar] [CrossRef]
  13. Lacerda, L.C.; dos Santos Pires, M.; Corrêa, S.; Oliveira, L.C.; Ramalho, T.C. Oxidative dehydration reaction of glycerol into acrylic acid: A first-principles prediction of structural and thermodynamic parameters of a bifunctional catalyst. Chem. Phys. Lett. 2016, 651, 161–167. [Google Scholar] [CrossRef]
  14. Oliveira, J.A.; Reis, M.O.; Pires, M.S.; Ruotolo, L.A.; Ramalho, T.C.; Oliveira, C.R.; Lacerda, L.C.; Nogueira, F.G. Zn-doped Nb2O5 photocatalysts driven by visible-light: An experimental and theoretical study. Mater. Chem. Phys. 2019, 228, 160–167. [Google Scholar] [CrossRef]
  15. Kresse, G.; Joubert, D. From ultrasoft pseudopotentials to the projector augmented-wave method. Phys. Rev. B 1999, 59, 1758–1775. [Google Scholar] [CrossRef]
  16. Jain, A.; Ong, S.P.; Hautier, G.; Chen, W.; Richards, W.D.; Dacek, S.; Cholia, S.; Gunter, D.; Skinner, D.; Ceder, G.; et al. Commentary: The Materials Project: A materials genome approach to accelerating materials innovation. APL Mater. 2013, 1, 011002. [Google Scholar] [CrossRef] [Green Version]
  17. Zeng, Z.; Ma, X.; Ding, W.; Li, W. First-principles calculation of core-level binding energy shift in surface chemical processes. Sci. China Chem. 2010, 2, 122–130. [Google Scholar] [CrossRef]
  18. Chanturia, V.A.; Bunin, I.Z.; Ryazantseva, M.V.; Filippova, I.V.; Koporulina, E.V. Nanosecond electromagnetic pulse effect on phase composition of pyrite and arsenopyrite surfaces, their sorption and flotation properties. J. Min. Sci. 2011, 47, 506–513. [Google Scholar] [CrossRef]
  19. Zhang, C.; Grass, M.E.; McDaniel, A.H.; DeCaluwe, S.C.; El Gabaly, F.; Liu, Z.; McCarty, K.F.; Farrow, R.L.; Linne, M.A.; Hussain, Z.; et al. Measuring fundamental properties in operating solid oxide electrochemical cells by using in situ X-ray photoelectron spectroscopy. Nat. Mater. 2010, 9, 944–949. [Google Scholar] [CrossRef]
  20. Mayer, I. Bond order and valence: Relations to Mulliken’s population analysis. Int. J. Quantum Chem. 1984, 26, 151–154. [Google Scholar] [CrossRef]
  21. Rakhmatullin, A.; Boča, M.; Mlynáriková, J.; Hadzimová, E.; Vasková, Z.; Polovov, I.B.; Mičušík, M. Solid state NMR and XPS of ternary fluorido-zirconates of various coordination modes. J. Fluor. Chem. 2018, 208, 24–35. [Google Scholar] [CrossRef]
  22. Van, V.; Daněk, V. Formation Gibbs energy of K2NbF7, K2NbOF5, and K2NbO2F3 from electrochemical measurements. Thermochim. Acta 2001, 373, 181–186. [Google Scholar] [CrossRef]
  23. Liang, Y.; Che, Y. Thermodynamic Data Manual for Inorganic Matter; Northeastern University Press: Shenyang, China, 1993. [Google Scholar]
Figure 1. Density of states diagram (DOS) of bulk FeNb2O6 calculated by DFT + U method.
Minerals 11 00146 g001
Figure 2. The optimized structure of FeNb2O6 (the purple atoms are Fe atoms, the red atoms are O atoms, and the blue atoms are Nb atoms).
Minerals 11 00146 g002
Figure 3. Different mineral phases in columbite–(Fe).
Minerals 11 00146 g003
Figure 4. XRD pattern of selected columbite–(Fe).
Minerals 11 00146 g004
Figure 5. Diagram of Nb atoms and Fe atoms in columbite–(Fe) bonding with different numbers of F ions. (a) One F ion combined Nb atom; (b) 2 F ions combined with Nb atom; (c) 3 F ions combined with Nb atom; (d) 1 F atom was added near Fe (when 2 F and 3 F atoms were added in the system); and (e) When 2 F is added near Fe (4 F and 6 F atoms are added to the system).
Minerals 11 00146 g005
Figure 6. Charge density diagram of FeNb2O6 (110).
Minerals 11 00146 g006
Figure 7. Electron density difference on (110) surface in different systems before and after acid leaching: (a) Nb atom combined with O atom on FeNb2O6 (110) surface (b) Nb atom combined an F atom on FeNb2O6 (110) surface (c) Nb atom combined 2 F atoms on FeNb2O6 (110) surface (d) Nb atom combined 3 F atoms on FeNb2O6 (110) surface.
Minerals 11 00146 g007
Figure 8. Electron density difference on (110) surface in different systems before and after acid leaching: (a) Fe atom combined with O atom on FeNb2O6 (110) surface; (b) Fe atom combined an F atom on FeNb2O6 (110) surface; (c) Fe atom combined 2 F atoms on FeNb2O6 (110) surface.
Minerals 11 00146 g008
Figure 9. High-resolution XPS spectra of O 1s of the FeNb2O6 after different concentrations of HF leaching: (a) 5mol/L HF; (b) 10mol/L HF.
Minerals 11 00146 g009
Figure 10. High-resolution XPS spectra of Nb 3d of the FeNb2O6 before and after different concentrations of HF leaching: (a) before acid leaching; (b) 5 mol/L HF; (c) 10 mol/L HF.
Minerals 11 00146 g010
Figure 11. High-resolution XPS spectra of F 1s of the FeNb2O6 before and after different concentrations of HF leaching: (a) 5 mol/L HF; (b) 10 mol/L HF.
Minerals 11 00146 g011
Figure 12. EELS spectrum of Nb 3d orbital in FeNb2O6(110) system before and after adding HF.
Minerals 11 00146 g012
Figure 13. EELS spectrum of Nb 3d orbital in FeNb2O6(110) system before and after adding HF.
Minerals 11 00146 g013
Table 1. Mulliken populations and bond lengths of some Nb–O and Nb–F in FeNb2O6 before and after HF acid leaching.
Nb–ONb–FFe–OFe–F
FeNb2O6(110)Number of bonds4-4-
Length of bonds (Å)1.82–2.02-1.84–1.88-
FeNb2O6(110) with 1 H atom and 1 F atomNumber of bonds314-
Length of bonds (Å)1.79–1.931.891.84–1.90-
FeNb2O6(110) with 2 F atomsNumber of bonds3141
Length of bonds (Å)1.78–1.921.871.89–1.971.78
FeNb2O6(110) with 3 F atomsNumber of bonds3241
Length of bonds (Å)1.82–1.93, 2.42 1.78, 1.86 1.87–1.891.77
FeNb2O6(110) with 4 F atomsNumber of bonds3242
Length of bonds (Å)1.76–1.83, 2.411.86, 1.87 1.87–1.991.78, 1.82
FeNb2O6(110) with 6 F atomsNumber of bonds2342
Length of bonds (Å)1.75, 2.091.85–2.01 1.86–2.071.79, 1.80
Note: - means there is no bond formed.
Table 2. Hirshfeld charge analysis of Nb and Fe before and after adding one HF, 2 F atoms and 3 F atoms.
Before Reaction (Charge)After Adding HF (Charge)After Adding 2 F Atoms (Charge)After Adding 3 F Atoms (Charge)After Adding 4 F Atoms (Charge)After Adding 6 F Atoms (Charge)
Nb0.780.810.840.880.920.94
Fe0.280.260.230.250.250.23
Table 3. ICP detection results of the solution of different concentrations of HF acid leaching minerals.
Concentrations of HF AcidContent (mg/L)Nb/Fe Ratio
FeNb
5mol/L HF512.471378.22.69
10mol/L HF1010.62983.72.95
Table 4. F 1s orbital binding energy after 5M and 10M HF acid leaching FeNb2O6.
BondsPeak Position/eVI/S
5M 10M5M10M
Nb–F–Nb686.06684.932376.24494.58
Nb–F684.37683.95577.32169.45
Terminal/Bridge24.29%34.26%
Table 5. Standard thermodynamic data of FeNb2O6, H2O, HF, FeF2, and (NbF7)2− at 298 K, 100 kPa [23].
SubstanceΔfGmθ (kJ∙mol−1)
FeNb2O6 (s)−2154.8
H2O (g)−237.25
HF (g)−273.20
FeF2−663.18
(NbF7)2− (aq)−773.46
(NbOF5)2− (aq)−959.46
Table 6. The number of various atoms and bonds in different systems and the total energy of the system.
FeNb2O6 BulkFeNb2O6 (110) SurfaceFeNb2O6 (110) with 3 F AtomsFeNb2O6 (110) with 4 F Atoms
Number of Nb atoms8242424
Number of Fe atoms4121212
Number of O atoms24727272
Number of F atoms--34
Number of Nb–O bonds48132129128
Number of Nb–O bonds24646464
Number of Nb–O bonds--22
Number of Nb–O bonds--12
Total energy of each systems (eV)E1 = −26350.68E2 = −79143.24E3 = −80698.31E4 = −81357.93
Energy of atoms of different elements (eV)ENb−1541.34EFe−855.92
EF−657.91EO−429.60
Note: - means there is no atoms or bonds added or formed.
Table 7. Average bond energy calculated under different systems.
BondBond Energy (eV)
Nb–O−1.025
H–F−8.316
Nb–F−5.438
O–H−7.482
Fe–F−2.732
Fe–O−9.86
Publisher’s Note: MDPI stays neutral with regard to jurisdictional claims in published maps and institutional affiliations.

