
Characterization of Tailings Dams by Electrical Geophysical Methods (ERT, IP): Federico Mine (La Carolina, Southeastern Spain)


Abstract
:
1. Introduction
2. Description of the Study Area
2.1. Geological Setting
2.2. Mining Technique
2.3. Tailings Dam
3. Materials and Methods
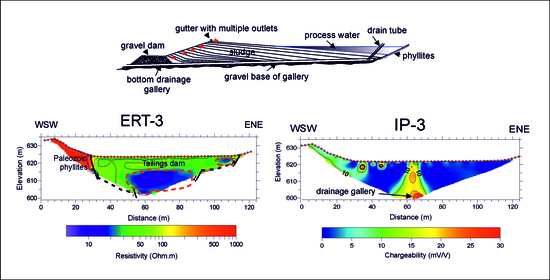
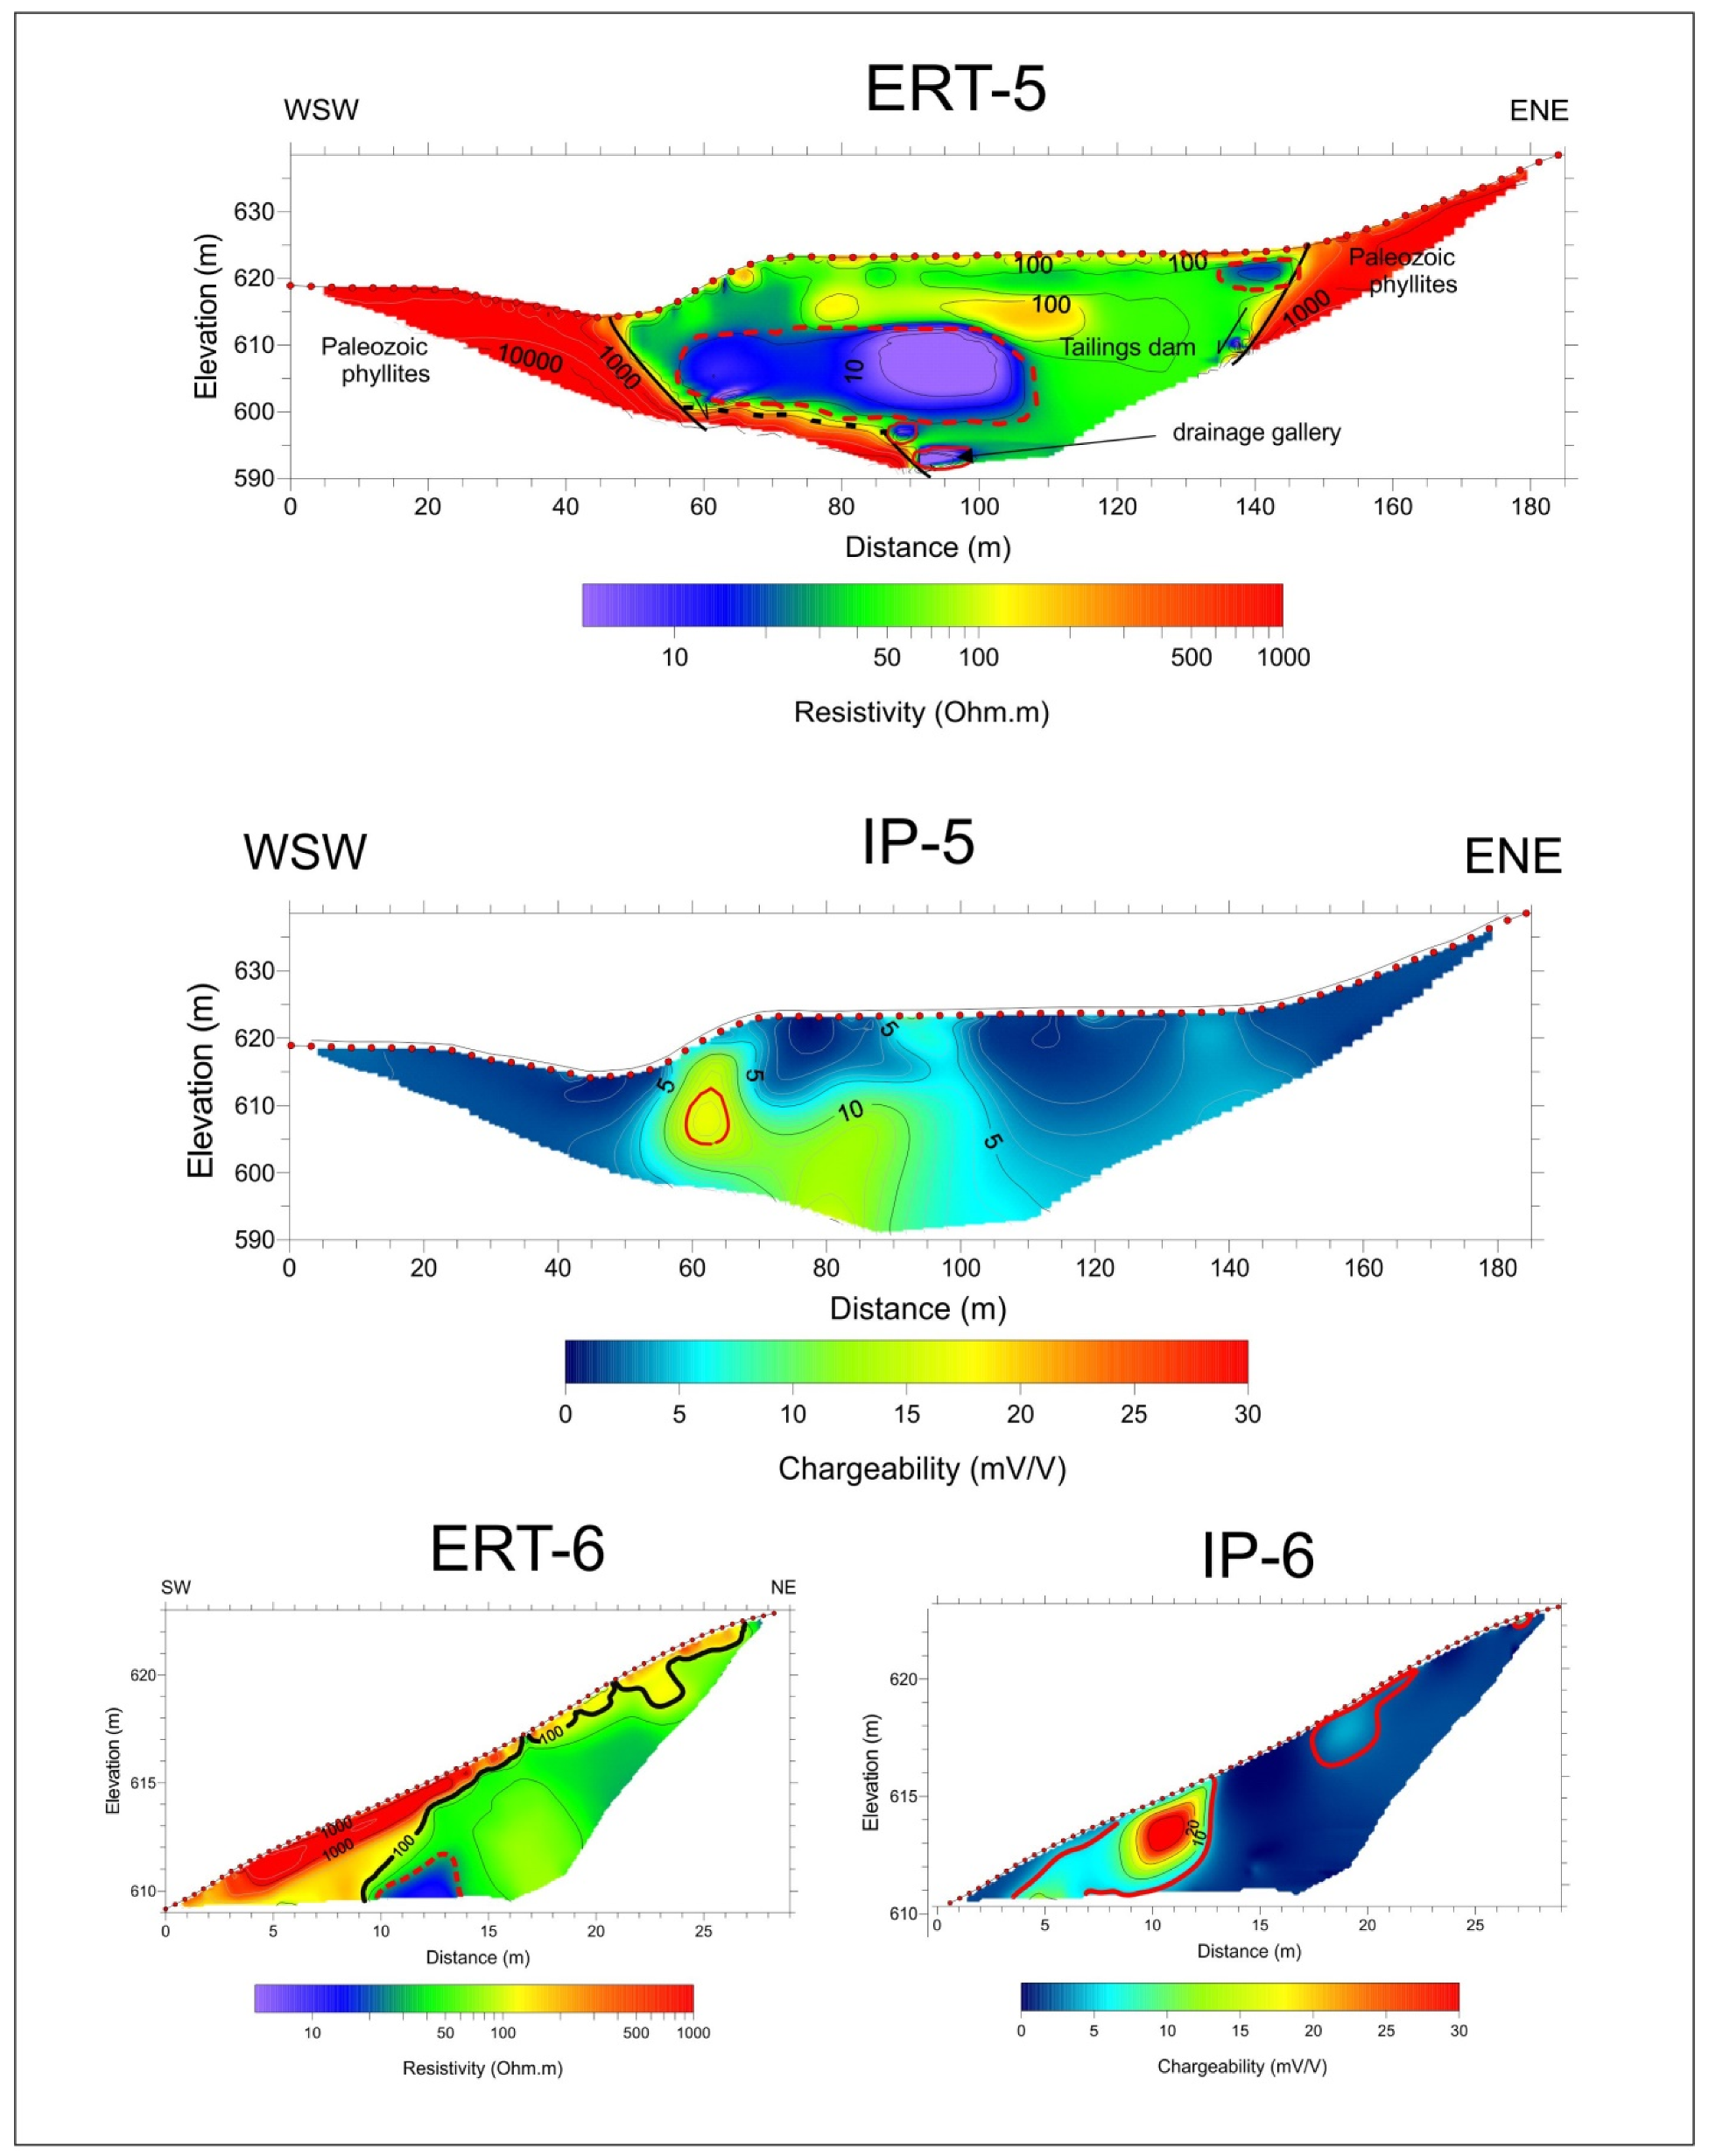
Electrical Resistivity Tomography (ERT) and Induced Polarization (IP)
4. Discussion and Results
Electrical Resistivity Tomography (ERT) and Induced Polarization (IP)
5. Conclusions
Author Contributions
Funding
Institutional Review Board Statement
Informed Consent Statement
Data Availability Statement
Acknowledgments
Conflicts of Interest
References
- Gutiérrez-Guzmán, F. Minería en Sierra Morena; Ilustre Colegio de Ingenieros Técnicos de Minas de Linares: Granada, Spain, 2007. [Google Scholar]
- Contreras, F.; Dueñas, J. La Minería y la Metalurgia en el Alto Guadalquivir: Desde sus Orígenes Hasta Nuestros Días; Instituto de Estudios Giennenses, Diputación de Jaén: Jaén, Spain, 2010. [Google Scholar]
- Martínez, J.; Rey, J.; Hidalgo, M.C.; Benavente, J. Characterizing Abandoned Mining Dams by Geophysical (ERI) and Geochemical Methods: The Linares-La Carolina District (Southern Spain). Water Air Soil Pollut. 2012, 223, 2955–2968. [Google Scholar] [CrossRef]
- Martínez, J.; Rey, J.; Hidalgo, M.C.; Garrido, J.; Rojas, D. Influence of measurement conditions on the resolution of electrical resistivity imaging: The example of abandoned mining dams in the La Carolina District (Southern Spain). Int. J. Miner. Process. 2014, 133, 67–72. [Google Scholar] [CrossRef]
- Martínez, J.; Hidalgo, M.C.; Rey, J.; Garrido, J.; Kohfahl, C.; Benavente, J.; Rojas, D. Multidisciplinary characterization of a tai-lings pond in the Linares-La Carolina mining district, Spain. J. Geochem. Explor. 2016, 162, 62–71. [Google Scholar] [CrossRef]
- Rey, J.; Martínez, J.; Hidalgo, C.; Rojas, D. Heavy metal pollution in the Quaternary Garza basin: A multidisciplinary study of the environmental risks posed by mining (Linares, southern Spain). Catena 2013, 110, 234–242. [Google Scholar] [CrossRef]
- Cortada, U.; Martínez, J.; Rey, J.; Hidalgo, M.C.; Sandoval, S. Assessment of tailings pond seals using geophysical and hydrochemical techniques. Eng. Geol. 2017, 223, 59–70. [Google Scholar] [CrossRef]
- Ji, K.; Kim, J.; Lee, M.; Park, S.; Kwon, H.J.; Cheong, H.K.; Jang, J.-Y.; Kim, D.-S.; Yu, S.; Kim, Y.-W.; et al. Assessment of exposure to heavy metals and health risks among residents near abandoned metal mines in Goseong, Korea. Environ. Pollut. 2013, 178, 322–328. [Google Scholar] [CrossRef]
- IGME. Inventario Nacional de Depósitos de Lodos. Available online: http://www.igme.es/actividadesIGME/lineas/RMeIA.htm. (accessed on 31 January 2021).
- Marangoni, Y.; Mantovani, M. Geophysical signatures of the alkaline intrusions bordering the Paraná Basin. J. S. Am. Earth Sci. 2013, 41, 83–98. [Google Scholar] [CrossRef]
- Abud Louro, V.; Mantovan, M. i3D inversion and modeling of magnetic and gravimetric data characterizing the geophysical anomaly source in Pratinha I in the southeast of Brazil. J. Appl. Geophys. 2012, 80, 110–120. [Google Scholar] [CrossRef]
- Martínez-Pagán, P.; Gómez-Ortiz, D.; Martín-Crespo, T.; Manteca, J.I.; Rosique, M. The electrical resistivity tomography method in the detection of shallow mining cavities. A case study on the Victoria Cave, Cartagena (SE Spain). Eng. Geol. 2013, 156, 1–10. [Google Scholar]
- Smith, R. Electromagnetic Induction Methods in Mining Geophysics from 2008 to 2012. Surv. Geophys. 2013, 35, 123–156. [Google Scholar] [CrossRef]
- Olivier, G.; Brenguier, F.; Wity, T.; Lynch, R. Monitoring the stability of tailings dam walls with ambient seismic noise. Lead. Edge 2017, 36, 350a1–350a6. [Google Scholar] [CrossRef]
- Min, L.; Ming, X.; Shimin, L.; Douglas, R. In Situ Seismic Investigations for Evaluating Geotechnical Properties and Liquefaction Potential of Fine Coal Tailings. J. Geotech. Geoenviron. Eng. 2020, 146, 04020014. [Google Scholar]
- Martínez-Pagán, P.; Faz Cano, A.; Aracil, E.; Arocena, J.M. Electrical resistivity imaging revealed the spatial properties of mine tailing ponds in the Sierra Minera of Southeast Spain. J. Environ. Eng. Geophys. 2009, 14, 63–76. [Google Scholar] [CrossRef]
- Martínez-Pagán, P.; Faz, A.; Acosta, J.A.; Carmona, D.M.; Martínez-Martínez, S. A multidisciplinary study for mining landscape reclamation: A study case on two tailing ponds in the Region of Murcia (SE Spain). Phys. Chem. Earth 2011, 36, 1331–1344. [Google Scholar] [CrossRef]
- Gabarrón, M.; Martínez-Pagán, P.; Martínez-Segura, M.A.; Martínez-Martínez, S.; Faz, A.; Acosta, J.A. Electrical Resistivity Tomography as a Support Tool to Estimate Physicochemical Properties of Mining Tailings Pond. Preprints 2020, 2020010377. [Google Scholar] [CrossRef]
- Martín-Crespo, T.; Martín-Velázquez, S.; Gómez-Ortíz, D. A geochemical and geophysical characterization of sul_de mine ponds at the Iberian Pyrite Belt (Spain). Water Air Soil Pollut. 2010, 217, 387–405. [Google Scholar] [CrossRef] [Green Version]
- Gómez-Ortiz, D.; Martín-Velázquez, S.; Martín-Crespo, T.; De Ignacio-San José, C.; Lillo, J. Application of electrical resistivity tomography to the environmental characterization of the abandoned massive sulphide mine ponds (Iberian Pyrite Belt, SW Spain). Near Surf. Geophys. 2010, 8, 65–74. [Google Scholar] [CrossRef] [Green Version]
- Gómez-Ortiz, D.; Fernández-Remolar, D.C.; Granda, A.; Quesada, C.; Granda, T.; Prieto-Ballesteros, O.; Molina, A.; Amils, R. Identification of the subsurface bodies responsible for acidity in Rio Tinto source water; Spain. Earth Planet. Sci. Lett. 2014, 391, 36–41. [Google Scholar] [CrossRef]
- Lghoul, M.; Teixido, T.; Peña, J.A.; Hakkou-Azzouz, R.; Kchikach, A.; Guerin, R.; Jaffal, M.; Zouhri, L. Electrical and Seismic Tomography Used to Image the Structureof a Tailings Pond at the Abandoned Kettara Mine, Morocco. Mine Water Environ. 2012. [Google Scholar] [CrossRef]
- Zarroca, M.; Linares, R.; Velásquez-López, P.C.; Roqué, C. Application of electrical resistiviy imaging (ERI) to a tailing dam project for artisanal and small-scale gold mining in Zaruma-Portovelo, Ecuador. J. Appl. Geophys. 2015, 113, 103–113. [Google Scholar] [CrossRef]
- Placencia-Gómez, E.; Parviainen, A.; Hokkanen, T.; Loukola-Ruskeeniemi, K. Integrated geophysical and geochemical study on AMD generation at the Haveri Au–Cu mine tailings, SW Finland. Environ. Earth Sci. 2010, 61, 1435–1447. [Google Scholar] [CrossRef]
- Tamain, G. Recherches Géologiques et Minières en Sierra Morena Orientale (Espagne). Ph.D. Thesis, Université Paris-Sud, Paris, France, 1972. (In French). [Google Scholar]
- Castelló, R.; Orviz, F. Mapa y Memoria Explicativa de la Hoja n° 884 (La Carolina) del mapa Geológico de España, Escala 1:50,000; Instituto Geológico y Minero de España: España, Spain, 1976. [Google Scholar]
- Ríos, S. Estudio del Metalotecto Plumbífero del Ordoviense (La Carolina-Santa Elena, Sierra Morena Oriental, Provincia de Jaén. Ph.D. Thesis, Politécnica Madrid, E.T.S. Ingenieros de Minas, Madrid, Spain, 1977. [Google Scholar]
- Fontboté, J.M. Mapa Geológico y Memoria Explicativa de la Hoja 70 (Linares), Escala 1:200,000; Ministerio de Industria: Madrid, Spain, 1982; 29p.
- Lillo, J. Geology and Geochemistry of Linares-La Carolina Pb-Ore Field. Southeastern Border of the Hesperian Massif. Ph.D. Thesis, University of Leeds, Leeds, UK, 1992. [Google Scholar]
- Hoek, E.; Kaiser, P.K.; Bawden, W.F. Support of Underground Excavations in Hard Rock; Bolkema Publishers: Rotterdam, The Netherlands, 1995. [Google Scholar]
- Rojas, D.; Hidalgo, M.C.; Kohfahl, C.; Rey, J.; Martínez, J.; Benavente, J. Oxidation Dynamics and Composition of the Flotation Plant Derived Tailing Impoundment Aquisgrana (Spain). Water Air Soil Pollut. 2019, 230, 158. [Google Scholar] [CrossRef]
- Telford, W.M.; Geldart, L.P.; Sheriff, R.E. Applied Geophysics; Cambridge University Press: Cambridge, UK, 1990; 770p. [Google Scholar]
- Sasaki, Y. Resolution of resistivity tomography inferred from numerical simulation. Geophys. Prospect. 1992, 40, 453–464. [Google Scholar] [CrossRef]
- Store, H.; Storz, W.; Jacobs, F. Electrical resistivity tomography to investigate geological structures of earth’s upper crust. Geophys. Prospect. 2000, 48, 455–471. [Google Scholar] [CrossRef]
- Dahlin, T.; Zhou, B. A numerical comparison of 2D resistivity imaging with 10 electrode arrays. Geophys. Prospect. 2004, 52, 379–398. [Google Scholar] [CrossRef] [Green Version]
- Griffiths, D.H.; Barker, R.D. Two-dimensional resistivity imaging and modelling in areas of complex geology. J. Appl. Geophys. 1993, 29, 211–226. [Google Scholar] [CrossRef]
- Maillet, G.M.; Rizzo, E.; Revil, A.; Vella, C. High resolution electrical resistivity tomography (ERT) in a transition zone environment: Application for detailed internal architecture and infilling processes study of a Rhône River paleo-channel. Mar. Geophys. Res. 2005, 26, 317–328. [Google Scholar] [CrossRef]
- Martínez, J.; Benavente, J.; García-Aróstegui, J.L.; Hidalgo, M.C.; Rey, J. Contribution of electrical resistivity tomography to the study of detritical aquifers affected by seawater intrusion-extrusion effects: The river Vélez delta (Vélez-Málaga, southern Spain). Eng. Geol. 2009, 108, 161–168. [Google Scholar] [CrossRef]
- André, F.; van Leeuwen, C.; Saussez, S.; Van Durmen, R.; Bogaert, P.; Moghadas, D.; de Resseguier, L.; Delvaux, B.; Vereecken, H.; Lambot, S. High-resolution imaging of a vineyard in south of France using ground-penetrating radar, electromagnetic induction and electrical resistivity tomography. J. Appl. Geophys. 2012, 78, 113–122. [Google Scholar] [CrossRef]
- Irawan, D.; Sumintadireja, P.; Saepuloh, A. 2-D subsurface Imaging Tecniques for Deep ore mineral mapping using geoelectrical and induced polarization (IP) methods. Proc. Earth Planet. Sci. 2013, 6, 139–144. [Google Scholar] [CrossRef] [Green Version]
- Martínez, J.; Rey, J.; Sandoval, S.; Hidalgo, C.; Mendoza, R. Geophysical prospection using ERI and IP techniques to locate vein deposits. Remote Sens. 2019, 11, 2923. [Google Scholar] [CrossRef] [Green Version]
- Sumner, J.S. Principles of Induced Polarization for Geophysical Exploration; Elsevier Scientific Publishing: Amsterdam, The Netherlands, 1976. [Google Scholar]
- Zhadanov, M.S. Direct current and induced polarization methods. In Foundations of Geophysical Electromagnetic, Theory and Methods; Elsevier: Amsterdam, The Netherlands, 2018; Volume 2018, pp. 439–493. [Google Scholar]
- Loke, M.H.; Barker, R.D. Rapid least-squares inversion of apparent resistivity pseudosections by a quasi-Newton method. Geophys. Prospect. 1996, 44, 131–152. [Google Scholar] [CrossRef]
- Loke, M.H.; Dahlin, T. A comparison of the Gauss-Newton and quasi-Newton methods in resistivity imaging inversion. J. Appl. Geophys. 2002, 49, 149–162. [Google Scholar] [CrossRef] [Green Version]
- Loke, M.H. Tutorial: 2-D and 3-D Electrical Imaging Surveys, Revision Date: 5th November 2014. Available online: www.geotomosoft.com (accessed on 19 February 2015).


Publisher’s Note: MDPI stays neutral with regard to jurisdictional claims in published maps and institutional affiliations. |
© 2021 by the authors. Licensee MDPI, Basel, Switzerland. This article is an open access article distributed under the terms and conditions of the Creative Commons Attribution (CC BY) license (http://creativecommons.org/licenses/by/4.0/).
Share and Cite
Martínez, J.; Mendoza, R.; Rey, J.; Sandoval, S.; Hidalgo, M.C. Characterization of Tailings Dams by Electrical Geophysical Methods (ERT, IP): Federico Mine (La Carolina, Southeastern Spain). Minerals 2021, 11, 145. https://doi.org/10.3390/min11020145
Martínez J, Mendoza R, Rey J, Sandoval S, Hidalgo MC. Characterization of Tailings Dams by Electrical Geophysical Methods (ERT, IP): Federico Mine (La Carolina, Southeastern Spain). Minerals. 2021; 11(2):145. https://doi.org/10.3390/min11020145
Chicago/Turabian StyleMartínez, Julián, Rosendo Mendoza, Javier Rey, Senén Sandoval, and M. Carmen Hidalgo. 2021. "Characterization of Tailings Dams by Electrical Geophysical Methods (ERT, IP): Federico Mine (La Carolina, Southeastern Spain)" Minerals 11, no. 2: 145. https://doi.org/10.3390/min11020145