Article

Provenance and Tectonic Setting of Lower Cretaceous Huanhe Formation Sandstones, Northwest Ordos Basin, North-Central China

1
Beijing Research Institute of Uranium Geology, China National Nuclear Corporation, Beijing 100029, China
2
Key Laboratory of Uranium Resource Prospecting and Evaluating Technology, China National Nuclear Corporation, Beijing 100029, China
*
Author to whom correspondence should be addressed.
Minerals 2021, 11(12), 1376; https://doi.org/10.3390/min11121376
Submission received: 7 November 2021 / Revised: 22 November 2021 / Accepted: 24 November 2021 / Published: 7 December 2021

Abstract

:
In adjustment to fulfill the requirements of the investigation regarding the lower Cretaceous sandstone uranium deposit in the Naogaodai area within the northwest of Ordos Basin, twenty-seven sandstone samples obtained from the Lower Cretaceous Huanhe Formation were analyzed for major, trace and rare earth elements (REE). The source of clastic and tectonic background was additionally analyzed. The results show that Huanhe sandstone is feldspar rich sandstone, and also the mineral composition is principally quartz, albite and plagioclase; the ratio of light to heavy rare earth elements (LREE/HREE) is 9.25–10.83, with an average value of 10.00; (La/Yb)CN is 10.20–12.53, with an average value of 11.24, demonstrating that LREE is enriched and fractionated compared with HREE. REE distribution patterns are similar, which additionally reveals that Huanhe sandstone has a homogenous source; the Index of Compositional Variability (ICV) value is 1.17–1.73, with an average value of 1.35, both greater than 1, showing an immature property, which may be first-order cycle deposition. The average value of the Chemical Index of Alteration (CIA) is 50.29, suggesting that the source rock has encountered weak chemical weathering; sandstones are near-source first-cycle provenance, which is not significantly influenced by sedimentary sorting and recycling. The geochemical qualities further indicate that Huanhe sandstone was deposited in a passive margin and experienced moderate weathering.

1. Introduction

In recent years, various exceptional remarkable achievements have been made in recognising the geotectonic background throughout the formation of rocks, the provenance of the basin and the tectonic background of the provenance area, providing a new perspective for understanding the evolution of the basin and its source area [1,2,3,4,5,6,7,8]. Detrital mineralogy and geochemical characteristics of siliciclastic sediments will effectively reveal the provenance area, tectonic settings, transportation, paleoweathering conditions of the source area, and also establish a basis for understanding paleoclimate and diagenesis [9,10,11,12]. Mineralogy and petrography of sandstones have been widely used to determine their provenance [13,14]. Bulk rock geochemistry of sandstones has also been used in the determination of their provenance, tectonic setting and paleoweathering of the source area [8,15,16,17,18]. In this study, an integrated approach employing mineralogy, petrography together with bulk-rock geochemistry in order to reveal the provenance, tectonic setting, paleoweathering and paleoclimate has been widely documented by many researchers [13,19,20].
Lower Cretaceous strata are extensively distributed throughout the northwestern part of the Ordos Basin. Recently, we have a tendency to find uranium mineralization information within the Huanhe Formation of the Lower Cretaceous. Several studies have documented the stratigraphy, sedimentology and structural framework of the Lower Cretaceous Huanhe Formation in the Ordos Basin, but there are no data regarding its provenance, tectonic setting, paleoweathering and paleoclimate. Therefore, this study aims to determine provenance, tectonic setting, source area paleoweathering, and paleoclimatic conditions of the Huanhe sandstones through a combination of mineralogical composition, petrographical analysis and bulk-rock geochemical data. In a broad interest, the results of this study have significant implications to reconstruct the paleoclimatic conditions and paleogeographical evolution of northwestern Ordos Basin during Early Cretaceous. Recently, we discovered uranium mineralization information in the Huanhe Formation of Lower Cretaceous. Few studies have been conducted on it before; there is a lack of research especially on the corresponding changes of the provenance of the sandstone-type uranium deposits during the depositional period and the regional sedimentary-tectonic background. The uranium source in the pre-enrichment stage during the sedimentary diagenesis process is consistent with the provenance of the detrital sediments of the Huanhe Formation. Therefore, by studying the provenance of the detrital sediments of the Huanhe Formation, we can have a deeper understanding of the mineralization process of sandstone-type uranium deposits.

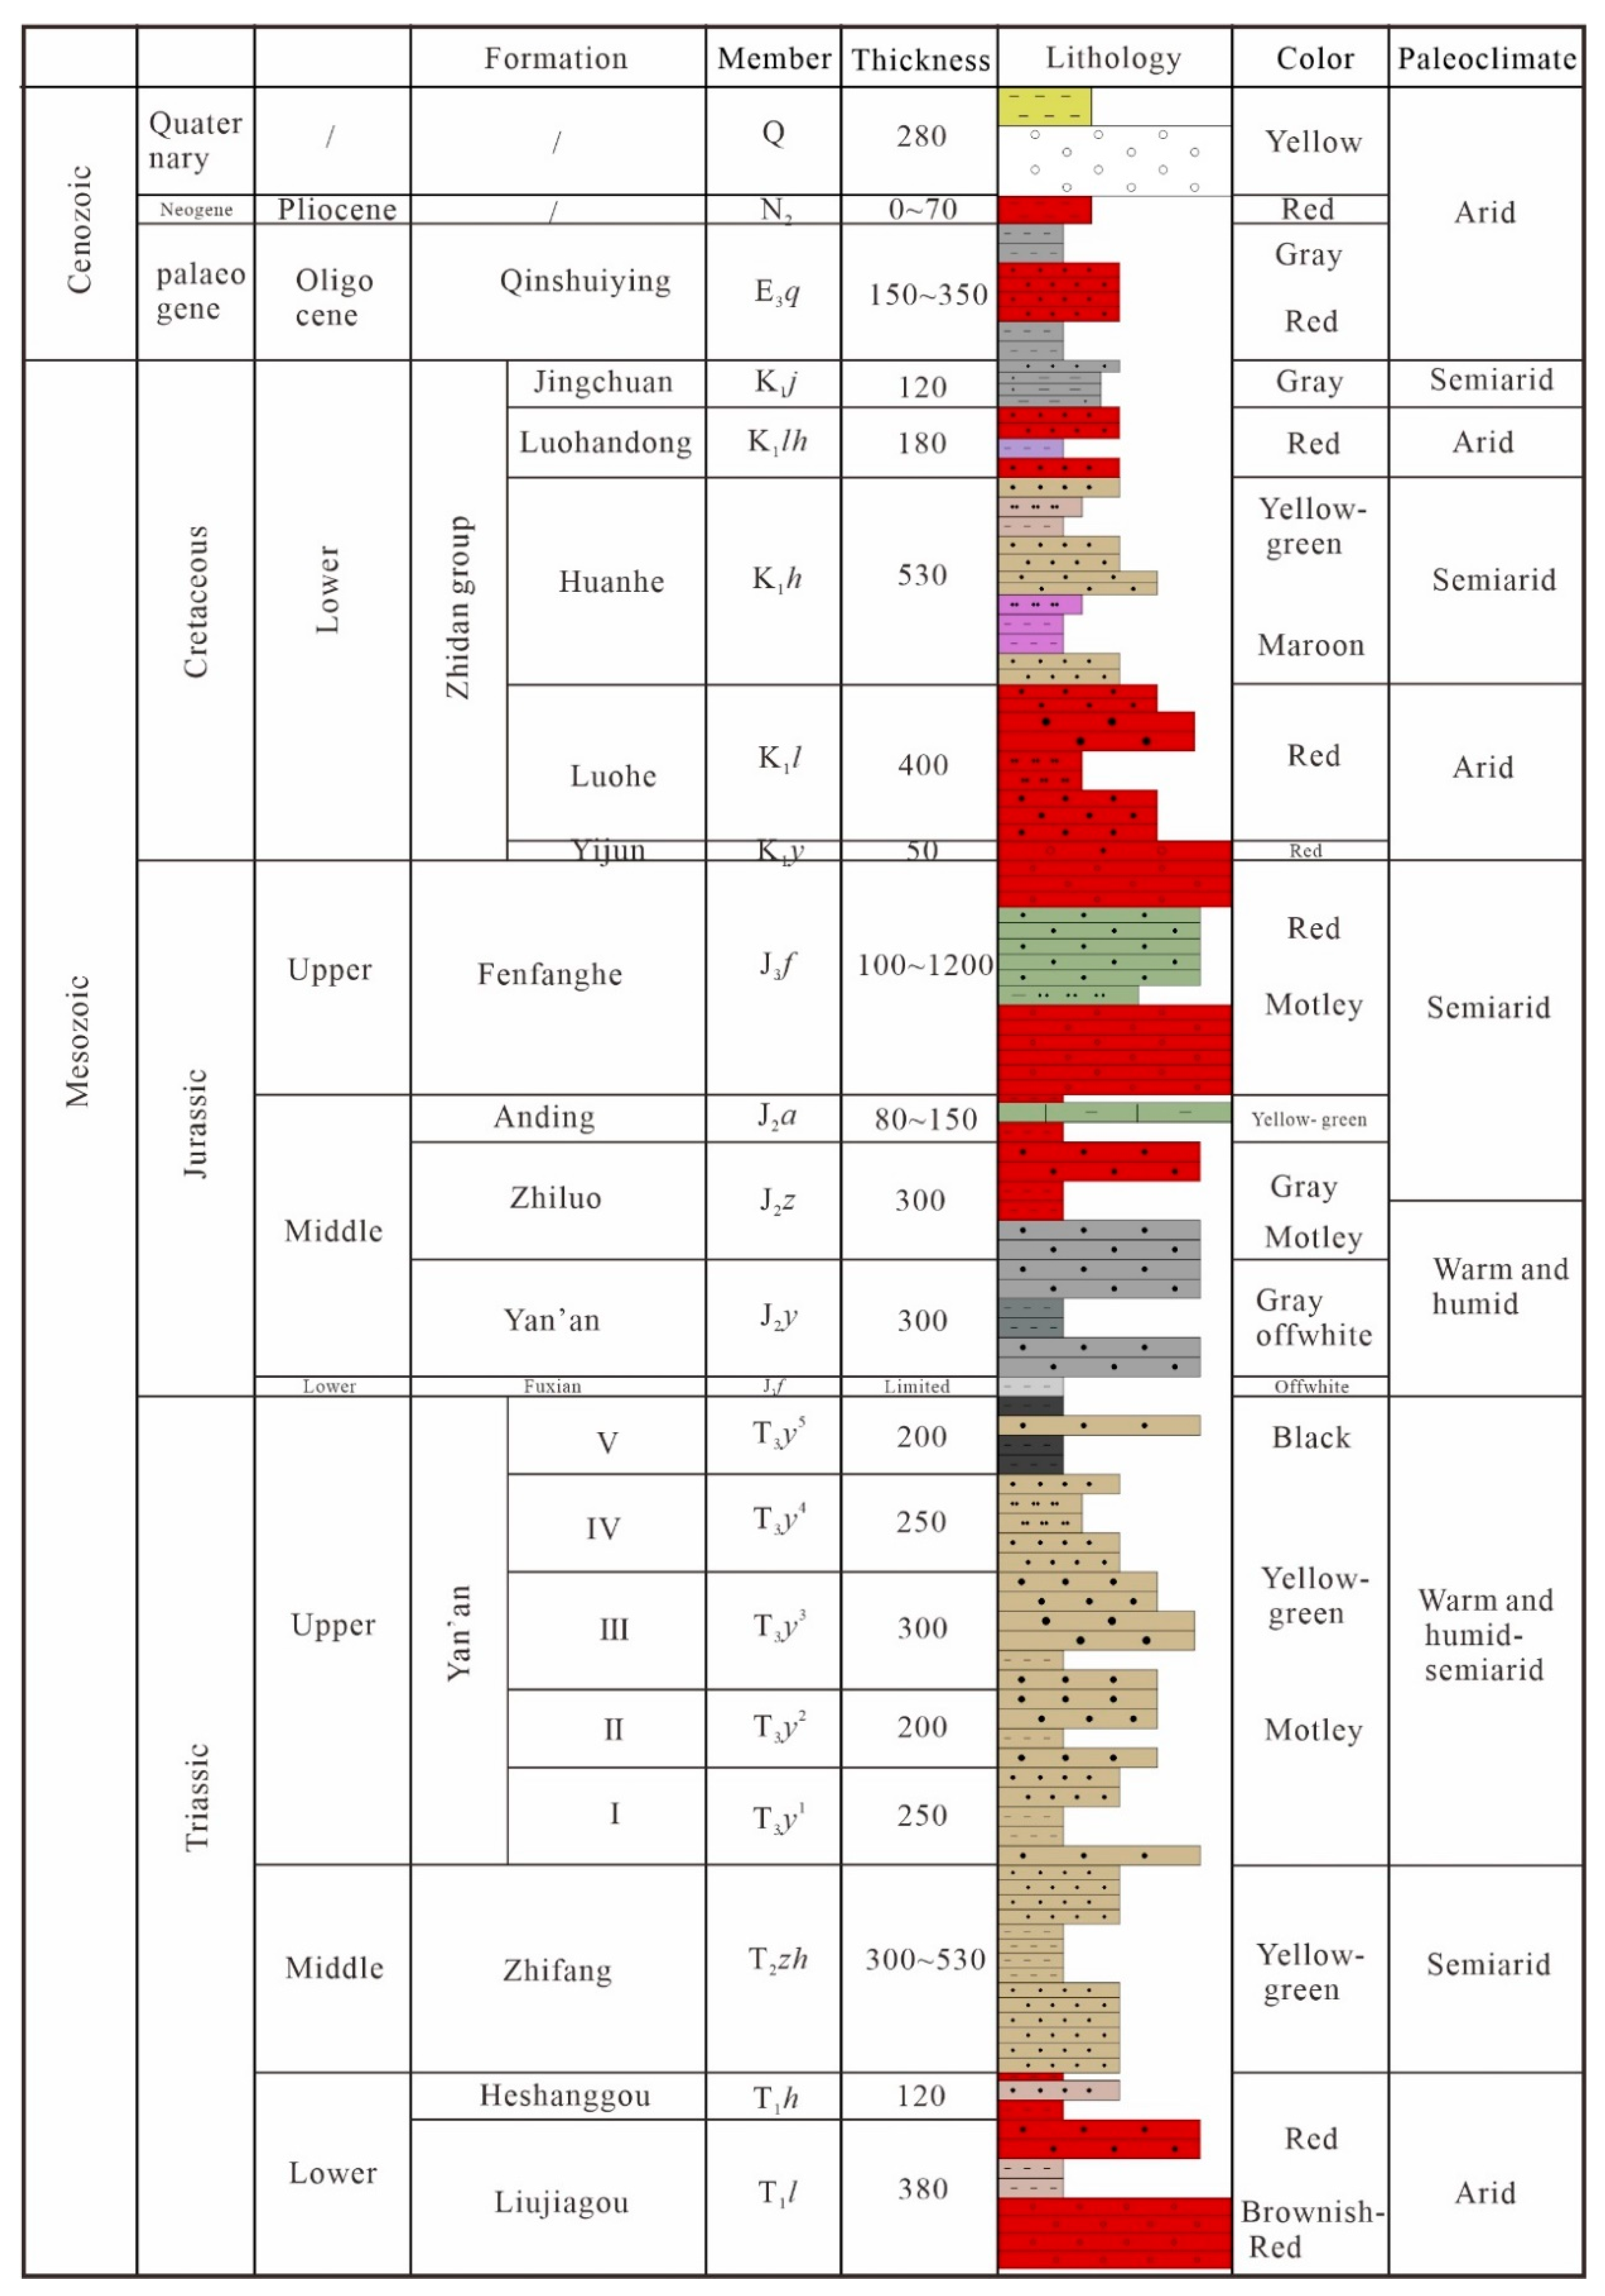
2. Geological Setting

The Ordos Basin is a Mesozoic and Cenozoic superimposed basin on top of the Paleozoic, which is distributed in an exceedingly close to south–north direction, and has the characteristics of overall uplift, continuous subsidence, wide and slow slope, and uniform contact. Ordos Basin is a part of the North China Craton and one of the most stable blocks. The Ordos Basin is formed on the basis of the North China Craton. Since the meso Neoproterozoic, it has been superimposed and compounded by the three tectonic domains of paleoasia, Tethys and the circum Pacific. At present, the basin is surrounded by orogenic belts, the Tianshan-Xingmeng orogenic system in the north, the Qin-qi-kun orogenic system in the south, Helan mountain and Liupanshan mountain in the west and Luliang mountain in the East (Figure 1a). Some fault depressions have developed between the basin and the orogenic system, with the Hetao fault depression in the north, the Yinchuan fault depression in the west, the Weihe fault depression in the South and Shanxi fault depressions in the East. The basement of the basin consists of pre-Mesozoic sedimentary rocks and metamorphic rocks, including Archean granulite facies, amphibolite facies metamorphic rocks and migmatite granite, and Lower Proterozoic amphibolite and greenschist. Cap rocks are Mesozoic Triassic, Jurassic, lower Cretaceous and Cenozoic Paleogene, Neogene and Quaternary, of which Triassic, Jurassic and Lower Cretaceous are the main sedimentary bodies of the basin. The Ordos Basin can be divided into six tectonic sub-units, and the research area is located in the north of Yimeng uplift. The surface is covered with Quaternary sediments and the Lower Cretaceous (Figure 1b). Within the whole early Cretaceous, this area is especially composed of fluvial and lacustrine facies developed on an alluvial diluvial plain in the inland depression basin, and the fluvial facies is the dominant facies.
The Lower Cretaceous in the study area is called the Zhidan group, sandstone bodies are developed and have favorable uranium metallogenic conditions, which can be divided into the Luohe Formation (K1zh2), the Huanhe Formation (K1zh3+4), the Luohandong Formation (K1zh5) and Jingchuan Formation (K1zh6) [21] (Figure 2). From the Luohe Formation to the Huanhe Formation, they are continuous deposits, the maximum thickness of the stratum can be greater than 1200 m, which constitute two major sedimentary cycles: K1zh2−K1zh3+4 and K1zh5−K1zh6. The strata are generally thin in the east and thick in the west, old in the east and new in the west, reflecting that the missing strata at the top are more in the east and less in the west, more in the south and less in the north. The Luohe Formation is mainly aeolian sandstone of desert facies, mainly medium-fine feldspar-quartz sandstone, with excellent separation and less heterogeneous, showing a large number of aeolian cross-bedding and large parallel bedding. Luohe formation contains no or a small number of fossils and is the product of an arid climate. The Huanhe Formation is mainly fluvial brown, green, gray medium-coarse feldspar-quartz sandstone, with a medium degree of separation and a high degree of cementation, mainly calcium cementation. The fossils in the Huanhe formation not only have many kinds, but also have a large number, which reflects that they are the products of a relatively humid climate. In particular, the emergence of spruce, cone fern and other plants can accurately explain the characteristics of warm and humid paleoclimate at that time. It can be seen that the sedimentary period of the Zhidan group was dominated by drought and alternating dry and wet paleoclimate.

3. Materials and Methods

The samples of this study were collected from ZKW2019-1, ZKW2019-2, ZKW2019-3 and ZKW2020-1 boreholes in the Naogaodai area, northwest Ordos Basin (Figure 3). Owing to the effect of sediment granularity on the chemical composition of clastic rocks, the samples were designated as medium and fine sandstone with uniform particles. When sampling, we flushed the surface drilling fluid, cut off the weathered surface, then crushed it to two hundred mesh in the conventional way in Tianjin trilobite Mine Technical Service Co., Ltd. Samples were observed microscopically prior to chemical analysis to monitor potential alteration, mineralization, or secondary weathering. All samples were ground with a noncontaminating crusher, screened in a 200-mesh sieve, and heated in an oven at 80 °C for 3 h to remove moisture. The sample analysis test was completed by the Analytical Laboratory of Beijing Research Institute of Uranium Geology (Beijing, China).
The major element test instrument was an Axiosm AX-X-ray fluorescence spectrometer (Beijing Research Institute of Uranium Geology, Beijing, China, analysis method is based on the Silicate Rock Chemical Analysis Method Part 14: Determination of ferrous oxide (GB/T 14506.14-2010) and Silicate Rock Chemical Analysis Method Part 28: Determination of 16 primary and secondary components (GB/T 14506.28-2010) and the analysis error was less than 1%. The sample was melted with anhydrous tetraboric acid file, ammonium nitrate as oxidant, lithium fluoride and a small amount of lithium bromide as flux and release agent. The weight ratio of sample to flux is 1:8. The prototype was melted at 1150~1250 degrees to make glass samples. The test voltage was 50 kV and the current was 50 mA.
The analysis instrument of trace and rare earth elements was NexION 300D laser coupled Plasma Mass Spectrometer (ICP-MS) (PerkinElmer, Waltham, MA, USA), the analysis method is based on the Silicate Rock Chemical Analysis Method Part 30: Determination of 44 Elements (GB/T 14506.30-2010), and the analysis accuracy is better than 5%. We accurately weighed 25 mg of the sample and placed it in the inner tank of the closed sample dissolver, added hydrofluoric acid and nitric acid and sealed it, put the sample dissolver into the oven, heated it for 2 h, and controled the temperature at 185 °C. After cooling, we placed it on the electric heating plate to heat and steam dry, then added nitric acid to steam dry, and repeated. We added nitric acid again, sealed it, put it into the oven, heated it at 130 °C for 3 h, diluteed it with water after cooling, and tested it by ICP-MS. The error range was 5~10%, the experimental temperature was 21 °C, and the relative humidity was 44%.
Paleo-weathering of the source region has been quantitatively assessed by chemical indices, together with the Chemical Index of Alteration (CIA) = Al2O3/(Al2O3 + CaO* + Na2O + K2O) × 100 [9], the Plagioclase Index of Alteration (PIA) = (Al2O3 − K2O)/(Al2O3 + Ca2O* + Na2O − K2O) × 100 [22], the Chemical Index of Weathering (CIW) = Al2O3/(Al2O3 + CaO* + Na2O) × 100 [23], and the Index of Compositional Variability (ICV) = (Fe2O3 + K2O + Na2O + CaO* + MgO + MnO + TiO2)/Al2O3 [24]. Within the formula above, the content of all oxides is calculated in line with the molecular ratio, and CaO* solely means the Ca combined with the aluminum silicate component [9,22]. Due to the modification of carbonate minerals, the CaO content within the samples of this analysis varied greatly. If the value of CIA is calculated by the total CaO, this could cause unauthentic conclusions. Therefore, the formula for CaO* is: CaO** = mol CaO − (10/3 × mol P2O5); if CaO** < Na2O, then CaO* = CaO**, else CaO* = Na2O [11]. The discriminant diagram-based major elements were accustomed separate to the provenance of the Huanhe sandstones [25], since major and trace element-based discriminant diagrams have been accustomed to assess the tectonic setting of the Huanhe sandstones [26,27,28,29,30].

4. Results

4.1. Petrography of Sandstones

A petrological identification of allegorical sandstone samples within the western allotment of the Ordos Basin was carried out. Detrital particles incorporate quartz, feldspars, bedrock fragments, micas, and heavy minerals (Figure 4A–F). Quartz is the predominant detrital grain, a mixture of strained, unstrained and crystalline (Figure 4). The majority of monocrystalline quartz grains are bright with equant shapes and reasonably undulate eradication. Feldspar crystals incorporate plagioclase (Figure 4), orthoclase and microcline. Potassium feldspars are composed of filamentous twin crystals and Karls twin crystals, which are composed of subhedral particles. Mica includes biotite and muscovite, which are striped or angled (Figure 4), mainly biotite. The grain sizes of quartz, plagioclase, potash feldspar, biotite and muscovite are appropriately 200–450 µm, 150–300 µm, 150–300 µm, 200–500 µm, 100–250 µm, which are fine-medium grained sandstones.
There are a large number of igneous, sedimentary and metamorphic bedrock fragments present in the lower Cretaceous sandstone. The authigenic minerals, for instance, calcite in sandstone is additionally shown in Figure 4. As observed by thin-sections, due to relatively low matrix concentration, the sandstones are mainly clast-supported.

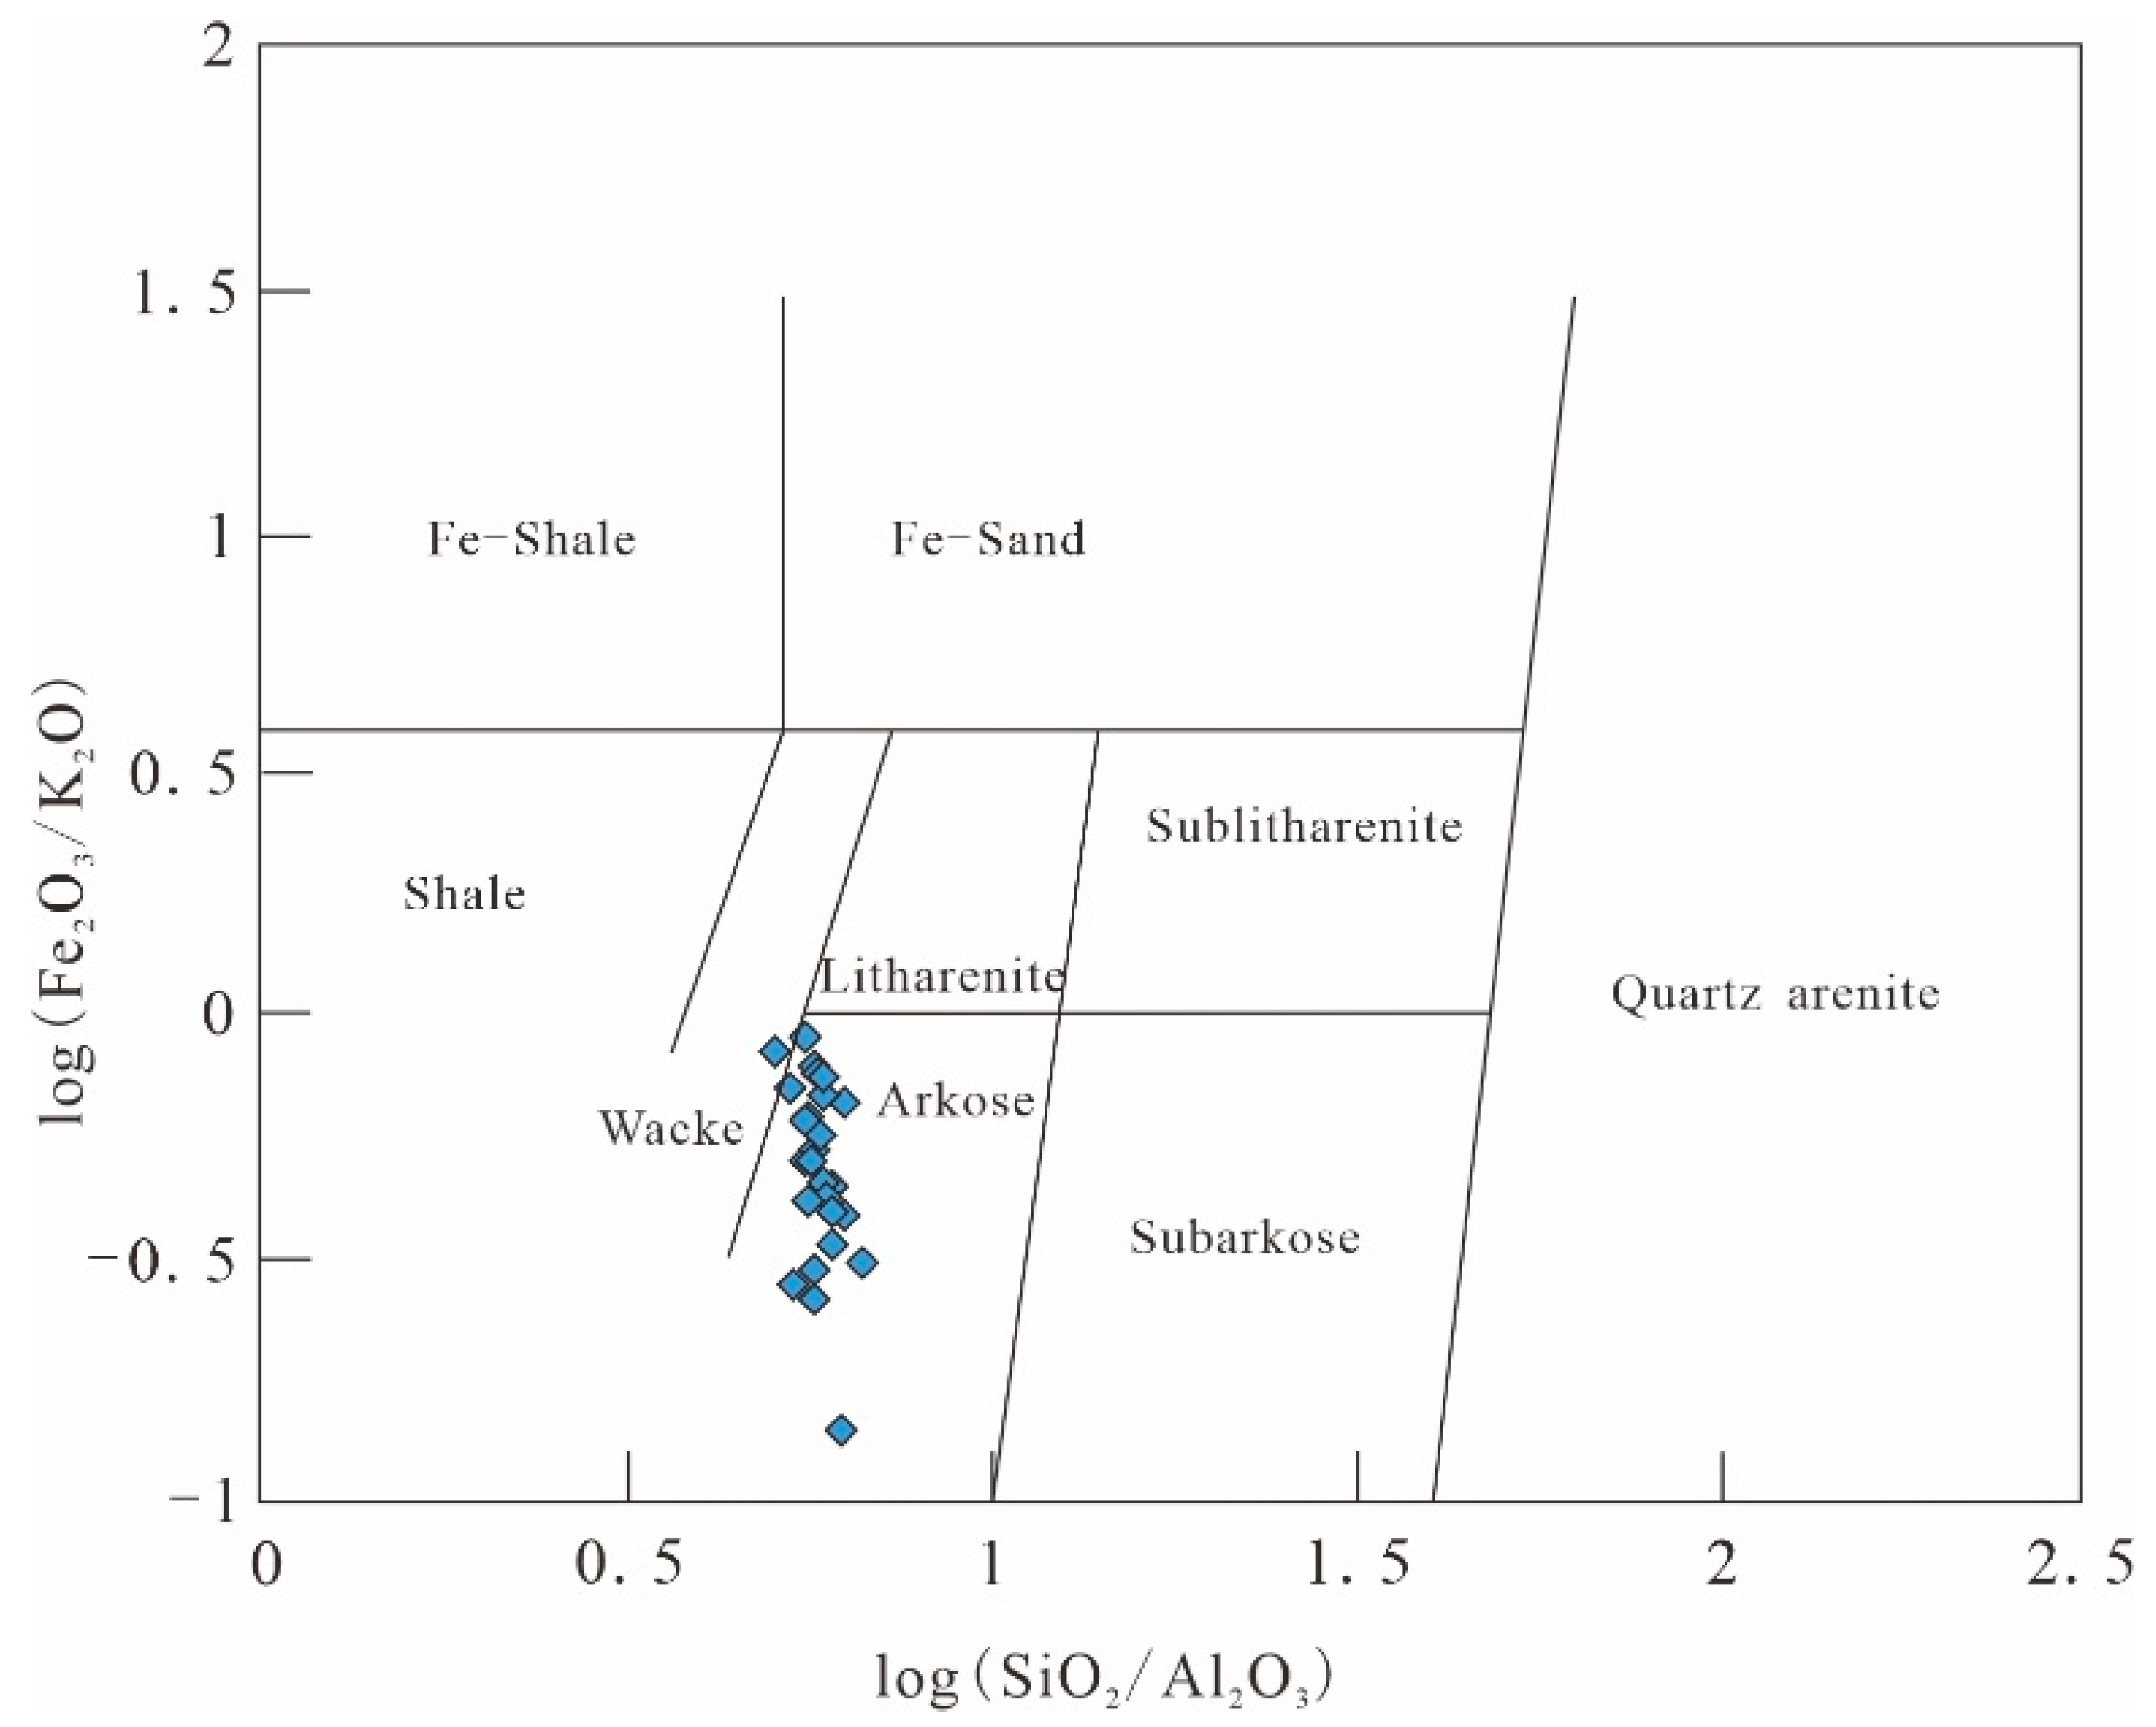
4.2. Major Elements Geochemistry

The concentration of major elements in sedimentary rocks is regulated by several factors, the foremost vital of that is the mineral composition [31]. For instance, the K2O/Na2O ratio of sedimentary rocks is controlled by the relative ratio of potassium feldspar and plagioclase, whereas the SiO2 content is controlled by the abundance of quartz. Weathering can likewise influence the fixation of major elements in sedimentary rocks. Provenance and sediment transport processes also have an impact. For instance, Ti, Si, and P are usually associated with coarse-grained sand in high-energy environments, whereas Al is enriched in clay minerals [32,33].
Major element contents of investigated sandstones are shown in Table 1. SiO2 is the prevailing oxide compound (64.09–75.73%, average 70.99%). The concentration of Al2O3 varies widely (11.08–13.02%, average 12.23%). Compared with CaO (1.36–5.53%), MgO (0.61–1.78%), Fe2O3 (0.11–2.27%), Na2O (3.16–4.02%), K2O (1.93–2.52%), and TiO2 (0.23–0.67%), the content of Al2O3 is comparatively higher. The Huanhe sandstone is characterized by low MnO (0.04–0.15%) and P2O5 (0.07–0.17%).
The sandstone samples studied have low Al2O3/SiO2, low K2O/Na2O and high Al2O3/TiO2 ratios. Al2O3 is positively correlated to K2O (r = 0.462) and Na2O (r = 0.479), and negatively to CaO (r = −0.289) and MnO (r = −0.274). The log (SiO2/Al2O3) versus log (Fe2O3/K2O) bivariate diagram [34] shows that Huanhe sandstones are principally distributed within the arkose area (Figure 5), whereas few samples plotted within the wacke field.

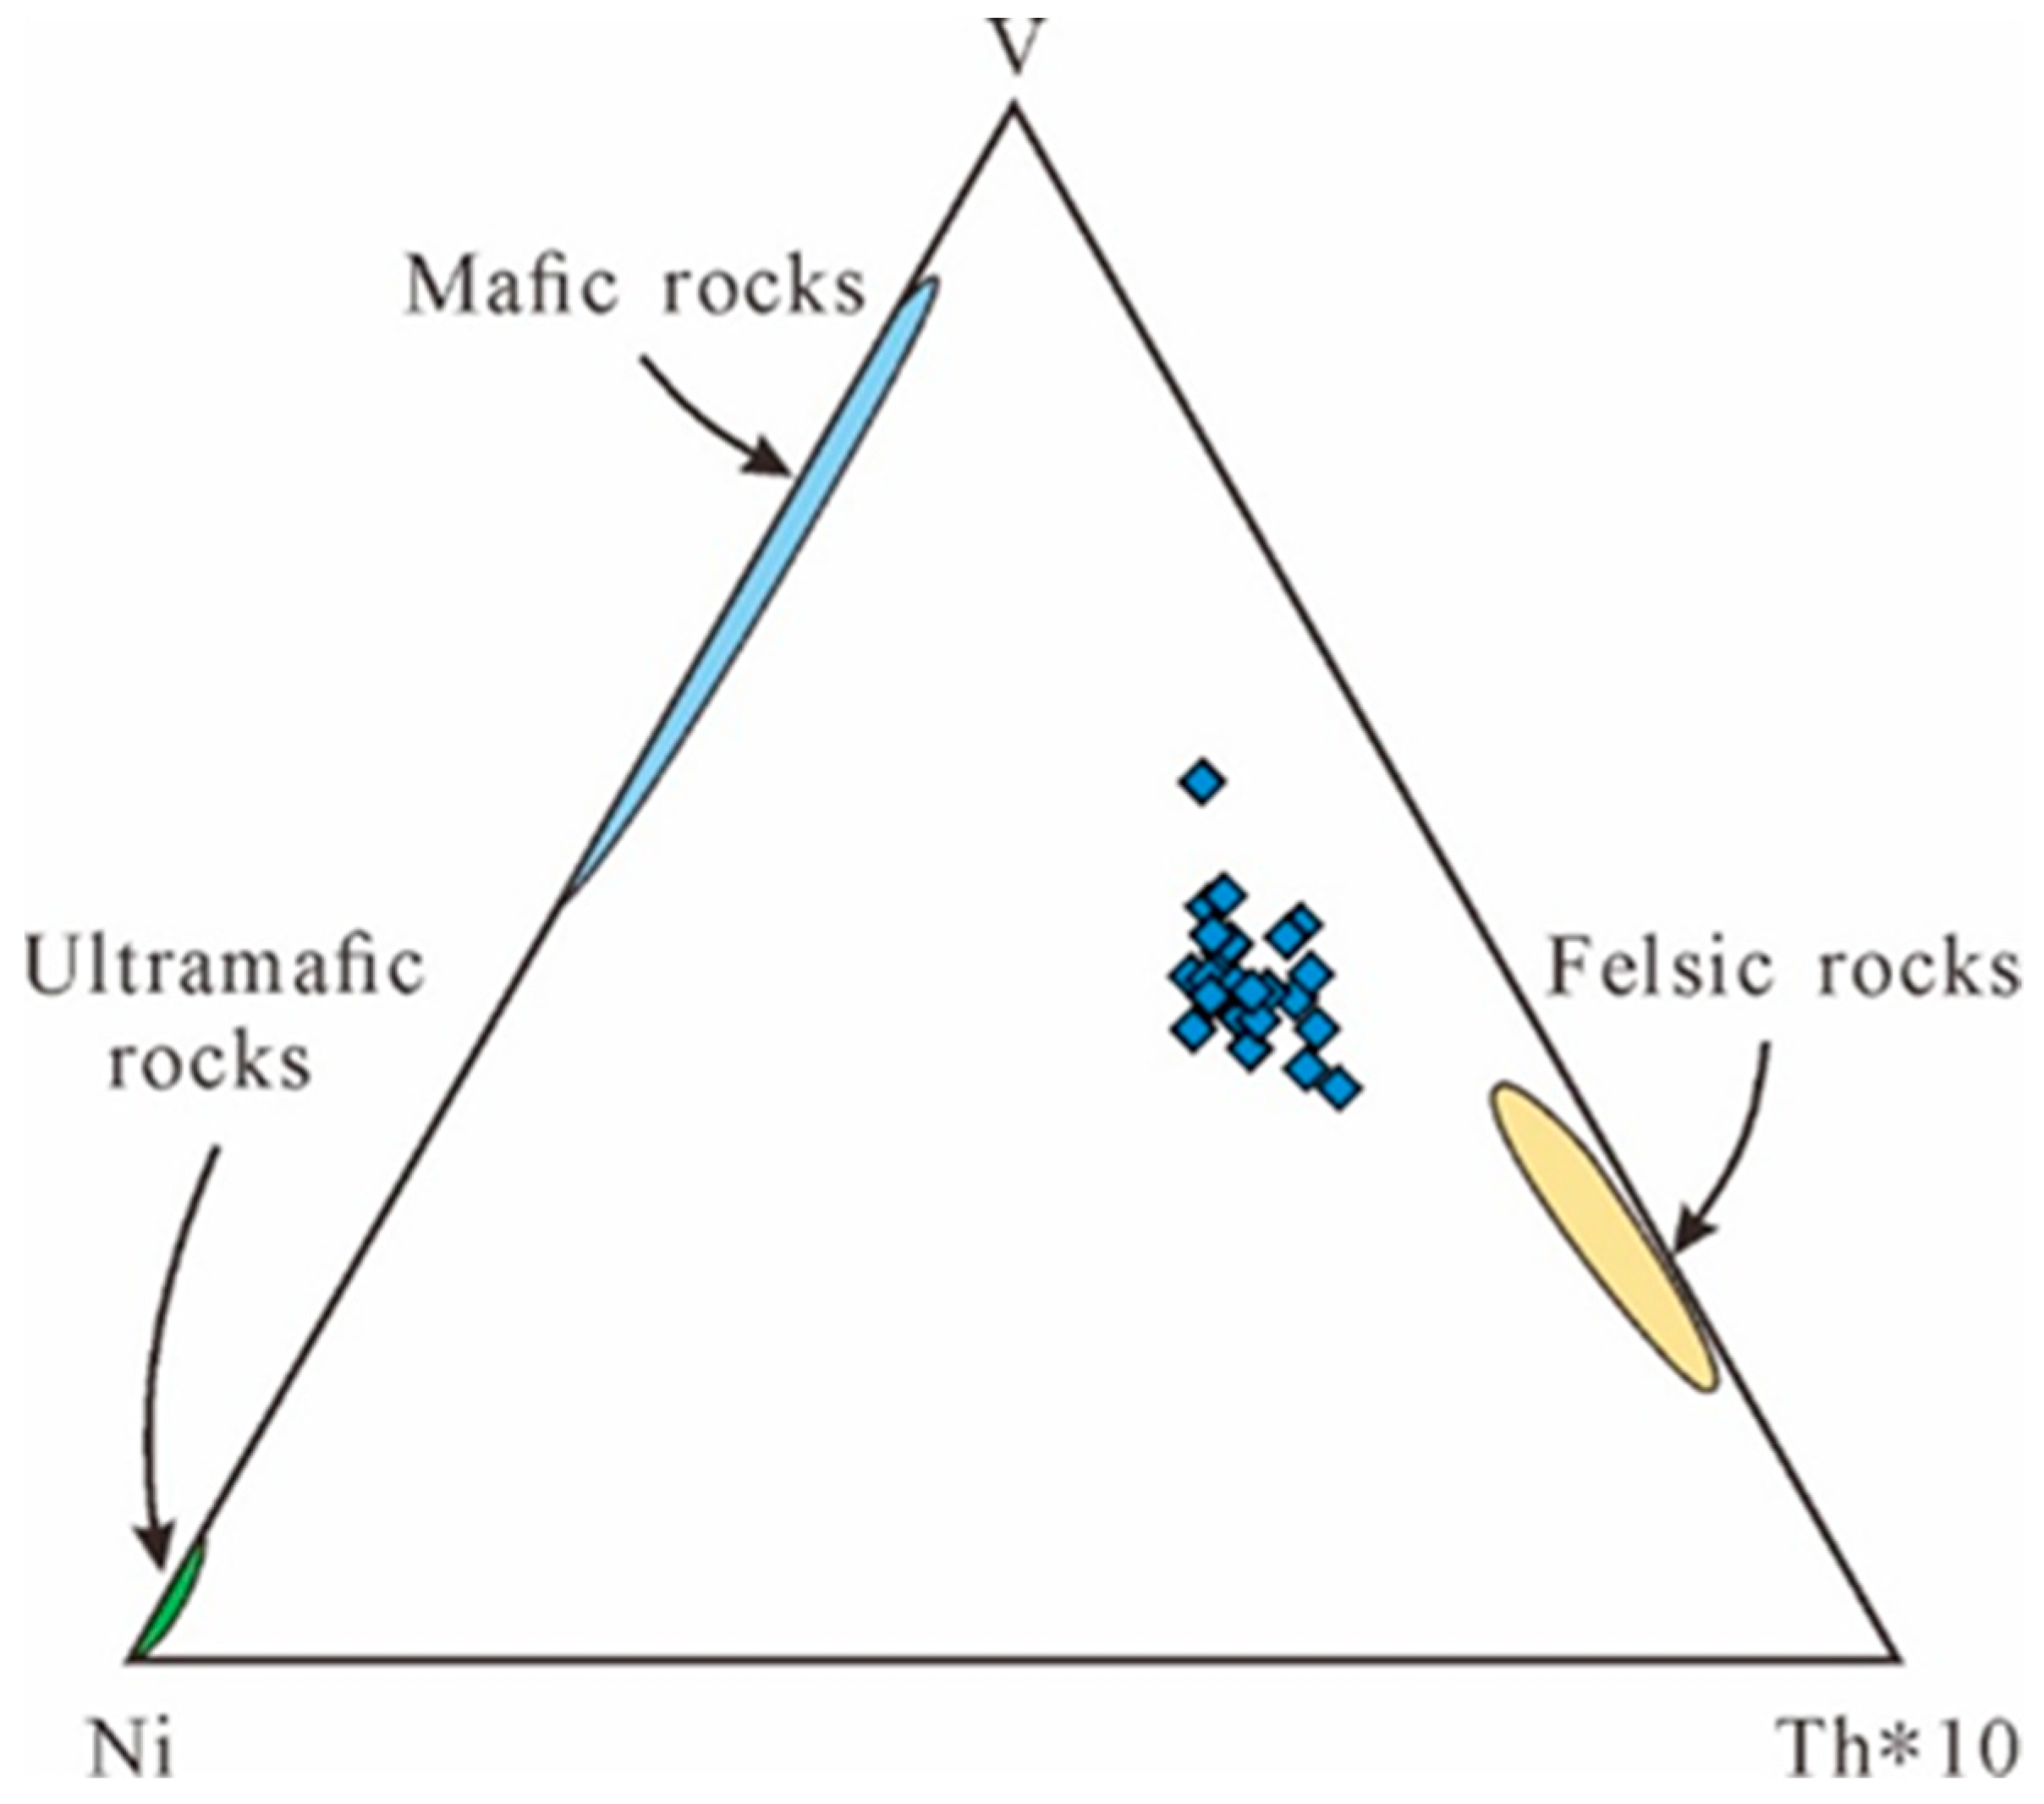
4.3. Trace Elements Geochemistry

The trace element contents of the studied sandstones are shown in Table 2. Generally, trace elements contents of the studied sandstones vary widely. Compared to the average contents of the upper continental crust (UCC), the majority of trace element contents are lower. However, the content of large ion lithophile elements, such as Ba and Sr varies greatly, with the average values being 643.89 ppm and 356.74 ppm, respectively. These values are higher than the average UCC values (Table 2).
The content of Th (3.69–8.24 ppm), U (1.11–7.36 ppm) and Th/U ratio (0.67–3.91) within the studied sandstones vary greatly, but they are consistent with the UCC. Trace elements (such as Pb, V and Cr) are positively correlated with Al2O3 (r = 0.535, 0.50 and 0.494, respectively), as a result of they are typically associated with potash feldspar and clay minerals [35].

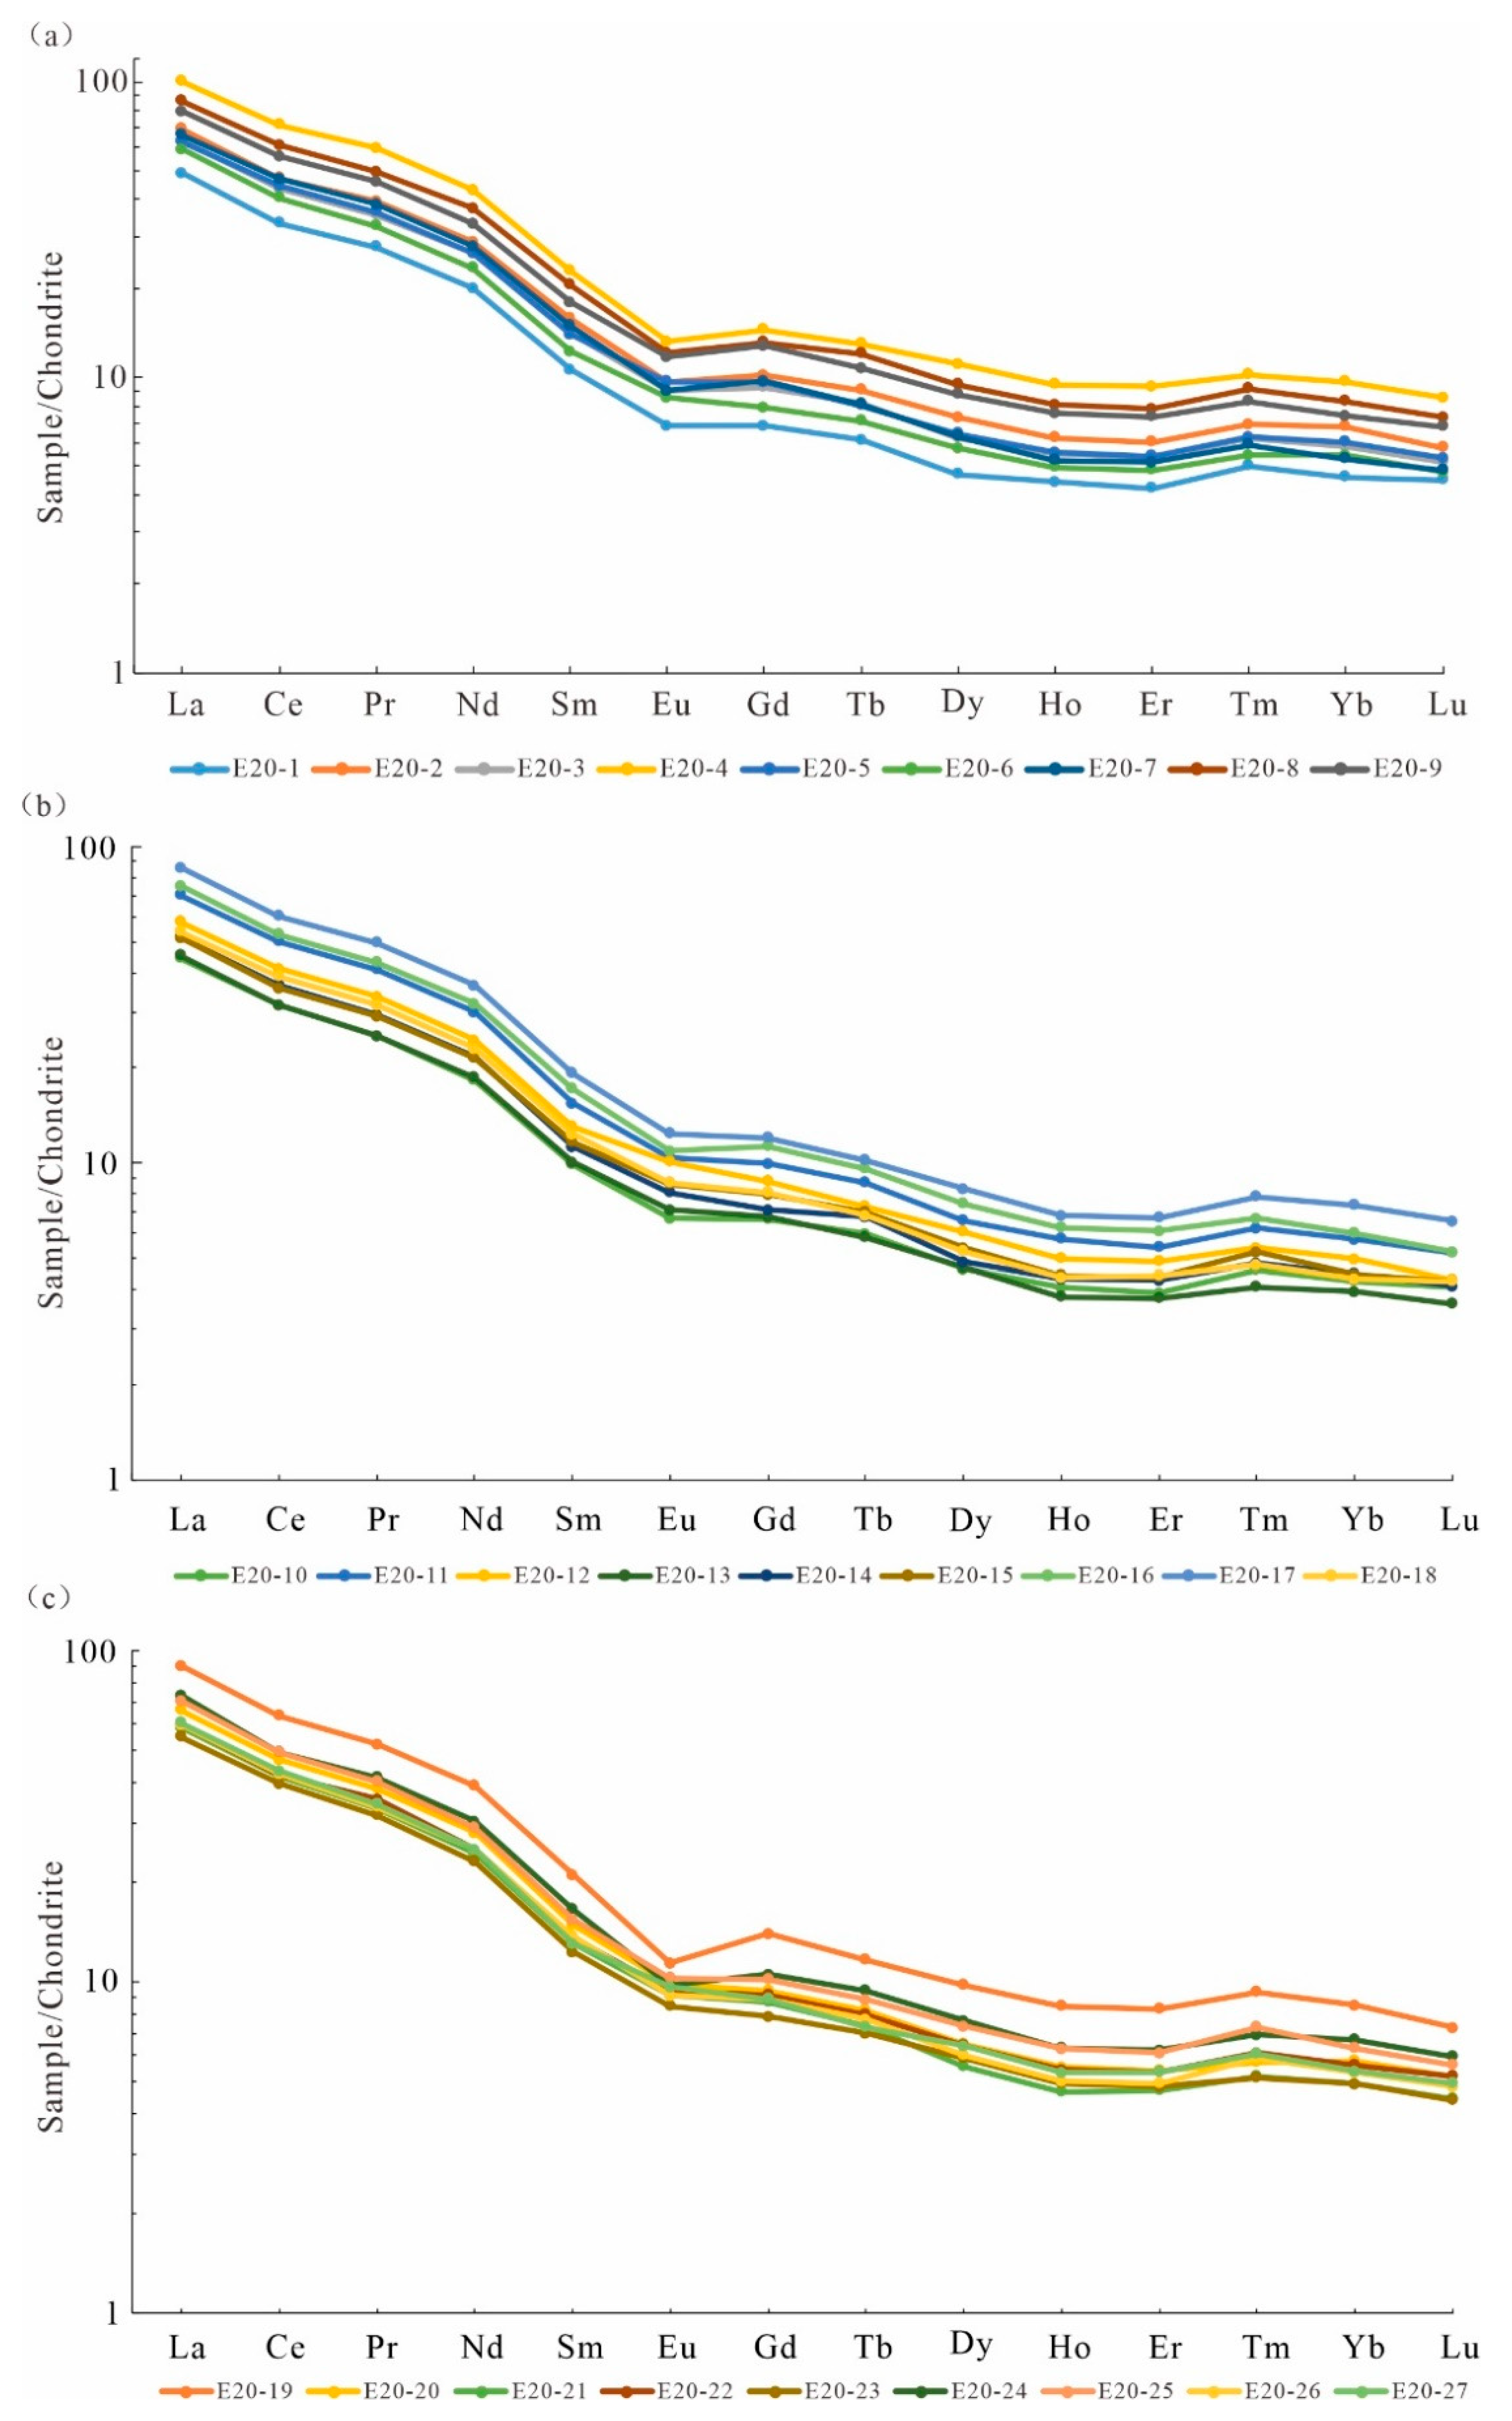
4.4. Rare Earth Elements (REE) Geochemistry

The contents and proportions of REE of the Huanhe Formation sandstones are reported in Table 3. The REE value show LREE enriched and flat HREE type. The REEs of the Huanhe Formation sandstones are normalized to chondrite (Figure 6), which is comparable to the distribution pattern of REEs of UCC [10,36]. Eu/Eu* anomaly is quantified as: Eu/Eu* = 2 × EuCN/(SmCN + GdCN). The Ce/Ce* anomaly is determined by the subsequent formula: Ce/Ce* = 2 × CeCN/(LaCN + PrCN) [10]. The subscript CN represents the normalized value of chondrite [10]. Table 3 reports the normalized ratios (La/Yb)CN, (La/Sm)CN and (Gd/Yb)CN.
The total quantity of rare earth elements (∑REE) varies considerably, from 72.76 to 166.37 ppm (an average of 106.73 ppm). The content of LREE varies between 65.93 and 150.74 ppm (average 96.99 ppm) and the content of HREE is varying between 6.70 and 15.63 ppm (average 9.73 ppm). The content of LREE and HREE ratios is varying between 9.25 and 10.83, with an average of 9.99. The Eu/Eu* values are mostly negative, and vary from 0.65 to 0.93 (an average of 0.80). The range of Ce/Ce* is 0.86 to 0.91, with an average of 0.89. The (La/Yb)CN ratio, that instructs the fractionation between LREE and HREE, is 10.20–12.53 (average 11.24). The (La/Sm)CN ratio, which expresses the LREE fractionation is 4.21–4.83, with an average of 4.46. The (Gd/Yb)CN ratio, which expresses the HREE fractionation is 1.45–1.89, with an average of 1.65.
Table 1. Major oxide concentrations in wt% of Lower Cretaceous sandstones from Huanhe Formation.
Sample No.SiO2%Al2O3%Fe2O3T%Fe2O3%FeO%MgO%CaO%Na2O%K2O%MnO%TiO2%P2O5%LOI%CaO*CIACIWICVPIAAl2O3/TiO2K2O/Na2OAl2O3/SiO2
E20-171.7312.813.480.962.271.101.773.762.300.070.460.102.401.6452.3358.271.2352.9327.790.610.18
E20-269.7812.992.160.641.370.903.673.452.270.080.260.084.363.1248.4653.371.3148.1250.740.660.19
E20-369.4112.502.761.111.490.973.363.832.210.080.360.094.403.2446.1350.611.4745.3034.340.580.18
E20-473.0112.033.190.762.191.251.363.432.250.050.310.102.971.2353.8260.421.2054.8938.430.660.16
E20-570.1012.273.781.721.861.781.843.762.170.060.490.113.631.7051.3256.921.4751.6425.090.580.18
E20-668.5511.841.920.111.630.744.763.952.140.110.300.085.563.5743.6047.671.5142.2739.870.540.17
E20-775.7311.362.440.601.661.081.373.571.930.040.260.072.141.2852.4658.081.2253.0643.360.540.15
E20-872.0712.822.791.351.301.171.553.712.160.040.300.083.301.4453.6459.481.2054.5343.160.580.18
E20-971.9912.153.351.531.641.401.693.402.050.060.350.093.381.5853.2058.941.3053.9834.520.600.17
E20-1071.4912.613.361.181.961.521.523.562.360.050.320.093.091.4153.4559.961.2854.4139.160.660.18
E20-1171.7112.173.411.501.721.691.503.422.170.050.330.083.451.3953.6559.861.3454.6036.990.630.17
E20-1271.5312.522.871.181.521.202.013.542.220.050.330.093.621.9051.7257.431.2852.1538.170.630.18
E20-1369.5212.493.772.271.351.661.963.582.520.060.550.133.701.7951.2557.721.4751.6122.790.700.18
E20-1472.6011.982.510.991.370.972.423.612.210.050.310.083.252.3148.8454.131.3548.5539.150.610.17
E20-1572.5811.502.861.521.211.242.223.272.280.060.380.103.482.0949.6655.601.4249.5730.340.700.16
E20-1672.6912.352.540.991.401.141.893.662.180.050.290.083.101.7851.5157.141.2651.8842.290.600.17
E20-1772.2912.642.450.621.650.902.593.722.360.050.290.082.622.4848.9154.291.2948.6443.890.630.17
E20-1871.7412.572.400.751.490.712.793.722.490.060.260.083.162.6947.8253.301.3147.2648.160.670.18
E20-1973.1212.263.040.951.881.151.863.472.250.040.270.092.431.7551.9657.961.2552.4745.410.650.17
E20-2065.9413.024.681.872.531.663.253.792.210.090.670.174.463.0347.9252.551.5847.4719.490.580.20
E20-2173.5812.172.660.951.541.011.683.522.390.040.280.082.491.5751.9658.431.2252.5243.160.680.17
E20-2271.8412.293.181.271.721.281.603.392.250.050.390.113.541.4653.5359.901.2554.4831.760.660.17
E20-2364.0912.073.611.531.871.604.843.342.150.120.490.137.473.0247.5352.341.5946.9824.580.640.19
E20-2464.2611.083.961.552.171.765.533.252.050.150.420.097.322.9446.1750.891.7345.3026.440.630.17
E20-2569.6612.553.411.451.771.402.223.652.390.060.450.114.082.0850.3356.171.4050.4227.700.650.18
E20-2670.5211.232.730.881.671.153.853.162.260.080.320.084.592.8546.6451.921.5045.7835.090.720.16
E20-2775.2612.051.610.311.170.611.744.022.200.040.230.072.141.6550.0855.601.1750.1052.620.550.16
Average70.9912.233.001.131.681.222.483.582.240.060.360.093.712.1150.2955.891.3550.4036.460.630.17
UCC66.6215.405.04 2.483.593.272.800.100.640.15 52.74 24.060.860.23
Fe2O3T: Total Fe expressed as Fe2O3. CaO*: Ca combined with the aluminum silicate component. UCC: upper continental crust from Rudnick and Gao [36].
Table 2. Trace element concentrations (ug/g) of Lower Cretaceous sandstones from Huanhe Formation.
Sample No.ScVCrCoNiCuZnGaRbSrYCsBaPbThUNbZrHfTh/ULa/ThCr/VY/NiCr/ThZr/ScTh/ScLa/YSc/CrZr/10Th × 10
E20-14.0834.61944.2110.45.7125.111.553.32669.442.0977212.53.991.114.5938.81.243.594.515.610.9148.629.510.981.910.023.8839.9
E20-26.8751.52368.5219.88.9347.715.254.923114.03.1351212.44.971.277.4559.41.863.915.134.580.7147.488.650.721.820.035.9449.7
E20-35.8649.63776.7817.69.0837.912.970.035412.14.5064013.54.681.736.1057.41.892.714.967.600.6980.569.800.801.920.025.7446.8
E20-411.081.327810.120.012.157.214.663.041120.54.7569615.78.242.6011.096.73.073.174.483.421.0333.748.790.751.800.049.6782.4
E20-56.2350.264811.623.69.1941.513.467.838811.83.8958210.94.917.366.6959.31.970.674.7012.910.50131.989.520.791.960.015.9349.1
E20-65.0149.25938.1819.88.1634.112.369.833911.23.4771416.64.582.295.3853.41.872.004.7412.050.57129.4810.660.911.940.015.3445.8
E20-76.2455.65887.2020.67.1738.312.558.438012.63.2655811.15.832.106.1946.91.502.784.1710.580.61100.867.520.931.930.014.6958.3
E20-88.7265.82819.8322.414.869.414.768.053717.24.9167115.66.412.039.7682.92.733.164.954.270.7743.849.510.741.840.038.2964.1
E20-910.181.95257.6721.911.940.713.467.037216.54.0762330.16.214.447.8155.21.801.404.706.410.7584.545.470.611.770.025.5262.1
E20-104.8940.41956.8415.57.3633.110.848.42908.522.2681010.53.692.264.6041.61.341.634.424.830.5552.858.510.751.910.034.1636.9
E20-116.2853.22536.1415.67.0032.212.059.339313.02.4372411.65.551.986.4946.41.522.804.654.760.8345.597.390.881.980.024.6455.5
E20-125.7037.22565.8111.96.8625.211.350.127311.62.1883411.43.701.445.1840.01.272.575.766.880.9769.197.020.651.840.024.0037.0
E20-135.0144.74016.0516.97.1429.811.757.93059.122.6759311.54.571.504.9133.11.083.053.658.970.5487.756.610.911.830.013.3145.7
E20-145.5649.02216.4616.25.7832.712.361.735510.12.9161511.34.211.475.1439.21.262.864.514.510.6252.497.050.761.880.033.9242.1
E20-155.3151.92685.4715.49.6828.012.965.35169.983.0266327.53.932.065.0737.31.131.914.815.160.6568.197.020.741.890.023.7339.3
E20-168.4967.22935.8914.19.7130.812.759.444014.23.0065337.36.065.106.5642.81.421.194.554.361.0148.355.040.711.940.034.2860.6
E20-177.9676.41908.0217.98.1242.514.664.442416.22.8579815.56.912.479.0199.72.652.804.572.490.9127.5012.530.871.950.049.9769.1
E20-185.8173.92465.7514.15.7831.011.957.338610.63.2558831.44.241.855.1241.71.312.294.673.330.7558.027.180.731.870.024.1742.4
E20-197.4257.21758.3420.111.453.514.563.232817.83.6147915.17.752.6610.373.52.452.914.263.060.8922.589.911.041.850.047.3577.5
E20-206.8957.41928.0817.95.4542.913.362.231112.84.0052010.94.891.776.1554.01.802.764.973.340.7239.267.840.711.900.045.4048.9
E20-216.0348.35296.2017.66.4834.312.459.040011.62.8373913.04.681.685.5336.31.202.794.5910.950.66113.036.020.781.850.013.6346.8
E20-225.8248.63047.8818.98.7540.212.164.626811.63.7257410.94.962.796.1453.61.671.784.426.260.6161.299.210.851.890.025.3649.6
E20-235.6748.44447.7619.49.9537.812.866.631710.84.2159813.24.191.965.3054.21.782.144.829.170.56105.979.560.741.870.015.4241.9
E20-246.9246.43078.0117.212.542.514.066.022314.34.1553313.85.791.808.0869.12.223.224.656.620.8353.029.990.841.880.026.9157.9
E20-256.5947.23637.4320.09.0649.713.264.140213.43.8261414.65.231.707.6575.62.463.084.957.690.6769.4111.470.791.930.027.5652.3
E20-265.6761.74627.5019.96.8739.713.465.533812.53.7961612.25.032.276.3550.31.562.224.357.490.6391.858.870.891.750.015.0350.3
E20-275.7646.44657.5917.78.2131.312.968.138511.83.7866614.04.132.994.9551.51.681.385.3810.020.67112.598.940.721.880.015.1541.3
Average6.5154.63447.8317.98.6338.912.962.135712.83.4364415.75.162.406.5755.21.772.474.686.570.7369.638.500.801.880.025.5251.6
UCC14.097.092.017.347.028.067.017.584.032021.04.9062417.010.52.7012.01935.303.802.950.950.458.7613.790.751.480.1519.3105.0
UCC: upper continental crust from Rudnick and Gao [36].
Table 3. Rare earth element concentrations of Lower Cretaceous sandstones from Huanhe Formation.
Sample No.LaCePrNdSmEuGdTbDyHoErTmYbLu∑REELREEHREELREE/HREEEu/Eu*Ce/Ce*La/Yb(La/Yb)CN(La/Sm)CN(Gd/Yb)CN
E20-118.0031.803.7814.202.450.602.100.361.790.381.050.181.140.1777.9970.837.169.890.790.8715.7910.674.621.49
E20-225.5045.305.4020.403.660.843.110.532.790.531.500.251.690.22111.71101.1010.619.520.740.8715.0910.204.391.49
E20-323.2041.704.8718.803.270.782.830.472.380.471.330.221.450.20101.9792.629.359.910.770.8816.0010.814.471.58
E20-436.9068.508.1830.705.311.154.440.764.220.812.320.362.400.33166.37150.7415.639.640.710.8915.3810.394.371.50
E20-523.1042.704.9718.703.220.842.940.472.460.471.350.221.500.20103.1593.539.629.730.820.9015.4010.414.521.59
E20-621.7038.804.4716.702.830.742.410.412.190.421.210.191.350.1893.6185.248.3710.190.850.8816.0710.864.831.45
E20-724.3045.105.3019.803.460.782.980.472.410.451.280.211.310.19108.0498.749.2910.630.730.9018.5512.534.421.84
E20-831.7058.506.8226.504.741.054.010.703.610.691.940.332.060.28142.92129.3113.619.500.720.9015.3910.404.211.58
E20-929.2053.606.3123.504.141.023.910.623.340.641.830.301.830.26130.50117.7712.739.250.760.8915.9610.784.441.73
E20-1016.3030.303.4613.002.290.582.040.351.760.350.970.161.050.1672.7665.936.839.650.810.9115.5210.494.481.57
E20-1125.8048.205.6321.303.570.913.040.502.510.491.350.221.420.20115.14105.419.7310.830.820.9018.1712.284.551.74
E20-1221.3039.404.6117.403.020.882.680.422.310.431.220.191.230.1695.2586.618.6410.020.930.9017.3211.704.441.77
E20-1316.7030.203.4513.302.320.622.070.341.780.320.930.150.970.1473.2966.596.709.940.850.8917.1511.594.531.72
E20-1419.0035.104.0215.402.600.702.180.391.860.371.060.171.110.1684.1276.827.3010.530.880.9017.1211.574.601.59
E20-1518.9034.203.9915.302.690.752.430.412.050.381.090.191.100.1683.6375.837.809.720.880.8917.1811.614.421.79
E20-1627.6050.705.9222.703.970.953.470.562.830.531.520.241.490.20122.67111.8410.8410.320.760.8918.5212.524.381.89
E20-1731.6057.706.8325.904.451.083.680.593.160.581.670.281.830.25139.60127.5612.0410.600.790.8917.2711.674.471.63
E20-1819.8037.204.3316.402.850.762.470.402.000.371.100.171.070.1689.0781.347.7410.510.850.9118.5012.504.371.87
E20-1933.0060.807.1527.804.870.994.280.683.720.722.060.332.110.28148.78134.6114.179.500.650.8915.6410.574.271.64
E20-2024.3044.905.2520.003.440.852.880.482.470.471.340.201.430.20108.2198.749.4710.430.810.9016.9911.484.451.63
E20-2121.5039.904.5717.303.020.792.660.432.120.401.170.191.220.1795.4387.088.3510.430.830.9117.6211.914.481.77
E20-2221.9040.504.8717.803.150.822.790.462.450.461.330.221.390.2098.3489.049.309.580.830.8915.7610.654.381.63
E20-2320.2038.004.3716.402.840.742.400.412.240.421.200.181.220.1790.7882.558.2410.020.840.9116.5611.194.481.59
E20-2426.9047.205.6821.703.830.853.220.552.910.541.550.251.660.23117.05106.1610.899.740.720.8616.2010.954.421.57
E20-2525.9047.305.5220.703.550.893.110.512.790.531.520.261.560.21114.36103.8610.509.890.800.8916.6011.224.591.62
E20-2621.9040.604.6317.803.180.792.710.452.290.431.230.211.320.1897.7288.908.8210.080.800.9116.5911.214.331.66
E20-2722.2041.504.7217.803.010.842.720.422.440.451.330.221.330.1999.1790.079.109.900.880.9116.6911.284.641.66
Average24.0144.065.1519.533.400.842.950.492.550.481.390.231.450.20106.7396.999.7310.000.800.8916.6311.244.461.65
UCC31637.10274.70140.703.900.832.300.3020.31184.14 9.330.72 15.4010.474.151.62
UCC: upper continental crust from Rudnick and Gao [36]. LREE = La + Ce + Pr + Nd + Sm + Eu; HREE = Gd + Tb + Dy + Ho + Er + Tm + Yb + Lu; Eu/Eu* = 2 × EuCN/(SmCN + GdCN); Ce/Ce* = 2 × CeCN/(LaCN + PrCN).

5. Discussion

5.1. Provenance

5.1.1. Petrography

The Huanhe sandstone is rich in quartz and feldspar, containing felsic classics rather than basic rock classics, and is a felsic source rock. Crystalline quartz grains have intergranular boundaries down to slightly curved, which are conducive to the source of deep igneous rocks, whereas the serrated to suture intercrystalline interface reflects the metamorphic source [37,38]. Additionally, only a few crystalline quartz particles enclose one single crystal in an exceedingly bimodal state (Figure 4). Such quartz particles are likely to come from schist source rocks. Some quartz grains show a part of the inherited quartz overgrowth (Figure 4), that is the result of recycling sedimentary quartz throughout the diagenesis process. The identified non-opaque heavy minerals include ZTR (zircon, tourmaline and rutile), additionally to rare epidote. The ZTR group might be derived from acidic igneous rocks (granite) and/or recycled older sediments, whereas epidote is principally derived from metamorphic rocks [39]. The composition and textural maturity of the Huanhe sandstone indicated that it is a felsic source area, supplemented by recycled quartz sand.

5.1.2. Geochemistry

Geochemical data provide clues to characterize the provenance and source area of clastic rocks [12,16,27,40]. Oxides and hydroxides of Al, Ti and Zr have low solubility in low-temperature aqueous solutions can be considered as immobile elements. Therefore, their ratio is extremely about to that of the source rocks. On the discriminant diagram [25], the Huanhe Formation sandstones are plotted in the felsic and intermediate igneous rock field (Figure 7A). On the TiO2 versus Zr binary diagram [41], the studied sandstones are plotted in intermediate igneous provenance fields (Figure 7B). Al2O3/TiO2 ratio < 8 indicates basic source rock, Al2O3/TiO2 ratio between 8 and 21 indicates intermediate igneous source rock, and Al2O3/TiO2 ratio > 21 indicates felsic igneous source rock [41]. The TiO2 versus Al2O3 diagram shows the felsic igneous source rocks for most of the studied samples (Figure 8).
Trace elements such as Th, Cr, Ni, V, La, Co, Sc, Nb, Zr, Hf, Y and REEs, are very important in interpreting of provenance and composition of the source area because they are immobile in the post-depositional processes [11,28]. According to the diagram of Hf versus La/Th [42], La/Sc versus Co/Th [11], Th/Sc versus Cr/Th [43], Y/Ni versus Cr/V [44] (Figure 7C–F), the studied sandstone shows that it is a felsic igneous source rock and basic mixed source rock. The ternary graph of Ni-V-Th*10 [45] showed that the Huanhe sandstones fall close to the V-Th*10 line, reflecting a mixed origin of felsic and mafic rock provenance (Figure 9). At the same time, depletion of the Sc, Co, Ni, Cu and Th contents (Average values 6.51, 7.83,17.87, 8.63 and 5.16 ppm, respectively; Table 2), represents the felsic source area [11].
Comparing the Cr/Th, Th/Co, Th/Sc, La/Co and La/Sc ratios of the Huanhe sandstones (69.63, 0.71, 0.80, 3.31 and 3.72, respectively) with those of upper continental crust (Table 4), shows that the sandstones are derived from felsic rocks [12,35,37]. The distribution pattern of rare earth elements in sediments and the abnormal characteristics of Eu provide clues for finding out the feature of the source area. The felsic source rock has the characteristics of high LREE/HREE ratios and negative Eu anomaly, while the basic source rock has the characteristics of low LREE/HREE and missing Eu anomalies [46]. Due to the quartz dilution, the contents of ∑REE within the Huanhe sandstones is low [10], which is consistent with high SiO2 contents (64.09–75.73%, average 70.99%). In the Eu/Eu* versus fractionation factor (La/Yb)CN bivariate graph, most samples show that felsic source rocks derived from the upper continual crust (Figure 10A), while in (Gd/Yb)CN versus Eu/Eu* diagram (Figure 10B), the sandstones studied almost belong to the post-Archean field. This is consistent with the potassium-rich feldspar granite with (Gd/Yb)CN < 2 [10]. LREE/HREE and (La/Yb)CN are enriched, while HREE and (Gd/Yb)CN are depleted, with consistent provenance interpretation and negative Eu anomaly, reflecting the granitic source rocks in the upper continental crust of studied sandstones samples.

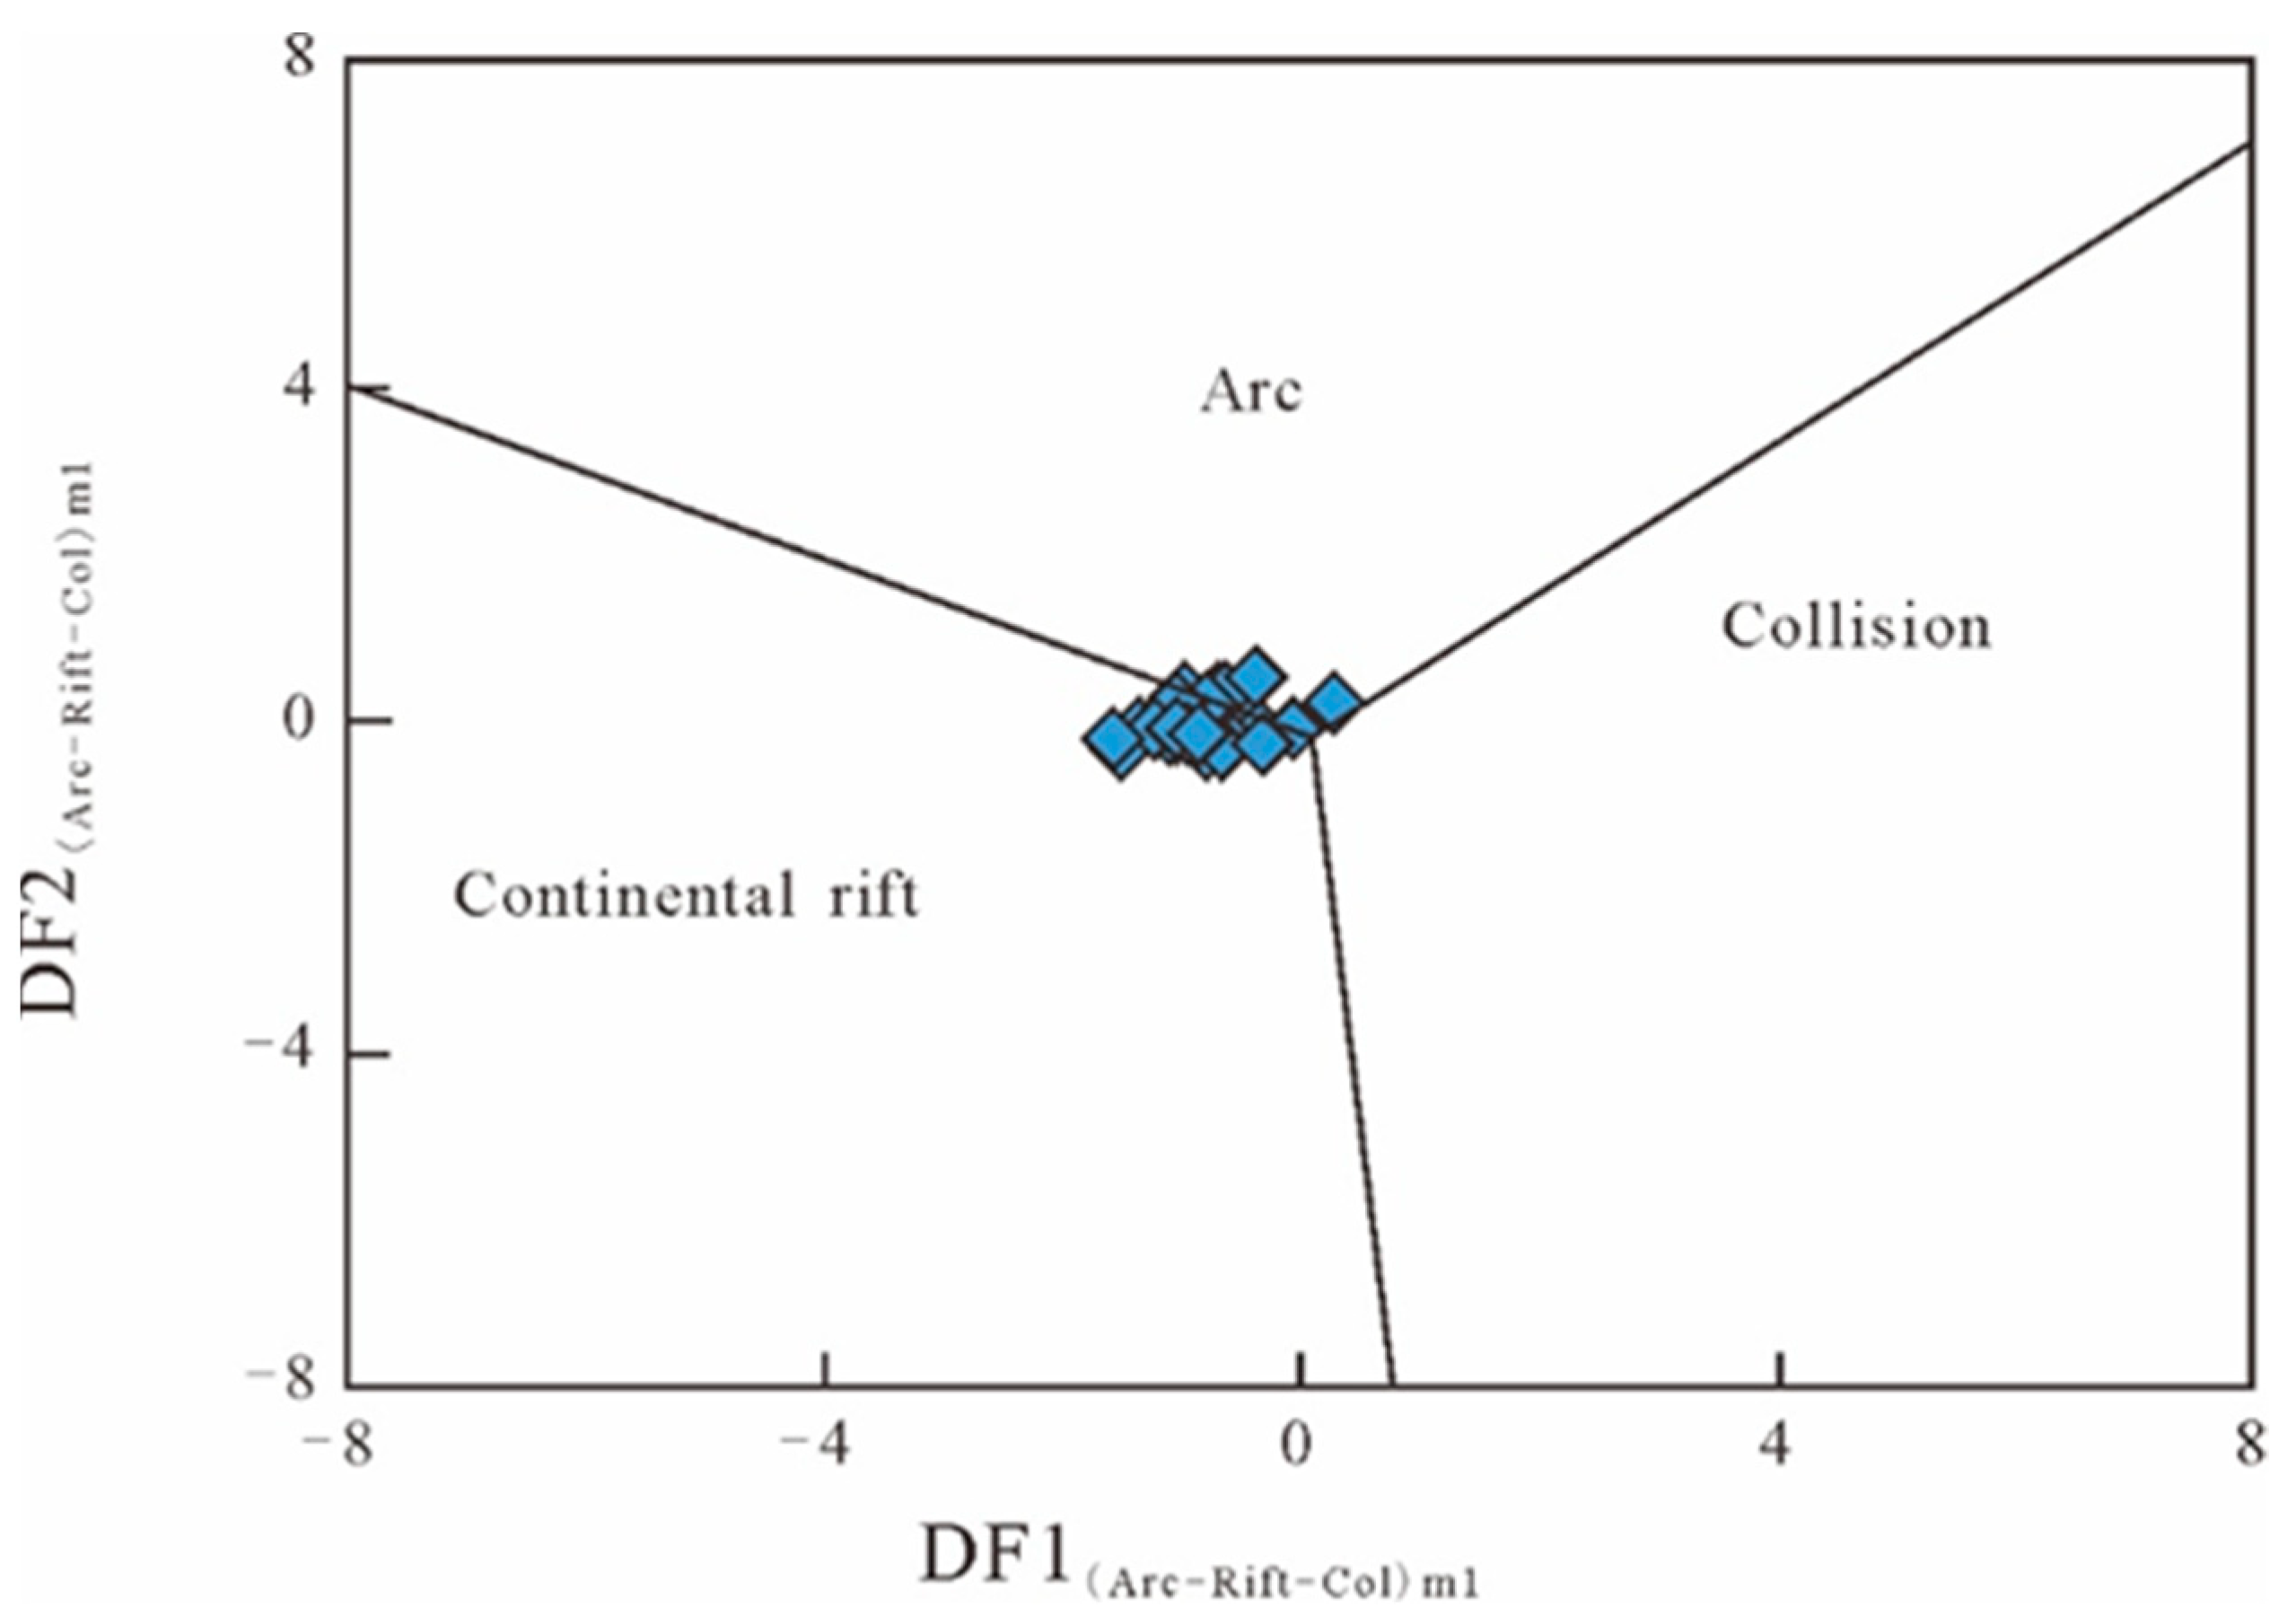
5.2. Tectonic Setting

Bulk-rock geochemistry of siliciclastic sediments has been accustomed to distinguish the tectonic settings of sedimentary basins [26,27,28]. The discrimination diagrams based on the major elements were drawn [26,28,29], showing that the majority of the sandstone samples fall within the passive margin field; however, four samples exist in the active continental margin field (Figure 11).
The distribution of REE is additionally accustomed distinguish between active and passive marginal tectonic environments [11,26,35]. The passive margin includes a REE distribution pattern similar to the average of UCC and Post-Achaean Australian Shale (PAAS) [10,26] and an obvious Eu anomaly. Within Figure 4, the distribution of REE in studied samples is extremely almost like the typical average UCC and PAAS, and Eu is a negative anomaly, indicating that the deposition was at the passive margin after the Early Cretaceous rifting event. Cyclic alternations of fluvial and shallow lake sediments of the Lower Cretaceous Huanhe Formation reflect base-level changes. Geochemical data show that before the late Cretaceous, the early Cretaceous rifting period in the southern edge of the Neo-Tethys Ocean ceased, and then passive margin development and the deposition of the Huanhe Formation began after rifting appeared.
Recently, two major element diagrams of siliciclastic rocks based on discriminant function using the geochemical composition of Neogene-Quaternary sediments [30]. Consistent with the high silica multidimensional function diagram [30], the sandstones studied are mainly distributed within the continental rift field, except that three samples belong to the collision field (Figure 12). Continental rifts are caused by extension processes within the continent, including passive margins [30]. Plotting of both major and trace elements of Huanhe sandstones using the multidimensional discriminant function diagrams [50] reflects a passive margin setting of the source area (Figure 13). The previous studies are basically consistent with the passive margin interpretation of the Huanhe Formation.

5.3. Source—Area Paleoweathering and Paleoclimate

5.3.1. Paleoweathering

In humid climate conditions, chemical weathering is dominant and strongly controls the major and trace element composition of siliceous clastic sediments [9,11,22,23,51], within which larger cations (such as Ba, Al, Rb) are preferentially fixed in weathering residue, while smaller cation (such as Na, Ca, Sr) are selectively removed [47]. These geochemical features can eventually be transferred to sediments, providing important information for monitoring the weathering status of the sediment source region [9]. At the same time, physical weathering is common in arid climate, together with the mechanical decomposition of source rock into smaller grain sizes without significant changes in minerals or chemical composition. Therefore, geochemical indicators give an honest methodology for paleoweathering in the source area. This may be due to the leaching of alkaline elements (such as Na, K and Ca) and also the enrichment of immobile elements (such as Al and Si) throughout weathering process, and also the development of plagioclase and K–feldspars in the direction of clay minerals (Figure 14) [9]. Using Al2O3 − (CaO* + Na2O) − K2O (A-CN-K) ternary diagram, where Al2O3, CaO*, Na2O and K2O are arranged in molecular proportions [52], and also the Chemical Index of Alteration (CIA) [9] determined the mobility of elements during in the diagenesis process. The CIA value is widely plotted in the A-CN-K ternary diagram [53] (Figure 14) to judge the weathering history and source rock composition [52]. They were utilizing the values of major elements, chemical indices such as CIW [23], PIA [22], ICV [24] and other chemical indicators to evaluate the paleoweathering in the source area, avoiding the matter of potassium enrichment.
The Index of Compositional Variability (ICV) is employed to identify the compositional maturity of sediments and has been successfully applied in several studies. Typical diagenetic minerals such as feldspar, amphibole, and pyroxene have ICV values larger than 1, while alteration products such as kaolinite, illite, and muscovite have ICV values less than 1 [12,24]. Therefore, sediments with immature composition and high ICV value belong to the sediments with high recirculation and strong weathering. The ICV values of the studied samples are 1.17–1.72 (average is 1.35), indicating that Huanhe sandstone includes a low content of clay and belongs to the first-order cycle sediments. Most of the sediments in the first cycle do not change the geochemical characteristics of the samples, and their CIA can be used to discuss the weathering conditions within the source area.
The calculated average values of CIA within the studied sandstones vary from 43.60 to 53.82 (average is 50.29) (Table 1). These values indicate that the sediments were derived from the source rocks that have undergone weak chemical decomposition. Several authors use the chemical index of weathering (CIW) to raise weathering conditions in the source area [22]. The CIW values of Huanhe sandstones are 47.67–60.42, with an average of 55.89 (Table 1). These CIW values indicate that the degree of chemical weathering of source rocks/sediments ranges from weak to moderate [23]. The data of the Huanhe sandstones are located in the A–CN–K composition space, nearly parallel to the A–CN edge (Figure 14), showing that Na2O and CaO are removed from the source rock throughout low–moderate chemical weathering process of plagioclase feldspars. The PIA values (42.27–54.89, average = 50.40, Table 1) also indicate that there is weak chemical weathering in the source area [22].
The chemical weathering of the source area is additionally determined according to the proportion of trace elements [11]. The studied sandstones plot at the starting point of sedimentary recycling trend on Zr/Sc versus Th/Sc bivariate diagram (Figure 15A). The lower Zr/Sc ratios (5.04–12.53) indicate that the Zr concentration is lower throughout the circulation and sorting processes of the sediment. The chemical weathering in a semi-humid to humid environment is especially an oxidization reaction. During this process, some elements such as U are oxidized (U4+ to U6+) and removed by a natural process, such as leaching, unlike Th remaining in insoluble residues [54]. Therefore, Th versus Th/U diagram can be used to evaluate the continuous cycles of chemical weathering and sediment recirculation. The Huanhe sandstones have a high Th/U ratio (average is 2.47), indicating that it has reducing conditions (less than 3.8 of UCC) [10]. On the Th versus Th/U bivariate diagram, most samples plot along the depleted mantle source (Figure 15B). The ratio of Th/U and Th/Sc reflects the influence of chemical weathering or special oxidation-redox conditions, instead of the chemical composition of the source rocks.

5.3.2. Paleoclimate

Geochemical proxy indicators are widely utilized in the paleoclimate interpretation of the source areas [9,11,12,55]. In humid climate conditions, chemical weathering is dominant and affects the chemical composition of sediments, just like the concentration of mobile elements (Na, K and Ca) and immobile elements (Al, Si) throughout the process [9].
The major elements bivariate diagram (Al2O3 + K2O + Na2O% versus SiO2) of Suttner and Dutta (1986) was applied to the studied sandstones, reflecting the prevalence of arid paleoclimate conditions (Figure 16). In keeping with the geochemical indicators (CIA, CIW, PIA and ICV) of the major element composition of siliciclastic sediments (Table 1), sandstones have experienced weak to moderate weathering beneath arid paleoclimate conditions. This is often in sensible agreement with the previous documents within the survey area.

6. Conclusions

This study takes the Huanhe Sandstone within the west Ordos Basin, China as the research object, the provenance, sedimentary structure background, and paleoweathering were studied by petrography and bulk-rock major and trace element geochemistry. Most of the sandstone is feldspar sandstone. Both chemical index of alteration and chemical index of weathering values indicate that the degree of chemical weathering of most studied samples is weak to moderate. In the Th/Sc versus Zr/Sc diagram, all samples are amid at the starting point of the sedimentary recycling trend, indicating that the degree of sediment recycling (zircon addition) is low. Different indicators (such as La/Th versus Hf) indicate that the studied samples are felsic and mixed (felsic-mafic) source rocks in the upper continental crust. Similarly, the Cr/Th versus Th/Sc and Cr/V versus Y/Ni commixture models conjointly indicate that Huanhe Sandstone has felsic to mixed source rocks. Their geochemical characteristics further indicate that the Huanhe Sandstone was partially deposited in a passive marginal environment and has undergone post—deposition potassium metasomatism.

Author Contributions

Conceptualization, Z.Z. and Y.Z. (Yuyan Zhang) were responsible for the project and participated with X.L., Y.Z. (Yan Zhang) in the fieldwork and the selection of the sample material. Z.L., Y.C., C.Y. and Y.Z. (Yuyan Zhang) contributed by their experience and knowledge of the geology of the sandstone uranum deposit in inner Mongolia. Y.Z. (Yan Zhang) carried out the various analyses in the laboratories of Analtical Laboratory of Beijing Research Institute of Uranium Geology. X.L. and Y.Z. (Yan Zhang) completed original draft preparation; X.L. accomplished revision and editing; All authors contributed to the design of the submitted manuscript. All authors have read and agreed to the published version of the manuscript.

Funding

The research was funded by President Foundation of Beijing Research Institute of Uranium Geology (BRIUG) (NO. DQJ2004), Nuclear Material Technology Innovation Center Foundation Project (NO. ICNM-2021-ZH-11), National Natural Science Foundation of China (No.41630103) and Uranium geology research project (NO.DD2109).

Data Availability Statement

No new data were created in this study. Data sharing is not applicable to this article.

Acknowledgments

The authors thanks BRIUG for the technical and financial support provided. Special acknowledgment extended to Longhui Wang and Tao Guo (No.208 Geological Party CNNC) for their help in performance of field geological survey and sample collection.

Conflicts of Interest

The authors declare no conflict of interest.

References

  1. Adeigbe, O.C.; Yusuf, A.J. Geochemical Fingerprints; Implication for Provenance, Tectonic and Depositional Settings of Lower Benue Trough Sequence, Southeastern Nigeria. J. Environ. Sci. 2013, 3, 115–140. [Google Scholar]
  2. Omabehere, I.E.; Abiodun, A.I.E.; Edwin, O.A. Pattern of Geochemical and Sedimentological Variability of the Albian to Cenomanian Upper Bima Sandstone, Benue Trough, Nigeria: Implications on Tectonic provenance and Source Area Weathering. J. Environ. Sci. 2013, 3, 170–184. [Google Scholar]
  3. Min-Na, A.; Zhang, F.Q.; Yang, S.F.; Chen, H.L.; Batt, G.E.; Sun, M.D.; Meng, Q.A.; Zhu, D.F.; Cao, R.C.; Li, J.S. Early Cretaceous provenance change in the southern Hailar Basin, northeastern China and its implication for basin evolution. Cretac. Res. 2013, 40, 21–42. [Google Scholar] [CrossRef]
  4. Ikhane, P.R.; Akintola, A.I.; Bankole, S.I.; Oyinboade, Y.T. Provenance Studies of Sandstone Facies Exposed Near Igbile Southwestern Nigeria: Petrographic and Geochemical Approach. J. Geogra. Geol. 2014, 6, 47–68. [Google Scholar] [CrossRef] [Green Version]
  5. Khan, T.; Khan, M.S. Geochemistry of the Sandstones of Punagarh Basin: Implications for Two Source Terranes and Arabian—Nubian Connection of Aravalli Craton? J. Geol. Soc. India 2016, 88, 366–386. [Google Scholar] [CrossRef]
  6. Khan, T.; Sarma, D.S.; Somasekhar, V.; Ramanaiah, S.; Reddy, N.R. Geochemistry of the Palaeoproterozoic quartzites of Lower Cuddapah Supergroup, South India: Implications for the palaeoweathering, provenance, and crustal evolution. Geol. J. 2019, 55, 1587–1611. [Google Scholar] [CrossRef]
  7. Khan, T.; Sarma, D.S.; Khan, M.S. Geochemical study of the Neoproterozoic clastic sedimentary rocks of the Khambal Formation (Sindreth Basin), Aravalli Craton, NW Indian Shield: Implications for paleoweathering, provenance, and geodynamic evolution. Geochemistry 2020, 80, 129956. [Google Scholar] [CrossRef]
  8. Wanas, H.A.; Assal, E.M. Provenance, tectonic setting and source area-paleoweathering of sandstones of the Bahariya Formation in the Bahariya Oasis, Egypt: An implication to paleoclimate and paleogeography of the southern Neo-Tethys region during Early Cenomanian. Sediment. Geol. 2021, 413, 105822. [Google Scholar] [CrossRef]
  9. Nesbitt, H.W.; Young, G.M. Early Proterozoic climates and plate motions inferred from major element chemistry of lutites. Nature 1982, 299, 715–717. [Google Scholar] [CrossRef]
  10. Taylor, S.R.; McLennan, S.M. The Continental Crust: Its Composition and Evolution: An Examination of the Geochemical Record Preserved in Sedimentary Rocks; Blackwell Scientific Pu: Oxford, UK, 1985. [Google Scholar]
  11. McLennan, S.M.; Hemming, S.; McDaniel, D.K.; Hanson, G.N. Geochemical approaches to sedimentation, provenance, and tectonics. In Processes Controlling the Composition of Clastic Sediments; Johnsson, M.J., Basu, A., Eds.; Geological Society of America: Boulder, CO, USA, 1993; Volume 284. [Google Scholar] [CrossRef]
  12. Cullers, R.L. The geochemistry of shales, siltstones and sandstones of Pennsylvanian–Permian age, Colorado, USA: Implications for provenance and metamorphic studies. Lithos 2000, 51, 181–203. [Google Scholar] [CrossRef]
  13. Salgado-Campos, V.M.J.; Carvalho, I.D.S.; Bertolino, L.C.; Duarte, T.A.; Araújo, B.C.; Borghi, L. Clay mineralogy and lithogeochemistry of lutites from the Lower Cretaceous Crato Member, Araripe Basin, NE Brazil: Implications for paleoenvironmental, paleoclimatic and provenance reconstructions. J. S. Am. Earth Sci. 2021, 110, 103329. [Google Scholar] [CrossRef]
  14. Gao, Y.; Wang, C.S.; Liu, Z.F.; Zhao, B.; Zhang, X.F. Clay mineralogy of the middle Mingshui Formation (upper Campanian to lower Maastrichtian) from the SKIn borehole in the Songliao Basin, NE China: Implications for palaeoclimate and provenance. Palaeogeogr. Palaeoclimatol. Palaeoecol. 2013, 385, 162–170. [Google Scholar] [CrossRef]
  15. Zhang, X.L.; Gao, Z.Q.; Fan, T.L.; Xue, J.Q.; Li, W.H.; Zhang, H.; Cao, F.D. Element geochemical characteristics, provenance attributes, and paleosedimentary environment of the Paleogene strata in the Lenghu area, northwestern Qaidam Basin. J. Pet. Sci. Eng. 2020, 195, 107750. [Google Scholar] [CrossRef]
  16. Li, Y.; Nie, F.J.; Jia, L.C.; Lu, S.J.; Yan, Z.B. Geochemical Characteristics, Palaeoenvironment and Provenance of Uranium-Bearing Sandstone in the Sifangtai Formation, Northern Songliao Basin, Northeast China. Minerals 2021, 11, 1019. [Google Scholar] [CrossRef]
  17. Patra, A.; Shukla, A.D. Geochemical signatures of Late Paleocene sandstones from the Sanu Formation, Jaisalmer basin, western India: Implication for provenance, weathering and tectonic setting. J. Earth Syst. Sci. 2020, 129, 81–92. [Google Scholar] [CrossRef]
  18. Li, J.; Tian, J.C.; Zhang, X.; Liang, Q.S.; Peng, M.H. Geochemical characteristics and the constraints on paleoenvironment, provenance, and tectonic setting of Precambrian Xifangshan Formation in the northwestern Tarim Basin, NW China. J. Pet. Sci. Eng. 2022, 208, 109553. [Google Scholar] [CrossRef]
  19. Scott, M.; Sylvester, P.J.; Wilton, D.H.C. A Provenance Study of Upper Jurassic Hydrocarbon Source Rocks of the Flemish Pass Basin and Central Ridge, Offshore Newfoundland, Canada. Minerals 2021, 11, 265. [Google Scholar] [CrossRef]
  20. Papadopoulos, A.; Lazaridis, S.; Kipourou-Panagiotou, A.; Kantiranis, N.; Koroneos, A.; Almpanakis, K. Mineralogy, Geochemistry and Provenance of Coastal Sands from Greece: New Insights on the REE Content of Black Coastal Sands from Aggelochori Area, N.-Greece. Minerals 2021, 11, 693. [Google Scholar] [CrossRef]
  21. Xie, Y.; Wang, J.; Li, L.X.; Xie, Z.W.; Deng, G.S.; Li, M.H.; Jiang, X.H. Disbution of the Cretaceous clay minerals in Ordos basin, China and its implication to sedimentary and diagenetic environment. Geol. Bull. China 2010, 29, 93–104. [Google Scholar] [CrossRef]
  22. Fedo, C.M.; Nesbitt, H.W.; Young, G.M. Unraveling the effects of potassium metasomatism in sedimentary rocks and paleosols, with implications for paleoweathering conditions and provenance. Geology 1995, 23, 921–924. [Google Scholar] [CrossRef]
  23. Harnois, L. The CIW index: A new chemical index of weathering. Sediment. Geol. 1988, 55, 319–322. [Google Scholar] [CrossRef]
  24. Cox, R.; Lowe, D.R.; Cullers, R.L. The influence of sediment recycling and basement composition on evolution of mudrock chemistry in the south-western United States. Geochim. Cosmochim. Acta 1995, 59, 2919–2940. [Google Scholar] [CrossRef]
  25. Roser, B.P.; Korsch, R.J. Provenance signature of sandstone-mudstone suite determined using discriminant function analysis of major element data. Chem. Geol. 1988, 67, 119–139. [Google Scholar] [CrossRef]
  26. Bhatia, M.R. Plate Tectonics and Geochemical Composition of Sandstones: A Reply. J. Geol. 1985, 93, 85–87. [Google Scholar] [CrossRef]
  27. Roser, B.P.; Korsch, R.J. Determination of tectonic setting of sandstone-mudstone suites using SiO2 content and K2O/Na2O ratio. J. Geol. 1986, 94, 635–650. [Google Scholar] [CrossRef]
  28. Bhatia, M.R.; Crook, K.A.W. Trace element characteristics of greywackes and tectonic setting discrimination of sedimentary basins. Contrib. Mineral. Petrol. 1986, 92, 181–193. [Google Scholar] [CrossRef]
  29. Kroonenberg, S.B. Effects of provenance, sorting and weathering on the geochemistry of fluvial sands from different tectonic and climatic environments. Proc. Int. Geol. Congr. Part A 1994, 69, 81. [Google Scholar]
  30. Verma, S.P.; Armstrong-Altrin, J.S. New multi-dimensional diagrams for tectonic discrimination of siliciclastic sediments and their application to Precambrian basins. Chem. Geol. 2013, 355, 117–133. [Google Scholar] [CrossRef]
  31. Zhang, N.; Lin, C.M.; Zhang, X. Petrographic and geochemical characteristics of the Paleogene sedimentary rocks from the North Jiangsu Basin, Eastern China: Implications for provenance and tectonic setting. Mineral. Petrol. 2013, 108, 571–588. [Google Scholar] [CrossRef]
  32. Ross, D.J.K.; Bustin, R.M. Investigating the use of sedimentary geochemical proxies for paleoenvironment interpretation of thermally mature organic-rich strata: Examples from the Devonian–Mississippian shales, Western Canadian Sedimentary Basin. Chem. Geol. 2009, 260, 1–19. [Google Scholar] [CrossRef]
  33. Schindler, D.W.; Hecky, R.E.; Findlay, D.L.; Stainton, M.P.; Parker, B.R.; Paterson, M.J.; Beaty, K.G.; Lyng, M.; Kasian, S.E.M. Eutrophication of lake cannot be controlled by reducing nitrogen input: Results of a 37-year whole-ecosystem experiment. Proc. Natl. Acad. Sci. USA 2008, 105, 11254–11258. [Google Scholar] [CrossRef] [Green Version]
  34. Herron, M.M. Geochemical classification of terrigenous sands and shales from core or log data. J. Sediment. Res. 1988, 58, 820–829. [Google Scholar] [CrossRef]
  35. Armstrong-Altrin, J.S.; Nagarajan, R.; Madhavaraju, J.; Rosalez-Hoz, L.; Lee, Y.I.; Balaram, V.; Cruz-Martínez, A.; Avila-Ramírez, G. Geochemistry of the Jurassic and Upper Cretaceous shales from the Molango Region, Hidalgo, eastern Mexico: Implications for source-area weathering, provenance, and tectonic setting. C. R. Geosci. 2013, 345, 185–202. [Google Scholar] [CrossRef] [Green Version]
  36. Rudnick, R.L.; Gao, S. Composition of the Continental Crust. In Treatise on Geochemistry; Elsevier Science: Amsterdam, The Netherlands, 2003; pp. 1–64. [Google Scholar] [CrossRef]
  37. McLennan, S.M. Relationships between the trace element composition of sedimentary rocks and upper continental crust. Geochem. Geophys. Geosyst. 2001, 2, 1021. [Google Scholar] [CrossRef]
  38. Asiedu, D.K.; Suzuki, S.; Shibata, T. Provenance of sandstones from the Lower Cretaceous Sasayama Group, inner zone of southwest Japan. Sediment. Geol. 2000, 131, 9–24. [Google Scholar] [CrossRef]
  39. Morton, A.C.; Hallsworth, C.R. Processes controlling the composition of heavy mineral assemblages in sandstones. Sediment. Geol. 1999, 124, 3–29. [Google Scholar] [CrossRef]
  40. Adepoju, S.A.; Ojo, O.J.; Akande, S.O.; Sreenivas, B. Petrographic and geochemical constraints on petrofacies, provenance and tectonic setting of the upper cretaceous sandstones, Northern Bida Basin, north-central Nigeria. J. Afr. Earth Sci. 2021, 174, 104041. [Google Scholar] [CrossRef]
  41. Hayashi, K.I.; Fujisawa, H.; Holland, H.D.; Ohmoto, H. Geochemistry of ~1.9 Ga sedimentary rocks from northeastern Labrador, Canada. Geochim. Cosmochim. Acta 1997, 61, 4115–4137. [Google Scholar] [CrossRef]
  42. Floyd, P.A.; Leveridge, B.E. Tectonic environment of the Devonian Gramscatho basin, south Cornwall: Framework mode and geochemical evidence from turbiditic sandstones. J. Geol. Soc. Lond. 1987, 144, 531–542. [Google Scholar] [CrossRef]
  43. Totten, M.W.; Hanan, M.A.; Weaver, B.L. Beyond whole-rock geochemistry of shales: The importance of assessing mineralogic controls for revealing tectonic discriminants of multiple sediment sources for the Ouachita Mountain flysch deposits. Geol. Soc. Am. Bull. 2000, 112, 1012–1022. [Google Scholar] [CrossRef]
  44. Hiscott, R.N. Ophiolitic source rocks for Taconic-age flysch: Trace-element evidence. Geol. Soc. Am. Bull. 1984, 95, 1261–1267. [Google Scholar] [CrossRef]
  45. Cullers, R.L. The controls on the major and trace element variation of shales, siltstones, and sandstones of Pennsylvanian-Permian age from uplifted continental blocks in Colorado to platform sediment in Kansas, USA. Geochim. Cosmochim. Acta 1994, 58, 4955–4972. [Google Scholar] [CrossRef]
  46. Wronkiewicz, D.J.; Condie, K.C. Geochemistry of Archean shales from the Witwatersrand Supergroup, South Africa: Source-area weathering and provenance. Geochim. Cosmochim. Acta 1987, 51, 2401–2416. [Google Scholar] [CrossRef]
  47. Whalen, J.B.; Currie, K.L.; Chappell, B.W. A-type granites: Geochemical characteristics, discrimination and petrogenesis. Contrib. Mineral. Petrol. 1987, 95, 407–419. [Google Scholar] [CrossRef]
  48. Wedepohl, K.H. The composition of the continental crust. Geochim. Cosmochim. Acta 1995, 59, 1217–1232. [Google Scholar] [CrossRef]
  49. Verma, S.P.; Armstrong-Altrin, J.S. Geochemical discrimination of siliciclastic sediments from active and passive margin settings. Sediment. Geol. 2016, 332, 1–12. [Google Scholar] [CrossRef]
  50. Middelburg, J.J.; Weijiden, C.H.V.D.; Woittiez, J.R.W. Chemical processes affecting the mobility of major, minor and trace elements during weathering of granitic rocks. Chem. Geol. 1988, 68, 253–273. [Google Scholar] [CrossRef]
  51. Nesbitt, H.W.; Young, G.M. Prediction of some weathering trends of plutonic and volcanic rocks based on thermodynamic and kinetic considerations. Geochim. Cosmochim. Acta 1984, 48, 1523–1534. [Google Scholar] [CrossRef]
  52. Christopher, M.F.; Kenneth, A.E.; Eirik, J.K. Geochemistry of shales from the Archean (~3.0 Ga) Buhwa Greenstone Belt, Zimbabwe: Implications for provenance and source-area weathering. Geochim. Cosmochim. Acta 1996, 60, 1751–1763. [Google Scholar] [CrossRef]
  53. McLennan, S.M.; Taylor, S.R.; McCulloch, J.B. Geochemical and Nd-Sr isotopic composition of deep-sea turbidites: Crustal evolution and plate tectonic associations. Geochim. Cosmochim. Acta 1990, 54, 2015–2050. [Google Scholar] [CrossRef]
  54. Lee, J.S.; Prodip, K.D. Alluvial sandstone composition and paleoclimate; I, Framework mineralogy. J. Sediment. Res. 1986, 56, 329–345. [Google Scholar] [CrossRef]
  55. Ge, X.Y.; Mou, C.L.; Yu, Q.; Liu, W.; Men, X.; He, J.L. The geochemistry of the sedimentary rocks from the Huadi No. 1 well in the Wufeng-Longmaxi formations (Upper Ordovician-Lower Silurian), South China, with implications for paleoweathering, provenance, tectonic setting and paleoclimate. Mar. Pet. Geol. 2019, 103, 646–660. [Google Scholar] [CrossRef]
Figure 1. (a) Outline of structures around Ordos Basin (b) Geological map of Northwest Ordos Basin.
Minerals 11 01376 g001
Figure 2. Stratigraphic sketch of the northwestern part of Ordos Basin.
Minerals 11 01376 g002
Figure 3. (a) Structural partition map, (b) floor burial depth diagram of Cretaceous, (c) drilling sampling map of the study area.
Minerals 11 01376 g003
Figure 4. Photomicrograph of sandstones from the Huanhe Formation showing (A) texturally matured grains, quartz (Qz) is secondary enlarged and cemented by calcite; (B) Biotite (Bit) and Microcline (Mic); (CF) non-undulose and undulose quartz grains, feldspar cemented by calcite. Note: All photomicrographs are under cross-polarized light.
Minerals 11 01376 g004
Figure 5. Geochemical classification diagram [34] of log (SiO2/Al2O3) plotted against log (Fe2O3/K2O) for the Huanhe Formation sandstones. The blue diamond symbol represents Huanhe Formation sandstone.
Minerals 11 01376 g005
Figure 6. (ac) Chondrite–normalized REE diagrams for the Lower Cretaceous Huanhe Formation sandstones. Chondrite–normalization values are from Taylor and McLennan [10].
Minerals 11 01376 g006
Figure 7. Source rock discrimination diagram for the Huanhe Formation sandstones on: (A) Provenance discriminant function diagram using major elements [25], Discrimination functions 1 = −1.773 × TiO2 + 0.607 × Al2O3 + 0.76 × TFe2O3 − 1.5 × MgO + 0.616 × CaO + 0.509 × Na2O − 1.224 × K2O − 9.09; Discrimination functions 2 = 0.445 × TiO2 + 0.07 × Al2O3 − 0.25 × TFe2O3 − 1.142 × MgO + 0.438 × CaO + 1.475 × Na2O + 1.426 × K2O − 6.861. (B) Zr (ppm) versus TiO2 (wt.) bivariate diagram [41]. (C) Hf (ppm) versus La/Th bivariate diagram [42]. (D) La/Sc versus Co/Th bivariate diagram [11]. The average chemical compositions of the volcanic rocks are from Condie [47]. (E) Th/Sc versus Cr/Th bivariate diagram [43]. (F) Y/Ni versus Cr/V bivariate diagram [11]. Symbols are the same as in Figure 5.
Minerals 11 01376 g007
Figure 8. The plot of TiO2 versus Al2O3 of the Huanhe sandstones. UCC [10], granite [48], granodiorite [49], and tonalite [49]. Symbols are the same as in Figure 5.
Minerals 11 01376 g008
Figure 9. Ni-V-Th*10 ternary diagram for provenance discrimination of the Huanhe Formation sandstones [45]. Symbols are the same as in Figure 5.
Minerals 11 01376 g009
Figure 10. Provenance-dependent elements and elemental ratios for the Lower Cretaceous Huanhe Formation sandstones: (A) Eu/Eu* versus (La/Yb)CN bivariate diagram [36], (B) (Gd/Yb)CN versus Eu/Eu* bivariate diagram [10]. Symbols are the same as in Figure 5.
Minerals 11 01376 g010
Figure 11. Polts of major elements composition of the Huanhe sandstones using tectonic setting discrimination diagrams [26]: (A) Fe2O3 + MgO versus TiO2 bivariate diagram, (B) Discriminant function coefficients ternary diagram. PM, Passive margin; ACM, Active continental margin; CA, Continental island—arc; OA, Oceanic island—arc. Symbols are the same as in Figure 5.
Minerals 11 01376 g011
Figure 12. Discriminant-function multi-dimensional diagram for high-silica clastic sediments [30]. The subscript m1 in DF1 and DF2 represents the high-silica diagram based on loge-ratios of major elements. The discriminant function equations are: DF1(Arc-Rift-Col)m1 = (−0.263 × ln(TiO2/SiO2)adj) + (0.604 × ln(Al2O3/SiO2)adj) + (−1.725 × ln(Fe2O3T/SiO2)adj) + (0.660 × ln(MnO/SiO2)adj) + (2.191 × ln(MgO/SiO2)adj) + (0.144 × ln(CaO/SiO2)adj) + (−1.304 × ln(Na2O/SiO2)adj) + (0.054 × ln(K2O/SiO2)adj) + (−0.330 × ln(P2O5/SiO2)adj) + 1.588; DF2(Arc-Rift-Col)m1 = (−1.196 × ln(TiO2/SiO2)adj) + (1.604 × ln(Al2O3/SiO2)adj) + (0.303 × ln(Fe2O3T/SiO2)adj) + (0.436 × ln(MnO/SiO2)adj) + (0.838 × ln(MgO/SiO2)adj) + (−0.407 × ln(CaO/SiO2)adj) + (1.021 × ln(Na2O/SiO2)adj) + (−1.706 × ln(K2O/SiO2)adj) + (−0.126 × ln(P2O5/SiO2)adj) − 1.068. Symbols are the same as in Figure 5.
Minerals 11 01376 g012
Figure 13. Multidimensional discriminant function diagrams [50] using major elements (A) and combined major and trace elements (B) respectively, to distinguish active from passive margin settings. Symbols are the same as in Figure 5.
Minerals 11 01376 g013
Figure 14. A–CN–K diagram [9] for the studied sandstones of the Huanhe Formation. Note: A = Al2O3; CN = CaO* + Na2O; K = K2O (in molar proportions); CaO* is the molar proportion of CaO in the silicate fraction; CIA is chemical index of alteration. Symbols are the same as in Figure 5.
Minerals 11 01376 g014
Figure 15. Comparative diagrams showing influence of weathering, sorting and recycling processes for the Huanhe sandstones. (A) Zr/Sc versus Th/Sc bivariate diagram [11]. (B) Th versus Th/U bivariate diagram [11]. Symbols are the same as in Figure 5.
Minerals 11 01376 g015
Figure 16. Al2O3 + K2O + Na2O% versus SiO2% bivariate diagram for distinguishing climatic conditions of the Huanhe sandstones [55]. Symbols are the same as in Figure 5.
Minerals 11 01376 g016
Table 4. Elemental ratios of the Huanhe sandstones compared to the range values of siliciclastic sediments derived from felsic and mafic rocks, and upper continental crust.
Elemental
Ratio
Studied SamplesRange of Sediments from
Felsic Sources [12,46]
Range of Sediments from Mafic SourcesUCC [36]
RangeAverage
Eu/Eu*0.65–0.930.800.40–0.940.71–0.950.72
La/Sc2.89–4.453.722.50–16.30.43–0.862.21
La/Co1.99–4.693.311.80–13.80.14–0.381.79
Th/Sc0.61–1.040.800.84–20.50.05–0.220.75
Th/Co0.42–1.030.710.67–19.40.04–1.400.61
Cr/Th22.58–131.9869.634–1525–5008.76
Publisher’s Note: MDPI stays neutral with regard to jurisdictional claims in published maps and institutional affiliations.

