
Decay Detection in an Ancient Column with Combined Close-Range Photogrammetry (CRP) and Ultrasonic Tomography

 ,
,  , , , and
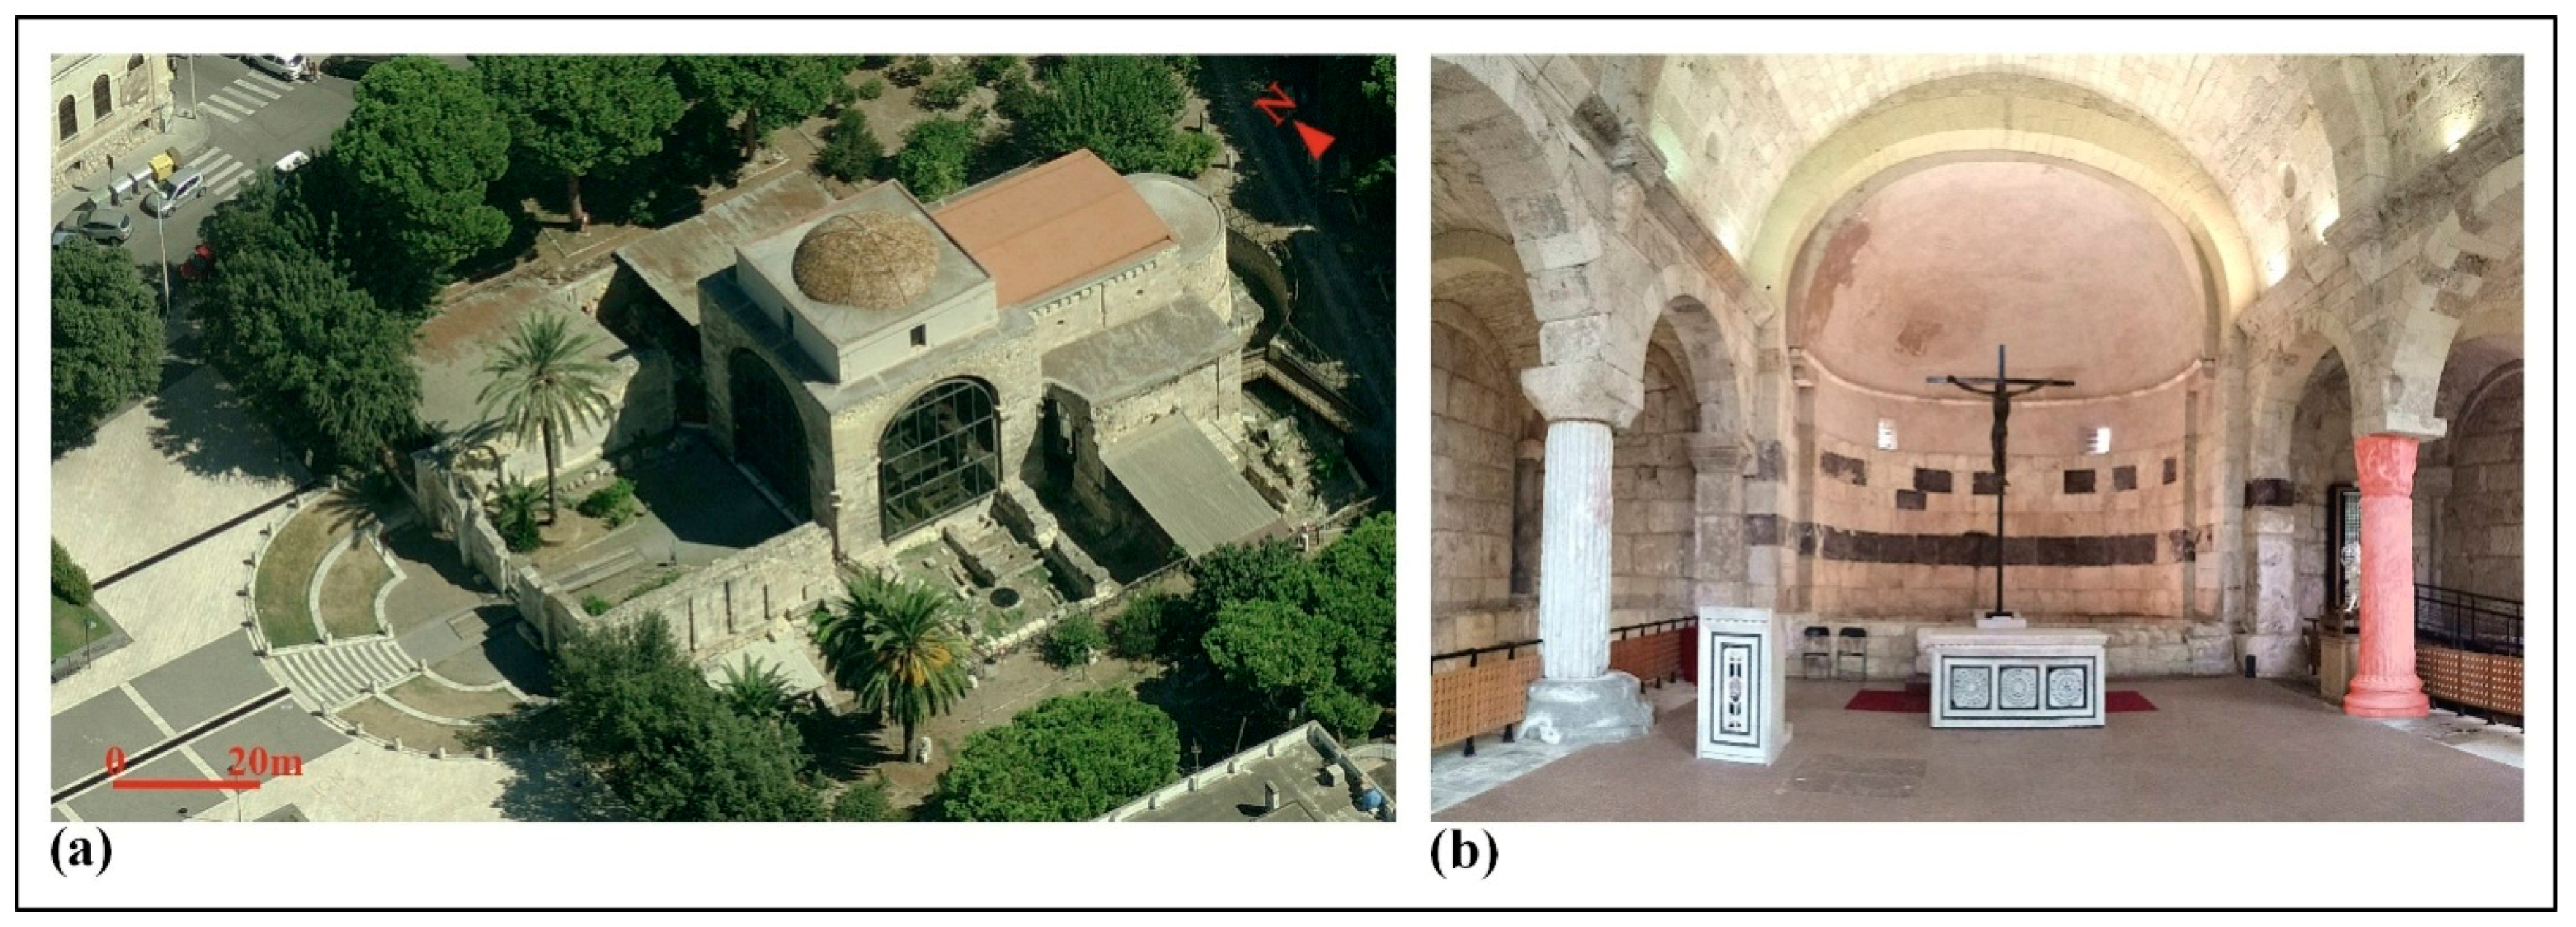
Abstract
:1. Introduction
2. Materials and Methods
2.1. Macroscopic Features
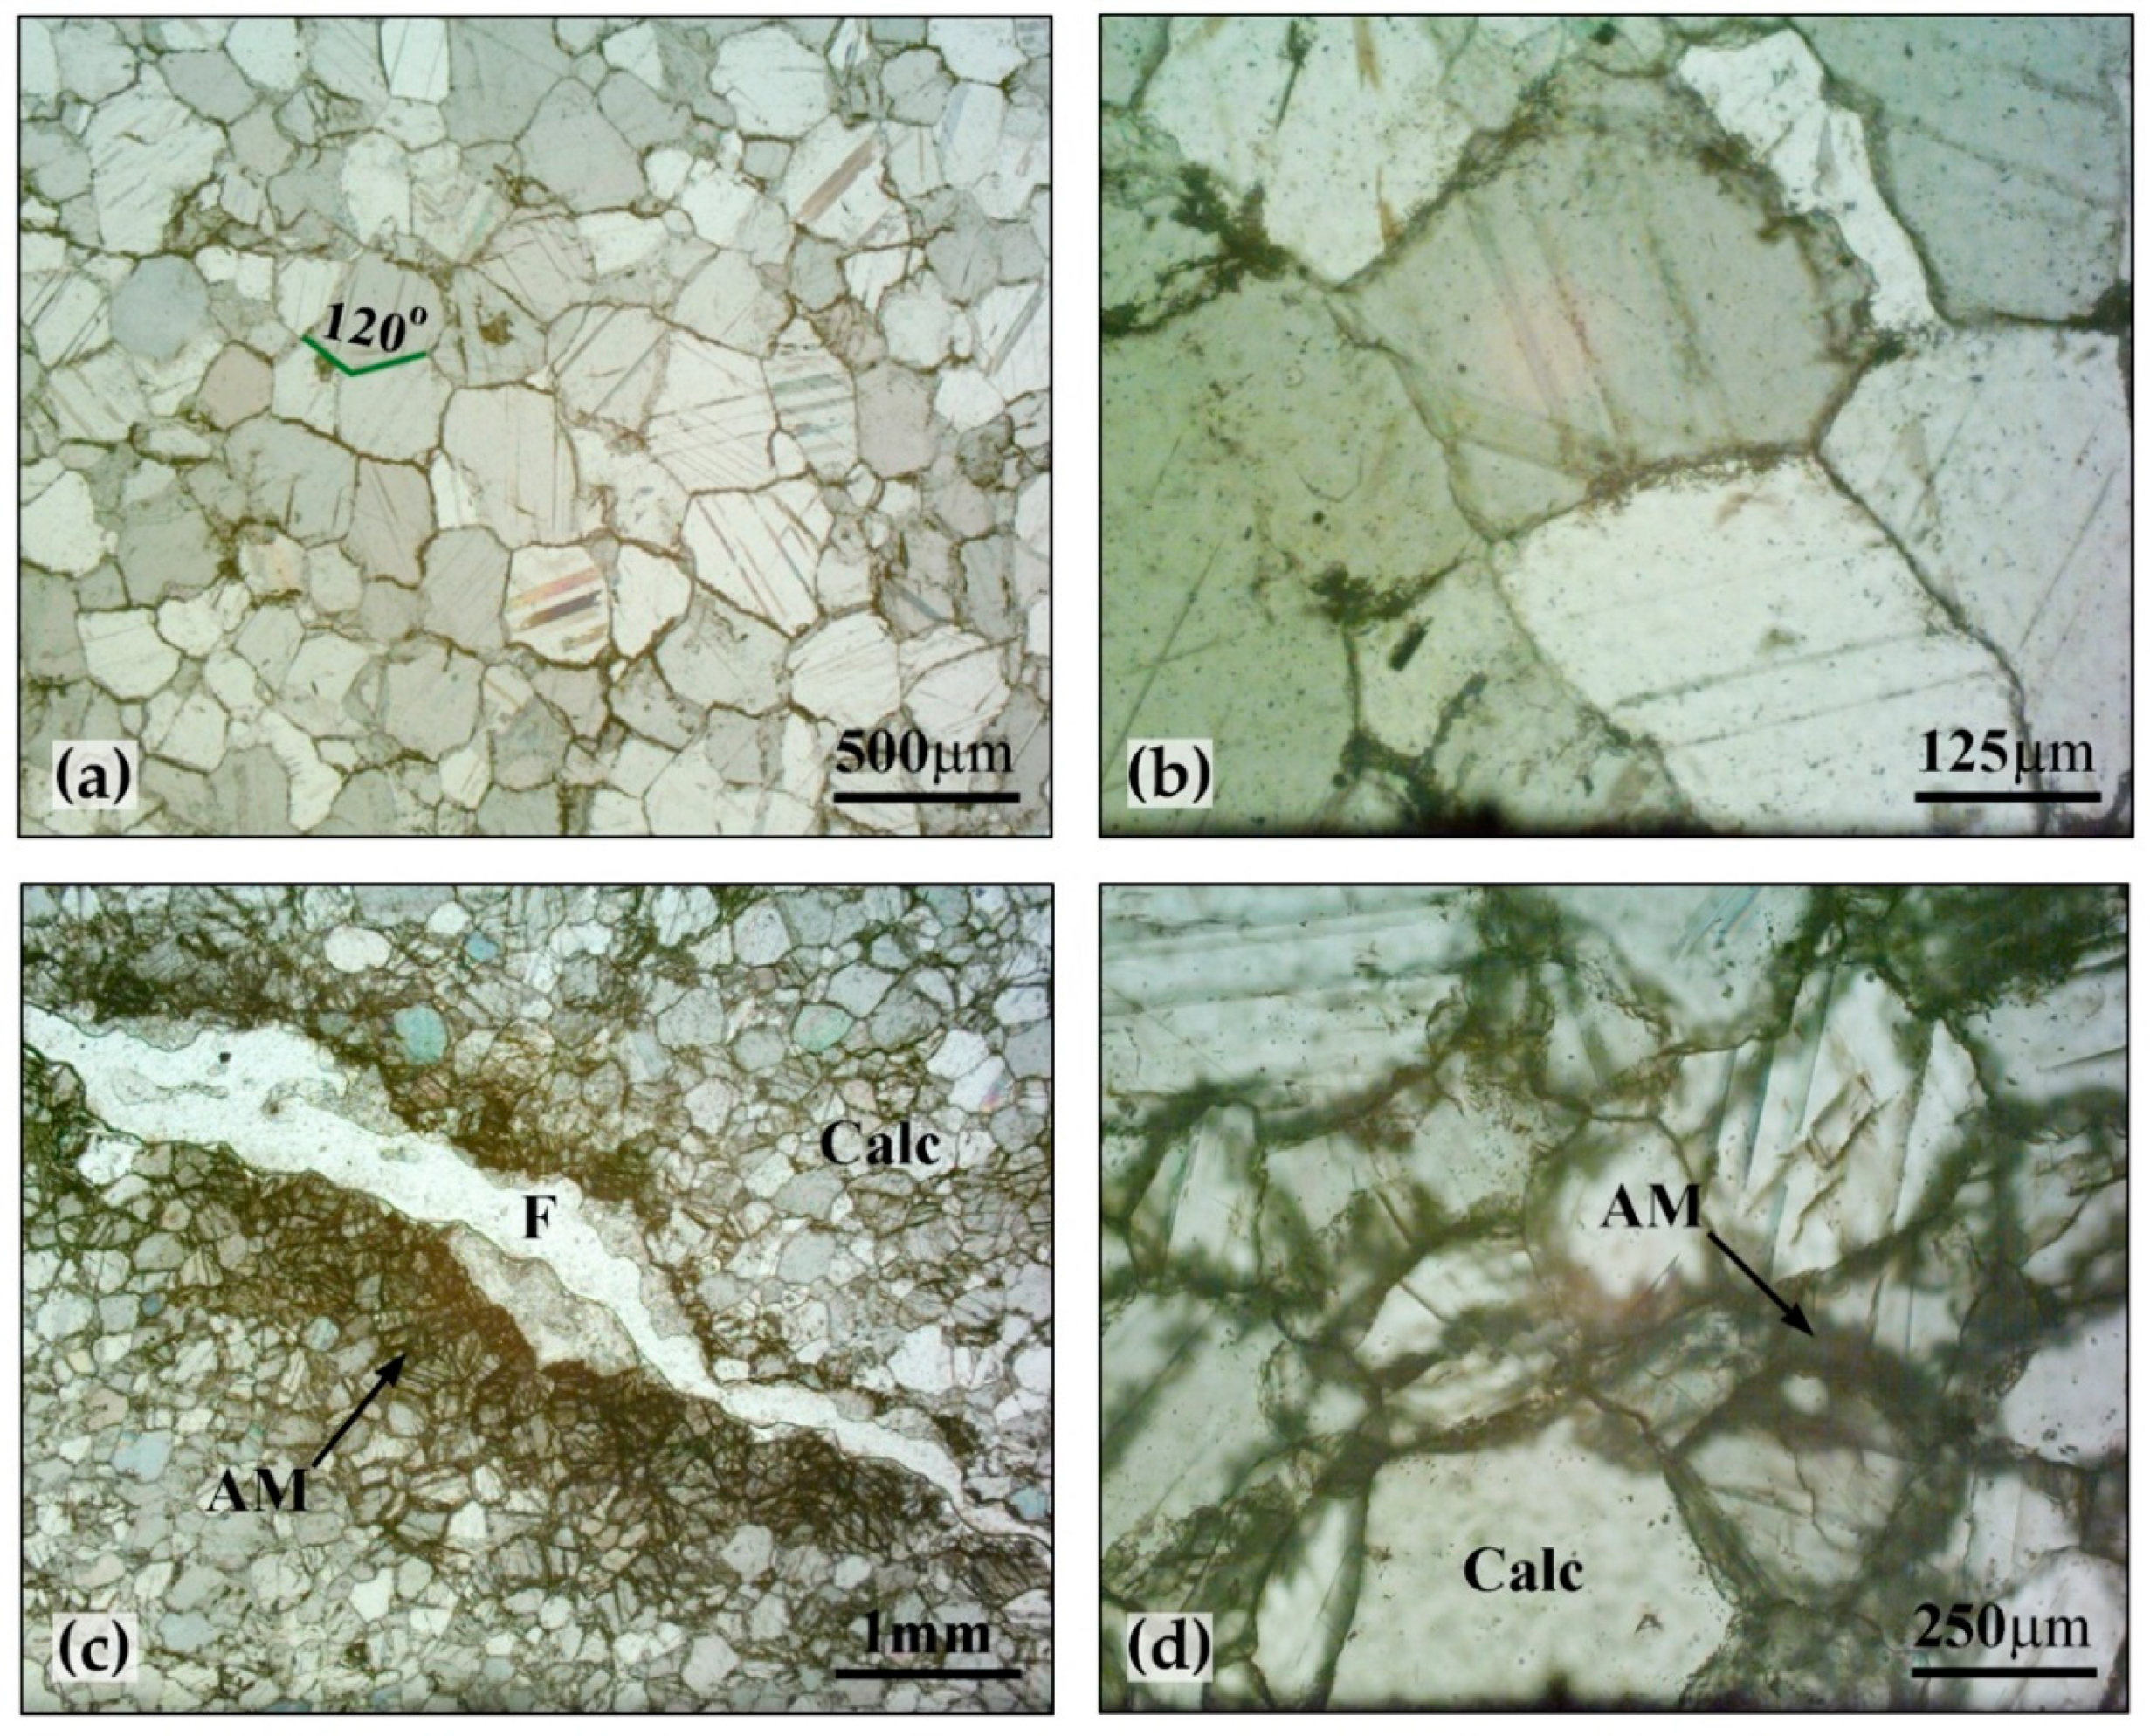
2.2. Optical Microscopy Analysis
2.3. Close Range Photogrammetry
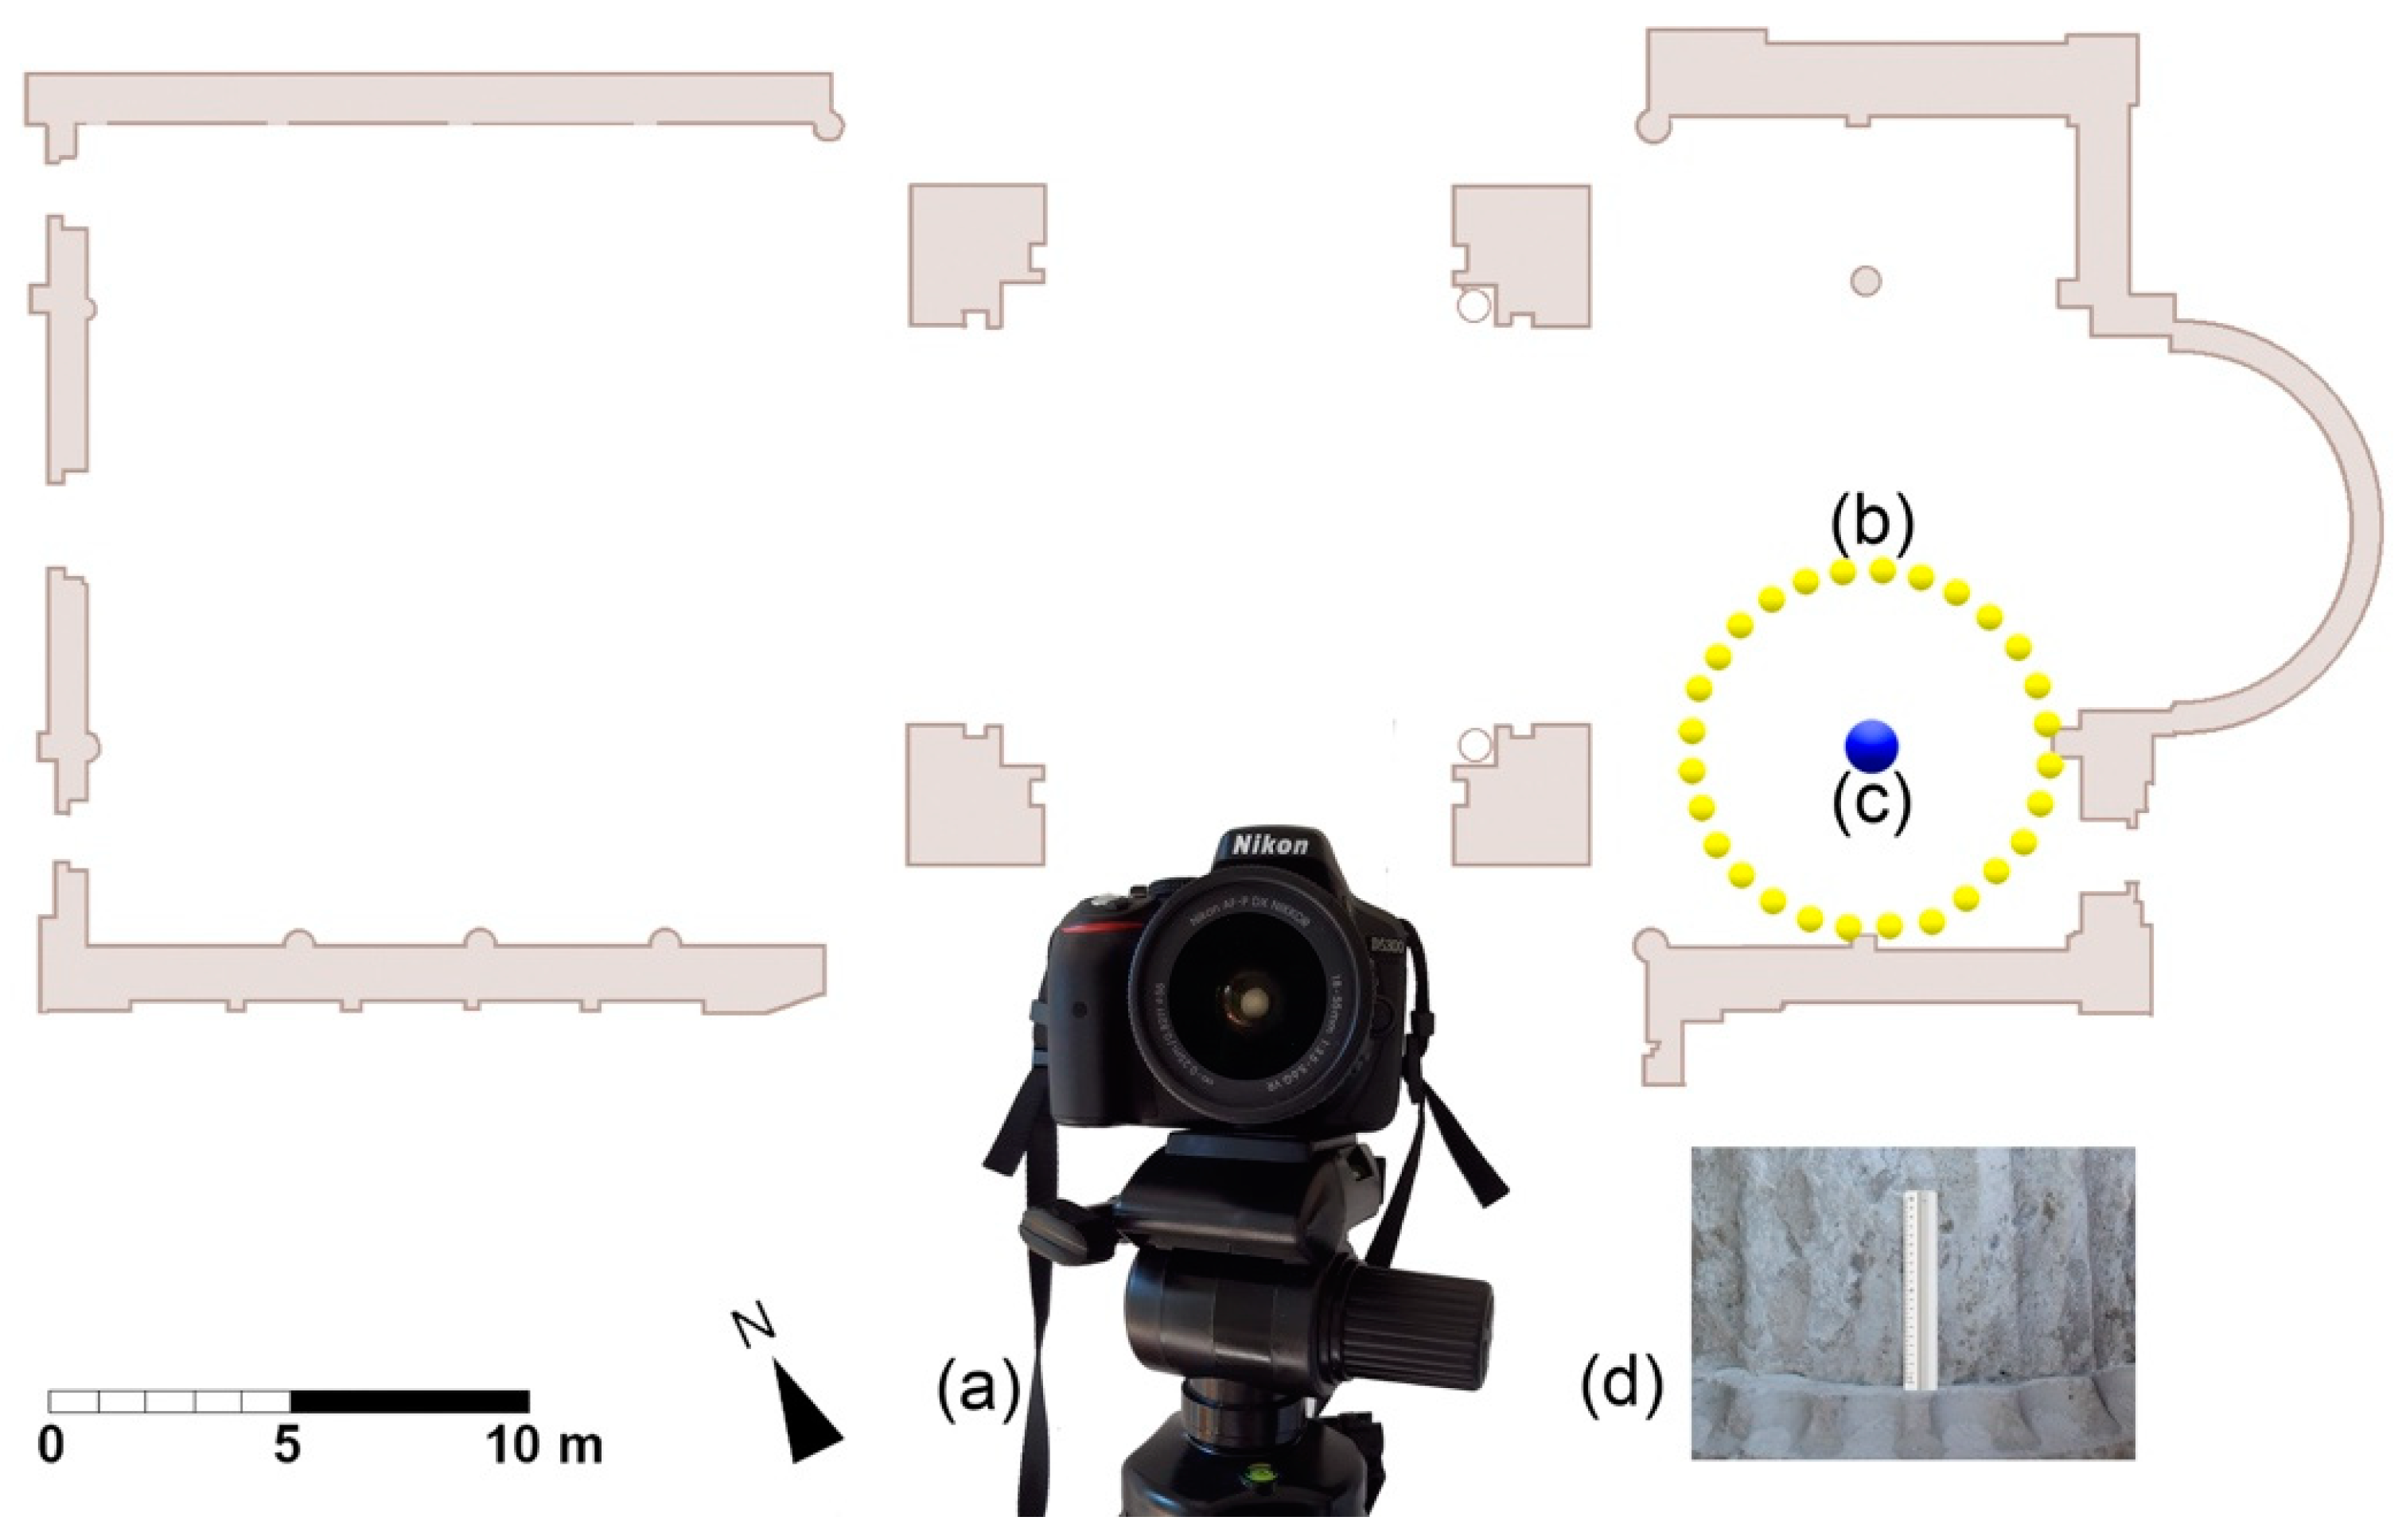
2.3.1. The Photogrammetric Survey
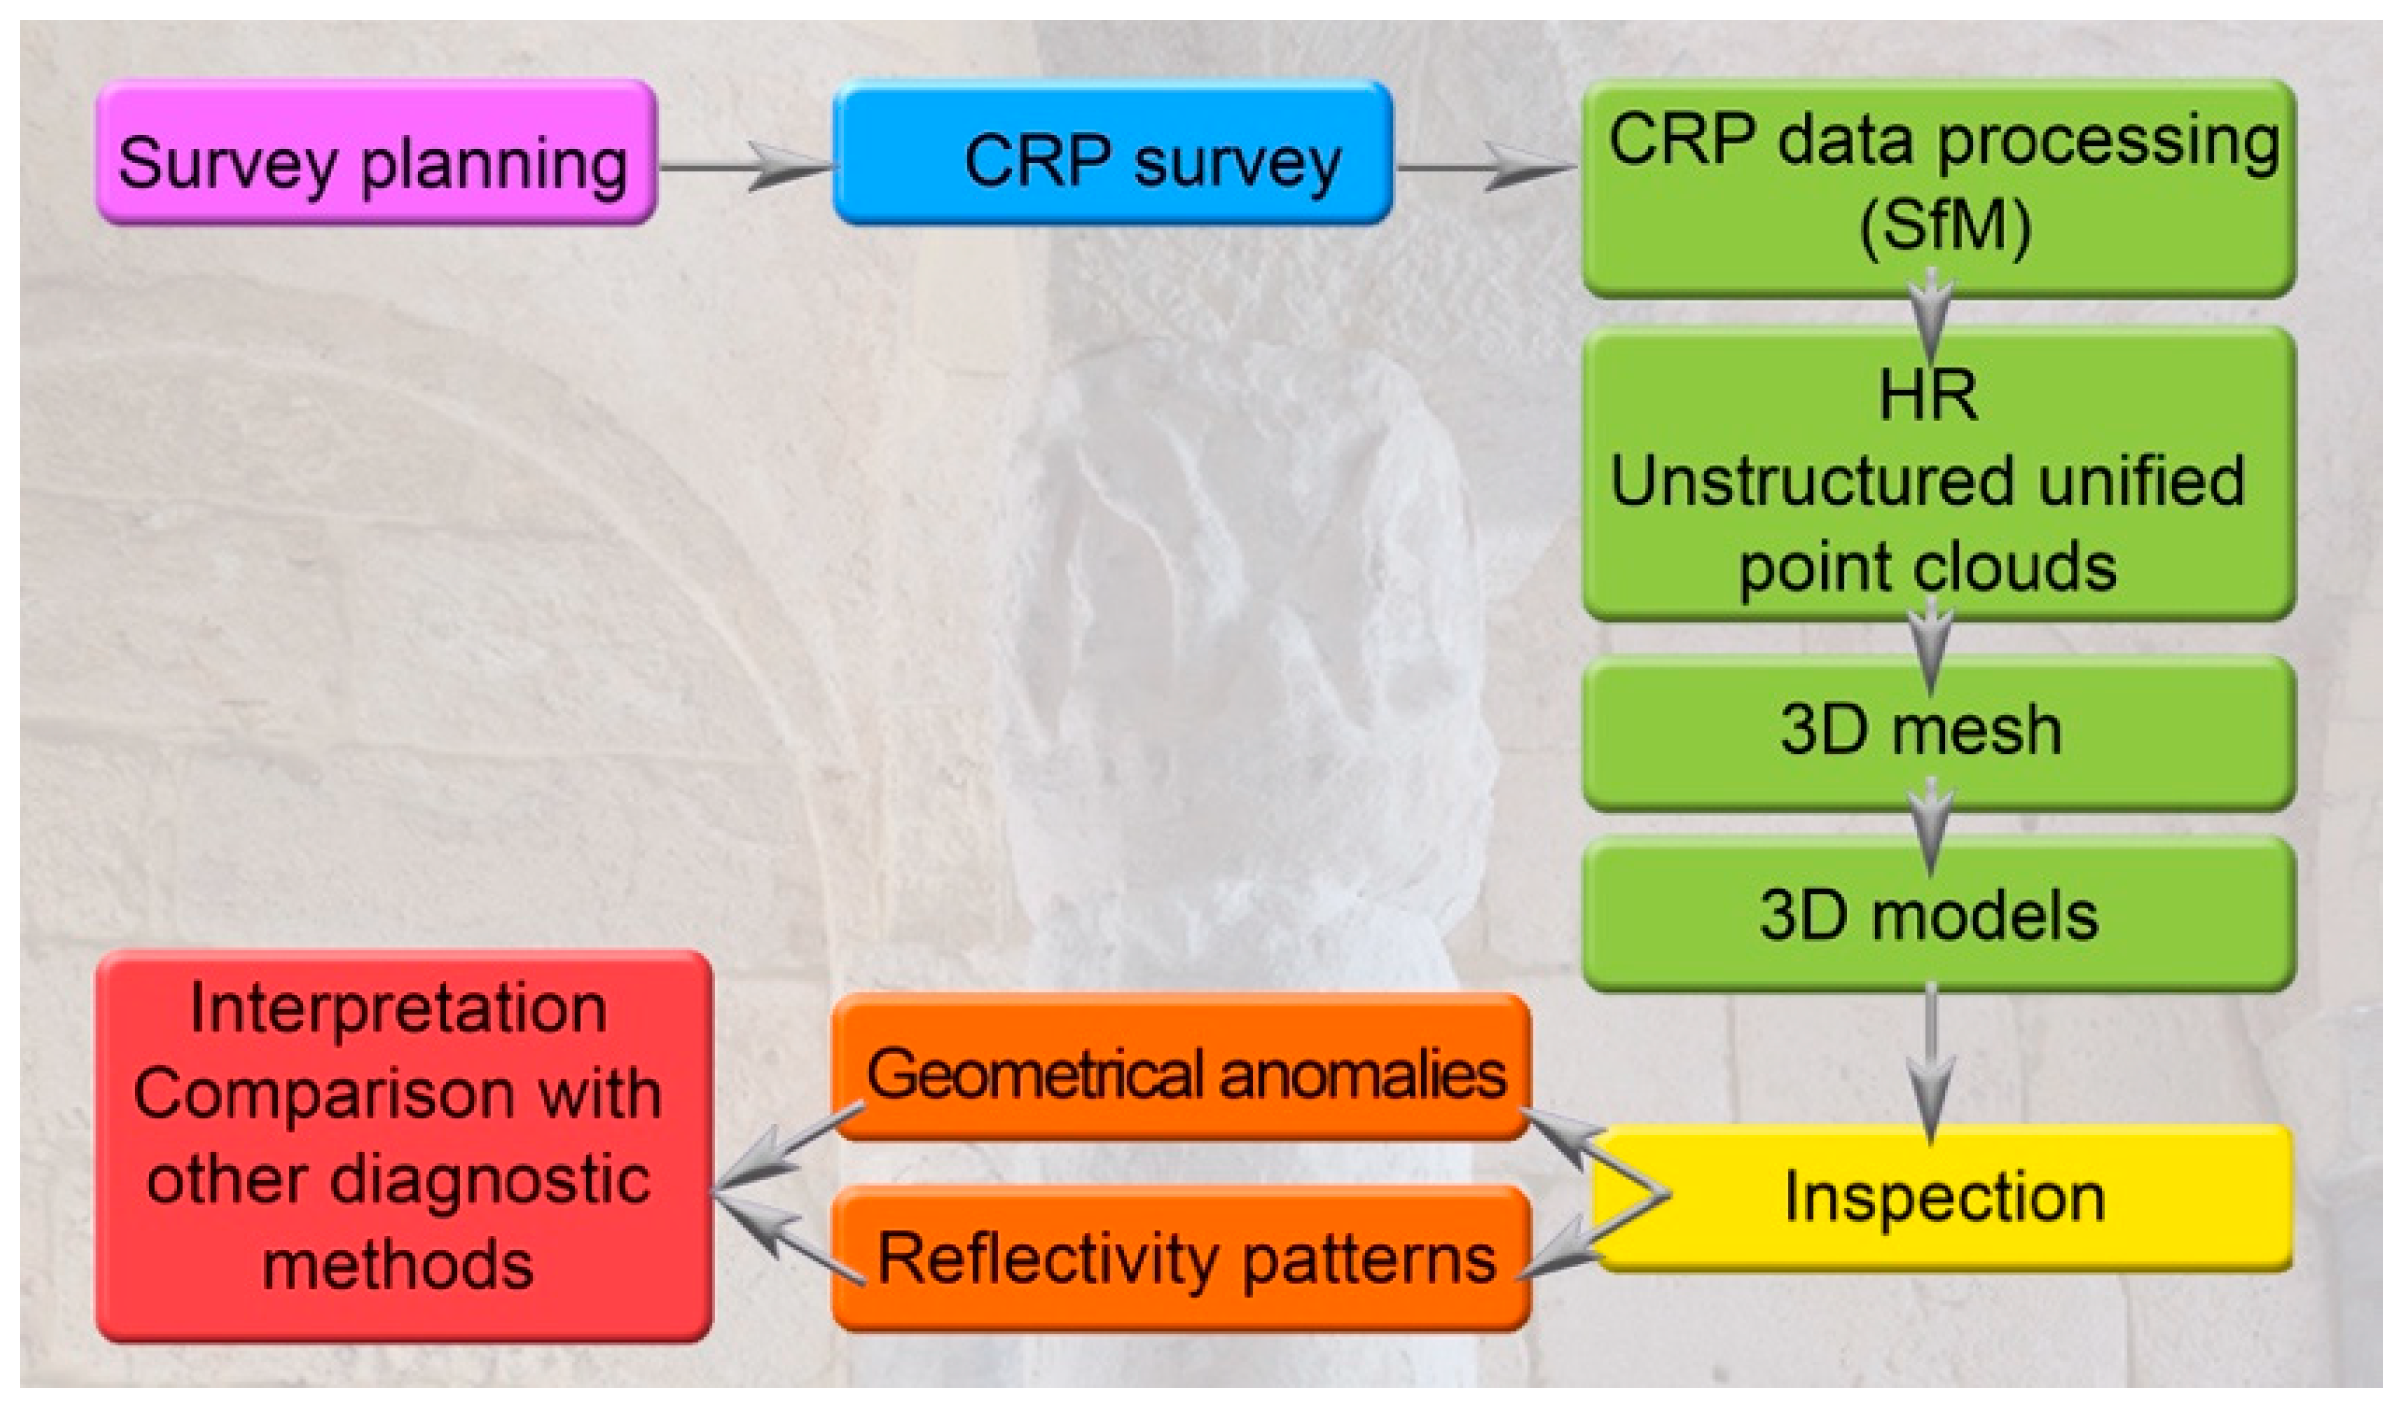
2.3.2. Data Processing
2.4. Ultrasonic Measurements
The 3D Ultrasonic Tomography
3. Results and Discussion
3.1. Close Range Photogrammetry
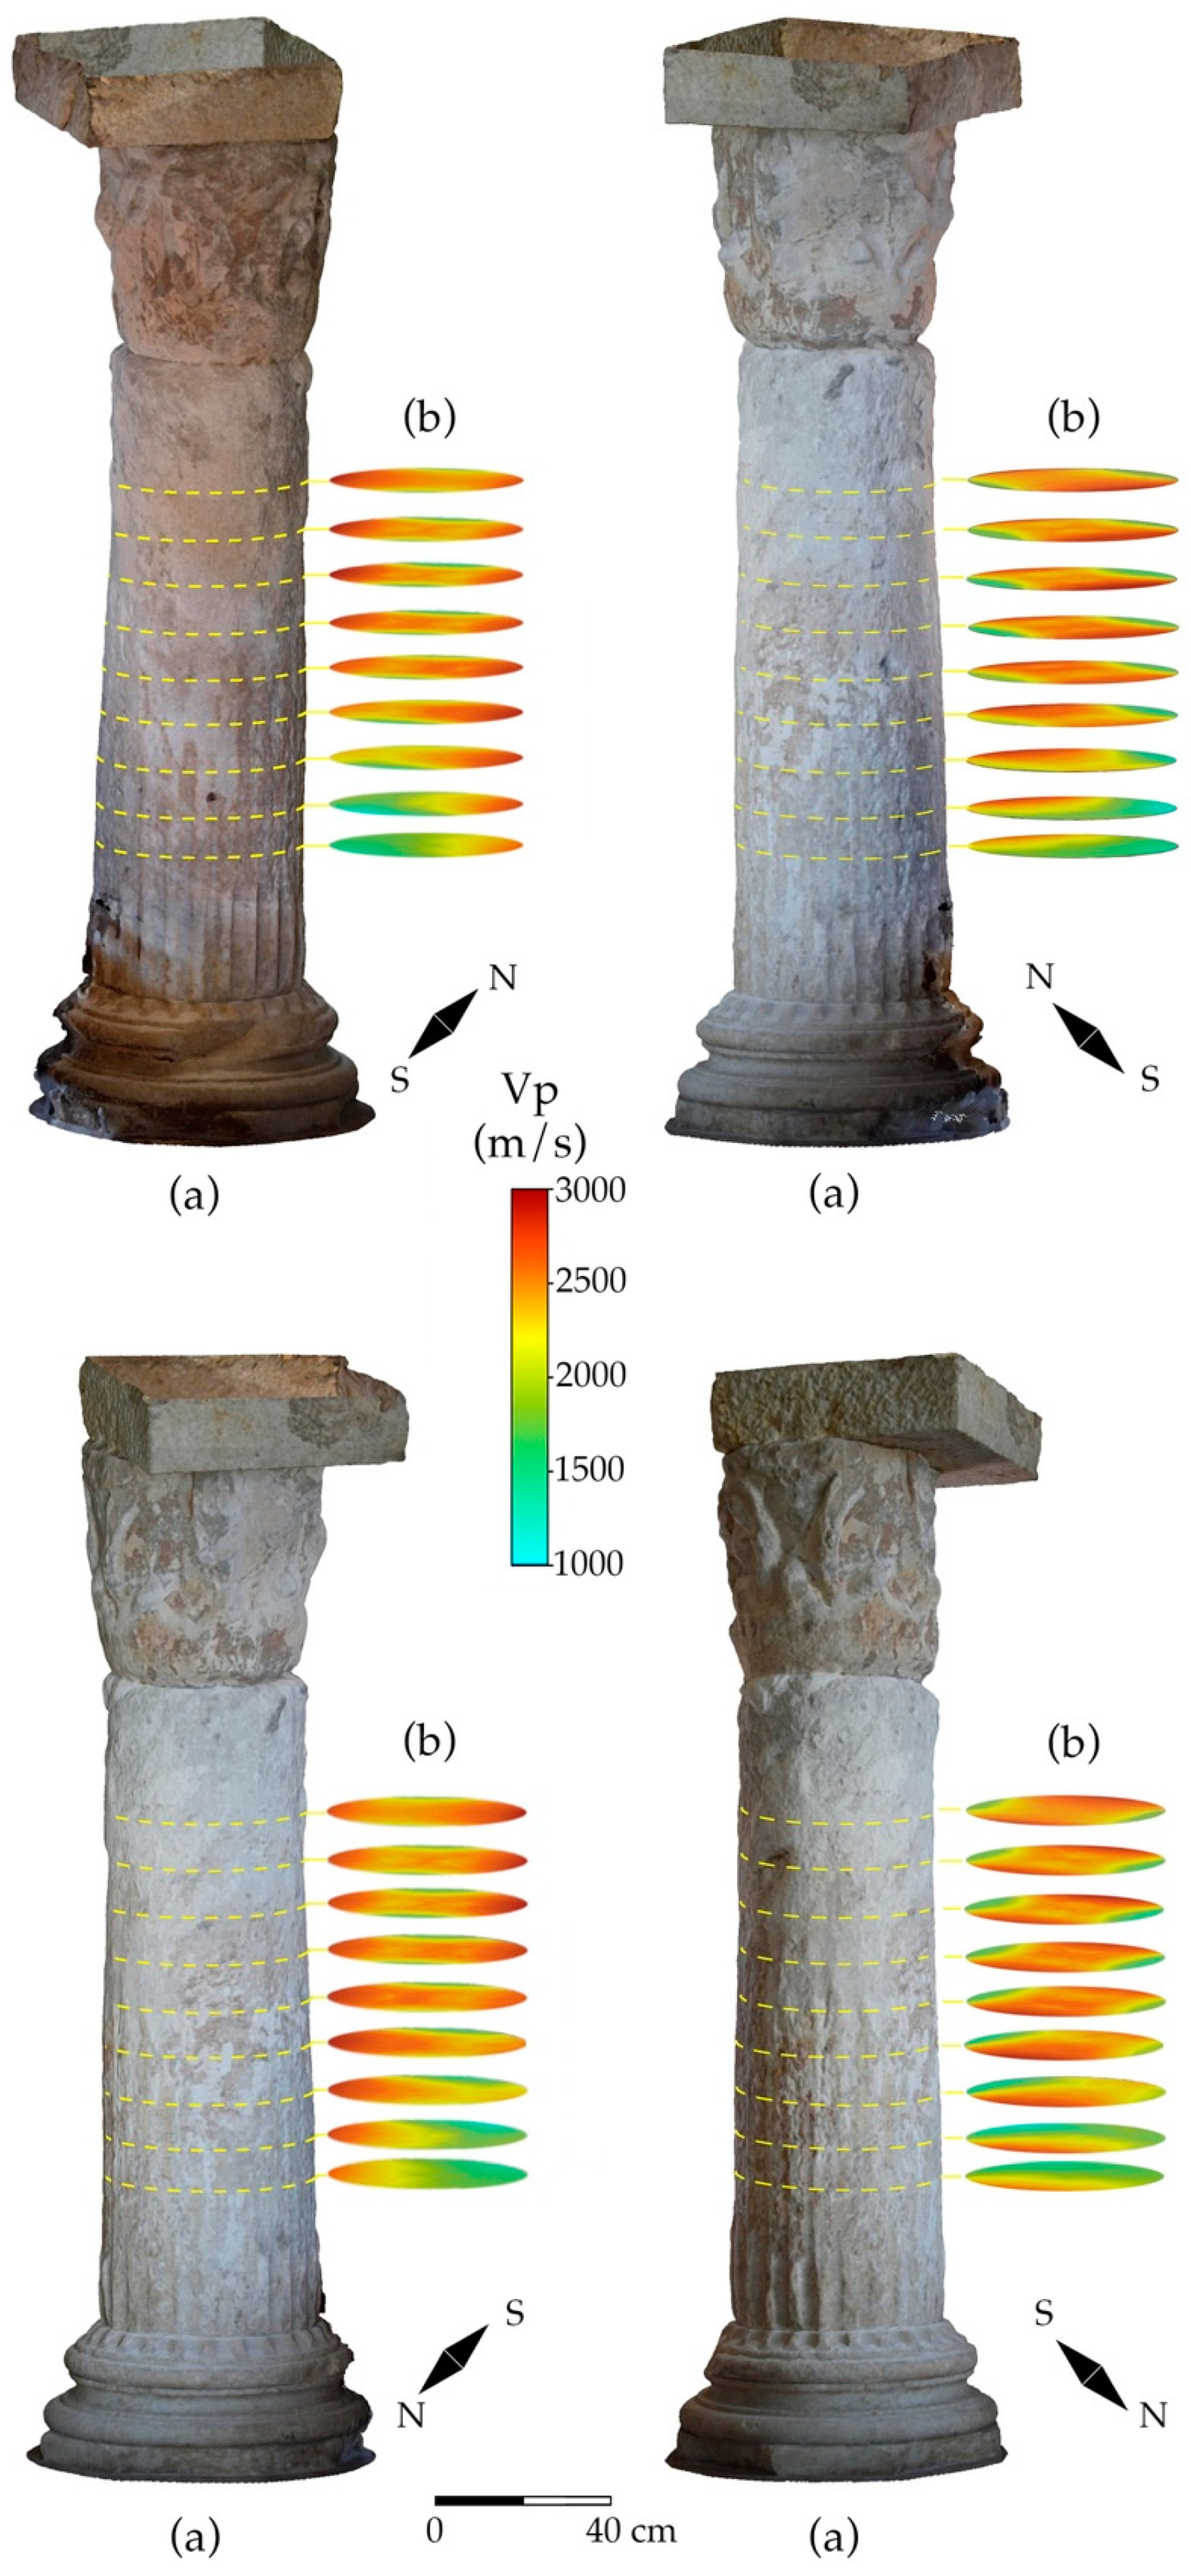
3.2. Ultrasonic Tomography
4. Conclusions
Author Contributions
Funding
Acknowledgments
Conflicts of Interest
References
- Montuori, A.; Luzi, G.; Stramondo, S.; Casula, G.; Bignami, C.; Bonali, E.; Bianchi, M.G.; Crosetto, M. Combined use of ground-based systems for Cultural Heritage conservation monitoring. In Proceedings of the 2014 IEEE Geoscience and Remote Sensing Symposium, Quebec City, QC, Canada, 13–18 July 2014; IEEE: Quebec City, QC, Canada, 2014; pp. 4086–4089. [Google Scholar] [CrossRef]
- Montuori, A.; Costanzo, A.; Gaudiosi, I.; Vecchio, A.; Apa, M.I.P.; Gervasi, A.; Falcone, S.; La Piana, C.; Minasi, M.; Stramondo, S.; et al. The MASSIMO system for the safeguarding of historic buildings in a seismic area: Operationally-oriented platforms. Eur. J. Remote Sens. 2016, 49, 397–415. [Google Scholar] [CrossRef]
- Bianchi, M.G.; Casula, G.; Cuccuru, F.; Fais, S.; Ligas, P.; Ferrara, C. Three-dimensional imaging from laser scanner, photogrammetric and acoustic non-destructive techniques in the characterization of stone building materials. Adv. Geosci. 2018, 45, 57–62. [Google Scholar] [CrossRef] [Green Version]
- Casula, G.; Cuccuru, F.; Bianchi, M.G.; Fais, S.; Ligas, P. High resolution 3-D modelling of cylinder shape bodies applied to ancient columns of a church. Adv. Geosci. 2020, 54, 119–127. [Google Scholar] [CrossRef]
- Christaras, B.; Cuccuru, F.; Fais, S.; Papanikolaou, H. Application of non destructive ultrasonic techniques for the analysis of the conservation status of building materials in monumental structures. In Engineering Geology for Society and Territory-Volume 8; Springer: Berlin/Heidelberg, Germany, 2015; pp. 139–143. [Google Scholar]
- Fais, S.; Casula, G.; Cuccuru, F.; Ligas, P.; Bianchi, M.G. An innovative methodology for the non-destructive diagnosis of architectural elements of ancient historical buildings. Sci. Rep. 2018, 8, 4334. [Google Scholar] [CrossRef] [PubMed] [Green Version]
- Zhang, J.; Khoshelham, K. 3D reconstruction of internal wood decay using photogrammetry and sonic tomography. Photogramm. Rec. 2020, 35, 357–374. [Google Scholar] [CrossRef]
- Hatır, M.E.; Korkanç, M.; Başar, M.E. Evaluating the deterioration effects of building stones using NDT: The Küçükköy Church, Cappadocia Region, central Turkey. Bull. Eng. Geol. Environ. 2019, 78, 3465–3478. [Google Scholar] [CrossRef]
- Puxeddu, M.; Cuccuru, F.; Fais, S.; Casula, G.; Bianchi, M.G. 3D Imaging of CRP and Ultrasonic Tomography to Detect Decay in a Living Adult Holm Oak (Quercus ilex L.) in Sardinia (Italy). Appl. Sci. 2021, 11, 1199. [Google Scholar] [CrossRef]
- Pepe, M.; Costantino, D. Techniques, tools, platforms and algorithms in close range photogrammetry in building 3D model and 2D representation of objects and complex architectures. Comput. Aided Appl. 2020, 18, 42–65. [Google Scholar] [CrossRef]
- Moyano, J.; Nieto-Julián, J.E.; Bienvenido-Huertas, D.; Marín-García, D. Validation of close-range photogrammetry for architectural and archaeological heritage: Analysis of point density and 3D mesh geometry. Remote Sens. 2020, 12, 3571. [Google Scholar] [CrossRef]
- Prasetyo, Y.; Bashit, N.; Silaen, B. Geometry accuracy analysis of the three-dimensional model using the close-range photogrammetry method for conservation object of culture (case study: Cow Statue, Faculty Of Livestock, Diponegoro University). IOP Conf. Ser. Earth Environ. Sci. 2020, 500, 12043. [Google Scholar] [CrossRef]
- Adamopoulos, E.; Rinaudo, F. Close-Range Sensing and Data Fusion for Built Heritage Inspection and Monitoring—A Review. Remote Sens. 2021, 13, 3936. [Google Scholar] [CrossRef]
- Iglhaut, J.; Cabo, C.; Puliti, S.; Piermattei, L.; O’Connor, J.; Rosette, J. Structure from Motion Photogrammetry in Forestry: A Review. Curr. For. Rep. 2019, 5, 155–168. [Google Scholar] [CrossRef] [Green Version]
- Buill, F.; Núñez-Andrés, M.A.; Costa-Jover, A.; Moreno, D.; Puche, J.M.; Macias, J.M. Terrestrial Laser Scanner for the Formal Assessment of a Roman-Medieval Structure—The Cloister of the Cathedral of Tarragona (Spain). Geosciences 2020, 10, 427. [Google Scholar] [CrossRef]
- Kushwaha, S.K.P.; Dayal, K.R.; Raghavendra, S.; Pande, H.; Tiwari, P.S.; Agrawal, S.; Srivastava, S.K. 3D Digital Documentation of a Cultural Heritage Site Using Terrestrial Laser Scanner—A Case Study. In Applications of Geomatics in Civil Engineering; Ghosh, J.K., da Silva, I., Eds.; Lecture Notes in Civil Engineering; Springer: Singapore, 2020; Volume 33, pp. 49–58. ISBN 9789811370663. [Google Scholar] [CrossRef]
- Cecchi, G.; Pantani, L.; Raimondi, V.; Tomaselli, L.; Lamenti, G.; Tiano, P.; Chiari, R. Fluorescence lidar technique for the remote sensing of stone monuments. J. Cult. Herit. 2000, 1, 29–36. [Google Scholar] [CrossRef]
- Mitchell, J.; Chandrasekera, T.C.; Holland, D.J.; Gladden, L.F.; Fordham, E.J. Magnetic resonance imaging in laboratory petrophysical core analysis. Phys. Rep. 2013, 526, 165–225. [Google Scholar] [CrossRef]
- Grinzato, E.; Marinetti, S.; Bison, P.G.; Concas, M.; Fais, S. Comparison of ultrasonic velocity and IR thermography for the characterisation of stones. Infrared Phys. Technol. 2004, 46, 63–68. [Google Scholar] [CrossRef]
- Grinzato, E. IR thermography applied to the cultural heritage conservation. In Proceedings of the 18th World Conference on Nondestructive Testing, Durban, South Africa, 16–20 April 2012; Volume 46. [Google Scholar]
- Moropoulou, A.; Bakolas, A.; Aggelakopoulou, E.; Pineli, T.; Prassianakis, I.N. Estimation of elastic constants of stones, used in historic monuments, using ultrasonic technique and correlation to their microstructure parameters. In Proceedings of the 3rd International Conference on Non-Destructive Testing of the Hellenic Society for NDT—NDT in Antiquity and Nowadays—Skills-Applications-Innovations, Chania, Greece, 15–18 October 2003; Prassianakis, I.N., Ed.; The Hellenic Society of NDT (HSNT): Athens, Greece, 2003; pp. 242–245. [Google Scholar]
- Casula, G.; Fais, S.; Ligas, P. An experimental application of a 3D terrestrial laser scanner and acoustic techniques in assessing the quality of the stones used in monumental structures. Int. J. Microstruct. Mater. Prop. 2009, 4, 45–56. [Google Scholar] [CrossRef]
- Cuccuru, F.; Fais, S.; Ligas, P. Dynamic elastic characterization of carbonate rocks used as building materials in the historical city centre of Cagliari (Italy). Q. J. Eng. Geol. Hydrogeol. 2014, 47, 259–266. [Google Scholar] [CrossRef]
- Fais, S.; Cuccuru, F.; Ligas, P.; Casula, G.; Bianchi, M.G. Integrated ultrasonic, laser scanning and petrographical characterisation of carbonate building materials on an architectural structure of a historic building. Bull. Eng. Geol. Environ. 2017, 76, 71–84. [Google Scholar] [CrossRef]
- Fais, S.; Cuccuru, F.; Casula, G.; Bianchi, M.G.; Ligas, P. Characterization of Rock Samples by A High-Resolution Multi-Technique Non-Invasive Approach. Minerals 2019, 9, 664. [Google Scholar] [CrossRef] [Green Version]
- Fais, S.; Casula, G.; Cuccuru, F.; Ligas, P.; Bianchi, M.G.; Plaisant, A.; Pettinau, A. A Contribution to the Geological Characterization of a Potential Caprock-Reservoir System in the Sulcis Coal Basin (South-Western Sardinia). Energies 2019, 12, 4524. [Google Scholar] [CrossRef] [Green Version]
- Kahraman, S. Estimating the direct P-wave velocity value of intact rock from indirect laboratory measurements. Int. J. Rock Mech. Min. Sci. 2002, 39, 101–104. [Google Scholar] [CrossRef]
- Vasanelli, E.; Colangiuli, D.; Calia, A.; Sileo, M.; Aiello, M.A. Ultrasonic pulse velocity for the evaluation of physical and mechanical properties of a highly porous building limestone. Ultrasonics 2015, 60, 33–40. [Google Scholar] [CrossRef] [PubMed]
- Vasconcelos, G.; Lourenço, P.B.; Alves, C.A.S.; Pamplona, J. Ultrasonic evaluation of the physical and mechanical properties of granites. Ultrasonics 2008, 48, 453–466. [Google Scholar] [CrossRef] [PubMed] [Green Version]
- Santos-Assunçao, S.; Perez-Gracia, V.; Caselles, O.; Clapes, J.; Salinas, V. Assessment of complex masonry structures with GPR compared to other non-destructive testing studies. Remote Sens. 2014, 6, 8220–8237. [Google Scholar] [CrossRef] [Green Version]
- Anselmetti, F.S.; Eberli, G.P. Sonic Velocity in Carbonate Sediments and Rocks. In Carbonate Seismology; Palaz, I., Marfurt, K.J., Eds.; Society of Exploration Geophysicists: Tulsa, OK, USA, 1997; pp. 53–74. ISBN 978-1-56080-038-5. [Google Scholar] [CrossRef]
- Eberli, G.P.; Baechle, G.T.; Anselmetti, F.S.; Incze, M.L. Factors controlling elastic properties in carbonate sediments and rocks. Lead. Edge 2003, 22, 654–660. [Google Scholar] [CrossRef]
- Fais, S.; Ligas, P.; Cuccuru, F.; Maggio, E.; Plaisant, A.; Pettinau, A.; Casula, G.; Bianchi, M.G. Detailed Petrophysical and Geophysical Characterization of Core Samples from the Potential Caprock-reservoir System in the Sulcis Coal Basin (Southwestern Sardinia—Italy). Energy Procedia 2015, 76, 503–511. [Google Scholar] [CrossRef] [Green Version]
- King, M.S.; Myer, L.R.; Rezowalli, J.J. Experimental studies of elastic-wave propagation in a columnar-jointed rock mass. Geophys. Prospect. 1986, 34, 1185–1199. [Google Scholar] [CrossRef]
- Soete, J.; Kleipool, L.M.; Claes, H.; Claes, S.; Hamaekers, H.; Kele, S.; Özkul, M.; Foubert, A.; Reijmer, J.J.G.; Swennen, R. Acoustic properties in travertines and their relation to porosity and pore types. Mar. Pet. Geol. 2015, 59, 320–335. [Google Scholar] [CrossRef] [Green Version]
- Weger, R.J.; Baechle, G.T.; Masaferro, J.L.; Eberli, G.P. Effects of porestructure on sonic velocity in carbonates. In Proceedings of the SEG International Exposition and 74th Annual Meeting, Denver, CO, USA, 10–15 October 2004; SEG Technical Program Expanded Abstracts 2004. Society of Exploration Geophysicists: Houston, TX, USA, 2004; Volume 23, pp. 1774–1777. [Google Scholar] [CrossRef] [Green Version]
- Siegesmund, S.; Ruedrich, J.; Koch, A. Marble bowing: Comparative studies of three different public building facades. Environ. Geol. 2008, 56, 473–494. [Google Scholar] [CrossRef] [Green Version]
- Antonelli, F.; Lazzarini, L. An updated petrographic and isotopic reference database for white marbles used in antiquity. Rendiconti Lincei 2015, 26, 399–413. [Google Scholar] [CrossRef]
- Westoby, M.J.; Brasington, J.; Glasser, N.F.; Hambrey, M.J.; Reynolds, J.M. ‘Structure-from-Motion’ photogrammetry: A low-cost, effective tool for geoscience applications. Geomorphology 2012, 179, 300–314. [Google Scholar] [CrossRef] [Green Version]
- Snavely, N.; Seitz, S.M.; Szeliski, R. Modeling the World from Internet Photo Collections. Int. J. Comput. Vis. 2008, 80, 189–210. [Google Scholar] [CrossRef] [Green Version]
- Triggs, B.; McLauchlan, P.F.; Hartley, R.I.; Fitzgibbon, A.W. Bundle adjustment—A modern synthesis. In Proceedings of the International Workshop on Vision Algorithms, Corfu, Greece, 21–22 September 1999; pp. 298–372. [Google Scholar]
- Campanella, M.; Rossi, G.; Ruggiero, G. JRC 3D Reconstructor® User Manual; Gexcel, Geomatics and Excellence: Brescia, Italy, 2014. [Google Scholar]
- CloudCompare CloudCompare (Version 2.11 Beta) [GPL Software]. 2020. Available online: http://www.cloudcompare.org/ (accessed on 20 September 2021).
- ISRM. The complete ISRM suggested methods for rock characterization, testing and monitoring: 1974–2006. In Suggested Methods Prepared by the Commission on Testing Methods; Ulusay, R., Hodson, J.A., Eds.; International Society for Rock Mechanics, Compilation Arranged by the ISRM Turkish National Group: Ankara, Turkey, 2007; p. 628. [Google Scholar]
- ISRM. Upgraded ISRM Suggested Method for Determining Sound Velocity by Ultrasonic Pulse Transmission Technique. In The ISRM Suggested Methods for Rock Characterization; Ulusay, R., Ed.; Testing and Monitoring: 2007–2014; ISRM: Cham, Switzerland; Heidelberg, Germany; New York, NY, USA; Dordrecht, The Netherlands; London, UK, 2014; pp. 95–99. [Google Scholar]
- Gilbert, P. Iterative methods for the three-dimensional reconstruction of an object from projections. J. Theor. Biol. 1972, 36, 105–117. [Google Scholar] [CrossRef]
- Trampert, J.; Leveque, J.-J. Simultaneous iterative reconstruction technique: Physical interpretation based on the generalized least squares solution. J. Geophys. Res. 1990, 95, 12553–12559. [Google Scholar] [CrossRef]
- Phillips, W.S.; Fehler, M.C. Traveltime tomography: A comparison of popular methods. Geophysics 1991, 56, 1639–1649. [Google Scholar] [CrossRef]
- Fais, S.; Casula, G. Application of acoustic techniques in the evaluation of heterogeneous building materials. NDT E Int. 2010, 43, 62–69. [Google Scholar] [CrossRef] [Green Version]
- Siegesmund, S.; Menningen, J.; Shushakova, V. Marble decay: Towards a measure of marble degradation based on ultrasonic wave velocities and thermal expansion data. Environ. Earth Sci. 2021, 80, 395. [Google Scholar] [CrossRef]


Publisher’s Note: MDPI stays neutral with regard to jurisdictional claims in published maps and institutional affiliations. |
© 2021 by the authors. Licensee MDPI, Basel, Switzerland. This article is an open access article distributed under the terms and conditions of the Creative Commons Attribution (CC BY) license (https://creativecommons.org/licenses/by/4.0/).
Share and Cite
Casula, G.; Fais, S.; Cuccuru, F.; Bianchi, M.G.; Ligas, P.; Sitzia, A. Decay Detection in an Ancient Column with Combined Close-Range Photogrammetry (CRP) and Ultrasonic Tomography. Minerals 2021, 11, 1114. https://doi.org/10.3390/min11101114
Casula G, Fais S, Cuccuru F, Bianchi MG, Ligas P, Sitzia A. Decay Detection in an Ancient Column with Combined Close-Range Photogrammetry (CRP) and Ultrasonic Tomography. Minerals. 2021; 11(10):1114. https://doi.org/10.3390/min11101114
Chicago/Turabian StyleCasula, Giuseppe, Silvana Fais, Francesco Cuccuru, Maria Giovanna Bianchi, Paola Ligas, and Alessandro Sitzia. 2021. "Decay Detection in an Ancient Column with Combined Close-Range Photogrammetry (CRP) and Ultrasonic Tomography" Minerals 11, no. 10: 1114. https://doi.org/10.3390/min11101114