Article

The Effect of X-ray Energy Overlaps on the Microanalysis of Chevkinite (Ce, La, Ca, Th)4(Fe2+, Mg)2(Ti, Fe3+)3Si4O22 Using SEM EDS-WDS

1
Environmental Science Centre, British Geological Survey, Nicker Hill, Keyworth NG12 5GG, UK
2
Oxford Instruments NanoAnalysis, High Wycombe HP12 3SE, UK
3
The Lyell Centre, British Geological Survey, Research Avenue South, Edinburgh EH14 4AP, UK
*
Author to whom correspondence should be addressed.
Minerals 2021, 11(10), 1063; https://doi.org/10.3390/min11101063
Submission received: 2 July 2021 / Revised: 24 September 2021 / Accepted: 27 September 2021 / Published: 28 September 2021
(This article belongs to the Special Issue Electron Microbeam and X-ray Techniques: Advances and Applications)

Abstract

:
A light REE (LREE)-bearing mineral called chevkinite (Ce, La, Ca, Th)4(Fe2+, Mg)2(Ti, Fe3+)3Si4O22, originating from a heavy metal placer deposit Aksu Diamas in Turkey, previously assessed for potential REE extraction as a by-product of magnetite production, was studied using scanning electron microscopy with energy and wavelength-dispersive spectrometers (SEM EDS-WDS). This mineral exhibits analytical challenges associated with severe X-ray energy overlaps between the REE, titanium, and barium. Here, we present an iterative process, showing that SEM EDS-WDS is a viable technique for obtaining good quality quantitative data. SEM EDS-WDS is an in situ, non-destructive, and relatively non-expensive technique, but operator’s experience is essential to obtain good quality data. In cases where the peak fitting remains challenging, in particular, and where the constituents have large differences in abundance, an assessment of the X-ray spectrum to qualitatively assign all peaks is essential prior to quantitative analysis.

1. Introduction

Rare Earth Elements (REE) are currently of significant economic importance due to high demand for their use in the energy and technology, sectors, including neodymium–iron–boron (NdFeB) magnets for electric vehicles or La-series glass for optical lenses in smartphones and tablets [1]. Concerns regarding supply interruption [1] classify these elements as critical raw materials [2,3]. REE occur in a range of ore deposits with minerals including silicates, carbonates, and phosphates. Primary global resources of the REE are dominantly hosted in carbonatite [4] and alkaline igneous intrusions [5]. In these lithologies, the REE are hosted by a range of minerals including bastnäsite, monazite, and others (Table 1), with carbonatites being the main source of light REE (LREE = lanthanum to gadolinium) [3]. Global resources of heavy REE (HREE = yttrium to lutetium inclusive) are dominantly sourced from Chinese secondary regolith-hosted (weathered carbonatite and soil) ion-adsorption deposits, in which the REE are inferred to be weakly adsorbed onto clay minerals [3,6]. The demand for the REE drives research into new and/or alternative sources of these elements and into methods for their investigation. Here, we provide details of the microanalytical investigation of chevkinite-(Ce). Samples originated from the heavy mineral placer deposit Aksu Diamas in Turkey, which has been assessed for potential REE extraction as a by-product of magnetite production [7]. The REE content in chevkinite is dominated by the LREE [8], making chevkinite a potential future resource of the LREE [7].
Chevkinite belongs to the Chevkinite Group Minerals (CGM) that are titanium- and REE-bearing silicates reported from a wide variety of lithologies, including mafic to felsic intrusive and extrusive igneous rocks [9], high-grade metamorphic rocks [10], metasomatic rocks [11], and lunar basalts [12]. The CGM display complex crystal chemistry, with a general formula of A4BC2D2(Si2O7)2O8, where A→(LREE, Y, Ca, Sr, Th); B→(Fe2+, Mn2+, Mg2+); C→(Fe2+, Fe3+, Ti, Al, Zr, Mg, Nb, Mn); and D→(Ti) [13,14,15]. This chemical complexity, and the common presence of specific trace elements, can be used to fingerprint geochemical processes and/or lithological facies. The high REE contents in CGM, in some cases reaching 50 wt% (as REE2O3), make them a good candidate for future LREE resources. The complex crystal chemistry, especially the presence of REE and Ti as major elements and Ba and V as trace elements (<1 wt%), causes analytical challenges when chevkinite is analysed using energy and wavelength-dispersive X-ray spectrometry in an electron probe microanalyser (EPMA) or scanning electron microscope (SEM).
This paper presents the evaluation of analytical protocol for the use of SEM Energy-Dispersive–Wavelength-Dispersive Spectrometry (SEM EDS-WDS), with a focus on X-ray energy overlaps in the range of 4.5 and 5 keV (2.7–2.4 Å wavelength). Although the EPMA is commonly accepted as the “gold standard” for quantitative microanalysis of REE-bearing minerals, including CGM, SEM EDS-WDS is a useful alternative method for microanalysis of such minerals. First, there are many more SEMs available, although not all SEMs are equipped with WDS analytical capability; in the UK’s University Earth Science departments, there are approximately 45 SEM instruments vs. approximately 13 EPMA. Secondly, EPMA and expert operation is not always logistically and financially viable. Finally, SEM can offer other high-resolution imaging, superior contextual imaging, and an easier user interface. The multi-technique approach is important to the thorough understanding of materials and processes at micro- and nano-scale, from which inferences on large-scale systems and processes can be made. Contextual data for the chevkinite analysed here is presented in Deady et al. [7].

1.1. Brief Introduction to SEM EDS-WDS

The quantitative analysis of simple combinations of LREE by EDS has long been established [16], but complex mixtures of REE have been much more challenging. A detailed evaluation of the silicon drift detector EDS (SDD EDS) system for performing high accuracy and precision microanalysis is given by Newbury and Ritchie [17].
EDS provides fast, accurate results for major (>10 wt%) and many minor (1–10 wt%) elements, and continuous system developments enable users to solve increasingly complex quantitative analytical challenges [18]. The development of SDD and associated analytical advancements (fast pulse processors, data transfer speeds, software refinement) make the accuracy and precision of SDD-EDS derived data comparable to that of EPMA equipped with several WDS detectors [17,19]. Advantages of WDS include [1] measurement of minor and trace elements (<1 wt%) especially when concentrations are below 0.1 wt% [20]; and [2] superior spectral resolution to EDS (0.01 keV vs. 0.145 keV at Mn Kα, in our system), reducing peak interferences. Therefore, an SEM with SDD-EDS and WDS detectors is a powerful tool for the contextual quantitative analysis of chemically and texturally complex and challenging geological materials [21]. It is imperative that a careful SEM EDS-WDS measurement must also follow some EPMA procedures [17]. This includes the well-polished surface for samples and standards, which improves the precision and accuracy of the analytical results [17]. Additionally, the surfaces of samples and standards must be placed at the identical working distance (i.e., the distance from the electron beam column to the sample surface) and inclination, so that the take-off angle is optimal for the application of matrix correction protocols.

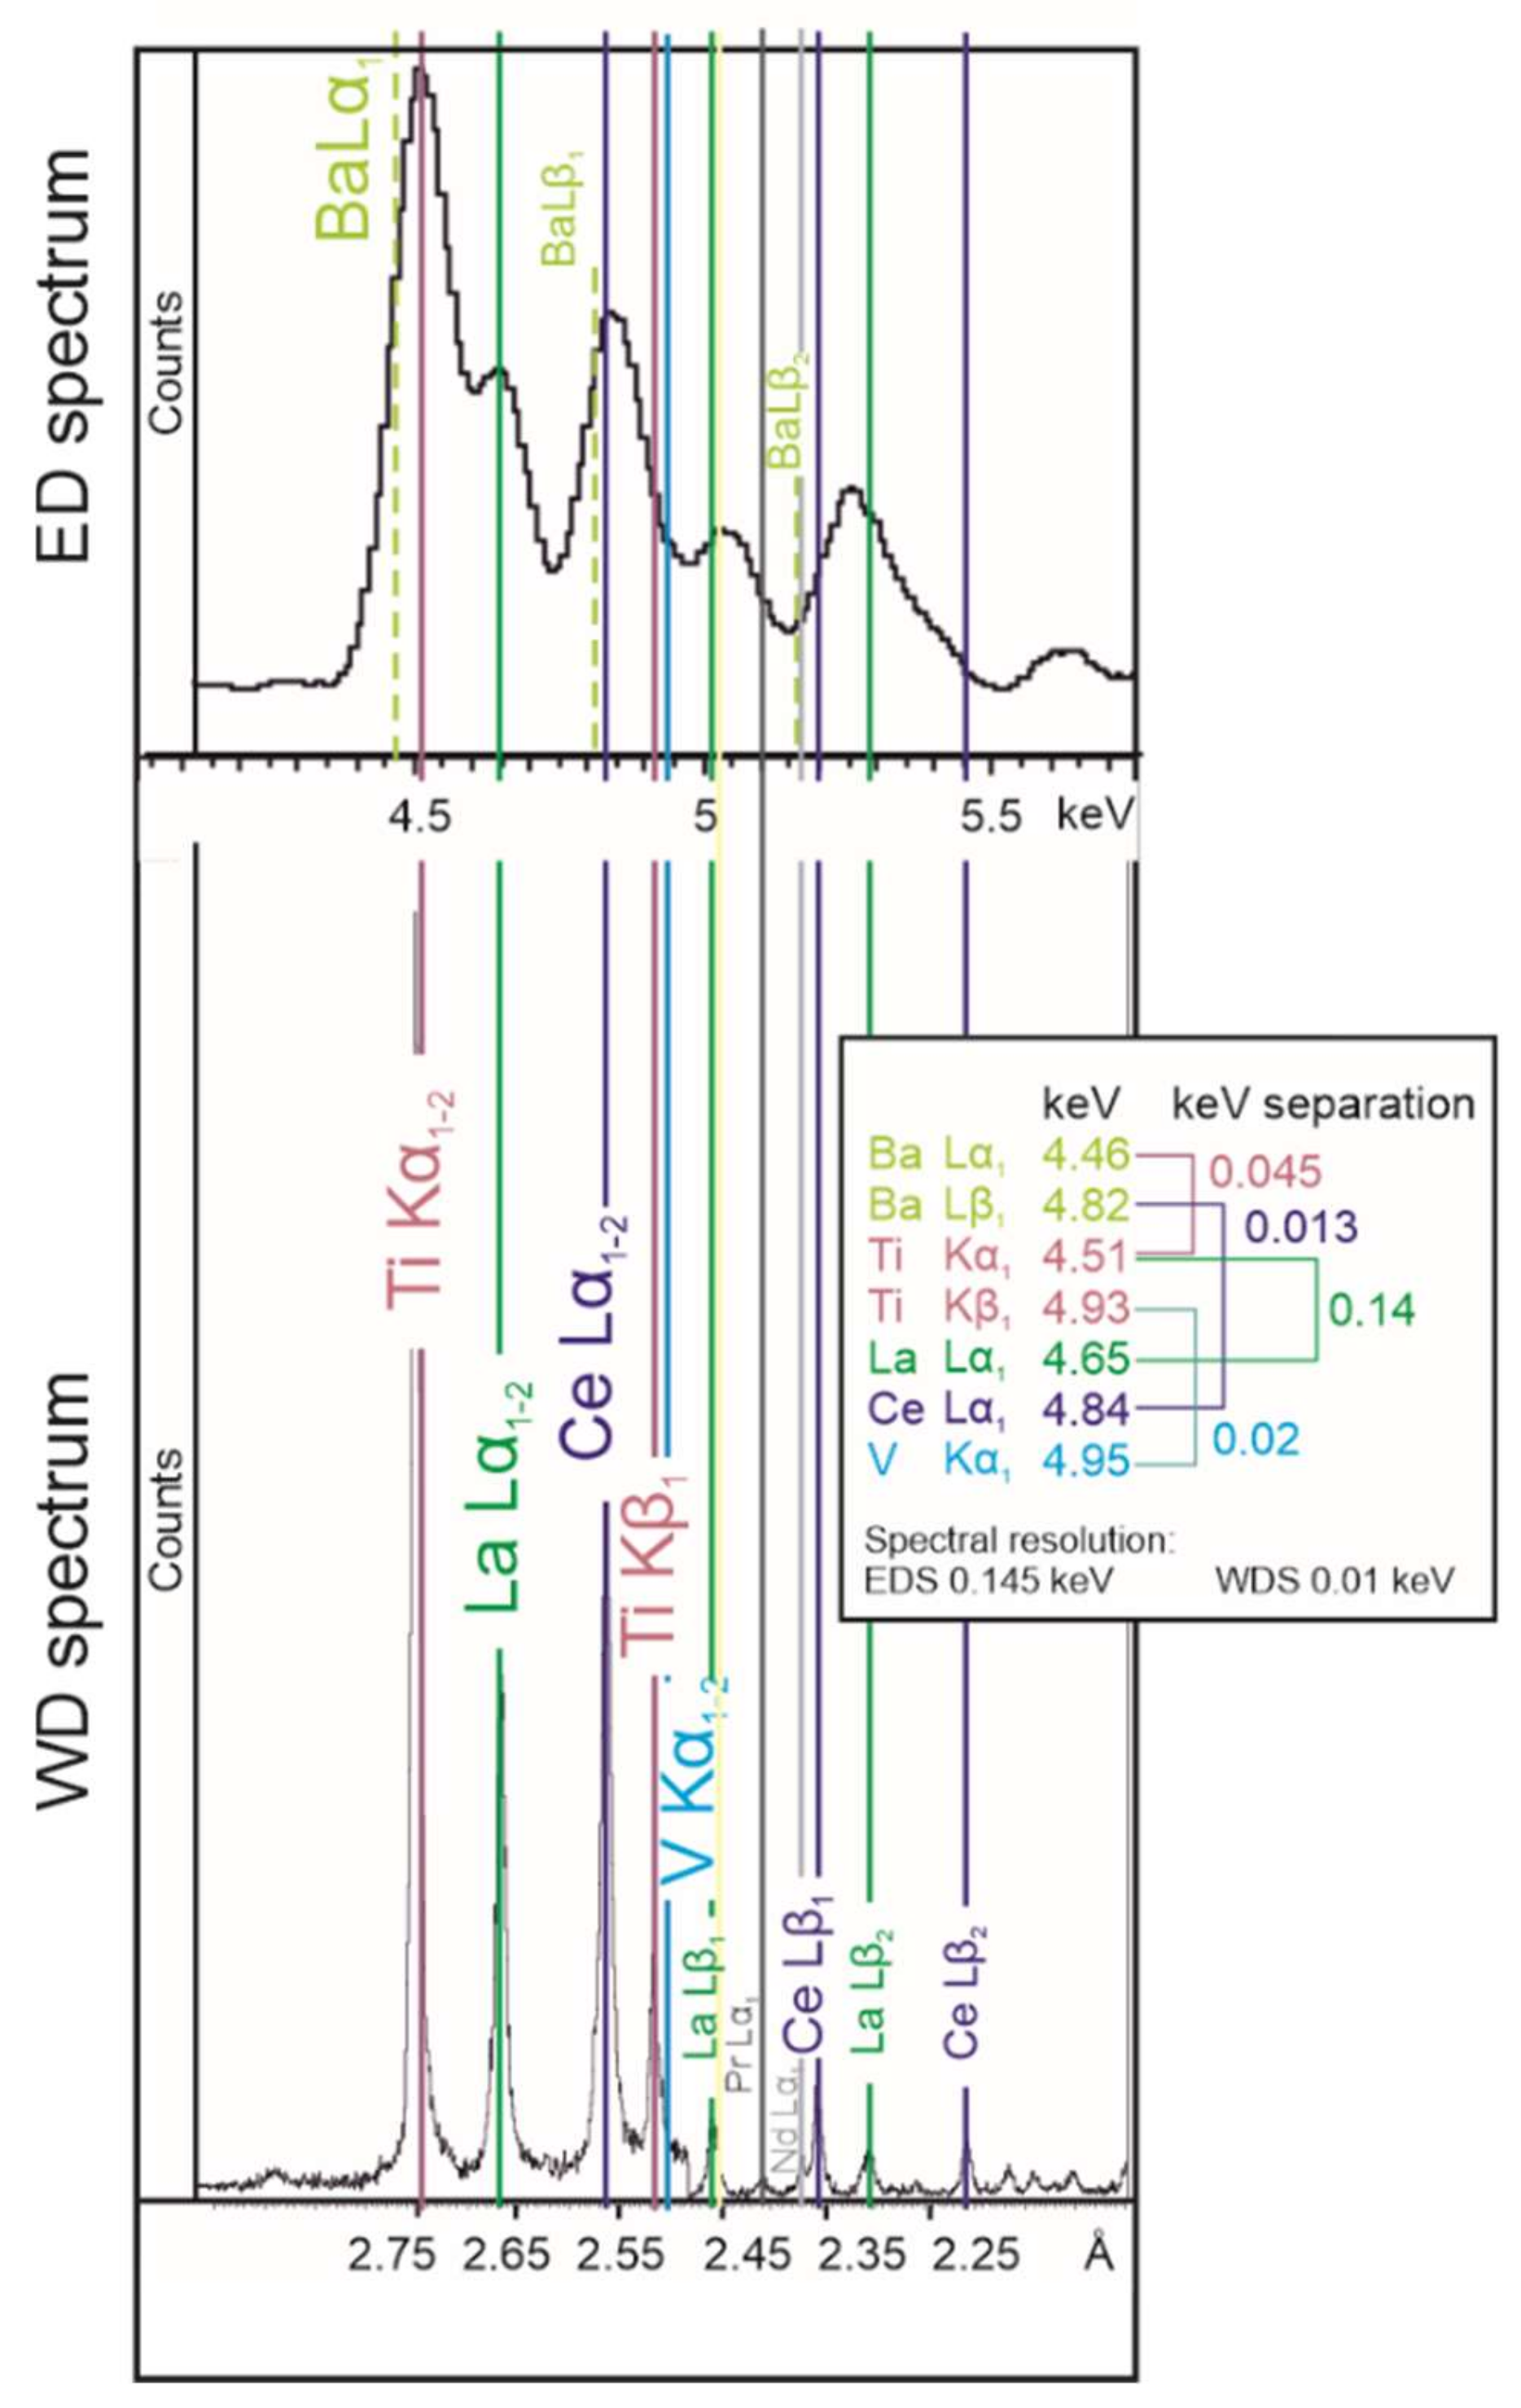
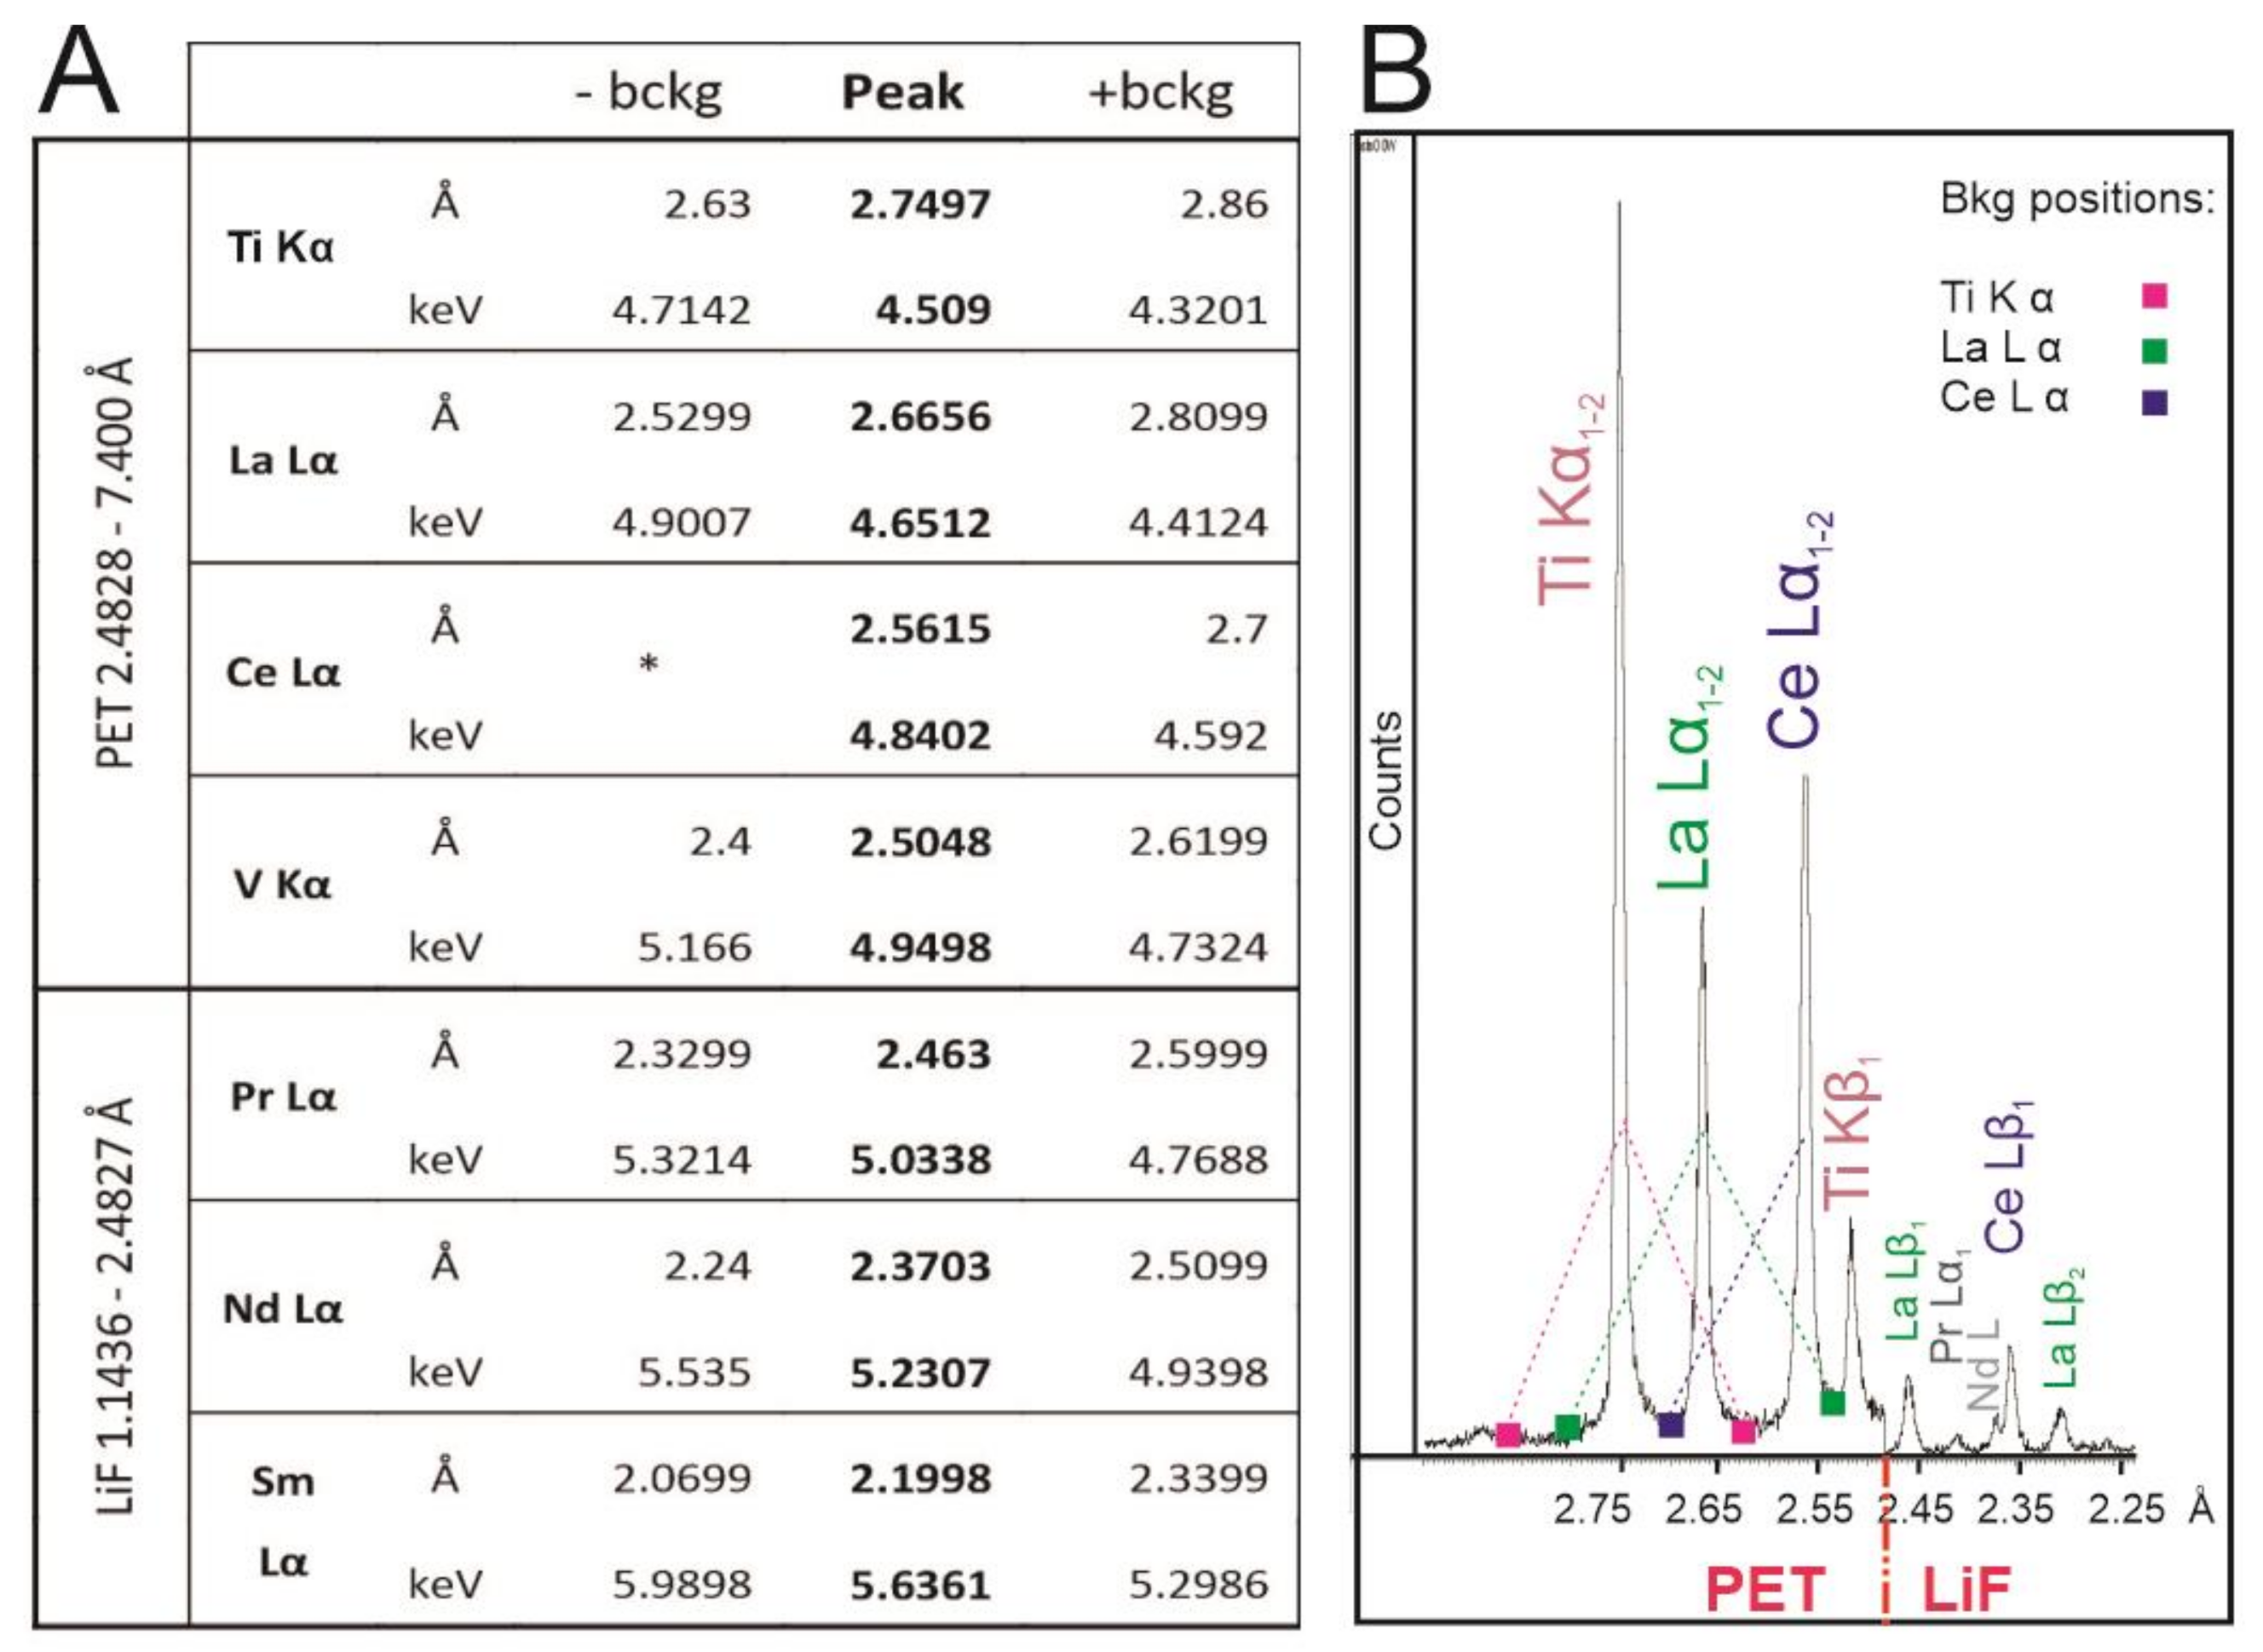
1.2. X-ray Energy Overlaps between 4.5 and 5 keV (2.7–2.4 Å Wavelength)

Major elements REE and Ti and trace elements Ba and V in chevkinite have severe and complex X-ray energy overlaps in EDS’s 4.5 to 5 keV spectral region. The REEs, commonly called lanthanides, comprise 15 elements with atomic number Z from 57 (La) to 71 (Lu) [3]. Among them, Pm (Z = 61) is rare and unstable in nature. Yttrium (Z = 39), although not a REE, shares similar chemical and physical properties with the heavy lanthanides and typically occurs in the same deposits as other REEs; therefore, it is grouped with the HREE [3].
In X-ray spectroscopy, the extremely complex L-line families of REE spread over a range of energies, making WDS peak and background determination and measurements a challenge [22,23]. LREE X-ray lines are mostly resolvable by WDS. On the other hand, EDS is unable to resolve the peak overlaps with Pr, Eu, Gd, Ho, Er, Tm, and Lu [24]. Peak overlaps in an EDS spectrum create combined peaks of non-ideal shapes, and element identification and quantification by EDS is dependent on the ability to mathematically deconvolve the constituent peaks. Therefore, results are subject to software deconvolution limitations, which yields significant uncertainties in both qualitative and quantitative analyses, especially for minor elements. A detailed study on Ba and Ti overlaps in barium titanate (BaTiO3), benitoite (BaTiSi3O9), and Ba–Ti–Si–O glasses using the ‘NIST DTSA-II’-EDS software demonstrated that SDD-EDS is capable of achieving results comparable to WDS in some severe overlap cases [17]. However, EDS peak fitting is especially challenging when the elements have significantly different concentrations in the analysed volume. Due to the presence of significant minor X-ray peaks associated with major elements, analysis of an unknown must be performed iteratively [25]. In this study, the most significant challenges in the analysis are due to large differences in concentration, including: (i) deconvolution of overlapping peaks originating from major elements (Ti, La, and to lesser extent Ce); (ii) interference in background measurements from peaks of lower relative intensity (Pr, Nd, V, +/−Ba); and (iii) minor and trace element detection in the overlapping peaks region (Ba and V).
The principal peak interferences for chevkinite in our study are among the first few LREE (La, Ce, Pr, Nd) with multiple Lα lines (4.651–5.208 keV), Ti multiple K lines (4.511–4.932 keV), Ba multiple L lines (4.466–5.157 keV), and V multiple K lines (4.952–5.427 keV). The peak separation in this region is difficult and largely unresolvable with the lower resolution EDS systems. The resolution of the EDS system in British Geological Survey (BGS, Nottingham, UK) (based on the ‘full width at half height’ (FWHM) of the Mn Kα X-ray peak, 5.9 keV), was 145 eV under actual analytical conditions, contrasting with the 10 eV resolution of a typical WDS system. The peak separations between the element of concern are illustrated in Figure 1.
The main aim of this work was to develop a protocol for the combined SEM EDS-WDS analysis of major, minor, and trace elements present in minerals that exhibit complex and severe X-ray energy overlaps, using chevkinite as an example of peak interferences between 4.5 and 5 keV (2.7–2.4 Å wavelength). In particular, we present an iterative analysis of a dataset derived from Oxford Instruments software on an unknown material, to understand the sequence of steps necessary to ensure high-quality results. To make it applicable to other EDS system manufacturers, acronyms and procedure names used by Oxford Instruments are explained in the text.

2. Materials and Methods

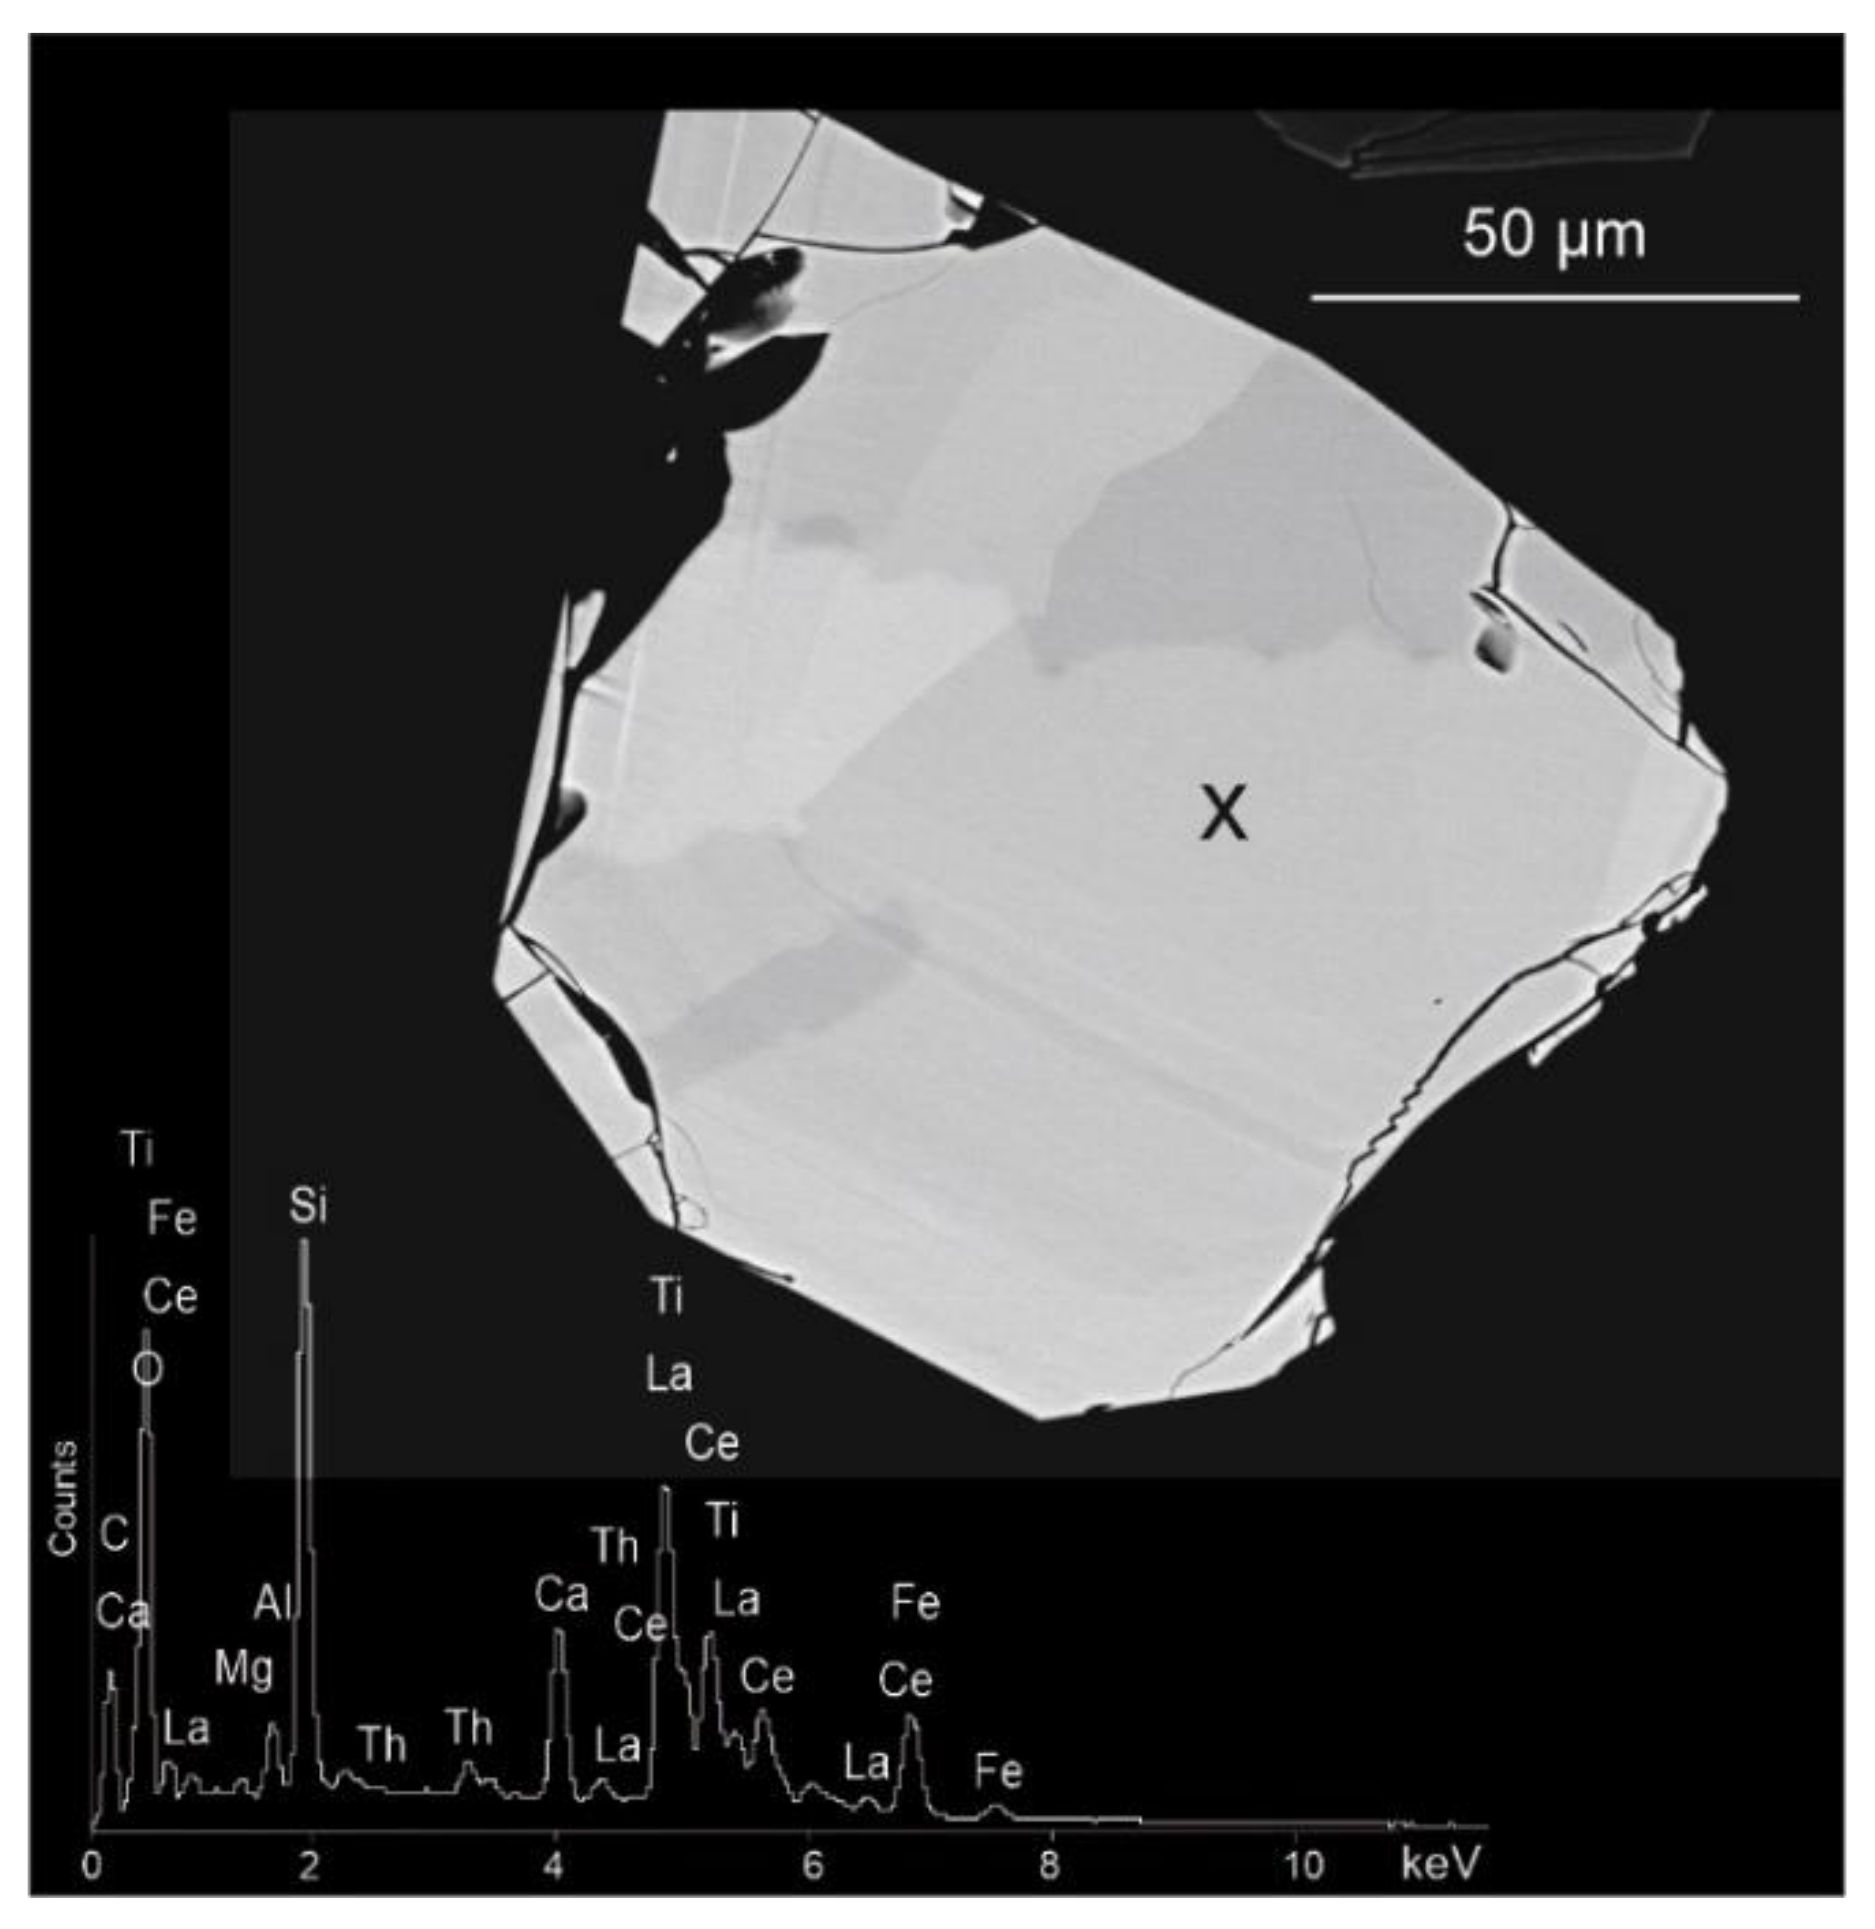
2.1. Samples and Preparation

The chevkinite grains analysed in this study were from the Aksu Diamas iron–REE placer deposit in Turkey [7]. Samples were sieved to collect the 125–250 μm size fraction. After manual removal of the magnetite using a handheld magnet, the heavy minerals were separated using a Frantz isodynamic magnetic separator at the Natural Environment Research Council (NERC) Isotope Geosciences Laboratory (NIGL), Keyworth, UK. Both the magnetic and non-magnetic fractions were sampled. The separated heavy minerals were prepared as polished thin sections at the BGS. These sections were coated with a 25 nm layer of carbon to ensure sample conductivity prior to analysis.

2.2. Analytical Equipment

The SEM used in this study was an FEI Quanta 600 SEM (FEI, Hillsboro, OR, USA) fitted with an Oxford Instruments X-Max 50 mm2 SDD for EDS, and INCAWave 500 spectrometer (Oxford Instruments, Abingdon, UK) for WDS, running Oxford Instruments INCA (v4) software. INCA software applies XPP (Pouchou and Pichoir) matrix correction methods [26] and uses an iterative filtered least squares fit to include background removal for peak deconvolution [27]. The SEM was operated at high vacuum of ca. 1 × 10⁻³ Pa, 10 mm working distance (optimal for the detector geometry in the FEI Quanta 600 sample chamber), 20 kV accelerating voltage, and 10 nA beam current, with both EDS and WDS detectors having take-off angles of 35°. An EDS process time of 4 (on the scale of 1–6, where 1 represents the shortest process time, and longer process times result in fewer collection artefacts, narrower peaks, and better peak to background response) resulted in deadtimes <45%, within the linear response range of the X-max SDD. The images of the phases were acquired using the backscatter electron (BSE) detector, displaying contrast that is proportional to average atomic number [28].
INCAWave 500 is a horizontal-inclined fully focusing WDS spectrometer with a geometry similar to EDS. The focus was obtained by fixing the Working Distance (WD = 10 mm in our case) and adjusting the stage height until a sharp image at high magnification is achieved. As long as the sample is in focus for EDS analysis, it is also in focus for WDS data acquisition. The WDS spectrometer uses the diffracting crystal to focus the characteristic X-ray into the detectors.

2.3. Method: SEM EDS-WDS

Chevkinite crystals were located in the polished thin section using a dedicated particle search software (INCA Feature), making use of the higher BSE brightness of the chevkinite than most of the other phases present. An initial assessment of their compositional characteristics based on BSE imaging at min ↔ max brightness ↔ contrast conditions, EDS spectra, X-ray element distribution maps, and WDS scans over selected spectral regions revealed that many of the crystals displayed strong chemical heterogeneities, mainly related to the variable amounts of Th and Fe. The heterogeneities reflect both growth and alteration histories (Figure 2). Then, analytical sites were chosen in homogeneous areas in crystals with low complexity avoiding boundaries, as well as inclusions, defects, and grain margins.
Prior to quantitative microanalysis, the SEM beam current was monitored for its stability for approximately 180 min, with the electron beam in spot mode placed in a Faraday Cup mounted on the sample holder and measured using the SEM system’s specimen current monitor. Once the beam became stable (<±1% beam current variation in 30 min), the beam current was recorded for the WDS detector. Then, an ‘INCA quant optimisation’ was performed to calibrate the EDS detector to determine all other peaks accurately on the day. This required the acquisition of a high-quality EDS spectrum from a suitable element (in our case cobalt) from which details of the beam current and spectrometer gain are calculated and stored (Oxford Instruments, INCA, 2006).
Both EDS and WDS systems were used in user-calibrated mode. The materials used to calibrate the EDS system are listed in Table 2. A count time of 60 s real time was used for EDS quantification, with process time set to 4. Calibration was regularly checked against a secondary mineral standard. It is appreciated that the standards should ideally reflect the composition of the unknown mineral analysed, but for the chevkinite mineral, this is challenging. For this purpose, two types of standards have been used: manufactured REE glasses standards [29] and BGS in house standard, augite pyroxene, which are both frequently analysed by CAMEXA SX50 electron microprobe and SEM-EDS systems at BGS in the past [7,16,30]. Procedures used for the SEM-EDS quantitative microanalysis were in line with those recommended by the ASTM Standard [31].
For the WDS analysis, pure element and compound standards were used (Table 2). The WDS system was re-calibrated every 24 h to accommodate changes in ambient temperature conditions. The INCAWave multi-crystal spectrometer changes crystals on-the-fly rather than first moving to a specified position on the Rowland circle, flipping to the appropriate crystal, and moving back to the correct position on the circle for analysis of the desired element. These steps reduce the potential drift of peak positions caused by crystal flipping or temperature fluctuations.
The WDS analysis was performed using one horizontal-inclined spectrometer and two diffracting crystals: PET for Ti, La, Ce, Sr, Ba, and V, and LiF (200) for Pr, Nd, and Sm. Although it is appreciated that Ce could potentially be susceptible to interferences from Ba and Ti when run by PET and not LiF, the spectral range of LiF (200) crystal used here, i.e., 1.1436–2.4827 Å, precluded its use for Ce Lα at 2.5615 Å. However, Ce is a major element in chevkinite and has previously been successfully analysed by PET crystal from minerals [32].
The counting times on the peak/background varied depending on the concentration, with 60/30 s for minor and trace elements and 20/10 s for major elements, respectively (Table 2). The peak and background positions for elements analysed are shown in Figure 3.
To track and account for beam variation throughout the analytical process, beam current analysis was performed approximately every 90 min, bracketing sets of EDS and WDS analyses. Typically, on the unknown material, with nine elements being measured on WDS (under the conditions of Table 2), this represented beam checks every three analyses. Beam current measurement every analysis on unknown would involve another variable related to the re-location of exactly the sample analytical spot.

3. Results

3.1. Resolution of Analytical Problems Relating to Peak Overlaps

This section considers one dataset obtained using SEM EDS-WDS, which was processed iteratively in the INCA software in six different ways (i.e., scenarios) to illustrate (1) challenges arising from X-ray energy overlaps and (2) the importance of compositional screening of a material, where previous knowledge of the composition is unavailable.
The challenges include analysing La and Ce using EDS or WDS, and detection of Ba with different processing scenarios (Table 3). It is noted that Ba, which can be present in chevkinite, especially in the altered crystals [33] was identified during automatic peak search by the EDS part of INCA software (at 0.9 wt% BaO) but was not detected by WDS during separate checks. However, it was added here as an EDS-detected element to illustrate the associated errors possible, when prior knowledge of mineral chemistry is unavailable.
  • Scenarios 1 and 2. La, Ce, and Ti were analysed by EDS as major elements in the chevkinite [8,34,35]; Pr, Nd, Sm, Eu, Gd, V, and Sr were analysed by WDS. Ba was added based on EDS in scenario 1 or removed in scenario 2. This approach resulted in repeatedly high analytical totals (>101%) arising from multiple X-ray energy lines interference, which the INCA EDS was unable to deconvolve accurately (Table 3). The greatest analytical challenges were caused by the identification of Ba and the overlaps of Ba Lα1 with Ti Kα1 with only 45 eV separation, Ba Lα2 with Ti Kα2 with 54 eV separation, and Ba Lα2 with Ti Kα1 with 60 eV separation. The INCA automatic peak determination/fitting of the EDS data has misidentified the presence Ba at approximately 0.9 wt% of BaO and at the same time reduced the measured content of Ti by approximately 0.3 wt% TiO2, when compared to scenario 2 that did not include Ba in the data processing. Then, this overlapping pair has cascaded down to the Ti Kα1–La Lα1 overlap with 0.14 keV separation, by slightly overestimating the amount of the latter in the materials. Finally, Ba Lβ1 interferes with Ce Lα1 (0.013 keV separation) and when added to processing, the misidentification of Ba causes underestimation of the Ce content.
  • Scenarios 3 and 4. La, Ce, Pr, Nd, Sm, Eu, Gd, V, and Sr were analysed by WDS; and Ti was analysed by EDS. Ba was added based on EDS in scenario 3 or removed in scenario 4. The contents of La and Ce by WDS are not affected by the misidentification of Ba but are notably lower when compared with the EDS-derived values. The Ba-Ti interference resembles scenarios 1 and 2.
  • Scenarios 5 and 6. Ti, La, Ce, Pr, Nd, Sm, Eu, Gd, V, and Sr were analysed by WDS. Ba was added based on EDS in scenario 5 and removed in scenario 6. As expected, when Ti is analysed by WDS, there is no interference between Ti and Ba. When Ba is added to the processing as an EDS-derived element, it affects the analytical totals but has no effect on the content of Ti. The dataset of scenario 6 was also assessed for overlaps between major element Ti Kβ1 (4.932 keV) and trace element V Kα1 and Kα2 (4.952 and 4.945 keV). Although the EDS measured content of Ti does not change, this overlap affects V mostly and results in more than 100% increase in EDS-calculated content, i.e., V2O5 contents from 0.27 wt% by WDS to 0.56 wt% by EDS. The errors at trace level are significant (Table 5), confirming that INCA automatic peak determination/fitting of the EDS data overestimates or misidentifies trace elements when peaks overlap, similarly to the Ba-Ti overlapping discussed above. It is likely that this mis-fitting will also affect the Si Kα1 (1.740 keV) and Sr Lα1 (1.806 keV) pair in chevkinite, which requires further investigation. The contents from scenario 6 are the same as those from scenario 4, suggesting that as long as we eliminate the interference from Ba (either absent or to be analysed by WDS) and analyse V by WDS, it is feasible to analyse Ti as an EDS element. This is useful for the most pragmatic, less-time consuming analysis, while providing a high-quality dataset.
Although the differences presented in Table 3 fall within analytical errors (<2% for major elements), it is important to understand the origin of the errors and to have optimised practical solutions, especially for SEM-based systems without WDS. These observations show that despite advancements in the software development, peak fitting remains problematic, especially when elemental concentrations are significantly different in the analysed volume [17]. Furthermore, in minerals with such complex crystal chemistry and multiple X-ray energy overlaps, an iterative assessment of the spectrum to qualitatively assign all peaks is essential prior to quantitative analysis. Failure to do so renders the entire measurement invalid [25]. The qualitative assessment can be facilitated in two ways: (1) analysis of the “residual spectrum” that remains after peak fitting has removed all the characteristic X-ray peaks of the identified elements [25,36] and/or (2) by performing preliminary WDS screening analysis, but knowledge of mineral chemistry is required to choose the possible elements for WDS screening. In the INCA software, there is no residual spectrum option, but the unidentified peaks in the spectrum can be assessed using spectrum reconstruction overlay [27]. However, this is not viable where the X-ray overlap is tighter than the resolution of the EDS system. Thus, in our study, Ba (closely overlapping with Ti) had to be confirmed by WDS. The output from the preliminary assessment is integral to the accurate quantitative analysis of the unknown.

3.2. Optimal Practical Analytical Protocol

Unlike in the EPMA with in-column Faraday Cup, the shifting of the beam in an SEM with thermionic-emission gun and the Faraday Cup located outside the electron column must be monitored by checking the beam current stability. If there is a >1% drift in the beam current, ‘quant optimisation’ of the cobalt standard for EDS and a fresh beam current measurement for WDS must be performed. The frequency of this will depend on the stability of an instrument and its gun setup. This imposes limitations to the duration of data collection from one field but with an appropriate electron source set-up (sufficient time to warm up and centering to enable highest electron yield), the typical drift observed during our measurements was <1% over 120 min. This gave us confidence to proceed with analyses that lasted 30 min per analytical point.
The iterative data processing presented above in scenarios 1–6 (Table 3) determined the elements that need to be analysed by WDS to allow for X-ray energy overlap-free EDS results. The elements analysed by WDS included La, Ce, Ti, Pr, Nd, Sm, Ba, V, and Sr; with the remaining analysed by EDS (Table 4). In this study, with only one WDS detector available, the data acquisition from one data point took approximately 30 min to complete, and beam monitoring was done after three data points, i.e., every 90 min.

3.3. Estimation of Precision (Reproducibility)

Previous work [30] on REE-bearing minerals suggests that for major elements in a silicate, precision (at 2 × sigma, 95.45% confidence) is better than 2%. For the REE in silicates with 3–4 wt% of total REE, the precision is better than 6%. In this study, additional estimation of precision was done using chevkinite crystals, with three 30 min replicate analyses (Table 5). Based on 2 sigma, the calculated precision falls <3% for major elements (EDS) but increases significantly with decreasing content of a particular element. The empirical precision calculated on replicate analyses agrees with INCA software-derived values based on counting statistics.

4. Conclusions

The demand for REE to support the transition to a low-carbon future drives research into new and/or alternative sources of these elements, and thus into methods for investigating REE. In this study, we provide a detailed microanalytical investigation of chevkinite using SEM EDS-WDS. The REE in chevkinite are predominantly LREE [8] representing a potential resource of the LREE in other areas of alkaline volcanism [7].
The REE are a group of chemically similar elements, with very similar atomic structure and configuration of electron shells. Upon the excitation by an electron beam, the transitions of electrons between the electron shells produce X-rays with similar and overlapping energies, making analysis using the relatively low-resolution of EDS difficult. The overlapping peaks in EDS are commonly resolved with much higher resolution WDS. With the advanced SDD EDS systems, quantitative analysis of minerals with high accuracy and high precision can be obtained using standard SEM EDS-WDS. However, we have demonstrated that despite sophisticated EDS software, the EDS peak fitting remains challenging and problematic, especially when the elements have overlapping X-ray lines and significantly different concentrations in the analysed volume, e.g., Ti and La as major elements and Ba and V as potential trace elements in chevkinite in this study. It is essential to accurately assign all peaks of the X-ray spectrum prior to quantitative analysis. When the X-ray overlaps are tighter than the resolution of the EDS systems, WDS analysis is critical. We further demonstrated that combined EDS-WDS approach based on SEM is an adequate technique for quantitative microanalysis of complex minerals, such as the CGM. Choices for quantitative analysis of minerals between EPMA and SEM EDS-WDS depend on (1) research needs, i.e., trace element complex microanalysis (e.g., for dating) versus a contextual analysis of major and minor element; (2) logistical access to EPMA or SEM EDS-WDS; and (3) the need for contextual perspective (both spatial and textural) to any microanalytical data that are of importance to the thorough understanding of materials and processes at the nano- and micro-scales, from which inferences can be made on systems and processes at a macro-scale.

Author Contributions

A.L. performed the analytical work, protocol development, data interpretation and manuscript preparation, J.R. assisted with protocol development, data acquisition, and interpretation, S.B. provided insights into data interpretation, E.A.D. provided materials, contextual data to the REE deposits, and G.T. assisted with data acquisition. All authors have been involved in manuscript revision. All authors have read and agreed to the published version of the manuscript.

Funding

This research received no external funding.

Acknowledgments

The work was supported by the British Geological Survey Innovation Flexible Fund and was performed in the Petrography and Microanalysis Laboratory of the British Geological Survey. The authors would like to thank Simon Chenery (BGS) for providing constructive comments that have enhanced this paper, Michael Styles whose comments strengthened the manuscript and John Fletcher for the preparation of high-quality polished thin sections that enabled collection of the SEM EDS-WDS data. The authors would also like to acknowledge all anonymous reviewers, whose comments and suggestion improved this manuscript significantly. All authors publish with the permission of the Executive Director of the British Geological Survey [UKRI 2021].

Conflicts of Interest

The authors declare no conflict of interest.

References

  1. Goodenough, K.M.; Wall, F.; Merriman, D. The Rare Earth Elements: Demand, Global Resources, and Challenges for Resourcing Future Generations. Nat. Resour. Res. 2018, 27, 201–216. [Google Scholar] [CrossRef] [Green Version]
  2. European Commission. Critical Raw Materials Resilience: Charting a Path towards Greater Security and Sustainability; European Commission: Brussels, Belgium, 2020. [Google Scholar]
  3. Van Gosen, B.S.; Verplanck, P.L.; Seal, R.R., II; Long, K.R.; Gambogi, J. Rare-Earth Elements. In Critical Mineral Resources of the United States—Economic and Environmental Geology and Prospects for Future Supply; Schulz, K.J., DeYoung, J.H., Jr., Seal, R.R., II, Bradley, C.D., Eds.; U.S. Geological Survey Professional Paper; U.S. Geological Survey: Washington, DC, USA, 2017. [Google Scholar]
  4. Verplanck, P.L.; Mariano, A.N.; Mariano, A., Jr. Rare earth element ore geology of carbonatites. Rev. Econ. Geol. 2016, 18, 5–32. [Google Scholar]
  5. Dostal, J. Rare Earth Element Deposits of Alkaline Igneous Rocks. Resources 2017, 6, 34. [Google Scholar] [CrossRef]
  6. Borst, A.M.; Smith, M.P.; Finch, A.A.; Estrade, G.; Villanova-De-Benavent, C.; Nason, P.; Marquis, E.; Horsburgh, N.J.; Goodenough, K.M.; Xu, C.; et al. Adsorption of rare earth elements in regolith-hosted clay deposits. Nat. Commun. 2020, 11, 4386. [Google Scholar] [CrossRef]
  7. Deady, E.; Lacinska, A.; Goodenough, K.M.; Shaw, R.A.; Roberts, N.M.W. Volcanic-Derived Placers as a Potential Resource of Rare Earth Elements: The Aksu Diamas Case Study, Turkey. Minerals 2019, 9, 208. [Google Scholar] [CrossRef] [Green Version]
  8. Macdonald, R.; Belkin, H.E. Compositional variation in minerals of the chevkinite group. Mineral. Mag. 2002, 66, 1075–1098. [Google Scholar] [CrossRef]
  9. Vazquez, J.A.; Velasco, N.O.; Schmitt, A.K.; Bleick, H.A.; Stelten, M.E. U-238-Th-230 dating of chevkinite in high-silica rhyolites from La Primavera and Yellowstone calderas. Chem. Geol. 2014, 390, 109–118. [Google Scholar] [CrossRef]
  10. Belkin, H.E.; Macdonald, R.; Grew, E.S. Chevkinite-group minerals from granulite-facies metamorphic rocks and associated pegmatites of East Antarctica and South India. Mineral. Mag. 2009, 73, 149–164. [Google Scholar] [CrossRef] [Green Version]
  11. Macdonald, R.; Baginski, B.; Kartashov, P.; Zozulya, D.; Dzierzanowskii, P. Chevkinite-group minerals from Russia and Mongolia: New compositional data from metasomatites and ore deposits. Mineral. Mag. 2012, 76, 535–549. [Google Scholar] [CrossRef]
  12. Muhling, J.R.; Suvorova, A.A.; Rasmussen, B. The occurrence and composition of chevkinite-(Ce) and perrierite-(Ce) in tholeiitic intrusive rocks and lunar mare basalt. Am. Mineral. 2014, 99, 1911–1921. [Google Scholar] [CrossRef]
  13. Ito, J.; Arem, J.E. Chevkinite and perrierite—Synthesis, crystal growth and polymorphism. Am. Mineral. 1971, 56, 307–319. [Google Scholar]
  14. Gottardi, G. The crystal structure of perrierite. Am. Mineral. 1960, 45, 1–14. [Google Scholar]
  15. Sokolova, E.; Hawthorne, F.C.; Della Ventura, G. Chevkinite-(Ce): Crystal structure and the effect of moderate radiation-induced damage on site-occupancy refinement. Can. Mineral. 2004, 42, 1013–1025. [Google Scholar] [CrossRef] [Green Version]
  16. Styles, M.T.; Young, B.R. Fluocerite and its alteration products from the Afu Hills, Nigeria. Mineral. Mag. 1983, 47, 41–46. [Google Scholar] [CrossRef]
  17. Newbury, D.E.; Ritchie, N.W.M. Performing elemental microanalysis with high accuracy and high precision by scanning electron microscopy/silicon drift detector energy-dispersive X-ray spectrometry (SEM/SDD-EDS). J. Mater. Sci. 2015, 50, 493–518. [Google Scholar] [CrossRef] [PubMed] [Green Version]
  18. Newbury, D.E.; Ritchie, N.W.M. Is Scanning Electron Microscopy/Energy Dispersive X-ray Spectrometry (SEM/EDS) Quantitative? Scanning 2013, 35, 141–168. [Google Scholar] [CrossRef] [PubMed]
  19. Ritchie, N.W.M.; Newbury, D.E.; Lowers, H.; Mengason, M. Exploring the limits of EDS microanalysis: Rare earth element analyses. In Proceedings of the Emas 2017 Workshop—15th European Workshop on Modern Developments and Applications in Microbeam Analysis & Iumas-7 Meeting—7th Meeting of the International Union of Microbeam Analysis Societies, Konstanz, Germany, 7–11 May 2017; IOP Conference Series-Materials Science and Engineering. 304. Iop Publishing Ltd.: Bristol, UK, 2018. [Google Scholar]
  20. Burgess, S.; Pinard, P. AZtec Wave—A New Way to Achieve Combined EDS and WDS Capability on SEM Microscopy and Microanalysis 2020 Proceedings. Microsc. Microanal. 2020, 26, 114–115. [Google Scholar] [CrossRef]
  21. Lowers, H.; Carpenter, P. Comparison of WDS and EDS Rare Earth Element Analysis. Microsc. Microanal. 2015, 21, 1881–1882. [Google Scholar] [CrossRef] [Green Version]
  22. Allaz, J.; Jercinovic, M.; Williams, M.; Donovan, J. Trace Element Analyses by EMP: Pb-in-Monazite and New Multipoint Background Method. Microsc. Microanal. 2014, 20, 720–721. [Google Scholar] [CrossRef] [Green Version]
  23. Allaz, J.M.; Jercinovic, M.J.; Williams, M.L. U-Th-Pb-TOTAL dating of REE-phosphate by electron microprobe: Review and progress. In Proceedings of the EMAS 2019 Workshop—16th European Workshop on Modern Developments and Applications in Microbeam Analysis, Trondheim, Norway, 19–23 May 2019; IOP Conference Series-Materials Science and Engineering. Publishing IOP: Bristol, UK, 2020. [Google Scholar]
  24. Roeder, P.L. Electron microprobe analysis of minerals for Rare Earth Elements—Use of calculated peak-overlap corrections. Canadian Mineralogist. 1985, 23, 263–271. [Google Scholar]
  25. Newbury, D.E. Mistakes Encountered During Automatic Peak Identification of Minor and Trace Constituents in Electron-Excited Energy Dispersive X-ray Microanalysis. Scanning 2009, 31, 91–101. [Google Scholar] [CrossRef] [PubMed]
  26. Pouchou, J.L.; Pichoir, F. Quantitative Analysis of Homogeneous or Stratified Microvolumes Applying the Model PAP; Heinrich, K.F.J., Newbury, D.E., Eds.; Springer: Boston, MA, USA, 1991. [Google Scholar]
  27. Analytical, O.I. INCA Energy Operator Manual; Oxford Instruments Analytical Ltd.: High Wycombe, UK, 2006. [Google Scholar]
  28. Lloyd, G.E. Atomic number and crystallographic contrast images with the SEM: A review of backscattered electron techniques. Mineral. Mag. 1987, 51, 3–19. [Google Scholar] [CrossRef] [Green Version]
  29. Drake, M.J.; Weill, D.F. New Rare Earth Element standards for electron microprobe analysis. Chem. Geol. 1972, 10, 179–181. [Google Scholar] [CrossRef]
  30. Walters, A.S.; Goodenough, K.M.; Hughes, H.S.R.; Roberts, N.M.W.; Gunn, A.G.; Rushton, J.; Lacinska, A. Enrichment of Rare Earth Elements during magmatic and post-magmatic processes: A case study from the Loch Loyal Syenite Complex, northern Scotland. Contrib. Mineral. Petrol. 2013, 166, 1177–1202. [Google Scholar] [CrossRef] [Green Version]
  31. ASTM. ASTM. ASTM Standard Guide for Quantitative Analysis by Energy-Dispersive Spectroscopy. In ASTM-E1508—2012A; ASTM: New York, NY, USA, 2012; p. R19. [Google Scholar]
  32. Williams, C.T. Analysis of rare earth elements. In Rare Earth Minerals: Chemistry, Origin and Ore Deposits; Jones, A.P., Wall, F., Williams, C.T., Eds.; Chapman and Hall: London, UK, 1996. [Google Scholar]
  33. Macdonald, R.; Baginski, B.; Kartashov, P.M.; Zozulya, D.; Dzierzanowski, P. Hydrothermal alteration of chevkinite-group minerals. Part 2. Metasomatite from the Keivy massif, Kola Peninsula, Russia. Mineral. Mag. 2015, 79, 1039–1059. [Google Scholar] [CrossRef]
  34. Macdonald, R.; Baginski, B.; Belkin, H.E.; Stachowicz, M. Composition, paragenesis, and alteration of the chevkinite group of minerals. Am. Mineral. 2019, 104, 348–369. [Google Scholar] [CrossRef]
  35. Macdonald, R.; Belkin, H.E.; Wall, F.; Baginski, B. Compositional variation in the chevkinite group: New data from igneous and metamorphic rocks. Mineral. Mag. 2009, 73, 777–796. [Google Scholar] [CrossRef]
  36. Newbury, D.; Ritchie, N.W. Rigorous quantitative elemental microanalysis by scanning electron microscopy/energy dispersive X-ray spectrometry (SEM/EDS) with spectrum processing by NIST DTSA-II: SPIE. In Scanning Microscopies 2014; International Society for Optics and Photonics: Washington, DC, USA, 2014. [Google Scholar]
Figure 1. Illustration of the main X-ray overlaps in the 4.4–4.9 keV spectral region of the chevkinite mineral group.
Minerals 11 01063 g001
Figure 2. BSE image of a chevkinite crystal with complex growth and alteration-related chemical heterogeneities, and a typical EDS spectrum revealing chemical complexity.
Minerals 11 01063 g002
Figure 3. (A) Background positions for the X-ray L lines of elements analysed. Note * One bckg selected only because of the limitation of the crystal range. (B) Visual representation of X-ray peaks for the closely spaced major elements (Ti, La, Ce) analysed here and the selection of their background positions. Note a step-in background at 2.475 Å related to the change of diffracting crystals from PET to LiF during data collection.
Minerals 11 01063 g003
Table 1. A selection of the most common REE-bearing minerals found in carbonatite and alkaline igneous intrusions.
Mineral NameFormula
Fluorcarbonates: Bastnäsite,
Parisite-(Ce), Synchysite-(Ce)
(Ce,La)(CO3)F
Ca(Ce,La)2(CO3)3F2
Monazite(Ce,La,Nd,Th)PO4
AllaniteCa(REE,Ca)Al2(Fe2+,Fe3+)(SiO4)(Si2O7)O(OH)
ApatiteCa5(PO4)3(Cl/F/OH)
EudialyteNa4(Ca;Ce)2(Fe2+;Mn2+)ZrSi8O22(OH;Cl)2(?)
Loparite(Ce,Na,Ca)(Ti,Nb)O3
Pyrochlore(Ca,Na)2Nb2O6(OH,F) REE-bearing
SteenstrupineNa14Mn2+2Fe3+2Ce6Zr(Si6O18)2(PO4)6(PO3OH)(OH)2 ·2H2O
Table 2. Details of WDS analysis for minor and trace elements, including X-ray line, standards, diffracting crystal, and count times peak/background selected appropriately to the concentration of an element in the mineral. B–standards used for the EDS analysis.
A—WDS StandardsB—EDS Standards
ElementStandardX-ray LineCrystalCount Time p/bElementStandardFormula
TiSrTiO3PET20/10MgForsteriteMg2SiO4
VV metalPET60/30FeFayaliteFe2SiO4
SrSrTiO3PET60/30Ca, SiWollastoniteCaSiO3
BaBaSO4PET60/30BaBariteBaSO4
LaLaB6PET20/10NaJadeiteNaAlSi2O6
CeCeO2PET20/10AlAl2O3N/A
PrPrAlO3LiF60/30ZrZrO2N/A
NdNdAlO3LiF60/30MnMn metalN/A
SmSmAlO3LiF60/30NbNb metalN/A
ThTh metalN/A
Table 3. Results of one SEM EDS-WDS quantitative dataset for chevkinite iteratively processed in different ways (S1–S6 are scenarios 1–6). BaO * was not detected by WDS but has been added here as an ED element to illustrate analytical challenges (NI = not included, bd = below detection).
La, Ce, and Ti by EDS (±)BaLa and Ce by WDS; Ti by EDS (±)BaLa, Ce, and Ti by WDS (±)Ba
S1S2 S3S4 S5S6
X-ray Linewt%wt%X-ray Linewt%wt%X-ray Linewt%wt%
V2O5WD Kα0.270.27WD Kα0.270.27WD Kα0.270.27
SrOWD Lα0.110.11WD Lα0.110.11WD Lα0.110.11
Pr2O3WD Lβ1.341.34WD Lβ1.341.34WD Lβ1.341.34
Nd2O3WD Lβ3.043.04WD Lβ3.043.04WD Lβ3.043.04
Sm2O3WD LβbdbdWD LβbdbdWD Lβbdbd
BaOWD LαbdbdWD LαbdbdWD Lαbdbd
BaO *ED L_ser.0.91NIED L_ser.0.91NIED L_ser.0.91NI
MgOED K_ser.0.610.58ED K_ser.0.610.58ED K_ser.0.610.58
Al2O3ED K_ser.2.872.86ED K_ser.2.862.85ED K_ser.2.862.85
SiO2ED K_ser.20.6920.66ED K_ser.20.6620.62ED K_ser.20.6520.62
CaOED K_ser.5.445.45ED K_ser.5.455.46ED K_ser.5.455.46
TiO2ED K_ser.16.3916.69ED K_ser.16.4116.7WD Kα16.716.72
MnOED K_ser.0.310.31ED K_ser.0.310.31ED K_ser.0.310.31
FeOED K_ser.7.987.96ED K_ser.7.987.97ED K_ser.7.987.97
ZrO2ED L_ser.1.551.54ED L_ser.1.541.54ED L_ser.1.541.54
Nb2O5ED L_ser.bdbdED L_ser.bdbdED L_ser.bdbd
La2O3ED L_ser.15.6515.55WD Lα14.9915.01WD Lα14.9915.01
Ce2O3ED L_ser.18.8619.04WD Lα18.818.82WD Lα18.818.82
ThO2ED M_ser.5.115.11ED M_ser.5.115.11ED M_ser.5.115.11
Totals 101.1100.5 100.3799.72 100.6599.74
Note: highlighted and bold parts are what authors have tried to test with their methodology.
Table 4. Results of SEM EDS-WDS of quantitative analysis of five different chevkinite crystals using the analytical protocol developed in this study. bd = below detection.
Crystal 1Crystal 2Crystal 3Crystal 4Crystal 5
SEM EDS-WDS (wt% oxide)
SEM-WDSTiO217.8417.5915.0914.4216.44
V2O50.280.240.510.460.27
SrO0.230.230.220.170.11
BaObdbdbdbdbd
La2O312.6511.7015.7715.3614.89
Ce2O319.2119.0421.5924.1619.09
Pr2O31.241.511.381.731.28
Nd2O33.804.453.964.802.99
Sm2O30.230.380.230.26bd
SEM-EDSMgO0.760.710.240.270.58
Al2O32.562.930.290.362.85
SiO221.3320.7619.4219.2620.63
CaO6.316.123.251.825.46
MnO0.24bd0.671.200.30
FeO7.697.5911.5211.707.99
ZrO21.621.760.39bd1.54
Nb2O3bdbd1.530.61bd
ThO22.665.541.622.585.19
UO2bdbd0.710.39bd
Total98.64100.5298.3599.5599.60
Table 5. Chemical compositions for three consecutive analyses (x1, x2, x3) on two different chevkinite crystals (crystal 6 and crystal 7) for estimation of precision.
Crystal 6wt%Empirical%Error Based on 2 Sigma Empirical
1 Sigma
x1x2x3
TiO217.3817.3517.510.070.8
V2O50.430.450.470.026.74
SrO0.290.360.40.0424.94
La2O318.0717.7718.350.242.6
Ce2O321.8121.6622.250.252.29
Pr2O31.321.191.140.0812.59
Nd2O32.982.792.990.096.26
MgO0.280.260.30.0212.03
Al2O30.560.50.50.039.89
SiO219.7219.7219.7200.03
CaO3.153.123.10.021.4
MnO0.760.770.680.0410.76
FeO11.511.411.60.081.45
Nb2O500.350.290.0317.32
ThO20.921.111.140.118.47
Totals99.1798.79100.43
Crystal 7x1x2x3Empirical 1ơ
TiO217.4617.7517.410.151.71
V2O50.490.480.40.0417.32
SrO0.390.310.360.0317.74
La2O317.7917.5217.230.232.6
Ce2O321.1621.4420.990.191.75
Pr2O31.221.151.190.034.76
Nd2O32.842.712.840.064.35
Sm2O30.240.310.190.0542.16
MgO0.430.390.40.027.59
Al2O30.520.50.570.0310.9
SiO219.9219.8419.770.060.64
CaO3.793.663.660.063.09
MnO0.590.530.530.0310.12
FeO11.0111.1311.030.050.97
ZrO20.390.50.370.0626.96
Nb2O50.350.370.430.0317.75
ThO21.040.861.050.0917.35
Totals99.6299.4698.42
Publisher’s Note: MDPI stays neutral with regard to jurisdictional claims in published maps and institutional affiliations.

