Article

Quartz Microstructures from the Sambagawa Metamorphic Rocks, Southwest Japan: Indicators of Deformation Conditions during Exhumation

The Division of Academic Resources and Specimens, The Hokkaido University Museum, Hokkaido University, Sapporo 060-0810, Japan
Minerals 2021, 11(10), 1038; https://doi.org/10.3390/min11101038
Submission received: 17 August 2021 / Revised: 15 September 2021 / Accepted: 22 September 2021 / Published: 25 September 2021

Abstract

:
The Sambagawa metamorphic rocks in central Shikoku, southwest Japan consist of an inverted metamorphic sequence from the upper chlorite to oligoclase-biotite zones at the lower structural level (LSL), which is overlain by a normal metamorphic sequence consisting of the albite-biotite and garnet zones at the upper structural level (USL). These sequences form a large-scale recumbent fold called the Besshi nappe. To unravel the mechanism of recrystallization and physical conditions in quartz, and their relation to exhumation tectonics, microstructures of recrystallized quartz grains in quartz schist from the Asemi-Saruta-Dozan River traverse were analyzed. The recrystallized quartz grain size increases with increasing structural level from 40 µm in the upper chlorite zone to 160 µm in the garnet zone of the USL. Further, the mechanism of dynamic recrystallization of quartz changes from subgrain rotation to grain boundary migration with increasing structural level across the uppermost garnet zone of the LSL. From these data, the deformation temperatures in quartz schist are calculated to increase with increasing structural level within the range between 300 and 450 °C using paleopiezometers and experimental flow laws. It could be interpreted that a rapid cooling of the Besshi nappe from above is responsible for the deformation temperatures recorded in quartz schist.

1. Introduction

Quartz is a major constituent mineral in the Earth’s crust, and its rheological properties are important for understanding geotectonic processes in the upper part of the crust and orogenic belts (e.g., [1]). Many experimental studies on deformation of both single crystals and aggregates of quartz have been conducted since the 1960s to elucidate the slip systems (e.g., [2,3,4,5]) and flow laws (references shown below). Crystallographic preferred orientations (CPOs) and microstructures in naturally and experimentally deformed quartzite have been extensively studied (e.g., [6,7,8,9,10,11,12]), and found to be useful indicators of physical conditions at the time of deformation with aid of numerical simulations (e.g., [13,14]). In particular, the dynamically recrystallized grain size in deformed minerals has been shown to only be dependent on differential stress [15]. The recrystallized grain size–stress relation known as paleopiezometer for quartz was first shown by [15], which was later applied to deformed and recrystallized quartz in mylonites (e.g., [16,17,18]).
It was experimentally shown by [19] for the first time that recrystallized quartz grains with oblate (S-type) and equant (P-type) shape form at a relatively faster strain rate and lower temperature, and slower strain rate and high-temperature conditions. Later, it was shown by [20] that the microstructural change from S- to P-type in fact occurred with increasing deformation temperature in quartz from the Sambagawa quartz schist, southwest Japan, which is also investigated in this paper. Subsequently, three regimes of dislocation creep and dynamic recrystallization (regime 1, 2, and 3) were experimentally identified [10]. The three regimes are dominated by slow grain boundary migration, subgrain rotation, and fast grain boundary migration. In a first application to a field example, these three regimes were identified in the nappe of the Ruby Gap Mts (Australia) [21], for which the flow law of quartz aggregates has been discussed [22]. Motivated by the same experimental study, microstructures in naturally deformed and recrystallized quartz veins from the Eastern Tonale mylonite zone (Italian Alps) were analyzed [23]. Based on microstructural analyses including CPOs, they identified three regimes of dynamic recrystallization in quartz aggregates with increasing temperature (i.e., bulging, BLG; subgrain rotation, SGR; and grain boundary migration, GBM recrystallization regimes).
The purpose of this paper is twofold: one is concerned with the identification of deformation and recrystallization regimes of natural quartz and an estimate of the physical condition at the time of deformation. The other is concerned with the implications for exhumation tectonics of the Sambagawa metamorphic rocks. First, the regimes of dynamic recrystallization under natural conditions for deformed quartz in quartz schist from the Sambagawa metamorphic rocks were analyzed, using the same microstructural criteria as used by [23], i.e., recrystallized quartz grain size and shape, and CPOs. Subsequently, natural physical conditions were inferred, using recrystallized gran-size paleopiezometer and flow laws established by experiments on quartz aggregates. Finally, how the physical conditions for deformation changed through time and space during the exhumation was discussed, paying special attention to microstructures and evidence of microstructural overprinting.

2. Geological Settings

The Sambagawa belt in southwest Japan, a classical high-P/T ratio type metamorphic belt, is juxtaposed in the north against the low-P/T ratio type Ryoke metamorphic belt, bounded by the Median Tectonic Line (MTL, Figure 1). Both belts, known as a paired metamorphic belt [24], have long been thought to have originated from Jurassic accretionary complexes (see [25] for the Late Jurassic radiolarian fossils found in the Sambagawa metamorphic rocks). However, it has been recently found that the Sambagawa metamorphic rocks were mostly derived from the Upper Cretaceous accretionary complexes based on U-Pb ages of detrital zircon grains (e.g., [26,27]). The ages for peak-metamorphism are also found to have been in the Late Cretaceous after the sedimentation ages. Amphibole and phengite K-Ar (or 40Ar/39Ar) ages range from 94 to 65 Ma (e.g., [28,29], reproduced in Figure 1d), probably indicating the ages of exhumation. The Sambagawa metamorphic rocks were finally juxtaposed against the Late Cretaceous Ryoke metamorphic rocks and granitoids, and the unconformably overlying Upper Cretaceous Izumi Group by large-scale north dipping normal faulting at c. 59 Ma in the earliest Paleogene [30,31].
On the basis of the peak-metamorphic grade, the Sambagawa metamorphic rocks in central Shikoku can be divided into four zones based on the appearance of index minerals in pelitic schists: chlorite (300–360 °C, 5.5–6.5 kb), garnet (440 ± 15 °C, 7–8.5 kb), albite-biotite (520 ± 25 °C, 8–9.5 kb), and oligoclase-biotite (610 ± 20 °C, 10–11 kb) zones in order of increasing metamorphic grade (e.g., [32,34]). In central Shikoku, metamorphic zonal mapping shows a peculiar structure, where the highest-grade oligoclase-biotite zone is located in the middle of the structural sequence, and from this zone the peak-metamorphic grade decreases towards both structural upward and downward directions (Figure 1c). This structure has been interpreted as a large-scale recumbent fold [33,35] or as thrust sheets [32,36,37] formed after the peak metamorphism. Throughout this paper, the chlorite, garnet, albite-biotite, and oligoclase-biotite zones are abbreviated as the chl, grt, al-bt, and ol-bt zones, respectively. Additionally, the grt and al-bt zones are repeated twice with increasing structural level, which are referred to as the grt or al-bt zone of the upper and lower structural levels and abbreviated as the grt or al-bt zone of the LSL and USL, respectively.
Deformation structures, which we observe in outcrops and thin sections, mostly formed under retrograde conditions during the exhumation stages. They formed in three distinct phases: phase forming bedding schistosity (Sb), Ozu-Nagahama phase, and Hijikawa phase after [36]; D1, D2, and D3 phases after [38]; and Ds, Dt, and Du phases after [39]. Since the definition of these three phases by different authors is more or less the same, we use the terminology of [38]. The D1 is characterized by a penetrative E-W to WNW-ESE striking main schistosity and subhorizontal lineation formed by ductile flow (e.g., [40]). The shape preferred orientation (SPO) of mica defines the foliation, and the SPO of amphibole defines the lineation, which formed under retrograde conditions during the exhumation stages [40,41,42,43,44,45,46,47]. The foliation and lineation can also be indicated by the SPO of deformed quartz grains. Further, quartz c-axis crystallographic preferred orientation (CPO) also formed together with the SPO under retrograde conditions during the exhumation stages (e.g., [46,48]), which will be described and discussed in the present paper.
Although D2 was originally defined by south-vergent overturned folds with crenulation cleavages that mostly occur in the chlorite zone, it has been recently found that north-vergent normal faults formed at the D2 stage in the high-grade zones situated at higher structural levels [40,49,50,51,52]. D3 resulted in the formation of open and upright folds with horizontal and E-W to WNW-ESE trending axes, the wavelength of which varies from a microscopic (thin section, e.g., [53]) to macroscopic (geological map) scale (Figure 1b). The D3 stage folds are considered to have formed after substantial exhumation [54], in relation to the left-lateral displacement along the MTL [31,36].

3. Review of the Existing Data on Microstructures in the Sambagawa Quartz Schist

3.1. Grain Size of Recrystallized Quartz in the Quartz Schist

The size of recrystallized quartz grains was first systematically analyzed with an intercept method by [20] for 25 quartz schist samples from the chl to ol-bt zones of the LSL along the Asemi-River. The grain size was calculated as the geometrical mean of 100 segments, measured parallel to the lineation (X-axis) and perpendicular to the foliation (parallel to the Z-axis) on the XZ-section. After this pioneering work, both Yoshida (2001, unpublished data) [55] and Yagi and Takeshita (2002) [46] analyzed the microstructures of recrystallized quartz grains on the XZ-section of 15 and 22 quartz schist samples from the entire cross-section including both LSL and USL along the Asemi, Saruta, and Dozan Rivers (Figure 2). Note that microstructures in any sample from both the ab-bt and grt zones of the USL were not analyzed by [20]. The grain size is determined as the diameter of the equivalent circle (D = 2 × S π ) with the NIH image (now called ImageJ, [56]), where S is the sectional area of a grain on the XZ-section. The grain size is averaged over 190–400 grains for each sample.
The data by Yoshida (2001) [55] and Yagi and Takeshita (2002) [46] both show a continuous increase of the recrystallized grain size with the increasing structural level from 40 µm in the upper chl zone (the higher-grade part of the chl zone after [34]) to 160 µm in the grt zone of the USL (Figure 3a). Although the recrystallized quartz grain size increases with the increasing peak-metamorphic grade from the upper chl to ol-bt zone in the LSL, it further increases with the increasing structural level in the USL, where the peak-metamorphic grade decreases with it. Accordingly, the recrystallized grain sizes in the al-bt and grt zones of the USL are larger than those in the corresponding metamorphic zones of the LSL. This has also been verified by a preliminary analysis of recrystallized quartz grain size in layer-parallel quartz veins that suffered from D1 deformation (Figure 4). Therefore, it is important to note that the spatial distribution of the recrystallized grain size is not entirely controlled by the peak metamorphism (or temperature).
Two data by [55] from the ab-bt zone of the LSL are much smaller than those by [46] from the same localities. Additionally, one of the data by [55] in each of the al-bt and grt zones of the USL is also much smaller than his other data from the corresponding metamorphic zone. These variations of the grain size in each of the same metamorphic zones could represent a reduction of the grain size due to overprinting deformation, as discussed below.

3.2. Grain Shape of Recrystallized Quartz in the Quartz Schist

The shape of recrystallized quartz grains (the mean aspect ratio, R = a/b, where a and b denote the mean length of the grain long and short axes) from the Sambagawa quartz schist was also first systematically analyzed on the XZ-section by [20]. The study area is divided into three areas (area I, II, and III in the order of increasing structural level as shown in Figure 2) based on the microstructural characteristics, principally the grain shape of recrystallized quartz from the quartz schist [20]. The boundary between area II and III is located at the uppermost grt zone close to the boundary between the grt and ab-bt zone of the LSL, while that between area I and II is in the upper chl zone. In this paper, the data from area I of [20] are not shown, because recrystallized quartz in quartz schist from area I, the grain size of which varies between 15 and 25 µm, perhaps deformed in dissolution-precipitation creep, where no quartz c-axis CPO developed in quartz schist.
The microstructural division by [20] is based on three criteria: aspect ratio (R), internal deformation features, and boundary characteristics. In area II, the larger grains (100–500 µm) are highly elongated (R = 5–10), while the smaller grains (<100 µm) are less elongated (Figure 4a). Wavy extinction and deformation bands are common in the grains, and their boundaries are serrated (Figure 4a,b). These features of the grain shape and microtextures can be correlated with those of the S-type after [19]. On the other hand, in area III, the grains are equant, and mostly free from internal deformation features, such as wavy extinction and deformation bands, and their boundaries are either straight or slightly curved (i.e., lobate; see Figure 4c,d). These characteristics are similar to those of the P-type after [19]. In addition to the criterions of microstructural division between the different areas used by [20], it is clear that the dynamic recrystallization of quartz is not complete in area II but complete in area III in quartz veins (compare Figure 4b with Figure 4c,d).
The present data by [55] and [46] are more or less comparable to those by [20], but aspect ratios (Rs) in the high-grade zones in the present data are higher than those by [20], perhaps due to the difference in the method. Rs are generally high in the upper chl and grt zones of the LSL, greatly varying between 2.0 and 6.0, while these are mostly lower than 2.6 in the uppermost grt and ab-bt zones of the LSL, ol-bt, and ab-bt and grt zones of the USL. Therefore, the present results essentially confirm the division of the Asemi-River route in terms of quartz microstructures by [20]. In the analyses by [46] and [55], samples with “oblique foliation” [57] are also indicated, which is the foliation defined by an elongated shape of quartz (Sq) inclined at 10–30° to that defined by alignment of mica (Sm) (Figure 3b). Note in the diagram that the mean aspect ratio in samples with “oblique foliation” is less than 2.6, indicating that this microstructure is correlated with the P-type (subtype of P-type, [46]).
It is interesting to note that one and two data by [46] from the ol-bt and grt zones of the USL, respectively, show mean aspect ratios greater than 4.0, where these are normally low (Figure 3b). In these samples, an elongated core of quartz is surrounded by very fine-grained recrystallized quartz (see Figure 7a of [46]), correlated with bulging recrystallization after [23]. This fact indicates that the elongation of the grains perhaps resulted from overprinting deformation.

3.3. CPOs of Quartz in the Quartz Schist

Quartz c-axis fabrics in the quartz schist along the Asemi-River from all the peak-metamorphic zones were analyzed by [58], which they inferred to have formed at deformation stages under different temperature conditions. They concluded that some quartz c-axis fabrics formed in temperature conditions greater than 500 °C. Nevertheless, all the quartz c-axis fabrics that they analyzed are classified into type I crossed girdles (Figure 5a, see [59] for the original definition, and [40] for their occurrences in the Sambagawa metamorphic rocks). The quartz c-axis fabrics were also analyzed by [35,60], which indicated that they all belong to type I crossed girdles.
All the quartz schist layers that crop out along the Asemi-River were collected (named “Tagami collection” open for use to the readers upon request), and quartz c-axis fabrics in c. in total, 100 quartz schist samples were analyzed, for each of which either 350 or 210 c-axis orientations were measured using a universal stage [61]. This study first discovered that a type II crossed girdle [59] with a Y-maximum (Figure 5b) and complete cleft girdle c-axis fabrics occur in the uppermost ol-bt zone and a lower part of the ab-bt zone of the USL (Figure 3a). In other zones, only type I crossed girdle, small circle girdle with a small-half-opening angle (20–40 °C), and incomplete cleft girdle c-axis fabrics develop [48]. The fabric transition from type I to type II crossed girdle is probably caused by the change of the combination of dominant slip systems from basal <a> and rhomb <a> to basal <a> and prism <a> [13,14]. The fabric transition is inferred to occur at temperature conditions of deformation around 400 °C (e.g., [18,62,63,64]). The fact indicates that these c-axis fabrics, which formed at fairly high temperatures, were preserved during exhumation in the uppermost ol-bt and lower al-bt zones of the USL. The implication of this fact will be discussed below.

4. Stress, Strain Rate, and Deformation Temperature Estimation

All the quartz schist samples analyzed in this study deform in a dislocation creep regime. This is well evidenced by the strong c-axis fabric development in the deformed quartz aggregates (Figure 5; also see, e.g., [40]). The dislocation creep regimes in the Sambagawa quartz schist can be correlated with the regime 2 and 3 of [10], as described below.
The flow law of dislocation creep is expressed as follows:
ε ˙ = A σ n e E R T
where ε ˙ , σ, and T are the strain rate, differential stress, and temperature; and A, n, and E are material constants. R is the universal gas constant. Therefore, in order to derive the strain rate ( ε ˙ ), the differential stress (σ) first of all must be independently determined by paleopiezometers, such as those using recrystallized grain size, which is assumed to be unaffected by other variables, such as the amount of strain and water content. Even if the differential stress (σ) can be determined from paleopiezometers, there are still two variables ( ε ˙ and T) left in the flow law of dislocation creep. In this study, we constrain the strain rate ( ε ˙ ) and deformation temperatures (T), as explained below.

4.1. Paleopiezometry

The paleostress for steady-state ductile deformation can be estimated by different microstructures (e.g., paleopiezometers) in deformed minerals. These are free dislocation density (e.g., [65]), subgrain size (e.g., [66] reported by [67]), and recrystallized grain size (e.g., [15]). While only 0.05–0.3 and 0.3–0.5 of natural (logarithmic) strain are necessary to generate steady-state substructures of dislocation and subgrain, respectively, a significantly larger strain more than 1.0 is necessary to generate a steady-state recrystallization microstructure for deformed olivine [68,69,70]. Since we deal with a very large ductile strain greater than 70% shortening (natural strain of 1.2, discussed below), which occurred during the exhumation stages, the recrystallized quartz grain sizes that we analyze to infer the paleostress are considered to be the steady state ones.
Several authors experimentally established recrystallized quartz grain size paleopiezometers (references cited in [71]). These are expressed in the following form:
σ = σ 1 σ 3 = C D x
where σ and D are the differential stress (MPa) and recrystallized grain size (µm), respectively. C and x are material constants. Among the paleopiezometers established by different authors, we use the one by [72], which is also used by [71]. Some relevance of this paleopiezometer has been discussed by [71]. Note that there is a maximum difference of an order of magnitude in the estimate of differential stresses using paleopiezometers after different authors, which gives rise to a maximum difference of four orders of magnitude in the estimated strain rate for the stress exponent (n) of the four used in the present calculations.
We only use the recrystallized grain size data by [46] and [55], not those by [20], to calculate the magnitude of paleostress, because the latter data were obtained by a different method from that used to obtain the former data. The differential stresses calculated with the paleopiezometer by [72] are shown in Figure 6. The inferred differential stresses monotonously decrease with increasing structural level from the upper chl zone (45–60 MPa) to the grt zone of the USL (ca. 20–25 MPa). Note that the inferred differential stresses greatly decrease from the upper chl zone to the ab-bt zone of the LSL (ca. 25–40 MPa), while they very sightly decrease from the latter to the grt zone of the USL.

4.2. Deformation Temperature and Strain Rate Estimation

In order to estimate the strain rate in the Tonale fault zone, the flow laws of quartz aggregates after four different sources [22,73,74,75] were used by [71], which are abbreviated as FL1, FL2, FL3, and FL4, respectively, where FL stands for flow law. Note here that while the experiments to establish FL2 and FL3 were conducted on synthetic quartzite at a confining pressure of 300 MPa, using a gas apparatus, FL4 is derived based on experiments on natural quartzite at a confining pressure of 1.5 GPa, using the Griggs-type apparatus with a liquid confining medium (molten salt). FL1 is not based on their own independent experimental data but rather constructed based on the comparison between FL3 and FL4, and natural results of deformed quartz mylonites from the Ruby Gap duplex [21]. Although it is interpreted by [22] that the difference between FL3 and FL4 is due to the pressure effect on water fugacity (fH2O), on which water weakening strongly depends, it could rather be inferred that the difference arises from the difference in starting materials (synthetic versus natural quartzite) as discussed below. Accordingly, following [71], we use FL2, FL3, and FL4 but leave out FL1 to estimate both the deformation temperature and strain rate in the Sambagawa quartz schist.
In the work of [71], it is assumed that the deformation temperature is the same as the peak-metamorphic temperature, and the strain rate is calculated accordingly. This assumption can be valid in the case of [71], considering the synkinematic emplacement of the Adamello Pluton. The emplacement is responsible for a steep temperature gradient from 250 to 700 °C inferred from the peak-metamorphic mineral assembledges, and large shear deformation in the c. 1-km-wide contact aureole (i.e., Tonale fault zone). It is inferred that the temperature rise and resultant deformation took place for a short time, and no significant overprinting deformation followed, because of a rapidly decreasing temperature during retrograde stages in the Tonale fault zone.
On the other hand, in the Sambagawa metamorphic rocks, a large amount of deformation took place during retrograde stages, which is in fact responsible for the exhumation of the Sambagawa metamorphic rocks (e.g., [40]). In other words, the quartz microstructures recorded successive overprinting deformations during the exhumation, and were frozen-in at some time due to either a rapid cooling or sudden decrease of differential stress. We cannot easily determine the deformation temperatures by some independent methods. It is only certain that the deformation temperatures must be significantly lower than the peak-metamorphic temperatures.
Therefore, we first assume the deformation temperatures as explained below, and assign them to each sample (model 1). Then, the strain rate in each sample is calculated using flow laws accordingly. Considering that the recrystallized grain size monotonously increases with increasing structural level, an inverted geotherm is postulated at the time of main deformation responsible for the formation of the steady-state recrystallization microstructure during the exhumation stages. We assume that the grt zone of the USL deformed at the highest temperature, while the upper chl zone of the LSL deformed at the lowest temperature during the exhumation stages, solely based on the recrystallized grain sizes. Since the peak-metamorphic temperatures for the grt zone are inferred to be 440   ±   15 °C [34], we set a maximum deformation temperature of 450 °C at the highest structural level in the grt zone of the USL (Figure 7a). Although the peak-metamorphic temperature for the upper chl zone is inferred to be 360–400 °C [34], the quartz could have deformed at lower temperatures during exhumation stages. We set a minimum deformation temperature of 300 °C at the lowest structural level in the upper chl zone (Figure 7a), which is the temperature for brittle-ductile transition in quartz at natural conditions [76,77]. Therefore, the range of deformation temperature assumed in this way indicates its maximum range. The deformation temperatures between both ends are linearly interpolated for the first approximation. Although the strain rates are calculated from the inferred differential stresses from recrystallized quartz grain sizes and assumed deformation temperatures using the above three flow laws, those from FL4 are only plotted in Figure 7a. The reason why we adopt FL4 will be given below. The calculated strain rate increases with increasing the structural level from 10−17/s to 10−15/s.
Alternatively, we can first assume a strain rate in each sample, and then calculate the deformation temperatures accordingly. In this model (model 2), we simply assume that the strain rate is constant throughout the Sambagawa metamorphic rocks. One example of this calculation is conducted at a reasonable strain rate of 5 × 10⁻¹⁶/s, which is in the range of the calculated strain rate for the prescribed deformation temperatures (model 1) using FL4. The results give the minimum deformation temperatures range varying between 360 and 425 °C (Figure 7b).
As explained above, the two types of models (the maximum range of deformation temperature assumed, and constant strain rate assumed) give the largest and smallest ranges of deformation temperature between both ends, which are 150 and 65 °C, respectively. The temperature and strain rate conditions calculated for the two extreme models are not much different.

5. Discussion

5.1. Extrapolation of Experimental Flow Laws to Natural Physical Conditions

In the Sambagawa metamorphic rocks, a few reliable data are available to constrain the strain rate. First, asymmetrical crossed and single girdle quartz c-axis fabrics mostly developed in the quartz schist. Based on simple shear experiments of a quartz analogue (norcamphor), the c-axis fabric patterns develop at shear strain (γ) of 4–6 [78], corresponding to natural (logarithmic) shortening strain of 1.4–1.8. Additionally, Moriyama and Wallis (2002) [79] directly measured the 3-D finite strain ratio of deformed quartz-rich conglomerates from the ol-bt zone. According to their analysis, the principal strain ratios with estimated errors are X/Y = 5.4–6.6 and Y/Z = 3.8–3.9, respectively, which nearly belong to the plane strain geometry. The logarithmic shortening or elongation strain for these strain ratios is calculated to be 1.5–1.6. Since the ductile deformation took place for the time interval lasting as much as 20 Ma (e.g., oldest sedimentation age at 93 Ma and youngest exhumation age at 73 Ma in the grt zone, [27]), the strain rate is calculated to be on the order of c. 10−15/s using these estimates of finite strain.
These estimates of the strain rate in the Sambagawa metamorphic rocks are compared with the calculated ones using the flow laws of different authors (Figure 8). The strain rates calculated with FL2 (10−13–10−14/s) are slightly higher than the natural strain ones. The strain rates calculated from FL3 (10−15–10−16/s) are slightly lower than the natural ones. The strain rates calculated with FL4 is comparable or slightly lower than the natural ones at high temperatures between 400 and 500 °C (10−15/s) but gives much lower strain rates of 10−16–10−17/s at low temperatures between 300 and 400 °C in the LSL. Nevertheless, we rely on FL4, because the flow law is only based on deformation of natural quartz aggregates.
It must be noted that the comparison of physical conditions between nature and experiments still has large uncertainties. For this matter, the following reasons could be important. As mentioned earlier, the uncertainty in the estimate of flow stress could lead to a very large difference in the strain rate estimate. Second, normal grain growth during pos-tectonic annealing is not counted at all in the present research. Grain size increases by a factor of 2 to 5 occur in experimentally deformed quartzite during static annealing of 120 h [80]. This leads to a stress estimate of 1/2 to 1/5 of the real values, and hence could lead to an apparent decrease in the calculated strain rate by one to three orders of magnitude. Third, strain softening at very large strains in nature has not been quantified in experiments, where the shortening strain is 50% at most. Finally, the water weakening effect may not still be quantitively evaluated for deformed quartzite. Therefore, one must realize that the above-mentioned difference in the strain rate up to two orders of magnitude between nature and extrapolation with flow laws is well within the uncertainties in the estimate of the natural strain rate.
The strain rates in the Tonale fault zone are two orders of magnitude higher than those in the Sambagawa belt at all temperature ranges between 300 and 500 °C using all flow laws (Figure 8). This large difference in the strain rate obviously results from the inferred much higher differential stresses in the Tonale fault zone than in the Sambagawa metamorphic rocks at the same deformation temperatures (Figure 8). The reason why the differential tresses and strain rates are very different between the two deformed zones could be attributed to the difference in tectonic setting (strike-slip fault zone in continents versus subduction channel sandwiched between oceanic and continental plates). While the shear zone in continents could be narrow and localized, it has been inferred that the thickness of the subduction channel is as wide as c. 2 km [81,82,83]. Since the shear strain rate is calculated as the displacement along the shear zone boundary divided by the thickness of the shear zone, it could have been much higher in the continental shear zone than in the subduction channel, assuming that the displacement is comparable [84].

5.2. Physical Conditions for Recrystallization Regimes in Naturally Deformed Quartz Aggregates and Comparison with Experiments

From the viewpoint of microstructures, it can be inferred that the quartz schist in the upper chl and most of grt zones of the LSL (area II by [20]) showing S-type quartz microstructures recrystallized in the SGR recrystallization regime [23]. On the other hand, the quartz schist in the uppermost grt and ab-bt zones of the LSL, the ol-bt (area III by [20]), and the ab-bt and grt zones of the USL showing P-type quartz microstructures recrystallized in the GBM recrystallization regime [23]. The boundary between the SGR and GBM recrystallization dominant region is thus located at the uppermost grt zone. This estimate of the recrystallization regime is essentially based on the aspect ratio of recrystallized grains (i.e., high and low aspect ratios for the former and latter zones, correlated with microstructures in recrystallized quartz grains in SGR and GBM recrystallization regimes, respectively). In addition, the recrystallized quartz grain size (discussed below), degree of recrystallization, and c-axis CPO for each regime are also comparable between the Sambagawa quartz schist and veins, and deformed quartz veins from the Tonale fault zone [71].
Now, it is of interest to compare the physical conditions for the mechanism transition from the SGR to GBM recrystallization between the Sambagawa schist and Tonale fault zone. The differential stresses at the SGR/GBM boundary, which were calculated from the recrystallized grain size piezometer by [72], are 32 and 33 MPa corresponding the recrystallized grain size of 89 and 84 μm (sample 15-2 in Table 1 of [71]) in the Sambagawa schist and Tonale fault zone, respectively. Although more data on the carefully calibrated recrystallized grain size of quartz are necessary from different localities, the coincidence of the flow stress suggests that the condition for the mechanism transition is delineated by an iso-stress boundary around 30 MPa (i.e., iso-recrystallized quartz grain size of 80–90 μm). For the transition between BLG and SGR recrystallization, no data is available from the Sambagawa belt, because no quartz schist from area I [20] deformed in the BLG regime, as mentioned above. The highest flow stress in the quartz schist, which deformed in the SGR regime, is 57 MPa (corresponding to a recrystallized quartz grain size of 38 μm). On the other hand, a flow stress of 77 MPa (corresponding to the recrystallized quartz grain size of 24 μm of sample 24-4 in Table 1 of [71]) is obtained for the BLG/SGR transition in the quartz vein sample from the Tonale fault zone. Accordingly, the flow stress for the mechanism transition does not contradict the highest stress for the SGR recrystallization in the Sambagawa quartz schist.
The BLG and SGR recrystallization has been corelated with regime 1 [10] to a lower temperature part of regime 2, and a higher temperature part of regime 2, and SGR/BGM transition with regime 3 by [23]. They further conclude that most microstructures suggesting GBM recrystallization have not been reproduced experimentally. In order to compare the flow stresses for the mechanism transitions between nature and experiments, the strain rates for the Sambagawa metamorphic rocks and Tonale fault zone were calculated with the flow laws after different authors, and are plotted in the logarithm of strain rate versus 1/T diagram (Figure 8). In this diagram, flow laws of dislocation creep are expressed as sets of iso-differential stress line with the slope proportional to the negative activation energy (E). Additionally, the strain rate and temperature for each set of experiments conducted by [10] are plotted in the same diagram together with the deformation and recrystallization regime.
The flow stresses of three as-is samples that deform in regime 3 in the experiments by [10] are calculated to be 37, 58, and 58 MPa (Figure 8). Note here that we adopt the differential stresses calculated from the temperature and strain rate of each experiment using FL4, not those directly calibrated by [10]. Although both experiments by [10] and [75] from which FL4 is derived were conducted on natural quartzite samples with the same Griggs-type apparatus, the experiments by [75] provide a better estimate of differential stress than the latter ones because of the confining medium used (molten salt versus solid NaCl or pyrophyllite). Note also that the differential stresses are only calculated for deformed as-is samples after [10], because FL4 is constructed based on experiments on as-is natural quartzite samples. Water-added samples perhaps follow a different flow law with a lower activation energy. If the experimental regime 3 is correlated with the natural SGR/GBM transition as pointed out by [23], these flow stresses (30–60 MPa) are slightly higher than the natural one (c. 30 MPa) but could be reasonably correlated.
On the other hand, for regime 1 and regime 2, experimental flow stresses vary between 238 and 1124 MPa and 118 and 416 MPa using FL4 (Figure 8). The flow stresses in the quartz veins from the Tonale fault zone, which deformed in the BLG recrystallization regime, are inferred to vary between 77 and 212 MPa [71] based on the recrystallized quartz grain size paleopiezometer by [72]. Therefore, if the BLG recrystallization can be correlated to regime 1 to the lower temperature part of regime 2 as pointed out by [23], the flow stresses for these recrystallization regimes can also be roughly correlated between nature and experiments, although the natural flow stresses are significantly lower than the experimental ones.
It has now become clear that based on the correlation of physical conditions between the natural and experimental deformation and recrystallization regimes, the regime boundaries are iso-stress boundaries (Figure 8). Note here that a good correlation is the case for the activation energy of 223 kJ/mol by FL4 but not for 152 kJ/mol by FL3. The former and latter experiments use natural and synthetic quartzites for starting materials, which is obviously responsible for a large difference in the activation energy. In fact, experiments on hot-pressed natural quartz aggregates by [85] yielded an activation energy of 242 kJ/mol, supporting the above conclusion that the large difference in the activation energy is due to the difference in starting materials, not to that in used apparatus (i.e., Griggs versus gas apparatus). This is the reason why we adopt FL4 for the calculation of the strain rate and deformation temperature in the Sambagawa quartz schist.

5.3. Implications for Exhumation Tectonics in the Sambagawa Metamorphic Rocks: Cause for Increasing Deformation Temperature with Increasing Structural Level

In this subsection, the proposed model of structural development during exhumation of the Sambagawa metamorphic rocks, and associated development of geotherm are presented in Figure 9 and Figure 10. First of all, note that the phengite K-Ar and 40Ar/39Ar ages increase with increasing the peak-metamorphic grade along the Asemi-River ([28,29] reproduced in Figure 1d). We would expect that the opposite case would occur, because it takes more time for the higher-grade rocks to be cooled down below the closure temperature for the K-Ar system in phengite (c. 350–375 °C by [86] and as high as 500 °C by [87]). The reversal of the expected tendency has now been resolved by the U-Pb ages of the youngest detrital zircons (i.e., maximum sedimentation ages) from the different units in eastern Shikoku, which suffered different degrees of peak metamorphism [27]. It has been found that while the youngest detrital zircons from the grt zone yield U-Pb ages of 93–83 Ma, those from the upper chl zone yield an age of 81 Ma [27]. Further, phengite K-Ar ages from the grt zone range between 74 and 72 Ma, and that from the upper chl zone is 65 Ma [27]. Therefore, those grt and upper chl zones are different tectonometamorphic units, and the former subducted and was exhumed earlier than the latter. Similarly, the ol-bt and ab-bt zones are inferred to consist of further older units than the grt zone, which subducted and were exhumed earlier than the grt zone, as originally proposed by [29]. Therefore, the subduction and exhumation of the different tectonometamorphic units that suffered different degrees of peak metamorphism is summarized as illustrated in Figure 9 (stage I). It is important to note that the inverted metamorphic structure and unique phengite K-Ar ages to each metamorphic zone could have been acquired when the different tectonometamorphic units are exhumed and juxtaposed (Figure 9, cf. [29]).
On the other hand, the difference in the recrystallized quartz grain size in the grt, ab-bt zones between the LSL and USL (Figure 3a) cannot be explained by the successive subduction and exhumation alone mentioned above. Only the grt and ab-bt zones of the LSL could have experienced a large amount of overprinting deformation at temperatures ranging between 325 and 415 °C (Figure 7) around and below the closure temperature of phengite. This led to the formation of low-T type microstructures in quartz from quartz schist in LSL (a type I crossed girdle quartz c-axis fabric and fine recrystallized grains, [46,48]). On the other hand, the intermediate-T type quartz microstructures (a type II crossed girdle quartz c-axis fabric and/or coarse recrystallized grains), which could have originally developed in the whole grt, ab-bt, and ol-bt zones, are only preserved in the USL free from a large amount of overprinting deformation. The difference in quartz deformation microstructures between the LSL and USL could be attributed to the emplacement of the higher-grade Besshi nappe consisting of the upper chl to ol-bt zones over the Oboke nappe consisting of the lower chl zone at the later stage of D1 phase ([29,35], Figure 1, stage II of Figure 9). During the emplacement, the overturned fold of the Besshi nappe could have formed, as originally proposed by [33] (Figure 9), and the rapid cooling could have occurred, because such a perturbed geotherm could have been fairly quickly restored to an equilibrium geotherm (increasing temperature with increasing depth, Figure 10). This occurred within c. a few myr for a perturbed zone of the geotherm with a thickness less than 10 km (thermal diffusivity of 10−6 m2s−1 is assumed, e.g., [88]). Although it is difficult to constrain the thickness of a perturbed zone of geotherm, it is assumed to have been less than c. 10 km considering a significant amount of tectonic thinning before the formation of the Besshi nappe. The model is supported by the present study on quartz microstructures, which led to the conclusion that the deformation temperature during the exhumation is generally higher with the increasing structural level. The fact perhaps indicates that the higher-temperature recrystallization microstructures of quartz were frozen-in earlier with increasing structural level due to a rapid cooling of the Besshi nappe. Hence, it is important to note that the spatial distribution of the deformation temperature does not indicate a geotherm at a fixed time but rather a series of temperatures recorded at different times for different depths, which is analogous to the field geotherm created by P-T paths in individual rocks [88].
It is inferred that the Besshi nappe could have been further destructed by large-scale normal faulting under the temperature conditions around those for the brittle-ductile transition of quartz (c. 300 °C) (stage III of Figure 9), which has been discussed elsewhere [40,49,52]. In particular, they argued that the late-stage folding and normal faulting strongly affected strata in the ol-bt zone, which may be in fault contact with the al-bt zone of USL (Figure 9). During this faulting, rocks of the USL just slid as a rigid body over those of the LSL. We also believe that some gaps in the phengite K-Ar ages across different metamorphic zones (Figure 1d) could have also been caused by the activation of normal faults [52].

6. Conclusions

In order to analyze the dislocation creep regime of quartz from the Sambagawa metamorphic rocks and their exhumation tectonics, we reviewed the existing data on the size, aspect ratio, and c-axis CPO of deformed and recrystallized quartz grains in quartz schist from the Asemi-Saruta-Dozan River traverse, central Shikoku, southwest Japan. Along this traverse, the whole sequence of the Sambagawa metamorphic rocks is best exposed forming a recumbent fold called the Besshi nappe. The nappe consists of the upper chlorite, garnet, and albite-biotite zones of the lower structural level (LSL); the oligoclase-biotite zone; and the albite-biotite and garnet zones of the upper structural level (USL) in structural ascending order. Based on these data, the following conclusions are made.
(1)
The recrystallized grain size of quartz in quartz schist monotonously increases with increasing structural level from 40 µm in the upper chlorite zone to 160 µm in the garnet zone of the USL. In fact, the recrystallized quartz grain sizes in quartz schist from the garnet and albite-biotite zones are smaller in the LSL than in the corresponding zones of the USL. Additionally, although a type I crossed girdle c-axis fabric develops in most of the structural level, a type II crossed girdle c-axis fabric only occurs in the uppermost oligoclase-biotite zone and a lower part of the albite-biotite zone of the USL. These facts indicate that microstructures formed at higher temperatures tend to be preserved in the upper than lower structural level, which experienced the same peak metamorphism. Therefore, it can be concluded that the microstructural development of quartz is not controlled by the peak metamorphism alone but by deformation and recrystallization during exhumation.
(2)
The recrystallized grain shape (i.e., aspect ratio, R) of quartz in quartz schist dramatically changes from an oblate shape (2.0 < R < 6.0) to an equant shape (mostly 1.0 < R < 2.6) with increasing structural level across the boundary located at the uppermost garnet zone of the LSL. These results essentially confirm those by [20], where the microstructural types of oblate and equant recrystallized quartz grains are called S-type and P-type. The S-type and P-type quartz microstructures can be correlated with those in quartz veins from the Tonale fault zone after [23], which deformed in subgrain rotation (SGR) and grain boundary migration (GBM) recrystallization regimes.
(3)
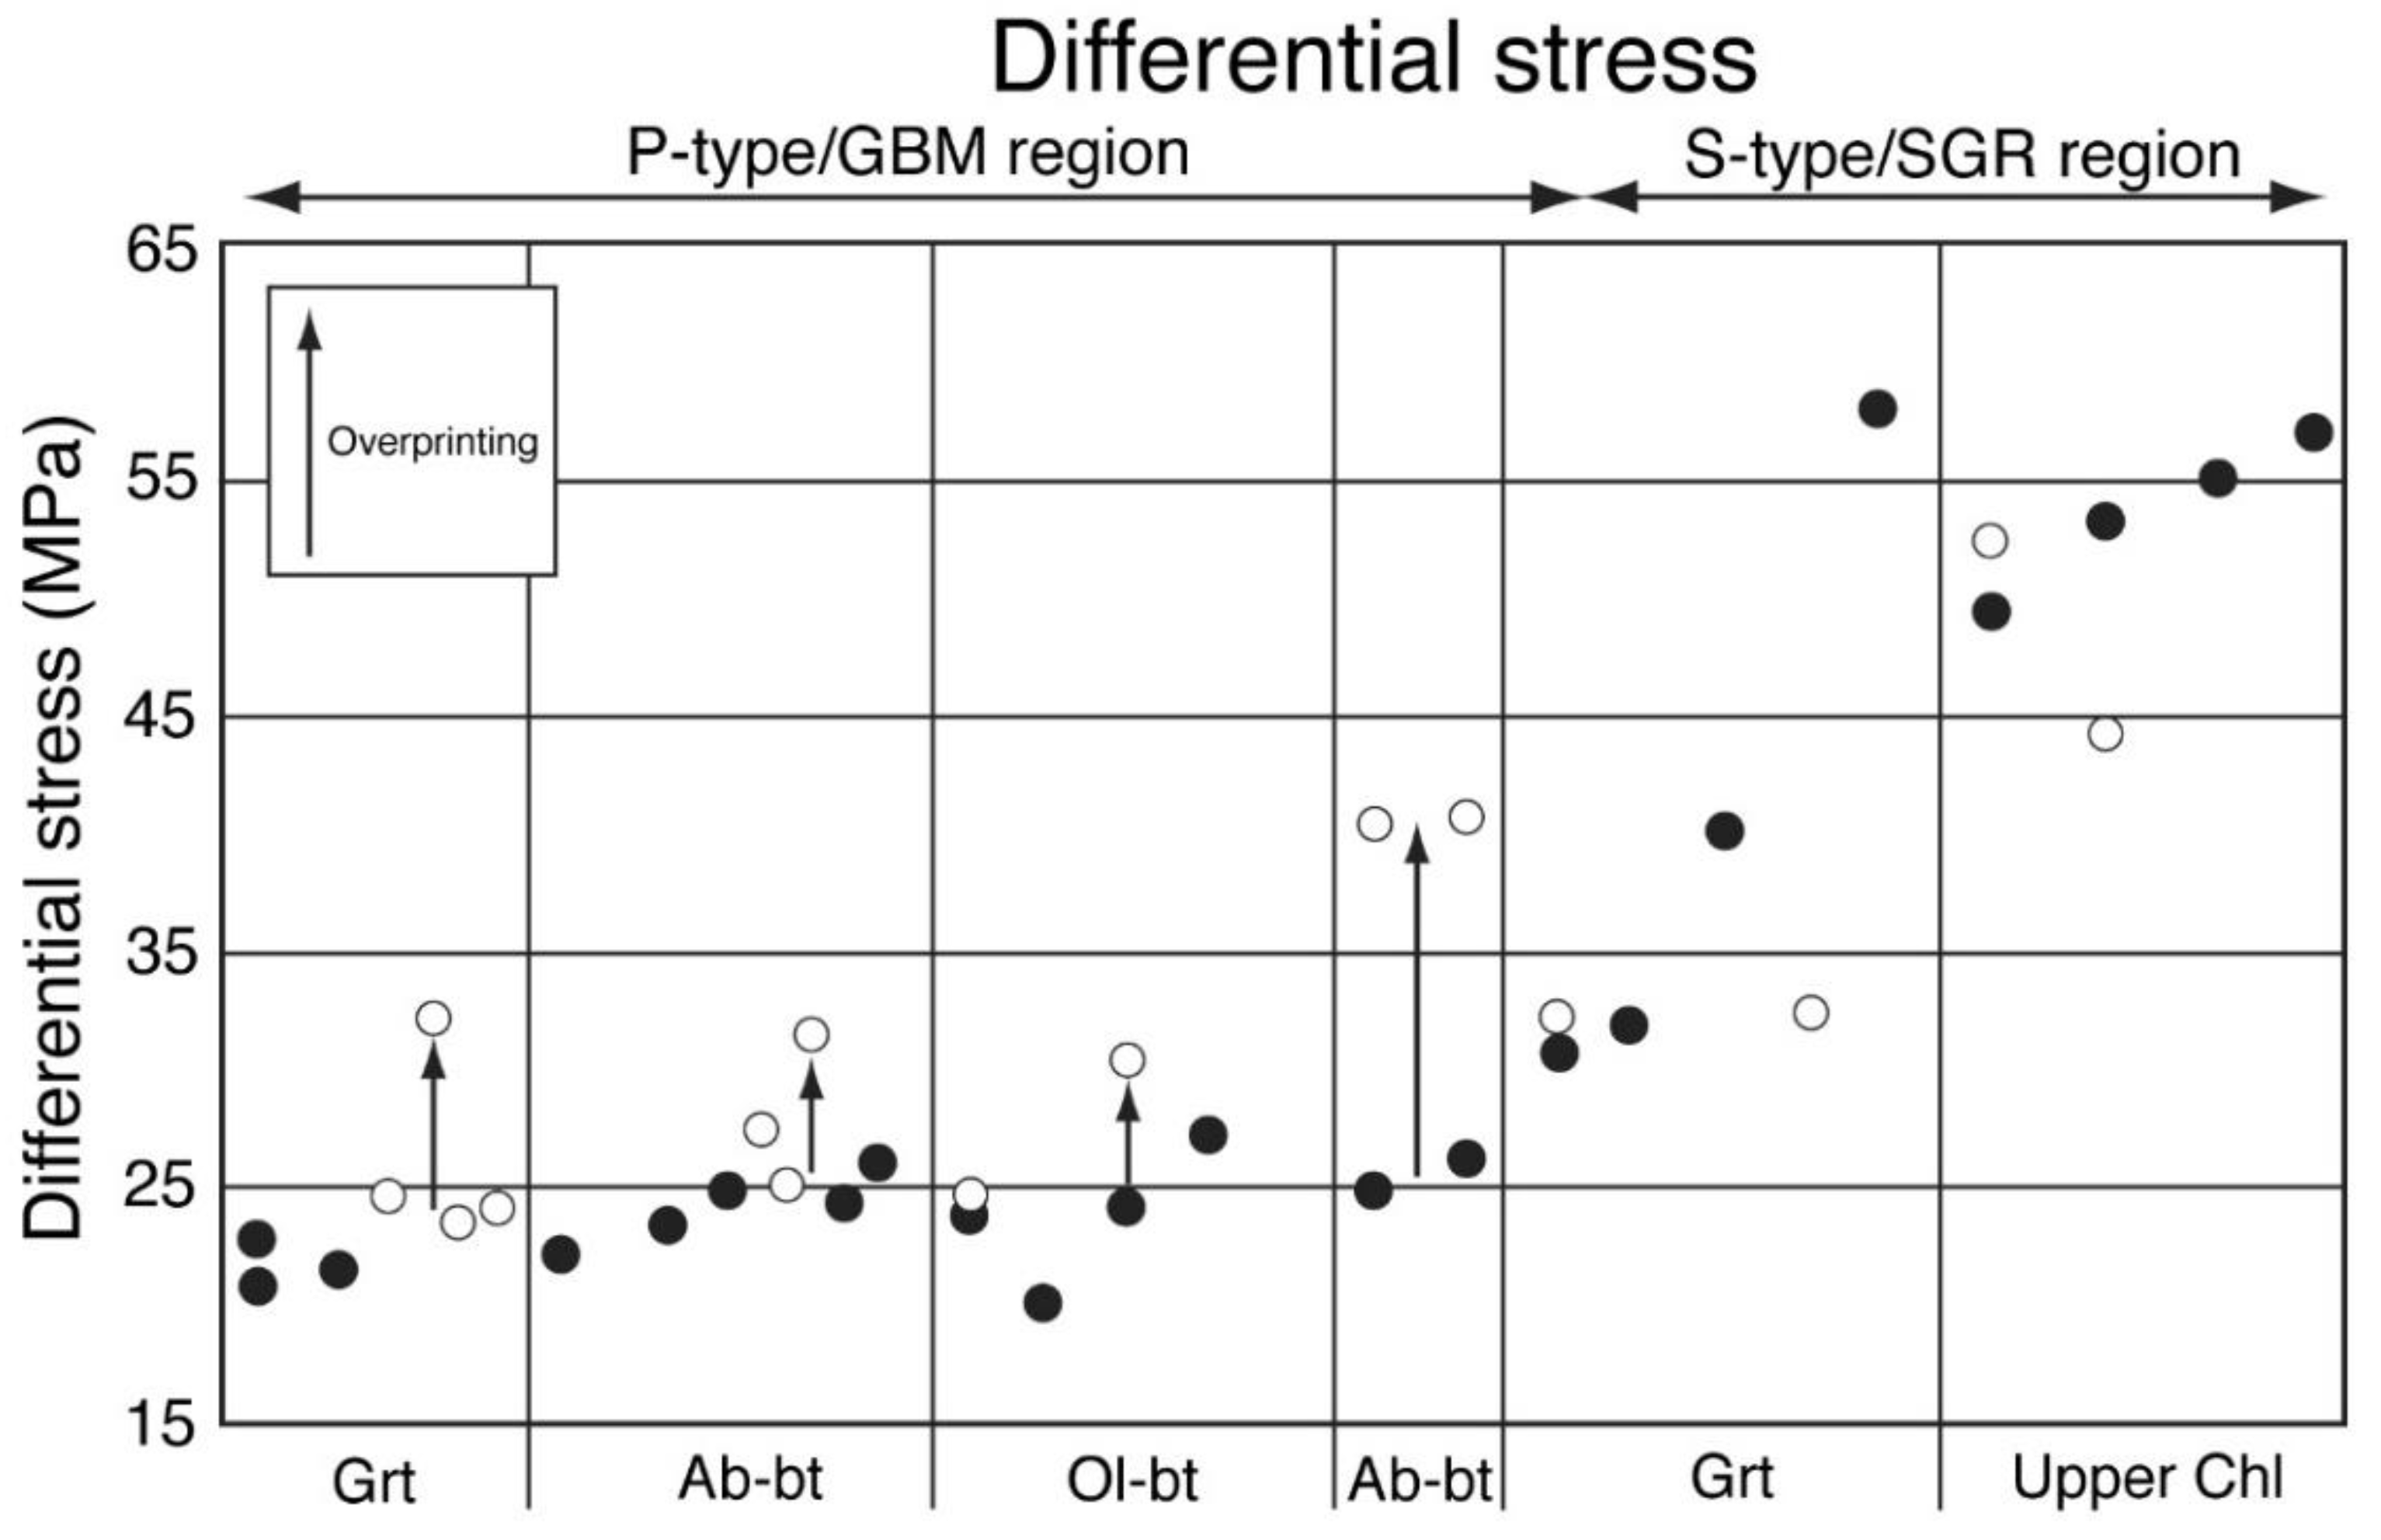
Assuming that the steady-state recrystallized grain size of quartz is solely determined by differential stresses and the post-tectonic grain growth is neglected, we calculated the paleo-differential stresses in quartz schist samples from the Asemi-Saruta-Dozan River traverse, using the piezometer of [72]. The calculated stresses monotonously decrease from 45–60 MPa in the upper chlorite zone to 20–25 MPa in the garnet zone of the USL with increasing structural level. The facts (1), (2), and (3) strongly suggest increasing deformation temperatures with the increasing structural level.
(4)
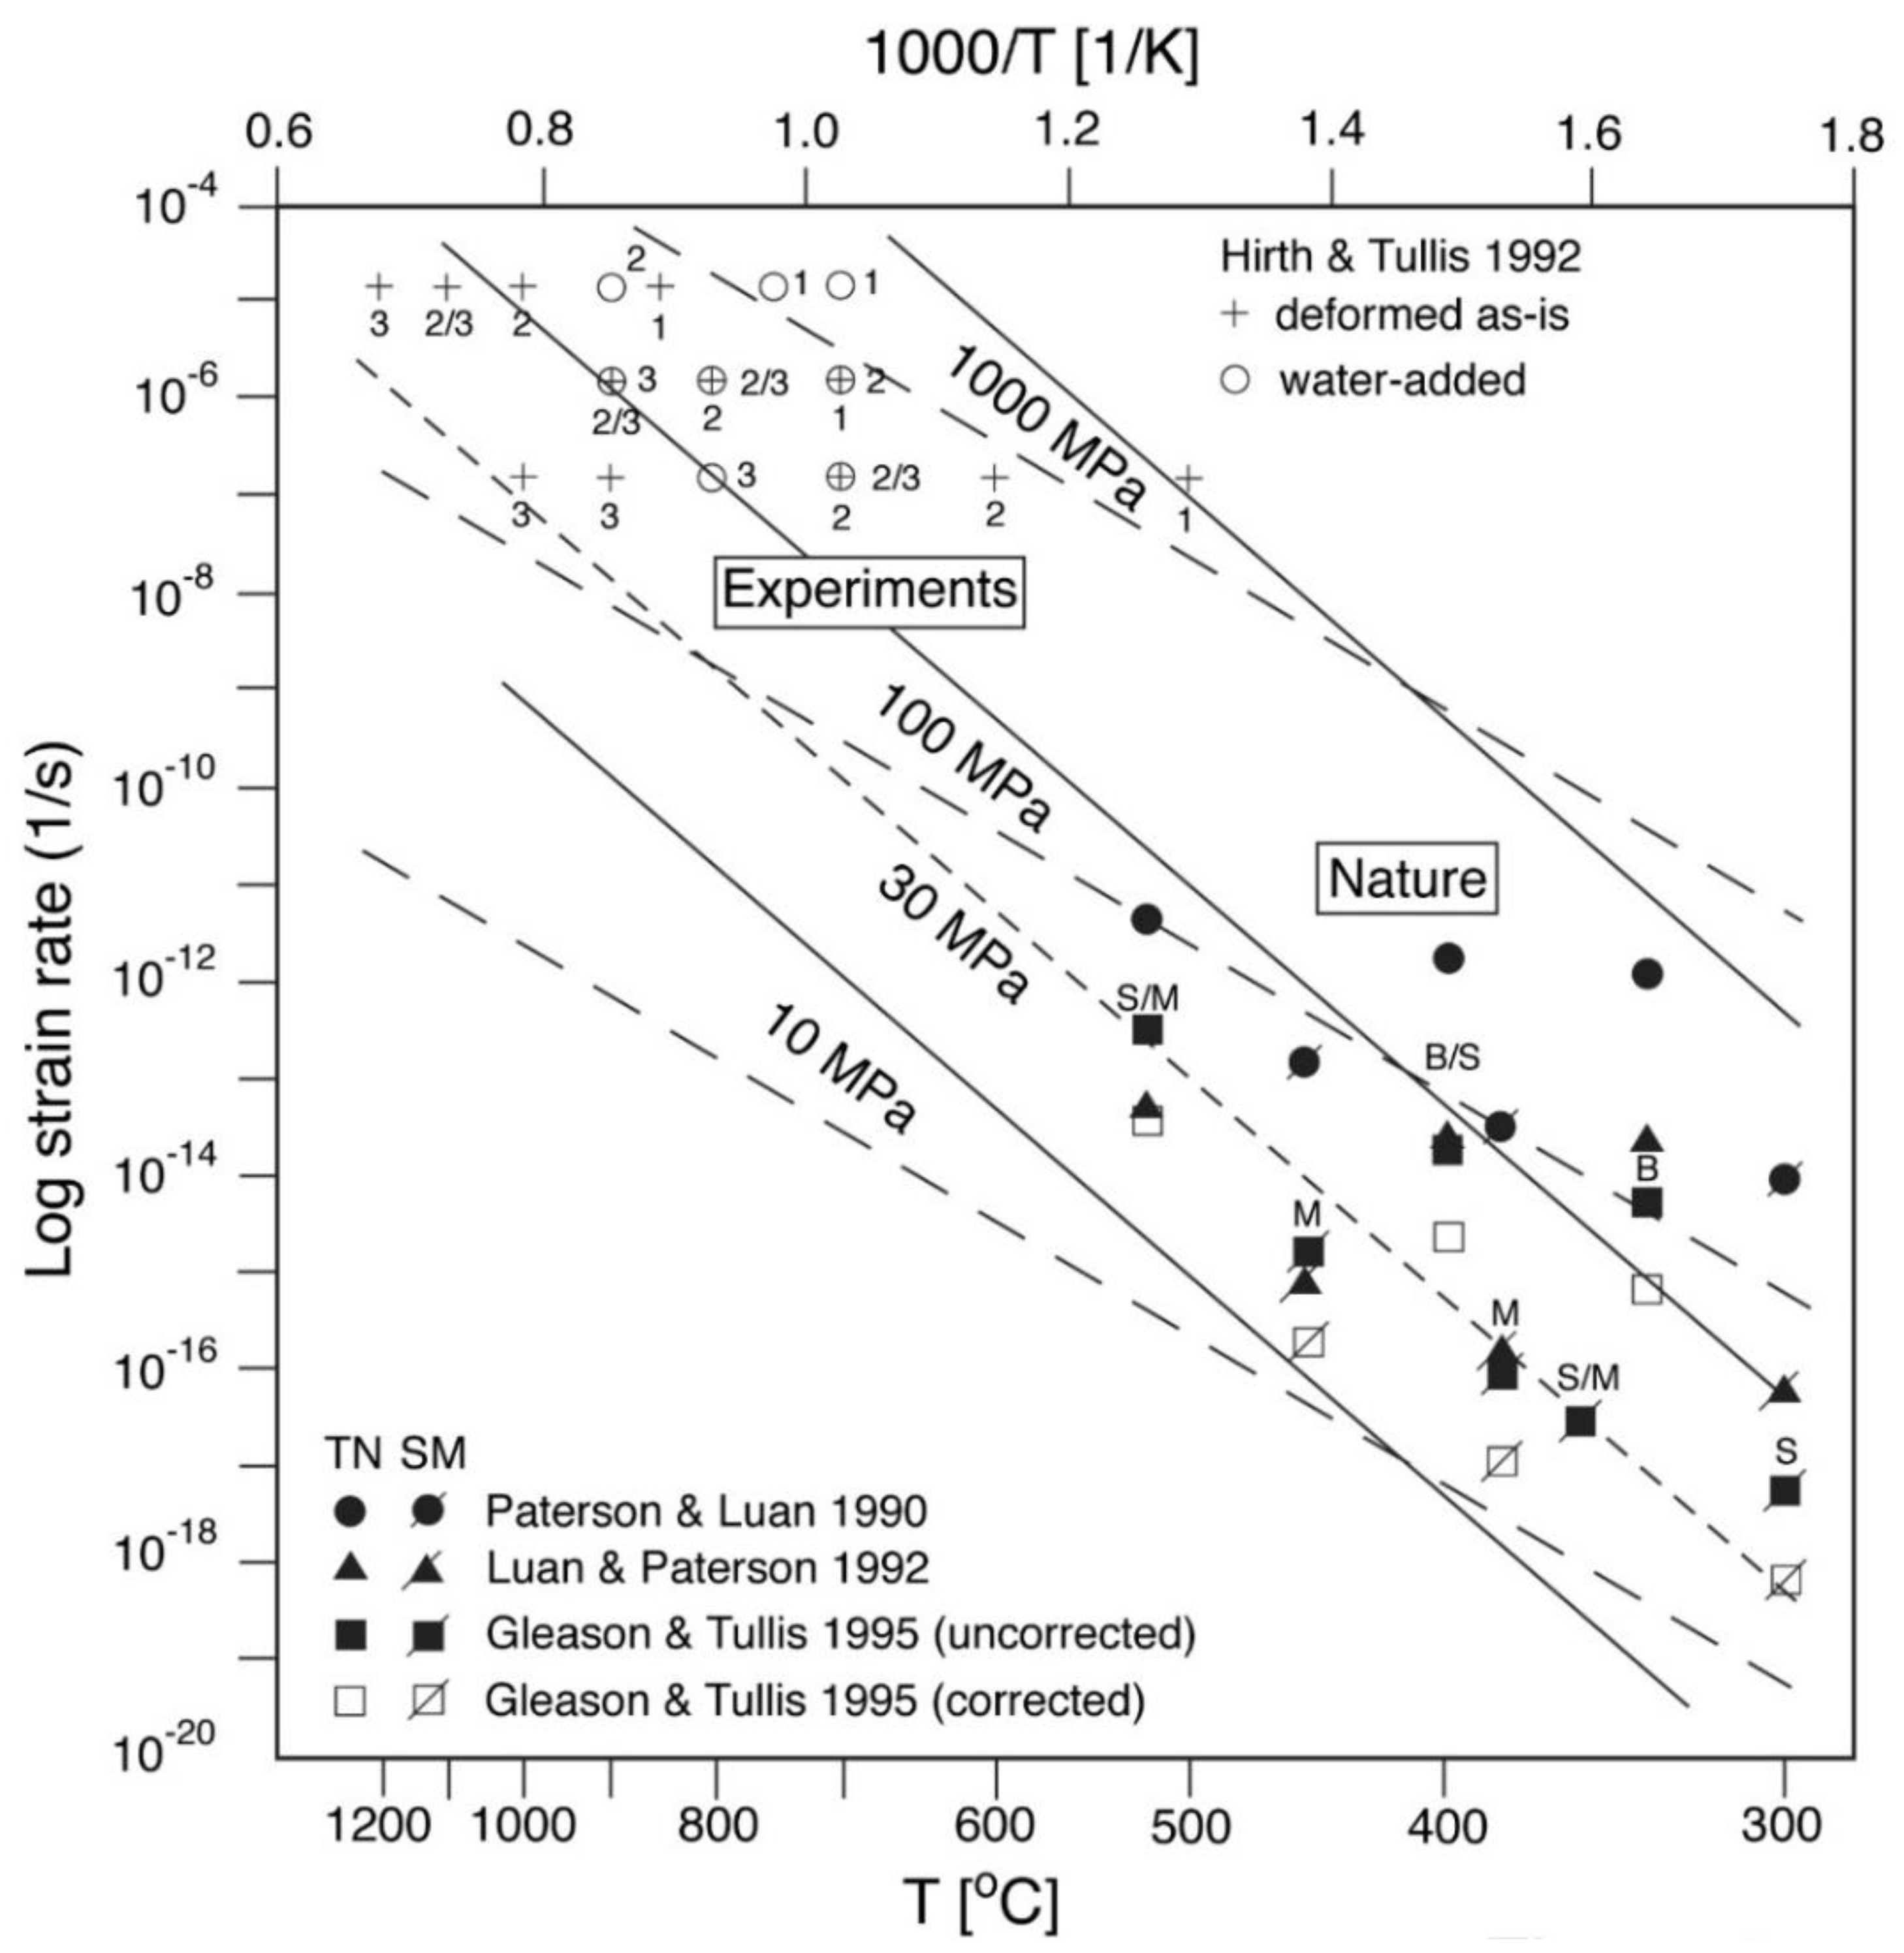
Assuming either the deformation temperature or strain rate, we can calculate either of these from the inferred paleo-differential stresses using experimental flow laws. These calculations indicate that the Sambagawa metamorphic rocks deformed at temperature conditions within the range between 300 and 450 °C, and at the strain rate within the range between 10−17 and 10−15/s during exhumation using the flow law after [75]. These results could be consistent with the inferred natural strain rates of the order of 10−15/s, considering the large uncertainties in the estimate of the paleo-differential stresses.
(5)
In comparison with the published data on naturally deformed quartz veins from the Tonale fault zone by [71], we found that the mechanism transition from the SGR to GBM recrystallization occurs at the differential stress of c. 30 MPa. The stress is roughly correlated with the experimental one by [10] (recalculated with the flow law of [75]), if the experimental microstructural regime 3 [10] is correlated with the natural SGR/GBM transition as pointed out by [23].
(6)
It has been inferred from (1) that while the garnet and albite-biotite zones in the LSL continued to deform at lower temperature conditions at 350–375 °C, the corresponding zones in the USL ceased to deform at higher temperature conditions at 400–450 °C. The increasing deformation temperature with increasing structural level could be explained by the emplacement and resultant rapid cooling of the high-grade Besshi nappe over the low-grade Oboke nappe consisting of the lower chlorite zone. The rapid cooling occurred because the resultant overturned geotherm during the emplacement was not stable, and quickly restored to a normal geotherm (i.e., increasing temperature with increasing depth) within a few myr. The Besshi nappe was further destructed by normal faulting at low temperatures around 300 °C, which is discussed elsewhere [40,49,51,52].

Funding

This study was supported in part by grants from the Japan Society for the Promotion of Science (No. 14340151, 21H01181).

Data Availability Statement

The study did not report any new data.

Acknowledgments

I particularly thank Renée Heilbronner for many fruitful discussions on deformation and recrystallization regimes and physical conditions of quartz from the Sambagawa quartz schist and veins, and some microstructural analyses on these samples during her two visits to Japan (2000, 2003), which cleared up and confirmed the deformation regimes presented in the manuscript. This study was supported in part by grants from the Japan Society for the Promotion of Science (No. 14340151, 21H01181).

Conflicts of Interest

The author declares no conflict of interest.

References

  1. Kohlstedt, D.L.; Evans, B.; Mackwell, S. Strength of the lithosphere: Constraints imposed by laboratory experiments. J. Geophys. Res. Space Phys. 1995, 100, 17587–17602. [Google Scholar] [CrossRef]
  2. Griggs, D.T.; Blacic, J.D. Quartz: Anomalous Weakness of Synthetic Crystals. Science 1965, 147, 292–295. [Google Scholar] [CrossRef] [PubMed]
  3. Baëta, R.D.; Ashbee, K.H.G. Slip systems in quartz: I. Experiments. Am. Mineral. 1969, 54, 1551–1573. [Google Scholar]
  4. Baëta, R.D.; Ashbee, K.H.G. Slip systems in quartz: II. Interpretation. Am. Mineral. 1969, 54, 1574–1582. [Google Scholar]
  5. Linker, M.F.; Kirby, S.H. Anisotropy in the Rheology of Hydrolytically Weakened Synthetic Quartz Crystals. In Mechanical Behavior of Crustal Rocks, The Handin Volume; Carter, N.L., Friedman, M., Logan, J.M., Stearns, D.W., Eds.; Geophys. Monogr. Ser. 1981; American Geophysical Union: Washington, DC, USA, 1981; Volume 24, pp. 29–48. [Google Scholar]
  6. Tullis, J.; Christie, J.M.; Griggs, D.T. Microstructures and Preferred Orientations of Experimentally Deformed Quartzites. GSA Bull. 1973, 84, 297–314. [Google Scholar] [CrossRef]
  7. Lister, G.; Dornsiepen, U. Fabric transitions in the Saxony granulite terrain. J. Struct. Geol. 1982, 4, 81–92. [Google Scholar] [CrossRef]
  8. Law, R.; Knipe, R.; Dayan, H. Strain path partitioning within thrust sheets: Microstructural and petrofabric evidence from the Moine Thrust zone at Loch Eriboll, northwest Scotland. J. Struct. Geol. 1984, 6, 477–497. [Google Scholar] [CrossRef]
  9. Schmid, S.M.; Casey, M. Complete fabric analysis of some commonly observed quartz c-axis patterns. In Mineral and Rock Deformation: Laboratory Studies, The Paterson Volume; Hobbs, B.E., Heard, H.C., Eds.; Geophys. Monogr. Ser. 1986; American Geophysical Union: Washington, DC, USA, 1986; Volume 36, pp. 263–286. [Google Scholar]
  10. Hirth, G.; Tullis, J. Dislocation creep regimes in quartz aggregates. J. Struct. Geol. 1992, 14, 145–159. [Google Scholar] [CrossRef]
  11. Muto, J.; Hirth, G.; Heilbronner, R.; Tullis, J. Plastic anisotropy and fabric evolution in sheared and recrystallized quartz single crystals. J. Geophys. Res. Space Phys. 2011, 116, 1–18. [Google Scholar] [CrossRef]
  12. Palazzin, G.; Raimbourg, H.; Stünitz, H.; Heilbronner, R.; Neufeld, K.; Précigout, J. Evolution in H2O contents during deformation of polycrystalline quartz: An experimental study. J. Struct. Geol. 2018, 114, 95–110. [Google Scholar] [CrossRef] [Green Version]
  13. Lister, G.; Paterson, M.; Hobbs, B. The simulation of fabric development in plastic deformation and its application to quartzite: The model. Tectonophysics 1978, 45, 107–158. [Google Scholar] [CrossRef]
  14. Takeshita, T.; Wenk, H.-R. Plastic anisotropy and geometrical hardening in quartzites. Tectonophysics 1988, 149, 345–361. [Google Scholar] [CrossRef]
  15. Twiss, R.J. Theory and applicability of a recrystallized grain size paleopiezometer. Pure Appl. Geophys. 1977, 115, 227–244. [Google Scholar] [CrossRef]
  16. Christie, J.M.; Ord, A. Flow stress from microstructures of mylonites: Example and current assessment. J. Geophys. Res. Space Phys. 1980, 85, 6253–6262. [Google Scholar] [CrossRef]
  17. Ord, A.; Christie, J. Flow stresses from microstructures in mylonitic quartzites of the Moine Thrust zone, Assynt area, Scotland. J. Struct. Geol. 1984, 6, 639–654. [Google Scholar] [CrossRef]
  18. Behr, W.; Platt, J. A naturally constrained stress profile through the middle crust in an extensional terrane. Earth Planet. Sci. Lett. 2011, 303, 181–192. [Google Scholar] [CrossRef]
  19. Masuda, T.; Fujimura, A. Microstructural development of fine-grained quartz aggregates by syntectonic recrystallization. Tectonophysics 1981, 72, 105–128. [Google Scholar] [CrossRef]
  20. Masuda, T. A Microstructural sequence of quartz schists in central Shikoku, south-west Japan. Tectonophysics 1982, 83, 329–345. [Google Scholar] [CrossRef]
  21. Dunlap, W.J.; Hirth, G.; Teyssier, C. Thermomechanical evolution of a ductile duplex. Tectonics 1997, 16, 983–1000. [Google Scholar] [CrossRef]
  22. Hirth, G.; Teyssier, C.; Dunlap, J.W. An evaluation of quartzite flow laws based on comparisons between experimentally and naturally deformed rocks. Inter. J. Earth Sci. 2001, 90, 77–87. [Google Scholar] [CrossRef]
  23. Stipp, M.; Stünitz, H.; Heilbronner, R.; Schmid, S.M. The eastern Tonale fault zone: A ‘natural laboratory’ for crystal plastic deformation of quartz over a temperature range from 250 to 700 °C. J. Struct. Geol. 2002, 24, 1861–1884. [Google Scholar] [CrossRef]
  24. Miyashiro, A. Evolution of Metamorphic Belts. J. Pet. 1961, 2, 277–311. [Google Scholar] [CrossRef]
  25. Faure, M.; Iwasaki, M.; Ichikawa, K.; Yao, A. The significance of Upper Jurassic radiolarians in high pressure metamorphic rocks of SW Japan. J. Asian Earth Sci. 1991, 6, 131–136. [Google Scholar] [CrossRef]
  26. Aoki, K.; Maruyama, S.; Isozaki, Y.; Otoh, S.; Yanai, S. Recognition of the Shimanto HP metamorphic belt within the traditional Sanbagawa HP metamorphic belt: New perspectives of the Cretaceous–Paleogene tectonics in Japan. J. Asian Earth Sci. 2011, 42, 355–369. [Google Scholar] [CrossRef]
  27. Nagata, M.; Miyazaki, K.; Iwano, H.; Danhara, T.; Obayashi, H.; Hirata, T.; Yagi, K.; Kouchi, Y.; Yamamoto, K.; Otoh, S. Timescale of material circulation in subduction zone: U–Pb zircon and K–Ar phengite double-dating of the Sanbagawa met-amorphic complex in the Ikeda district, central Shikoku, southwest Japan. Isl. Arc 2019, 28, e12306. [Google Scholar] [CrossRef]
  28. Itaya, T.; Takasugi, H. Muscovite K–Ar ages of the Sanbagawa schists, Japan and argon depletion during cooling and defor-mation. Contri. Mineral. Petrol. 1988, 100, 281–290. [Google Scholar] [CrossRef]
  29. Takasu, A.; Dallmeyer, R. 40Ar/39Ar mineral age constraints for the tectonothermal evolution of the Sambagawa metamorphic belt, central Shikoku, Japan: A Cretaceous accretionary prism. Tectonophysics 1990, 185, 111–139. [Google Scholar] [CrossRef]
  30. Kubota, Y.; Takeshita, T. Paleocene large-scale normal faulting along the Median Tectonic Line, western Shikoku, Japan. Isl. Arc 2007, 17, 129–151. [Google Scholar] [CrossRef]
  31. Kubota, Y.; Takeshita, T.; Yagi, K.; Itaya, T. Kinematic Analyses and Radiometric Dating of the Large-Scale Paleogene Two-Phase Faulting Along the Median Tectonic Line, Southwest Japan. Tectonics 2020, 39, e2018TC005372. [Google Scholar] [CrossRef]
  32. Higashino, T. The higher grade metamorphic zonation of the Sambagawa metamorphic belt in central Shikoku, Japan. J. Metamorph. Geol. 1990, 8, 413–423. [Google Scholar] [CrossRef]
  33. Banno, S.; Higashino, T.; Otsuki, M.; Itaya, T.; Nakajima, T. Thermal Structure of the Sanbagawa Metamorphic Belt in Central Shikoku. J.Phys. Earth 1978, 26, 345–356. [Google Scholar] [CrossRef] [Green Version]
  34. Enami, M.; Wallis, S.R.; Banno, Y. Paragenesis of sodic pyroxene-bearing quartz schists: Implications for the P-T history of the Sanbagawa belt. Contrib. Miner. Pet. 1994, 116, 182–198. [Google Scholar] [CrossRef]
  35. Wallis, S.R.; Banno, S.; Radvanec, M. Kinematics, structure and relationship to metamorphism of the east-west flow in the Sanbagawa Belt, southwest Japan. Isl. Arc 1992, 1, 176–185. [Google Scholar] [CrossRef]
  36. Hara, I.; Hide, K.; Takeda, K.; Tsukuda, E.; Tokuda, M.; Shiota, T. Tectonic movement in the Sambagawa belt. In The Sambagawa Belt; Hide, K., Ed.; Hiroshima University Press: Hiroshima Prefecture, Japan, 1977; pp. 307–390, (in Japanese with English abstract). [Google Scholar]
  37. Faure, M. Microtectonic evidence for eastward ductile shear in the Jurassic orogen of SW Japan. J. Struct. Geol. 1985, 7, 175–186. [Google Scholar] [CrossRef]
  38. Faure, M. Eastward ductile shear during the early tectonic phase in the sanbagawa belt. J. Geol. Soc. Jpn. 1983, 89, 319–329_1. [Google Scholar] [CrossRef] [Green Version]
  39. Wallis, S.R. The timing of folding and stretching in the sambagawa belt: The asemigawa region, central shikoku. J. Geol. Soc. Jpn. 1990, 96, 345–352. [Google Scholar] [CrossRef] [Green Version]
  40. Takeshita, T.; Yagi, K. Flow patterns during exhumation of the Sambagawa metamorphic rocks, southwest Japan, caused by brittle-ductile, arc parallel extension. In Vertical Coupling and Decoupling in the Lithosphere; Grocott, J., McCaffrey, K.J.W., Taylor, G., Tikoff, B., Eds.; Geological Society of London Publications: London, UK, 2004; Volume 227, pp. 279–296. [Google Scholar]
  41. Hara, I.; Shiota, T.; Hide, K.; Okamoto, K.; Takeda, K.; Hayasaka, Y.; Sakurai, Y. Nappe structure of the Sambagawa belt. J. Metamorph. Geol. 1990, 8, 441–456. [Google Scholar] [CrossRef]
  42. Hara, I.; Shiota, T.; Hide, K.; Kanai, K.; Goto, M.; Seki, S.; Kaikiri, K.; Takeda, K.; Hayasaka, Y.; Miyamoto, T.; et al. Tectonic evolution of the Sambagawa schists and its implications in convergent margin processes. J. Sci. Hiroshima Univ. Ser. C 1992, 9, 495–595. [Google Scholar]
  43. Nakamura, C.; Enami, M. Prograde amphiboles in hematite-bearing basic and quartz schists in the Sanbagawa belt, central Shikoku: Relationship between metamorphic field gradient and P-T paths of individual rocks. J. Metamorph. Geol. 1994, 12, 841–852. [Google Scholar] [CrossRef]
  44. Wintsch, R.P.; Byrne, T.; Toriumi, M. Exhumation of the Sanbagawa blueschist belt, SW Japan, by lateral flow and ex-trusion: Evidence from structural kinematics and retrograde P–T–t paths. In Exhumation Processes: Normal Faulting, Ductile Flow and Erosion; Ring, U., Brandon, M.T., Lister, G.S., Willett, S.D., Eds.; Geological Society of London Publications: London, UK, 1999; Volume 154, pp. 129–155. [Google Scholar]
  45. Banno, Y. Intermediate high-pressure exhumation of the northern segment of the Sanbagawa belt, Saruta-gawa area, central Shikoku, Japan. Lithos 2000, 50, 289–303. [Google Scholar] [CrossRef]
  46. Yagi, K.; Takeshita, T. Regional variation in exhumation and strain rate of the high-pressure Sambagawa metamorphic rocks in central Shikoku, south-west Japan. J. Metamorph. Geol. 2002, 20, 633–647. [Google Scholar] [CrossRef]
  47. Okamoto, A.; Toriumi, M. Optimal mixing properties of calcic and subcalcic amphiboles: Application of Gibbs? Method to the Sanbagawa schists, SW Japan. Contrib. Miner. Pet. 2003, 146, 529–545. [Google Scholar] [CrossRef]
  48. Tagami, M.; Takeshita, T. c-Axis fabrics and microstructures in quartz schist from the Sambagawa metamorphic belt, central Shikoku, Japan. J. Struct. Geol. 1998, 20, 1549–1568. [Google Scholar] [CrossRef]
  49. El-Fakharani, A.-H.; Takeshita, T. Brittle normal faulting in the highest-grade Sambagawa metamorphic rocks of central Shikoku, southwest Japan: Indication of the exhumation into the upper crustal level. J. Asian Earth Sci. 2008, 33, 303–322. [Google Scholar] [CrossRef]
  50. Osozawa, S.; Pavlis, T. The high P/T Sambagawa extrusional wedge, Japan. J. Struct. Geol. 2007, 29, 1131–1147. [Google Scholar] [CrossRef]
  51. Takeshita, T.; El-Fakharani, A.-H. Coupled micro-faulting and pressure solution creep overprinted on quartz schist deformed by intracrystalline plasticity during exhumation of the Sambagawa metamorphic rocks, southwest Japan. J. Struct. Geol. 2013, 46, 142–157. [Google Scholar] [CrossRef] [Green Version]
  52. Takeshita, T.; Yagi, K.; Gouzu, C.; Hyodo, H.; Itaya, T. Extensive normal faulting during exhumation revealed by the spatial variation of phengite K-Ar ages in the Sambagawa metamorphic rocks, central Shikoku, SW Japan. Isl. Arc 2015, 24, 245–262. [Google Scholar] [CrossRef]
  53. Takeshita, T.; Hara, I. c-Axis fabrics and microstructures in a recrystallized quartz vein deformed under fluid-rich greenschist conditions. J. Struct. Geol. 1998, 20, 417–431. [Google Scholar] [CrossRef]
  54. Banno, S.; Sakai, C. Geology and metamorphic evolution of the Sanbagawa metamorphic belt, Japan. In Evolution of Metamorphic Belts; Daly, J.S., Cliff, R.A., Yardley, B.W.D., Eds.; Geological Society of London Publications: London, UK, 1989; Volume 43, pp. 519–532. [Google Scholar]
  55. Yoshida, M. c-Axis Fabrics and Microstructures in Quartz Schist from the Sambagawa Metamorphic Rocks, Asemigawa-route, Central Shikoku, Japan. M. Ph.D. Thesis, Hiroshima University, Hiroshima Prefecture, Japan, 2001. [Google Scholar]
  56. National Institute of Health. NIH Image 1.62, Public Domain Image Analysis Software; National Technical Information Service: Springfield, VA, USA, 1999. [Google Scholar]
  57. Passchier, C.W.; Trouw, R.A.J. Microtectonics; Springer: Berlin, Germany, 1996; 289p. [Google Scholar]
  58. Sakakibara, N.; Kanai, K.; Kaikiri, K.; Shiota, T.; Hide, K.; Paulitsch, P.; Hara, I. Quartz microtextures of the Sambagawa schists and their implications in convergent margin processes. Isl. Arc 1992, 1, 186–197. [Google Scholar] [CrossRef]
  59. Lister, G. Discussion: Crossed-girdle c-axis fabrics in quartzites plastically deformed by plane strain and progressive simple shear. Tectonophysics 1977, 39, 51–54. [Google Scholar] [CrossRef]
  60. Wallis, S. Vorticity analysis and recognition of ductile extension in the Sanbagawa belt, SW Japan. J. Struct. Geol. 1995, 17, 1077–1093. [Google Scholar] [CrossRef]
  61. Tagami, M. c-Axis Fabrics and Microstructures in Quartz Schist from the Sambagawa Metamorphic Belt, Central Shikoku, Japan. Ph. D. Thesis, Hiroshima University, Hiroshima Prefecture, Japan, 1998. [Google Scholar]
  62. Sakakibara, N. Structural evolution of multiple ductile shear zone system in the Ryoke belt, Kinki Province. J. Sci. Hiroshima Univ. Ser. C 1995, 10, 267–332. [Google Scholar]
  63. Takeshita, T. Estimate of the physical conditions for deformation based on c-axis fabric transitions in naturally deformed quartzite. J. Geol. Soc. Jpn. 1996, 102, 211–222, (in Japanese with English abstract). [Google Scholar] [CrossRef] [Green Version]
  64. Czertowicz, T.A.; Takeshita, T.; Arai, S.; Yamamoto, T.; Ando, J.-I.; Shigematsu, N.; Fujimoto, K.-I. The architecture of long-lived fault zones: Insights from microstructure and quartz lattice-preferred orientations in mylonites of the Median Tectonic Line, SW Japan. Prog. Earth Planet. Sci. 2019, 6, 25. [Google Scholar] [CrossRef]
  65. Weathers, M.S.; Bird, J.M.; Cooper, R.F.; Kohlstedt, D.L. Differential stress determined from deformation induced micro-structures of the Moine thrust zone. J. Geophys. Res. 1979, 84, 7496–7509. [Google Scholar]
  66. Koch, P.S. Rheology and microstructures of experimentally deformed quartz aggregates. Ph.D. Thesis, University of California, Los Angeles, Los Angeles, CA, USA, 2013. [Google Scholar]
  67. Twiss, R.J. Variable sensitivity piezometric equations for dislocation density and subgrain diameter and their relevance to olivine and quartz. In Mineral and Rock Deformation: Laboratory Studies, The Paterson Volume; Hobbs, B.E., Heard, H.C., Eds.; Geophys. Monogr. Ser. 1986; American Geophysical Union: Washington, DC, USA, 1986; Volume 36, pp. 247–261. [Google Scholar]
  68. Karato, S.-I.; Toriumi, M.; Fujii, T. Dynamic recrystallization of olivine single crystals during high-temperature creep. Geophys. Res. Lett. 1980, 7, 649–652. [Google Scholar] [CrossRef]
  69. Karato, S.-I.; Toriumi, M.; Fujii, T. Dynamic Recrystallization and High-Temperature Rheology of Olivine. High-Press. Res. Geophys. 1982, 12, 171–189. [Google Scholar] [CrossRef]
  70. Toriumi, M.; Karato, S.; Fujii, T. Transient and steady state creep of olivine. In Material Science of the Earth’s Interior; Sunagawa, I., Ed.; Terra Publishing: Tokyo, Japan, 1984; pp. 281–300. [Google Scholar]
  71. Stipp, M.; Stünitz, H.; Heilbronner, R.; Schmid, S. Dynamic recrystallization of quartz: Correlation between natural and ex-perimental conditions. In Deformation Mechanisms, Rheology and Tectonics: Current Status and Future Perspectives; De Meer, S., Drury, M.R., De Bresser, J.H.P., Pennock, G.M., Eds.; Geological Society of London Publications: London, UK, 2002; Volume 43, pp. 519–532. [Google Scholar]
  72. Twiss, R.J. Static theory of size variation with stress for subgrains and dynamically recrystallized grains. In US Geological Survey Open-File Report, Proceedings of the IX. Conference, Magnitude of Deviatroic Stresses in the Earth’s Crust and Upper Mantle, Menlo Part, CA, USA, January 1980; USGS, Ed.; US Geological Survey: Reston, VA, USA, 1980; Volume 80–625, pp. 665–683. [Google Scholar]
  73. Paterson, M.S.; Luan, F.C. Quartzite rheology under geological conditions. In Deformation Mechanisms, Rheology and Tec-Tonics; Knipe, R.J., Rutter, E.H., Eds.; Geological Society of London Publications: London, UK, 1990; Volume 54, pp. 299–307. [Google Scholar]
  74. Luan, F.C.; Paterson, M.S. Preparation and deformation of synthetic aggregates of quartz. J. Geophys. Res. Space Phys. 1992, 97, 301–320. [Google Scholar] [CrossRef]
  75. Gleason, G.C.; Tullis, J. A flow law for dislocation creep of quartz aggregates determined with the molten salt cell. Tectonophysics 1995, 247, 1–23. [Google Scholar] [CrossRef]
  76. Takeshita, T. Dynamic analysis of deformed quartz grains from the folded Middle Miocence Momonoki Subgroup of central Japan: Origin of healed microcracks. Tectonophysics 1995, 245, 277–297. [Google Scholar] [CrossRef]
  77. Stöckhert, B.; Brix, M.R.; Kleinschrodt, R.; Hurford, A.J.; Wirth, R. Thermochronometry and microstructures of quartz e a comparison with experimental flow laws and predictions on the temperature of the brittle-plastic transition. J. Struct. Geol. 1999, 21, 351–359. [Google Scholar] [CrossRef]
  78. Herwegh, M.; Handy, M.R. The evolution of high-temperature mylonitic microfabrics: Evidence from simple shearing of a quartz analogue (norcamphor). J. Struct. Geol. 1996, 18, 689–710. [Google Scholar] [CrossRef] [Green Version]
  79. Moriyama, Y.; Wallis, S. Three-dimensional finite strain analysis in the high-grade part of the Sanbagawa Belt using deformed meta-conglomerate. Isl. Arc 2002, 11, 111–121. [Google Scholar] [CrossRef]
  80. Heilbronner, R.; Tullis, J. The effect of static annealing on microstructures and crystallographic preferred orientations of quartzites experimentally deformed in axial compression and shear. In Deformation Mechanisms, Rheology and Tectonics: Current Status and Future Perspectives; De Meer, S., Drury, M., De Bresser, J., Pennock, G., Eds.; Geological Society of London Publications: London, UK, 2002; Volume 200, pp. 191–218. [Google Scholar]
  81. Tsuru, T.; Park, J.; Miura, S.; Kodaira, S.; Kido, Y.; Hayashi, T. Along-arc structural variation of the plate boundary at the Japan Trench margin: Implication of interplate coupling. J. Geophys. Res. Space Phys. 2002, 107, ESE 11-1–ESE 11-15. [Google Scholar] [CrossRef]
  82. Nishikawa, T.; Matsuzawa, T.; Ohta, K.; Uchida, N.; Nishimura, T.; Ide, S. The slow earthquake spectrum in the Japan Trench illuminated by the S-net seafloor observatories. Science 2019, 365, 808–813. [Google Scholar] [CrossRef]
  83. Nakata, R.; Hori, T.; Miura, S.; Hino, R. Presence of interplate channel layer controls of slip during and after the 2011 Tohoku-Oki earthquake through the frictional characteristics. Sci. Rep. 2021, 11, 1–11. [Google Scholar] [CrossRef]
  84. Fitch, T.J. Plate convergence, transcurrent faults, and internal deformation adjacent to Southeast Asia and the western Pacific. J. Geophys. Res. Space Phys. 1972, 77, 4432–4460. [Google Scholar] [CrossRef]
  85. Rutter, E.; Brodie, K. Experimental intracrystalline plastic flow in hot-pressed synthetic quartzite prepared from Brazilian quartz crystals. J. Struct. Geol. 2004, 26, 259–270. [Google Scholar] [CrossRef]
  86. Dodson, M.H. Closure temperature in cooling geochronological and petrological systems. Contrib. Miner. Pet. 1973, 40, 259–274. [Google Scholar] [CrossRef]
  87. Itaya, T.; Tsujimori, T.; Liou, J.G. Evolution of the Sanbagawa and Shimanto high-pressure belts in SW Japan: Insights from K–Ar (Ar–Ar) geochronology. J. Asian Earth Sci. 2011, 42, 1075–1090. [Google Scholar] [CrossRef]
  88. Spear, F.S. Metamorphic Phase Equilibria and Pressure-Temperature-Time Paths; Mineralogical Society of America: Washington, DC, USA, 1993; p. 799. [Google Scholar]
Figure 1. (a) Simplified index map of SW Japan and Shikoku Island. (b) Metamorphic zonal map of the Sambagawa metamorphic belt, central Shikoku (study area) after [32]. (c) Cross-section across central Shikoku (Kamio-Asemi River section). Modified after [29,33,34]. (d) Phengite and amphibole K-Ar and 40Ar/39Ar ages along the Kamio-Asemi River Traverse after [28,29]. The traverse line (I-I’) of (c) cross-section and (d) age distribution is shown in (b). MTL, Median Tectonic Line; I-STL. Itoigawa-Shizuoka Tectonic Line.
Minerals 11 01038 g001
Figure 2. Locality map of quartz schist samples for quartz c-axis fabric, recrystallized quartz grain size, and shape analyses (locality of Figure 2 is shown in Figure 1b). A-A’ is the traverse line on which the data and calculated values (Figure 3, Figure 6, and Figure 7) of each sample are projected. Note that for samples T2 and T9, the quartz c-axis fabrics are shown in Figure 5, but the recrystallized quartz grain size and shape are not analyzed for T2. Readers can also refer to Figure 2 of [20] for the sample localities. For sample numbers analyzed by [46], see their Table 2. For area II and III, see text.
Minerals 11 01038 g002
Figure 3. Plot of (a) the recrystallized grain size and (b) aspect ratio along the Asemi-Saruta-Dozan River traverse, which are projected on the traverse line (A-A’ shown in Figure 2). Since the layers uniformly strike WNW-ENE and dip north at 20–50°, the horizontal distance along the traverse line shown by the horizontal axis is roughly proportional to the thickness normal to the layers. Different symbols indicate grain size and shape data after different authors, which are shown in (a). See Figure 2 for the sample localities of [20,46,55]. Arrows indicate a large difference from the average value in (a) the recrystallized grain size and (b) aspect ratio, which can be interpreted as overprinting deformation (see text). “Type I” and “type II” with arrows at both ends (a) indicate the spatial distribution of type I and type II crossed girdle quartz c-axis fabrics, which develop in quartz schist samples. In (b), arrows at both ends indicate the spatial distribution of S-type and P-type recrystallized quartz grains after [20], which is inferred to be formed by subgrain rotation (SGR) and grain boundary migration (GBM) recrystallization, respectively (see text). See text for abbreviations of each of the peak-metamorphic zones.
Minerals 11 01038 g003
Figure 4. Microphotographs (crossed polarized light) showing microstructures in recrystallized quartz grains. (a) Quartz schist from the garnet zone of the LSL. Recrystallized quartz veins from the (b) garnet zone (0152504) of the LSL, (c) albite-biotite zone of the LSL (0152506), and (d) albite-biotite zone of the USL (0152510). Note that dynamic recrystallization occurs by subgrain rotation in (a) shown by serrated boundaries of recrystallized grains and subgrain formation. Note dynamic recrystallization is not complete in (b), suggesting subgrain rotation recrystallization, while it occurs by grain boundary migration in (c) and (d) shown by lobate boundaries of recrystallized grains and complete dynamic recrystallization. Note also that the recrystallized quartz grain size in the albite-biotite zone is larger in the (d) USL than in (c) LSL. Sample localities are shown in Figure 2. Grt, garnet; Ep, epidote.
Minerals 11 01038 g004
Figure 5. Typical examples of each of (a) type I (T9) and (b) type II (T2) crossed girdle quartz c-axis fabrics in quartz schist samples from the study area. Upper-hemisphere and equal-area projections. Contours are 1%, 2%, 3%, and 4% per 1% area, and shaded above 1% per 1% area. Sm and Lm indicate foliation defined by the shape fabric of phengite, and lineation defined by that of amphibole and/or elongate quartz. A couple of arrows indicates the sense of shear inferred from the asymmetry of quartz c-axis fabric patterns showing a top to the west sense for both samples. N is the number of measurements. Localities of samples T9 and T2 are shown in Figure 2. These quartz c-axis fabrics, which are reproduced after [61], are also reproduced in [40,46].
Minerals 11 01038 g005
Figure 6. Plot of calculated flow stress (MPa) along the Asemi-Saruta-Dozan River traverse, using the piezometer of [72], where the empirical constants, A and x (see text), are 676 and 0.68, respectively. Solid and open circles are data after [46,55], respectively (also see Figure 3a). For overprinting shown by arrows, see the captions of Figure 3a and text for explanations. See text for abbreviations of each of the peak-metamorphic zones.
Minerals 11 01038 g006
Figure 7. Plot of the calculated (a) strain rate (log ε ˙ ) and (b) deformation temperature (T) along the Asemi-Saruta-Dozan River traverse, using the constitutive equation after [75], where the physical constant A, n, and E (see text) are 1.1 × 10⁻⁴ [MP−ns−1], 4.0, and 223 [kJ mol−1], respectively. In (a), deformation temperatures are assumed (model 1), as shown on the top horizontal line, while in (b), a constant strain rate of 5 × 10⁻¹⁶ [s−1] is assumed (model 2). See the captions of Figure 3a and text for explanations. Additionally, see text for abbreviations of each of the peak-metamorphic zones.
Minerals 11 01038 g007
Figure 8. Plot of the logarithm of strain rate ( ε ˙ ) versus 1/T showing the experimental data by [10], and natural data from the Sambagawa metamorphic rocks (this study, shown by dashed symbols below SM) and the Tonale Line (modified after [71], shown by symbols below TL). Note that in experiments by [10], some of the experiments on deformed as-is (shown by +) and water-added (shown by a circle) samples are conducted at the same physical conditions. In such cases, the symbols are superposed, and deformation regimes for experiments on deformed as-is and water-added samples are shown below and at the right of the superposed symbols, respectively. The strain rates for samples from both Sambagawa Belt and Tonale Line were calculated from the inferred differential stresses from the piezometer of [72] and assumed deformation temperatures (see text), using the flow laws of different authors (shown by different symbols). For the Sambagawa Belt, the results are shown for four representative samples (T11 at T = 300 °C, 38 at T = 355 °C, 35 at T = 380 °C, and 18 at T = 450 °C; see Figure 8 and Table 2 of [46] for the localities and numbers of each sample). The lines of constant flow stresses from the flow laws of [74,75] are shown by long-dashed and solid lines, respectively. Inferred recrystallization regimes at each of the deformation temperatures for both Sambagawa Belt and Tonale Line are shown by abbreviations: B (bulging), B/S (bulging-subgrain rotation transition), S (subgrain rotation), S/M (subgrain rotation-grain boundary migration transition), and M (grain boundary migration). Note that both natural data at the S/M transition from the Sambagawa Belt and Tonale Line, and the experimental data at regime 3 roughly lie on the iso-stress line of 30 MPa calculated from the flow law of [75]. Modified after Figure 8 of [71], but the flow law of [75] was not modified, as conducted in [71]. See text for further explanations.
Minerals 11 01038 g008
Figure 9. Schematic diagram to show the proposed structural development during exhumation of the Sambagawa metamorphic rocks. Stage I: Subduction and exhumation of different metamorphic zones 1 through 4. These zones successively subducted and were exhumed in this order acquiring the unique phengite K-Ar ages. TA, trench axis. Stage II: Emplacement of the Besshi nappe over the Oboke nappe at the later stage of the D1 phase. During the nappe emplacement, schematically illustrated D1 folds were formed by an E-W flow [35]. The main schistosity (S1) is parallel to the axial plane of D1 fold (not illustrated). A pair of symbols consisting of a dot and cross in a circle indicates the sense of the E-W flow (top to the west sense). The upper chlorite zone of the upper structural level is probably eroded at present. Stage III: Large-scale normal faulting at the D2 phase, which destructed the structure of the Besshi nappe. Large arrows indicate the sense of fault movement (normal sense). See text for further explanations.
Minerals 11 01038 g009
Figure 10. Schematic diagram to show the proposed development of geotherm during emplacement of the Besshi nappe (stage II in Figure 9). (1) Geotherm immediately after the nappe emplacement, and (2) development within a few myr after it are shown. The geotherm immediately after the nappe emplacement (t = 0 myr) and at a few myr after it (t = a few myr) is shown by dashed and solid lines, respectively. The equilibrium geotherm (20 °C/km) is drawn based on the peak-metamorphic conditions of the different metamorphic zones [34]. A pair of symbols consisting of a dot and cross in a circle in the inset diagram of (1) indicates the sense of the E-W flow (top to the west sense). See text for further explanations.
Minerals 11 01038 g010
Publisher’s Note: MDPI stays neutral with regard to jurisdictional claims in published maps and institutional affiliations.

