Article

Steady-State Microstructures of Quartz Revisited: Evaluation of Stress States in Deformation Experiments Using a Solid-Medium Apparatus

by
Ichiko Shimizu
1,* and
Katsuyoshi Michibayashi
2
1
Division of Earth and Planetary Sciences, Graduate School of Science, Kyoto University, Sakyo-ku, Kyoto 606-8502, Japan
2
Department of Earth and Planetary Sciences, Graduate School of Environmental Studies, Nagoya University, Chigusa-ku, Nagoya 464-8601, Japan
*
Author to whom correspondence should be addressed.
Minerals 2022, 12(3), 329; https://doi.org/10.3390/min12030329
Submission received: 31 January 2022 / Revised: 1 March 2022 / Accepted: 3 March 2022 / Published: 6 March 2022

Abstract

:
Dynamically recrystallizing quartz is believed to approach a steady-state microstructure, which reflects flow stress in dislocation creep. In a classic experimental study performed by Masuda and Fujimura in 1981 using a solid-medium deformation apparatus, two types of steady-state microstructures of quartz, denoted as S and P, were found under varying temperature and strain rate conditions. However, the differential stresses did not systematically change with the deformation conditions, and unexpectedly high flow stresses (over 700 MPa) were recorded on some experimental runs compared with the applied confining pressure (400 MPa). Internal friction in the sample assembly is a possible cause of reported high differential stresses. Using a pyrophyllite assembly similar to that used in the previous work and setting up paired load cells above and below the sample assembly, we quantified the frictional stress acting on the sample and corrected the axial stress. The internal friction changed in a complicated manner during pressurization, heating, and axial deformation at a constant strain rate. Our results suggest that Masuda and Fujimura overestimated the differential stress by about 200 MPa in their 800 °C runs. Crystallographic fabrics in the previous experimental sample indicated that the development of elongated quartz grains, which are characteristics of Type-S microstructures, was associated with preferential growth of unfavorably oriented grains during dynamic recrystallization.

1. Introduction

Since the discovery of hydrolytic weakening of quartz by D.T. Griggs in 1967 [1], solid-medium deformation apparatus have been utilized to simulate plastic deformation of quartz in the Earth’s crust, since high-pressure conditions, and consequently, high water fugacity conditions favorable for quartz deformation [2,3] can be relatively easily attained by compressing solid confining medium. Masuda and Fujimura [4] (hereafter referred to as MF) conducted axisymmetric compression tests on agate in wide ranges of temperatures ( T = 700–1000 °C) and strain rates ( ε ˙ = 10 4 –10 6 s 1 ) at a confining pressure ( P c ) of 400 MPa using a solid-medium deformation apparatus developed by M. Kumazawa (hereafter referred to as Kumazawa apparatus) [5], as described below, and distinguished two types of quartz microstructures, denoted S and P, in recrystallized samples (Figure 1). Type S was characterized by the dominance of elongated recrystallized grains with undulose extinction and serrated grain boundaries, which occurred at low-T/high- ε ˙ conditions. Type P was characterized by a polygonal microstructure with relatively strain-free equant grains, which were observed at high-T/low- ε ˙ conditions.
Currently, Griggs-type solid-medium apparatuses [6] are most commonly used in the study of deformation mechanisms and flow laws [7,8], crystallographic fabrics [9,10,11], and dynamic recrystallization of quartz [12,13,14,15], whereas gas-medium apparatuses have also been employed to obtain accurate rheological data [16,17,18,19]. Using Griggs apparatus, Hirth and Tullis [12] conducted axial compression tests of quartzite at a 1.5 GPa confining pressure and reported three distinct types of microstructures, denoted as Regimes 1, 2, and 3, from low-T/high- ε ˙ to high-T/low- ε ˙ conditions. In Regime 1, grain boundary bulging occurred, and recrystallization began at the margins of deformed quartzite grains. Regime 2 was characterized by highly deformed porphyroclastic cores surrounded by mantles of recrystallized grains formed by subgrain rotation. In Regime 3, grain boundary migration was activated and the quartzite samples were perfectly altered into the aggregates of recrystallized grains. The experimental ε ˙ T conditions of Hirth and Tullis largely overlap with those of MF (Figure 1).
Figure 1. Summery of deformation experiments of agate conducted by Masuda and Fujimura [4]. Numbers indicate the differential stress (in GPa) at 10% strain. The blue dashed line shows the boundary between Type-S and Type-P microstructures. Red dashed lines show the dislocation creep regime boundaries for samples of quartzite with water added defined by Hirth and Tullis [12].
Minerals 12 00329 g001
Although the quartz microstructures defined by MF were different from those of Regimes 1–3 of Hirth and Tullis, some similarities can be found between them [20,21]. An implicit assumption of MF is that recrystallized microstructures have attained a steady state that is only dependent on the state variables of ε ˙ and T. If this is the case, the transient microstructures of deformed quartzite in Regimes 1 and 2 would evolve into steady-state ones of Type S or P with increasing strain [21]. The S–P boundary is approximately linear in the logarithmic strain rate vs. reciprocal temperature ( log ε ˙ T 1 ) diagram, implying that shape changes in recrystallized grains were controlled by thermally activated processes. Quantitative analysis of grain boundary morphologies [20] suggested that the S–P transition occurred with an increasing Zener–Holloman parameter (Z), which is a function of differential stress ( σ ) in steady-state creep.
To date, close relationships between flow stress and recrystallized grain size of quartz have been discussed [13,14,21,22], while little attention has been given to the morphologies of recrystallized grains. Theoretical models of grain size piezometer have assumed the microstructures in dynamic recrystallization to be steady-state ones [23,24]. However, complete recrystallization of quartz was not achieved at low-T and high- ε ˙ conditions when using natural quartzite as a starting material [12,13]. In contrast, starting with a very fine-grained material of agate and conducting large strain experiments, MF obtained fully recrystallized quartz aggregates that appeared to reach steady states in wide ranges of T and ε ˙ . Microstructures similar to Type S and Type P are commonly observed in quartz schists [25,26], originating from siliceous sedimentary rocks on the top of the oceanic crust, which possibly govern the rheology of interplate megathrusts [27]. Further knowledge of the morphologies of recrystallized quartz grains might provide additional information for estimating differential stresses in subduction zones.
Despite the importance of the microstructural evidence provided by MF, their mechanical data (Figure 4 of [4]) showed no systematic changes with T and ε ˙ that would be expected from the change in Z, and the yield stress exceeded the limit of the so-called Goetze criterion ( σ < P c ) [28], which is generally accepted as the upper stress limit of plastic deformation without cataclasis and semibrittle deformation [11,29]. An important factor that needs to be considered is the frictional force in the solid confining medium, which apparently causes large σ in the stress–strain curves. For Griggs-type apparatus, the effects of internal friction in the sample assemblies have been investigated [30,31], and calibration methods for the sample assembly have been proposed [32,33]. However, no detailed calibration data for stress measurements have been presented for the Kumazawa apparatus, although a relatively hard material of pyrophyllite was used as confining medium in the early work of MF.
In this paper, we examine the experimental procedures of MF and evaluate stress states in the solid-medium assembly using an advanced measurement system, and thereby evaluate the reliability of the classical work on steady-state microstructures of quartz. We also analyze a selected sample of MF using an electron backscatter diffraction (EBSD) techniques to clarify deformation and recrystallization processes related to microstructural evolution.

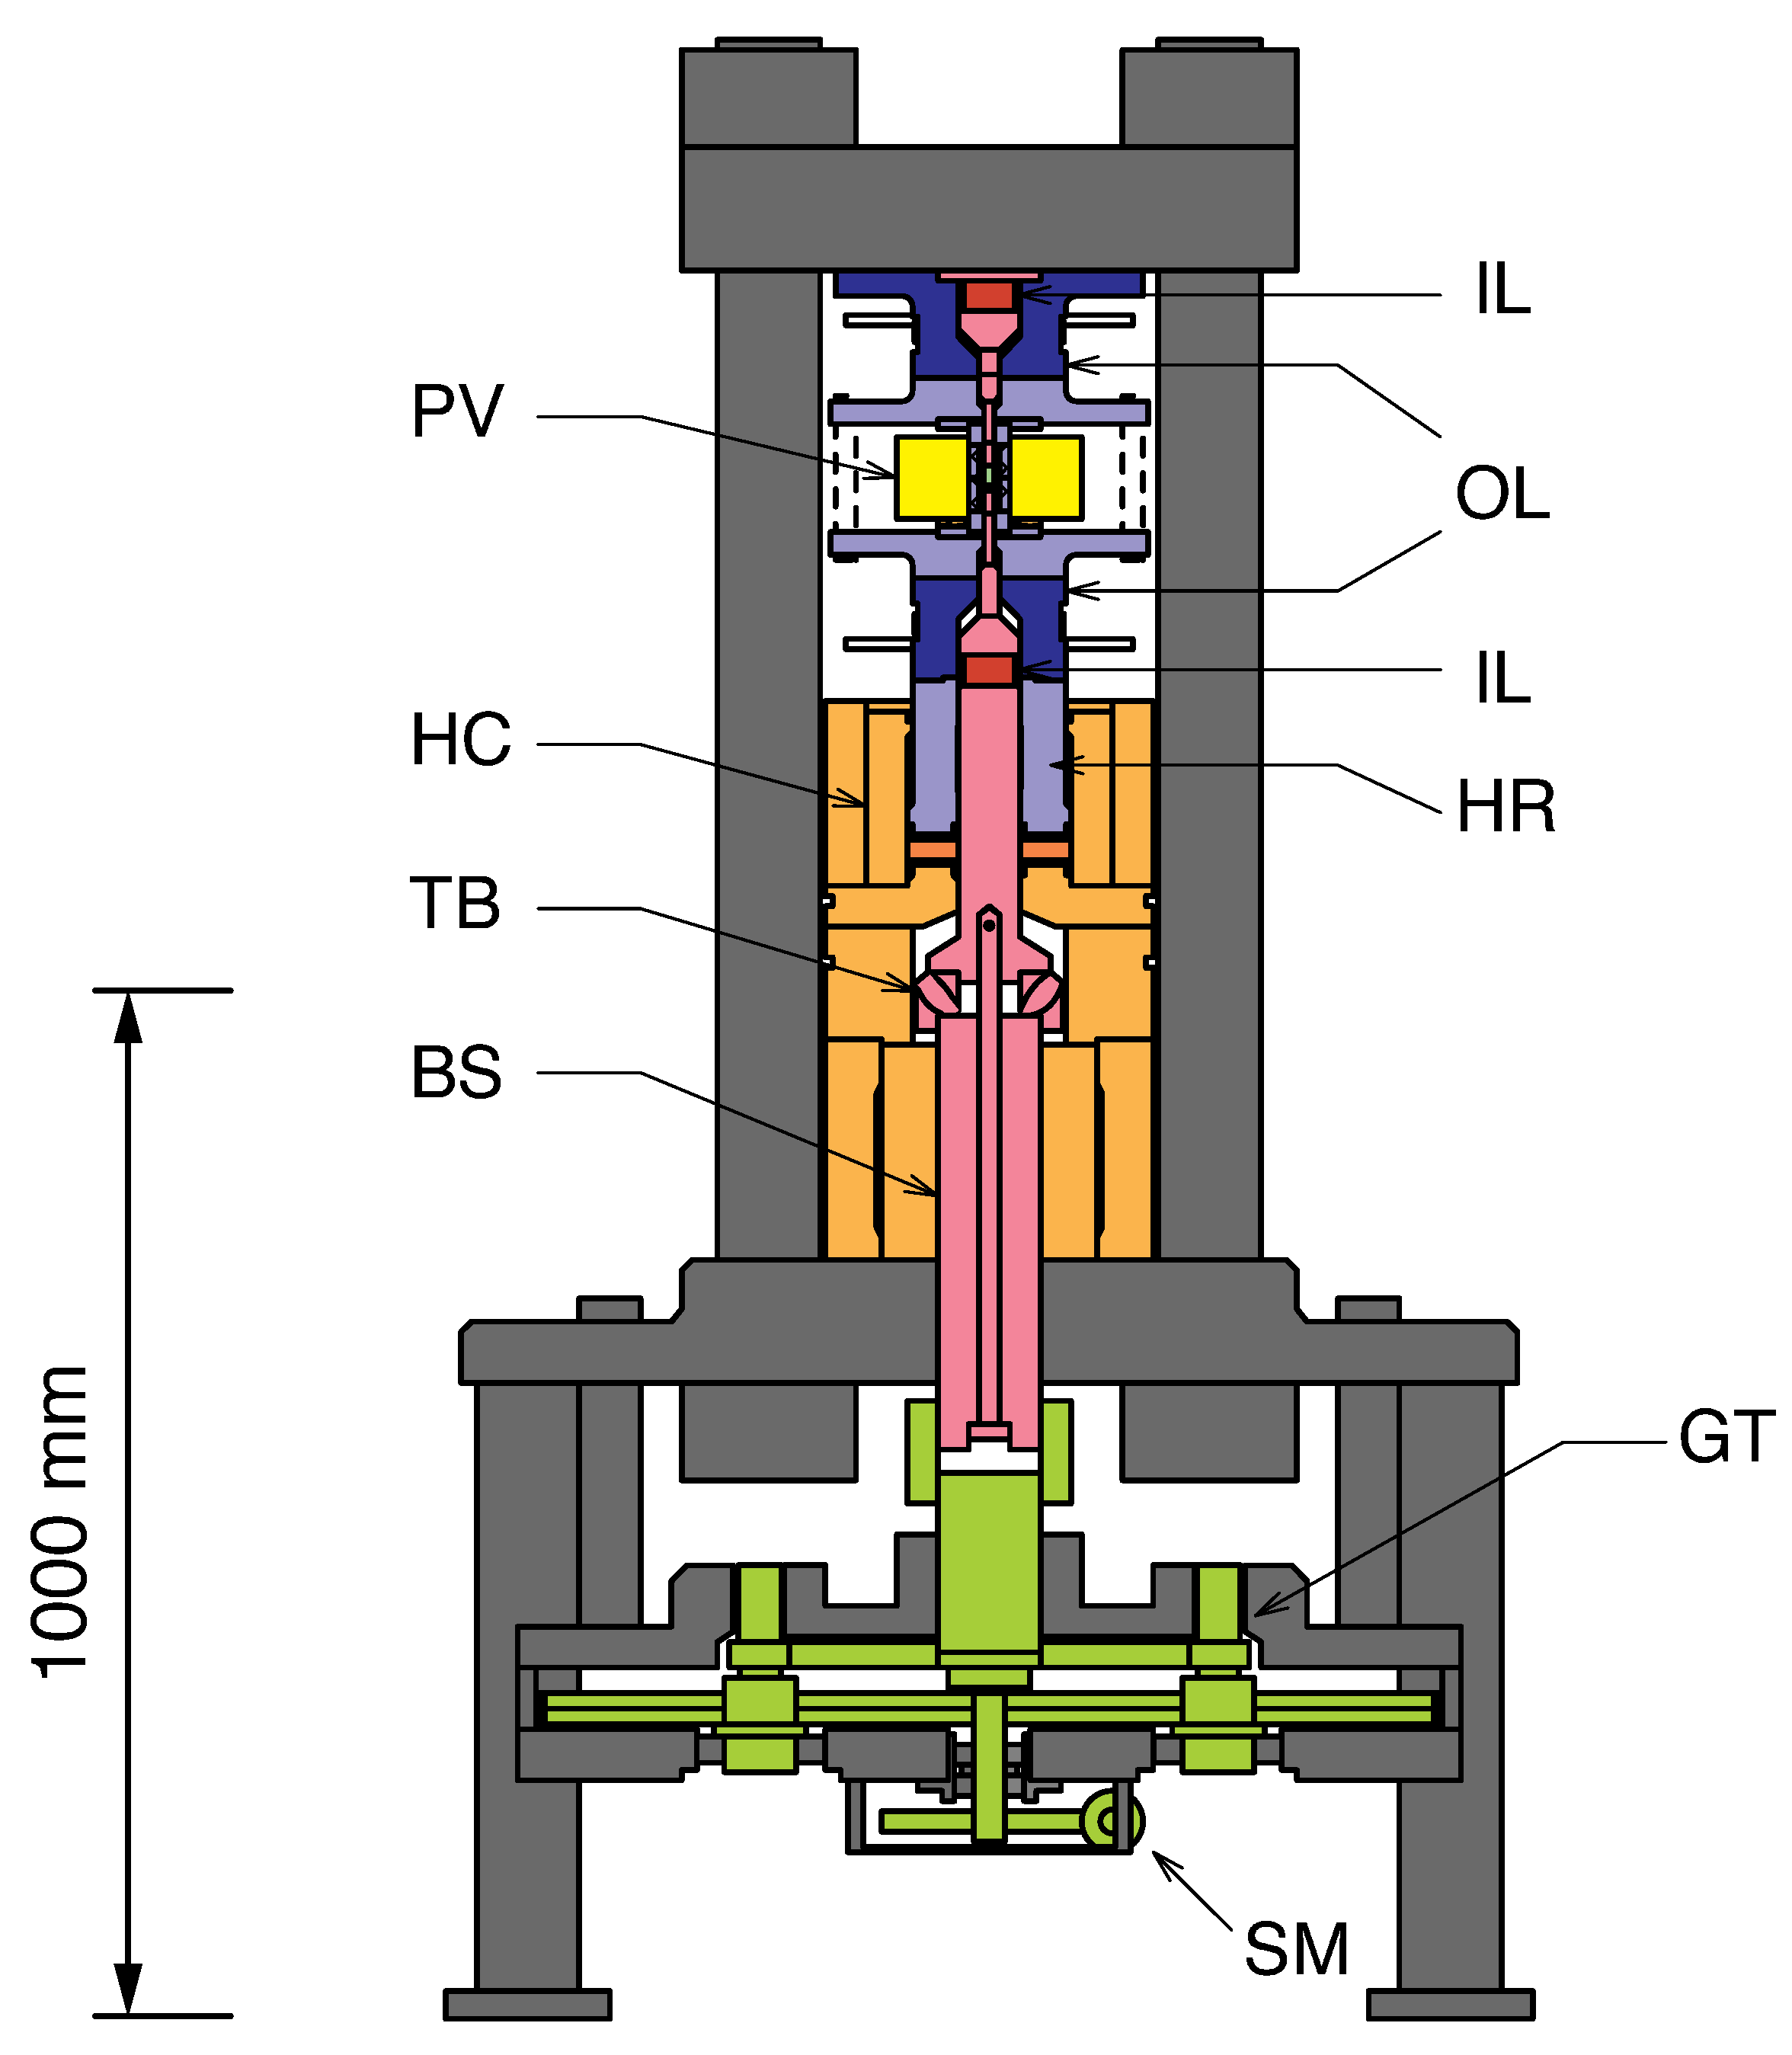
2. Deformation Apparatus

The Kumazawa apparatus was developed at Nagoya University and built by OKUMA Co. in 1965 [5,34]. This apparatus consists of a 200-ton press frame, a hydraulic ram driven by a hand pump, a motor–gear train system, a ball screw with a thrust bearing at its end, a pressure vessel (high-pressure cylinder), and two concentric opposing pistons, where the outer pistons provide confining pressure, while the inner pistons provide axial strain. Later, the motor and part of the gear train were replaced with a stepping motor system (Figure 2). The basic architecture described here is similar to that of a modified Griggs apparatus [6], but the loading systems are on the opposite sides, and its sample assembly utilizing a sample diameter of 10 mm is much larger than the one used in Griggs-type apparatus. Using a standard pressure vessel with an inside diameter of 40 mm, a confining pressure of up to 1 GPa and an axial stress of up to 2 GPa are generated.
The most unique feature of the Kumazawa apparatus is its stress measurement system. The vertical forces acting on the inner and outer pistons are measured by two couples of load cells, which are placed above and below the pressure vessel. Tsukahara and others [35] stated that, "Two readings of an axial force given by both upside and down side load cells show usually a deviation of 0 to 1.5 kbar (the value varies with strain rate, confining pressure, temperature, sample assembly, etc.) This deviation is attributable to the friction between the pressure medium and the specimen, and that between the pressure medium and the piston. Therefore, a mean value of the readings of the upside and downside is expected to give the force acting on the specimen." However, the complicated behaviors of the force data acquired by an original analogue measurement system were not well understood, and only the lower load cells were used in the experiments of MF (T. Masuda, personal communication). To evaluate the internal friction in the solid confining medium, we activated all load cells as originally designed and monitored the force data with a digitized data acquisition system. The principle of the stress measurements is detailed below.

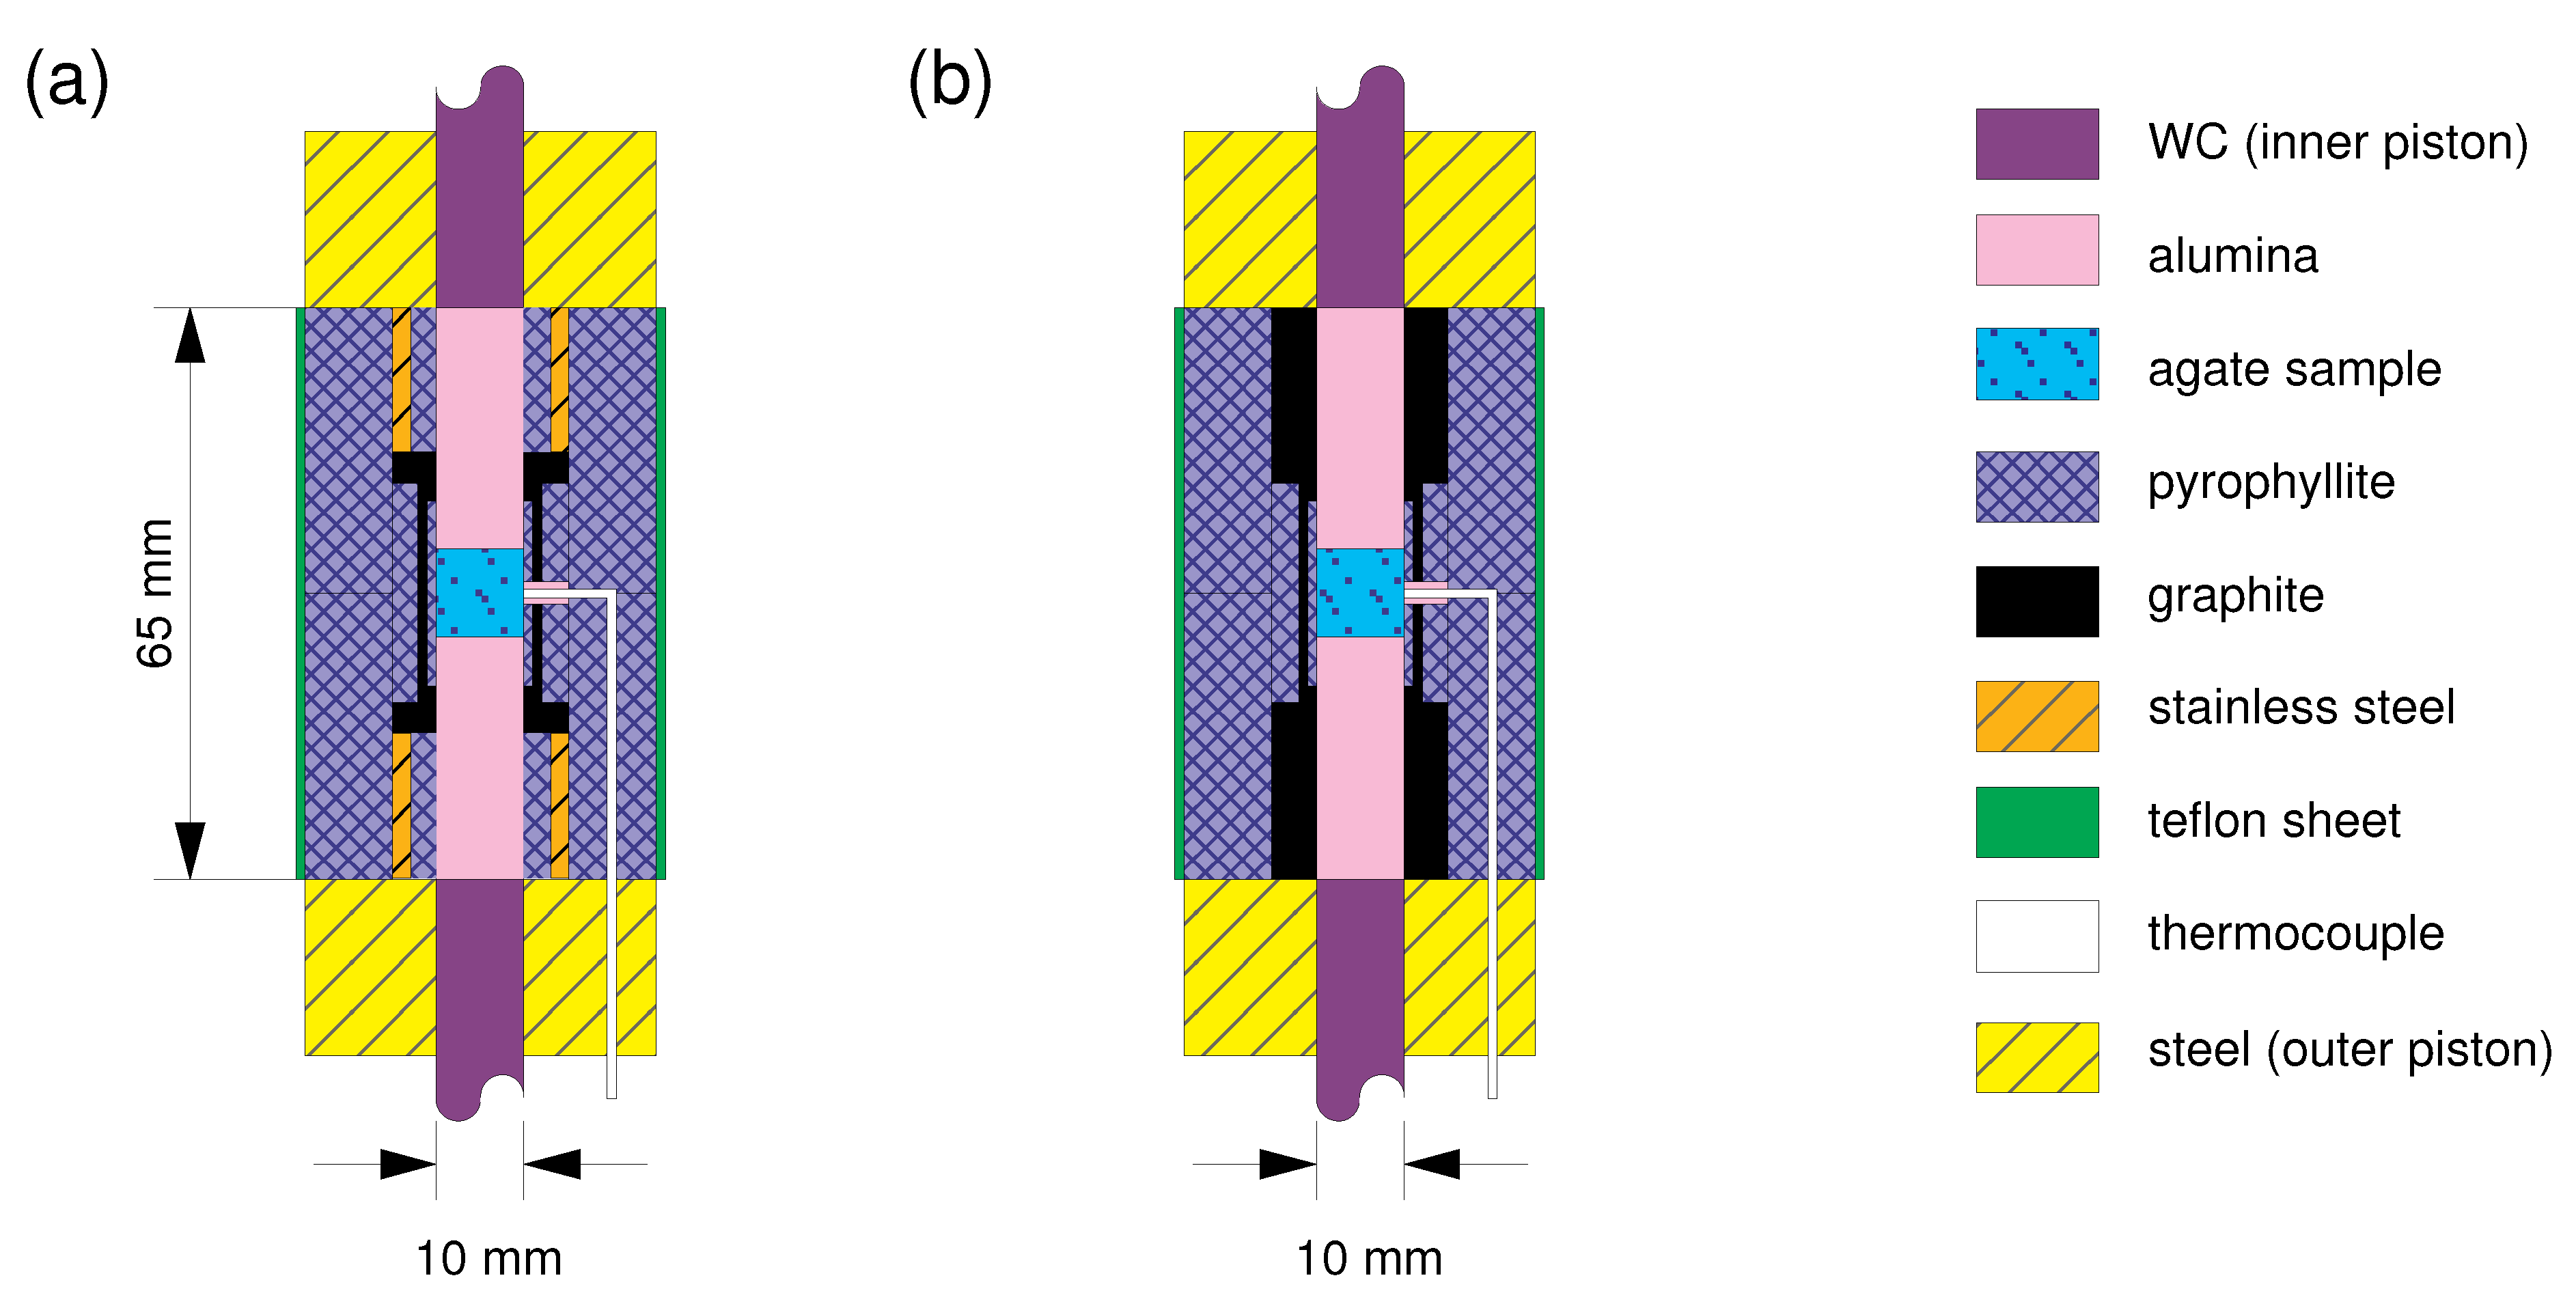
3. Experimental Setup

Experiments were carried on a whitish sample of agate, which is characterized by a parallel alignment of cryptocrystalline quartz fibers similar to the "feather agate" of MF (Figure 3a). Using an infrared microscope (Jasco IRT-3000) attached to a Fourier transform infrared (FTIR) spectrometer (Jasco FT/IR-6100) and a conventional calibration method proposed by Nakashima and others [36], the water content of the starting agate sample was quantified as 1.3–1.6 wt.%. This can be converted to 1.1–1.4 wt.% H 2 O in terms of Paterson’s calibration method [37,38].
EBSD analysis was conducted with a scanning electron microscope (JEOL JSM 6300) equipped with an EBSD detector controlled by the Channel 5 software (HKL Technology) at Shizuoka University. An EBSD map of undeformed sample is presented in Figure 3b. The crystallographic orientations in the white areas were undetermined probably due to very fine grain sizes. The pole figures showed a point maximum of a-axis and m-poles parallel to the quartz fibers, which is associated with a strong c-axis girdle pattern (Figure 3c).
The sample assembly (Figure 4b) was similar to that used by MF (Figure 4a), but some of the pyrophyllite inner sleeves and stainless steel rings were replaced with graphite sleeves. A cylindrical sample of agate with a diameter of 10 mm and a length of 10 mm was sandwiched by alumina pistons, and both were set in a pyrophyllite confining medium and a graphite furnace. The agate sample was prepared so that the quartz fibers were oriented parallel to the cylinder axis. The deformation condition was therefore, totally axisymmetric. The pyrophyllite sleeve was used to maintain "wet" environments above its dehydration temperature (ca. 500 °C).
In the standard procedure of deformation experiments using Griggs-type apparatus, the axial force piston is placed within the confining medium during pressurization and the sample is hit at the beginning of a constant strain rate test. In contrast, in the experiments conducted by MF, alumina pistons were in contact with the sample from the beginning and axial and confining stresses were independently measured. To avoid fracturing and deformation during pressurization, P c and axial stress were increased simultaneously before starting a high-temperature deformation experiment. In the present study, we first conducted a pressure stepping test in which the inner and outer pistons were moved alternately to clarify the frictional behavior in the sample assembly. Heating tests and constant strain rate tests were also conducted using the same assembly. The experimental conditions of each test are listed in Table 1.

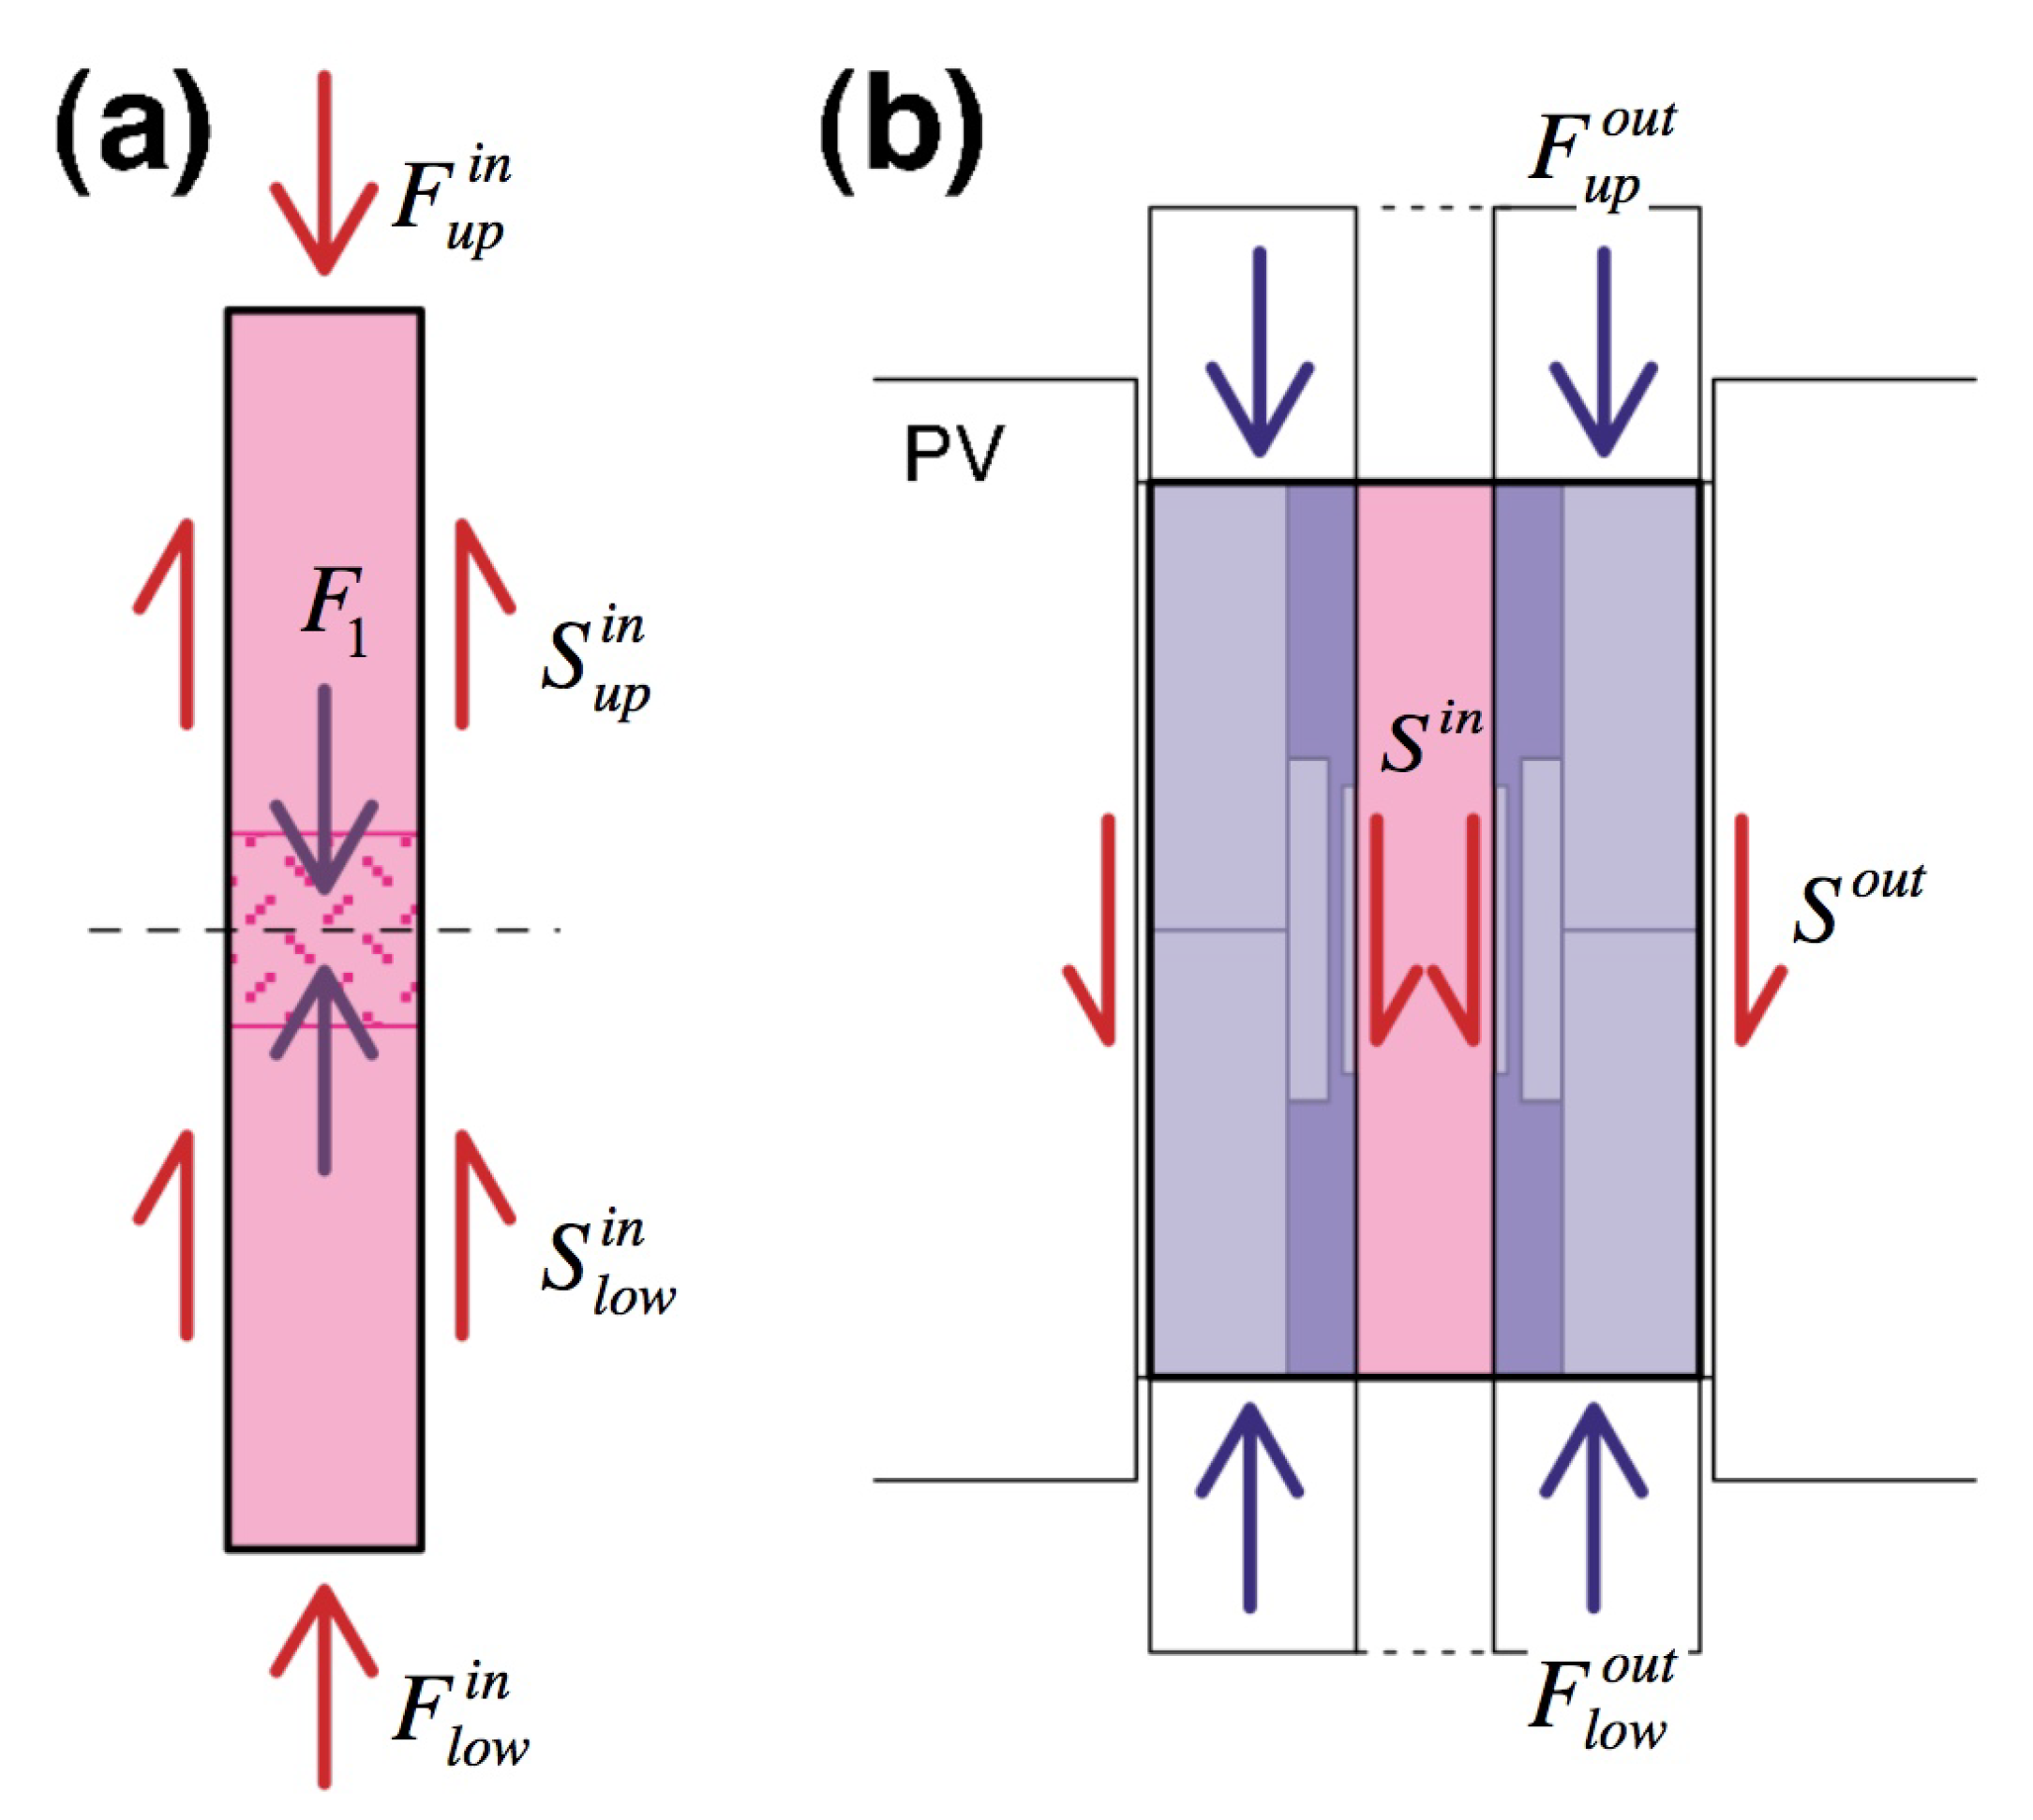
4. Principle of Stress Measurements

Hereafter, the central part of the assembly, which consisted of the sample and inner pistons, is referred to as the “cylinder core.” The vertical force acting on the cylinder core was measured by the inner load cells. The force balance of the upper and lower half parts of the cylinder core is expressed as:
F u p i n = F 1 + S u p i n F l o w i n = F 1 S l o w i n ,
where F u p i n and F l o w i n are the forces measured by the upper and lower load cells, respectively; F 1 is the axial force at the center of the sample; and S u p i n and S l o w i n are the shear forces on the upper and lower halves, respectively, (Figure 5a). The axial stresses σ u p and σ l o w measured above and below the cylinder core, respectively, are written as:
σ u p = F u p i n / A 1 i n σ l o w = F l o w i n / A 1 i n ,
where A 1 i n is the intersection area of the cylinder core. However, these equations do not give the true axial stress σ 1 = F 1 / A 1 i n at the center of the sample. Due to the vertical symmetry of the solid assembly, we can assume S u p i n = S l o w i n . Then, we obtain:
σ 1 = F u p i n + F l o w i n 2 A 1 i n .
The average shear stress τ between the cylinder core and the confining medium is S i n / A c , where S i n = S u p i n + S l o w i n is the total shear force necessary to drag the cylinder core up and A c is the side area of the cylinder core. Thus, from Equation (1), we have:
τ = F u p i n F l o w i n A c .
The force acting on the confining medium is measured by another couple of load cells placed at the upper and lower parts of the outer pistons. The apparent confining pressure,
P c a p p = F u p o u t + F l o w i n 2 A 1 o u t
is not equal to the true value of P c , because the Teflon sheet covering the solid assembly has a finite shear strength. Moreover, if the stress field in the solid confining medium is not hydrostatic, the vertical stress deviates from P c [39]. Hence, we determined a calibration parameter γ = P c / P c a p p from the transition point of NH 4 F at 370 MPa. The force balance with respect to the confining medium is expressed as:
F l o w o u t = F u p o u t + S i n + S o u t ,
where S o u t is the shear force between the confining medium and the pressure vessel (Figure 5b). S o u t due to the gravity force of the pressure vessel is much smaller than other terms. If S o u t is neglected, we obtain another expression for τ :
τ = F u p o u t F l o w o u t A c .

5. Experimental Results

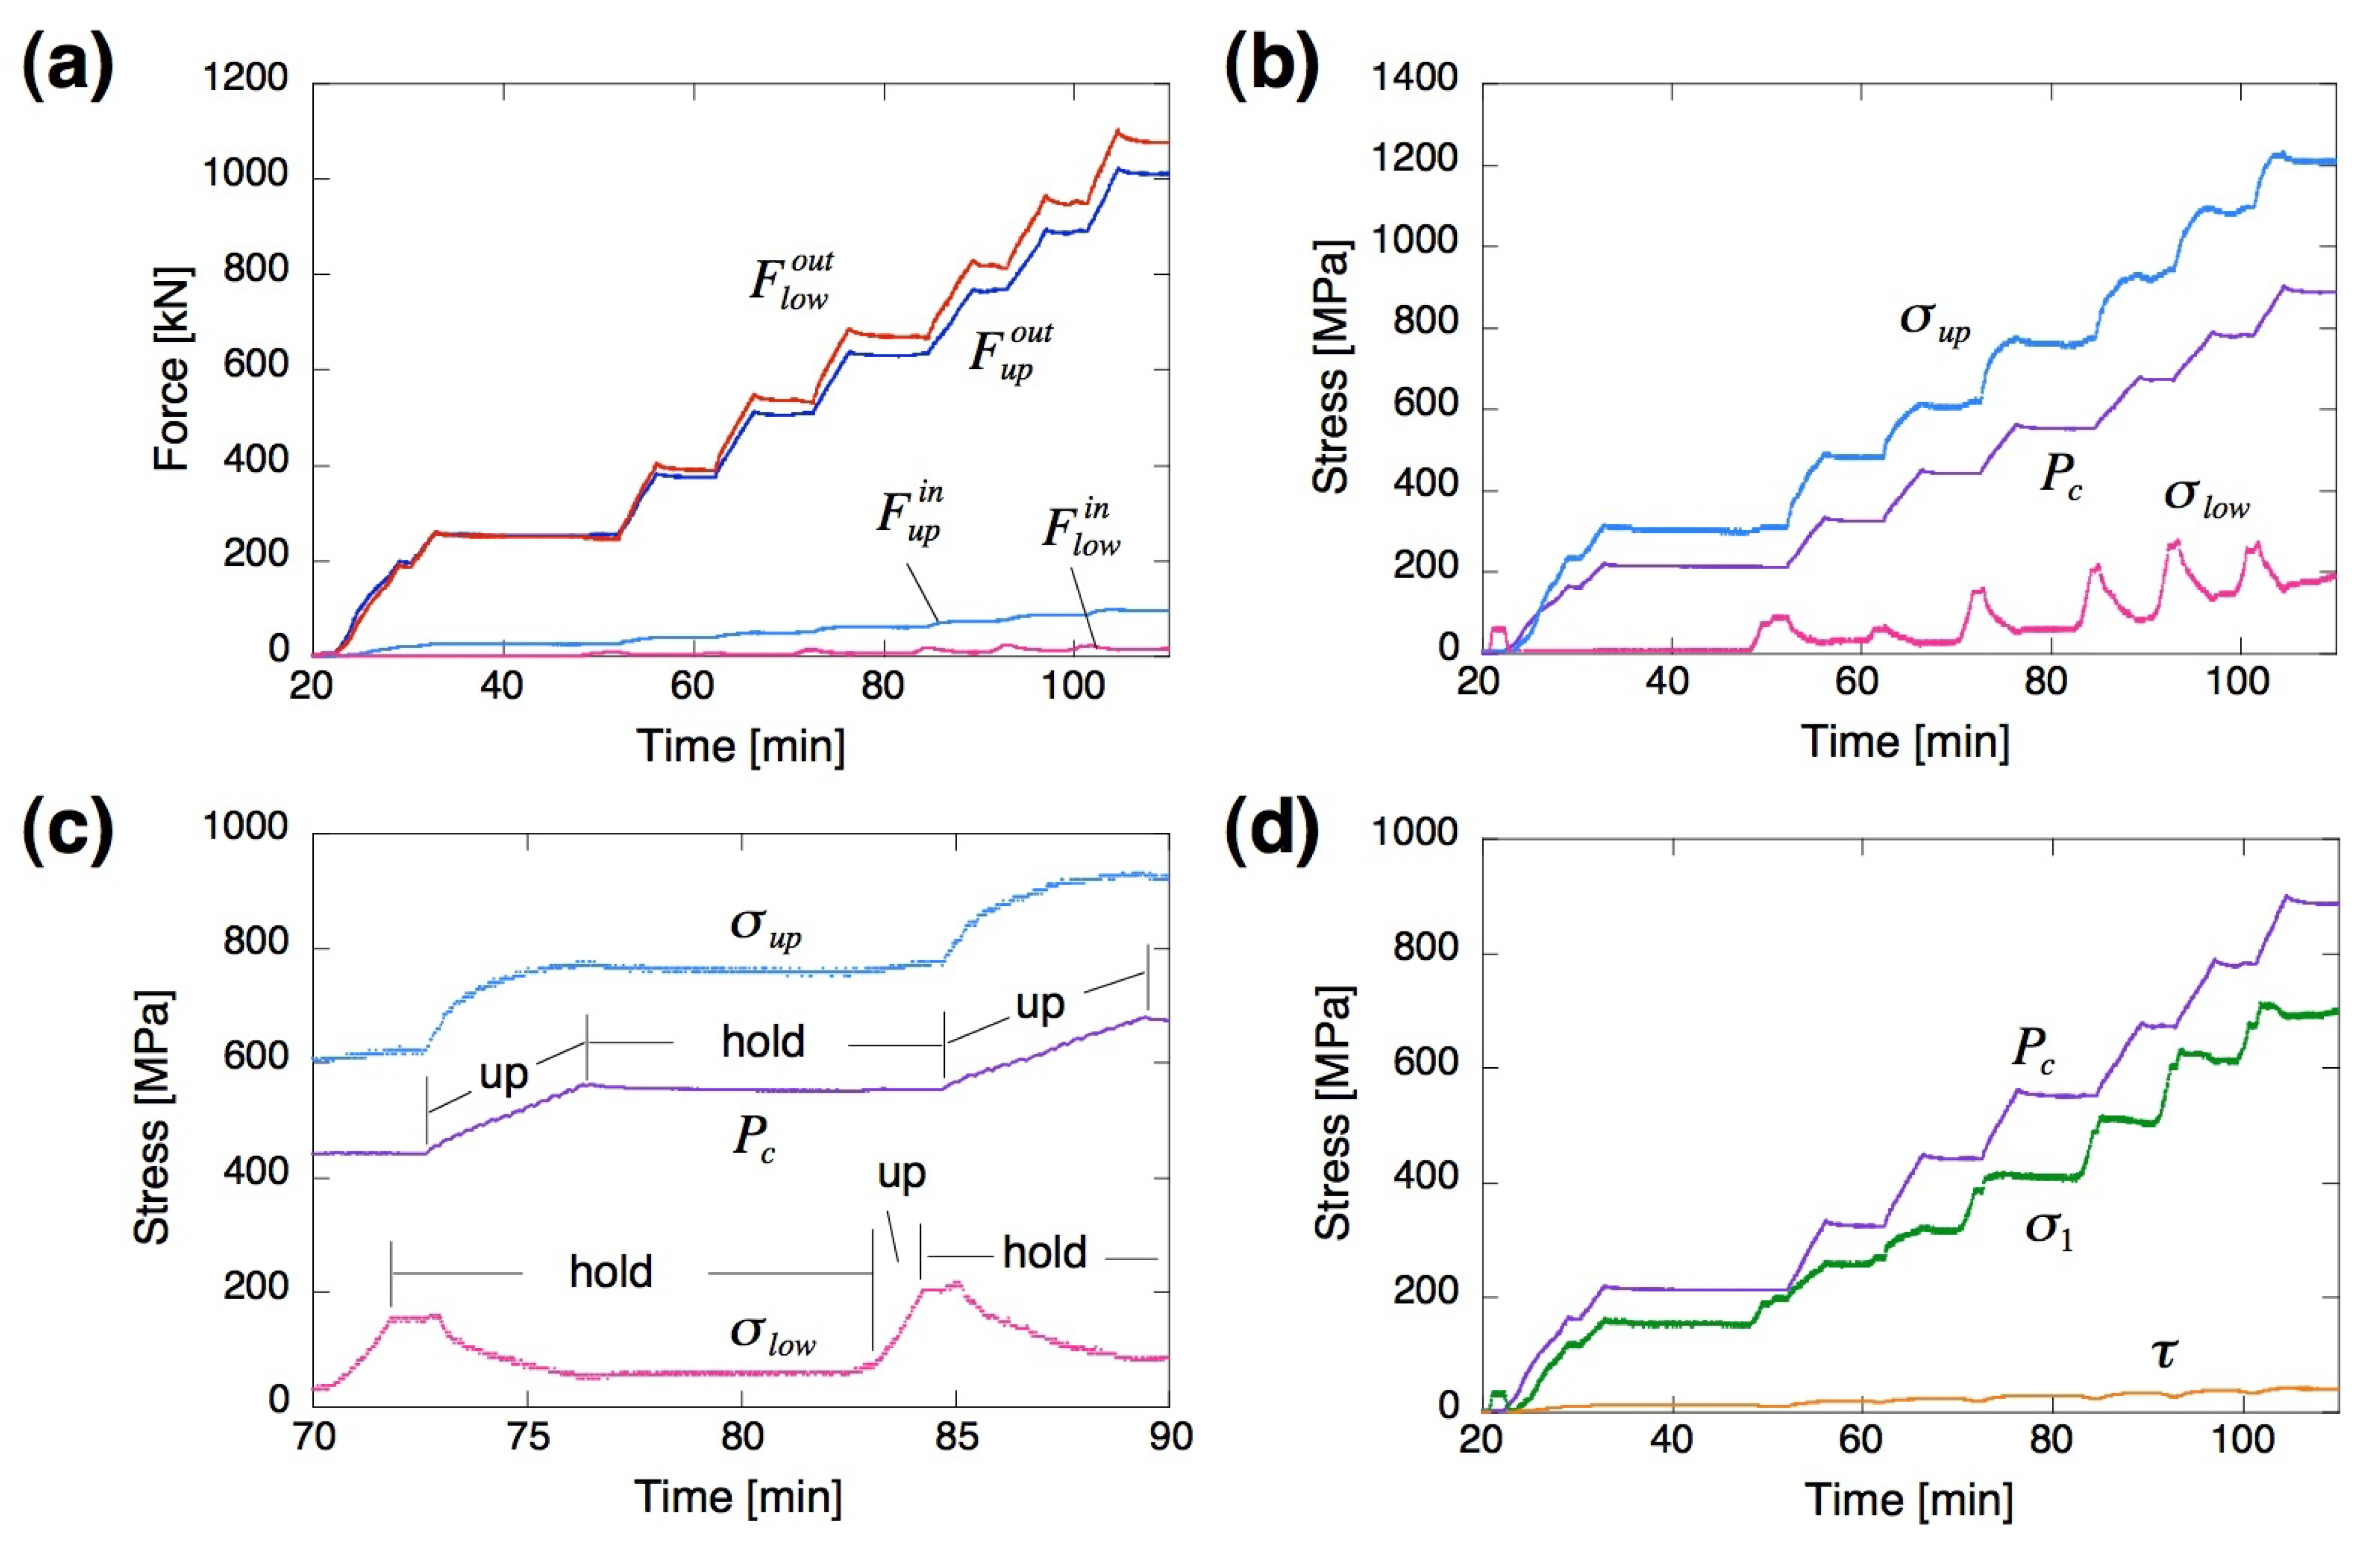
5.1. Pressure Stepping Test

In the pressure stepping test (S07), P c and σ 1 were alternately increased at room temperature. Figure 6a shows the force data acquired by each load cell. As expected from Equations (4) and (7), the difference between the upper and lower forces on the outer pistons was about the same as that for the inner pistons. The deviation of the upper and lower load cell data increased during pressurization, and at a 800 MPa confining pressure the difference between σ u p and σ l o w reached almost 1 GPa (Figure 6b). When the hydraulic ram moved upward and P c increased, σ u p also increased whereas σ l o w decreased, although the inner pistons were held in the same positions (Figure 6c). When the positions of both the outer and inner pistons were maintained, the forces were kept constant. When the inner pistons were pushed up while the outer pistons remained, σ l o w increased whereas σ u p decreased. The complicated behaviors observed here can be understood by the change in the dragging force acting on the cylinder core (Figure 5). Figure 6d shows the axial stress given by Equation (3) and the average shear stress given by Equation (4). The transient increase/decrease in apparent stress due to the movement of the outer piston was almost canceled out in the calculated value of σ 1 .

5.2. Heating Test

Following the pressure stepping test, the sample was heated to 500 °C in 40 min, while the outer and inner pistons were held in the same positions. Then, P c and σ 1 increased due to thermal expansion of the solid materials (Figure 6e). The increase in P c was relatively small, probably because the temperature was lower on the outside of the graphite furnace, and because thermal stress in the confining medium could be relaxed by compacting pyrophyllite. As the temperature increased, τ decreased from 40 MPa to 28 MPa (Figure 6f).

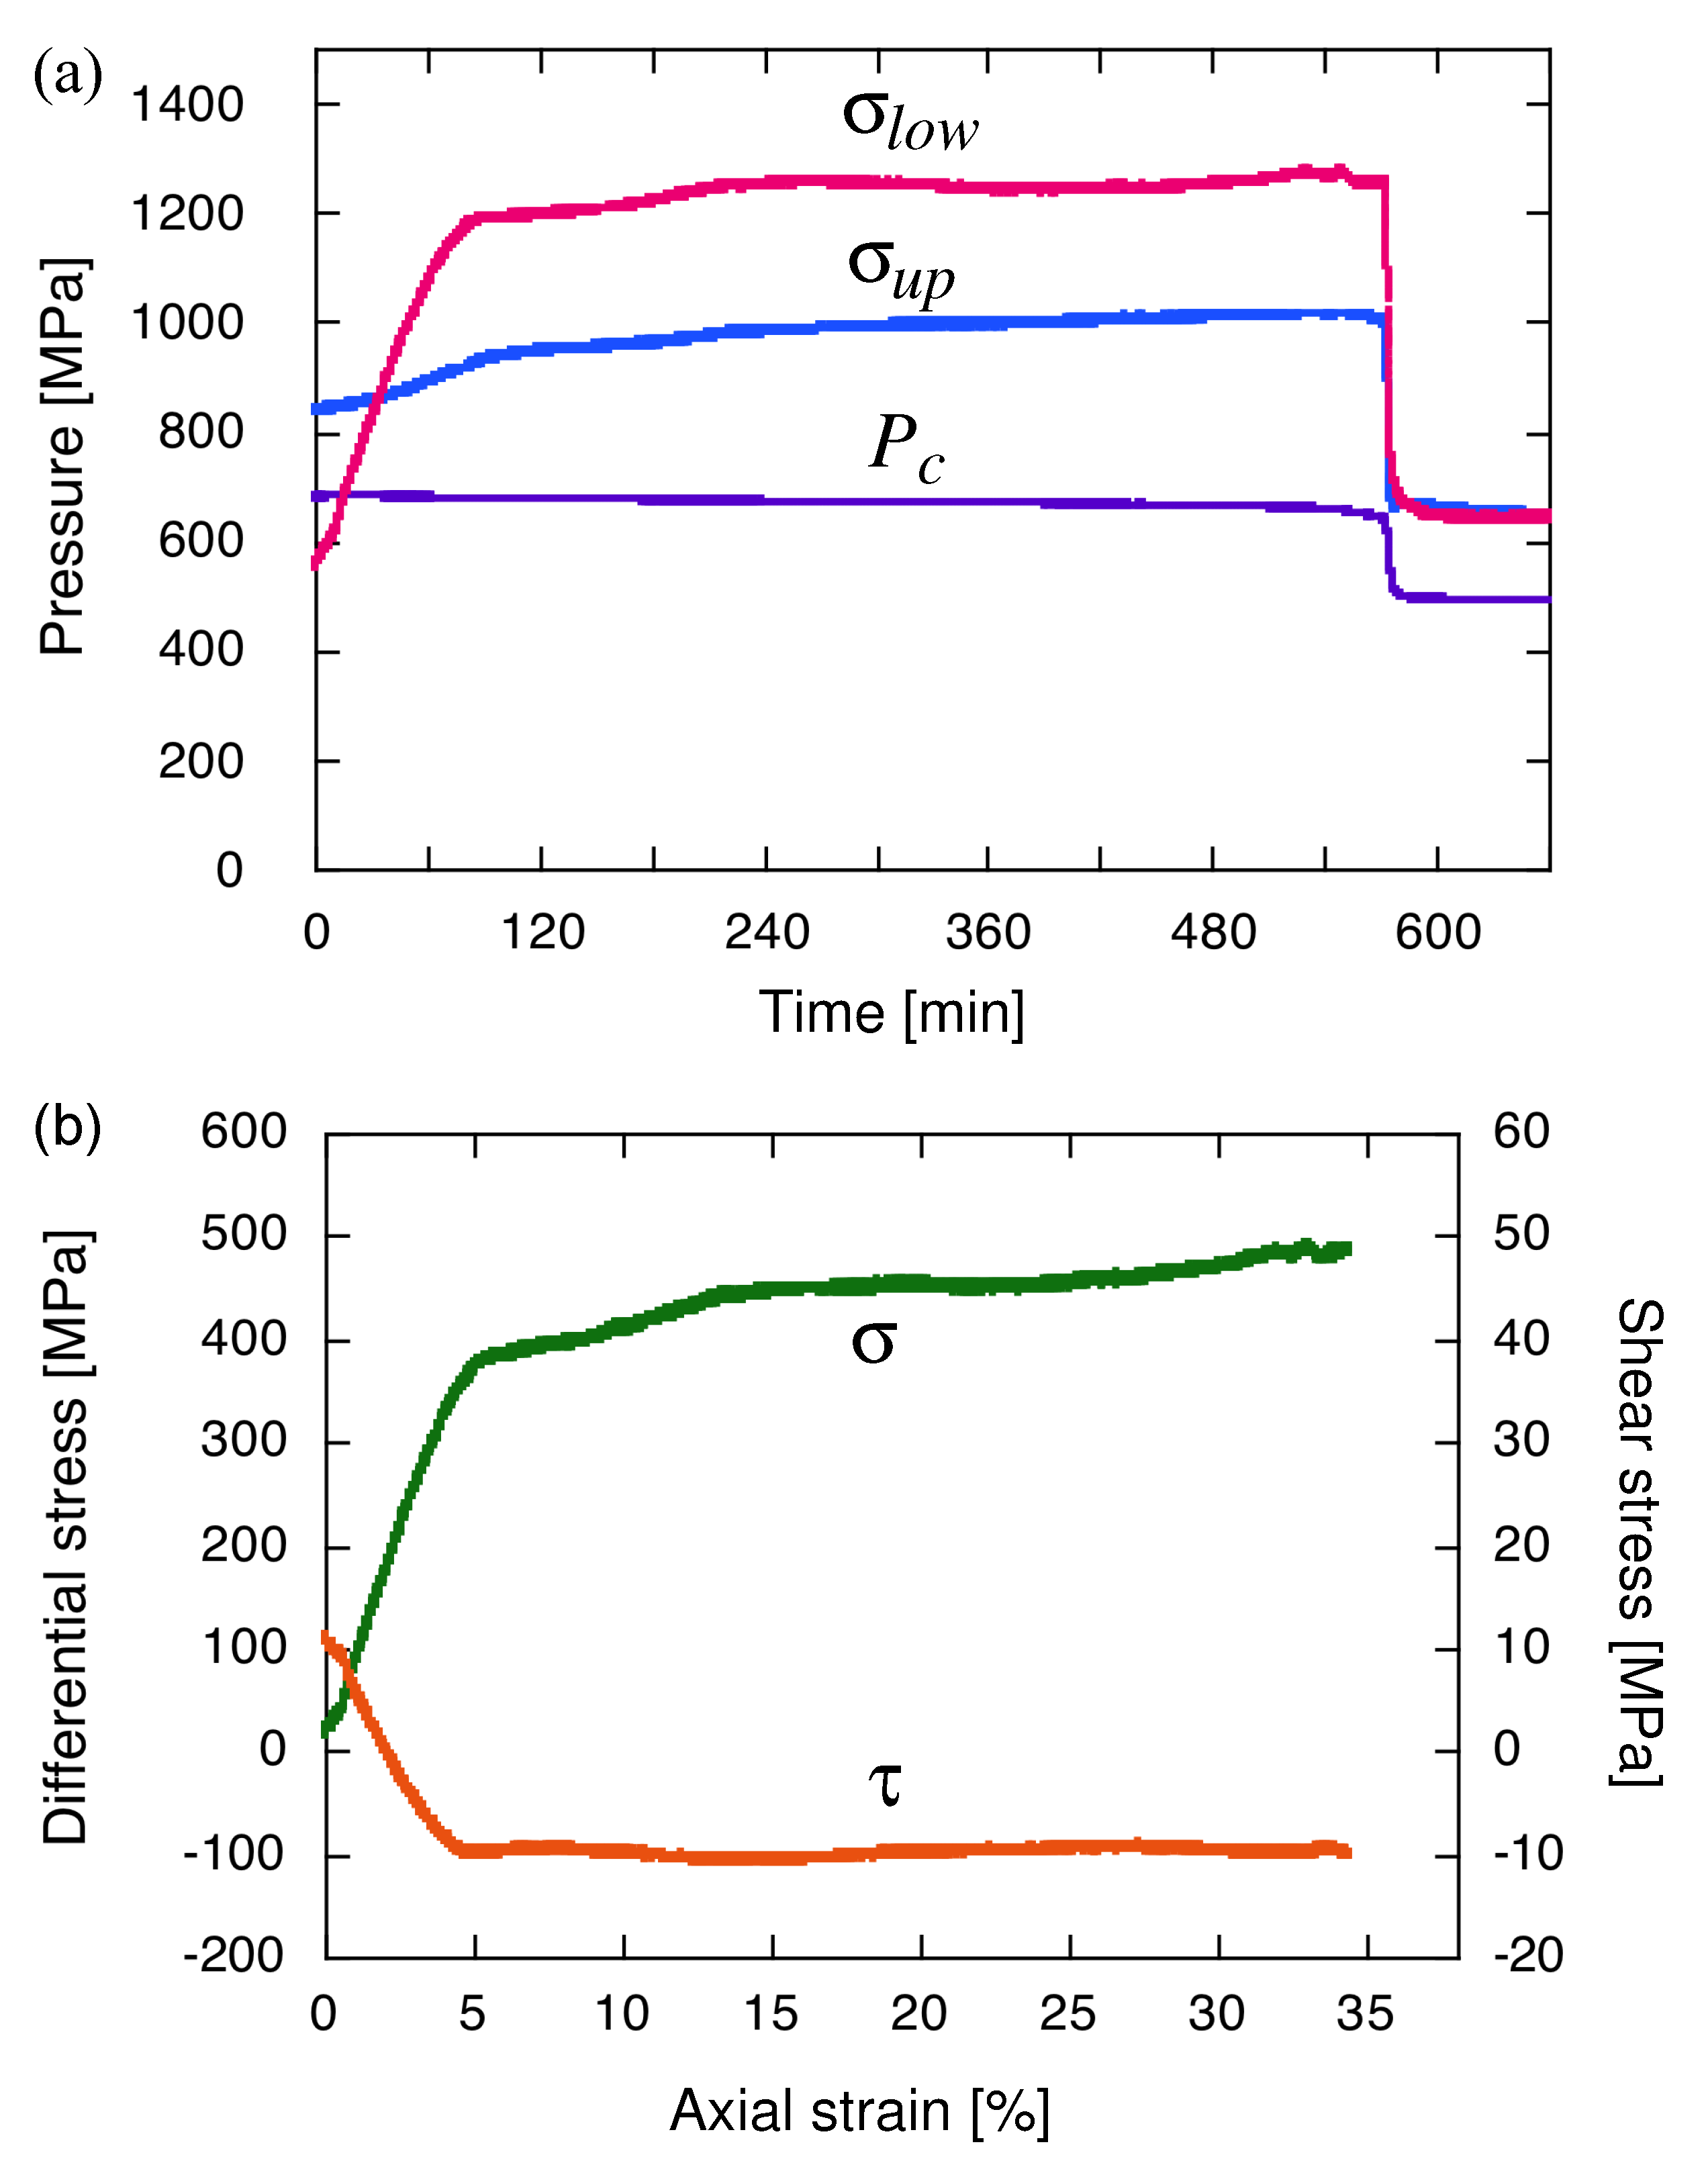
5.3. Constant Strain Rate Test

The constant strain rate test W01 was conducted using an as-received agate sample, whereas the sample used for W02 was preheated at 800 °C under a hydrostatic pressure of 700 MPa for 6.5 h to promote static grain growth prior to axial compression. The experimental procedure conducted was as follows: (1) P c and σ 1 were continuously and simultaneously increased to 650 MPa at room temperature. (2) The temperature was then raised to 800 °C in 60 min (W01) or 30 min (W02), while adjusting P c and σ 1 to about 700 MPa. (3) The inner piston was moved at a displacement rate of 1.0 × 10 4 mm s 1 , yielding the axial strain rate of 1.0 × 10 5 s 1 .
Figure 7a shows the mechanical data acquired in step (4) of W02, which were used to produce the stress–strain curve in Figure 7b. In the calculation of differential stress, no correction was made for changes in sample dimensions. The axial strain was calculated from the displacement rate of the axial piston and the duration of the deformation experiment. After yielding, the stress was slightly increased and then deformed at almost constant values. The water content of the recovered sample of W02 quantified by FTIR was 0.14 wt.%.

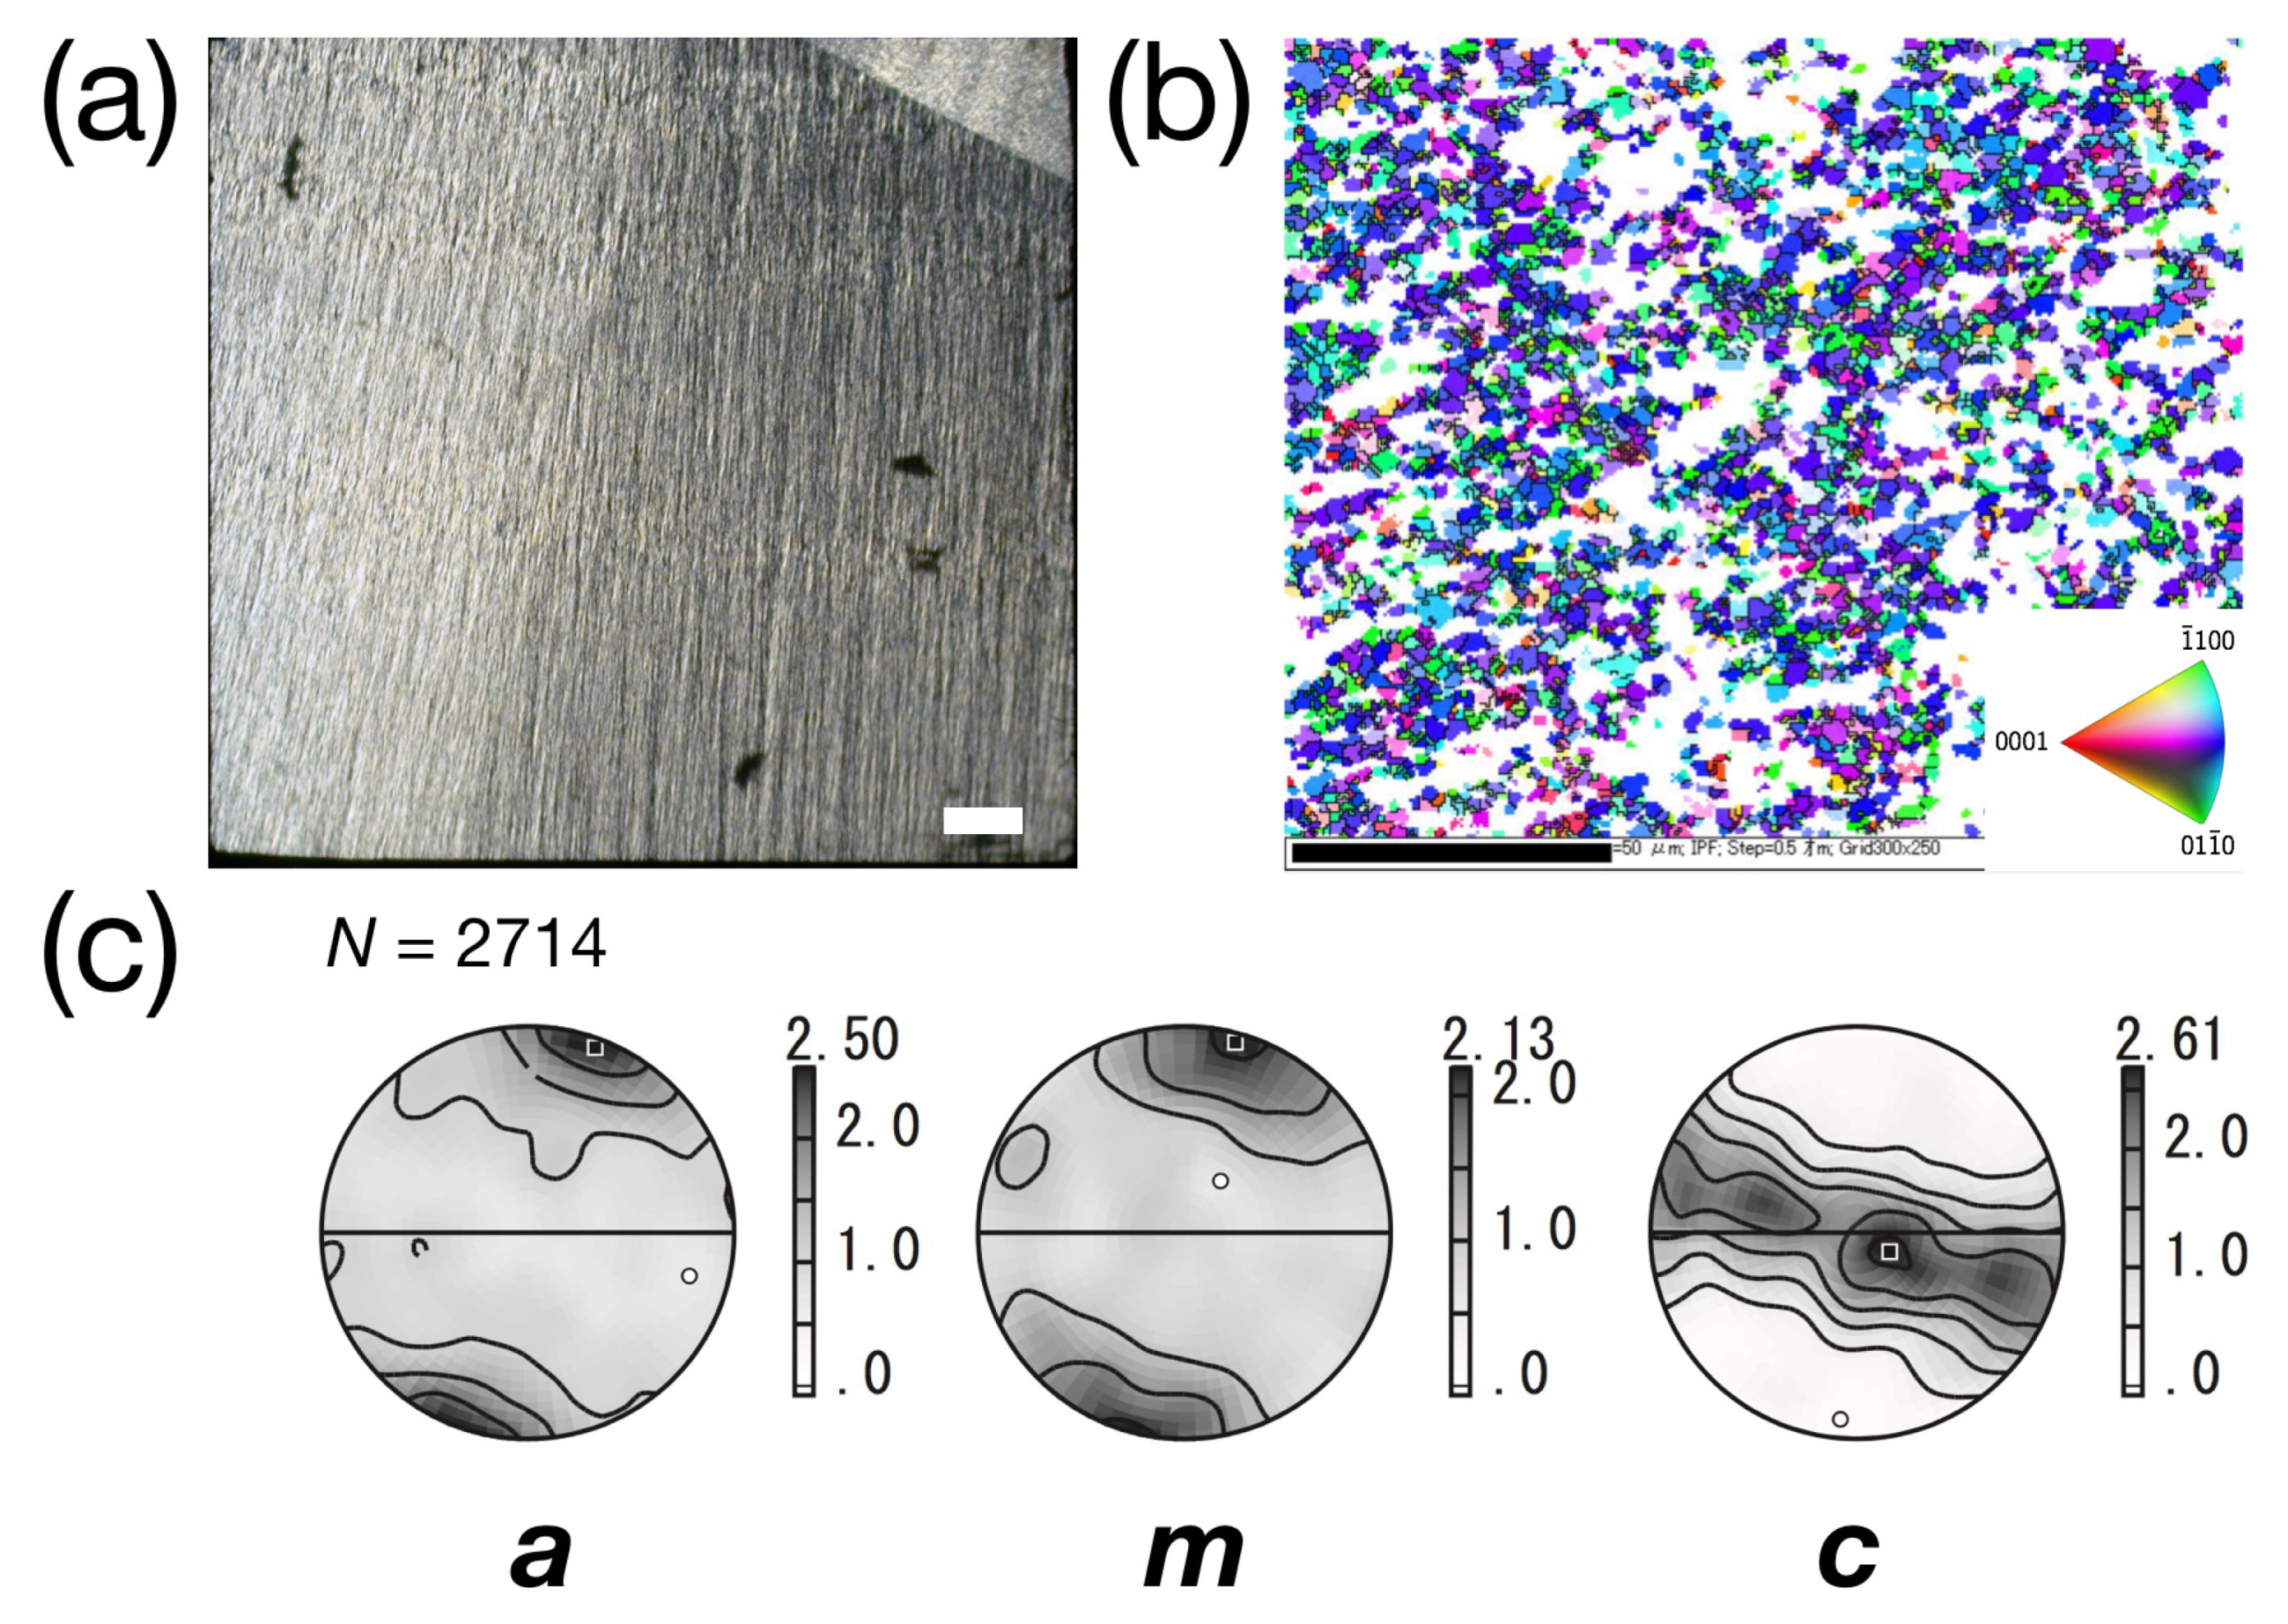
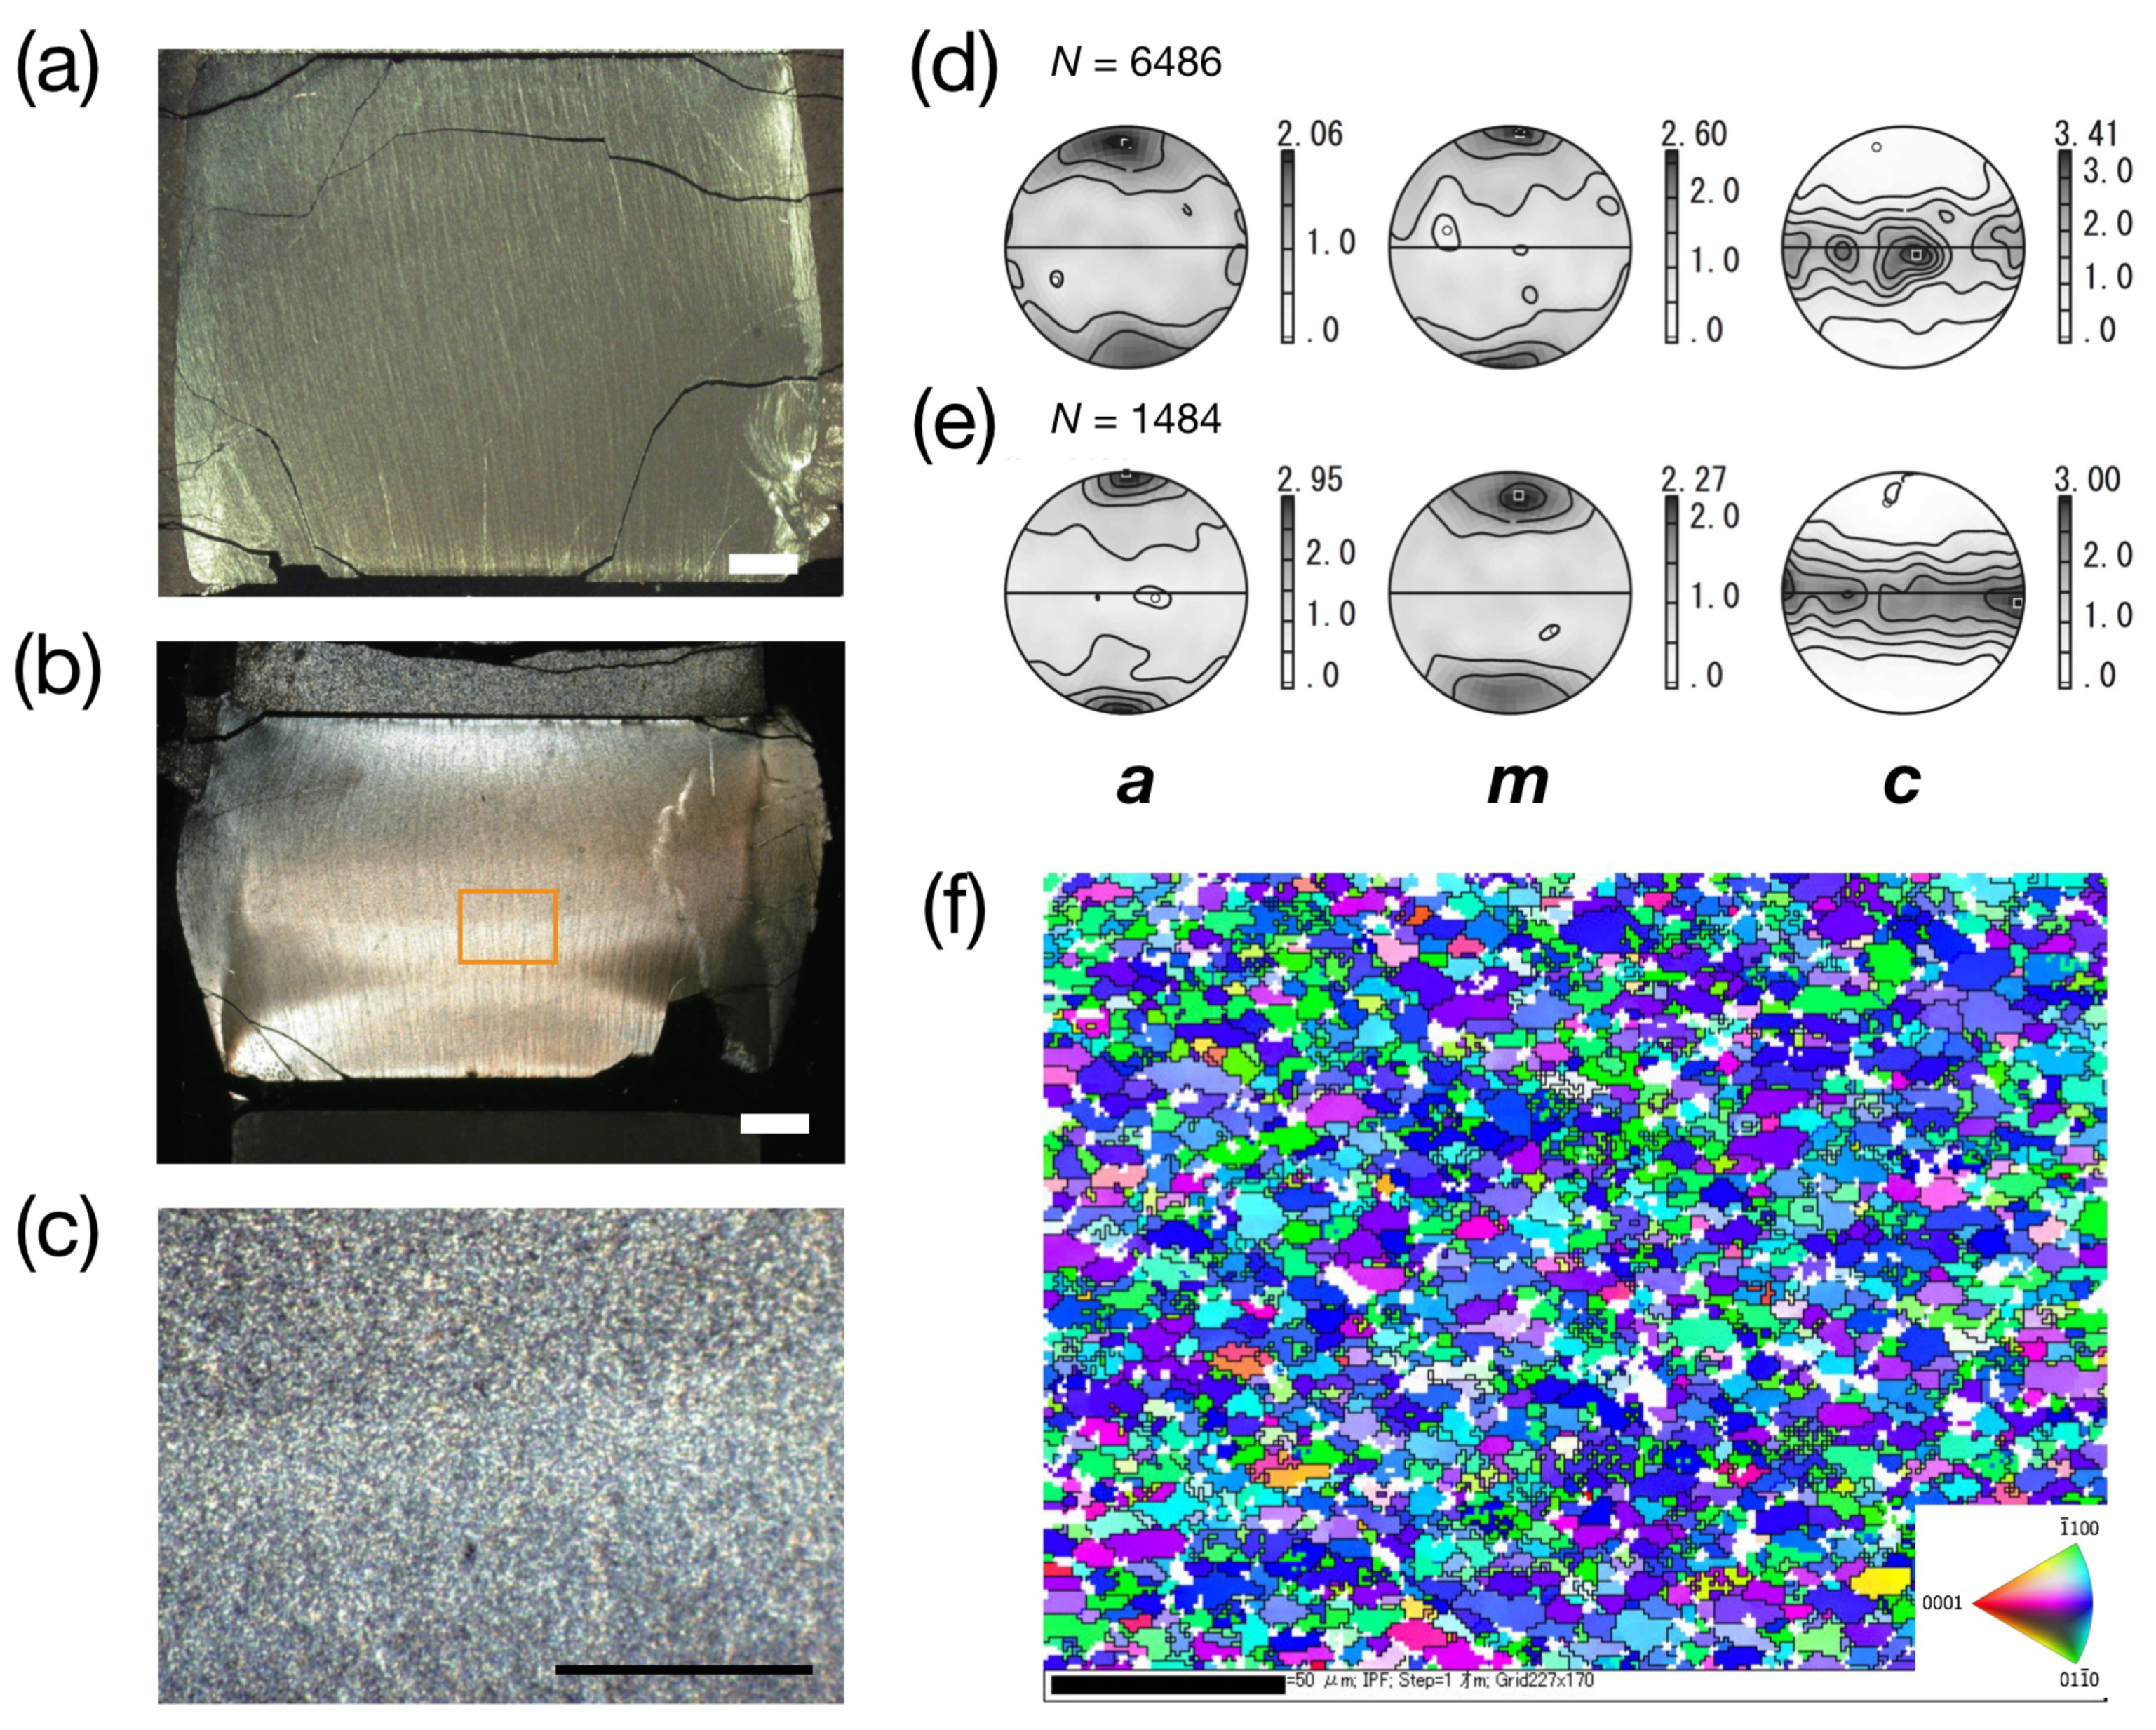
6. Microstructural Observation

Agate samples after constant strain rate tests (W01, W02) showed barrel-shaped deformation (Figure 8a,b). The initial fibrous texture of agate was almost preserved, and recrystallization only sporadically occurred in W01. The original texture of agate was also visible in the long-preheated sample of W02, which was deformed up to 24% strain. The wavy extinction of the sample indicates bending of the quartz fibers due to axial shortening. However, recrystallization occurred homogeneously, and the quartz fibers were changed into the aggregate of new grains after deformation (Figure 8c). The pole figures showed a point maximum of a-axis and m-poles associated with strong c-axis girdle patterns (Figure 8d,e), which resembled the orientation pattern of undeformed agate (Figure 3c). Moderately flattened recrystallized grains with the long axis of up to several tens of micron meters were observed in the EBSD map of W02 (Figure 8f).
We also analyzed an experimental product of MF (run number FL761229, provided by T. Masuda), which was deformed to 45% strain in the same ε ˙ T condition as W01 and W02 (Table 1). Under an optical microscope, the sample was deformed in a fully ductile manner and squeezed out from the gaps between the alumina pistons. The internal structure of the sample was highly heterogeneous. A Type-S microstructure was developed in the central part of the sample. Type P was also observed in the lower part, whereas the original texture of feather agate remained in the upper side, as described by MF (Figure 6 of [4]), wherein the quartz fibers were aligned perpendicular to the σ 1 axis. The EBSD maps of the central part show large elongated quartz grains grown in the matrix of fine-grained quartz aggregate (Figure 9c). The c–axis pole figure was characterized by two point maxima: one was parallel to the σ 1 -axis. and the other was perpendicular to the σ 1 -axis associated with a single-crystal-like pattern of m-poles (Figure 9d). The former corresponds to the large elongated grains, whereas the latter was observed in the fine-grained parts.

7. Discussion

7.1. Internal Friction in Solid Confining Medium

During the pressure stepping test (S07), τ monotonously increased at elevated P c . However, when the lower axial piston was pushed up, τ decreased at the same P c . Further compression of the confining medium by the outer piston caused τ to recover and approach the original trend. Hence, τ is not a simple function of P c but also depends on the relative displacement between the cylinder core and confining medium. The hysteresis of τ can be described by a spring-slider model; the reversible part of shear stress represents elastic strain in the confining medium, while the irreversible part represents friction during a finite slip. The latter corresponds to the envelope of the P c τ curve in Figure 6f.
From the slope of the envelope in Figure 6f, the frictional coefficient ( μ ) was estimated to be 0.05. In our assembly, large parts of the cylinder core were covered by graphite sleeves, and the rest was covered by a pyrophyllite sleeve. Frictional coefficients of a dry pyrophyllite gouge ( μ > 0.4) obtained at room temperature [40] was much higher than the above estimate. Graphite is widely used as a solid lubricant and is known to have low frictional coefficients ( μ 0.15 ) [41], but the present estimate of 0.05 is even smaller. It is possible that the the stress state within the pyrophyllite confining medium deviated from the hydrostatic state and that the horizontal confining stress was smaller than the vertical stress [39]. In the heating test, μ was reduced to 0.035 at 500 °C (Figure 6f).
The frictional behavior in the constant strain rate tests (W01, W02) conducted at 800 °C can be interpreted in a similar way as the pressure stepping test, though the shear direction turned the opposite way (Figure 7b); the initial increase in τ is due to the elastic stress in the solid matrix, whereas the stationary value (∼10 MPa) after yielding represents the frictional stress, which leads to a friction coefficient of 0.014. The deviation in apparent stresses σ l o w and σ u p reached about 300 MPa. This value is twice as large as that reported by Tsukahara and others [35] for their all-talc assembly. If we ignore the internal friction and consider σ l o w as the axial stress, then the yield stress could be overestimated by about 150 MPa.

7.2. Flow Stress of Wet Quartz

The constant strain rate tests (W01, W02) conducted at P c of 600–700 MPa resulted in a yield stress of 200–380 MPa and a flow stress (in terms of differential stress at 10% strain) of 300–420 MPa (Table 1). The differential stress of the long-heated sample (W02) was higher than that of the short-heated one (W01). Dewatering of the sample during pre-heating is a possible cause of the higher flow stress in W02.
In general, dislocation creep of quartz rocks is affected by various factors, including initial grain size, initial water content, and water fugacity [3]. Dislocation creep flow laws of quartz have been investigated using natural quartzite [7] and synthetic quartz aggregates [16,17].
Among these, synthetic aggregates of fine-grained quartz used by Luan and Paterson [16] had the largest water contents (up to 0.10 wt.% in silicic-acid origin samples) after deformation, which is closest to the water content (0.14 wt.%) measured for the W04 sample. Their experiments at a 300 MPa confining pressure using a gas-medium apparatus at 827 °C yielded a flow stress of 400 MPa at the same strain rate ( ε ˙ = 10 5 s 1 ). The flow stresses of W01 and W02 at a higher P c are in reasonable agreement with Luan and Paterson’s flow law.

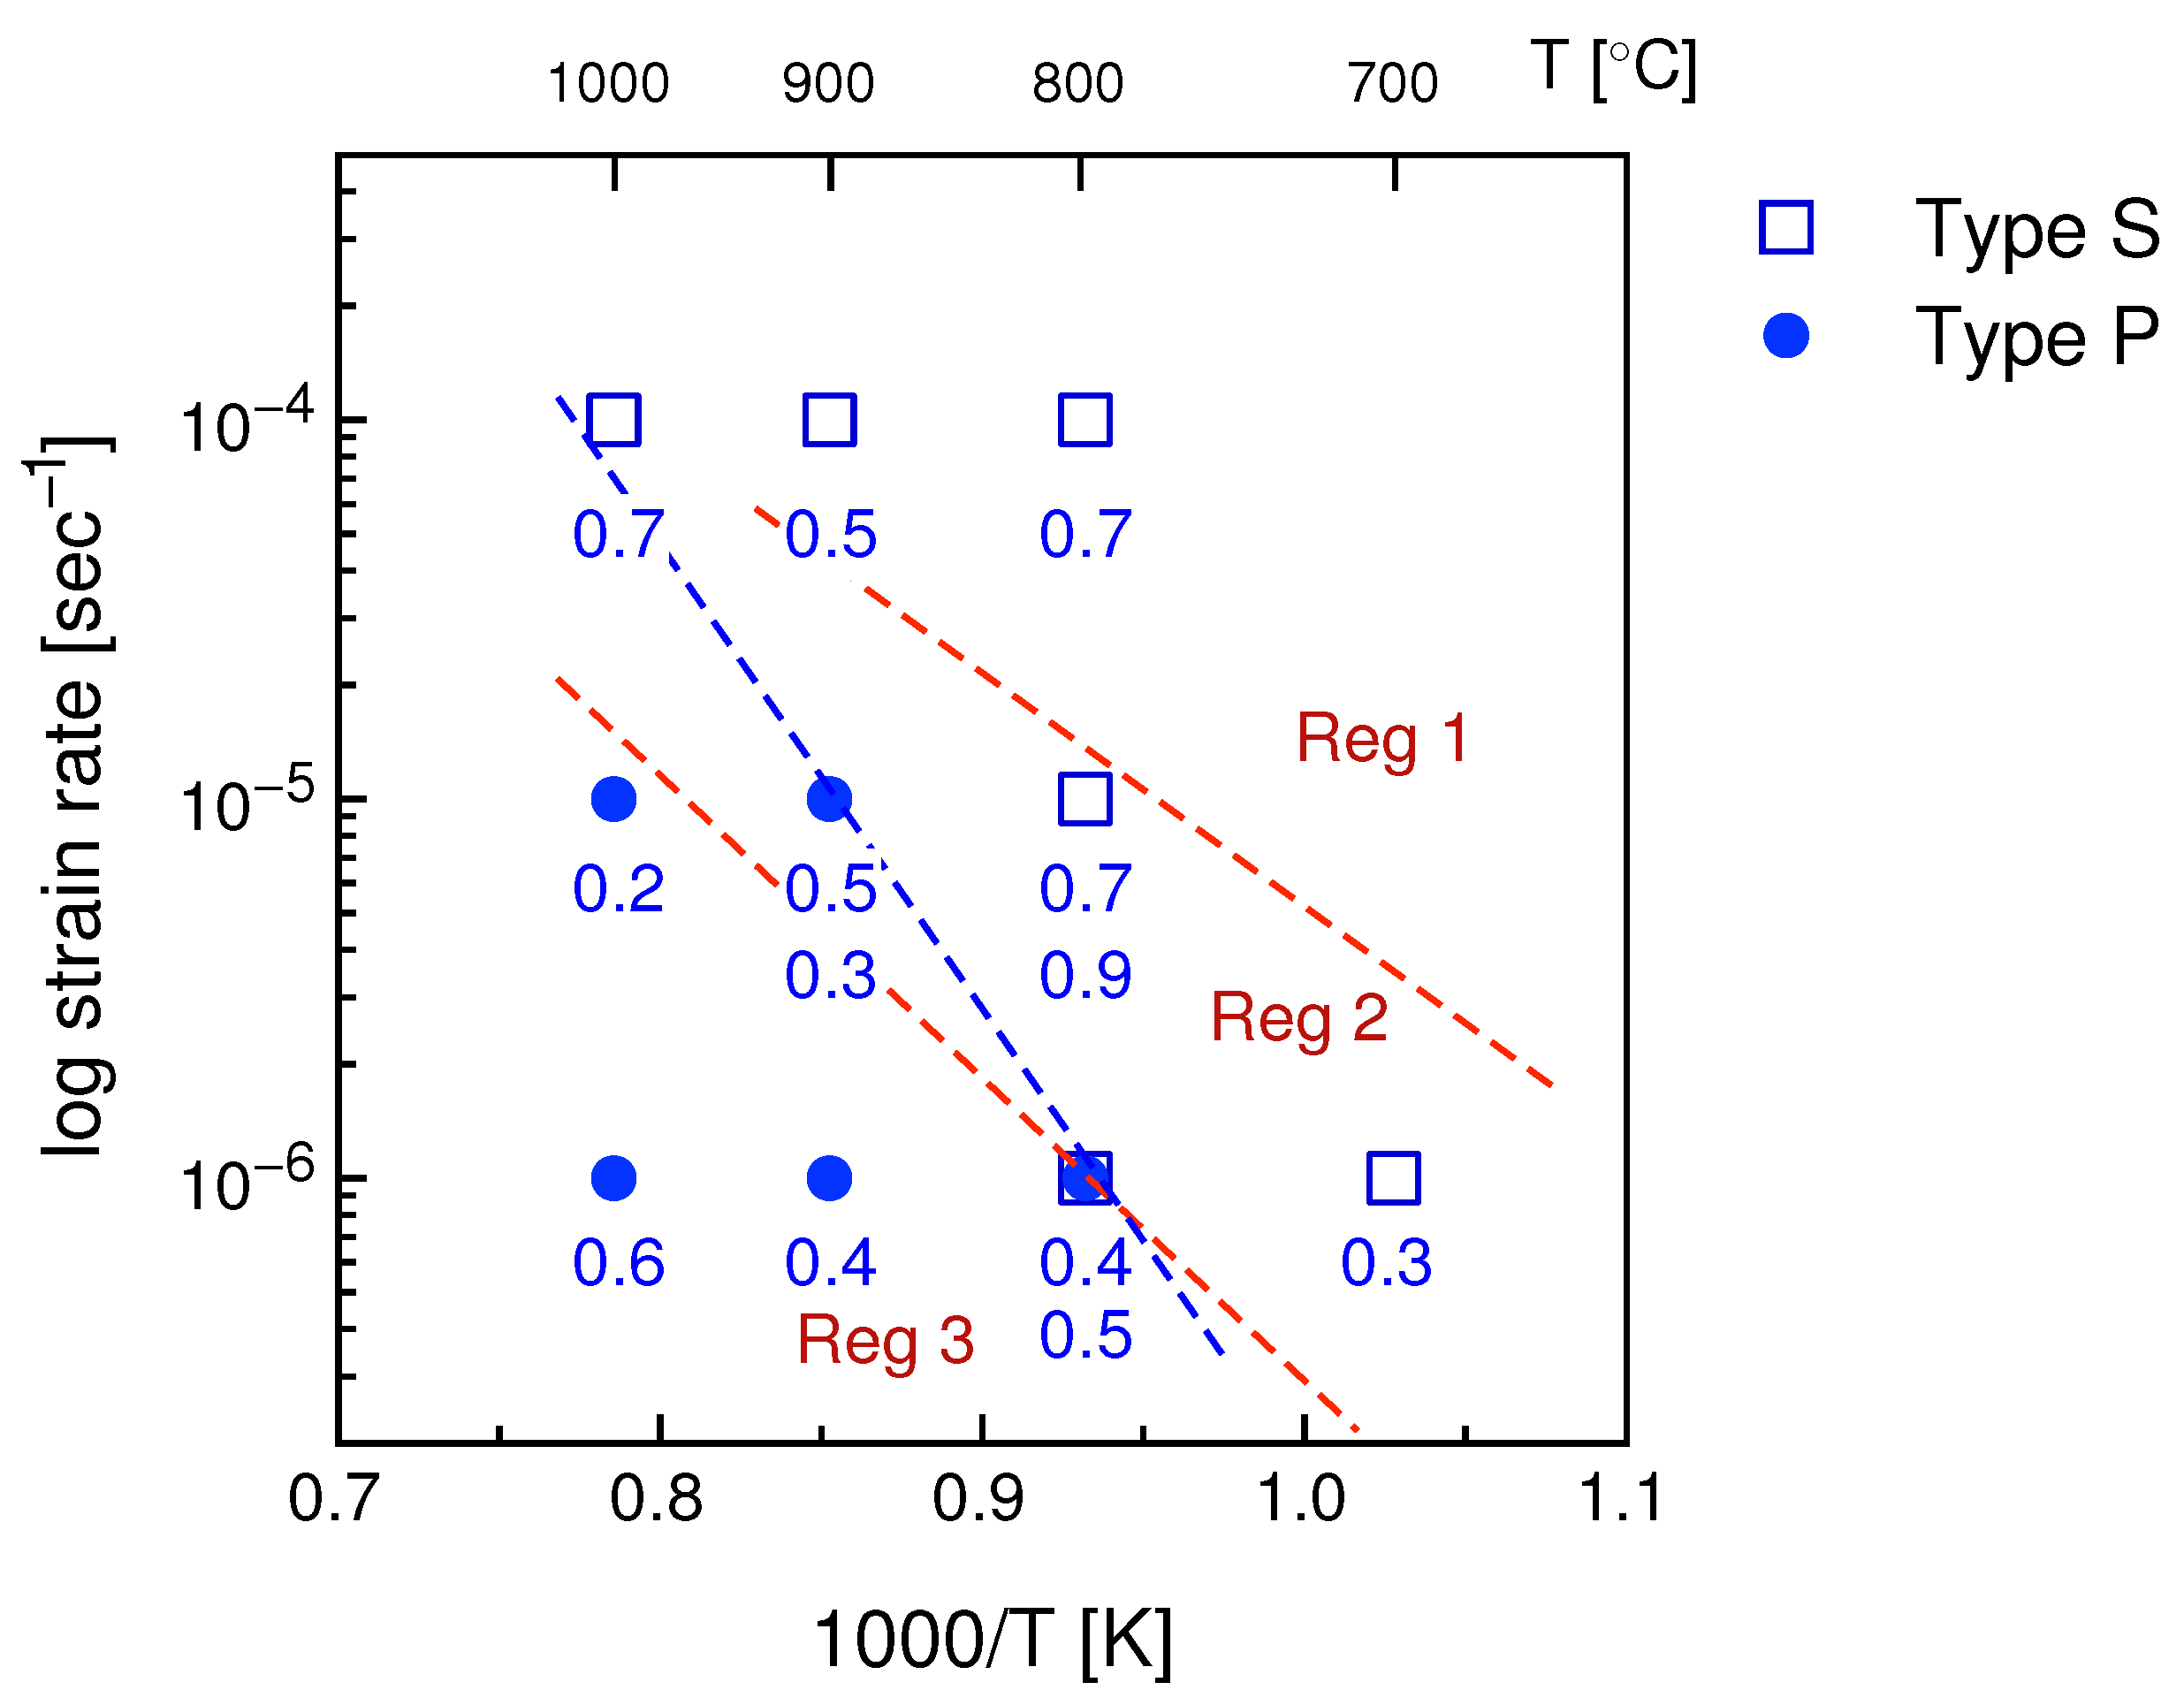
7.3. Re-Evaluation of Masuda and Fujimura’s (1981) Experiments

In the previous experiments conducted by MF, the upper load cell was not used, and therefore, the internal friction was not adequately corrected, as mentioned above. During pressurization at room temperature, the axial stress would have been underestimated by MF and the actual σ 1 would have been much larger than P c . Hence, microcracks might have been introduced in the sample before constant strain rate tests. Unreasonably small yield stress reported for the 700 °C run (FL78226) of MF is possibly due to brittle deformation during pressurization. Inversely, during axial displacement at a constant P c , the axial stress measured by the lower load cell would have been overestimated.
MF reported a yield stress of 600–700 MPa and flow stress of 700–900 MPa for their experiments conducted at 800 °C and a strain rate of 10 5 s 1 (Table 1). In our experiment (W02) conducted at a P c of 700 MPa, σ l o w deviated by about 150 MPa from the true value of σ 1 , as stated above. In the experimental runs of MF conducted at P c of 400 MPa, the friction coefficient of the pyrophyllite inner sleeves (Figure 4a) was about two times larger than that of the graphite+pyrophyllite sleeves in the present assembly (Figure 4b). Hence, the overestimate in differential stress reported by MF was roughly estimated to be 200 MPa; accordingly, the actual yield stress was estimated to be 400–500 MPa and the actual flow stress to be 500–700 MPa at these conditions. The corrected values of differential stresses are still larger than those in W01 and W02. The difference in P c (and hence difference in water fugacity) and difference in the initial quartz fabric of agate are possible causes of the larger flow stress in the MF experiments.

7.4. Implications of Microstructural observations

The agate samples originally had fibrous textures with strong lattice preferred orientations (LPOs) (Figure 3) and moderately deformed samples of W01 and W02 inherited the original c-axis girdle fabrics (Figure 8). The microstructures were altered by nucleation and growth of quartz grains but highly elongated grains of Type S did not develop in these samples, although the ε ˙ T conditions of these experiments correspond to the regime of Type S. It seems that finite strains of up to 24% were not sufficient to achieve steady-state microstructures.
In contrast, MF’s experimental sample (FL761229) was deformed up to a 45% strain. Although the corrected yield stress of (ca. 500 MPa) still exceeded the confining pressure (i.e., the stress limit of Goetze’s criterion), there was no microstructural indication of brittle deformation (Figure 9a). It is noted that differential stress (400 MPa) at a similar ε ˙ T condition reported by Luan and Paterson [16] also exceeded the confining pressure (300 MPa) imposed in their experimental runs. These results indicate that Goetze’s criterion does not hold for fine-grained quartz rocks with very high water contents.
The LPO of the fine-grained matrix of the MF sample was characterized by quartz grains with the c-axes oriented perpendicular to the compression direction (blue and green grains in Figure 9c), which corresponds to a c-axes point maximum in Figure 9d that was associated with a single crystal fabric of m-poles, although the sample deformation was axisymmetric. Influence of the initial fabric of agate (presumably a vertical c-axes girdle because the remnant quartz fibers in the upper part of the sample aligned perpendicular to the σ 1 -axis as described above) is a possible cause of the quartz fabric in the matrix. This orientation is favorable for intracrystalline deformation with a prism a slip, which is one of the representative slip systems in the laboratory conditions [42,43]. It is possible that a part of the initial c-axes fabric was stabilized during deformation, because prism a slips can be easily activated in this configuration. On the contrary, large elongated quartz grains (e.g., a large red area in the upper part of Figure 9c), which characterize Type-S microstructures under an optical microscope, are associated with a point maximum of c-axes parallel to the σ 1 -axis. These grains possibly originated from a part of the initial c-axes girdle fabric of agate. Another explanation is that they were formed by re-orientation of crystalline lattice due to basal a slip. Previous general shear experiments suggest that the dominant slip systems changes from prism a to basal a with increasing stress and both slip systems are active around 800 °C [43]. Grains with their c-axes parallel to the compression direction are unfavorable for further slip on prism and basal planes in co-axial deformation and are therefore, stabilized in the same orientation. Formation of large grains is accounted for by the preferential growth of “hard” grains at the expense of deformed “soft” grains with high dislocation densities [44]. Herein “hard” and “soft” grains represent those having low and high Schmid factors for the dominant slip systems, respectively. The quartz fabric characterized by c-axes parallel to σ 1 was previously observed in axisymmetric deformation experiments of quartzite [9]. In this case, original grains with their c-axis parallel to σ 1 exhibited little deformation, while grains of other orientation were extremely flattened [45]. In contrast, in Figure 9c, “soft” grains in blue and green colors recrystallized from agate exhibited a relatively weak shape fabric compared with red “hard” grains. It is probable that the “life time” of “soft” grains during nucleation-and-growth cycles of dynamic recrystallization [23,46] was shorter than the “hard” grains, and this led to smaller sizes and aspect ratios of the “soft” grains.
MF defined S and P microstructures using two independent factors—i.e., the aspect ratio of recrystallized grains and grain boundary serration. Our observation suggests that grain shapes in Type S were affected by slip systems and fabric development during dynamic recrystallization. For quartzite deformation, c-axes fabric transition from a point maximum to a small girdle pattern were observed at higher P c (800–1500 MPa) experiments [9]. It is noted that the ε ˙ T conditions of the fabric transition are close to those of S–P transition proposed by MF (Figure 1). The slip systems and quartz fabrics change not only with temperature and strain rates or differential stress [43], but also with confining pressure and water contents of quartz, while the fabric developments also depend on strain histories (e.g., non-coaxiality of deformation and total strain) [42]. Accordingly, the shapes of recrystallized grains will be influenced by these various factors.

8. Concluding Remarks

Using an improved data acquisition system for a solid-medium apparatus, we simulated classical deformation experiments of agate conducted by MF and corrected the friction in the solid assembly. Although a relatively hard material of pyrophyllite was used for the confining medium, corrected flow stresses of wet quartz agreed well with those reported for wet quartz using gas-medium apparatus. The application of this technique to solid assemblies with more soft confining materials for accurate measurements of differential stress will be discussed in future works.
The present experimental results suggest that the flow stress of agate was significantly affected by water release at high temperatures, and that microstructural developments were constrained by highly anisotropic textures of the starting material. Re-examination of Type-S microstructures using EBSD demonstrates that the development of shape fabrics was associated with preferential growth of unfavorably oriented grains during dynamic recrystallization. Further experimental studies using homogeneous samples under controlled water fugacity and more detailed analyses of crystallographic fabrics are needed to verify steady-state microstructures in dynamic recrystallization of quartz.

Author Contributions

Conceptualization, I.S. and K.M.; instrumentation, K.M. and I.S.; experiments, I.S. and K.M.; sample analysis K.M.; data processing, I.S.; writing, I.S.; visualization, I.S. and K.M. All authors have read and agreed to the published version of the manuscript.

Funding

This work was supported by a Grant-in-Aid for Scientific Research (KAKENHI 16340150 and 19340137) from the Japan Society for the Promotion of Science, a Grant-in-Aid for Scientific Research on Innovative Areas (KAKENHI 26109005) from the Ministry of Education, Culture, Sports, Science and Technology (MEXT), and the Observation and Research Program for Prediction of Earthquakes and Volcanic Eruptions from MEXT.

Data Availability Statement

All data can be provided from I.S. upon request.

Acknowledgments

We are grateful to Yuta Watanabe for conducting some of the deformation experiments and performing sample analysis during a master’s program at Shizuoka University. We thank Mineo Kumazawa and Toshiaki Masuda for their advice in setting up the deformation apparatus. Toshiaki Masuda is also thanked for providing the experimental sample used by MF. We appreciate the anonymous reviewers’ comments that improved the paper quality, and editorial handling and helpful comments by Toru Takeshita.

Conflicts of Interest

The authors declare no conflict of interest.

References

  1. Griggs, D.T. Hydrolytic weakening of quartz and other silicates. J. R. Astron. Soc. 1967, 14, 19–31. [Google Scholar] [CrossRef] [Green Version]
  2. Kronenberg, A.K.; Tullis, J. Flow strengths of quartz aggregates: Grain size and pressure effects due to hydrolytic weakening. J. Geophys. Res. 1984, 89, 4281–4297. [Google Scholar] [CrossRef]
  3. Fukuda, J.; Shimizu, I. Theoretical estimation of quartz dislocation creep: Comparison with experimental creep data and extrapolation of flow laws with water fugacity correction to natural conditions. J. Geophys. Res. 2017, 122, 5956–5971. [Google Scholar] [CrossRef]
  4. Masuda, T.; Fujimura, A. Microstructural development of fine-grained quartz aggregates by syntectonic recrystallization. Tectonophysics 1981, 72, 105–128. [Google Scholar] [CrossRef]
  5. Kumazawa, M.; Shimizu, I. Development of the first solid-medium apparatus in Japan: A historical review. Jpn. J. Struct. Geol. 2006, 49, 5–14, (In Japanese with English Abstract). [Google Scholar]
  6. Tullis, T.; Tullis, J. Experimental rock deformation techniques. In Mineral and Rock Deformation: Laboratory Studies (Geophysical Monograph Series 36); Hobbs, B.E., Heard, H.C., Eds.; American Geophysical Union: Washington, DC, USA, 1986; pp. 297–324. [Google Scholar]
  7. Gleason, G.C.; Tullis, J. A flow law for dislocation creep of quartz aggregates determined with the molten salt cell. Tectonophysics 1995, 247, 1–23. [Google Scholar] [CrossRef]
  8. Chernak, L.J.; Hirth, G.; Selverstone, J.; Tullis, J. Effect of aqueous and carbonic fluids on the dislocation creep strength of quartz. J. Geophys. Res. 2009, 114, B04201. [Google Scholar] [CrossRef]
  9. Tullis, J.; Christie, J.M.; Griggs, D.T. Microstructures and preferred orientations of experimentally deformed quartzites. Geol. Soc. Am. Bull. 1973, 84, 297–314. [Google Scholar] [CrossRef]
  10. Heilbronner, R.; Tullis, J. Evolution of c axis pole figures and grain size during dynamic recrystallization: Results from experimentally sheared quartzite. J. Geophys. Res. 2006, 111, B10202. [Google Scholar] [CrossRef]
  11. Richter, B.; Stünitz, H.; Heilbronner, R. The brittle-to-viscous transition in polycrystalline quartz: An experimental study. J. Struct. Geol. 2018, 114, 1–21. [Google Scholar] [CrossRef] [Green Version]
  12. Hirth, G.; Tullis, J. Dislocation creep regimes in quartz aggregates. J. Struct. Geol. 1992, 14, 145–159. [Google Scholar] [CrossRef]
  13. Stipp, M.; Tullis, J. The recrystallized grain size piezometers for quartz. Geophys. Res. Lett. 2003, 30, 2088. [Google Scholar] [CrossRef] [Green Version]
  14. Stipp, M.; Tullis, J.; Behrens, H. Effect of water on the dislocation creep microstructure and flow stress of quartz and implications for the recrystallized grain size piezometer. J. Geophys. Res. 2006, 111, B04201. [Google Scholar] [CrossRef] [Green Version]
  15. Nachlas, W.O.; Hirth, G. Experimental constraints on the role of dynamic recrystallization on resetting the Ti-in-quartz thermobarometer. J. Geophys. Res. 2015, 20, 8120–8137. [Google Scholar] [CrossRef]
  16. Luan, F.C.; Paterson, M.S. Preparation and deformation of synthetic aggregates of quartz. J. Geophys. Res. 1992, 97, 301–320. [Google Scholar] [CrossRef]
  17. Rutter, E.H.; Brodie, K.H. Experimental intracrystalline plastic flow in hot-pressed synthetic quartzite prepared from Brazilian quartz crystals. J. Struct. Geol. 2004, 26, 259–270. [Google Scholar] [CrossRef]
  18. Rutter, E.H.; Brodie, K.H. Experimental grain size-sensitive flow of hot-pressed Brazilian quartz aggregates. J. Struct. Geol. 2004, 26, 2011–2023. [Google Scholar] [CrossRef]
  19. Mainprice, D.; Paterson, M.S. Experimental deformation of flint in axial compression. Geol. Soc. Lond. Spec. Publ. 2005, 245, 251–276. [Google Scholar] [CrossRef]
  20. Takahashi, M.; Nagahama, H.; Masuda, T.; Fujimura, A. Fractal analysis of experimentally, dynamically recrystallized quartz grains and its possible application as a strain rate meter. J. Struct. Geol. 1998, 20, 269–275. [Google Scholar] [CrossRef]
  21. Shimizu, I. Theories and applicability of grain size piezometers: The role of dynamic recrystallization mechanisms. J. Struct. Geol. 2008, 30, 899–917. [Google Scholar] [CrossRef]
  22. Shimizu, I. Steady-state grain size in dynamic recrystallization of minerals. In Recrystallization; Sztwiertnia, K., Ed.; InTech: Rijeka, Croatia, 2012; pp. 371–386. Available online: http://www.intechopen.com/books/recrystallization/steady-state-grain-size-in-dynamic-recrystallization-of-minerals (accessed on 7 March 2012). [CrossRef] [Green Version]
  23. Shimizu, I. A stochastic model of grain size distribution during dynamic recrystallization. Phil. Mag. A 1999, 79, 1217–1231. [Google Scholar] [CrossRef]
  24. Shimizu, I. Stress and temperature dependence of recrystallized grain size: A subgrain misorientation model. Geophys. Res. Lett. 1998, 25, 4237–4240. [Google Scholar] [CrossRef]
  25. Masuda, T. A microstructural sequence of quartz schists in central Shikoku, south-west Japan. Tectonophysics 1982, 83, 329–345. [Google Scholar] [CrossRef]
  26. Tagami, M.; Takeshita, T. c-Axis fabrics and microstructures in quartz schist from the Sambagawa metamorphic belt, central Shikoku, Japan. J. Struct. Geol. 1998, 20, 1549–1568. [Google Scholar] [CrossRef]
  27. Shimizu, I. Rheological profile across the NE Japan interplate megathrust in the source region of the 2011 Mw9.0 Tohoku-oki earthquake. Earth Planets Space 2014, 66, 73. [Google Scholar] [CrossRef] [Green Version]
  28. Kohlstedt, D.L.; Evans, B.; Mackwell, S.J. Strength of the lithosphere: Constraints imposed by laboratory experiments. J. Geophys. Res. 1995, 100, 17587–17602. [Google Scholar] [CrossRef]
  29. Hirth, G.; Tullis, J. The brittle-plastic transition in experimentally deformed quartz aggregates. J. Geophys. Res. 1994, 99, 11731–11747. [Google Scholar] [CrossRef]
  30. Gleason, G.C.; Tullis, J. Improving flow laws and piezometers for quartz and feldspar aggregates. Geophys. Res. Lett. 1993, 20, 2111–2114. [Google Scholar] [CrossRef]
  31. Tingle, T.N.; Green, H.W.; Young, T.E.; Koczynski, T.A. Improvements to Griggs-type apparatus for mechanical testing at high pressure and temperatures. Pure Appl. Geophys. 1993, 141, 523–543. [Google Scholar] [CrossRef]
  32. Holyoke III, C.W.; Kronenberg, A.K. Accurate differential stress measurement using the molten salt cell and solid salt assemblies in the Griggs apparatus with applications to strength, piezometers and rheology. Tectonophysics 2010, 494, 17–31. [Google Scholar] [CrossRef]
  33. Kido, M.; Muto, J.; Nagahama, H. Method for correction of differential stress calculations from experiments using the solid salt assembly in a Griggs-type deformation apparatus. Tectonophysics 2016, 672, 170–176. [Google Scholar] [CrossRef]
  34. Iida, K.; Tsukahara, H.; Kumazawa, M.; Kobayashi, Y.; Suzuki, I.; Kasahara, J. Deformation of dunite at slow strain rates under high temperature and pressure. J. Soc. Mater. Sci. Jap. 1971, 20, 179–184. (In Japanese) [Google Scholar] [CrossRef]
  35. Tsukahara, H.; Yamazaki, Y. Preferred lattice orientation in partially melted fayalite aggregate at high temperature. J. Geol. Soc. Jap. 1976, 82, 751–756. [Google Scholar] [CrossRef] [Green Version]
  36. Nakashima, S.; Matayoshi, H.; Yuko, T.; Michibayashi, K.; Masuda, T.; Kuroki, N.; Yamagishi, H.; Ito, Y.; Nakamura, A. Infrared microspectroscopy analysis of water distribution in deformed and metamorphosed rocks. Tectonophysics 1995, 245, 263–276. [Google Scholar] [CrossRef]
  37. Paterson, M.S. The determination of hydroxyl by infrared absorption in quartz, silicate glasses and similar materials. Bull. Minéral. 1982, 105, 20–29. [Google Scholar] [CrossRef]
  38. Fukuda, J.; Shimizu, I. Water distribution in quartz schists of the Sanbagawa Metamorphic Belt, Japan: Infrared spectroscopic mapping and comparison of the calibrations proposed for determining water contents. Earth, Planet and Space 2019, 71, 136. [Google Scholar] [CrossRef]
  39. Edmond, J.M.; Paterson, M.S. Strength of solid pressure media and implications for high pressure apparatus. Contrib. Mineral. Petrol. 1971, 30, 141–160. [Google Scholar] [CrossRef]
  40. Moore, D.E.; Lockner, D.A. Crystallographic controls on the frictional behavior of dry and water-saturated sheet structure minerals. J. Geophys. Res. 2004, 109, 1–16. [Google Scholar] [CrossRef]
  41. Morrow, C.A.; Moore, D.E.; Lockner, D.A. The effect of mineral bond strength and adsorbed water on fault gouge frictional strength. Geophys. Res. Lett. 2000, 27, 815–818. [Google Scholar] [CrossRef] [Green Version]
  42. Muto, J.; Hirth, G.; Heilbronner, R.; Tullis, J. Plastic anisotropy and fabric evolution in sheared and recrystallized quartz single crystals. J. Geophys. Res. 2011, 116, B02206. [Google Scholar] [CrossRef]
  43. Tokle, L.; Hirth, G.; Behr, W.M. Flow laws and fabric transitions in wet quartzite. Earth Planet. Sci. Lett. 2019, 505, 152–161. [Google Scholar] [CrossRef]
  44. Gleason, G.C.; Tullis, J.; Heidelbach, F. The role of dynamic recrystallization in the development of lattice preferred orientations in experimentally deformed quartz aggregates. J. Struct. Geol. 1993, 15, 1145–1168. [Google Scholar] [CrossRef]
  45. Green, H.W.; Griggs, D.T.; Christie, J.M. Syntectonic and annealing recrystallization of fine-grained quartz aggregates. In Experimental and Natural Rock Deformation: Laboratory Studies; Pualitsch, P., Ed.; Springer: Berlin, Germany, 1970; pp. 272–335. [Google Scholar]
  46. Sakai, T. Dynamic recrystallization of metailic materials. In Rheology of Solids and of the Earth; Karato, S.-I., Toriumi, M., Eds.; Oxford Univ. Press: New York, NY, USA, 1989; pp. 284–307. [Google Scholar]
Figure 2. Solid-medium deformation apparatus designed by M. Kumazawa. PV, pressure vessel; HR, hydraulic ram; HC, hydraulic cylinder; TB, thrust bearing; BS, ball screw; GT, gear train; SM, stepping motor; IL, inner load cell for axial force; OL, outer load cell.
Minerals 12 00329 g002
Figure 3. Microstructures of the starting agate sample. (a) An optical micrograph of a thin section under crossed polarized lights. The scale bar (white) is 1 mm. Two domains with different fiber orientations are visible in the photograph. (b) An EBSD map of an undeformed core sample of agate. The cylinder axis is vertical and the basal plane is horizontal. The quartz fibers were sub-parallel to the cylinder axis. The c-axes of red grains are oriented vertically, whereas those of blue to green grains are oriented horizontally. See the inverse pole figure for coloring of the crystal orientation with respect to the cylinder axis. Crystallographic orientations of blank pixels (white) were not indexed. Scale bar is 50 μ m. The step size is 0.5 μ m. (c) Pole figures of crystallographic direction/pole of a〈11 2 ¯ 0〉, m (10 1 ¯ 0), and c [0001]. The horizontal lines are parallel to the basal planes of the cylindrical samples. N is the total number of measurements.
Minerals 12 00329 g003
Figure 4. Cross-sectional view of solid-medium assemblies used in (a) Masuda and Fujimura [4] and (b) this work.
Minerals 12 00329 g004
Figure 5. Force balance in the solid medium assembly. The forces acting on the cylinder core (a) and confining medium (b) are indicated by red and blue arrows. PV: pressure vessel. See text for details.
Minerals 12 00329 g005
Figure 6. Mechanical data acquired in the pressure stepping test (S01). (a) Force data recorded by the upper and lower load cells. (b) Apparent axial stresses σ u p and σ l o w and confining pressure P c calculated from the force data. (c) Enlarged view of (b). (d) True axial stress σ 1 and average shear stress τ on the cylinder core. (e) Change in mechanical data during the heating test. (f) Variation in shear stress τ with P c during the pressure step test and the heating test. RT: room temperature. All data are from experiment T07.
Minerals 12 00329 g006aMinerals 12 00329 g006b
Figure 7. (a) Mechanical data obtained in the constant strain rate test of agate (W02) carried out at 800 °C. (b) Stress–strain curve (green) and change in shear stress acting on the cylinder core (red). Abbreviations are the same as those in Figure 6.
Minerals 12 00329 g007
Figure 8. Microstructural observations of the samples after constant strain rate tests (W01, W02) conducted at 800 °C and ε ˙ = 10 5 s 1 . (a,b) show optical micrographs of thin sections after W01 and W02, respectively, under crossed polarized lights. Scale bars (white) are 2 mm. (c) Close up of the orange rectangular area of (b). The scale bar (black) is 1 mm. (d,e) show pole figures of a〈11 2 ¯ 0〉, m (10 1 ¯ 0), and c [0001] obtained in the samples of W01 and W02, respectively. The horizontal lines are parallel to the basal planes of the cylindrical samples. N is the total number of measurements. (f) An EBSD map of W02. The c-axes of red grains are oriented vertically, whereas those of blue to green grains are oriented horizontally. See the inverse pole figure for coloring of the crystal orientation with respect to the cylinder axis. Crystallographic orientations of blank pixels (white) were not indexed. The orientation data in the mapped area was used to construct the pole figures in (e). Scale bar is 50 μ m. The step size is 1 μ m. Compression direction is vertical for all figures.
Minerals 12 00329 g008
Figure 9. Microstructures of the recovered sample of the experiment (FL761229) conducted at 800 °C and ε ˙ = 10 5 s 1 by MF. (a) An optical micrograph of a thin section under crossed polarized lights. (b) Close up of the orange rectangular area of (a). Scale bars (white) are 2 mm. (c) An EBSD map of FL761229. The c-axes of red grains are oriented vertically, whereas those of blue- to green grains are oriented horizontally. See the inverse pole figure for coloring of the crystal orientation with respect to the cylinder axis. Crystallographic orientations of blank pixels (white) were not indexed. Most black lines within the large red grains are pseudo-symmetric boundaries that were misindexed as Dauphiné twins. Scale bar is 50 μ m. The step size is 0.5 μ m. (d) Pole figures of crystallographic direction/pole of a〈11 2 ¯ 0〉, m (10 1 ¯ 0), and c [0001]. The horizontal lines are parallel to the basal planes of the cylindrical samples. N is the total number of measurements. Compression direction is vertical for all figures.
Minerals 12 00329 g009
Table 1. Summary of experimental runs. σ y : yield stress. σ s : differential stress at 10% strain. σ f i n : final differential stress. ε f i n : final strain. Masuda and Fujimura [4]. Stresses within parentheses are friction-corrected values.
RunExperiment P c T ε ˙ σ y σ s σ fin ε fin
[GPa][°C][s 1 ][GPa][GPa][GPa][%]
S07pressure stepping test0–0.834
heating test0.834–550
W01constant strain rate test0.56800 1.0 × 10 5 0.200.300.3014
W02preheating (6.5 h)0.61800
constant strain rate test0.7800 1.0 × 10 5 0.380.420.4824
FL77207 constant strain rate test0.4800 1.0 × 10 5 0.60.70.830
(0.4)(0.5)(0.6)
FL761229 constant strain rate test0.4800 1.0 × 10 5 0.70.91.745
(0.5)(0.7)(1.5)
Publisher’s Note: MDPI stays neutral with regard to jurisdictional claims in published maps and institutional affiliations.

