Article

The Anomalous Seismic Behavior of Aqueous Fluids Released during Dehydration of Chlorite in Subduction Zones

1
Laboratoire Magmas et Volcans, Université Clermont Auvergne, CNRS, IRD, OPGC, 63000 Clermont-Ferrand, France
2
University Lille, CNRS, INRAE, Centrale Lille, UMR 8207—UMET—Unité Matériaux et Transformations, 59000 Lille, France
3
Synchrotron SOLEIL, 91192 Gif-Sur-Yvette, France
*
Author to whom correspondence should be addressed.
Minerals 2021, 11(1), 70; https://doi.org/10.3390/min11010070
Submission received: 8 November 2020 / Revised: 21 December 2020 / Accepted: 8 January 2021 / Published: 13 January 2021

Abstract

:
Dehydration and fluid circulation are integral parts of subduction tectonics that govern the dynamics of the wedge mantle. The knowledge of the elastic behavior of aqueous fluid is crucial to understand the fluid–rock interactions in the mantle through velocity profiles. In this study, we investigated the elastic wave velocities of chlorite at high pressure beyond its dehydrating temperature, simulating the progressive dehydration of hydrous minerals in subduction zones. The dehydration resulted in an 8% increase in compressional (Vp) and a 5% decrease in shear wave (Vs) velocities at 950 K. The increase in Vp can be attributed to the stiffening of the sample due to the formation of secondary mineral phases followed by the dehydration of chlorite. The fluid-bearing samples exhibited Vp/Vs of 2.45 at 950 K. These seismic parameters are notably different from the major mantle minerals or hydrous silicate melts and provide unique seismic criteria for detecting mantle fluids through seismic tomography.

1. Introduction

The dehydration of subducted hydrous minerals releases a flux of fluid into the wedge mantle [1]. The aqueous fluid entering the overlying mantle influences geochemical and geophysical processes, such as arc melting [2], mantle metasomatism [3,4], intermediate-depth seismicity [5,6], and the dynamics of the wedge-mantle flow [7]. The determination of the physical state of slab fluid can constrain the thermal state of the slab as melting, and dehydration reactions occur at different temperatures. Detection and differentiation of aqueous fluid and silicate melt and how they migrate and interact with the overlying mantle are therefore fundamental to the understanding of the subduction zone system [8].
Seismic velocities, anelastic attenuation, and seismic anisotropy are the key parameters that provide information on physical and chemical interactions between the slab and the mantle [8]. The low velocity and high attenuation (low-Q) in subduction zones have often been interpreted as an indication of the presence of a liquid phase [8]. This interpretation comes from the notion that the shearing motion cannot be transmitted through a liquid, as it may slow down the compressional (P) waves and hinder the propagation of shear (S) waves and attenuate [9,10,11]. The attenuation is often described by the seismic attenuation factor (Q−1), which depends on the temperature, composition, fluid/melt fraction, fluid/melt geometry, and grain size [12,13], and provides robust constraints on subduction zone components [14].
The seismic structures of most subduction systems have been well documented, and the high-resolution seismic tomography images [14], receiver function method [15], and seismic refraction methods allow the detection of seismic anomalies with great accuracy [16]. The prior knowledge of the elastic properties of major mantle mineral phases provides the basic framework for the interpretation of seismic parameters [17] obtained through inversion methods. The available criteria allow the identification of solid from liquid phases [18,19,20,21,22] or distinguish hydrous minerals from nominally anhydrous minerals [15,22,23,24]. However, there are no robust seismic parameters to identify aqueous fluids. At present, the interpretation of the presence of fluid is based on indirect observations, mainly through comparison of the seismic anomaly with the depth of dehydration, temperature profile, and proximity to the volcanic activity [15,25,26,27]. Despite the importance of seismic properties of fluid-bearing systems that have long been identified [15,24,28], the elastic velocity data on aqueous fluids have not been determined experimentally, partly due to the challenging nature of investigating fluid-bearing systems at high pressure. With the notable absence of seismic parameters of aqueous fluids, the interpretation of seismic anomalies in subduction zones remains an uncertain exercise.
The present study investigated the elastic properties of the dehydration-induced fluid occurring in subduction zones. Using high-pressure ultrasonic measurements, we have determined elastic wave velocities of chlorite and dehydrating fluids at 1.8 and 3.8 GPa with increasing temperatures, simulating the progressive dehydration in the subducting slab. Chlorite (Mg, Fe)5Al(Si3Al)O10(OH)8, is one of the major hydrous phases stable in subducting ultramafic, mafic, and sediment lithologies [1,29,30,31]. The presence of chlorite in both the subducting slab and the hydrated mantle wedge presents a unique opportunity to investigate diverse dehydration scenarios in subduction zones.

2. Materials and Methods

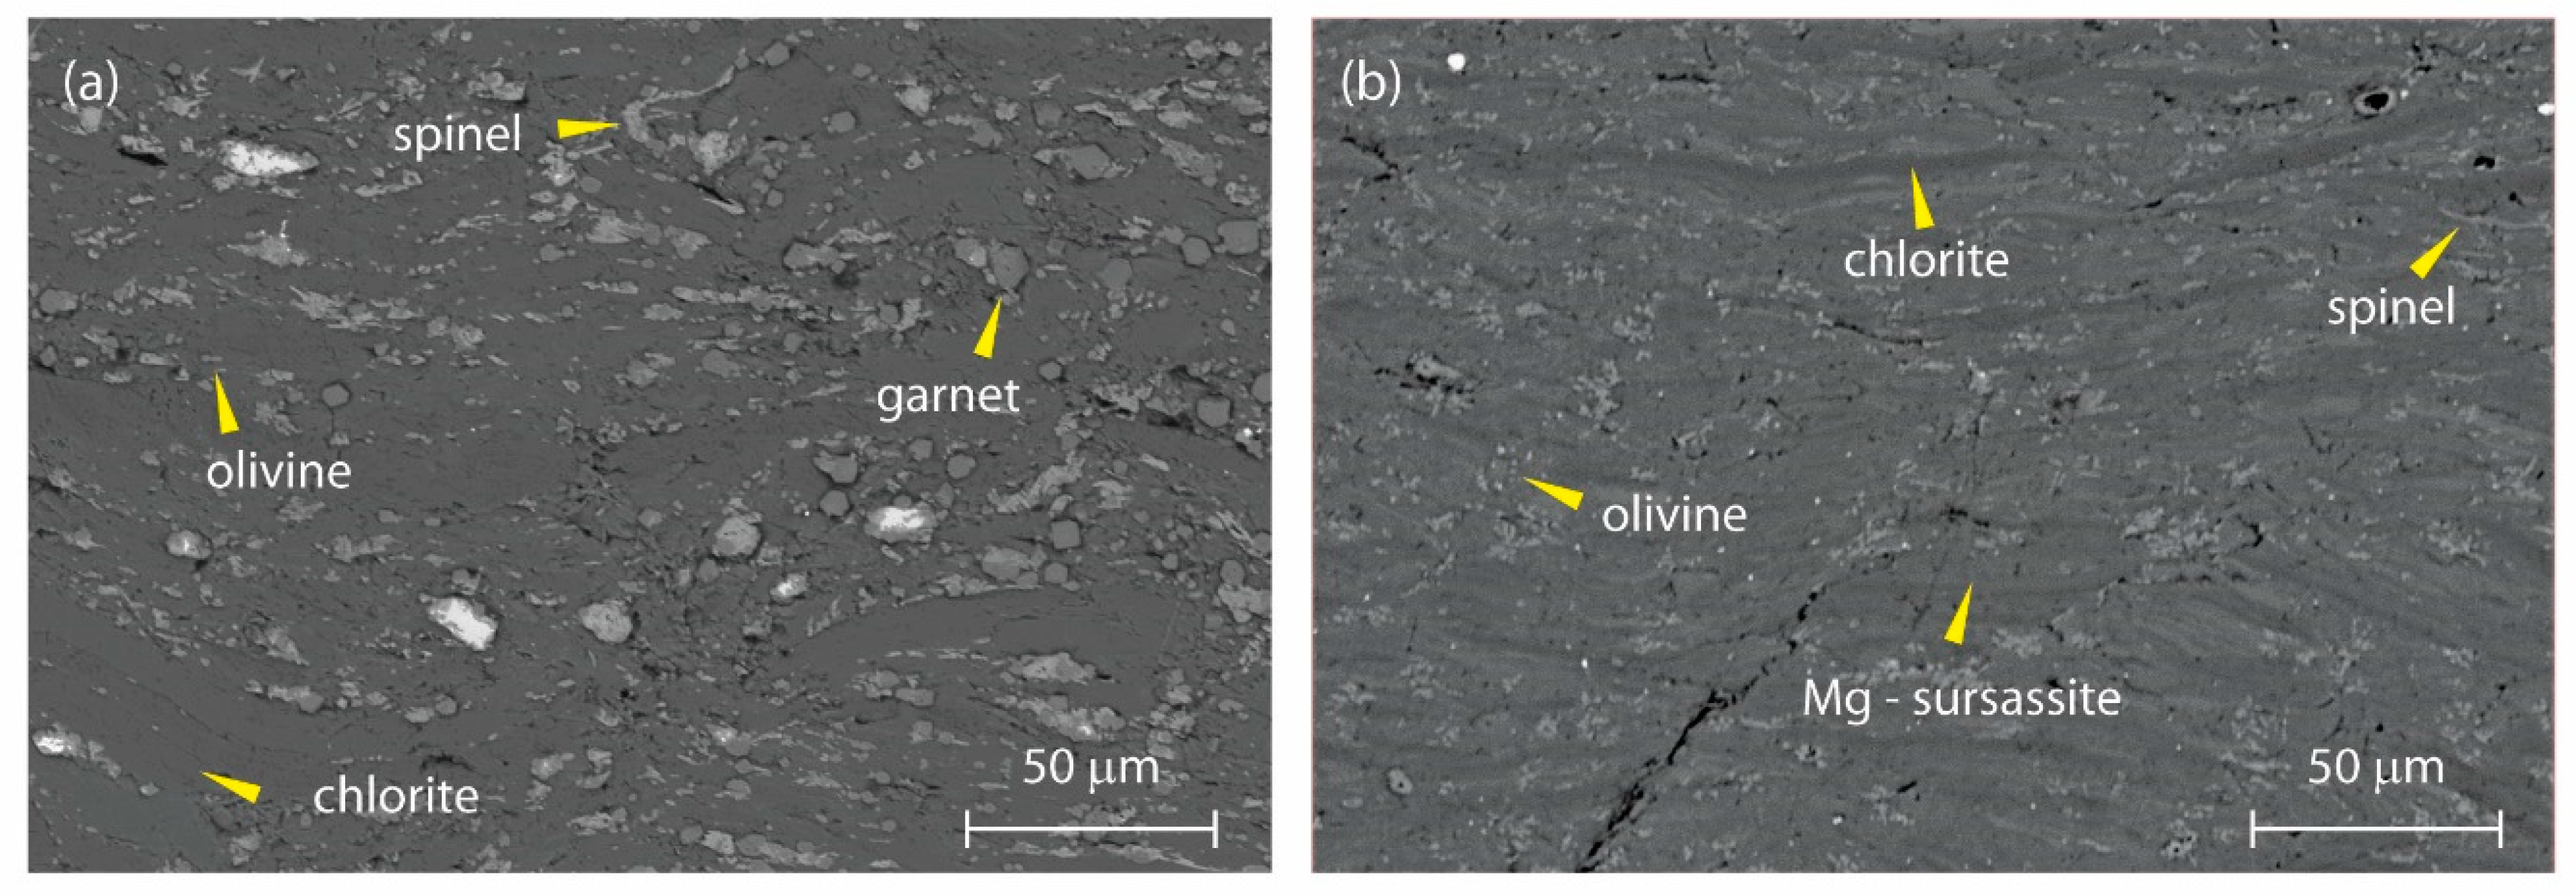
2.1. Sample Characterization

In this study, we measured the elastic wave velocities of natural chlorite with (Mg3.77Fe1.23)Al (Si3Al)O10(OH) 8 stoichiometry at conditions representative to the mantle wedge and subduction zone settings. The natural chlorite sample used in this study was from the Ambatomainty region in Madagascar. The chemical composition of chlorite was determined by electron probe microanalysis (EPMA) using a Cameca SxFiveTactis electron microprobe, operating at an accelerating voltage of 15 kV and a beam current of 20 nA. The samples were further characterized by powder X-ray diffraction (XRD). After each experiment, cross-sections of run products were investigated using energy-dispersive X-ray spectroscopy (EDS) chemical mapping, using a Jeol JSM−5910 LV scanning electron microscope.

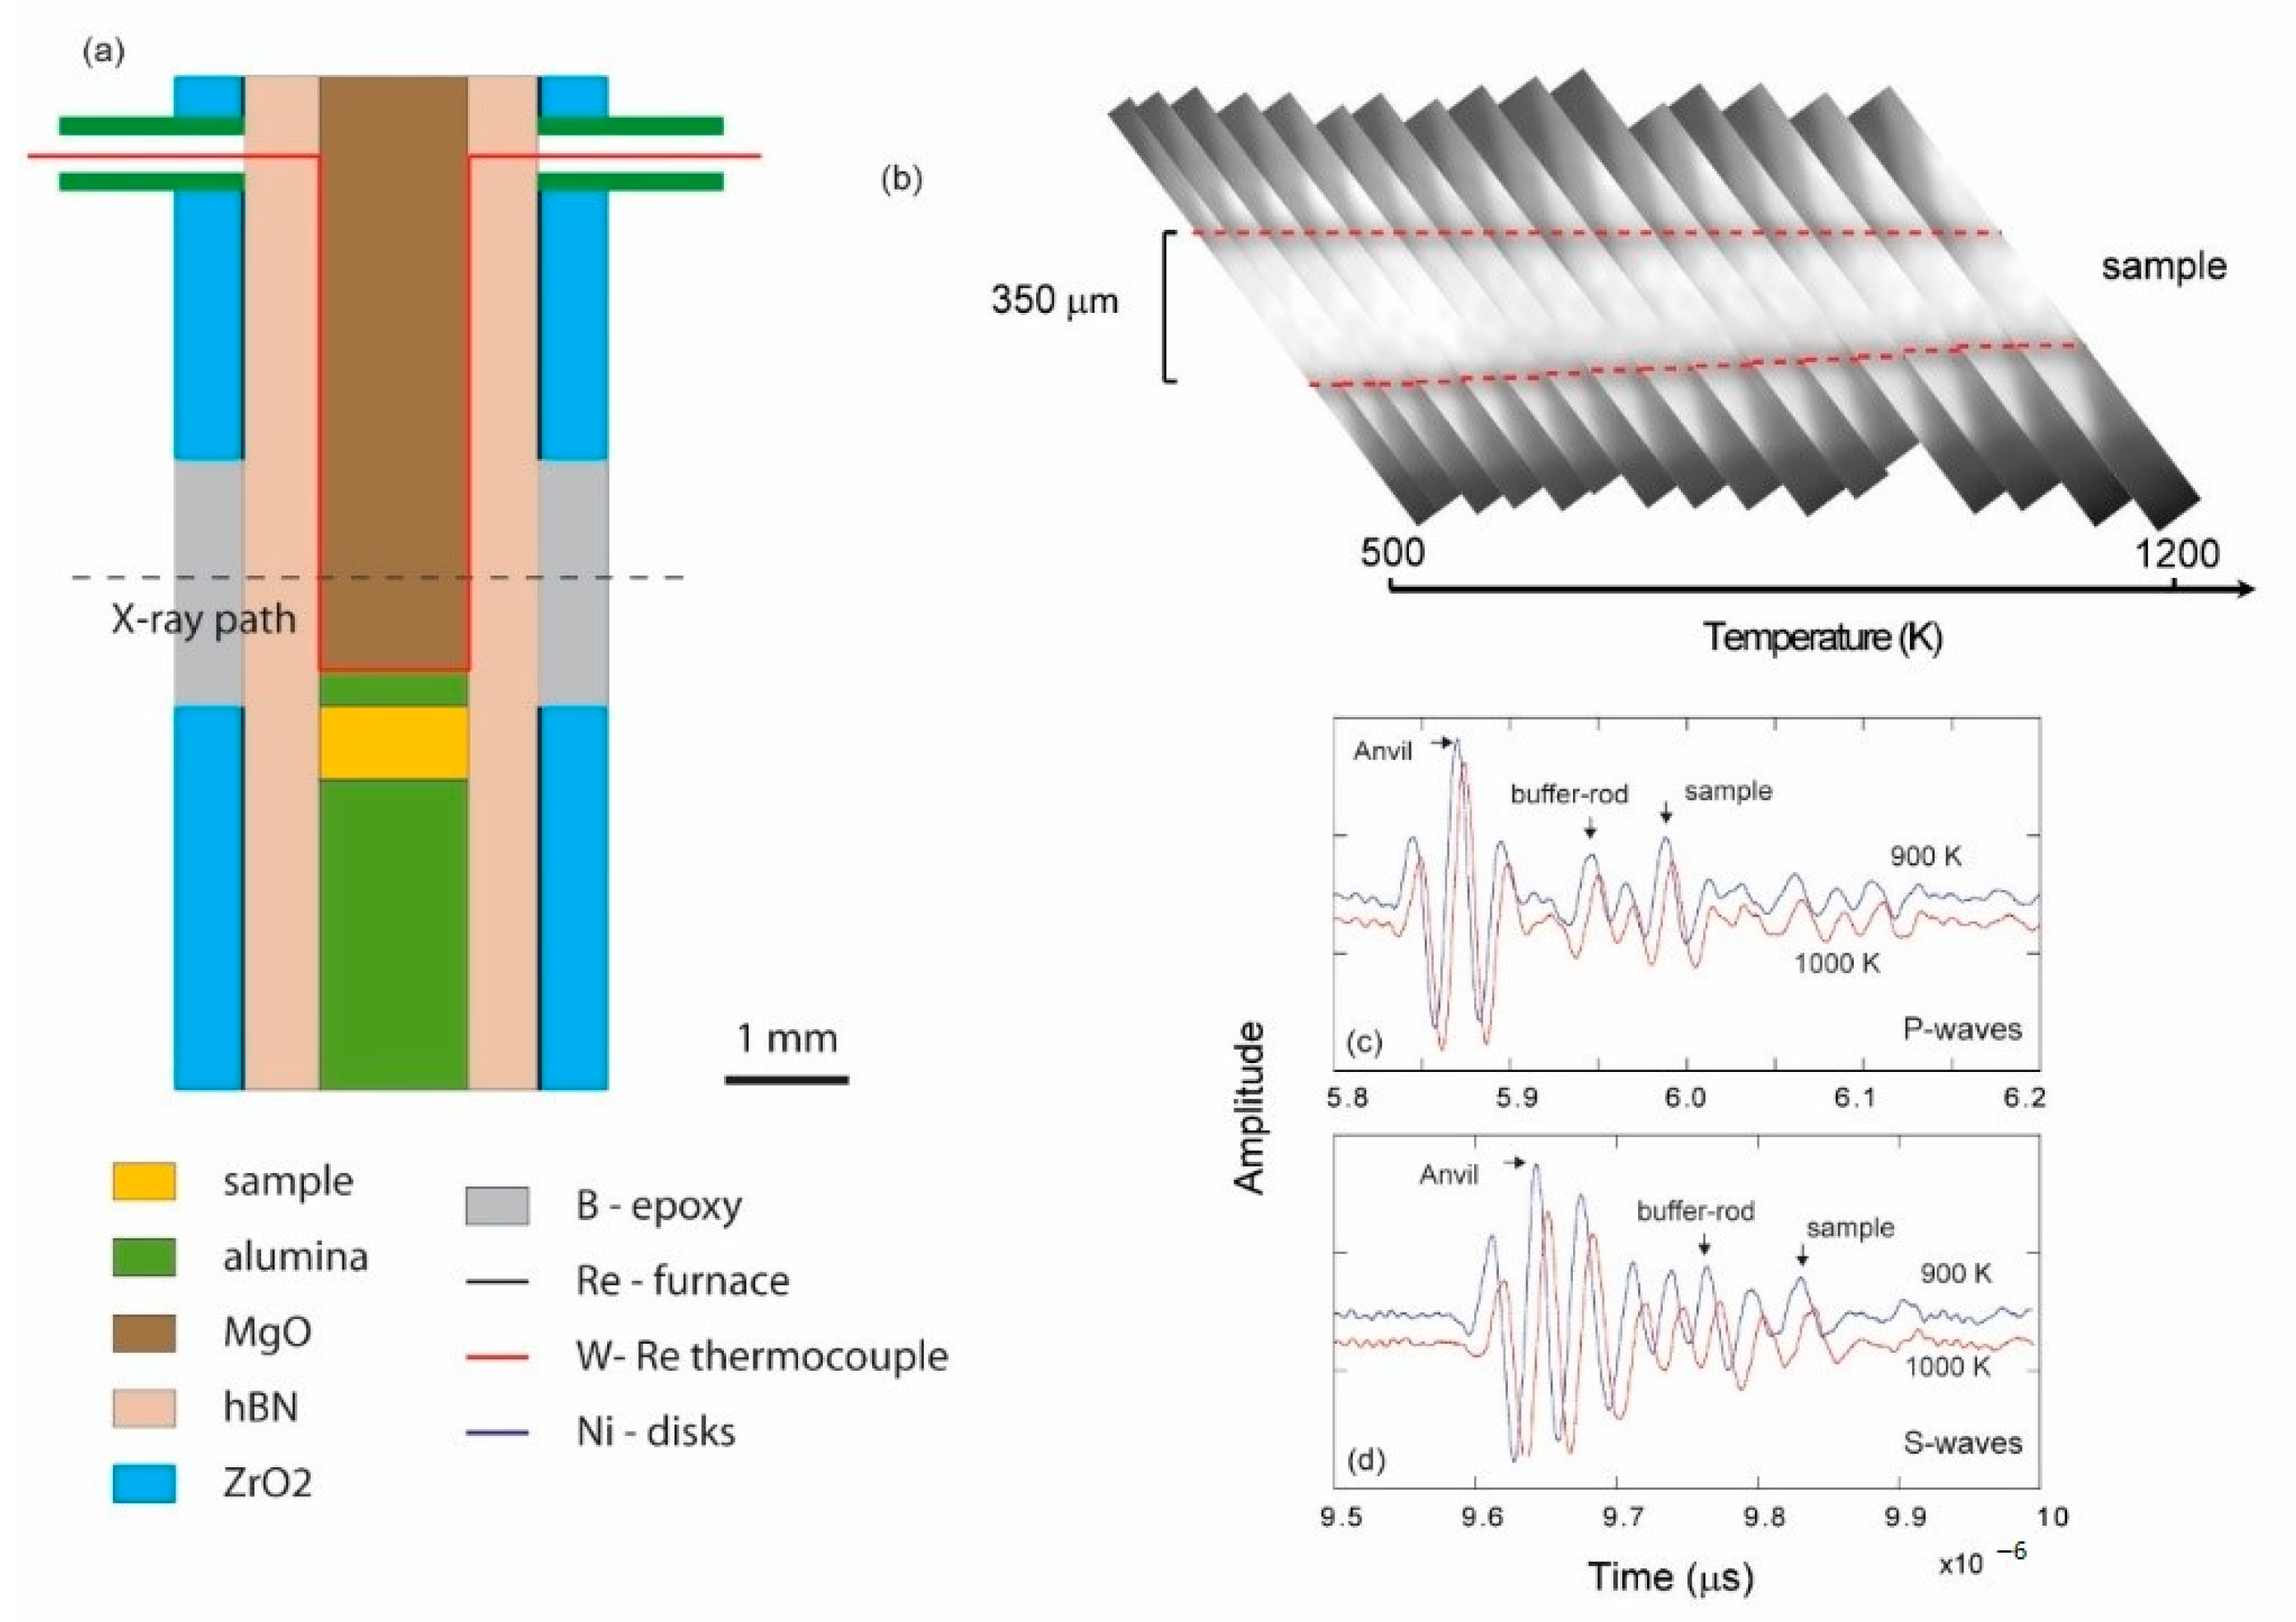
2.2. High-Pressure, High-Temperature Experiments

High-pressure and high-temperature conditions were generated using the 1200-ton DIA-type multi-anvil module at the PSICHE beamline in SOLEIL Synchrotron in France. For experiments conducted at 1.8 and 3.8 GPa, we used an octahedral pressure medium composed of MgO + Cr2O3 in a 10/4 multi-anvil configuration (Figure 1a). Cylindrical core samples of 1.2 mm diameter and 0.5 mm in length were placed in a hexagonal boron nitride (hBN) capsule, which electrically insulated the sample from the furnace during the measurements. The high-purity hBN, sintered at high temperature and pressure without a boron oxide (B2O3) binder (BNHP-FINAL Advanced Materials), ensures that there were no B2O3 forming reactions with the aqueous fluids. Two Ni disks (10 μm) placed at the top and bottom of the sample served as metal markers for X-ray radiography images, which were used for the measurement of the sample lengths using the radiography images (Figure 1b). The presence of Ni was expected to maintain the oxygen fugacity of the sample close to the Ni-NiO buffer. A W95Re5-W74Re26 thermocouple junction was placed at one side of the sample, which monitored the temperature. A dense Al2O3 buffer rod was placed between one of the tungsten carbide (WC) anvil truncations and the sample, to enhance the propagation of elastic waves and to provide sufficient impedance contrast to reflect ultrasonic waves at the buffer rod–sample interface. We placed a 0.3 mm thick alumina disc on the opposite end of the sample to maintain the sample geometry (Figure 1a). Both ends of the anvil, the alumina buffer rod, and the samples were mirror-polished to enhance mechanical contacts. All ceramic parts of the cell assembly, including the pressure medium, were fired at 1273 K prior to their assemblage, to remove any adsorbed moisture, and were kept at 400 K in a high-vacuum furnace (10−2 Torr) before assembling the experiment.

2.3. Seismic Wave Velocity Measurements

Sound wave velocities of the samples were measured using the ultrasonic interferometry technique [32]. In this method, electrical signals of sine waves of 20–50 MHz (3–5 cycles) with Vpeak-to-peak of 5 V were generated by an arbitrary waveform generator (Tektronix AFG3101C); they were then converted to primary (Vp) and secondary (VS) waves by a 10° Y-cut LiNbO3 piezoelectric transducer attached to the mirror-polished truncated corner of a WC anvil. The resonant frequency of the transducer is 50 MHz for compressional waves (P-waves) and 30 MHz for shear waves (S-waves). Elastic waves propagated through the tungsten carbide (WC) anvil, alumina buffer rod (BR), and the sample, and were reflected at the interfaces between the anvil-BR, the BR-sample, and the sample electrode (Figure 1c,d). The reflected elastic echo waves were converted back to electrical signals by the transducer and captured by a Tektronix DPO 5140 Digital Phosphor Oscilloscope at a rate of 5 × 10⁹ sample/s. Signals at 20, 30, 40, and 50 MHz were recorded at each temperature step. The two-way travel time for the sound waves propagating through the sample was determined by the time difference between the arrivals of the echoes from the BR–sample interface and the sample-backing material interface by the pulse-echo overlap method [32] Sample lengths at each temperature were determined using the X-ray radiography images (Figure 1b). Experimental measurements of velocity are subject to uncertainties originating from the estimation of temperature, pressure, sample dimensions, and fitting errors. Errors have been estimated to be 2.0% (2σ).

2.4. Synchrotron Experiments

Energy-dispersive X-ray diffraction was used to determine the sample pressure and verify the sample state. Diffraction was performed in an energy-dispersive mode using a CAESAR-type diffraction detector system [33]. The characteristics of the beam-line were discussed in previous studies [34,35,36]. Simultaneously, we acquired radiographic images for the determination of the sample lengths, yielding accurate quantitative determination of elastic velocity at each temperature (Figure 1b). The focused beam configuration (in vertical) allowed each image to be assembled by scanning the press in front of the beam. This had the advantage of producing almost flat-field corrected images, a feature usually not available when using multi-anvil modules.

3. Results

The ultrasound wave velocities of polycrystalline aggregates of natural chlorite were obtained in situ at pressures of 1.8 and 3.8 GPa and temperatures up to 1200 K (Figure 2). The increase in temperature incurred a gradual decrease in both Vp and vs. in chlorite, consistent with the softening of bulk and shear moduli with temperature. However, temperature appeared to have a more pronounced effect on Vp than it had on Vs. Compared to major mantle minerals, the Vp and vs. of chlorite appeared to be significantly lower, 5 km/s and 2.5 km/s respectively, at 900 K. We observed that the increase in pressure had a negligible effect on both compressional and shear wave velocities.
The dehydration of chlorite exhibited a unique velocity behavior which resulted in an increase in Vp and decrease in Vs. Upon dehydration, it was expected that both Vp and vs. would decrease at the dehydration and subsequent release of fluid, following the characteristic elastic wave velocity behavior for liquids [18,20,37]. The increase in temperature beyond 900 K prompted a marked change of velocities, as Vp increased from 5.1 to 5.5 km/s, and vs. decreased from 2.37 to 2.23 km/s at 950 K. The change in velocities corresponded to an 8% increase in Vp and a 5% decrease in Vs, relative to the normalized velocities in chlorite prior to dehydration (Figure 2b).
Analyses of recovered experimental run products after sound wave velocity measurements confirmed the partial dehydration of chlorite at high temperatures, which produced olivine, pyrope-garnet, hercynite spinel (Fe2(Mg, Al)O4) at 1.8 GPa, and the stability of olivine and Mg-sursassit at 3.8 GPa was consistent with previous studies [38,39] (Figure 3). We observed a higher proportion of Mg-sursassite at 3.8 GPa, which indicated partial dehydration of chlorite and stability of an intermediate hydrous phase [38]. The partially dehydrated chlorite retained the relict preferred orientation perpendicular to the compression axis.

4. Discussion

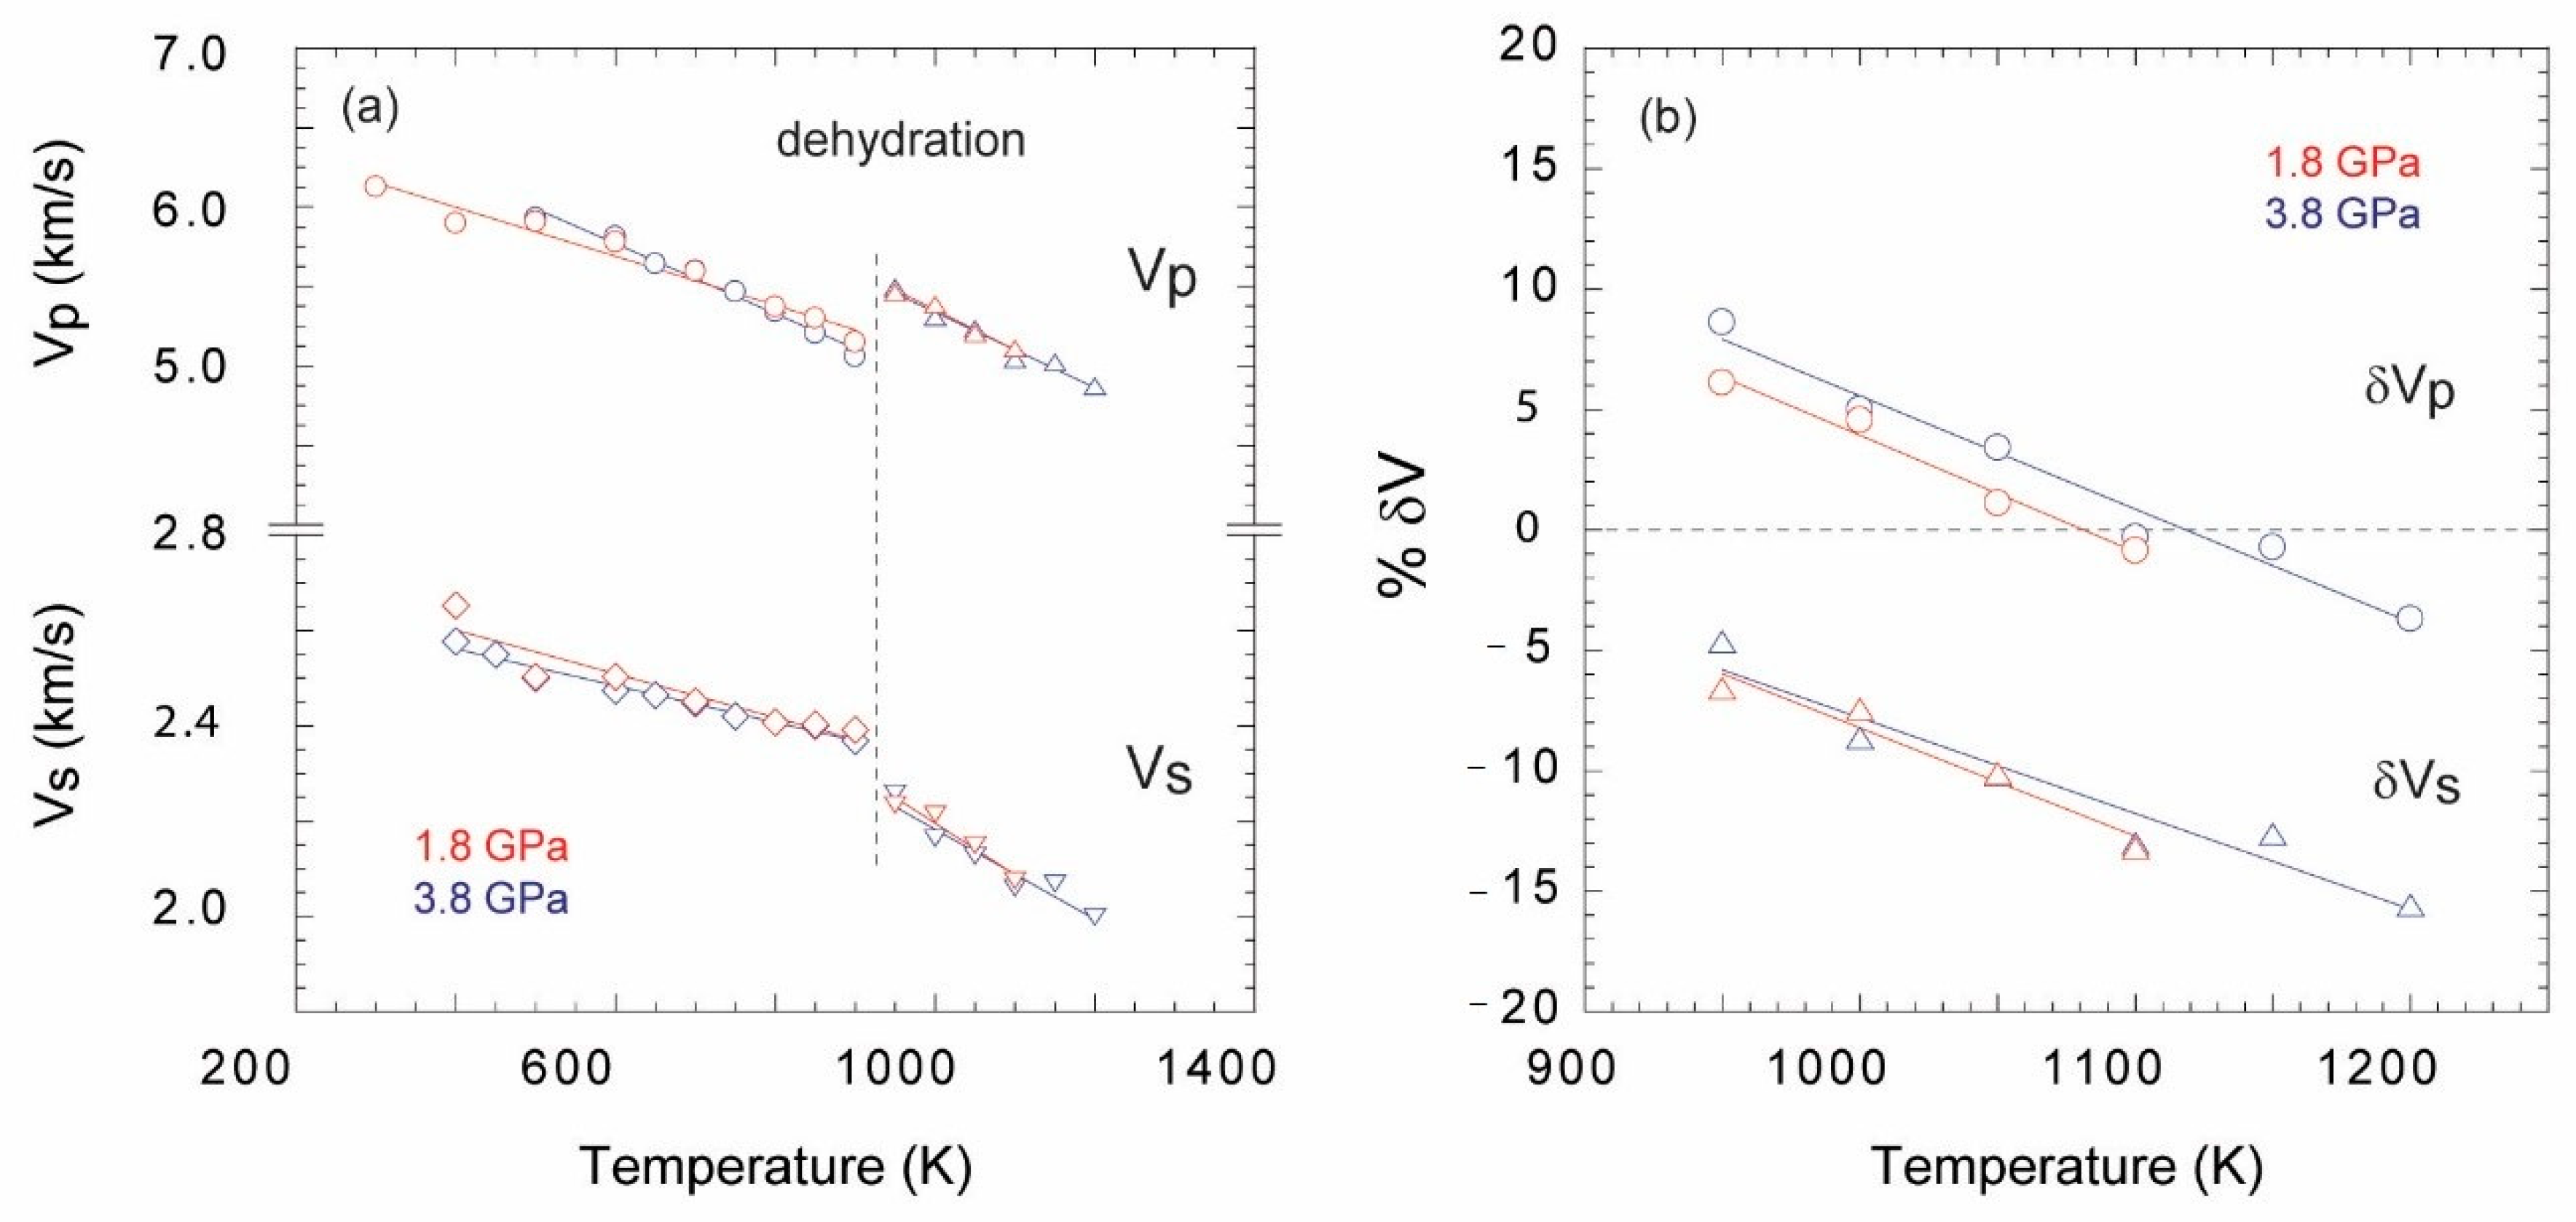
4.1. Elastic Wave Velocities

The measured elastic wave velocities of Fe-bearing chlorite (Mg3.77Fe1.23)Al(Si3Al)O10(OH)8 in this study indicated a ~20% decrease in Vp and ~38% decrease in Vs. relative to the ambient temperature velocities of Mg-endmember chlorite Mg5Al(Si3Al)O10(OH)8 obtained using static density functional theory (DFT) [40]. The decrease in Vp and vs. with the incorporation of Fe in chlorite was in agreement with the effect that Fe had on elastic wave velocities of mantle minerals [41,42,43,44,45]. The incorporation of Fe resulted in an increase in density from 2.60 gcm−3 of Fe-free verity [40] to 2.761 gcm−3 in our sample, which represented a 6% increase in density at ambient conditions. While the incorporation of Fe affected both elastic moduli and the density, it has been shown that the increase in density due to the increase in Fe contents was responsible for the observed low velocities in Fe-bearing minerals compared to their Fe-free varieties [46].
The unique increase in Vp at the dehydration of chlorite reflected important mineralogical changes that occurred in the sample. Unlike melting, in which mineral phases are consumed to produce melt, dehydration stabilizes a suite of solid minerals together with the fluid phase. We attributed the unique increase in Vp during dehydration of chlorite to the increase in the stiffness of the sample due to the crystallization of secondary mineral phases, which affected the compressibility, compensating for the velocity decrease by the fluid phase. The increase in Vp can be explained by dehydration of only 10 vol.% of chlorite (Figure 4). Further dehydration increased the volume fraction of fluid in the sample, gradually masking the effect of nominally anhydrous minerals, garnet, olivine, spinel, as seen by the decrease in Vp with increasing temperature (Figure 4).

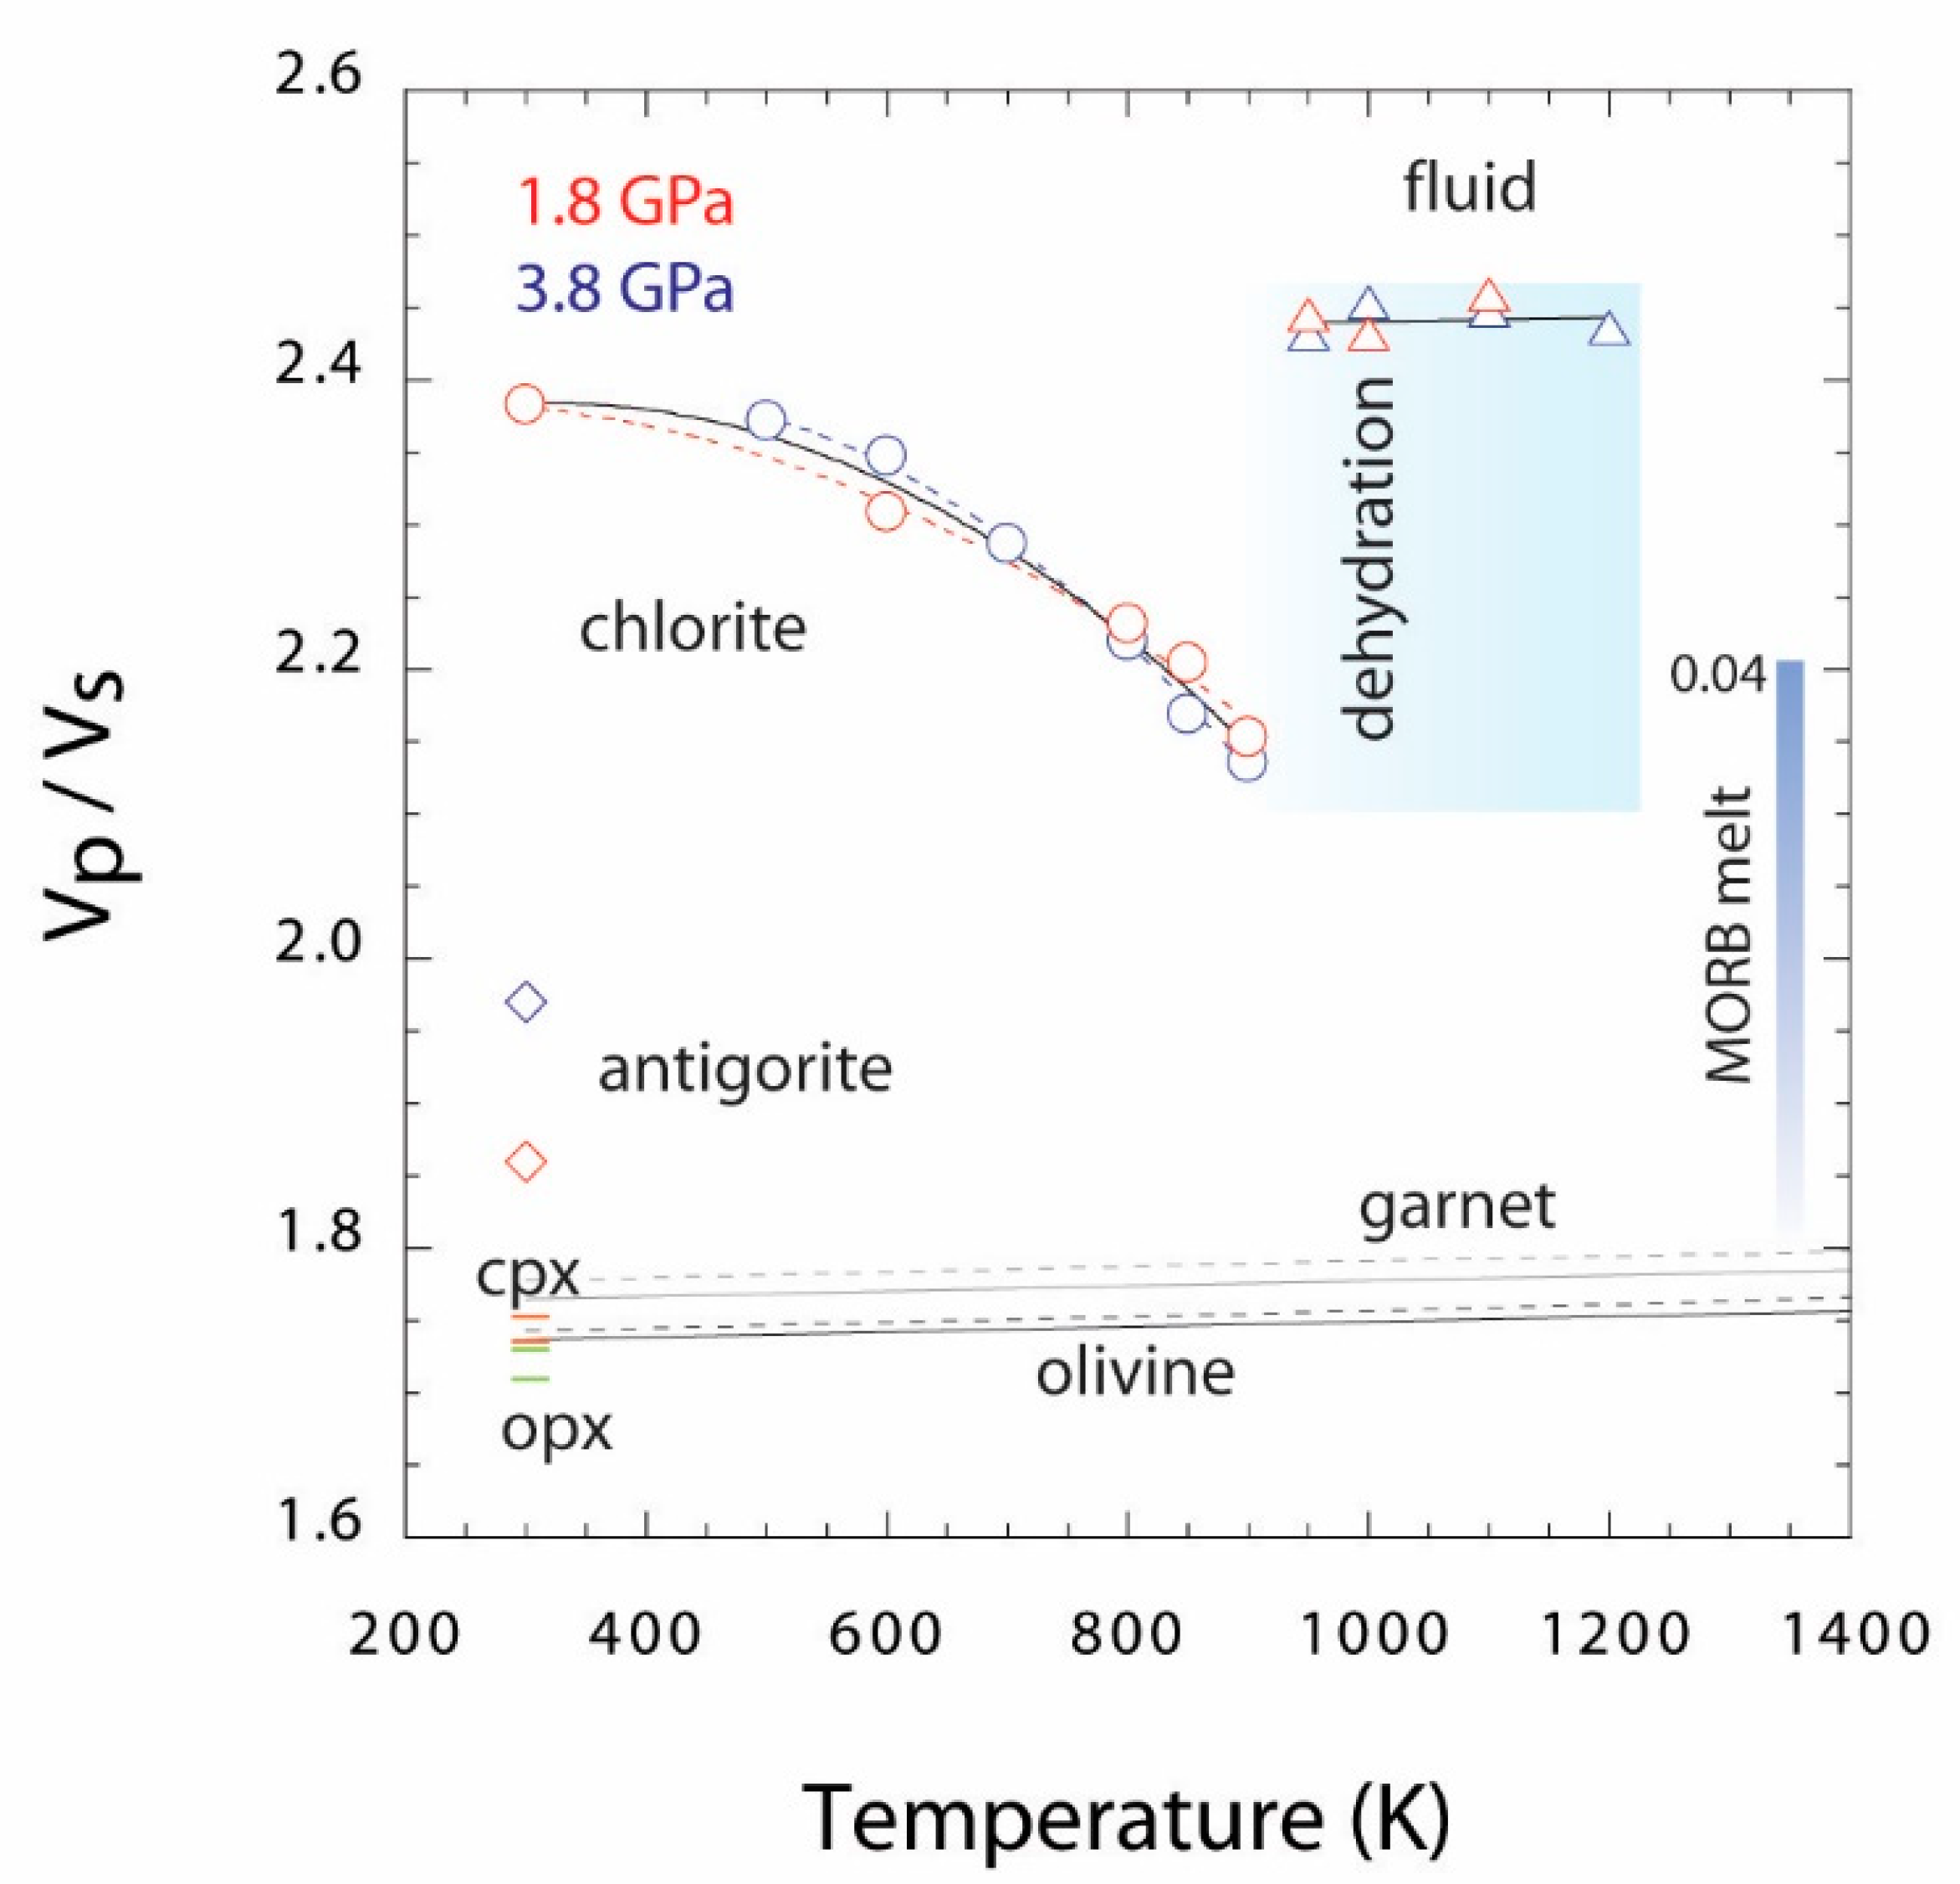
4.2. The Velocity Ratio (Vp/Vs) in Chlorite and Dehydrating Fluids

The velocity ratio Vp/Vs is frequently used to interpret composition, structure, and dynamic properties in the Earth’s interior [50,51,52]. For major upper mantle minerals, the ratio varies within a narrow range of 1.7–1.8, with garnet showing the highest value around 1.8 [52]. The velocity ratios of major mantle minerals show a general tendency to increase with increasing pressure and temperature. In this study, we observed a 13% increase in the Vp/Vs ratio, from 2.14 at 900 K to 2.45 at 950 K, as a result of the dehydration of chlorite. After dehydration, the value remained nearly constant, while further increases occurred in temperatures up to 1200 K (Figure 5). The unusually high Vp/Vs ratio of chlorite was consistent with the previous DFT calculations [40]. The progressive decrease in velocity ratio in chlorite with increasing temperature prior to the dehydration may be linked to the decrease in the principal elastic moduli C33 component, due to the development of preferred orientation in chlorite perpendicular to the principal compression axis. Low elastic wave velocities and a high Vp/Vs ratio have also been reported for antigorite [23], another principal hydrous mineral in subduction zones.
While the velocity ratio of major mantle minerals varies in a narrow range, the parameter has been considered as a reliable seismic tool to distinguish liquid phases from solid minerals. The velocity ratio has been used to predict the melting in the asthenosphere–lithosphere boundary, at subduction zones, and at the D” layer at the core–mantle boundary region [18,53,54]. The iron-enriched minerals observed at the core–mantle boundary region appeared to have anomalous seismic velocities, while the velocity ratio has been used to predict chemical interactions between the metal–liquid outer core and the overlying solid mantle [55].
In the Earth, melts or aqueous fluids occur in small quantities (a few vol.%), distributed along grain boundaries of the matrix minerals. The presence of a small amount of liquid shuts off the direct travel paths for wave propagations through shearing motion thereby effectively increasing the travel time and decreasing Vs. The compressional wave velocity is decreased due to the absence of the shear component; however, compressional waves could still travel through liquid media. Therefore, a general increase in Vp/Vs is expected for liquid phases due to the large drop in Vs. This tendency has been demonstrated by recent experimental studies [18,20,21], showing a systematic increase in Vp/Vs with increasing melt fraction.
The elastic wave velocity of aqueous fluids has not been investigated prior to this study. In this study, we have shown for the first time that the Vp/Vs ratio of the fluid-bearing sample increased sharply upon dehydration from 2.15 at 900 K to 2.45 at 950 K (Figure 5). Despite the increase in temperature, the fluid fraction appears to have had a negligible influence on the ratio. A higher Vp/Vs ratio was observed for the hydrous silicate melt [18,20]. Nevertheless, the Vp/Vs of hydrous basaltic melt was strongly dependent on the melt fraction, and a Vp/Vs of less than 2 can be expected for the geologically relevant melt fractions in the Earth [18]. Thus, the Vp/Vs ratio of about 2.4 could be a robust indicator of the presence of fluid in the mantle.

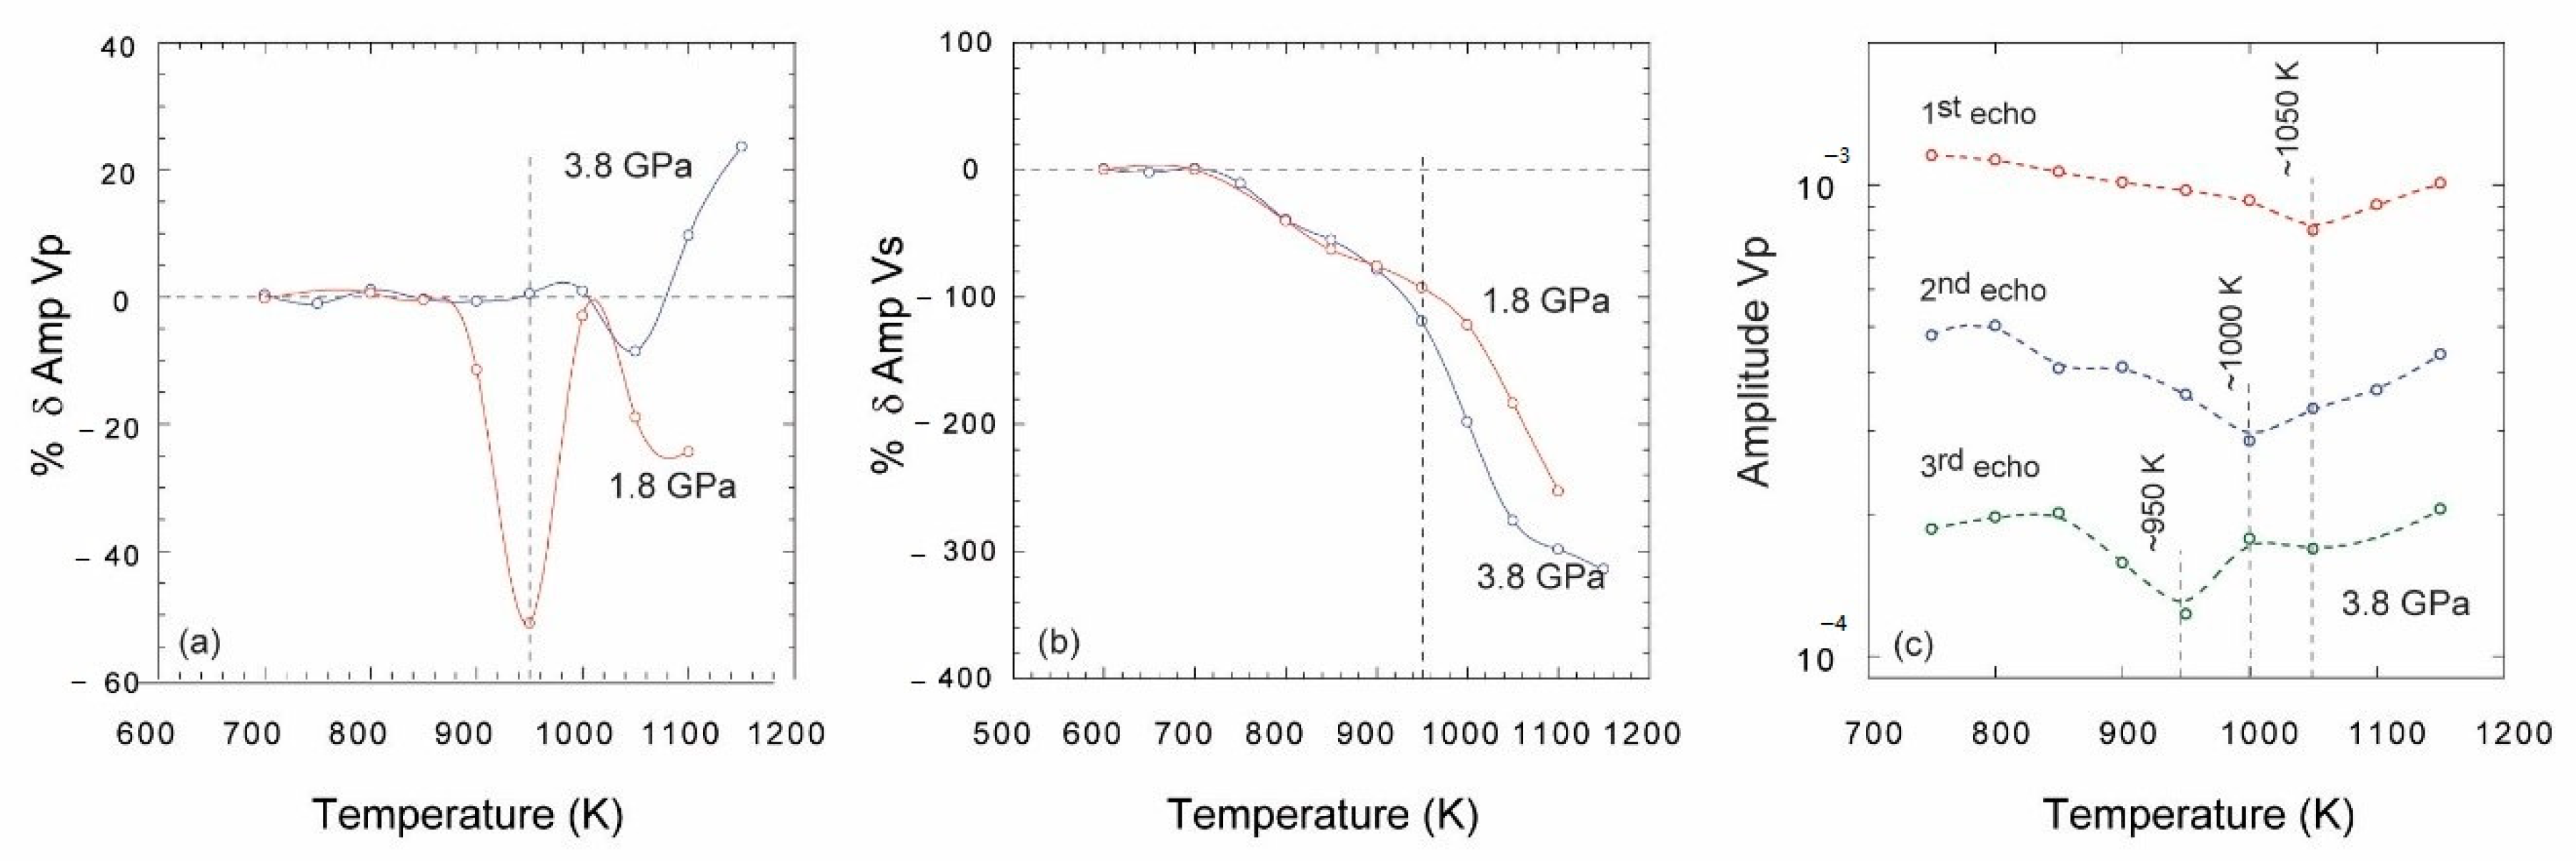
4.3. The Effect of Dehydration on the Amplitudes of P- and S-Wave Echoes

The amplitudes of both P- and S-wave echoes exhibited unusual behavior above 900 K, closely following the dehydration temperature of chlorite (Figure 6a,b). For example, the amplitude of the first echo of P-waves at 3.8 GPa was unaffected by the onset of dehydration at 900 K; however, an 8.5% decrease in the amplitude relative to the values normalized to the chlorite before dehydration was observed at around 1050 K. The amplitude of the first echo of P-wave of chlorite at 1.8 GPa, on the other hand, decreased by 50%, then recovered to the initial value and continued to decrease with increasing temperature. Amplitudes of the 1st echo of S-waves of 1.8 and 3.8 GPa samples followed a decreasing trend, with chlorite at 3.8 GPa exhibiting a steep change compared to the measurements at 1.8 GPa.
The decrease in wave amplitudes mostly depends on the reflectance (and transmittance) of waves at the interfaces between sample and alumina. Reflectance and transmittance of waves at interface depend on the contrast of acoustic impedance. The sharp decrease in the amplitude of P-and S-waves can be correlated to the release of aqueous fluid into the sample, which may change the acoustic impedance of the fluid-bearing sample. The unique increase in amplitude after the initial drop may be related to the growth of olivine, garnet, and spinel crystals in the sample, which may increase the bulk density of the sample relative to chlorite (Figure 6a). However, the attenuation in hydrous minerals during progressive dehydration appears to be governed by the fine balance between the amount of aqueous fluid present in the sample and the increase in bulk density due to the appearance of nominally anhydrous mineral phases. The shear waves lose more energy compared to P-waves, due to scattering at grain boundaries, especially when the grain boundaries contain a liquid phase. The decrease in the amplitudes of S-waves observed in our study was consistent with the continuous release of fluid into the sample with increasing temperature (Figure 6b).
The 1st, 2nd, and 3rd echos observed for p-waves in our sample at 3.8 GPa exhibited a unique behavior, indicating a sudden drop in amplitude at three different temperatures (Figure 6c). The magnitude of the drop in amplitude and the temperature at which the maximum drop occurred decreased from the 1st echo to the 3rd echo. While we could not offer a definitive explanation, we propose that this observation could be due to the cumulative effect of sound waves traveling multiple times through the fluid-bearing media.

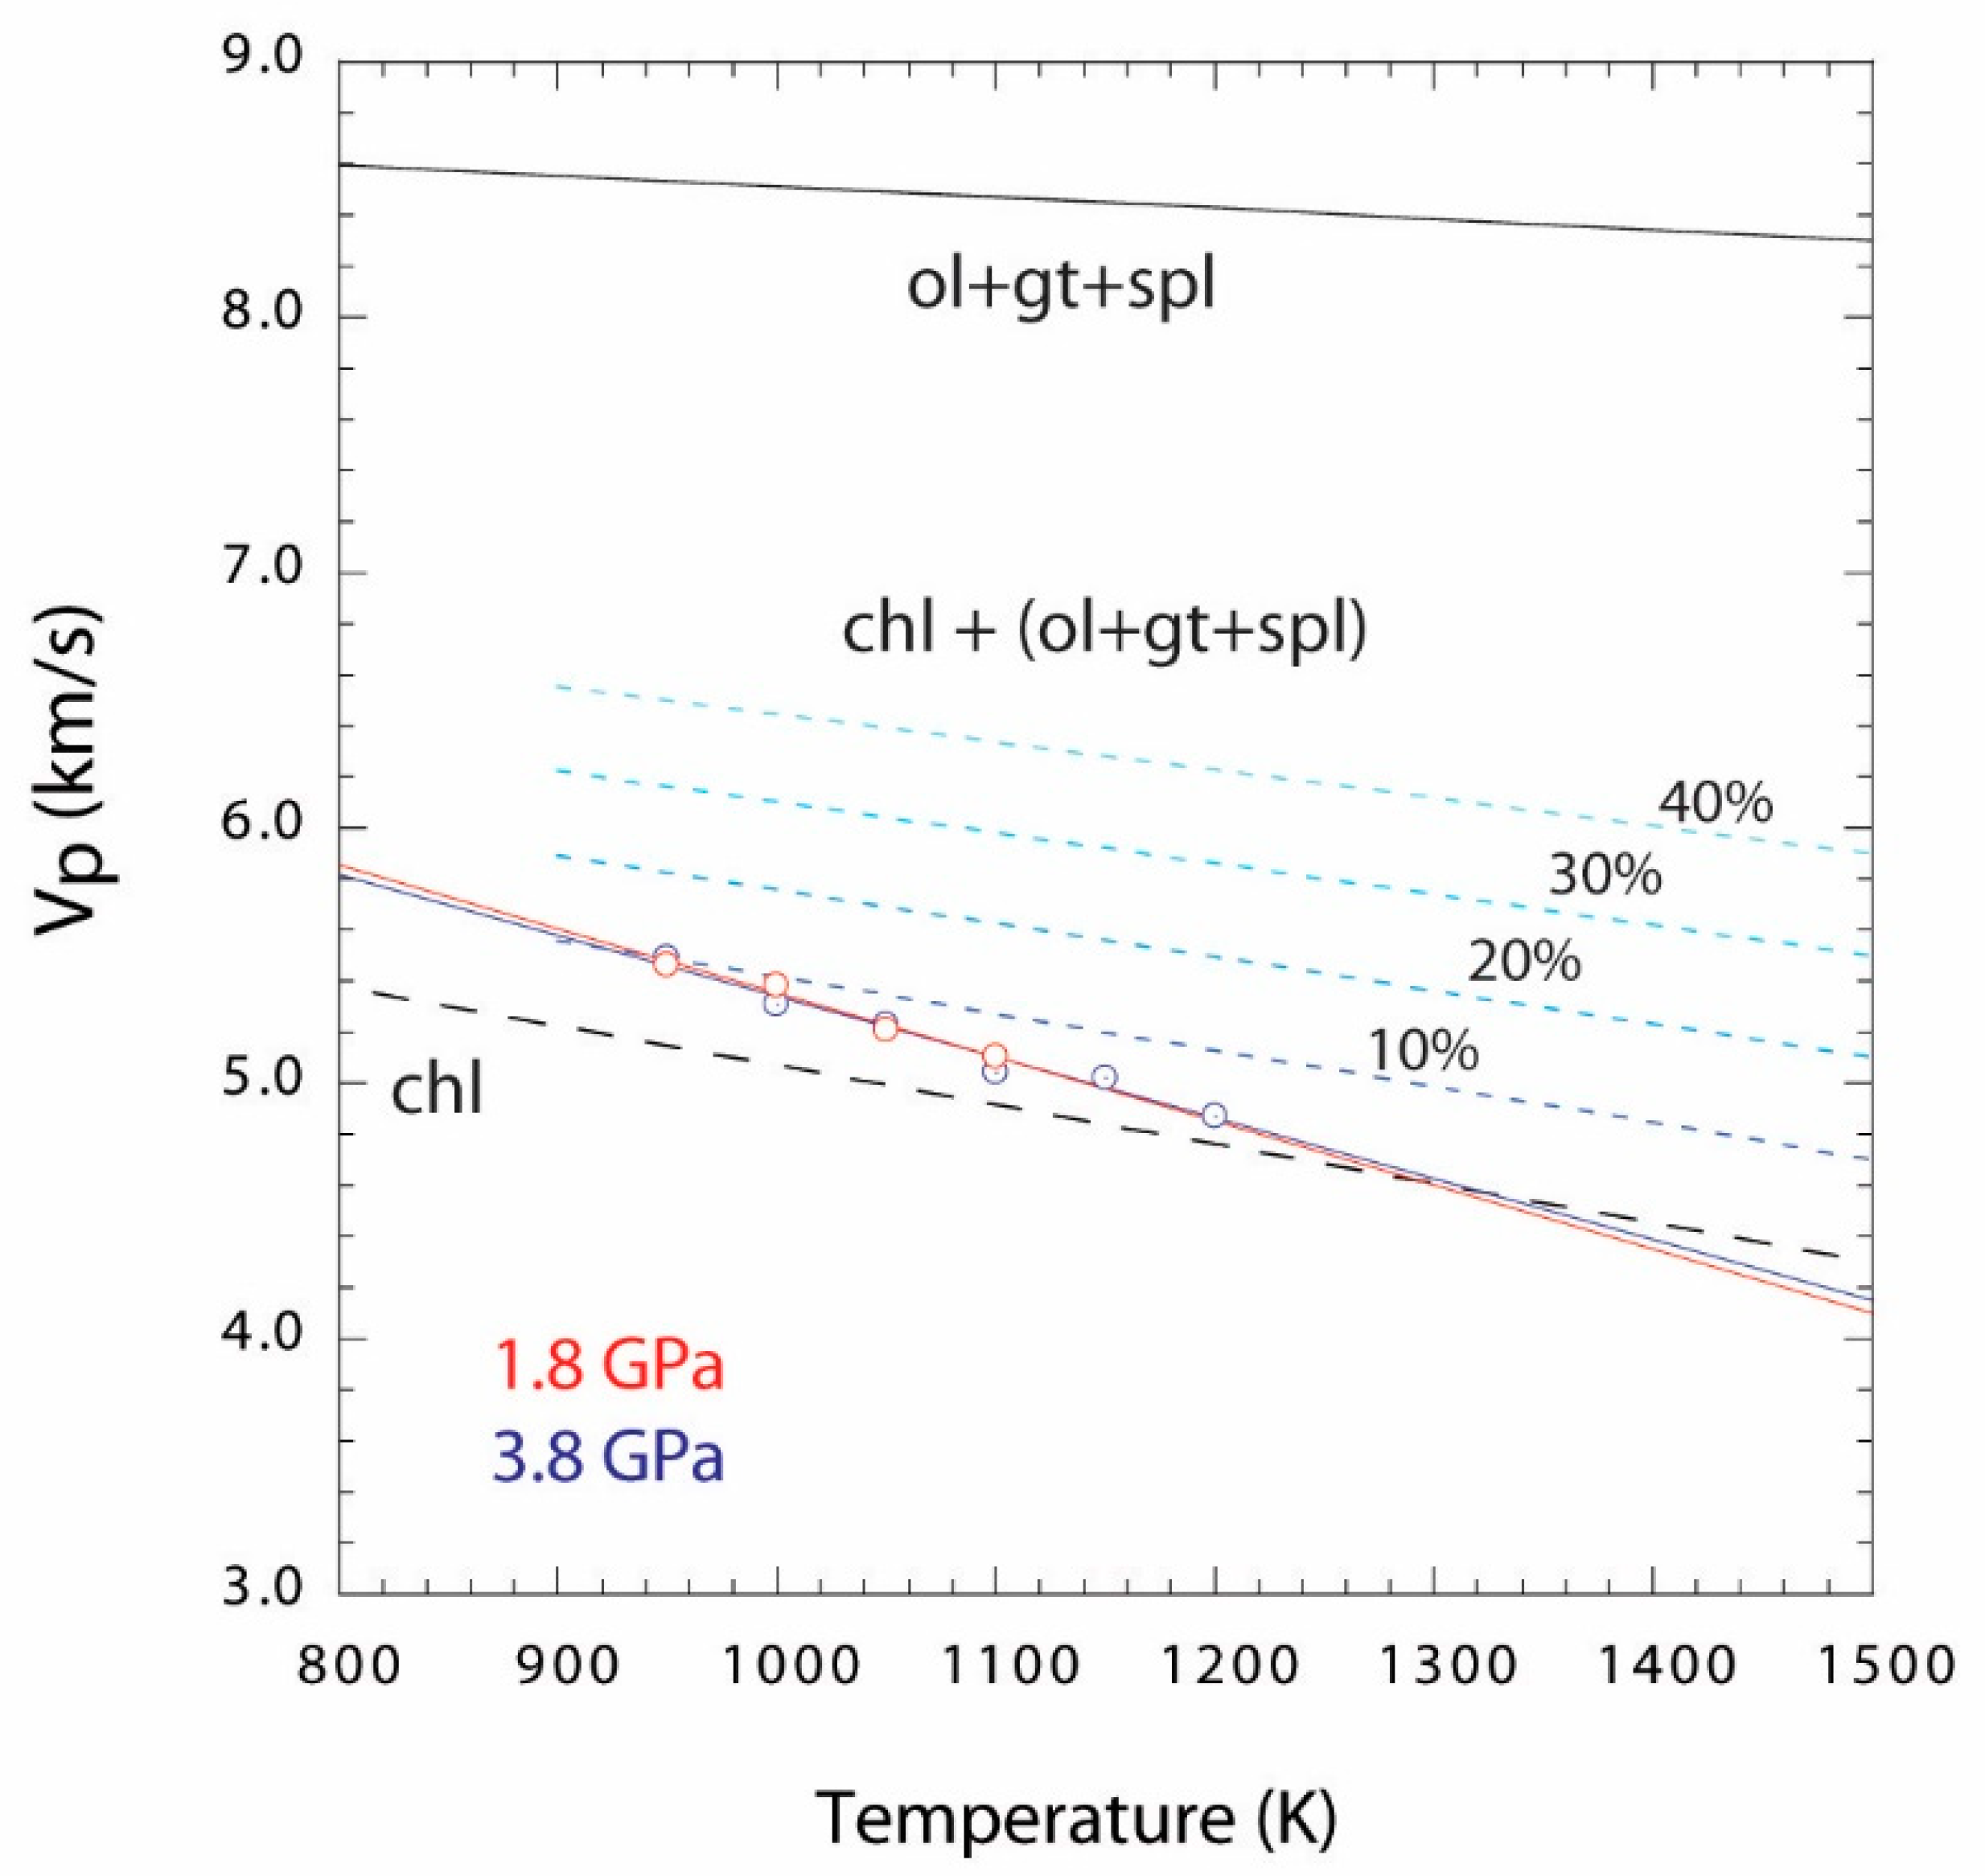
4.4. Geophysical Implications

Mantle wedges, where increased fluid activities can be expected, are often characterized by anomalous seismic properties. The low velocity and high Vp/Vs have often been interpreted as an indication of the presence of hydrous minerals such as serpentine and chlorite [40,56]. In light of the new data obtained in this study, we can explore low-velocity and high Vp/Vs regions to track fluid migration in mantle wedges.
The most compelling observation comes from the absolute Vp/Vs ratios obtained using the 3D seismic tomography at the central Chile–Argentina subduction zone [57] and the south-central Chilean subduction zone [58], where they emphasize high Vp/Vs ratios at the mantle depth of about 50 km. It has been speculated that a Vp/Vs ratio of around two, may indicate the presence of frozen pooled-melt [57] in these subduction systems. However, the depth at which the anomaly is observed (~50 km) may not correspond to the arc melting. The depth at which the seismic anomaly has been observed also coincides with the high conductivity anomaly observed for the Andean subduction system [59,60]. Such high conductivities can be attributed to the presence of aqueous fluids [61]. We interpreted the low-velocity anomaly and the high Vp/Vs ratio observed in the Chile and Argentina subduction systems as some of the best examples of the presence of aqueous fluid in subduction systems. The increase in δVp, decrease in δVs, and the high Vp/Vs ratio around 2.4 can, thus, be used to define aqueous fluids in subduction zones. This study would lay the foundation for tracking dehydrating fluid in the mantle through a high-resolution seismic tomography method.

Author Contributions

G.M. designed the study. G.M. and J.C. performed the experiments and analyzed data. G.M. wrote the manuscript. N.G. and A.K. assisted with the synchrotron set-up at the PSICHE beamline. All authors have read and agreed to the published version of the manuscript.

Funding

G.M. acknowledges funding from the INSU-CNRS. This research was financed by the French Government Laboratory of Excellence initiative n°ANR-10-LABX-0006, the Région Auvergne, and the European Regional Development Fund. This is ClerVolc contribution number 449.

Institutional Review Board Statement

Not applicable.

Informed Consent Statement

Not applicable.

Data Availability Statement

The data presented in this study are contained within the article.

Acknowledgments

We thank Emmy Voyer for her assistance with the scanning electron microscope and Laurent Jouffret for help characterizing the starting chlorite samples. Denis Andrault, Ali Bouhifd, Nathali Bolfan Casanova, and J.-P. Itie are thanked for their involvement in the installation of the multi-anvil press at the PSICHE beamline.

Conflicts of Interest

The authors declare no conflict of interest.

References

  1. Schmidt, M.W.; Poli, S. Experimentally based water budgets for dehydrating slabs and consequences for arc magma generation. Earth Planet. Sci. Lett. 1998, 163, 361–379. [Google Scholar] [CrossRef]
  2. Hirschmann, M.M. Mantle solidus: Experimental constraints and the effects of peridotite composition. Geochem. Geophys. Geosyst. 2000, 1, 2000GC000070. [Google Scholar] [CrossRef]
  3. Ishimaru, S.; Arai, S.; Ishida, Y.; Shirasaka, M.; Okrugin, V.M. Melting and multi-stage metasomatism in the mantle wedge beneath a frontal arc inferred from highly depleted peridotite xenoliths from the avacha volcano, Southern Kamchatka. J. Petrol. 2007, 48, 395–433. [Google Scholar] [CrossRef] [Green Version]
  4. Scambelluri, M.; Müntener, O.; Ottolini, L.; Pettke, T.T.; Vannucci, R. The fate of B, Cl and Li in the subducted oceanic mantle and in the antigorite breakdown fluids. Earth Planet. Sci. Lett. 2004, 222, 217–234. [Google Scholar] [CrossRef]
  5. Hacker, B.R.; Peacock, S.M.; Abers, G.; Holloway, S.D. Subduction factory 2. Are intermediate-depth earthquakes in subducting slabs linked to metamorphic dehydration reactions? J. Geophys. Res. 2003, 108, 2030. [Google Scholar] [CrossRef] [Green Version]
  6. Zhao, D.; Mishra, O.P.; Sanda, R. Influence of fluids and magma on earthquakes: Seismological evidence. Phys. Earth Planet. Inter. 2002, 132, 249–267. [Google Scholar] [CrossRef]
  7. Arcay, D.; Tric, E.; Doin, M.P. Numerical simulations of subduction zones. Effect of slab dehydration on the mantle wedge dynamics. Phys. Earth Planet. Inter. 2005, 149, 133–153. [Google Scholar] [CrossRef]
  8. Zhao, D. Seismological structure of subduction zones and its implications for arc magmatism and dynamics. Phys. Earth Planet. Inter. 2001, 127, 197–214. [Google Scholar] [CrossRef]
  9. Birch, F. Interpretations of the low-velocity zone. Phys. Earth Planet. Inter. 1970, 3, 178–181. [Google Scholar] [CrossRef]
  10. Spetzler, H.A.; Anderson, D.L. The Effect of Temperature and Partial Melting on Velocity and Attenuation in a Simple Binary System. J. Geophys. Res. 1968, 73, 6051–6060. [Google Scholar] [CrossRef] [Green Version]
  11. Anderson, D.; Sammis, C. Partial melting in the upper mantle. Phys. Earth Planet. Inter. 1970, 3, 41–50. [Google Scholar] [CrossRef]
  12. Faul, U.H.; Fitz Gerald, J.D.; Jackson, I. Shear wave attenuation and dispersion in melt-bearing olivine polycrystals: 2. Microstructural interpretation and seismological implications. J. Geophys. Res. B Solid Earth 2004, 109, 1–20. [Google Scholar] [CrossRef]
  13. Karato, S.; Spetzler, H.A. Defect microdynamics in minerals and solid-state mechanisms of seismic wave attenuation and velocity dispersion in the mantle. Rev. Geophys. 1990, 28, 399–421. [Google Scholar] [CrossRef]
  14. Jang, H.; Kim, Y.H.; Lim, H.; Clayton, R.W. Seismic attenuation structure of southern Peruvian subduction system. Tectonophysics 2019, 771, 228203. [Google Scholar] [CrossRef]
  15. Kawakatsu, H.; Watada, S. Seismic Evidence for Deep-Water Transportation in the Mantle. Science 2010, 316, 1468–1471. [Google Scholar] [CrossRef]
  16. Allam, A.A.; Schulte-Pelkum, V.; Ben-Zion, Y.; Tape, C.; Ruppert, N.; Ross, Z.E. Ten kilometer vertical Moho offset and shallow velocity contrast along the Denali fault zone from double-difference tomography, receiver functions, and fault zone head waves. Tectonophysics 2017, 721, 56–69. [Google Scholar] [CrossRef] [Green Version]
  17. Anderson, O.L.; Goto, T. Measurement of elastic constants of mantle-related minerals at temperatures up to 1800 K. Phys. Earth Planet. Inter. 1989, 55, 241–253. [Google Scholar] [CrossRef]
  18. Chantel, J.; Manthilake, G.; Andrault, D.; Novella, D.; Yu, T.; Wang, Y. Experimental evidence supports mantle partial melting in the asthenosphere. Sci. Adv. 2016, 2, e1600246. [Google Scholar] [CrossRef] [Green Version]
  19. Freitas, D.; Manthilake, G.; Schiavi, F.; Chantel, J.; Bolfan-Casanova, N.; Bouhifd, M.A.; Andrault, D. Experimental evidence supporting a global melt layer at the base of the Earth’s upper mantle. Nat. Commun. 2017, 8, 1–7. [Google Scholar] [CrossRef] [Green Version]
  20. Freitas, D.; Manthilake, G.; Chantel, J.; Bouhifd, M.A.; Andrault, D. Simultaneous measurements of electrical conductivity and seismic wave velocity of partially molten geological materials: Effect of evolving melt texture. Phys. Chem. Miner. 2019, 46, 535–551. [Google Scholar] [CrossRef] [Green Version]
  21. Weidner, D.J.; Li, L.; Whitaker, M.L.; Triplett, R. Ultrasonic Acoustic Velocities During Partial Melting of a Mantle Peridotite KLB-1. J. Geophys. Res. Solid Earth 2018, 123, 1252–1261. [Google Scholar] [CrossRef]
  22. Fomin, I.; Schiffer, C. Water, hydrous melting, and teleseismic signature of the mantle transition zone. Geosciences 2019, 9, 505. [Google Scholar] [CrossRef] [Green Version]
  23. Wang, D.; Liu, T.; Chen, T.; Qi, X.; Li, B. Anomalous Sound Velocities of Antigorite at High Pressure and Implications for Detecting Serpentinization at Mantle Wedges. Geophys. Res. Lett. 2019, 46, 5153–5160. [Google Scholar] [CrossRef]
  24. Nakajima, J.; Tsuji, Y.; Hasegawa, A. Seismic evidence for thermally-controlled dehydration reaction in subducting oceanic crust. Geophys. Res. Lett. 2009, 36, 1–6. [Google Scholar] [CrossRef] [Green Version]
  25. Audet, P.; Bostock, M.G.; Christensen, N.I.; Peacock, S.M. Seismic evidence for overpressured subducted oceanic crust and megathrust fault sealing. Nature 2009, 457, 76–78. [Google Scholar] [CrossRef] [PubMed]
  26. Hyndman, R.D.; Peacock, S.M. Serpentinization of the forearc mantle. Earth Planet. Sci. Lett. 2003, 212, 417–432. [Google Scholar] [CrossRef]
  27. Bostock, M.G.; Hyndman, R.D.; Rondenay, S.; Peacock, S.M. An inverted continental moho and serpentinization of the forearc mantle. Nature 2002, 417, 536–538. [Google Scholar] [CrossRef]
  28. Saffer, D.M.; Tobin, H.J. Hydrogeology and mechanics of subduction zone forearcs: Fluid flow and pore pressure. Annu. Rev. Earth Planet. Sci. 2011, 39, 157–186. [Google Scholar] [CrossRef] [Green Version]
  29. Tatsumi, Y. Migration of fluid phases and genesis of basalt magmas in subduction zones. J. Geophys. Res. 1989, 94, 4697–4707. [Google Scholar] [CrossRef]
  30. Grove, T.L.; Till, C.B.; Krawczynski, M.J. The Role of H2O in Subduction Zone Magmatism. Annu. Rev. Earth Planet. Sci. 2012, 40, 413–439. [Google Scholar] [CrossRef] [Green Version]
  31. Poli, S.; Schmidt, M.W. Petrology of Subducted Slabs. Annu. Rev. Earth Planet. Sci. 2002, 30, 207–235. [Google Scholar] [CrossRef] [Green Version]
  32. Li, B.; Kung, J.; Liebermann, R.C. Modern techniques in measuring elasticity of Earth materials at high pressure and high temperature using ultrasonic interferometry in conjunction with synchrotron X-radiation in multi-anvil apparatus. Phys. Earth Planet. Inter. 2004, 143, 559–574. [Google Scholar] [CrossRef]
  33. Wang, Y.; Uchida, T.; von Dreele, R.; Rivers, M.L.; Nishiyama, N.; Funakoshi, K.I.; Nozawa, A.; Kaneko, H. A new technique for angle-dispersive powder diffraction using an energy-dispersive setup and synchrotron radiation. J. Appl. Crystallogr. 2004, 37, 947–956. [Google Scholar] [CrossRef]
  34. Manthilake, G.; Chantel, J.; Monteux, J.; Andrault, D.; Bouhifd, M.A.; Casanova, N.B.; Boulard, E.; Guignot, N.; King, A.; Itie, J.P. Thermal conductivity of FeS and its implications for Mercury’s long sustaining magnetic field. J. Geophys. Res. E Planets 2019, 124, 2359–2368. [Google Scholar] [CrossRef]
  35. Xie, L.; Yoneda, A.; Yamazaki, D.; Manthilake, G.; Higo, Y.; Tange, Y.; Guignot, N.; King, A.; Scheel, M.; Andrault, D.; et al. Formation of bridgmanite-enriched layer at the top lower-mantle during magma ocean solidificatio. Nat. Commun. 2020, 11, 1–10. [Google Scholar] [CrossRef] [Green Version]
  36. Andrault, D.; Pesce, G.; Manthilake, G.; Monteux, J.; Bolfan-Casanova, N.; Chantel, J.; Novella, D.; Guignot, N.; King, A.; Itié, J.-P.; et al. Deep and persistent melt layer in the Archaean mantle. Nat. Geosci. 2018, 11, 139–143. [Google Scholar] [CrossRef]
  37. Li, L.; Weidner, D.J. Effect of dynamic melting on acoustic velocities in a partially molten peridotite. Phys. Earth Planet. Inter. 2013, 222, 1–7. [Google Scholar] [CrossRef] [Green Version]
  38. Cai, N.; Inoue, T. High-pressure and high-temperature stability of chlorite and 23-Å phase in the natural chlorite and synthetic MASH system. Comptes Rendus Geosci. 2019, 351, 104–112. [Google Scholar] [CrossRef]
  39. Fumagalli, P.; Poli, S.; Fischer, J.; Merlini, M.; Gemmi, M. The high-pressure stability of chlorite and other hydrates in subduction mélanges: Experiments in the system Cr2O3-MgO-Al2O3-SiO2-H2O. Contrib. Mineral. Petrol. 2014, 167, 979. [Google Scholar] [CrossRef]
  40. Mookherjee, M.; Mainprice, D. Unusually large shear-wave anisotropy for chlorite in subductin zone settings. Geophys. Res. Lett. 2014, 10, 1506–1513. [Google Scholar] [CrossRef] [Green Version]
  41. Fan, D.; Fu, S.; Lu, C.; Xu, J.; Zhang, Y.; Tkachev, S.N.; Prakapenka, V.B.; Lin, J.F. Elasticity of single-crystal Fe-enriched diopside at high-pressure conditions: Implications for the origin of upper mantle low-velocity zones. Am. Mineral. 2020, 105, 363–374. [Google Scholar] [CrossRef]
  42. Chung, D.H. Effects of Iron/Magnesium Ratio on P- and S-Wave Velocities in olivine. J. Geophys. Res. 1970, 75, 7353–7361. [Google Scholar] [CrossRef]
  43. Núñez-Valdez, M.; Wu, Z.; Yu, Y.G.; Wentzcovitch, R.M. Thermal elasticity of (Fex,Mg1-x)2SiO4 olivine and wadsleyite. Geophys. Res. Lett. 2013, 40, 290–294. [Google Scholar] [CrossRef]
  44. Tennakoon, S.; Peng, Y.; Mookherjee, M.; Speziale, S.; Manthilake, G.; Besara, T.; Andreu, L.; Rivera, F. Single crystal elasticity of natural topaz at high-temperatures. Sci. Rep. 2018, 8, 1–9. [Google Scholar] [CrossRef] [Green Version]
  45. Speziale, S.; Jiang, F.; Duffy, T.S. Compositional Dependence of the Elastic Wave Velocities of Mantle Minerals: Implications for Seismic Properties of Mantle Rocks. Earth’s Deep Mantle Struct. Compos. Evol. 2005, 160, 301–320. [Google Scholar] [CrossRef] [Green Version]
  46. Dorfman, S.M.; Duffy, T.S. Effect of Fe-enrichment on seismic properties of perovskite and post-perovskite in the deep lower mantle. Geophys. J. Int. 2014, 197, 910–919. [Google Scholar] [CrossRef] [Green Version]
  47. Zhang, J.S.; Bass, J.D. Sound velocities of olivine at high pressures and temperatures and the composition of Earth’s upper mantle. Geophys. Res. Lett. 2016, 43, 9611–9618. [Google Scholar] [CrossRef]
  48. Irifune, T.; Higo, Y.; Inoue, T.; Kono, Y.; Ohfuji, H.; Funakoshi, K. Sound velocities of majorite garnet and the composition of the mantle transition region. Nature 2008, 451, 814–817. [Google Scholar] [CrossRef]
  49. Antao, S.M.; Jackson, I.; Li, B.; Kung, J.; Chen, J.; Hassan, I.; Liebermann, R.C.; Parise, J.B. High-temperature elasticity of magnesioferrite spinel. Phys. Chem. Miner. 2007, 34, 345–350. [Google Scholar] [CrossRef]
  50. Afonso, J.C.; Ranalli, G.; Fernàndez, M.; Griffin, W.L.; O’Reilly, S.Y.; Faul, U. On the Vp/Vs-Mg# correlation in mantle peridotites: Implications for the identification of thermal and compositional anomalies in the upper mantle. Earth Planet. Sci. Lett. 2010, 289, 606–618. [Google Scholar] [CrossRef]
  51. Brantut, N.; David, E.C. Influence of fluids on VP/VS ratio: Increase or decrease? Geophys. J. Int. 2019, 216, 2037–2043. [Google Scholar] [CrossRef] [Green Version]
  52. Hacker, B.R.; Abers, G.A. Subduction Factory 5: Unusually low Poisson’s ratios in subduction zones from elastic anisotropy of peridotite. J. Geophys. Res. Solid Earth 2012, 117, B06308. [Google Scholar] [CrossRef] [Green Version]
  53. Revenaugh, J.; Meyer, R. Seismic Evidence of Partial Melt within a Possibly Ubiquitous Low-Velocity Layer at the Base of the Mantle. Science 1997, 277, 670–673. [Google Scholar] [CrossRef]
  54. Revenaugh, J.; Sipkin, S. Seismic evidance for silicate melt atop the 410-km mantle discontinuity. Nature 1994, 369, 474–476. [Google Scholar] [CrossRef]
  55. Williams, Q.; Garnero, E.J. Seismic evidance for partial melt at the base of the Earth’s mantle. Science 1996, 273, 1528–1530. [Google Scholar] [CrossRef] [Green Version]
  56. Bezacier, L.; Reynard, B.; Cardon, H.; Montagnac, G.; Bass, J.D. High-pressure elasticity of serpentine and seismic properties of the hydrated mantle wedge. J. Geophys. Res. Solid Earth 2013, 118, 527–535. [Google Scholar] [CrossRef]
  57. Wagner, L.S.; Beck, S.; Zandt, G.; Ducea, M.N. Depleted lithosphere, cold, trapped asthenosphere, and frozen melt puddles above the flat slab in central Chile and Argentina. Earth Planet. Sci. Lett. 2006, 245, 289–301. [Google Scholar] [CrossRef]
  58. Wagner, L.S.; Beck, S.; Zandt, G. Upper mantle structure in the south central Chilean subduction zone (30° to 36° S). J. Geophys. Res. Solid Earth 2005, 110, 1–20. [Google Scholar] [CrossRef] [Green Version]
  59. Brasse, H.; Eydam, D. Electrical conductivity beneath the Bolivian Orocline and its relation to subduction processes at the South American continental margin. J. Geophys. Res. Solid Earth 2008, 113, 1–14. [Google Scholar] [CrossRef]
  60. Brasse, H.; Lezaeta, P.; Rath, V.; Schwalenberg, K.; Soyer, W.; Haak, V. The Bolivian Altiplano conductivity anomaly. J. Geophys. Res. Earth 2002, 107, EPM-4. [Google Scholar] [CrossRef]
  61. Manthilake, G.; Bolfan-Casanova, N.; Novella, D.; Mookherjee, M.; Andrault, D. Dehydration of chlorite explains anomalously high electrical conductivity in the mantle wedges. Sci. Adv. 2016, 2, e1501631. [Google Scholar] [CrossRef] [PubMed] [Green Version]
Figure 1. (a) Schematic assembly configuration of the multi-anvil cell assembly (before compression) used for the sound wave velocity measurements. (b) The stacked radiography images of the sample with increasing temperature at 3.8 GPa. The red dashed lines show the thickness of the sample. Examples of the ultrasonic signals recorded at 40 MHz for P-waves (c), and S-waves (d) recorded at 900 and 1000 K, before and after the dehydration of chlorite.
Minerals 11 00070 g001
Figure 2. (a) Primary (Vp) and secondary (Vs) wave velocities as a function of temperature at 1.8 and 3.8 GPa. (b) The% drop in velocity (δVp, δVs) upon dehydration at 1.8 and 3.8 GPa compared to chlorite before dehydration. The lines are the linear fits through data points. Uncertainties in velocity estimations are estimated to be less than 2.0% (2σ), smaller than the symbol size.
Minerals 11 00070 g002
Figure 3. Scanning electron microscope backscattered electron images showing the chlorite sample after dehydration at (a) 1.8 GPa and (b) 3.8 GPa.
Minerals 11 00070 g003
Figure 4. P-wave velocity compared with the vol.% of chlorite dehydration. The Vp vs. temperature diagram showing the P-wave velocity for chlorite and dehydration products. The black dashed line indicates the Vp of chlorite before dehydration, extrapolated to high temperatures. The purple solid line indicates the P-wave velocity of a mixture of olivine [47], garnet [48], and spinel [49], computed for 3:1:1 proportion based on the dehydration reaction 2chl = 3ol + gt + spl + 8 H2O. Blue dashed lines indicate the linear mix between the velocity of chlorite and the (3ol + gt + spl) without taking into account the velocity effect of fluid. The numbers next to dashed lines indicate the fraction chlorite dehydrated producing the (ol + gt + spl). The red and blue solid lines indicate linear fits through the Vp data points of chlorite measured at 1.8 and 3.8 GPa, respectively.
Minerals 11 00070 g004
Figure 5. The Vp/Vs ratios of chlorite and dehydrating fluid at 1.8 and 3.8 GPa. The Vp/Vs of major mantle phases, olivine, garnet, clinopyroxene (cpx), orthopyroxene (opx), are shown for comparison [47]. Diamond symbols indicate antigorite [23] at 1.8 GPa (red) and 3.8 GPa (blue) at 300 K. The blue shaded line indicates the Vp/Vs of basaltic melt [18] for increasing melt fraction. The faded blue area corresponds to the dehydrating fluid. The red and blue dashed-lines are the second-order polynomial fits through data points.
Minerals 11 00070 g005
Figure 6. The% change of amplitude of P- (a) and S- (b) waves relative to the amplitude for the chlorite before dehydration. Blue and red lines are for 1.8 and 3.8 GPa respectively. The vertical dashed line indicates the dehydration temperature observed for chlorite. (c) The change of amplitudes in the 1st, 2nd, and 3rd echos of the P-waves at 3.8 GPa. The blue and red lines in panels (a) and (b) are the cubic-spline fits through data points.
Minerals 11 00070 g006
Publisher’s Note: MDPI stays neutral with regard to jurisdictional claims in published maps and institutional affiliations.

