Article

Geochemistry of Recent Brahmaputra River Sediments: Provenance, Tectonics, Source Area Weathering and Depositional Environment

1
Centre for Advanced Materials and Industrial Chemistry (CAMIC), School of Applied Sciences, RMIT University, Melbourne, VIC 3001, Australia
2
Institute of Mining, Mineralogy and Metallurgy (IMMM), Bangladesh Council of Scientific and Industrial Research (BCSIR), Science Laboratory Road, Khonjonpur, Joypurhat 5900, Bangladesh
3
CSIRO Mineral Resources, Clayton South, VIC 3169, Australia
4
Institute of Nuclear Minerals, Bangladesh Atomic Energy Commission, Savar, Dhaka 1207, Bangladesh
*
Author to whom correspondence should be addressed.
Minerals 2020, 10(9), 813; https://doi.org/10.3390/min10090813
Submission received: 22 July 2020 / Revised: 11 September 2020 / Accepted: 11 September 2020 / Published: 15 September 2020
(This article belongs to the Section Mineral Geochemistry and Geochronology)

Abstract

:
Sediments from stable sand bars along a 40 km section of the Brahmaputra River in northern Bangladesh were analyzed for their major, trace and rare earth element contents to determine their provenance, compositional maturity, source area weathering and tectonic setting. Geochemically, the sediments were classified as litharenites and the Index of Compositional Variability (ICV) varied between 1.4 and 2.0, indicating low compositional and mineralogical maturity. A high mean SiO2 concentration (72.9 wt.%) and low Al2O3 (11.1 wt.%) were consistent with a low abundance of shale and clay components. The depletion of the oxide components Na2O, CaO and K2O relative to average upper crustal compositions (UCC) reflected loss of feldspar during chemical weathering in the source region. Average TiO2 values for most samples were higher than average crustal levels, consistent with the northern section of the Brahmaputra River being a potential resource for valuable Fe-Ti oxide heavy minerals. Major and trace element ratios indicated the sediments represented erosional products from typical felsic upper continental crustal materials with contamination (30%–40%) from more intermediate/mafic compositions. The rare earth element patterns showed negative Eu anomalies (0.57–0.71), indicating they were derived mainly from fractionated felsic rocks. Resemblance of the sediment compositions to mean compositions from Higher Himalaya crystalline rocks pointed to these being potential source rocks but with components from a mafic source also present. Major element chemistries and low to intermediate weathering indices for all sediments indicated a lack of substantial chemical weathering. Evidence from tectonic discrimination diagrams suggested the Brahmaputra River sediments were derived from rock types that formed in a transitional tectonic setting ranging from an ancient passive margin to an active continental margin. Deposition occurred under cool to semi-arid climatic conditions in an oxic environment.

1. Introduction

Provenance studies of terrigenous clastic sediments are conducted to disclose the composition and the geological evolution of the sediment source areas and to limit the tectonic setting of the depositional basin (e.g., Morton et al. [1] and references therein). Such studies interface several geological disciplines (mineralogy, geochemistry, geochronology, sedimentology, igneous and metamorphic petrology) and typically include a determination of the location and nature of the sediment source areas, the pathways by which sediment is transferred from the source to the depositional basin, and the factors that influence the composition of the sedimentary rocks (e.g., climate, relief, tectonic setting).
The provenance of terrigenous sediments can be reconstructed based on their geochemical and mineralogical signatures, as these are the products of the multiple complex processes such as diagenesis, weathering, transportation and their interactions. The bulk compositions of the sediments therefore record the traces of these processes from source-to-sink and after deposition. For example, the distribution of some major and trace elements such as Al, Fe, Ti, Sc, Th, Zr, Cr, Ni, Co and rare earth elements (REEs) are particularly suited for the discrimination of provenance and tectonic settings. These elements typically have low mobility during sedimentary processes and have short residence times in seawater [2]. Thus, analysis of the sediment geochemistry enables decoding of the geological evolution of a sedimentary unit or basin province from its source region and also reveals information regarding the nature of weathering at the source, both of which are controlled by climatic and tectonic factors.
Generally, lithified sediments provide decisive information for provenance studies and for reconstructing the tectonic, climate and geographic setting of sedimentary basins [3]. In comparison, clastic sediments provide available information for source rock characteristics, with relief and climate, transport and depositional mechanisms. The geochemistry of clastic sediments therefore is the product of interacting factors including provenance, sorting, weathering and tectonism. In this context, a number of geochemical studies based on clastic sediments derived from regions of the Himalaya have been carried out and have provided valuable information on the depositional history of sedimentary basins within the region (e.g., Dalai et al. [4]; Najman [5]; Hossain et al. [6]; Bhuiyan et al. [7]; Roy and Roser [8]; Hossain [9]).
Moreover, numerous geochemical and mineralogical studies have been conducted on the major river systems of south Asia (e.g., Indus, Meghna, Ganges and Brahmaputra rivers) to determine their continental supplies [10,11,12,13,14]. The current study focuses on northern Brahmaputra river sediments using a new set of geochemical data to decipher information regarding provenance, tectonic setting, weathering and depositional environment with respect to Himalayan source region tectonics. The Brahmaputra River has recently been recognized as a source of heavy mineral (HM) sand concentrates [15,16] and a detailed analysis of the composition and sources for the HMs will provide key information regarding the future feasibility of northern Bangladesh river systems for the recovery of potentially valuable HM resources.

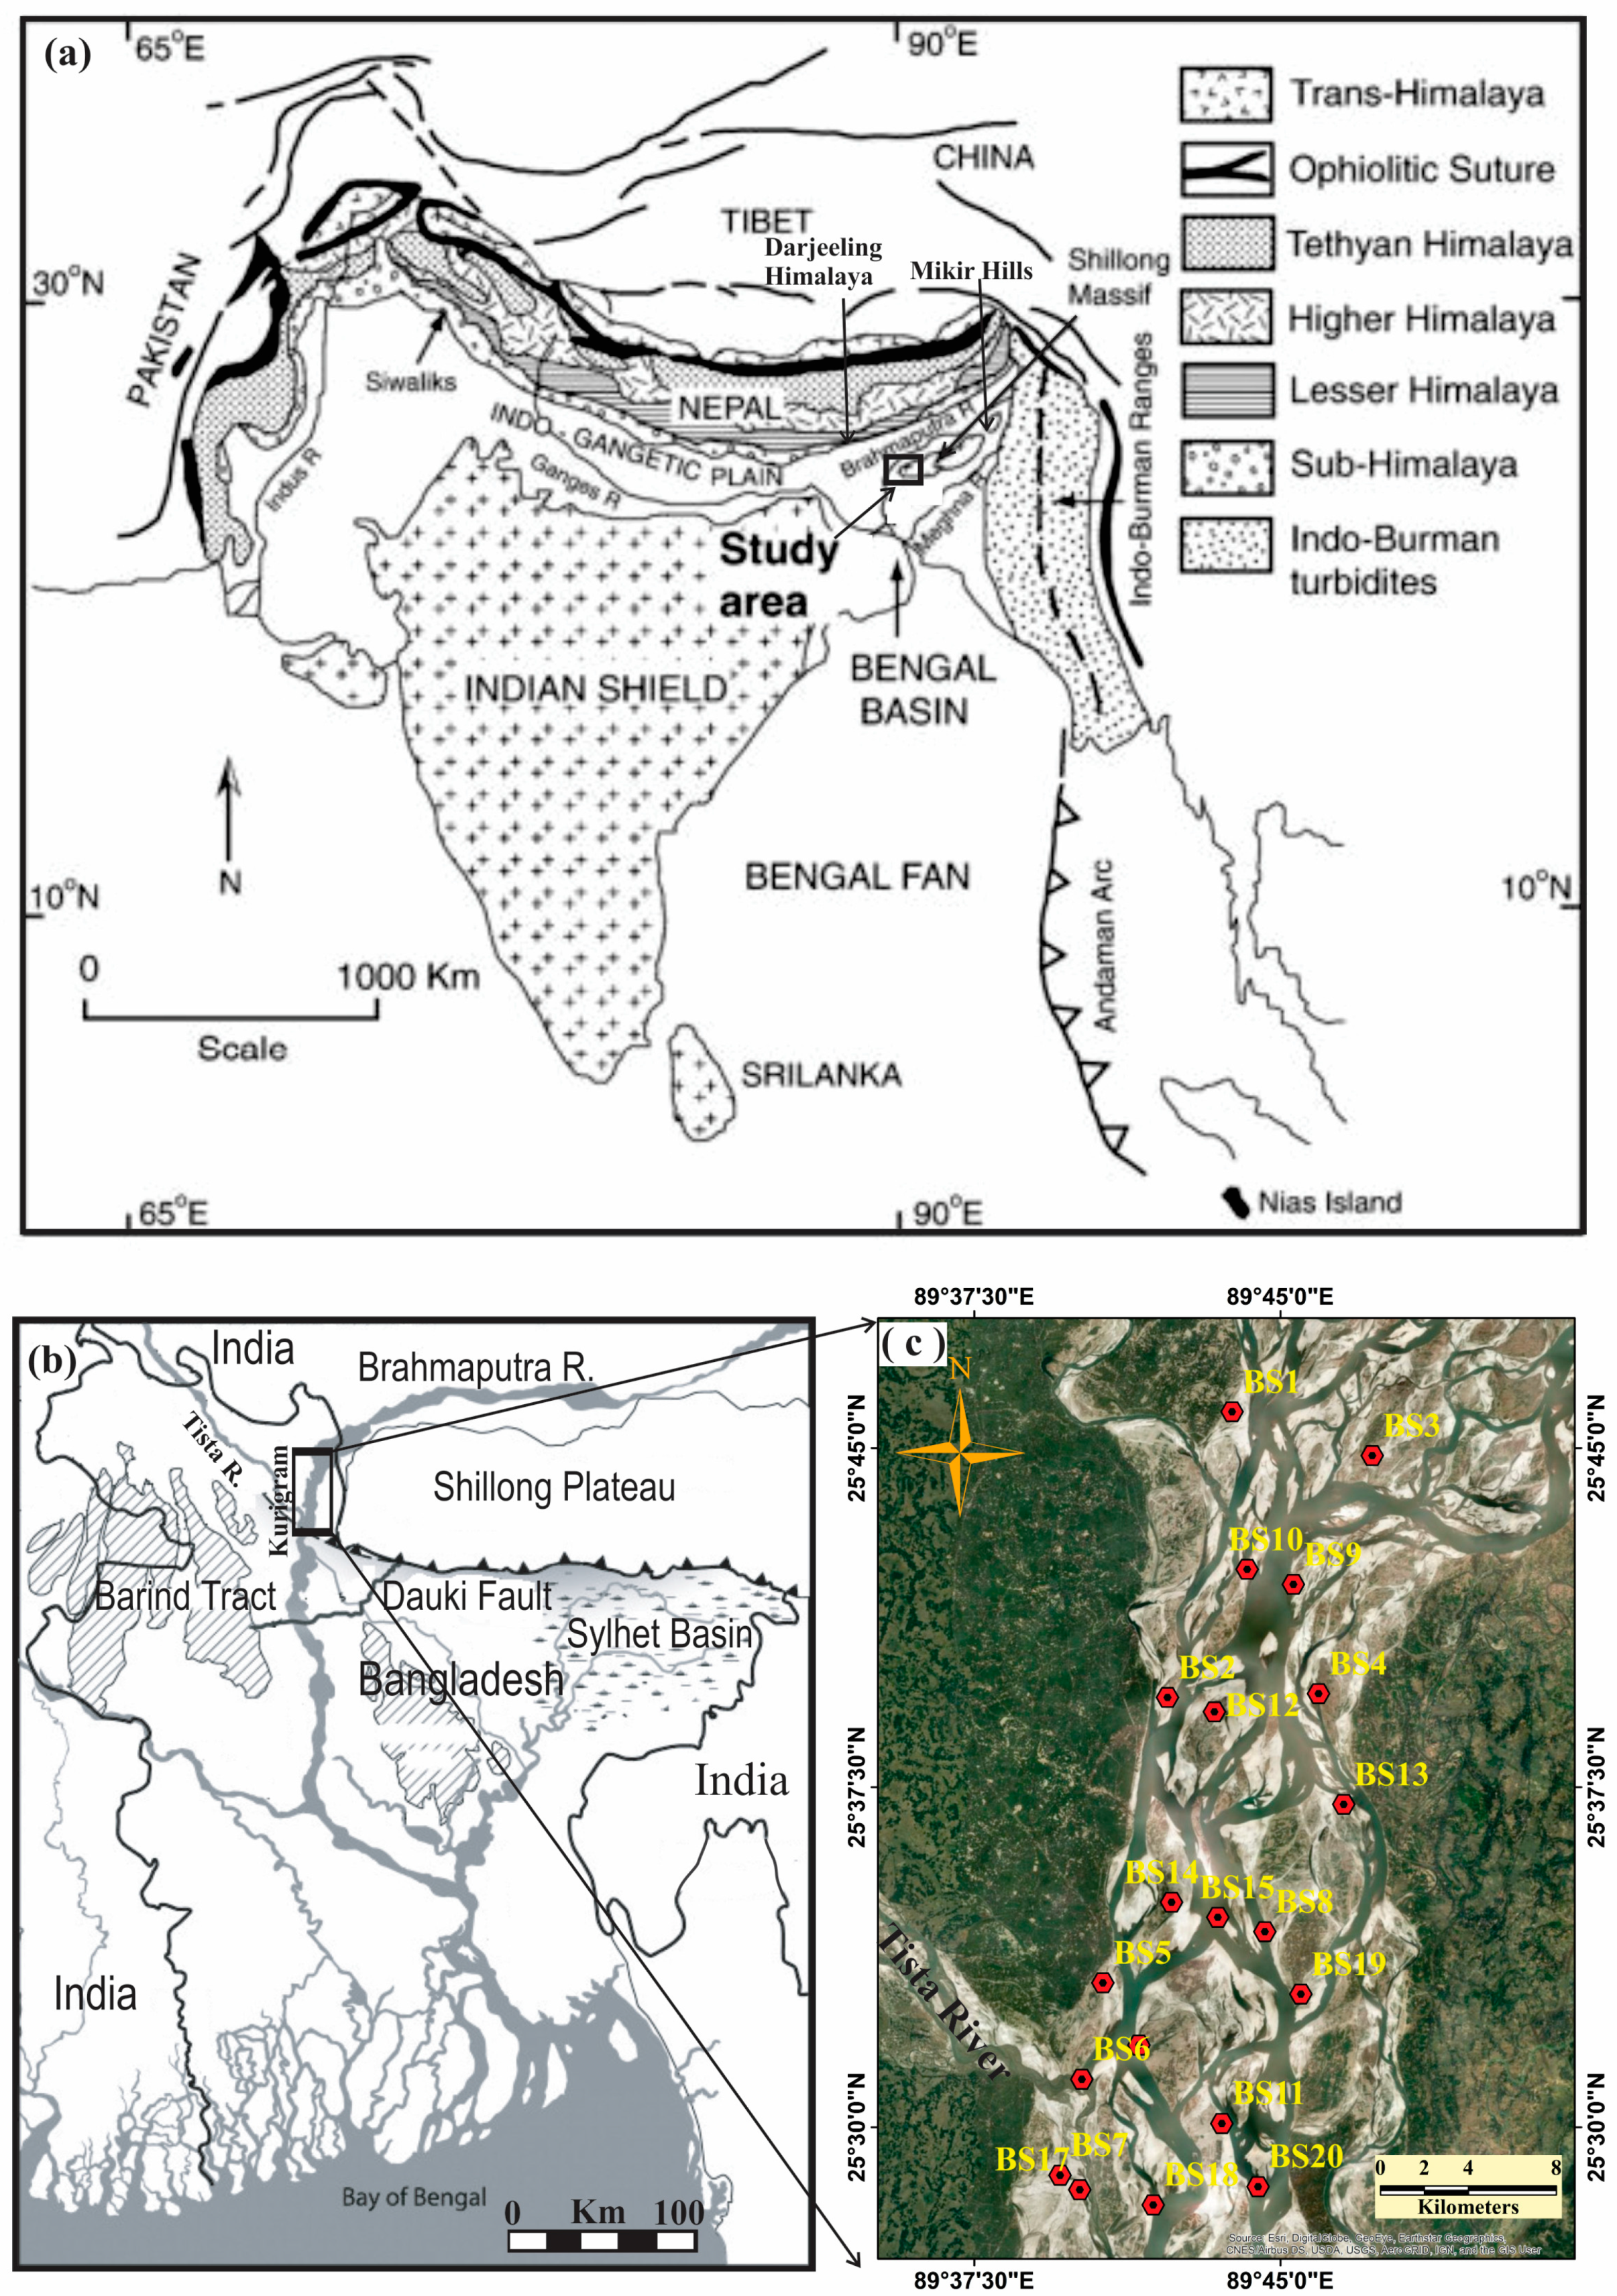
2. Geological Setting

The Bengal Basin is located in the eastern part of the Indian subcontinent and is recognized as Earth’s largest fluvio-deltaic to shallow marine sedimentary basin (Figure 1). The onshore section of the basin, coupled with the offshore Bengal Fan under the Bay of Bengal, forms the world’s biggest sediment dispersal system. The Bengal Basin itself is a peripheral Himalayan foreland basin formed by the continent-continent collision of the Indian and Eurasian plates. Mukherjee et al. [17] examined the geological framework, evolutionary history and regional stratigraphic context of the basin and concluded that the evolution started with the breakup of Gondwanaland at about 126 Ma in the Cretaceous. Subsequent basin formation was influenced by interaction between the Eurasian, Indian and Myanmar plates which formed the Indo-Burman Ranges and the extensive Himalaya-Tibetan Orogen. These plate collisions also played a pivotal role in exhumation and transport of sediments to the Bengal foreland basin (Figure 1a).
The onshore portion of the Bengal Basin is drained by three major rivers: the Brahmaputra, the Ganga and the Meghna (emerging from the point of confluence of the Ganga and Brahmaputra Rivers). The Brahmaputra River is the second largest river in Bangladesh originating in Tibet before moving through the north-eastern part of India and then entering Bangladesh through the Kurigram District. To the north and northeast, the Brahmaputra River basin is surrounded by the Himalayan Foredeep and in the east it is surrounded by the Shillong Massif and Mikir Hills (Figure 1a). The Brahmaputra River merges with the east flowing Tista River close to the northern border with India, after which it broadens into a large, sand-bedded braided river system of ~15–20 km total width and with individual channels up to 2–3 km wide. Within Bangladesh, the Brahmaputra is known as the Jamuna River, which is the main distributary channel flowing south, eventually joining the Padma River, the main distributary of the Ganges River.
The sedimentology, sediment discharge, sediment bed load distribution and geomorphology of the Brahmaputra-Jamuna River system has been discussed in several previous studies [21,22,23]. Research by Jasy et al. [24] focused on the northern part of the system where it was determined that the sediments were largely quartz- and feldspar-rich (>80–85 wt.%). They noted a significant heavy mineral component (10%–15%) which was dominated by amphibole (45.8 wt.%) and epidote (31.1 wt.%), with lesser garnet (10.1 wt.%), and minor to trace apatite, tourmaline, staurolite, sillimanite, kyanite, ilmenite, zircon, rutile, and magnetite. The source of the sediments supplied to the catchment area comprised mostly felsic to ultramafic magmatic, and medium- to high-grade metamorphic rock types. According to Chowdhury [25], the origin of the sand deposits is thought to be mainly from the Shillong Plateau and the Darjeeling Himalayas (Figure 1a,b).

3. Sampling and Analytical Procedures

3.1. Samples

The Brahmaputra River is a braided river system with numerous ephemeral and/or stable sand bars. The stable sand bars can be large in areal extent and often exceed 1–2 km in length (Figure 1c). The samples examined in the current study were sourced from sand bars in the northern part of Bangladesh, in the Kurigram district. Sample sites were located a few kilometers north of where the Brahmaputra River merges with the easterly flowing Tista River (Figure 1b,c). The Tista River flows from India and samples a different source region than the Brahmaputra River. The sourcing of samples for the current study from a region north of the Tista-Brahmaputra confluence avoided contamination from a dissimilar sediment source.
Twenty sediment samples, each weighing 1–2 kg, were collected from a trench cut at each site to a depth of approximately 1 m. Average grain size data for the samples was obtained by machine sieving samples into six size fractions (+500 μm, −500 to +250 μm, −250 to +125 μm, −125 to +63 μm, −63 to +45 μm and −45 μm). Results were previously reported in Rahman et al. (2016). The most frequent grain size was within the −250 to +125 μm fraction with >75% of particles falling in this range, indicating the sediments were well sorted.
The sand samples were free-flowing, unconsolidated sand-sized particles with overall low clay contents (see also Garzanti et al. [26]; Rahman et al. [16]). A range in color was noted, extending from beige colored sands with low amounts of mafic components (e.g., lithic fragments and/or heavy minerals such as amphiboles, pyroxenes garnets and ilmenite) to darker colored sands that comprised larger amounts of mafic mineral components. Further petrographic information regarding the samples can be found in Rahman et al. [15,16] where it was determined that up to 30%–40% of the sands comprised mafic minerals such as amphibole, epidote, pyroxene, ilmenite, garnet, olivine and biotite.
During field observations, it was determined that the samples contained a low carbonate content. This was done by applying HCl and observing gas/bubble formation. The low carbonate content was consistent with previous investigations of Brahmaputra River sediments which indicate low carbonate contents [7]. The uppermost surface layers were discarded to avoid any anthropogenic interferences and also any obvious cut-bank exposures that formed when the river originally flowed through the trench base line. The twenty samples covered a stretch of the river extending approximately 40 km (Figure 1c).

3.2. Analytical Procedures

Organic material present in the samples was removed by washing several times with 1N HCl followed by rinsing with distilled water. The washed samples were air-dried at room temperature, sieved to remove gravels and particles over 2 mm in size and then ~100 g of material was separated from each sample using a rotary splitter. Each sample was ground to −200 mesh size (<75 μm) using an agate mortar and pestle.
Loss on ignition (LOI) was measured by net weight loss after heating in a muffle furnace at 950 °C for more than 3 h (with at least 2 h at 1020 °C). Major, minor and trace element abundances were measured using glass fusion beads made with an alkali flux of 80% lithium tetraborate and 20% lithium metaborate. A flux to sample ratio of 2:1 was used. X-Ray Fluorescence (XRF) spectroscopic measurements were made using a Rigaku ZSX Primus (Akishima-shi, Tokyo, Japan) XRF instrument furnished with an end window 4 KW RH-Anode X-ray tube operated at 40 kV and 60 mA for heavy elements and 30 kV and 100 mA for light elements. Standards used in the analyses included Geological Survey of Japan (GSJ) Stream Sediment Standards and the United States Geological Survey (USGS) Rock Standards. Analytical uncertainties were ~2% for major and minor elements. The rare earth element (REE) and ultra-trace element (Th, U and Hf) concentrations were measured using Inductively Coupled Mass Spectrometry (ICP-MS) (Bruker Aurora M90, Bremen, Germany) following methods outlined by Kimura et al. [27]. For the REEs, Th, U and Hf, the analytical precision and accuracy was better than 5% [28,29]. The accuracy of the data was verified by analysis of Geological Survey of Japan (GSJ) standard geochemical reference samples.

4. Results and Discussion

4.1. Geochemistry

Major oxide, trace element and rare earth element data for the twenty sediment samples are given in Table 1, Table 2 and Table 3, respectively. Element and oxide ratios relevant to geochemical classification and tectonic setting as well as calculated indices for determining sediment maturity/weathering are included in Table 1 and Table 2, while key REE ratios for provenance analysis are supplied in Table 3. Measured LOI values were relatively uniform across all samples, varying between 0.9 and 1.4 wt.% and all major oxide data in Table 1 were normalized to 100% LOI free. The same normalization factors were also applied to the trace element data (Table 2) to retain proportions with the major elements/oxides.

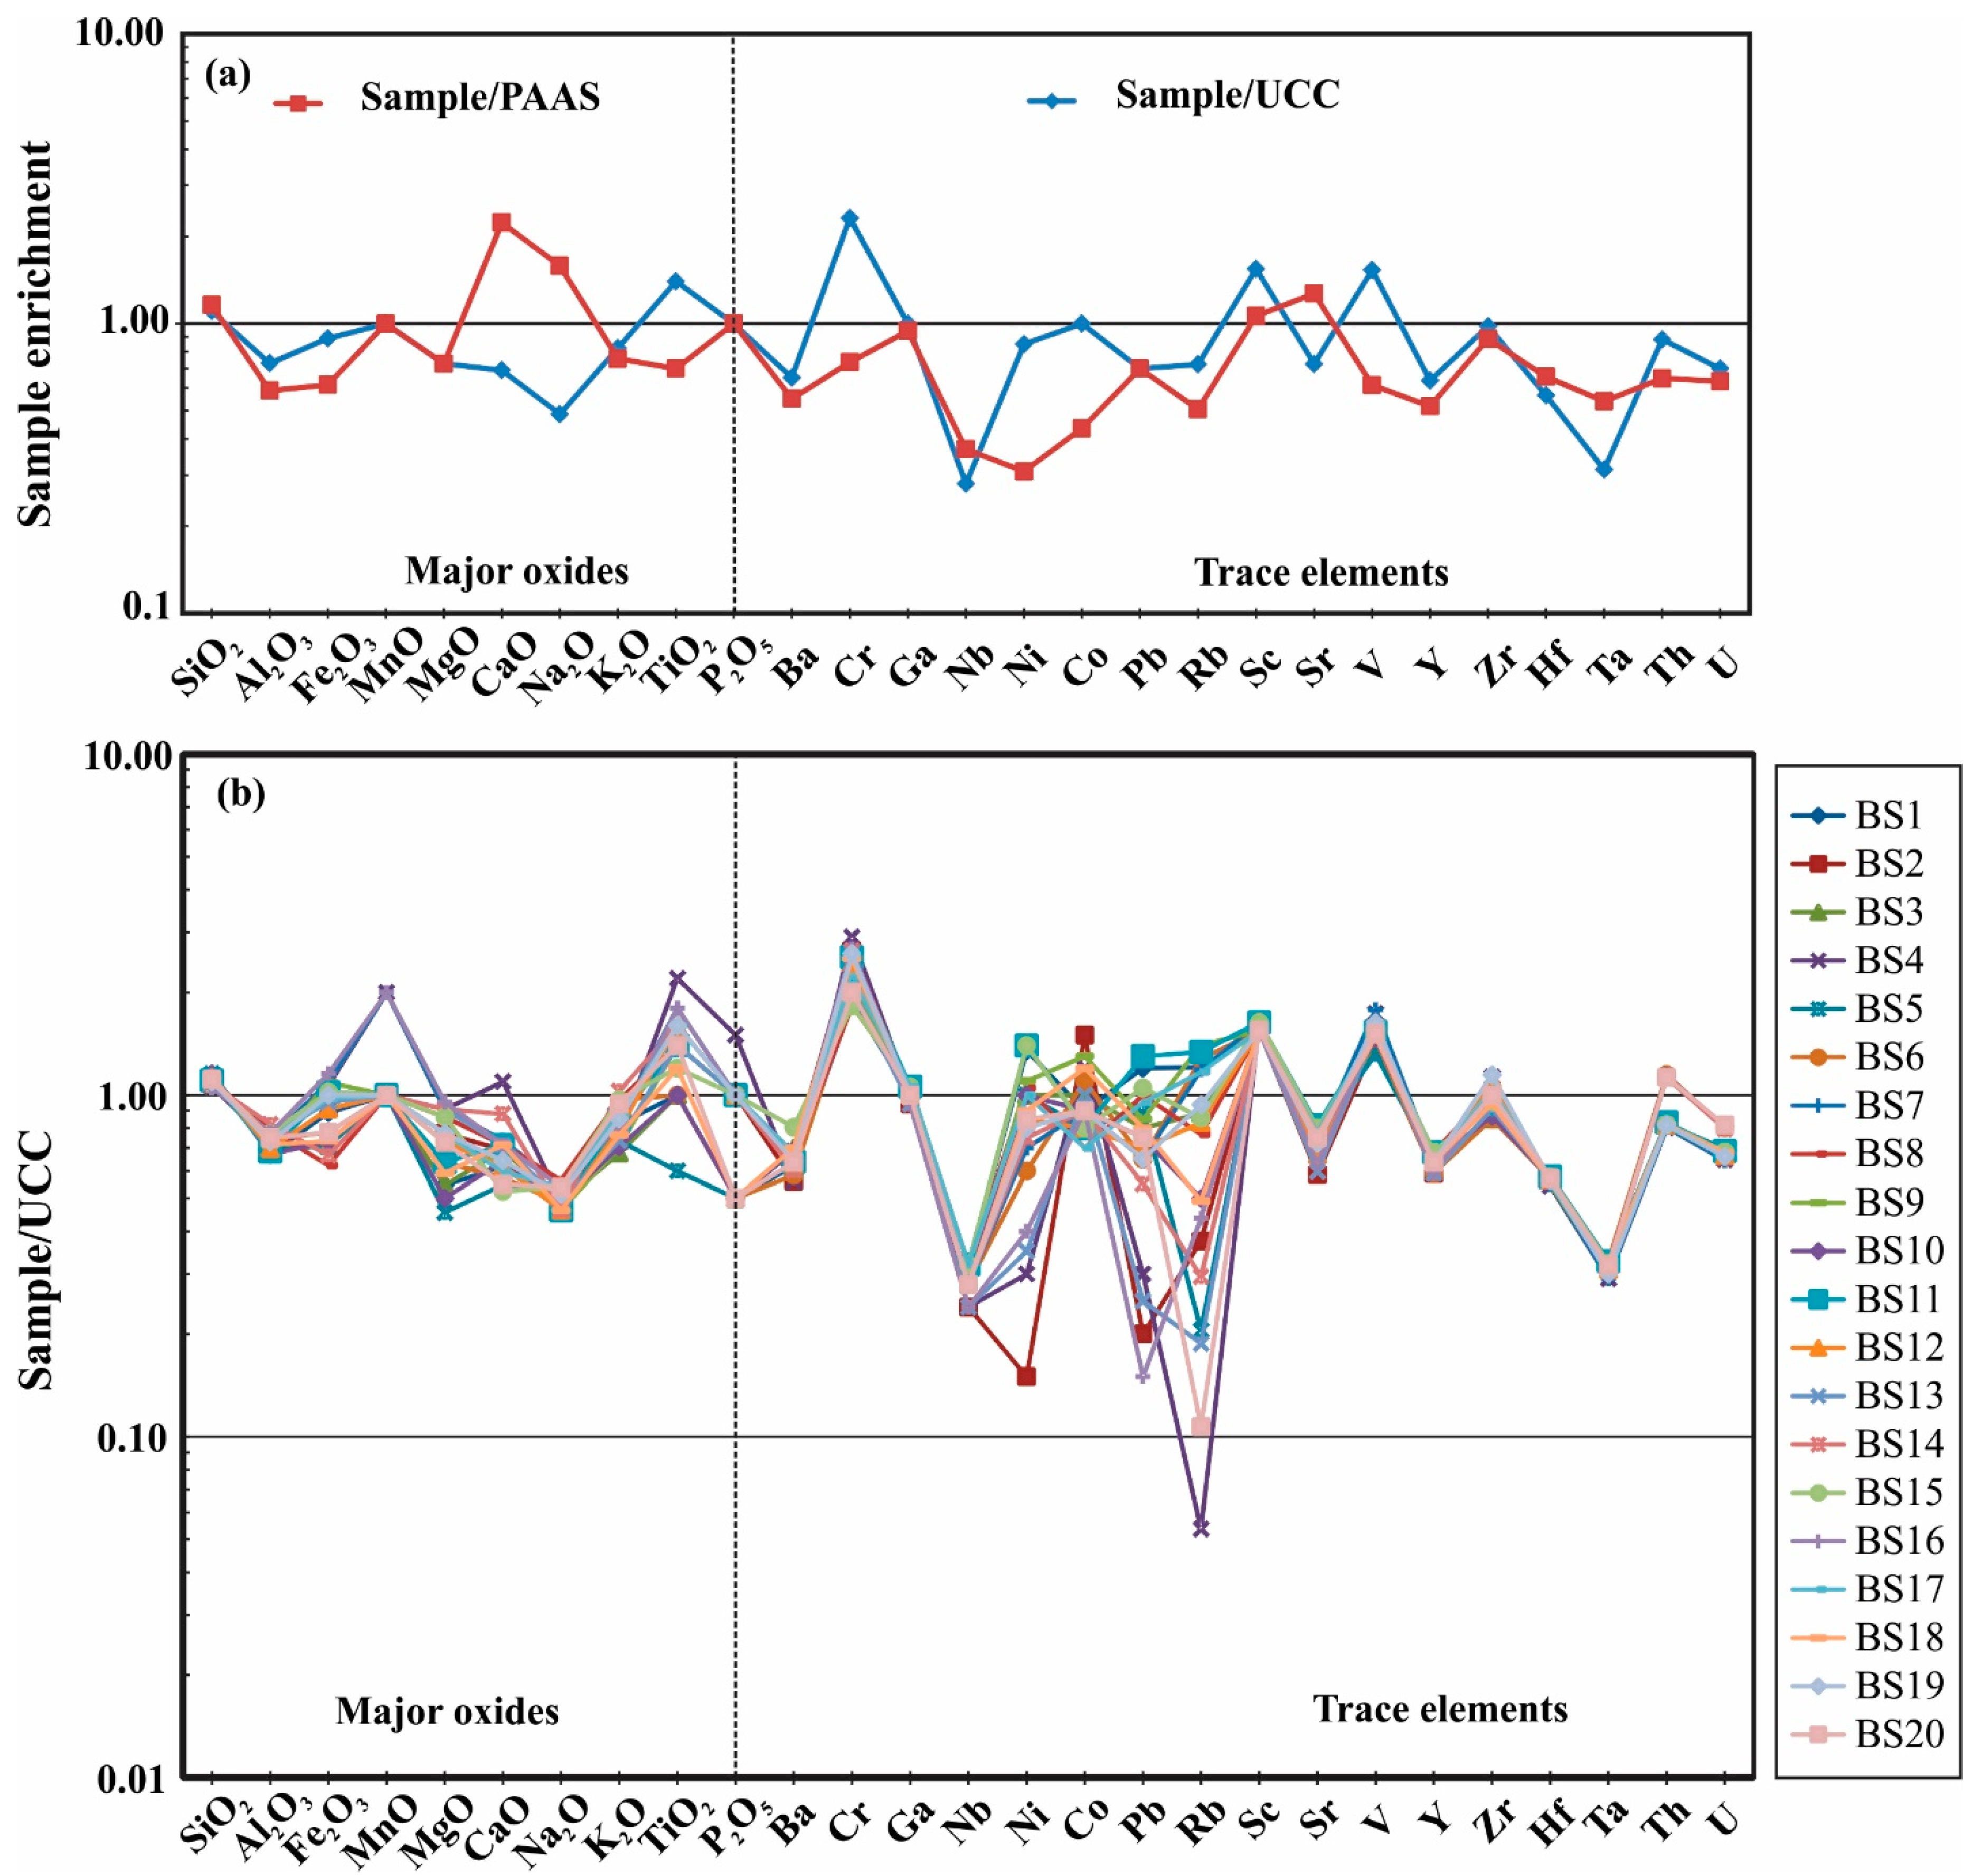
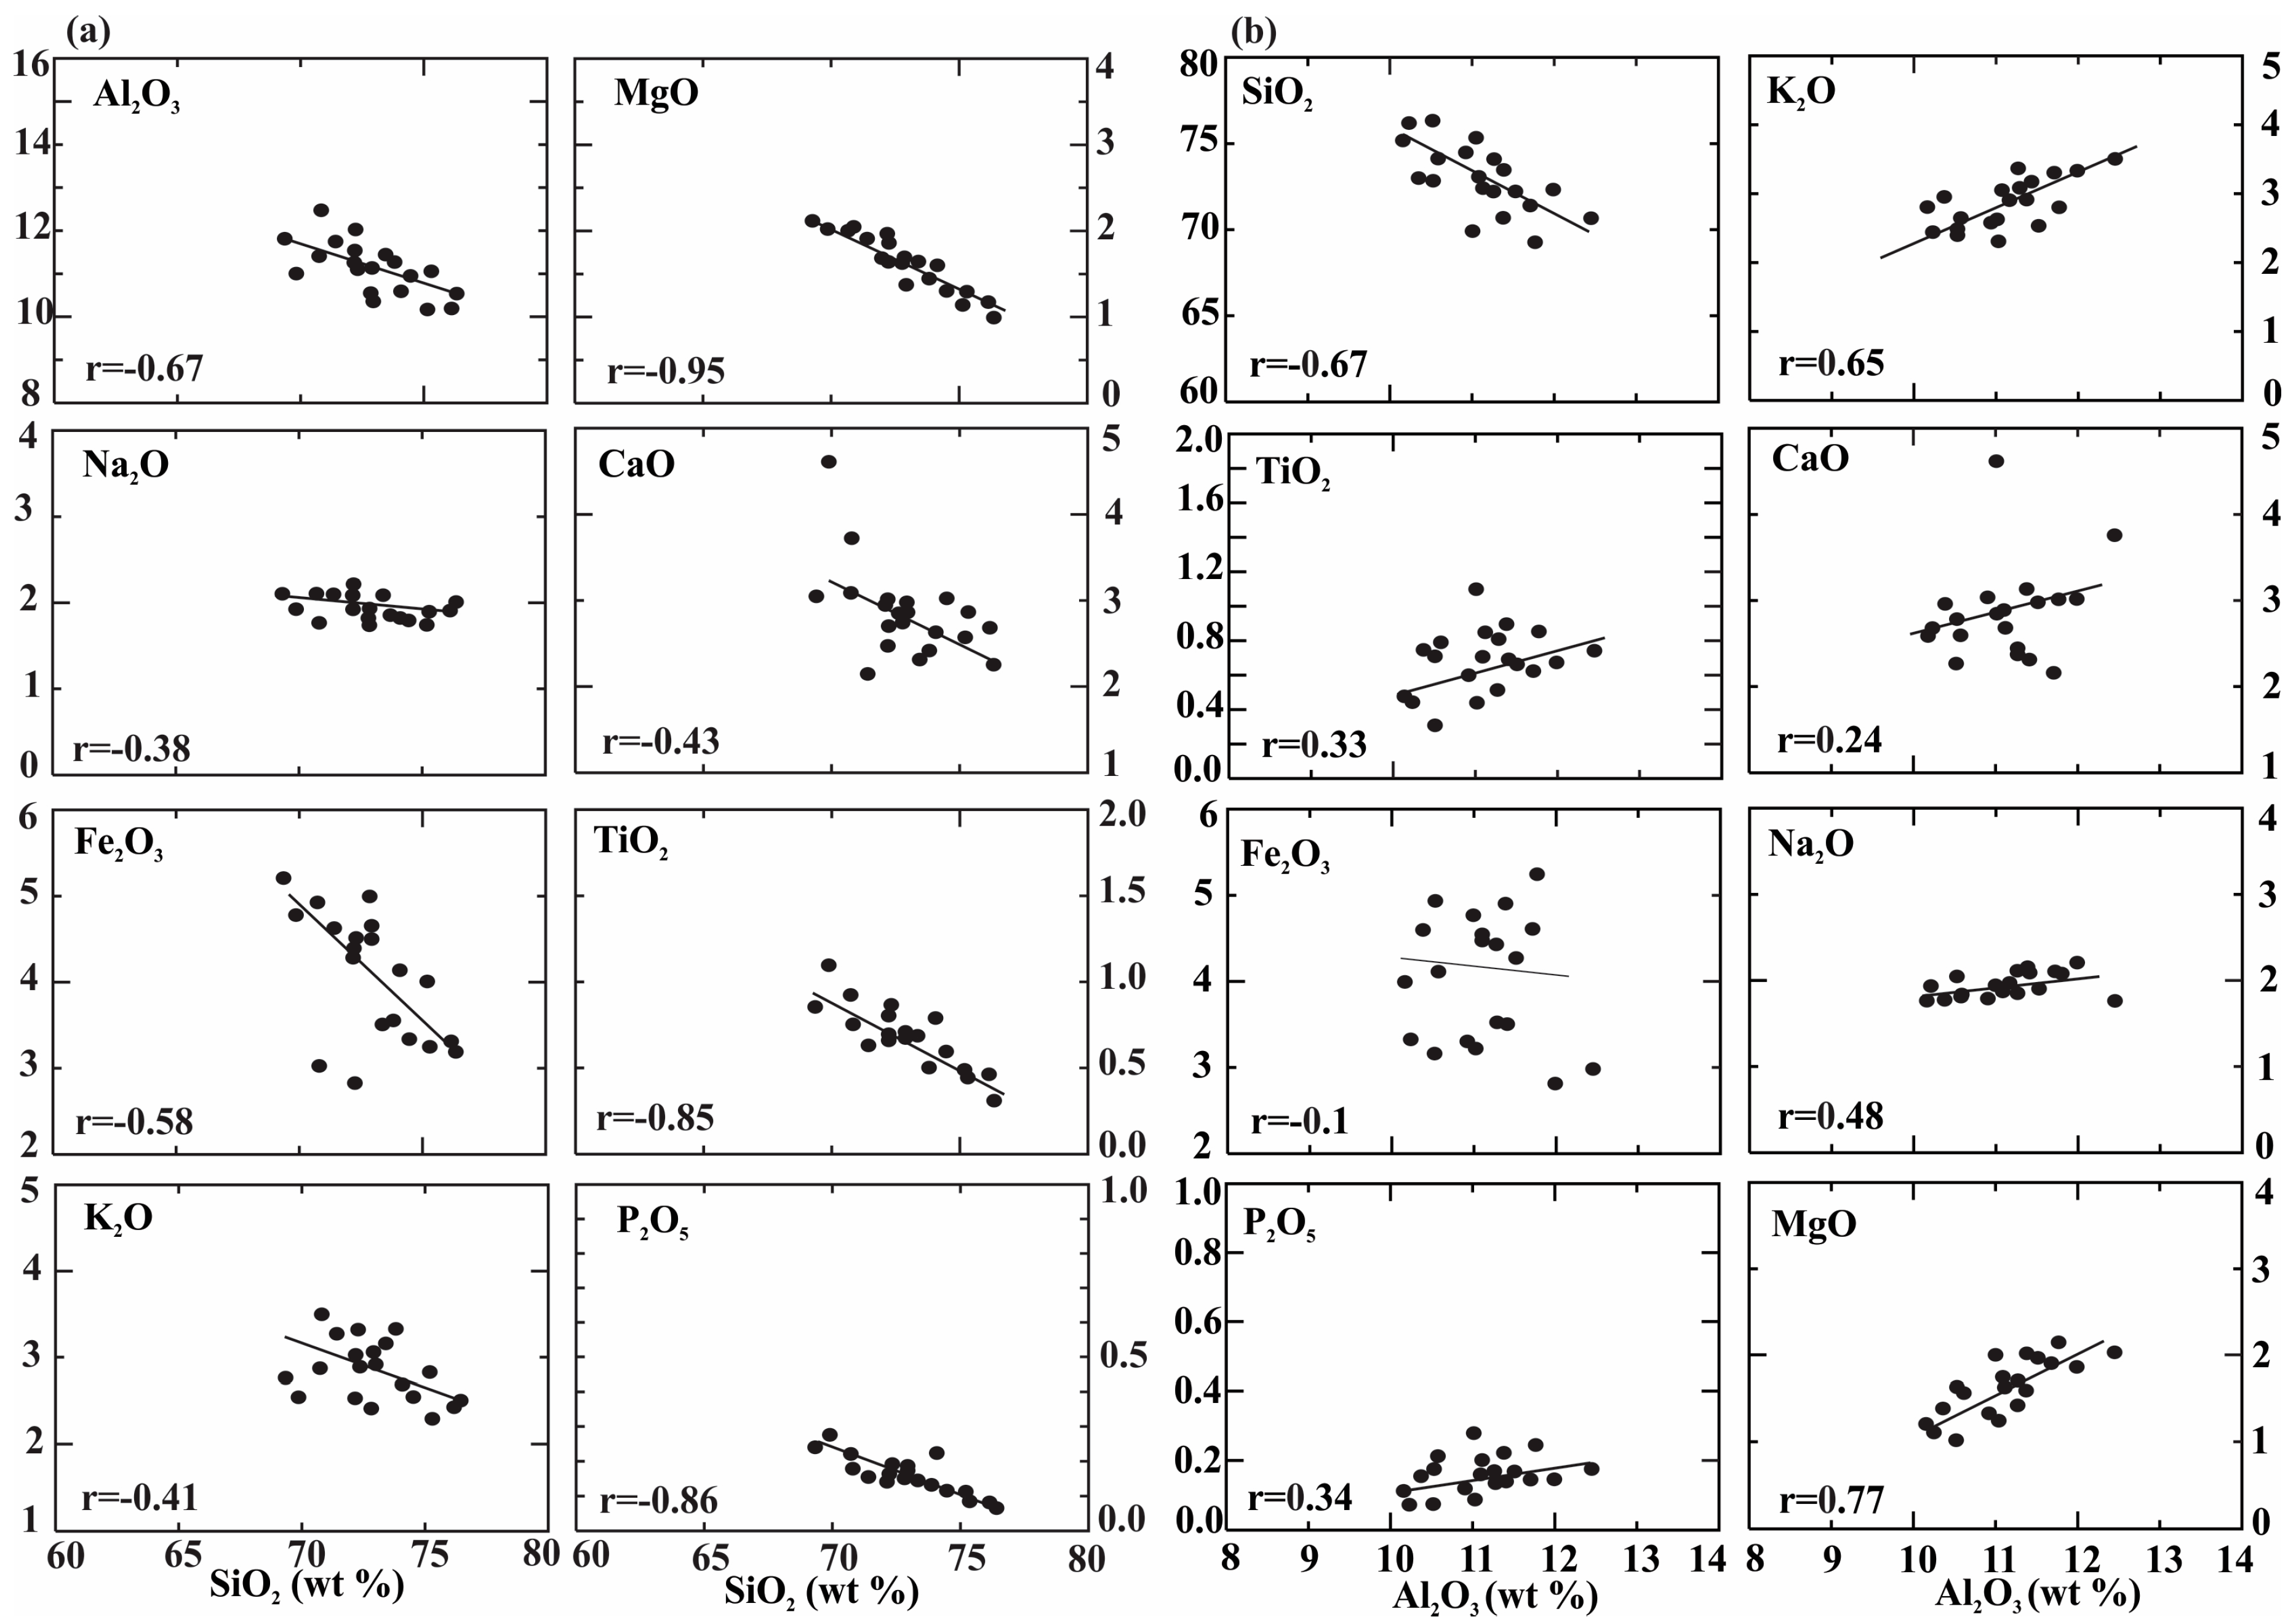
4.1.1. Major Elements

Major element abundances (as oxides) of the individual Brahmaputra River sediments as well as the average composition across all twenty samples are compared in Table 1, with the average concentrations of major elements in the Upper Continental Crust (UCC) [30,31]) and Post-Archean Australian Shale (PAAS) [32].
The sediments showed a relatively narrow range in SiO2 content (69.4–76.3 wt.%; average 72.9 wt.%) and uniform Al2O3 contents (10.2–12.5 wt.%; average 11.1 wt.%). The Fe2O3 contents in the samples ranged between (2.8–5.2 wt.%; average 4.0 wt.%) and the abundances of TiO2 varied considerably (0.3–1.1 wt.%). Levels of MgO, Na2O, K2O and CaO were mostly similar in their abundances, ranging from 0.1–2.1 wt.% (average 1.6 wt.%), 1.8–2.2 wt.% (average 1.9 wt.%), 2.3–3.5 wt.% (average 2.8 wt.%), and 2.2–4.6 wt.% (average 2.9 wt.%), respectively. The variation in P2O5 and MnO contents were very low, ranging from 0.1–0.3 wt.% (average 0.2 wt.%) for P2O5 and 0.1–0.2 wt.% (average 0.1 wt.%) for MnO.
Figure 2a shows a plot comparing the average composition of the Brahmaputra samples normalized against average UCC and PAAS values, while Figure 2b shows detailed results for individual samples normalized against UCC (data for PAAS not shown). For the major oxides, the SiO2 content for all individual Brahmaputra samples, as well as the average across all twenty samples, was higher than the values for both UCC and PAAS. In comparison, the Al2O3 content was significantly lower. The higher mean concentration of SiO2 in the river sediments indicated the presence of quartz-rich sands, while the low Al2O3 reflected a low abundance of shale and/or clay components. Most other minor element oxides (FeO, MnO, MgO, K2O) were depleted relative to the UCC and PAAS values, except for CaO and Na2O which were, on average, higher than the PAAS values. The depletion of major feldspar components such as Na2O, CaO and K2O relative to UCC suggested possible loss of feldspars during chemical weathering at the source. This was also reflected by the average SiO2/Al2O3 ratio (6.6) of the sediments which was greater than the UCC (4.3) and PAAS (3.3) ratios. The average TiO2 value was higher than the UCC average for most samples examined (Figure 2b), consistent with previous studies which indicated the northern section of the Brahmaputra River is a potential resource for Fe-Ti oxides [15,16].
In Figure 3, selected major oxides are plotted against SiO2 (Figure 3a) and Al2O3 (Figure 3b) on bivariate discrimination diagrams. Correlation data for the major oxides are provided in Table 4. All major oxides decreased as silica increased, and the negative linear relationships of SiO2 with Al2O3 indicated that the major element composition of the river sediments was largely controlled by the relative amount of quartz. Similarly, the negative correlation between silica and Fe2O3, MgO, TiO2 and P2O5 (Figure 3a) indicated that the abundance of heavy minerals such as garnet, amphibole and apatite were also affected by the relative amounts of quartz.
Plots against Al2O3 abundances (Figure 3b) make it possible to compare if the samples come from significantly different source rocks, as Al2O3 is likely to be immobile during weathering and diagenesis. The behavior of most of the major oxides (e.g., K2O, Na2O, MgO, and MnO) showed linear positive trends with increasing Al2O3, suggesting major influences of hydraulic fractionation [8]. In comparison, CaO, Fe2O3, P2O5 and TiO2 showed only moderate to negligible positive trends. The strongest correlations with Al2O3 were for MgO and K2O, suggesting the bulk of the Al2O3 was associated with heavy minerals such as amphiboles and garnets and clay minerals, K-rich feldspar and mica. The presence of heavy minerals was also confirmed by strong positive correlations between (Fe2O3-, MgO-, MnO-) and TiO2 (ilmenite), CaO and TiO2 (sphene), (CaO-, MgO-, MnO-, Fe2O3-) and (-Al2O3, -SiO2) in garnets and other ferromagnesian aluminosilicates (Table 4).
According to the compositional maturity diagram of [33] and the chemical compositional diagram of Pettijohn et al. [34], the Brahmaputra River sediments are classified as litharenites, trending toward wackes (Figure 4). Lithic arenites typically contain less than 90% quartz grains and more unstable rock fragments than feldspars [35]. This is consistent with previous compositional and mineralogical results reported by Rahman et al. [16] who determined the Brahmaputra sediments contained a significant amount of quartz (60%–65%), along with feldspar (5%–8%) and rock fragments and/or mafic minerals (30%–40%). Similar geochemical studies of clastic sediments from the Meghna [9] and Brahmaputra [7] rivers also indicated the sediments were primarily lithic arenites with SiO2 contents ranging from 58–80 wt.% SiO2 and with quartz contents of around 65%. The classifications arising from the major element ratio plots emphasizes the relative chemical and mineralogical immaturity of the Brahmaputra sediments, with none being classified as mature quartz arenite by either scheme.

4.1.2. Trace Elements

Trace element concentrations of the Brahmaputra River sediments are provided in Table 2, where the data are also compared with the average concentrations of trace elements in UCC and PAAS. Selected element ratios are also included in Table 2, and correlation data for the trace elements are provided in Table 4. Figure 2a shows a plot comparing the average trace element compositions of the Brahmaputra samples, normalized against average UCC and PAAS values, while Figure 2b shows detailed results for individual samples normalized against UCC (data for PAAS not shown).
In general, variability in the trace elements analyses was low except for Rb (6–157 ppm), Pb (4–26 ppm) and Ni (3–28 ppm), where considerable variation was noted within individual samples (Figure 2b). Most elements were depleted relative to UCC and PAAS, reflecting the dilution by quartz with exceptions being V (92 ppm), Sc (17 ppm) and Cr (81 ppm) which were enriched relative to UCC, and both Sc and Sr (254 ppm) were enriched relative to PAAS. Average concentrations of the large ion lithophile elements (LILE) and high field strength elements (HFSE) such as Rb (81.25 ppm), Ba (357.85 ppm), Sr (254.15 ppm), Zr (185.90 ppm), Hf (3.28 ppm), Nb (7.05 ppm), Th (9.44 ppm), and U (1.96 ppm) of the sediments were either similar to, or lower than, average PAAS compositions. Strontium contents (205–286 ppm) were also variable. This was likely due to the possibility of Sr levels being affected in low temperature depositional environments [36]. For example, Sr fractionation can result from the weathering of feldspars, particularly plagioclase [37]. Because the Brahmaputra River samples contain easily leached plagioclase feldspar [24], the depletion of Sr in the analyzed sediment samples was therefore likely due to weathering.

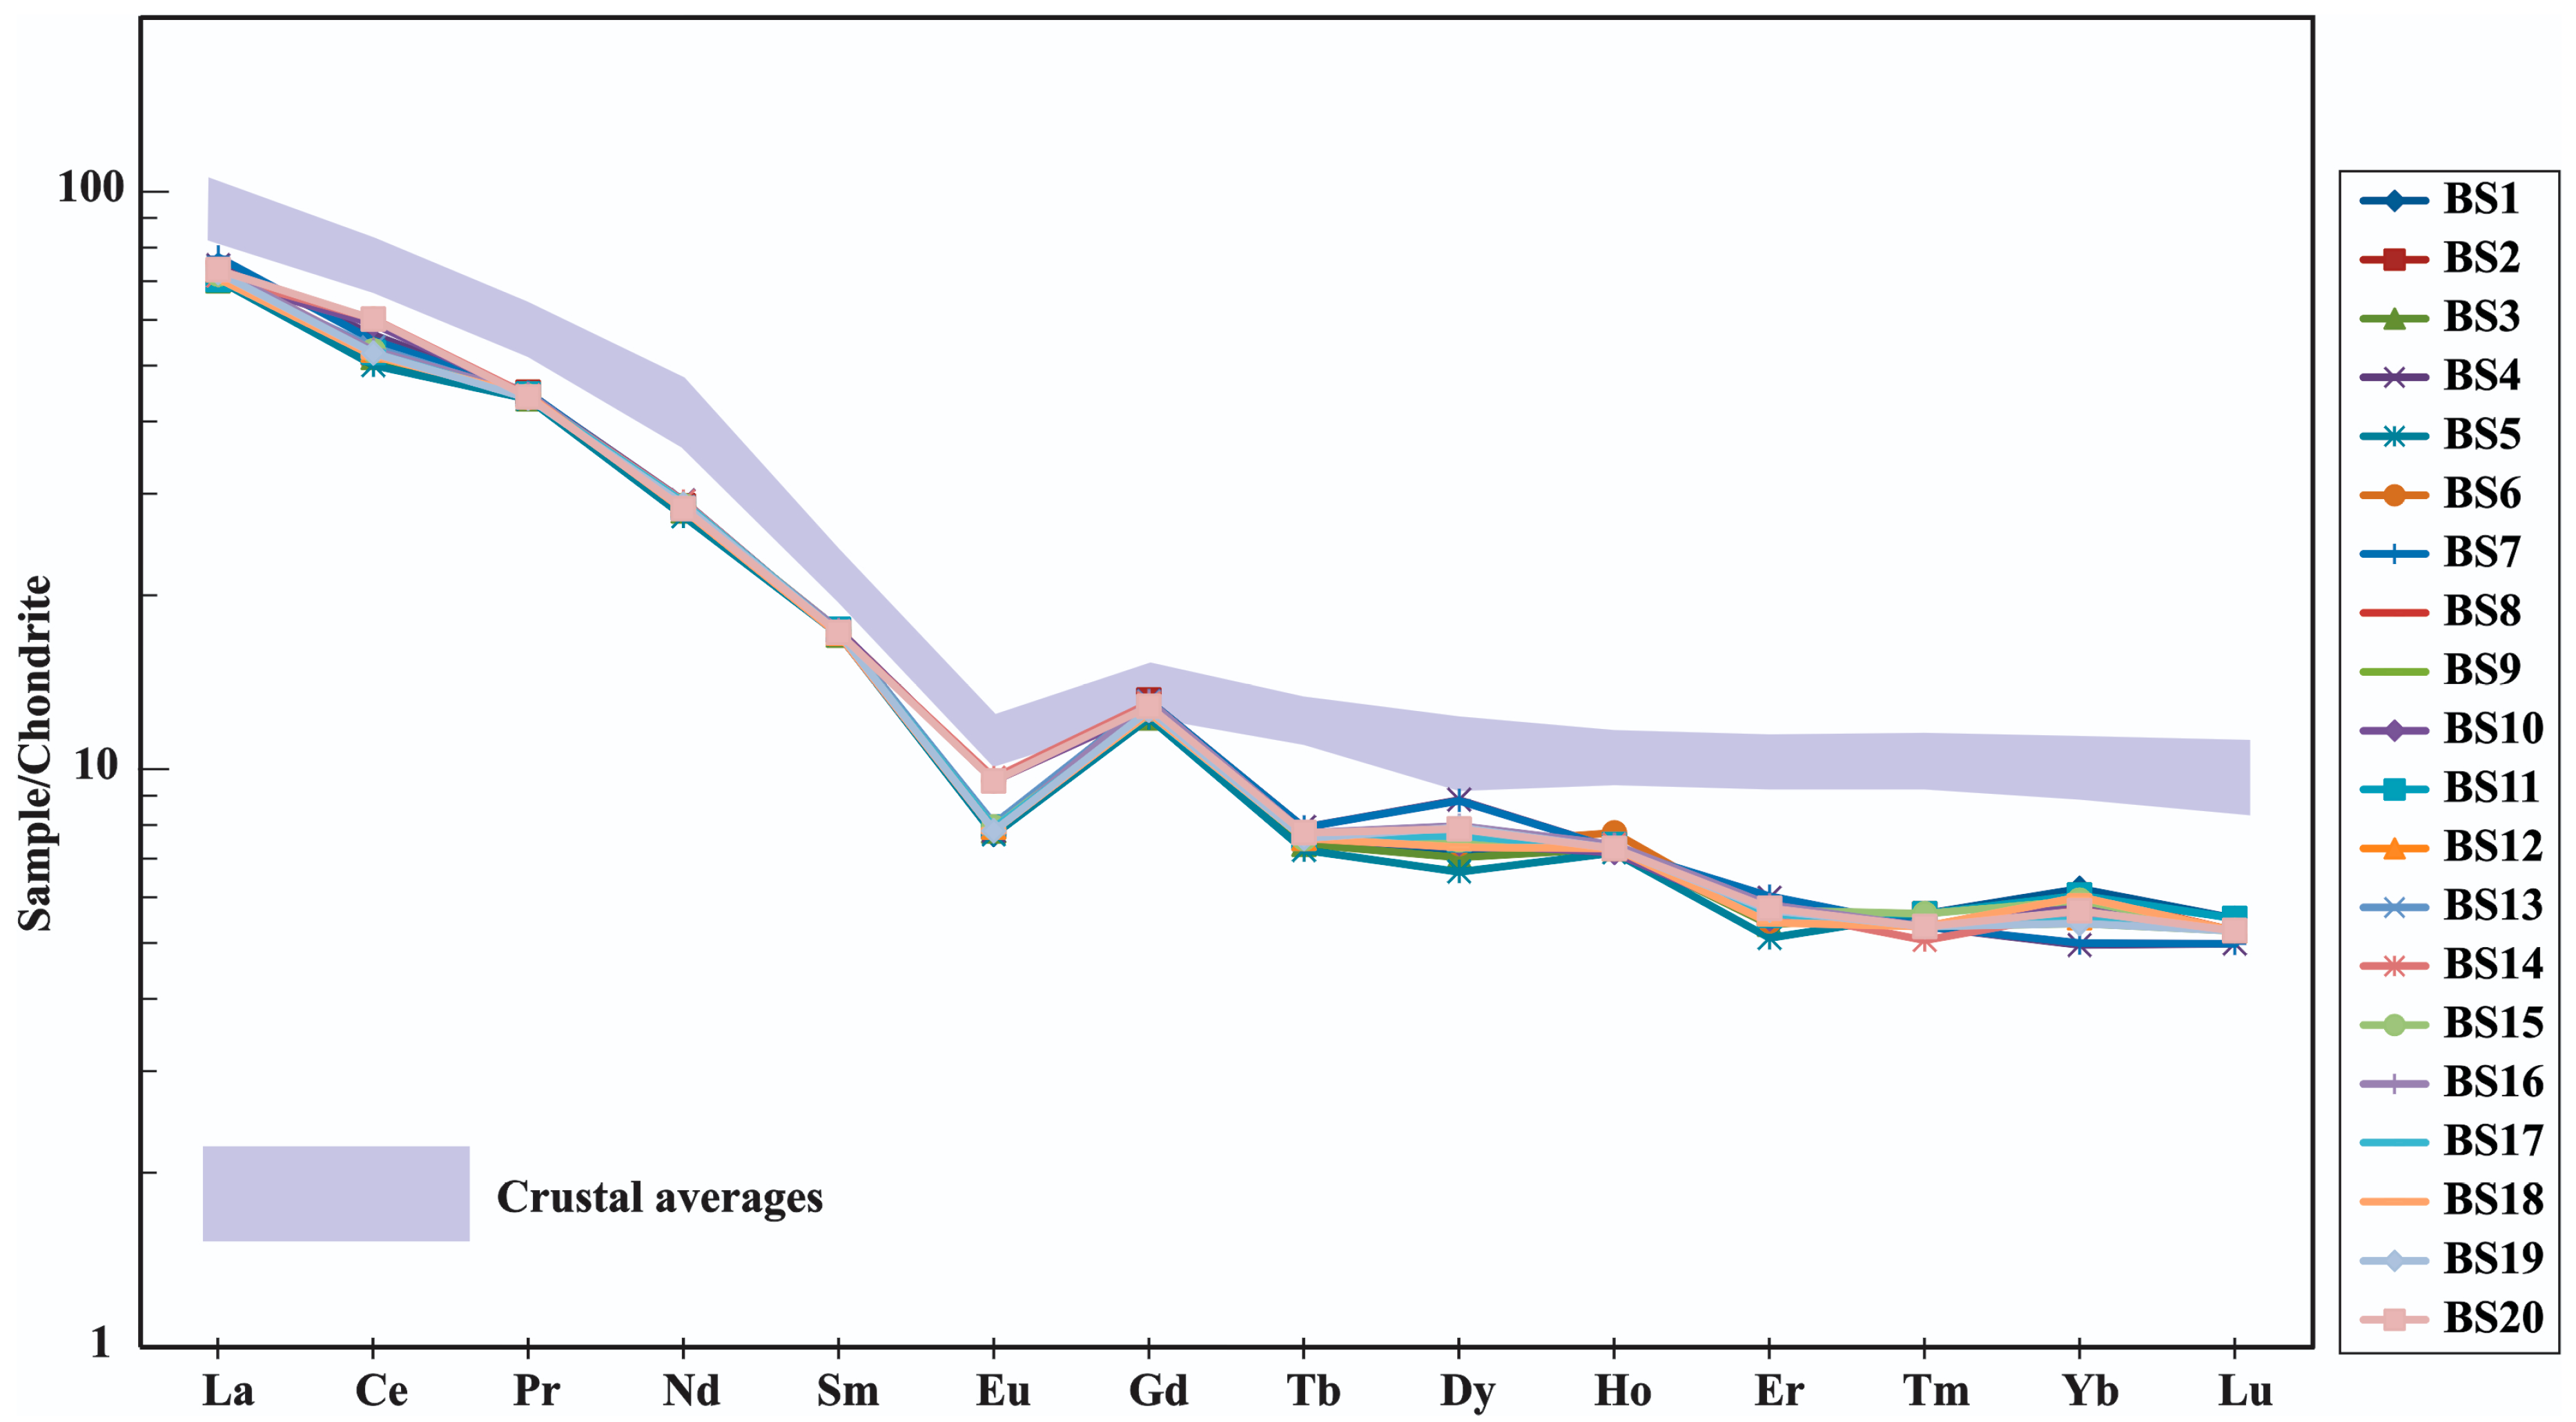
4.1.3. Rare Earth Elements (REEs)

The REE concentrations of bulk sediments from the Brahmaputra River are listed in Table 3. The total REE content of the sediments ranged between 130 ppm and 144 ppm, with an average value of 121 ppm. A chondrite-normalized REE plot shown in Figure 5 revealed broadly similar distribution patterns for all samples, with overlapping abundances and with negative slopes for the LREE and horizontal HREE segments. All data fell below the average crustal data ranges calculated from UCC and PAAS data.
The LREE and HREE abundances in the studied samples showed evidence of variable fractionation. The LaN/SmN values for the studied samples varied within a narrow range from 4.03–4.50, with an average of 4.18, and in general exhibited higher LREE fractionation. Furthermore, the GdN/YbN ratio also showed a narrow range between 1.68–2.18 with a mean value of 1.83 (Table 3). The overall negative slope geometry in the chondrite normalized plot resulted from the relative enrichment of LREE to MREE (LaN/SmN ranging 4.03–4.50) and HREE (LaN/YbN ranging 11.29–15.37), and of MREE to HREE (GdN/YbN ranging 1.68–2.18). All the sediments showed consistently slight homogeneous negative Eu anomalies, with Eu/Eu* ratios ranging between 0.57 and 0.71, with an average value of 0.61. A similar range (0.51–0.80) was noted by Bhuiyan et al. [7] in bar-top sediments from the Brahmaputra River. The negative Eu anomaly observed in the sediments was likely representative of their source-rock characteristics. Among the several compositional variables of the sediments, both Zr and P2O5 showed a positive correlation with all the REEs (Table 4), which likely indicated control of zircon and apatite on the REE distribution.

4.2. Provenance

Provenance characteristics of clastic sediments can be deduced using various approaches based on the geochemical data for major, trace and rare earth elements. These are discussed below.

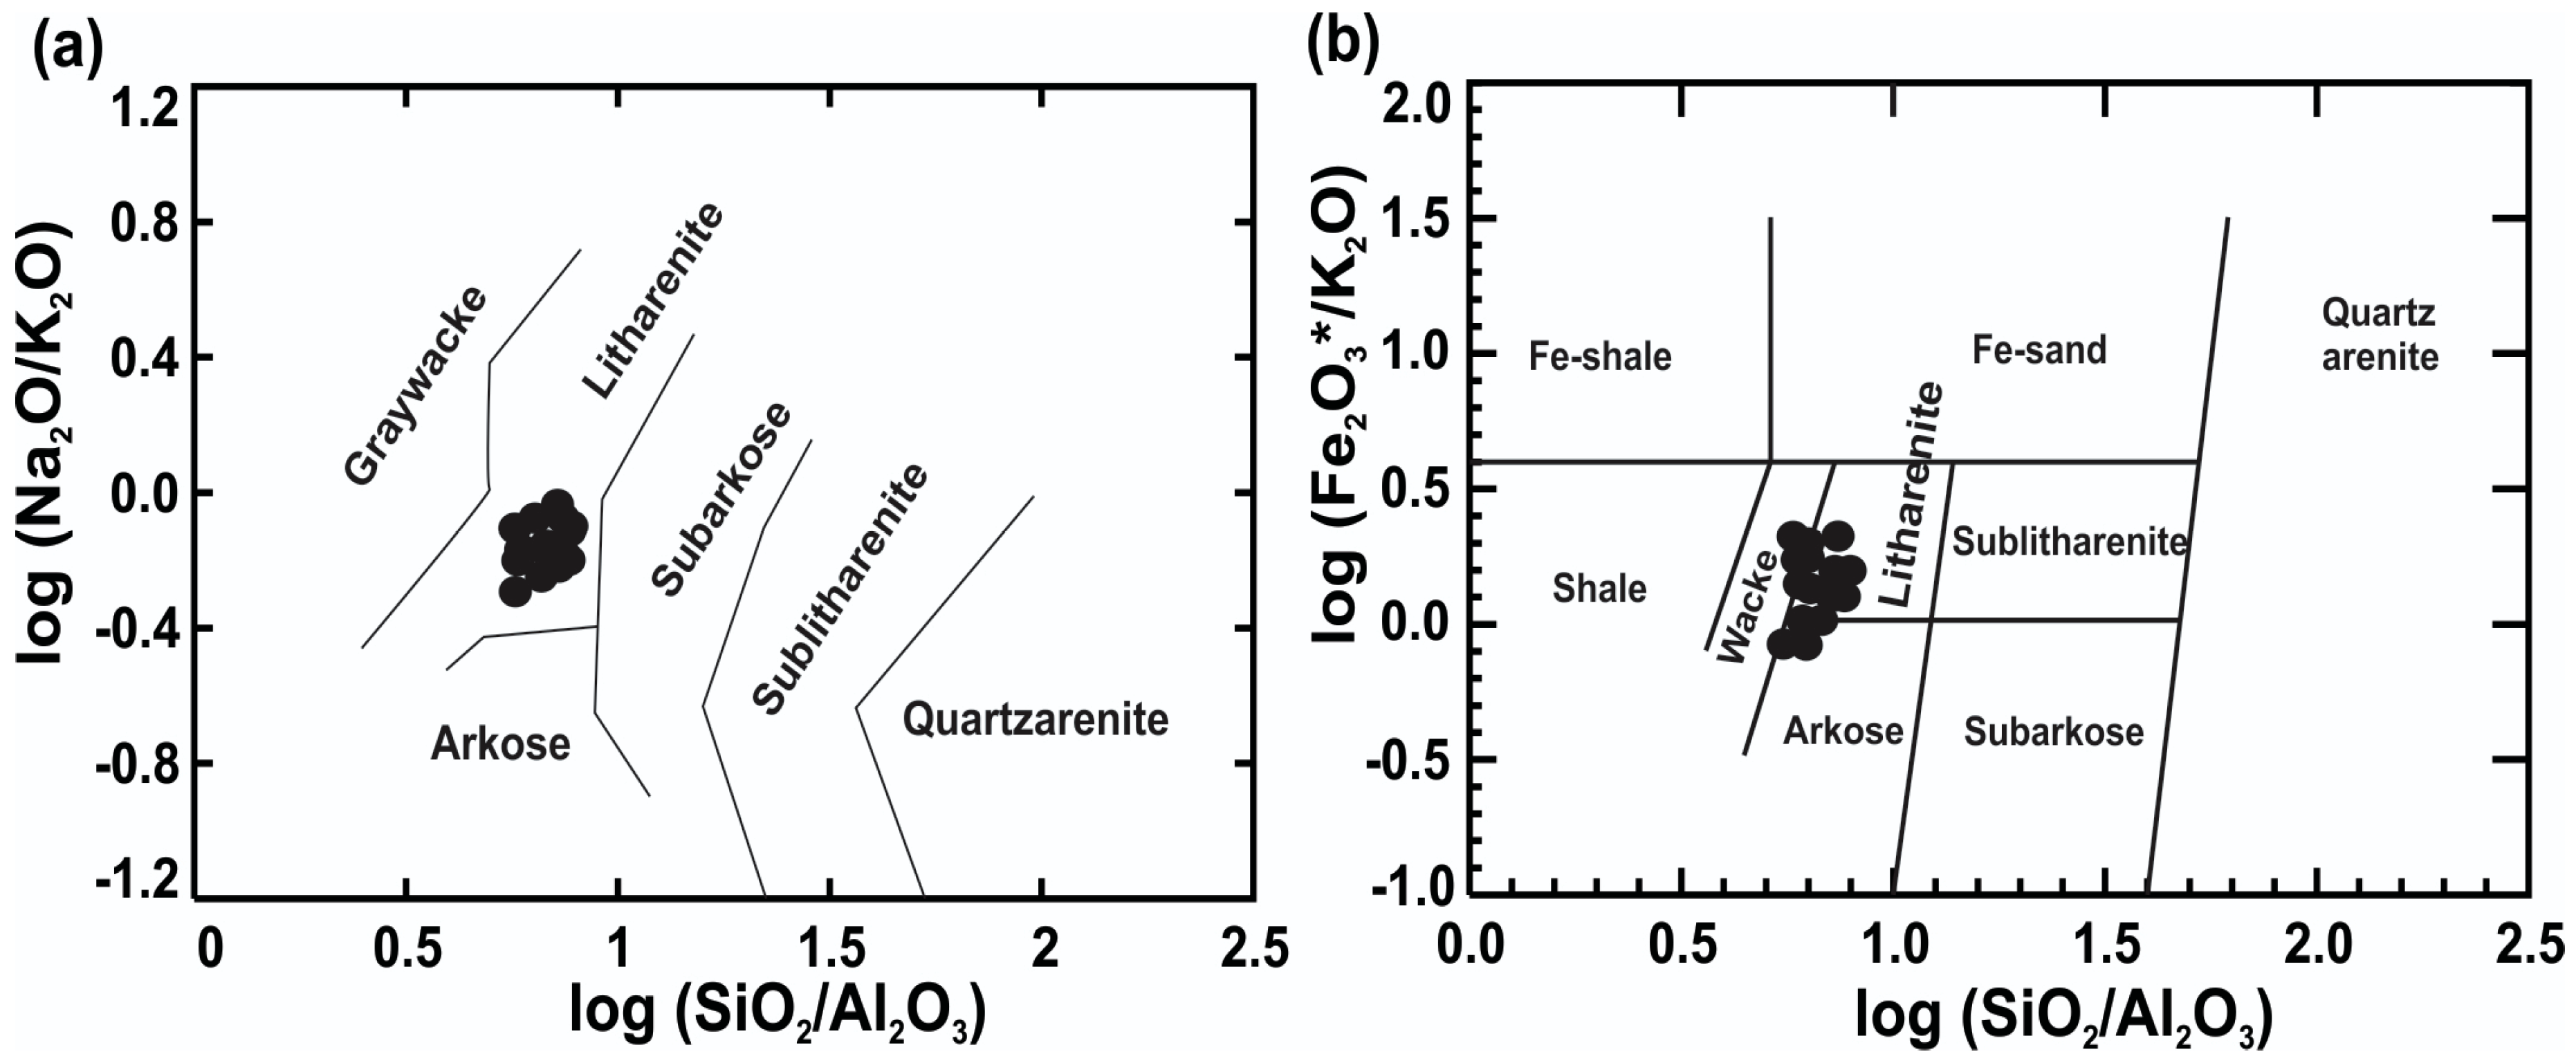
4.2.1. Major Elements

Major element geochemical data provides evidence regarding sedimentary provenance as well as the effects of sedimentary processes such as weathering and sorting. Using the abundance of seven major oxides, Roser and Korsch [38] provided an effective scheme to determine provenance of sedimentary suites based on four major provenance groupings: mafic igneous, intermediate igneous, felsic igneous and quartzose sedimentary recycled. On such a discriminant function plot (Figure 6), the Brahmaputra samples fall within the quartzose detritus field, consistent with significant loss of feldspar due to source rock weathering or recycling. Recycled sources typically represent quartzose sediments from a mature continental provenance, with the derivation of the sediments likely from a highly weathered granite-gneiss terrain and/or from a pre-existing sedimentary terrain such as in the southern Himalayas [13,37]. Similar results were obtained for Miocene Surma Group sandstones in the Bengal Basin by Rahman and Suzuki [37], for Brahmaputra-Jamuna River (BJR) sediments by Bhuiyan et al. [7] and for Ganges-Brahmaputra (GBR) sediments (data reported in Hossain [9]).
The ratio of SiO2/Al2O3 (5.7–7.4) of the studied sediments was higher than the equivalent ratio for both UCC and PAAS (Table 1), reflecting that the Brahmaputra sediments were derived largely from crustal felsic sources. Moreover, the Al2O3/TiO2 ratio, which can be used to infer mafic, intermediate and felsic rock compositions (see Keskin [40] and references therein) varied from 10 to 34 and according to Hayashi et al. [41] the Al2O3/TiO2 ratios in mafic rock types range from ~3 to 8, intermediate types from ~8 to 21, and felsic types from ~21 to 70. The high Al2O3/TiO2 values in the Brahmaputra sediments (average of ~8) combined with high SiO2 contents (up to 76 wt.%) indicate derivation from mostly intermediate to felsic rock sources. This was also confirmed by a bivariate plot of K versus Rb [42] shown in Figure 7. Although scattered, indicating multiple source rocks including basic components, in general the Brahmaputra sediments have K/Rb ratios that plot predominantly within the field that indicate they represent the erosional products of a series of magmatic rocks that could be generated by mixing typical upper continental crustal materials (granodioritic/granitic) with moderate portions of more intermediate/basic compositions.

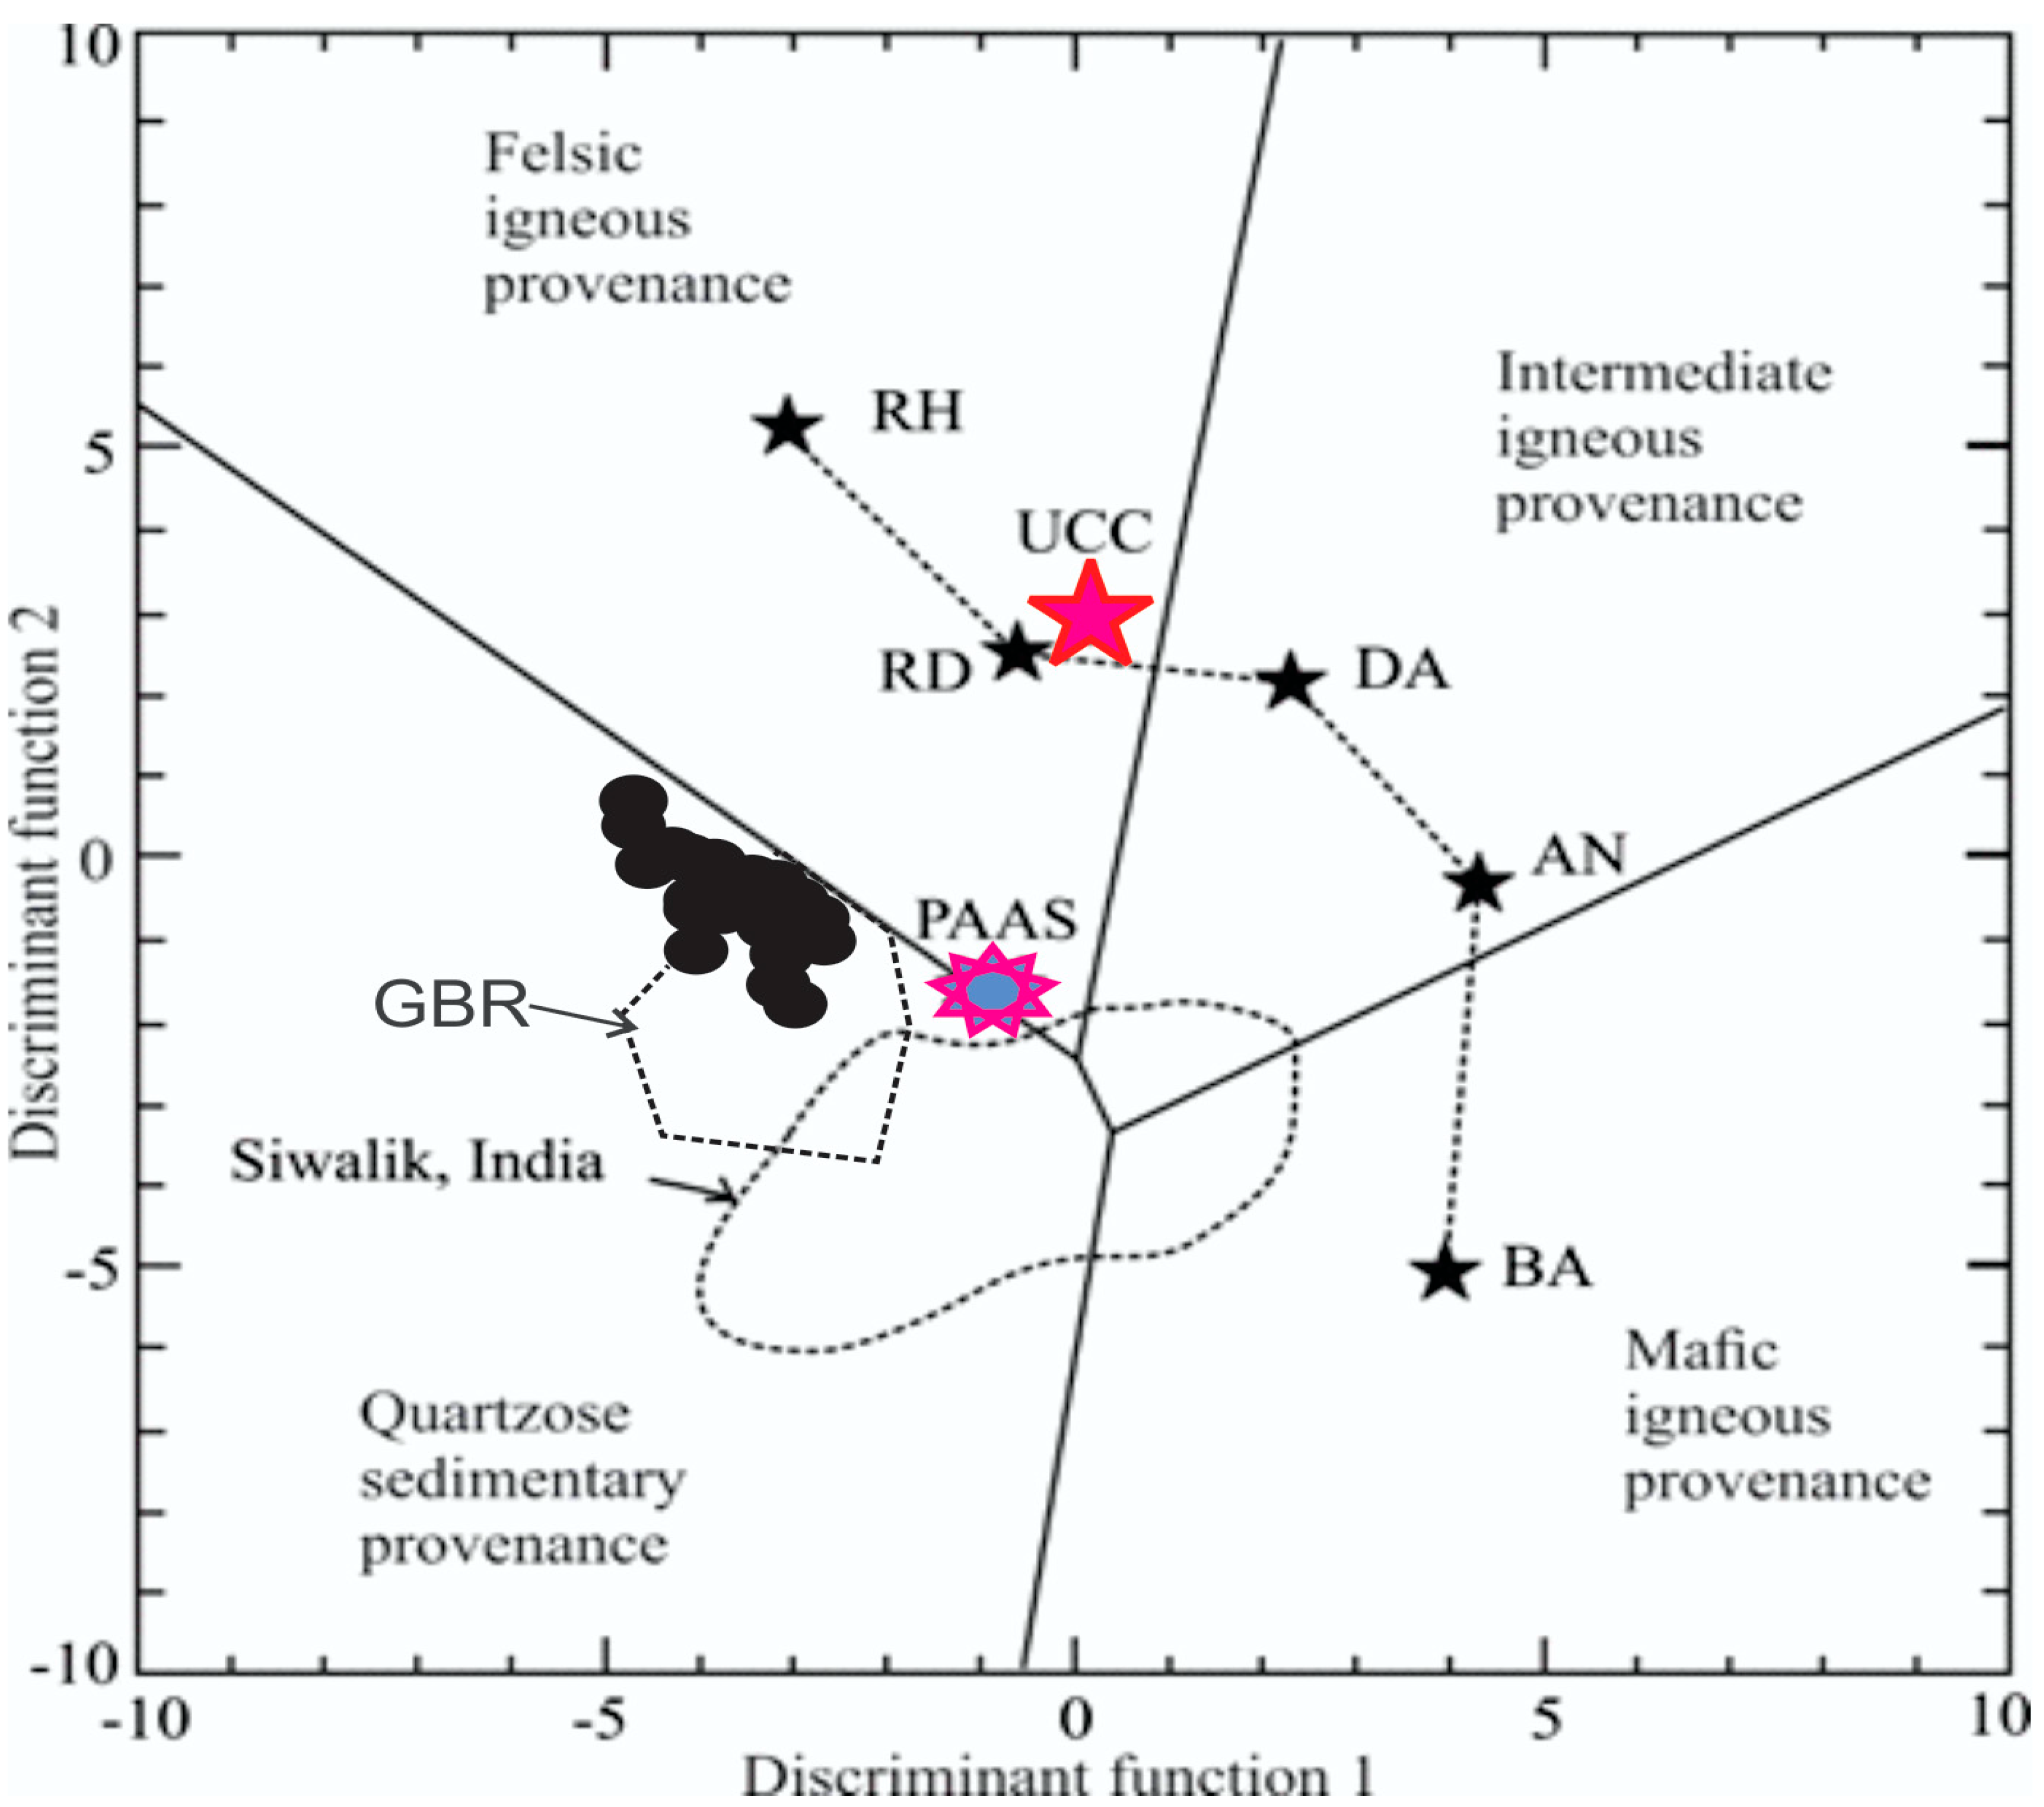
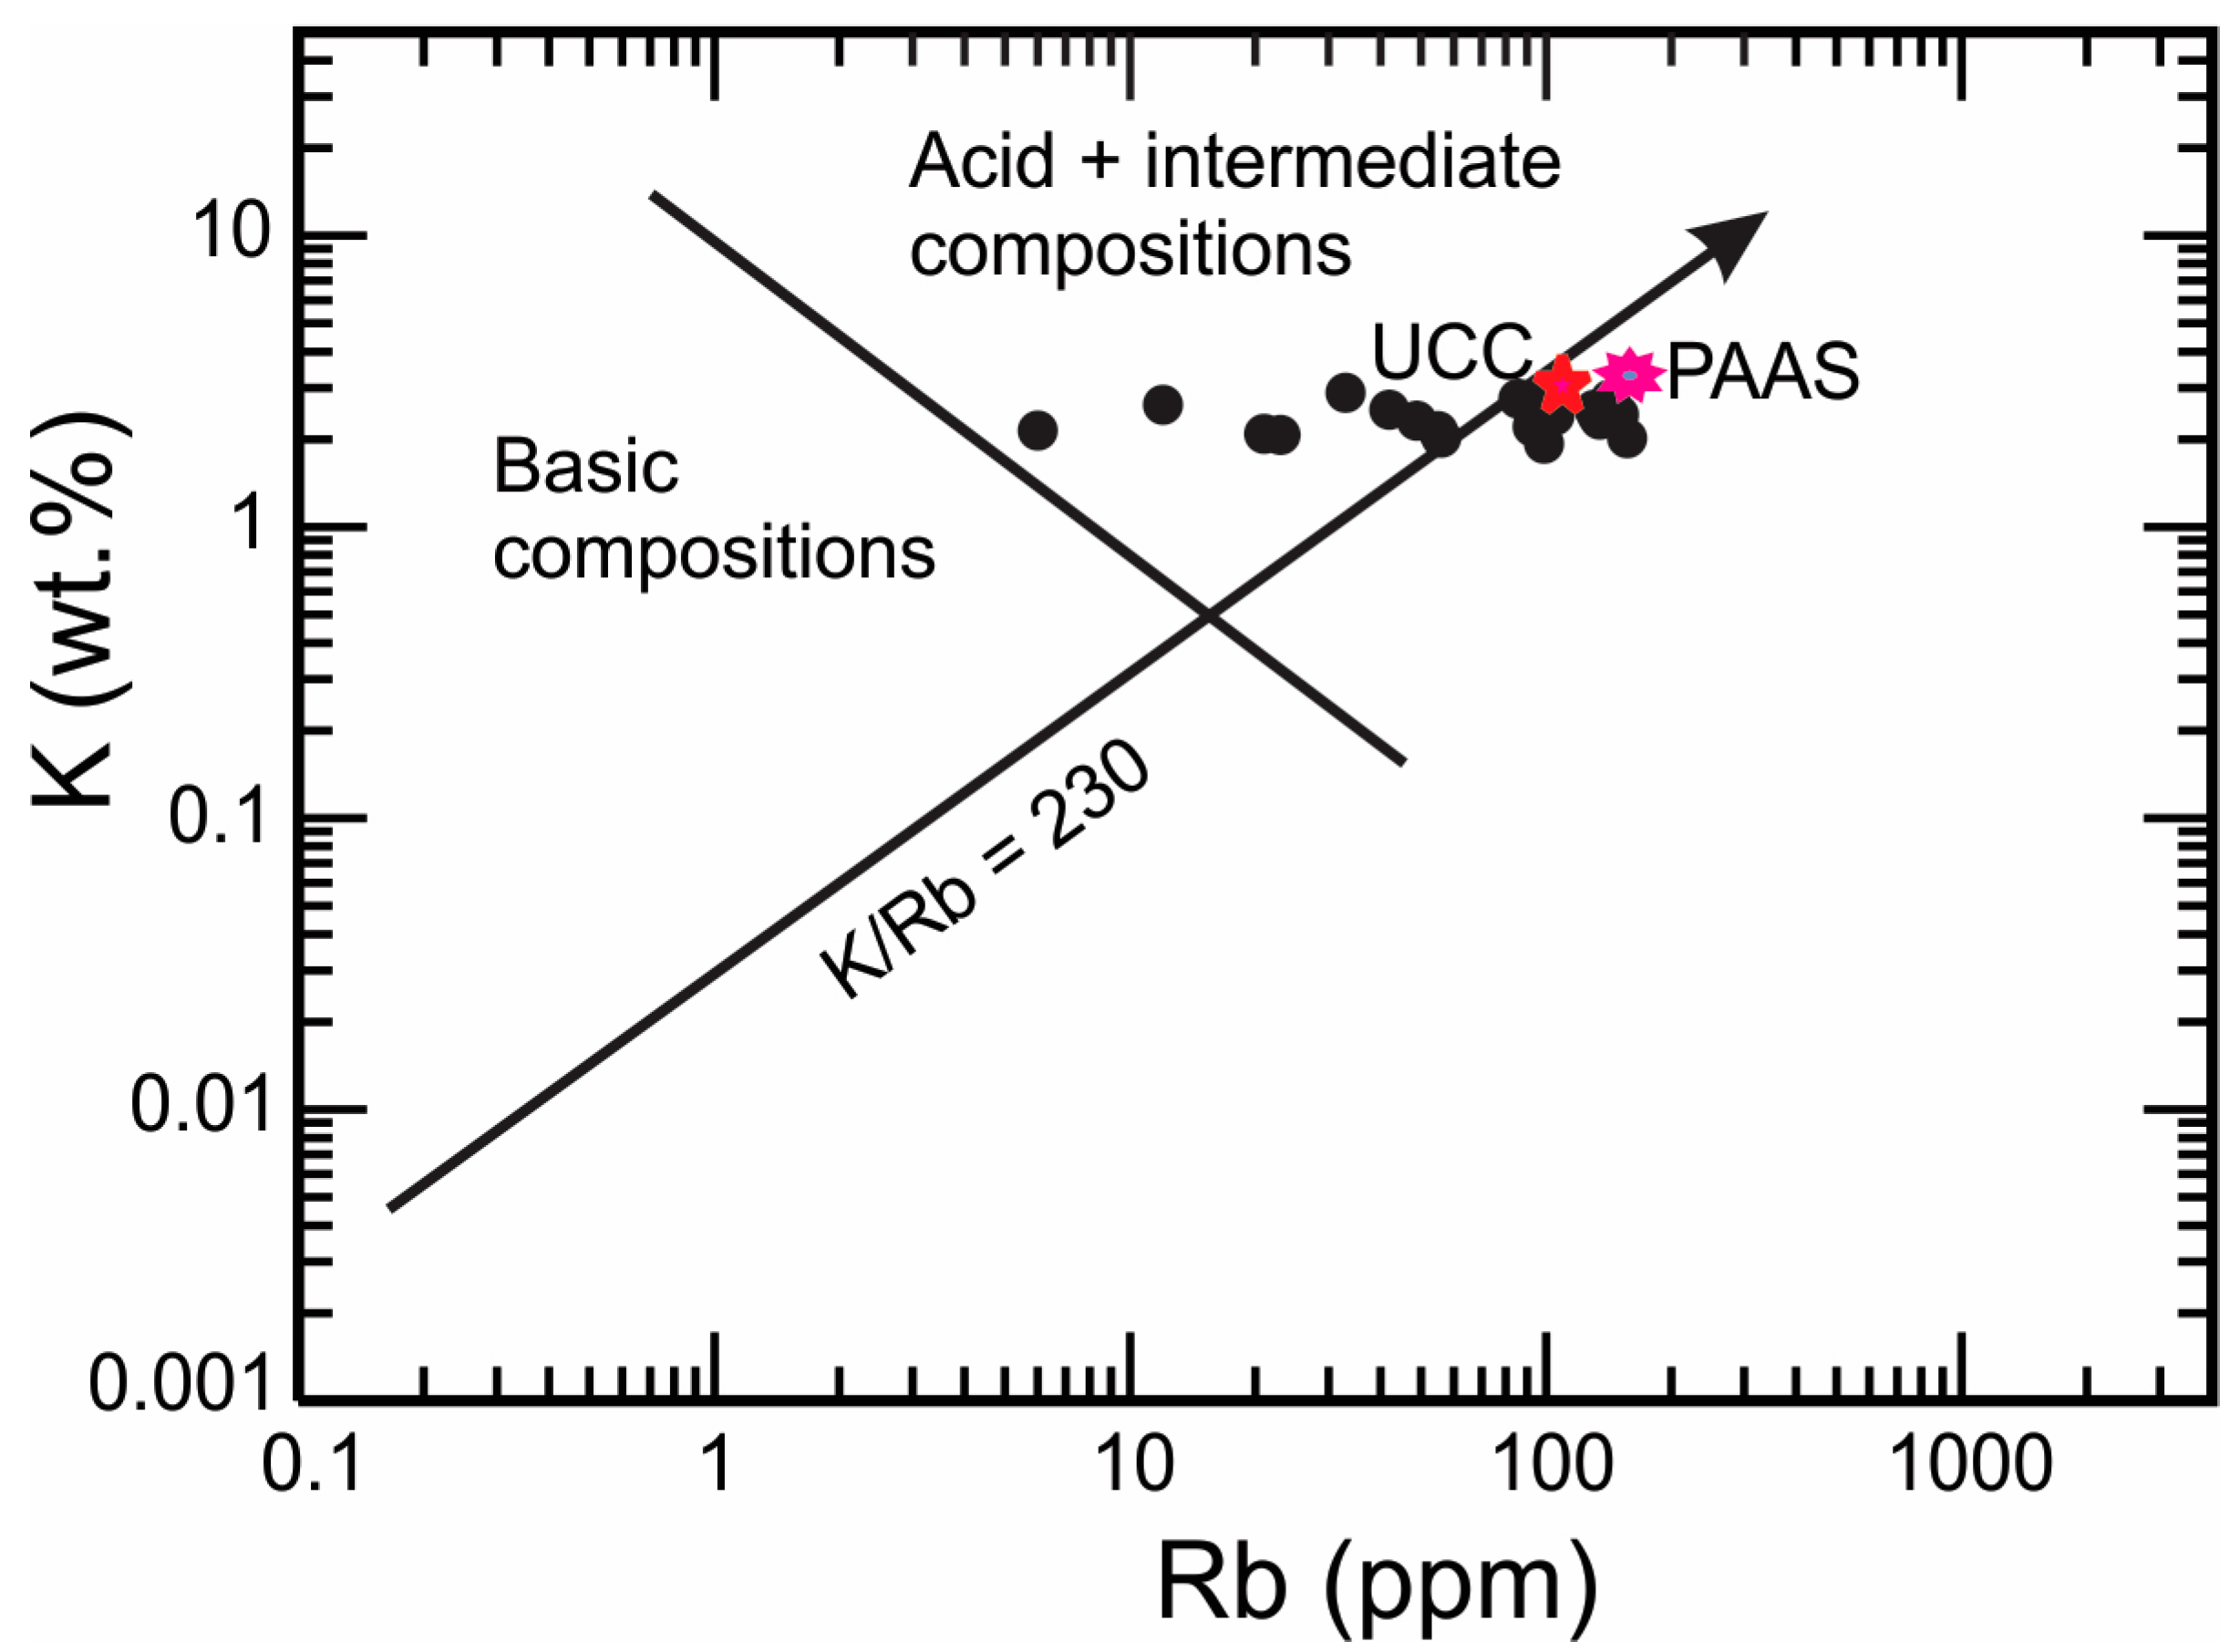
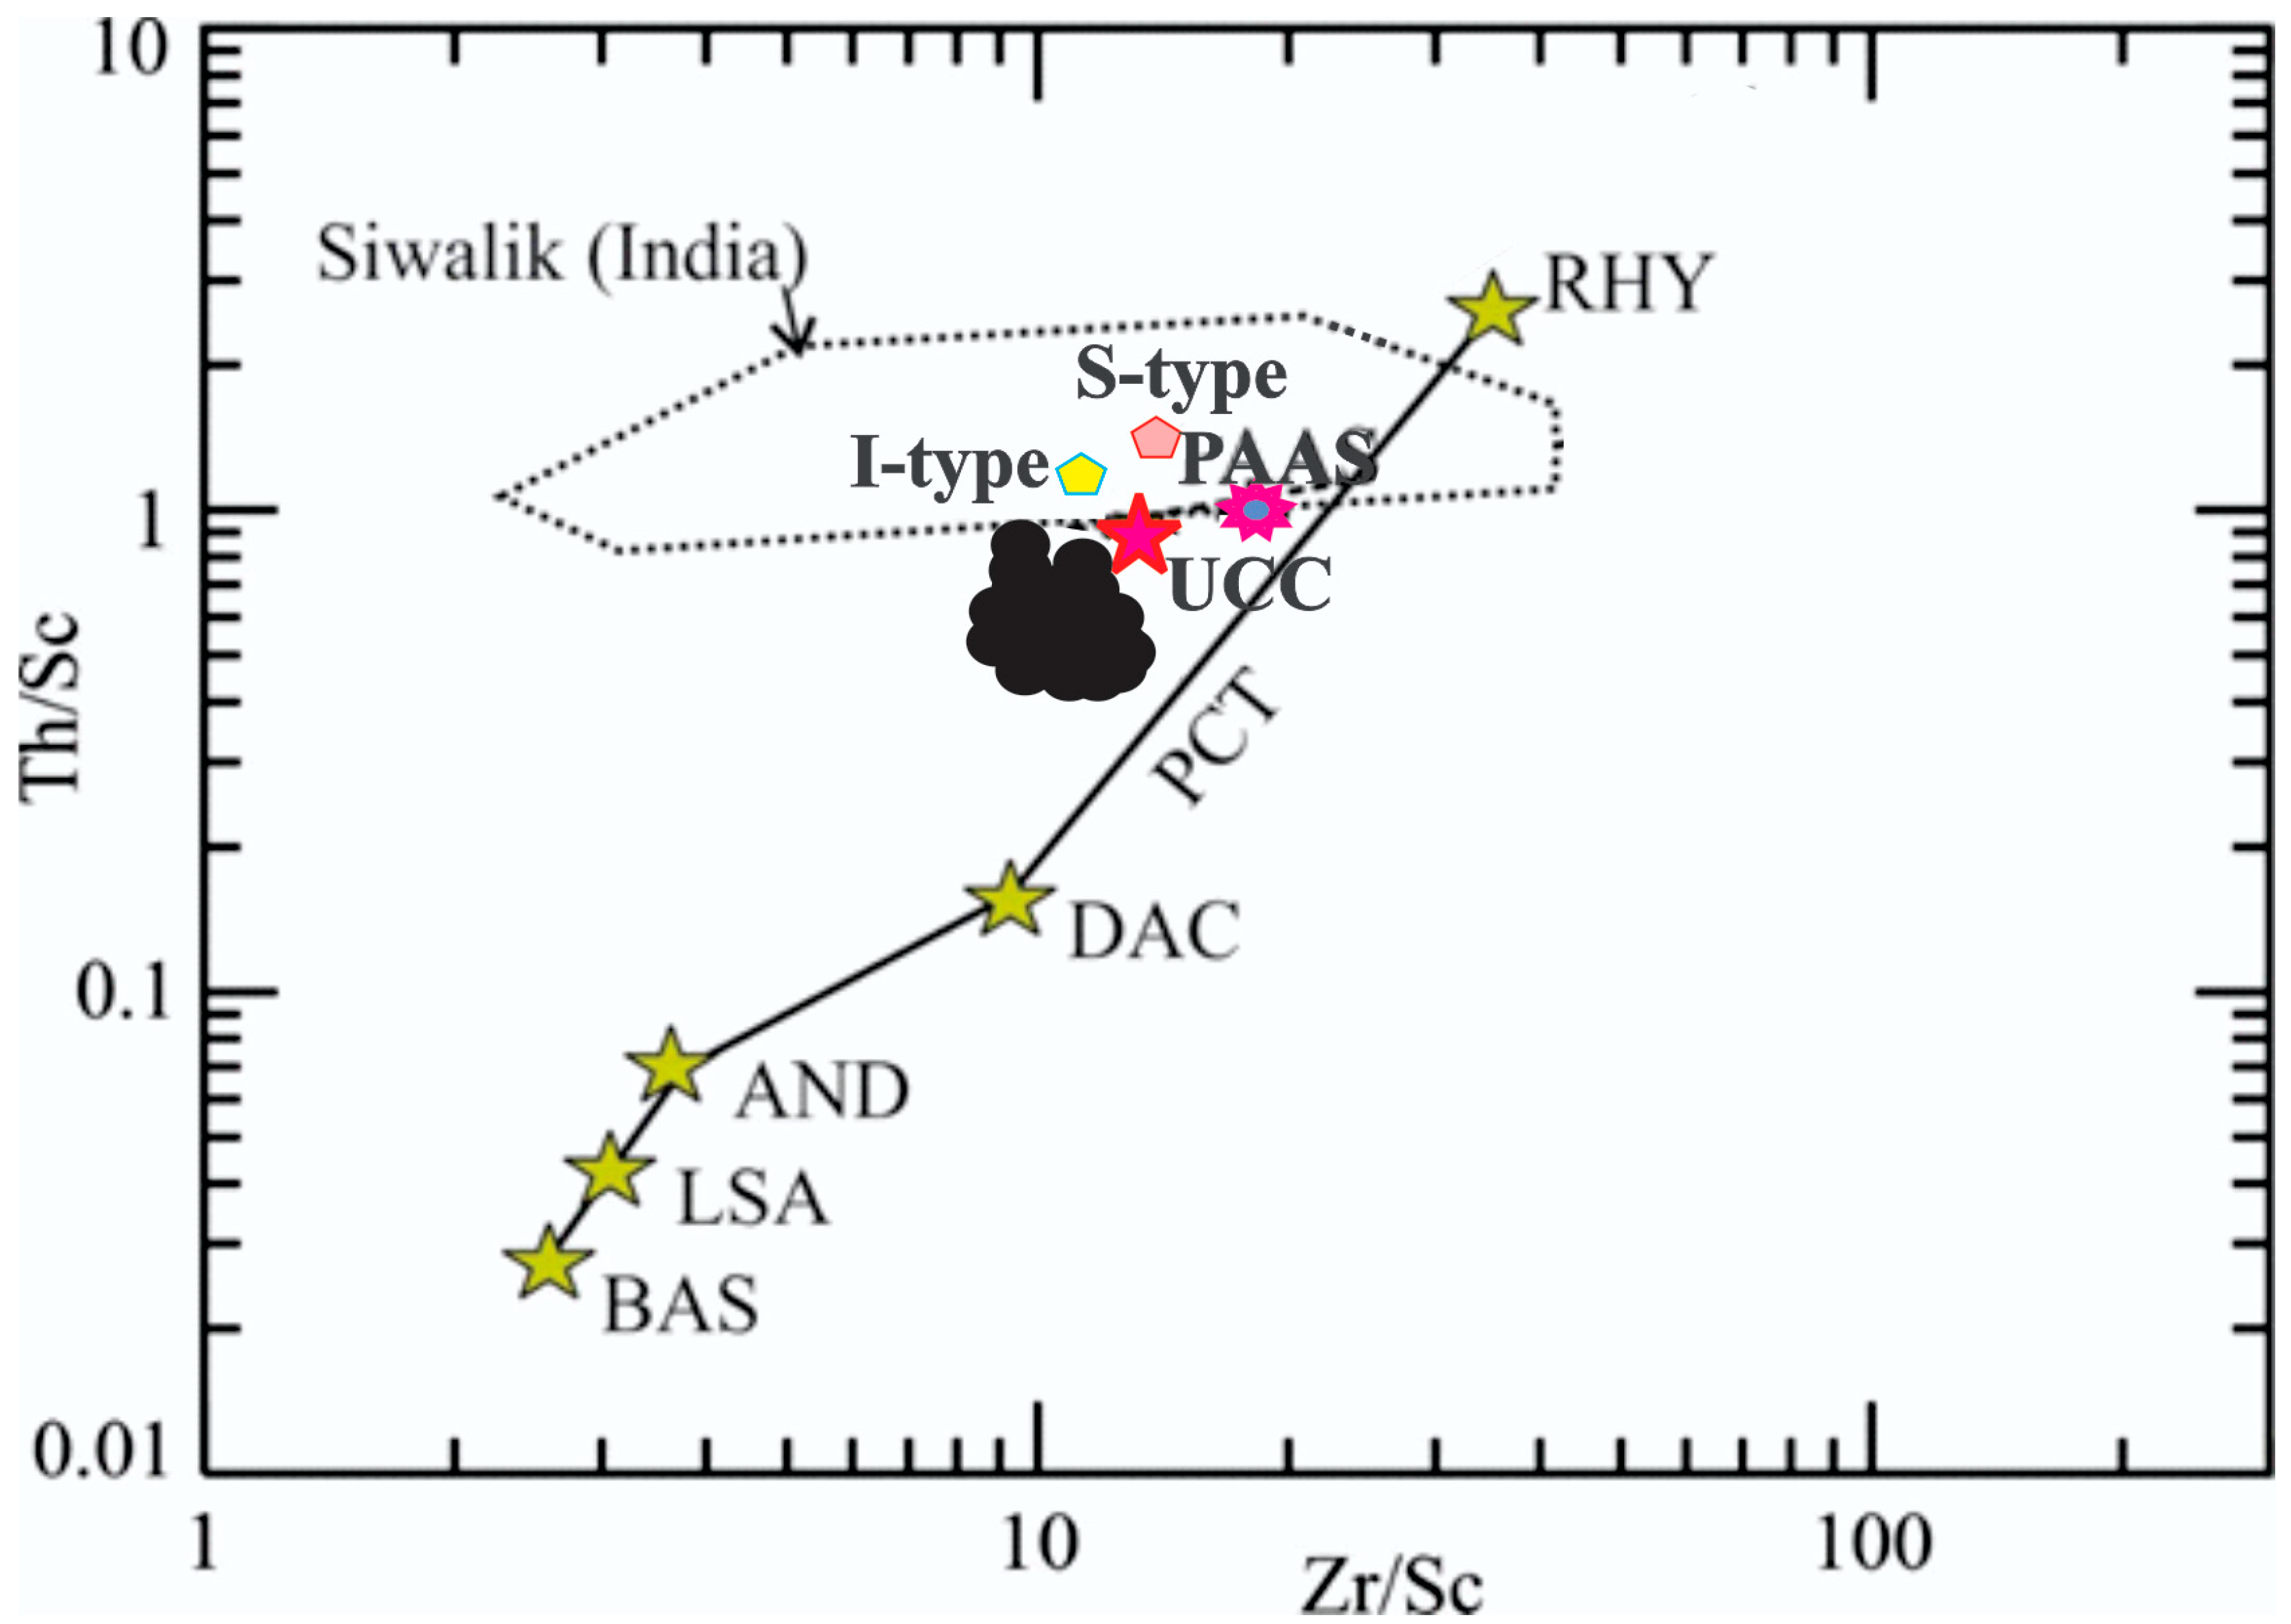
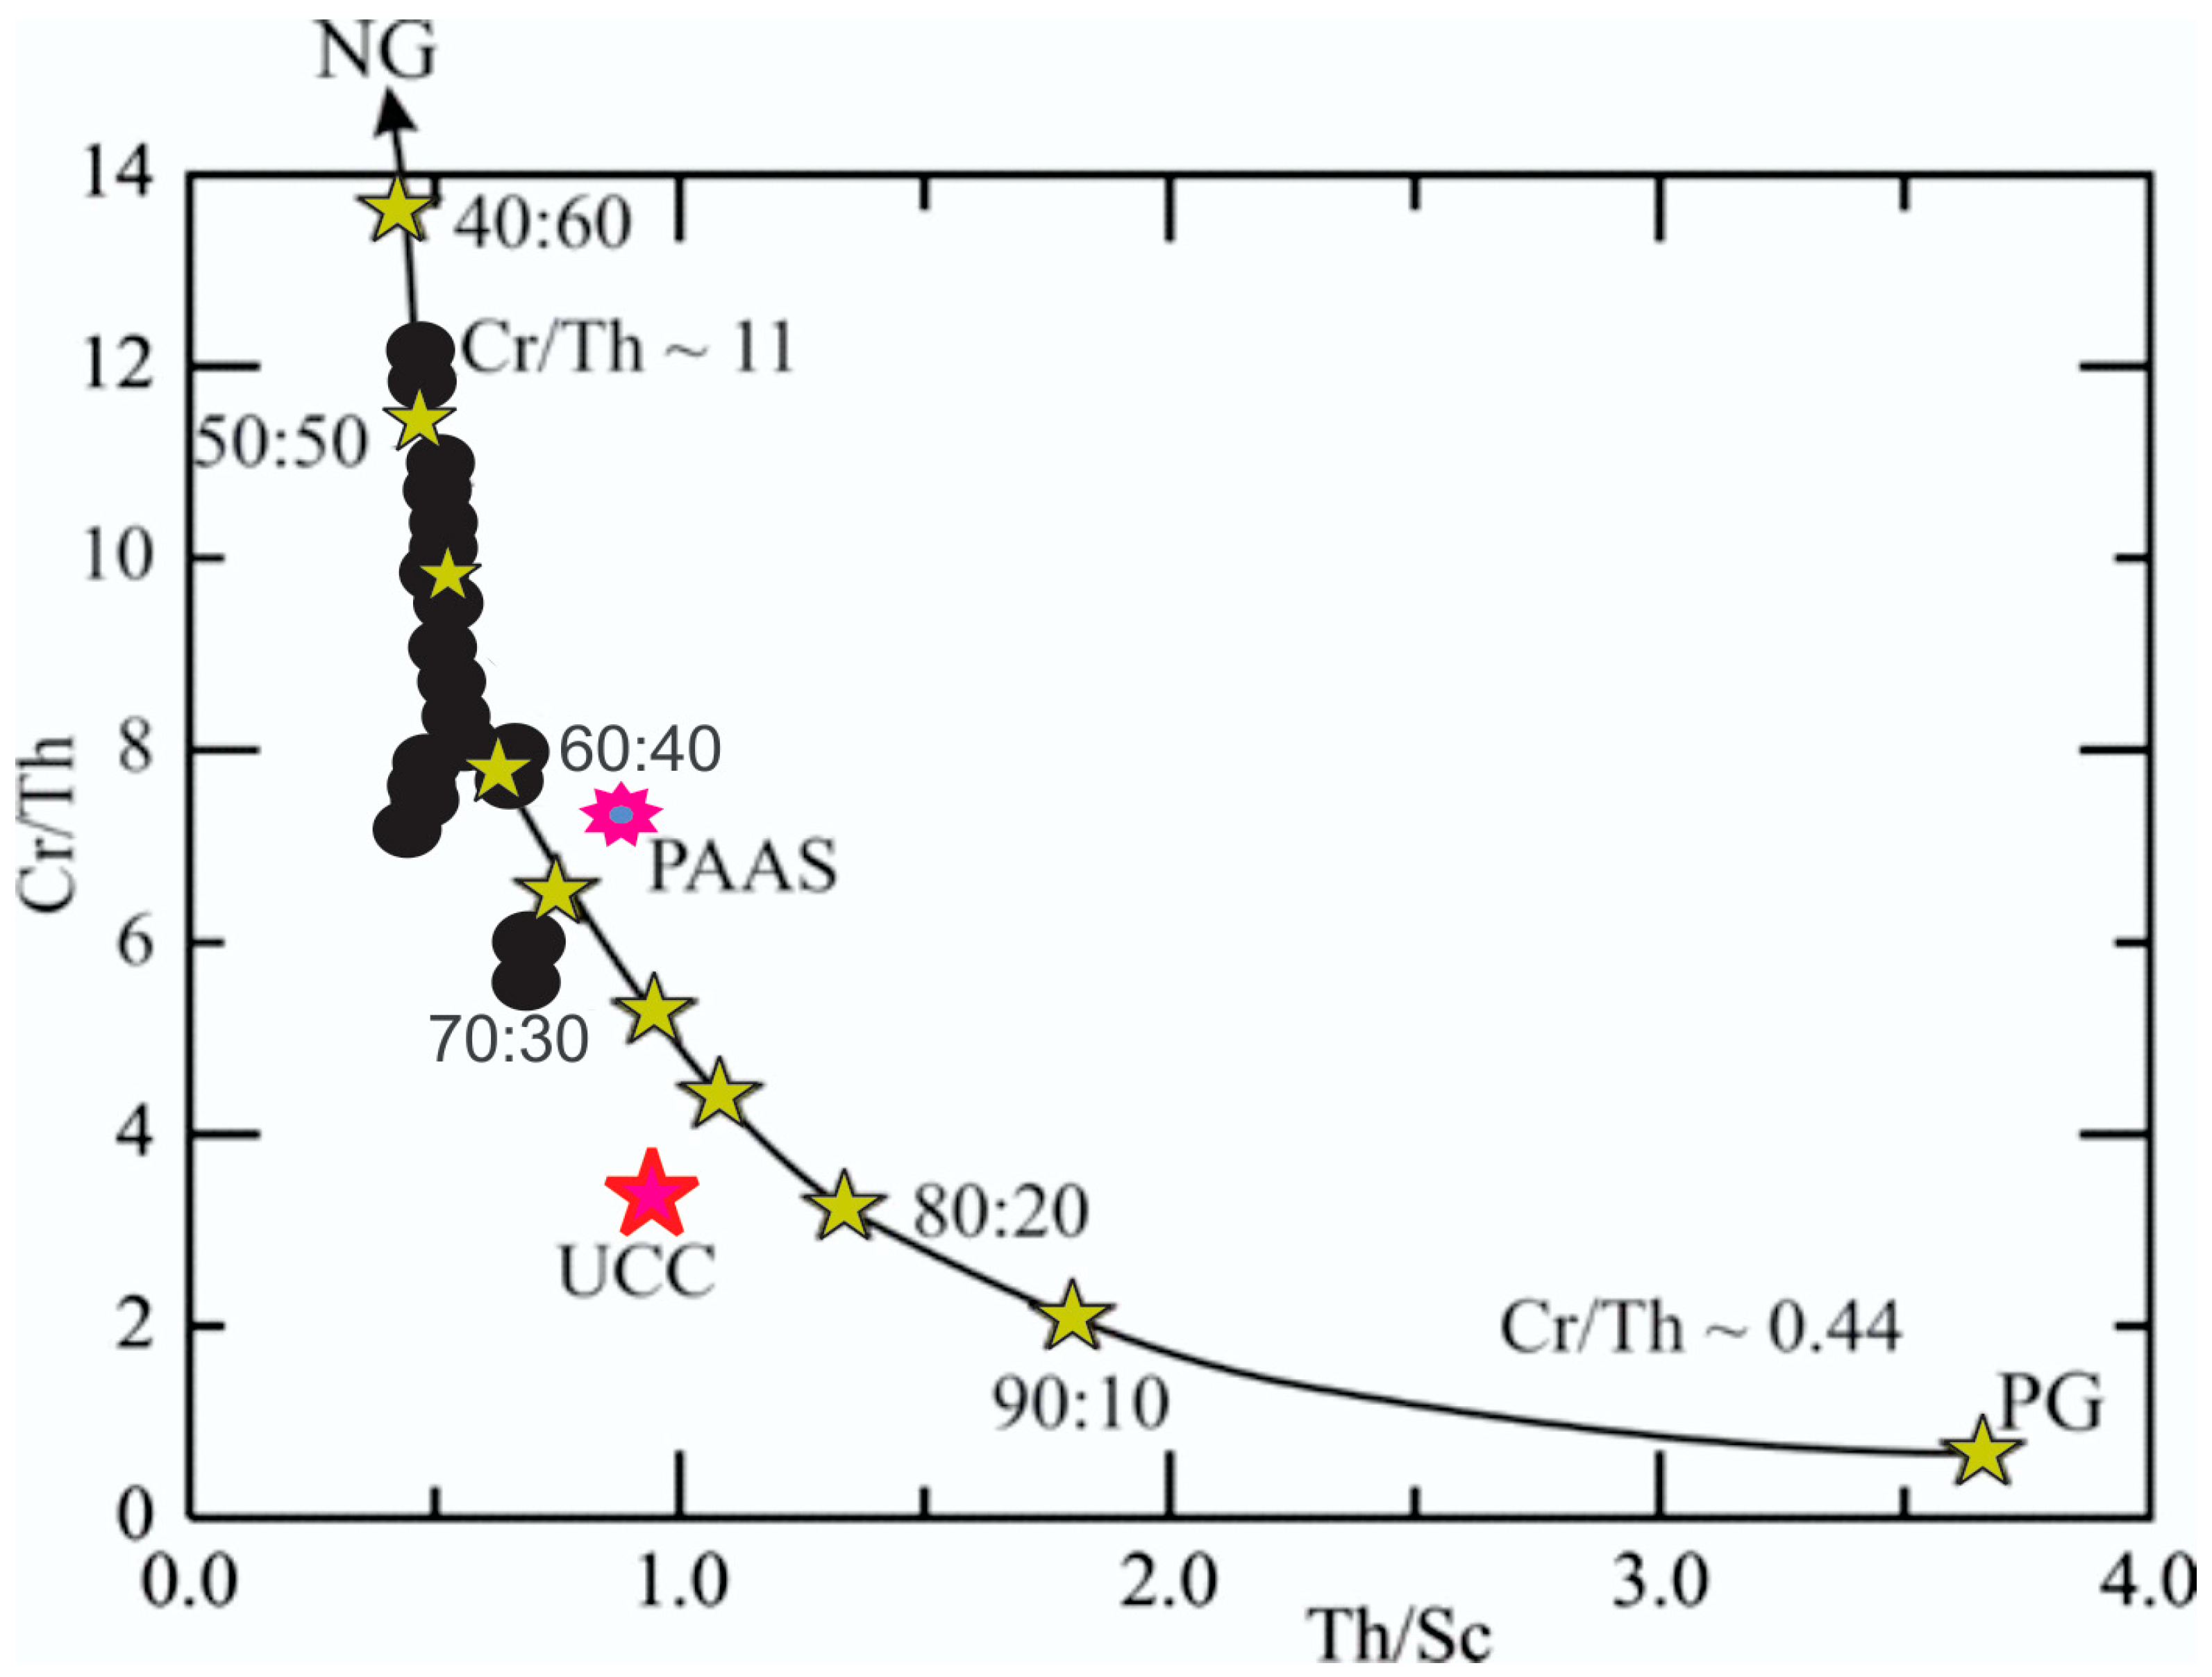
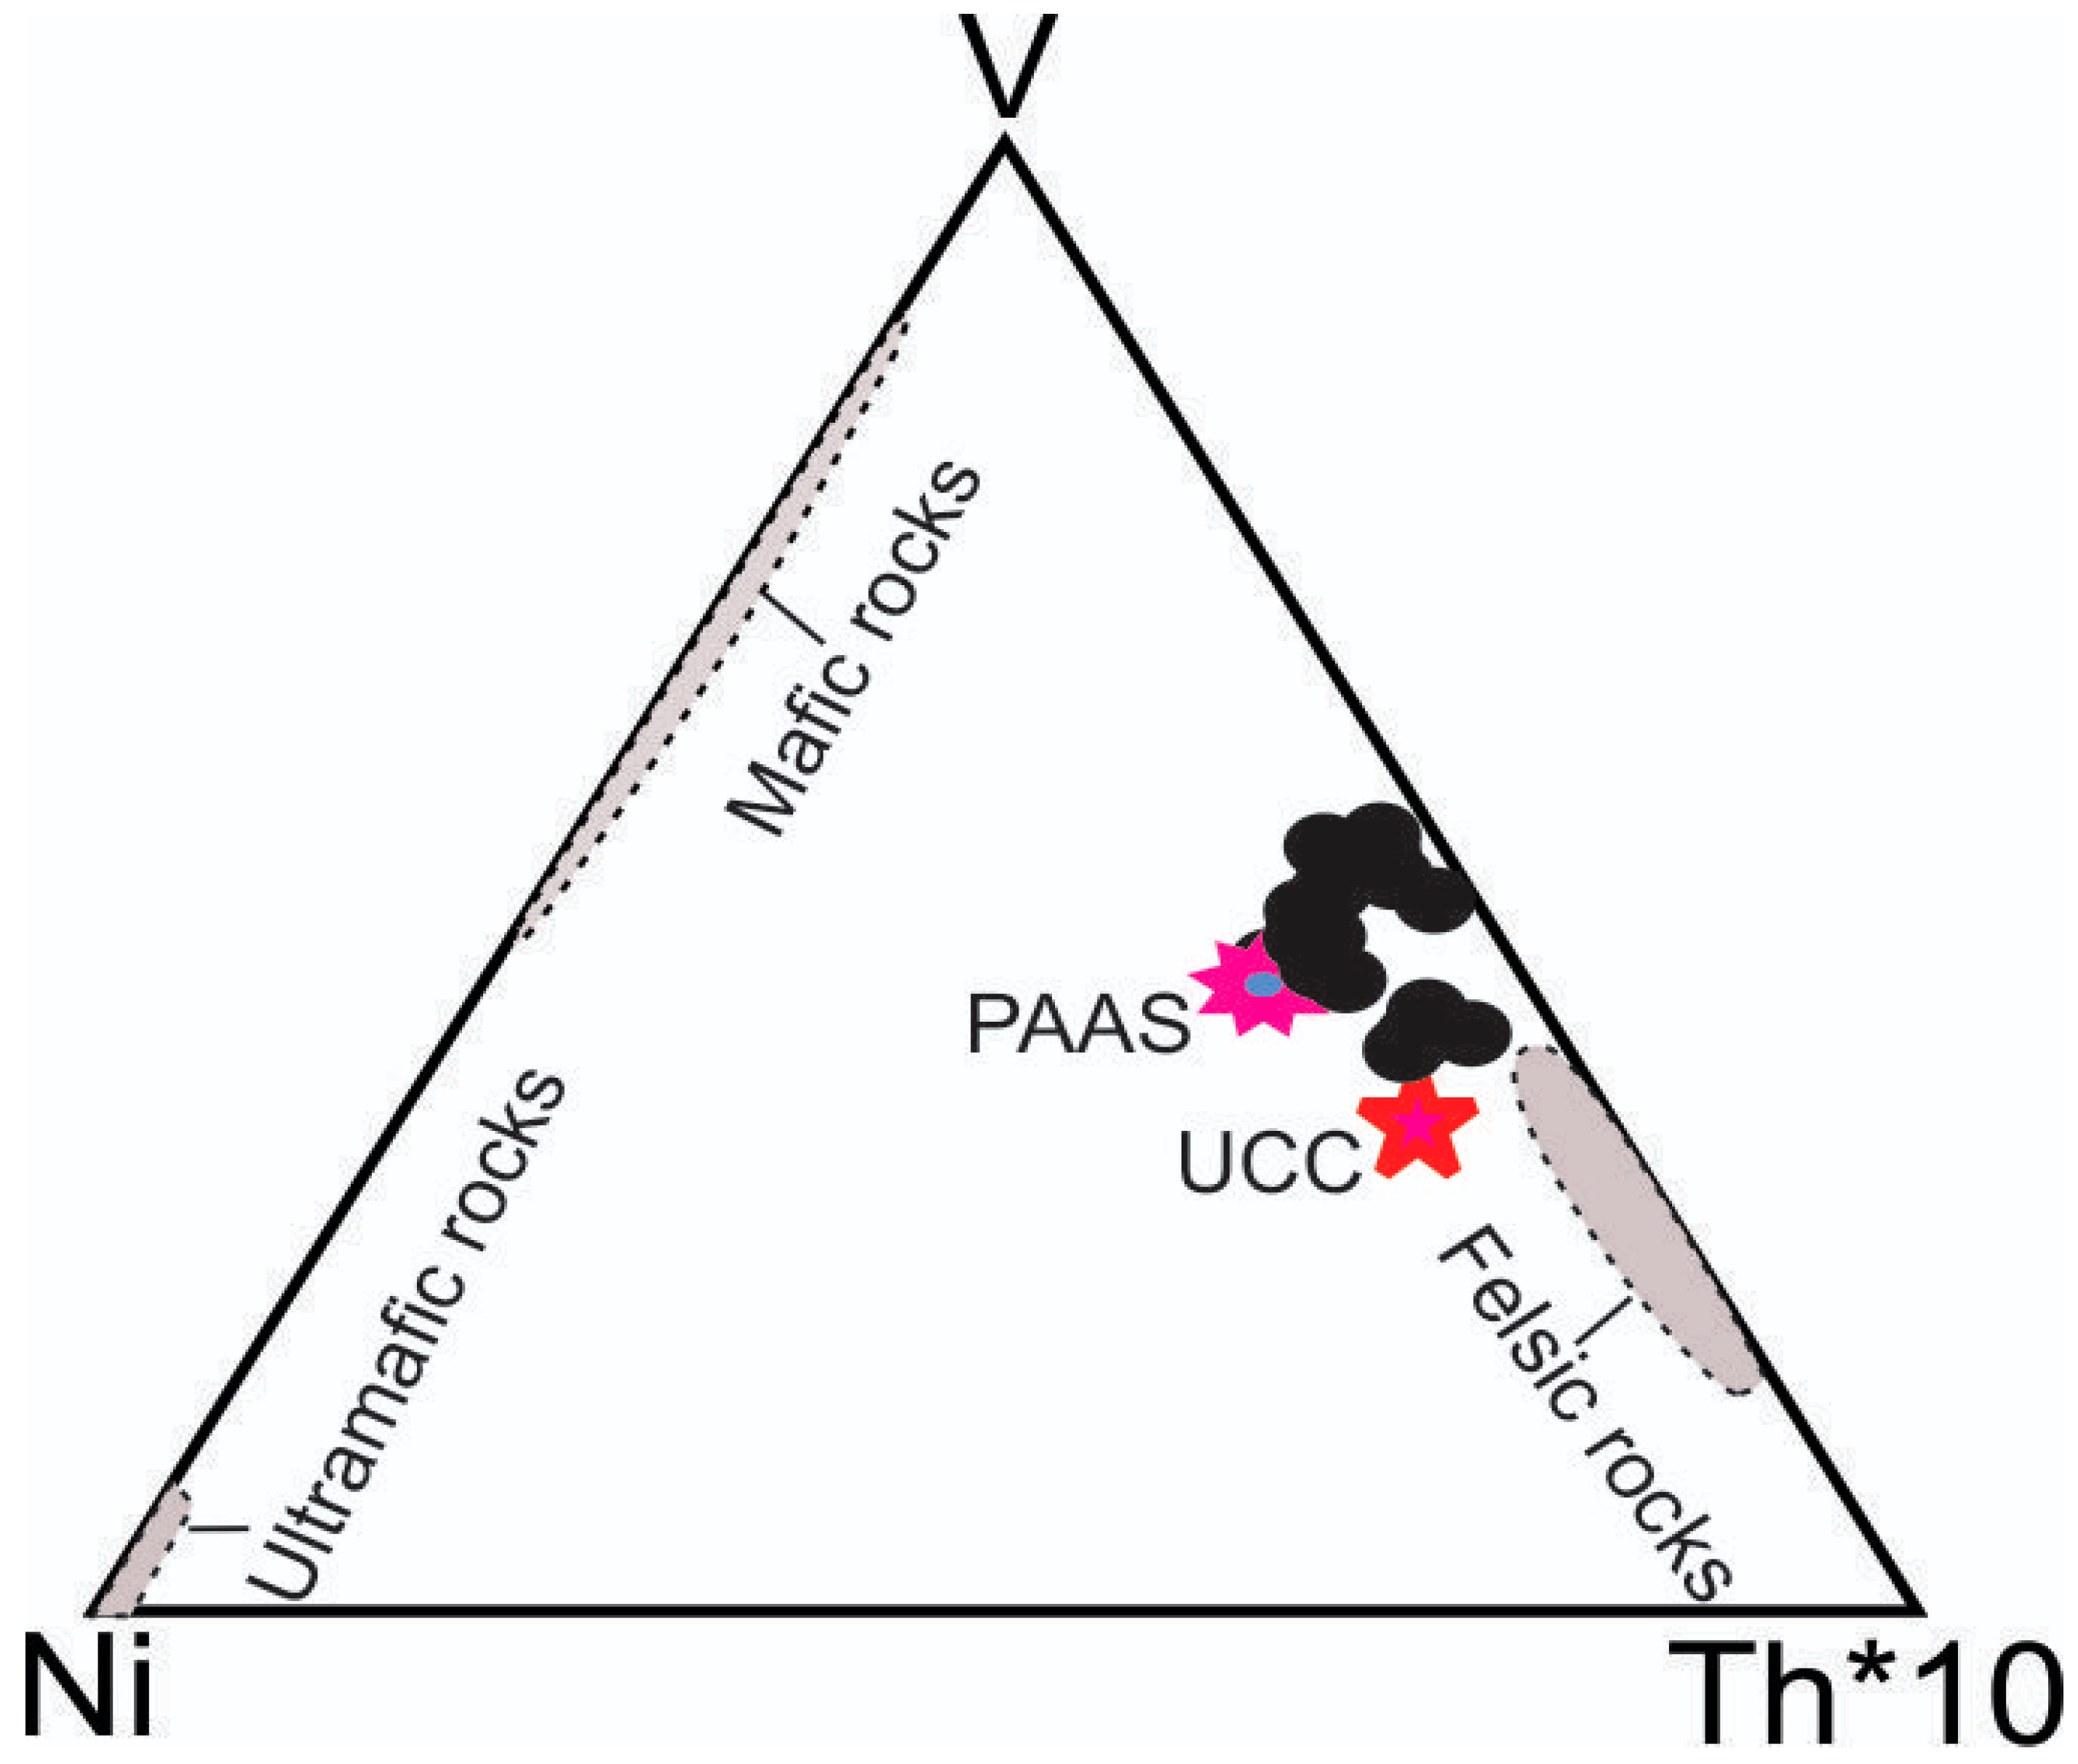
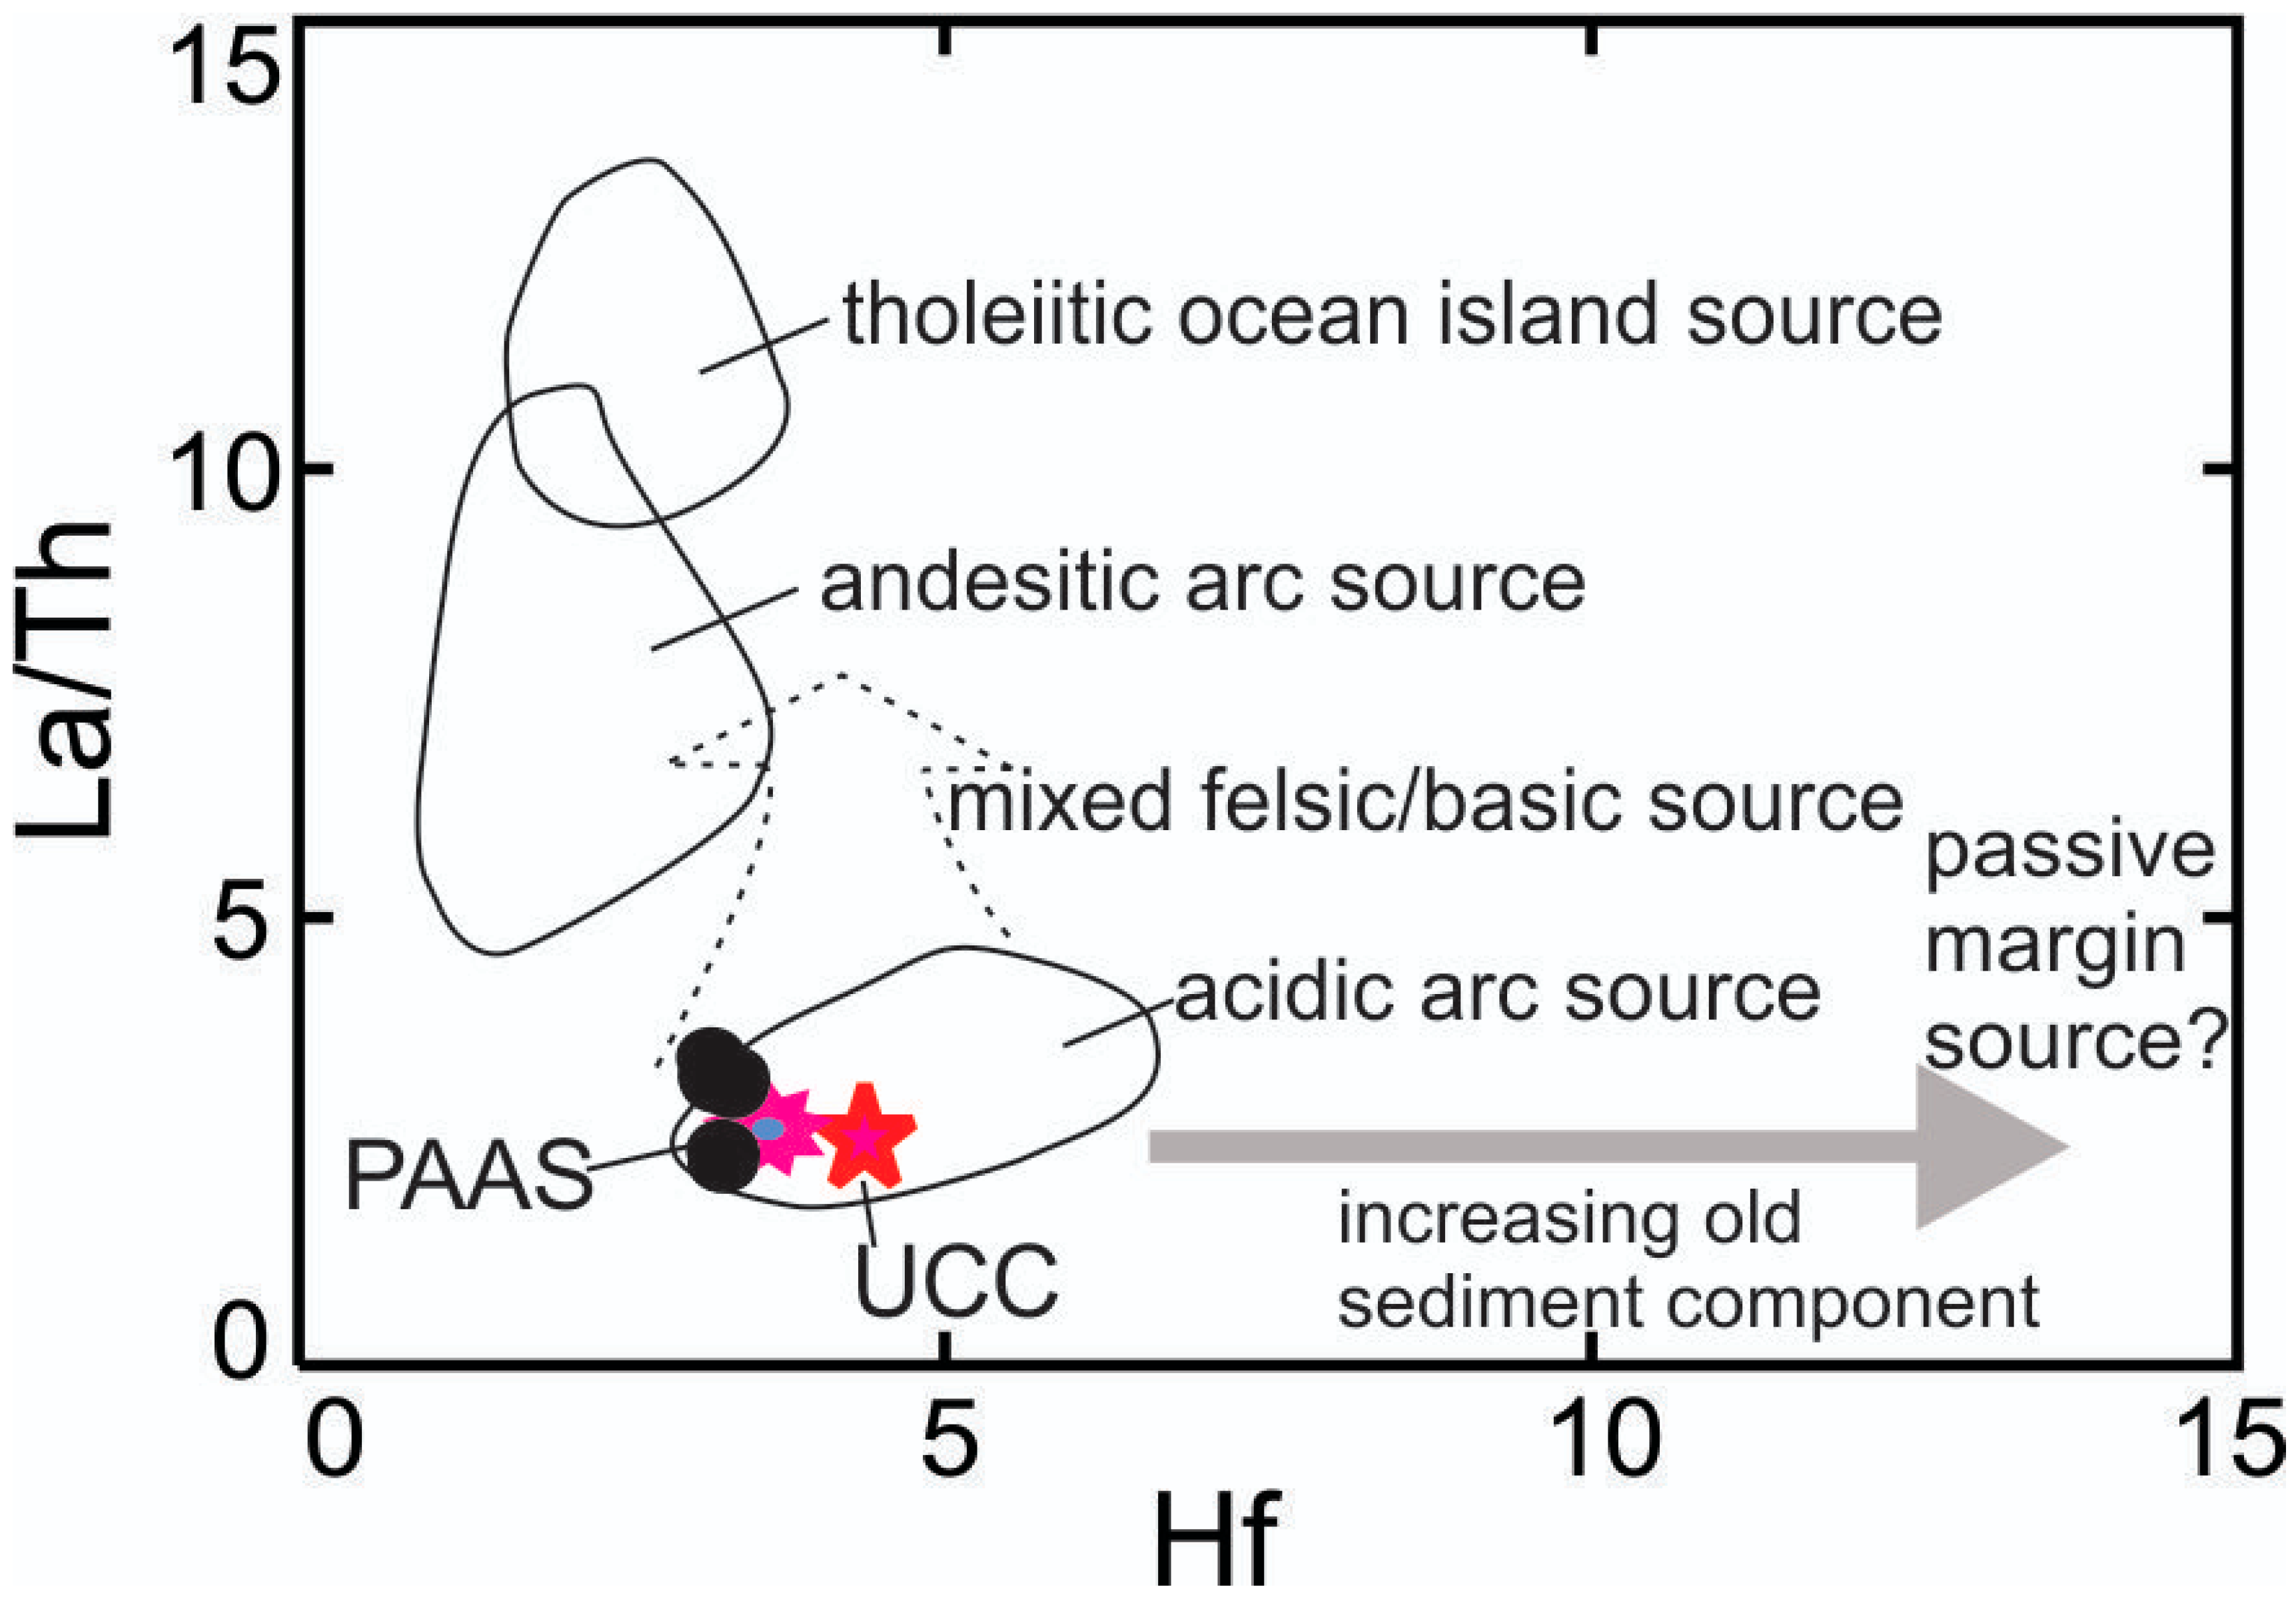
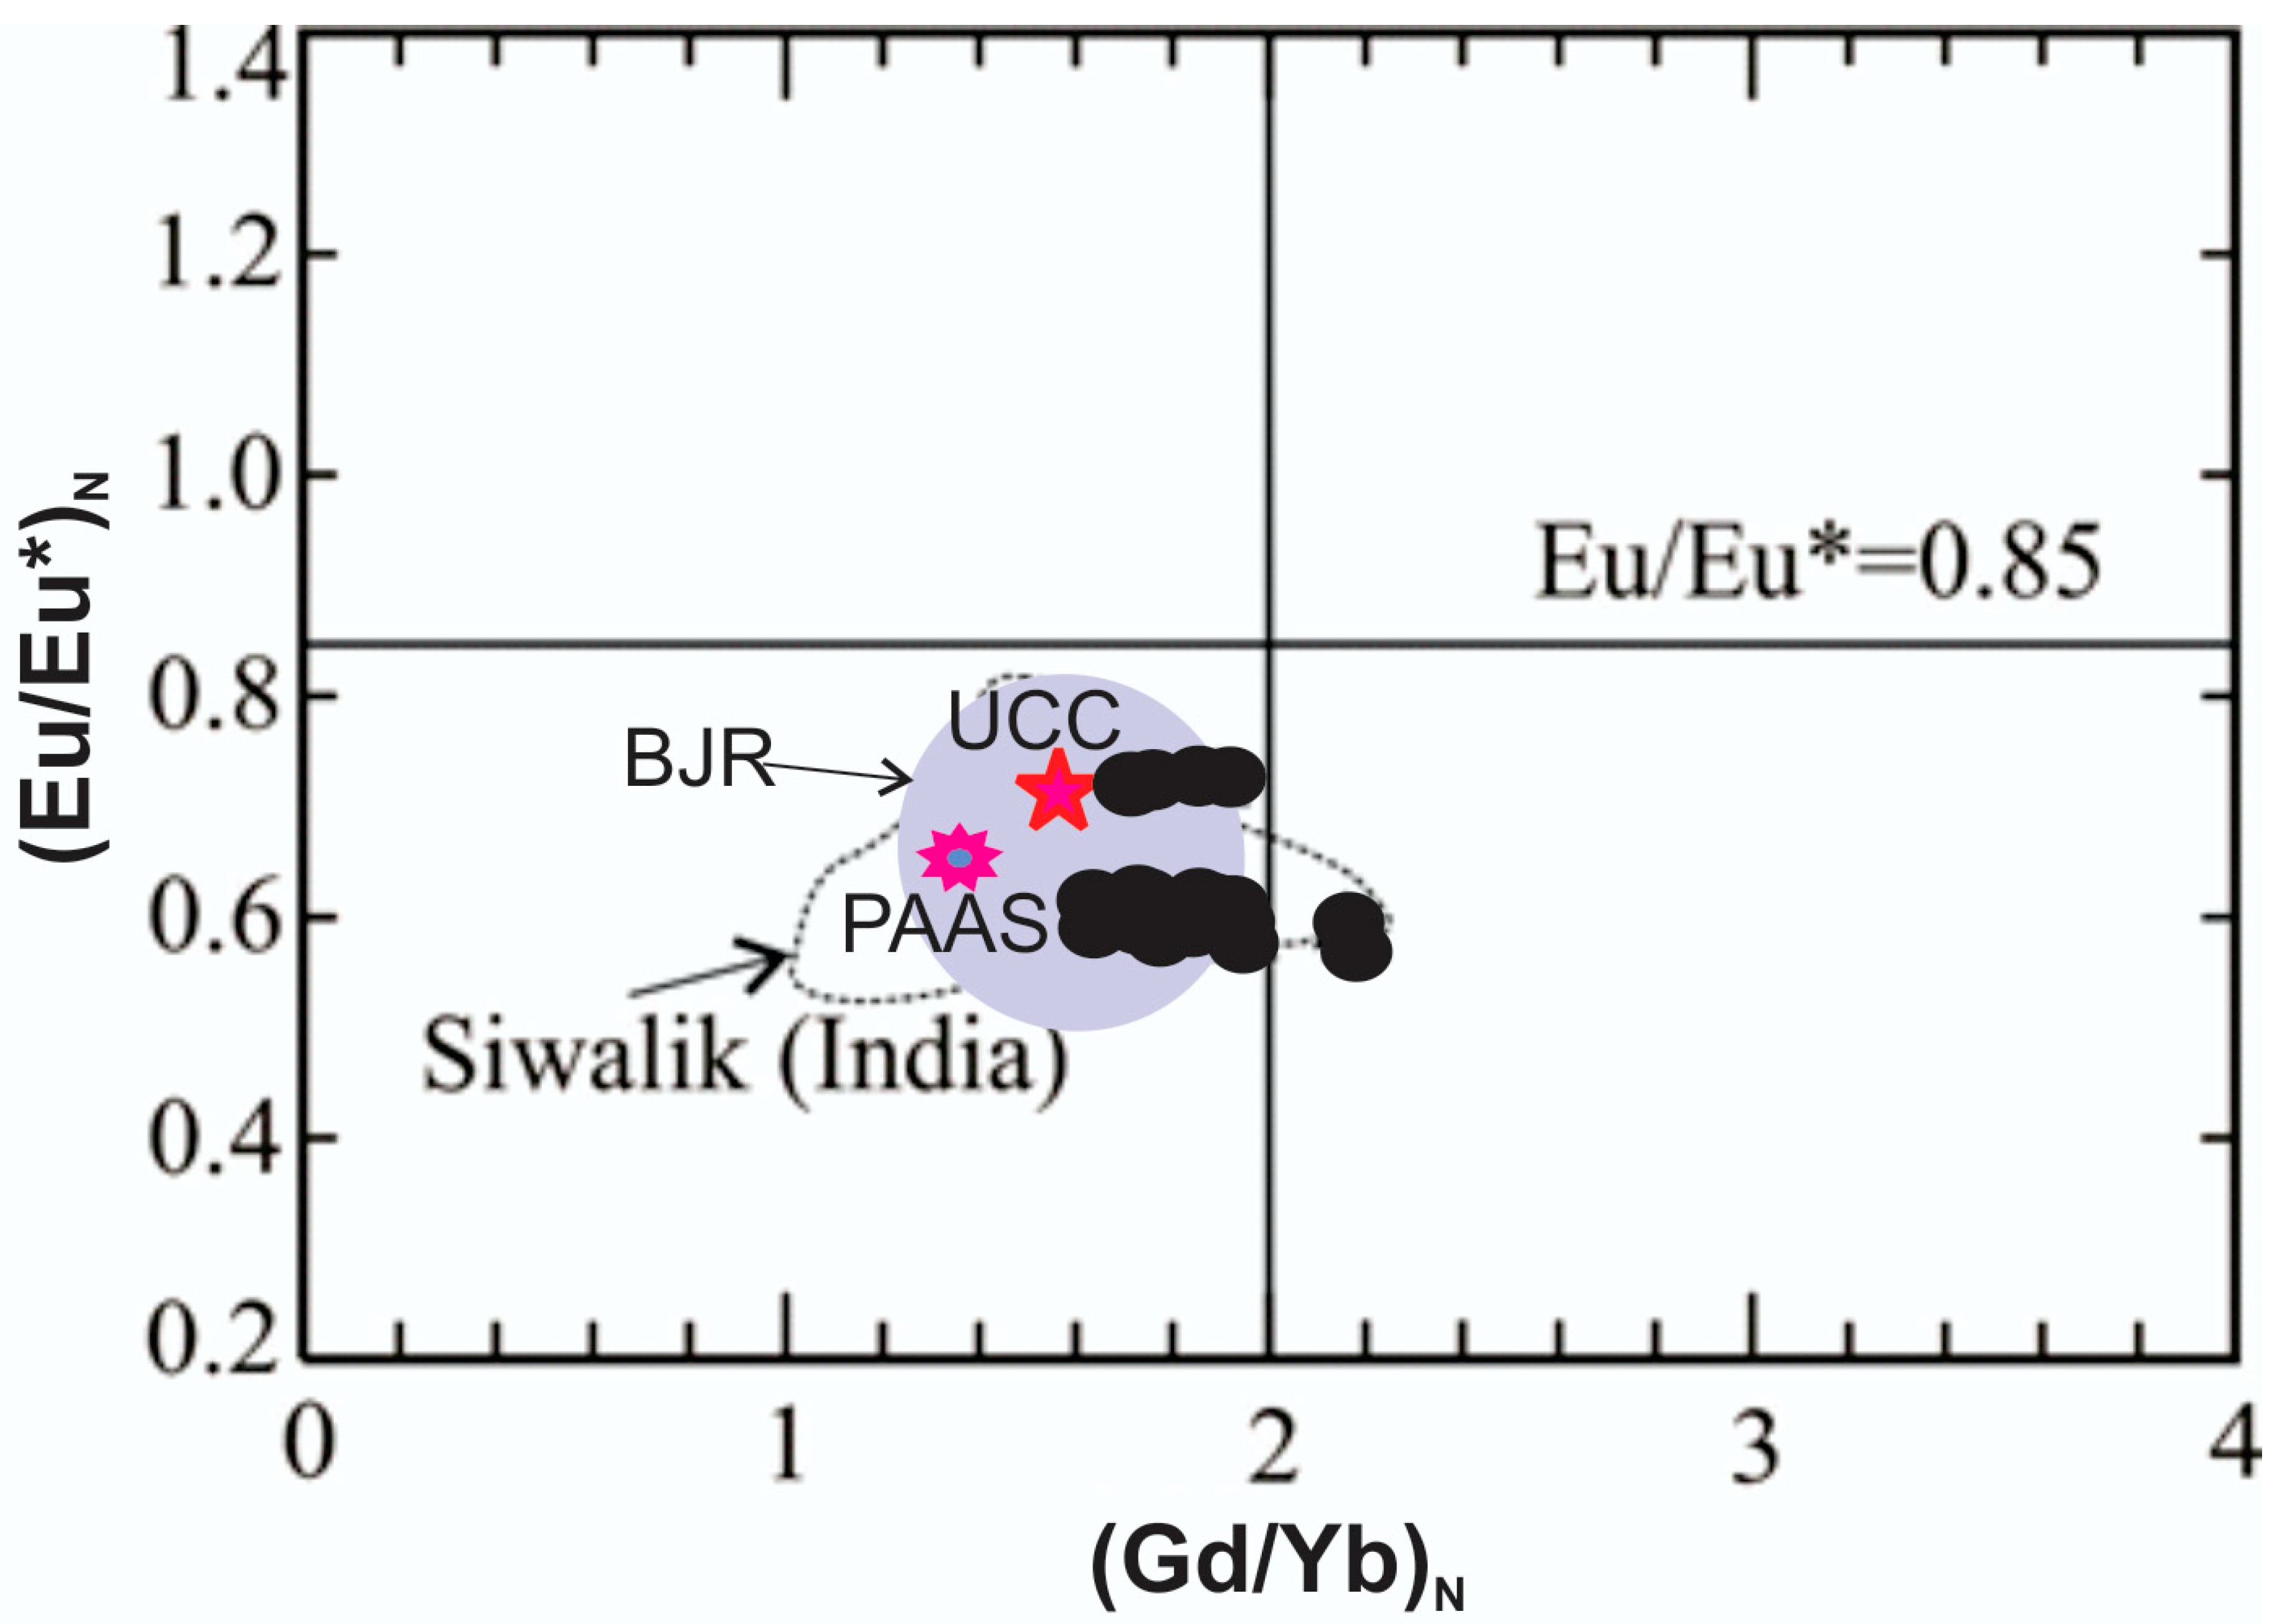
4.2.2. Trace and Rare Earth Elements

Elements that are considered relatively immobile during sedimentary processes include the rare earth elements (REE), the high field strength elements (HFSE - Zr, Hf, Y and Nb), some transition trace elements (Sc, Co, Cr and Ni), and Al, Ti and Th are useful for discriminating source area compositions. For example, the high field strength elements are preferentially partitioned into melts during crystallization and anatexis [44] and are enriched in felsic rocks compared to mafic rocks. Transition elements, on the other hand, are compatible in magmatic processes and are highly concentrated in mafic and ultramafic rocks. Ratios and plots of various elements such as La/Th vs. Hf, and Cr/Th vs. Th/Sc, and Th/Sc vs. Zr/Sc are useful in evaluating primary source compositions for sediments, in particular to distinguish between possible mafic and felsic sources, as they include both incompatible and compatible elements. Using element ratios also has the advantage of being independent of dilution effects, such as that produced by quartz in sediments.
Values of La/Sc, Th/Sc, La/Co, Th/Co, Cr/Th, Eu/Eu*, and (La/Yb)N, for the Brahmaputra River sediments (Table 2 and Table 3) were similar to values for sediments derived largely from intermediate felsic source rocks compared to equivalent ratios from mafic source rock regions [45,46]. For example, a plot of Th/Sc versus Zr/Sc (Figure 8) reveals compositions are clustered close to the primary igneous rock composition trend (PCT), midway between dacitic and rhyolitic compositions. The trend towards a potential mafic source also impacting the sediments is reasonable since the Himalaya comprises several lithotectonic belts, some of which contain ophiolites and intra-oceanic tholeiites [47]. The relative contribution of mafic material in the Brahmaputra sediments was examined using a plot of Th/Sc versus Cr/Th (Figure 9). A mixing model employing compositions from an average Phanerozoic granite (PG) [48] as the felsic end member and an average Nidar gabbro (NG) from the South Ladakh ophiolites (NW Himalaya, India) [47] as the mafic end member, was used to constrain the contribution of the mafic component. Although scattered, results indicated a 30%–40% contribution from mafic source material. The contribution of mafic components (e.g., lithic fragments and/or heavy minerals such as amphiboles, pyroxenes, garnets and ilmenite) in the Brahmaputra River sediments is logically explained by the previously noted presence of 30%–40% mafic minerals such as amphibole, epidote, pyroxene, ilmenite, garnet, olivine and biotite in the sands [16]. Furthermore, Datta and Subramanian [49] have pointed out that the majority of the heavy minerals of the Brahmaputra River sediments are supplied by high-rank metamorphic (40%–46%) and mafic igneous rocks (21%–29%). The correlation between ∑REE and Al2O3 and K2O contents of the Brahmaputra River sediment samples is poor (figure not illustrated), which suggests that distributions are mainly associated with heavy minerals [9]. The presence of pyrope garnet in the heavy fraction of Brahmaputra River sediment also indicates the presence of mafic igneous rocks in their provenance [49]. Moreover, the ferromagnesian trace elements (e.g., V, Cr and Ni) in sediments are widely used to separate mafic components over felsic source rocks [45,50,51] and the Brahmaputra River sediments exhibit enrichment of Cr and V in comparison to UCC which implies some contribution of mafic/ultramafic rocks from the source terrain. The high mafic component was consistent with predictions based on a ternary plot of V-Ni-(Th*10) showing fields representative for felsic, mafic and ultramafic rocks (Figure 10) i.e., the Brahmaputra samples all show extension toward a mafic source rock field. The Brahmaputra River sediments also exhibited low Hf contents (3.15–3.37 ppm) and La/Th ratios (typically < 4) plotting close to the UCC and PAAS fields within and along the boundary of acidic arc source to mixed felsic/basic source regions as defined by Floyd and Leveridge [42] and Gu et al. [52] (Figure 11).
The mean concentrations (in ppm) of Rb (~81), Sr (~254) and the RE elements Sm (~3.99) and Nd (~20) in the Brahmaputra River sediments were consistent with those in the Upper Himalaya sedimentary series [11] and close to UCC values. For the RE elements, chondrite-normalized patterns and associated europium anomalies of clastic sedimentary rocks are also used to provide important clues regarding the source rock composition. Mafic rocks show less fractionated chondrite-normalized patterns with low Light Rare Earth Element (LREE) to Heavy Rare Earth Element (HREE) ratios and zero to small Eu anomalies, whereas felsic rocks usually show fractionated chondrite normalized patterns with high LREE/HREE and negative Eu anomalies [55]. The Brahmaputra River samples showed fractionated chondrite normalized RE element patterns of enriched LREE and nearly flat HREE with small negative Eu anomalies (Figure 5) which suggest that these rocks were derived from felsic to intermediate rocks of the upper continental crust but with some contamination by a mafic component. On a (Eu/Eu*)N versus (Gd/Yb)N diagram (Figure 12), all the studied sediments from the Brahmaputra River plot in the field between (Gd/Yb)N ratios of 1.64–2.18 and (Eu/Eu*)N ratios of 0.57–0.71, indicating derivation from a depleted source.

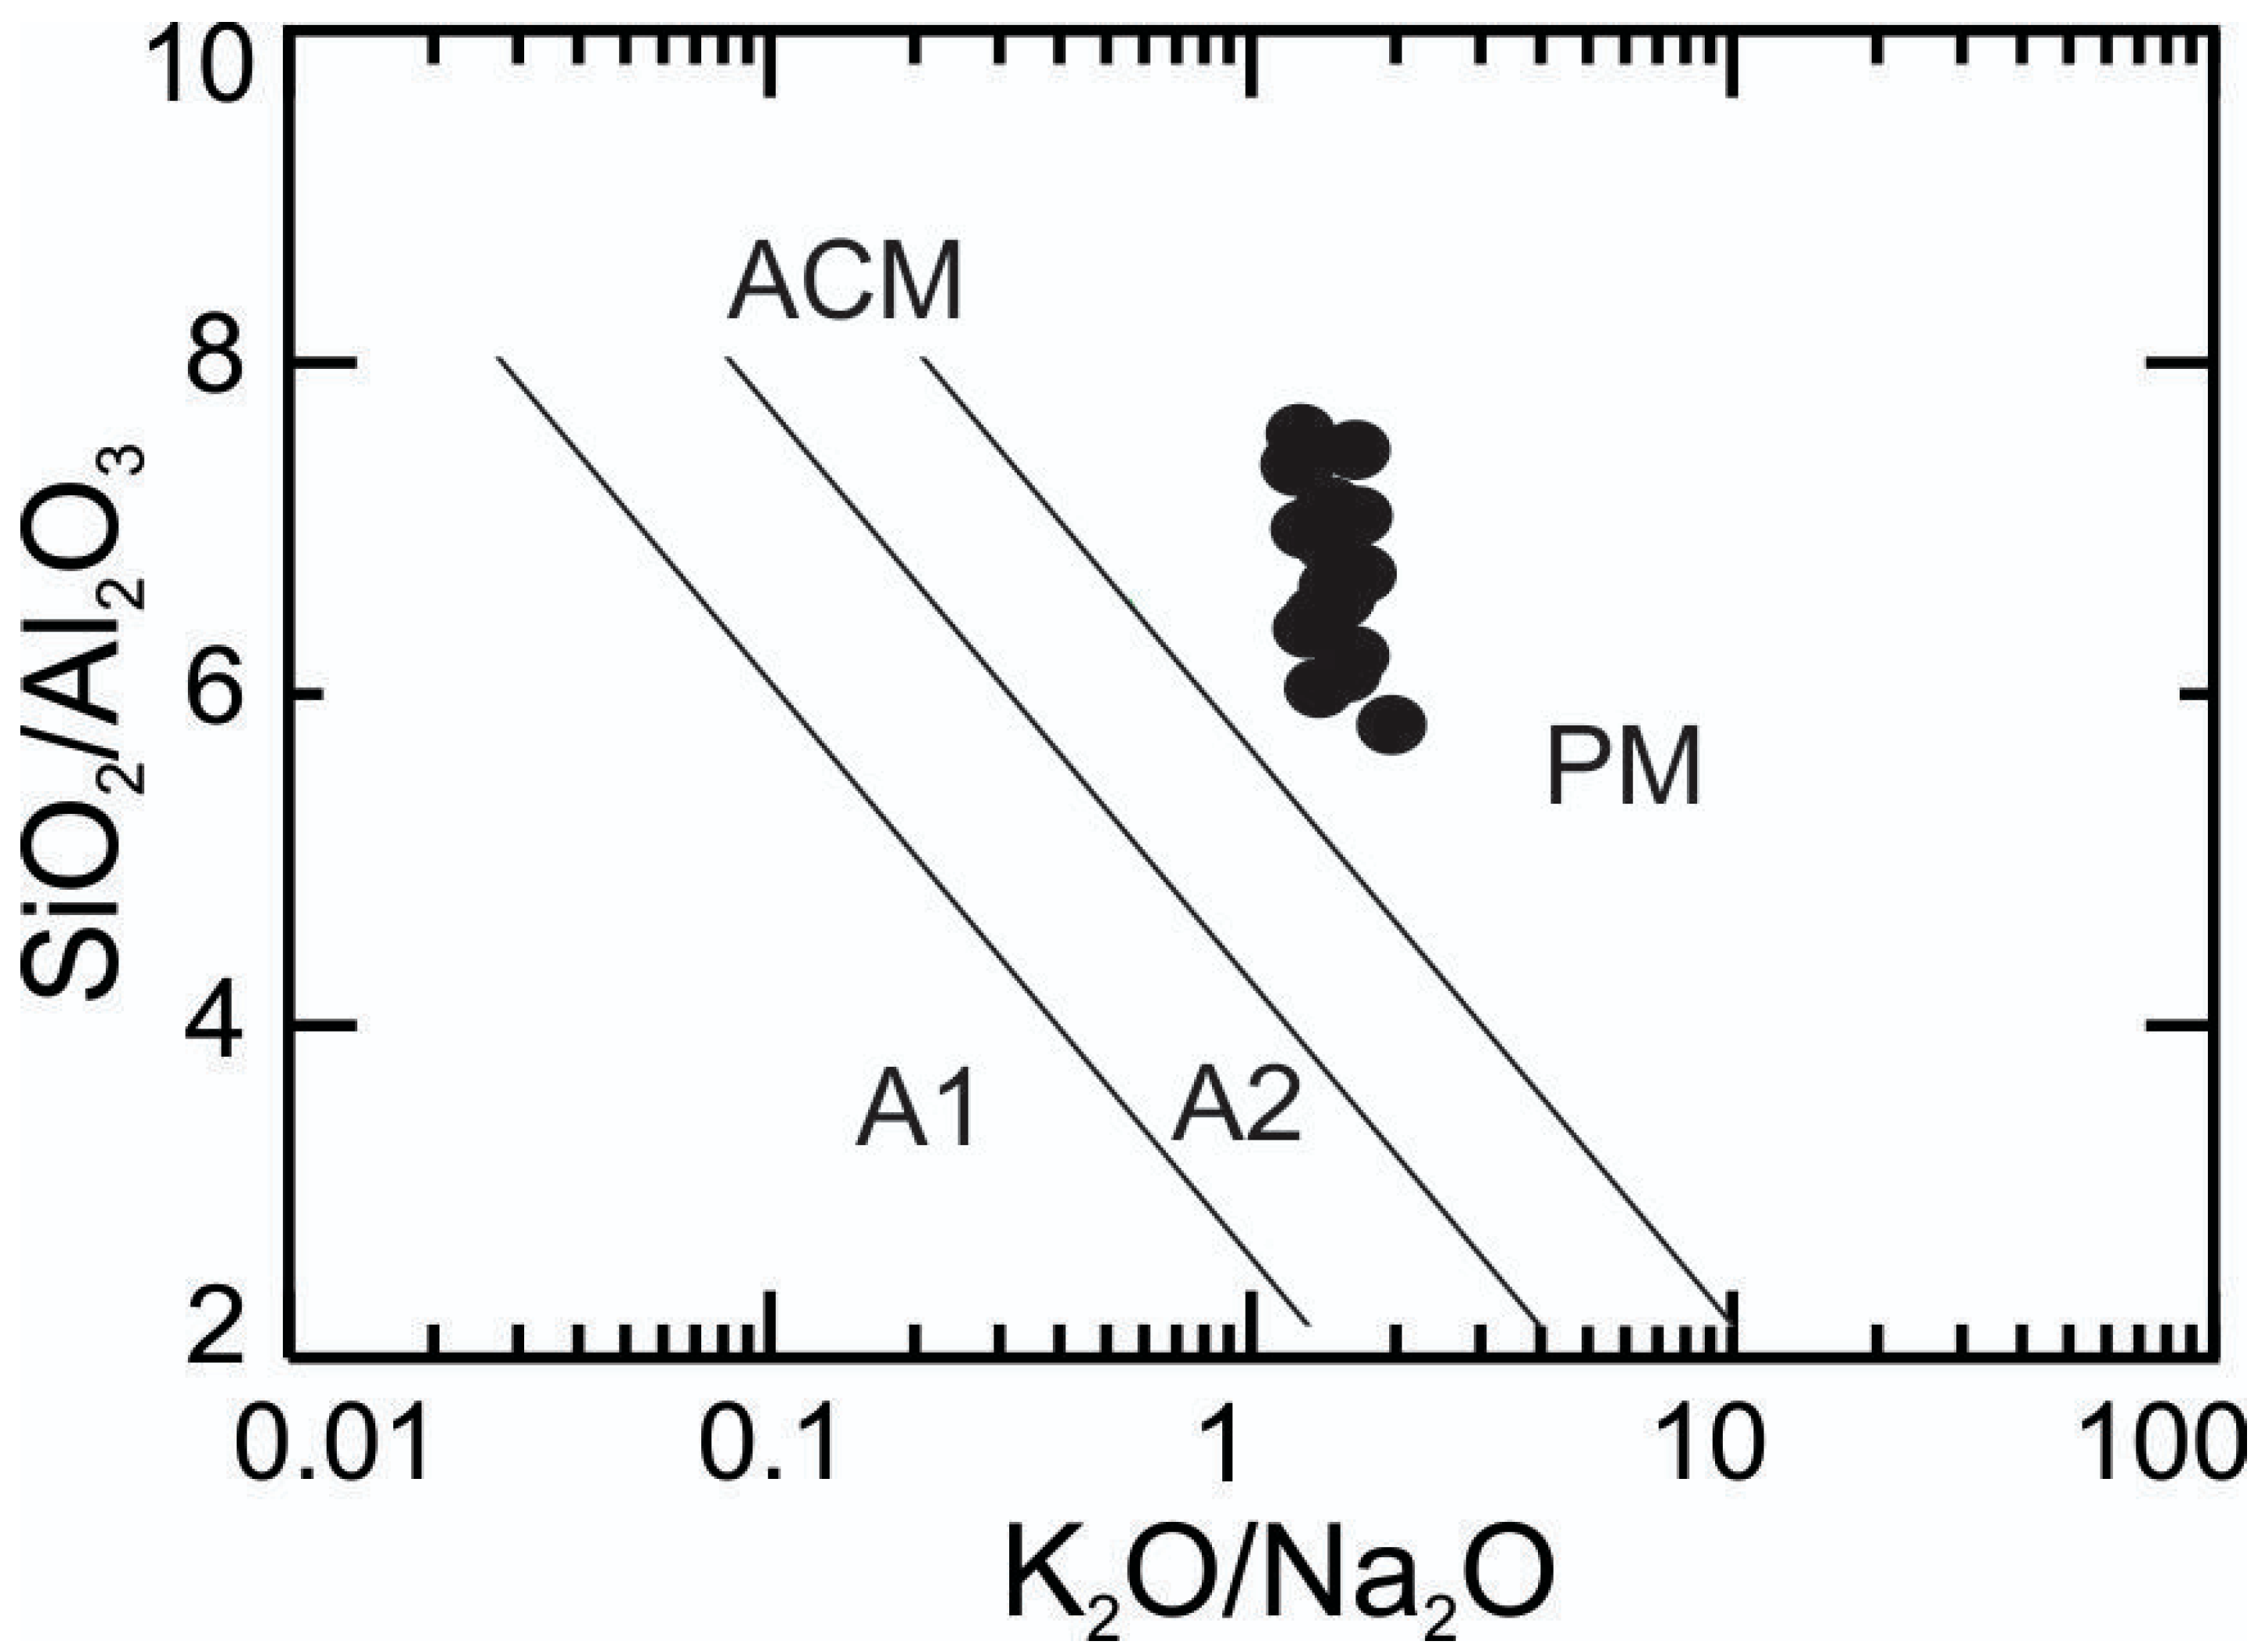
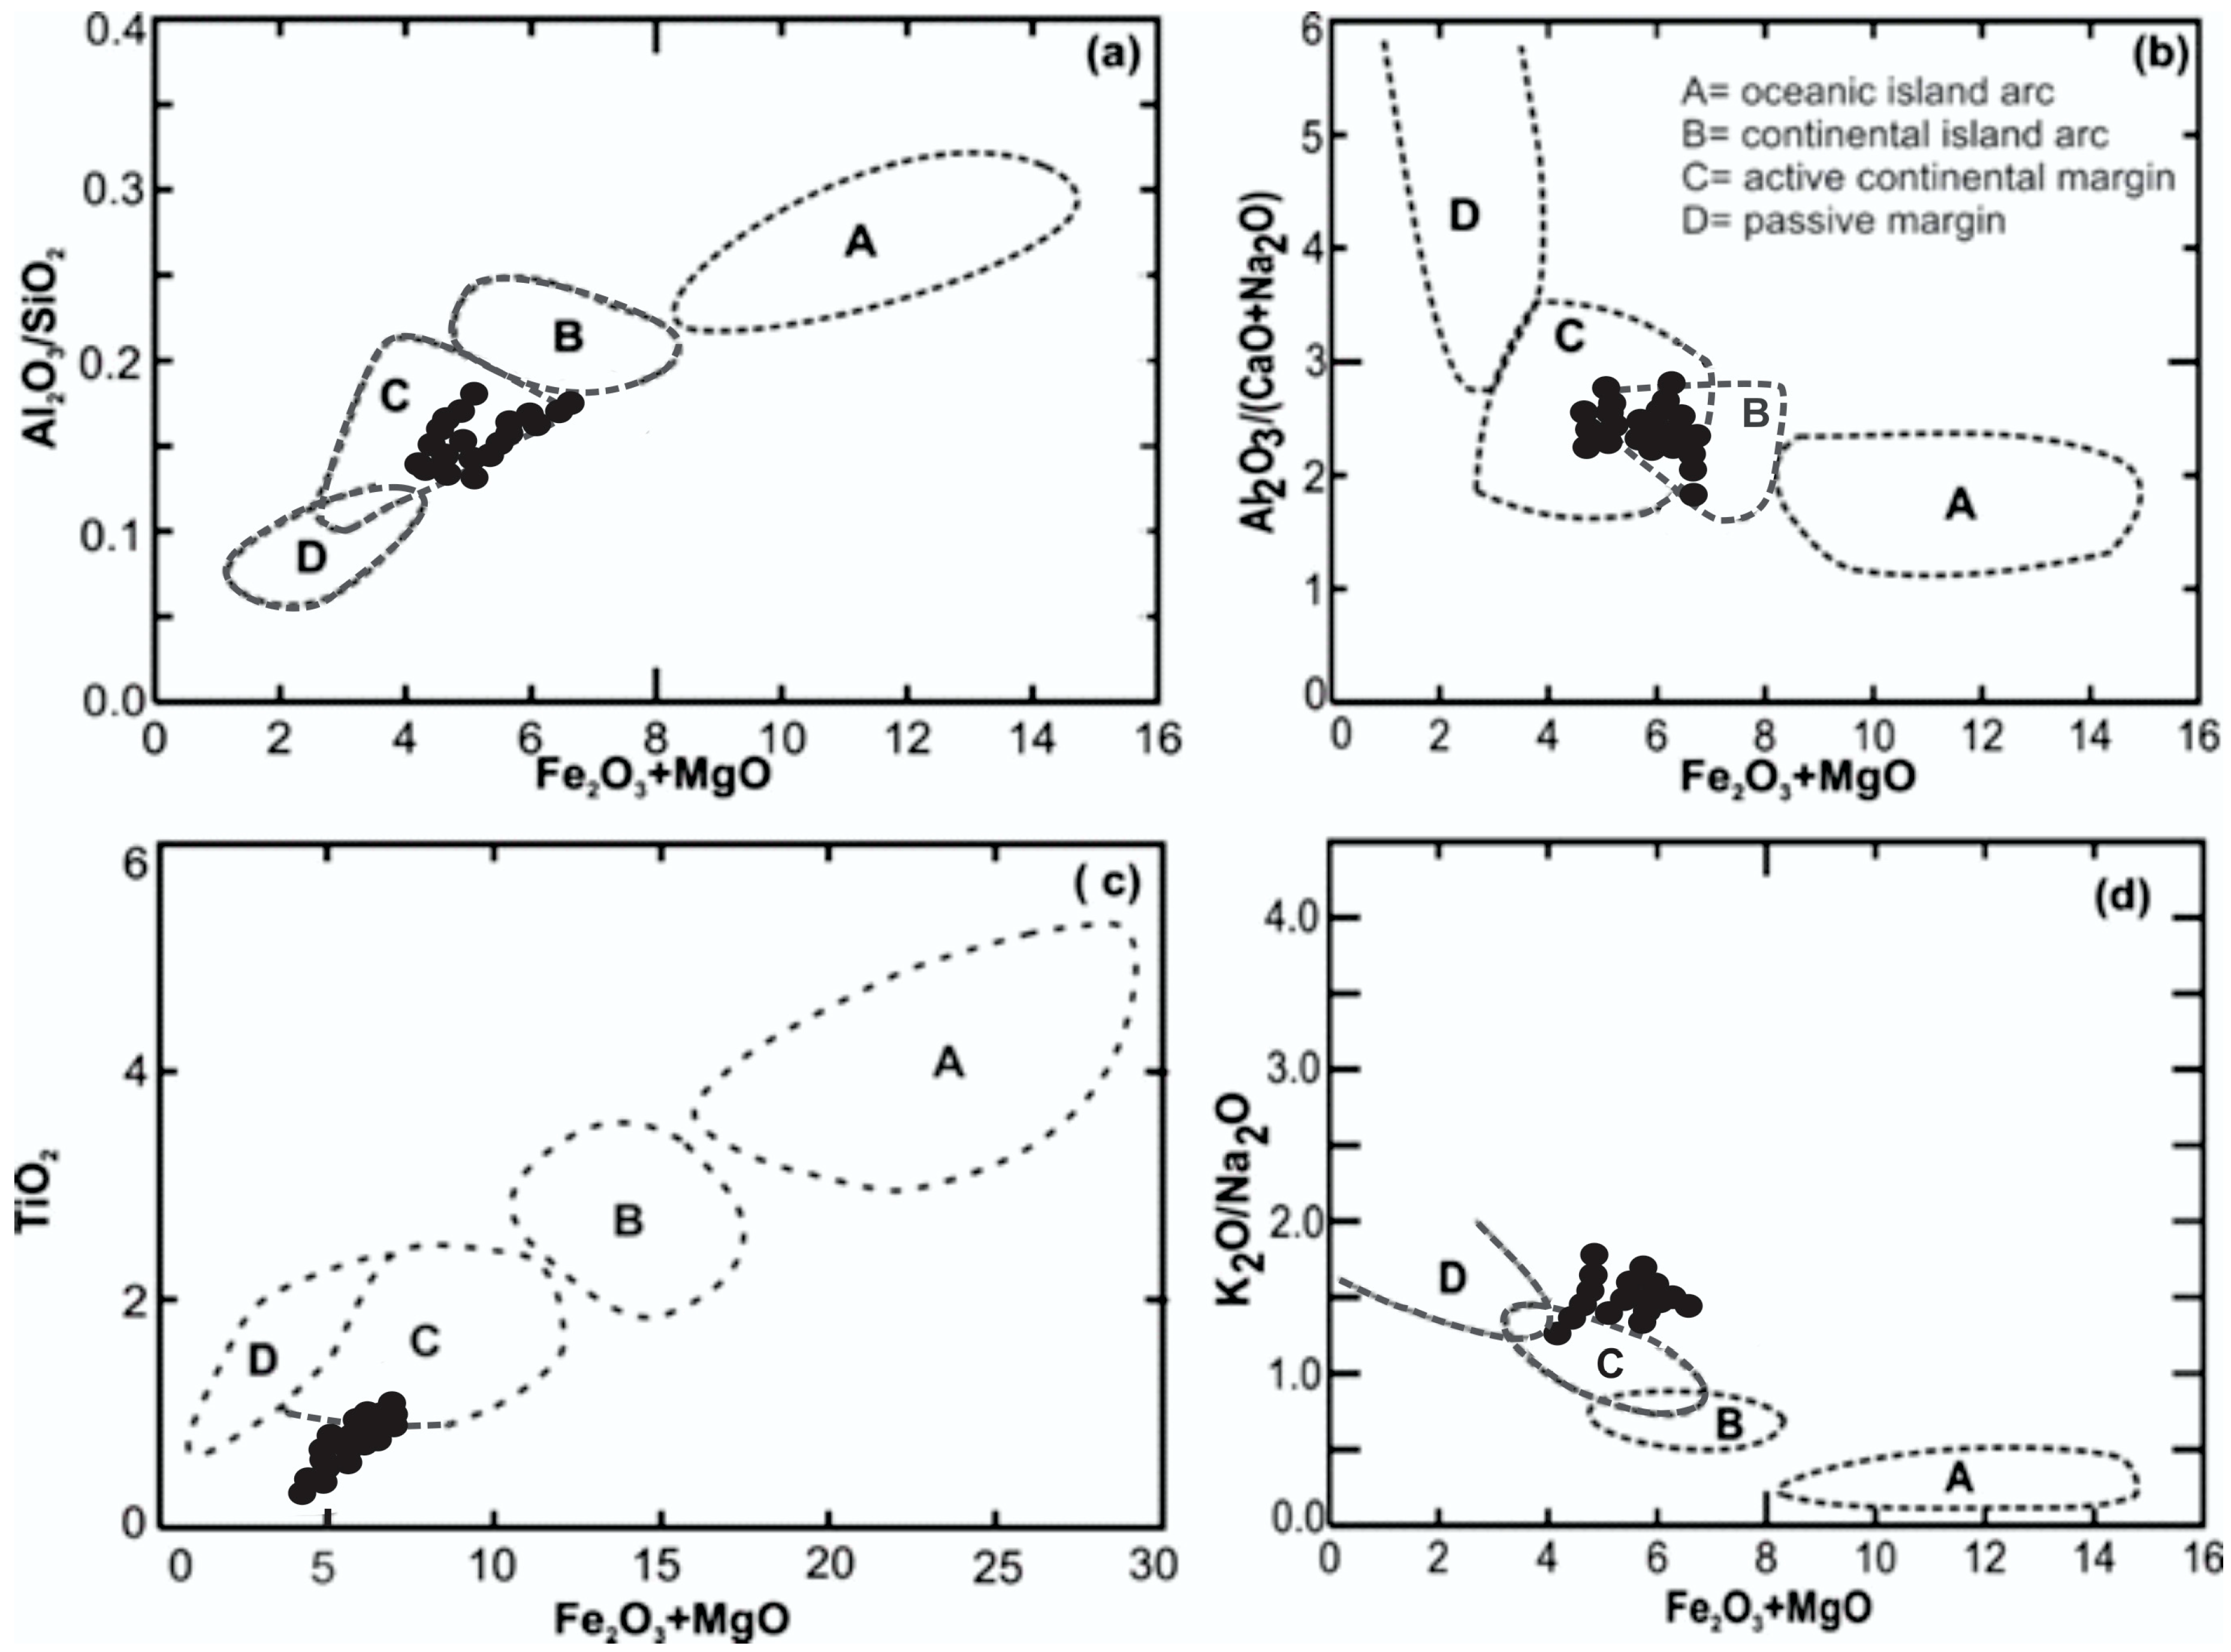
4.3. Tectonic Setting

Sedimentary rocks from different tectonic settings have varying geochemical characteristics and several authors have related the geochemistry of sandstone to specific tectonic environments [2,57,58]. Bivariate and multivariate plots of major oxide and trace-elements with discrimination functions are primarily used for determining tectonic settings of sedimentary basins.
On a log (K2O/Na2O) vs. SiO2 bivariate tectonic discrimination diagram, the Brahmaputra River sediments span the passive margin (PM) and active continental margin (ACM) fields with most samples clustered near the boundary separating the two fields (Figure 13). The plotted data indicated that the source rocks developed in regions with both passive and active continental margin characteristics. Further evidence for this interpretation was provided by the provenance discrimination diagram (Figure 6), which showed that the samples represented a recycled polycyclic quartzose sedimentary provenance. The tectonic and sedimentological information can be examined further using the tectonic setting discriminants proposed by Bhatia and Crook [57] and Roser and Korsch [58] using plots of SiO2/Al2O3 against log (K2O/Na2O) ratios (Figure 13). This type of plot is usually applied to arc (A1 and A2), active continental margin (ACM), and passive margin (PM) settings. In Figure 13, the sediments plot in the passive margin field, close to the active continental margin boundary line. Diagrams of (Fe2O3 + MgO) versus Al2O3/SiO2, Al2O3/(CaO + Na2O), TiO2 and K2O/Na2O show that most of the samples in this study fall within or near to the active continental margin field (Figure 14) with some samples plotting close to the continental island arc margin field (Figure 14b).

4.4. Source Area Weathering and Sediment Maturity

To evaluate the mineralogical maturity of the sediments, the Index of Compositional Variability (ICV) was used [59] while weathering intensities were determined using the Chemical Index of Alteration (CIA) from Nesbitt and Young [60] and the Plagioclase Index of Alteration (PIA) from Fedo et al. [61].

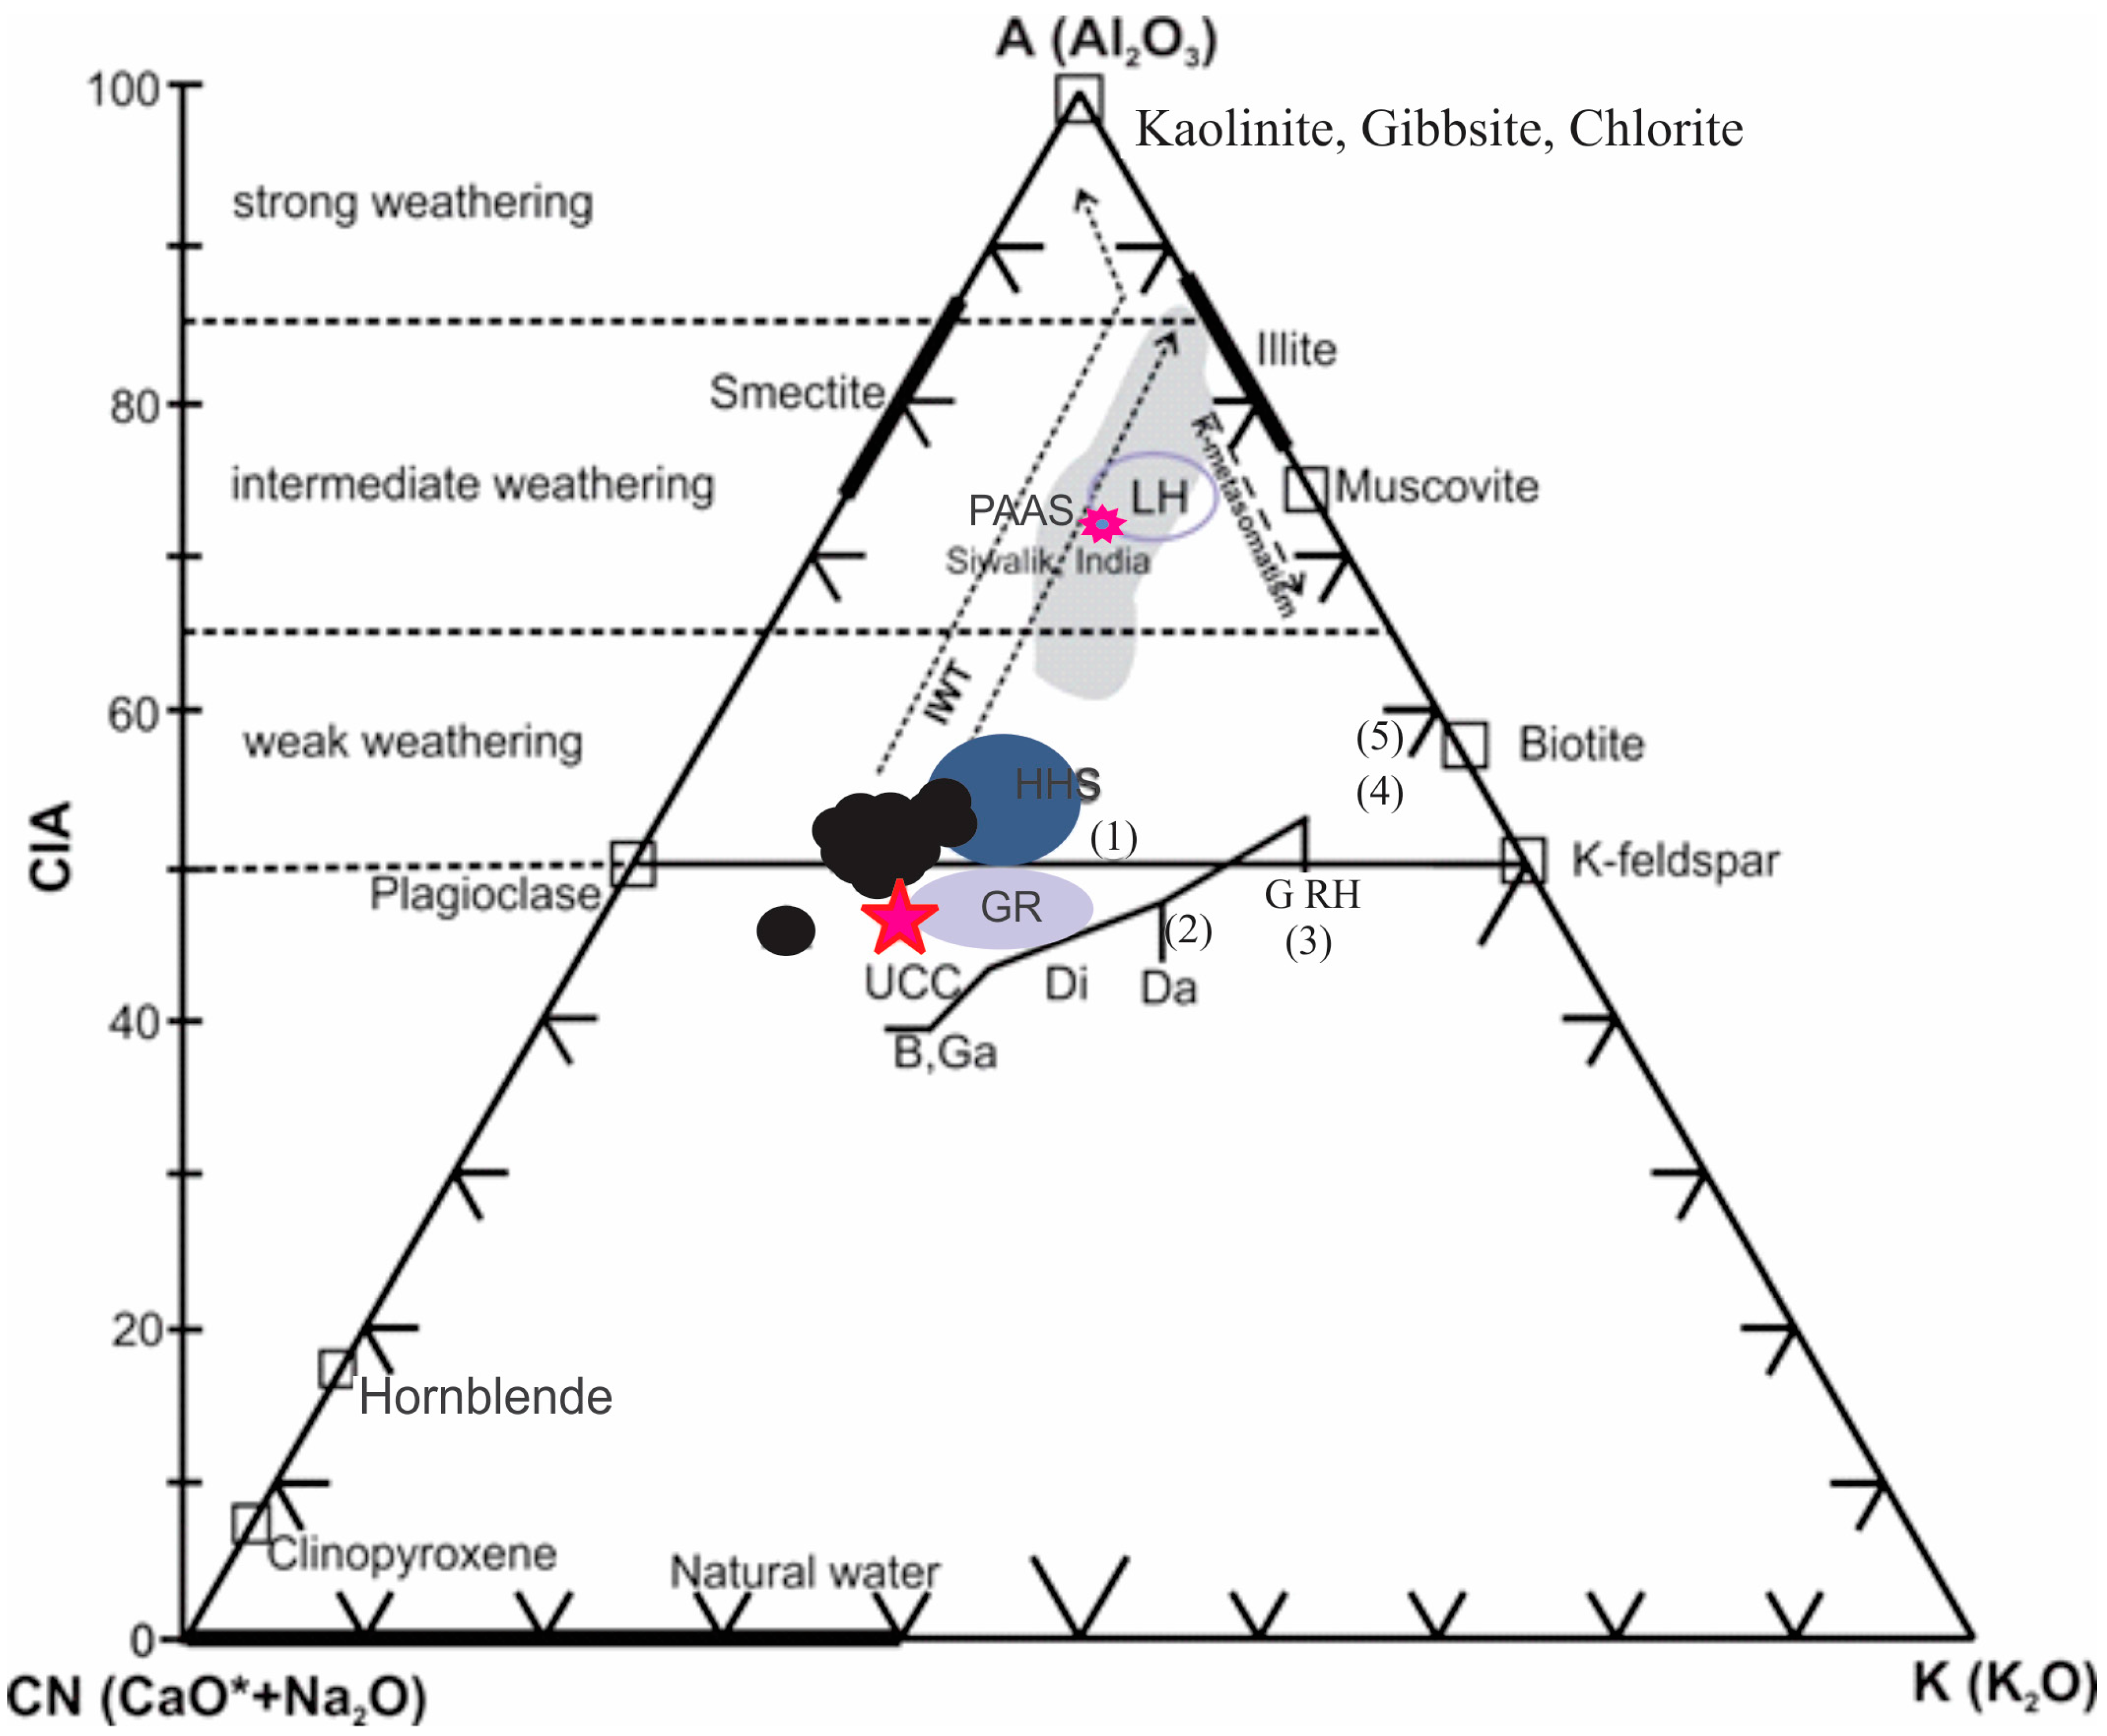
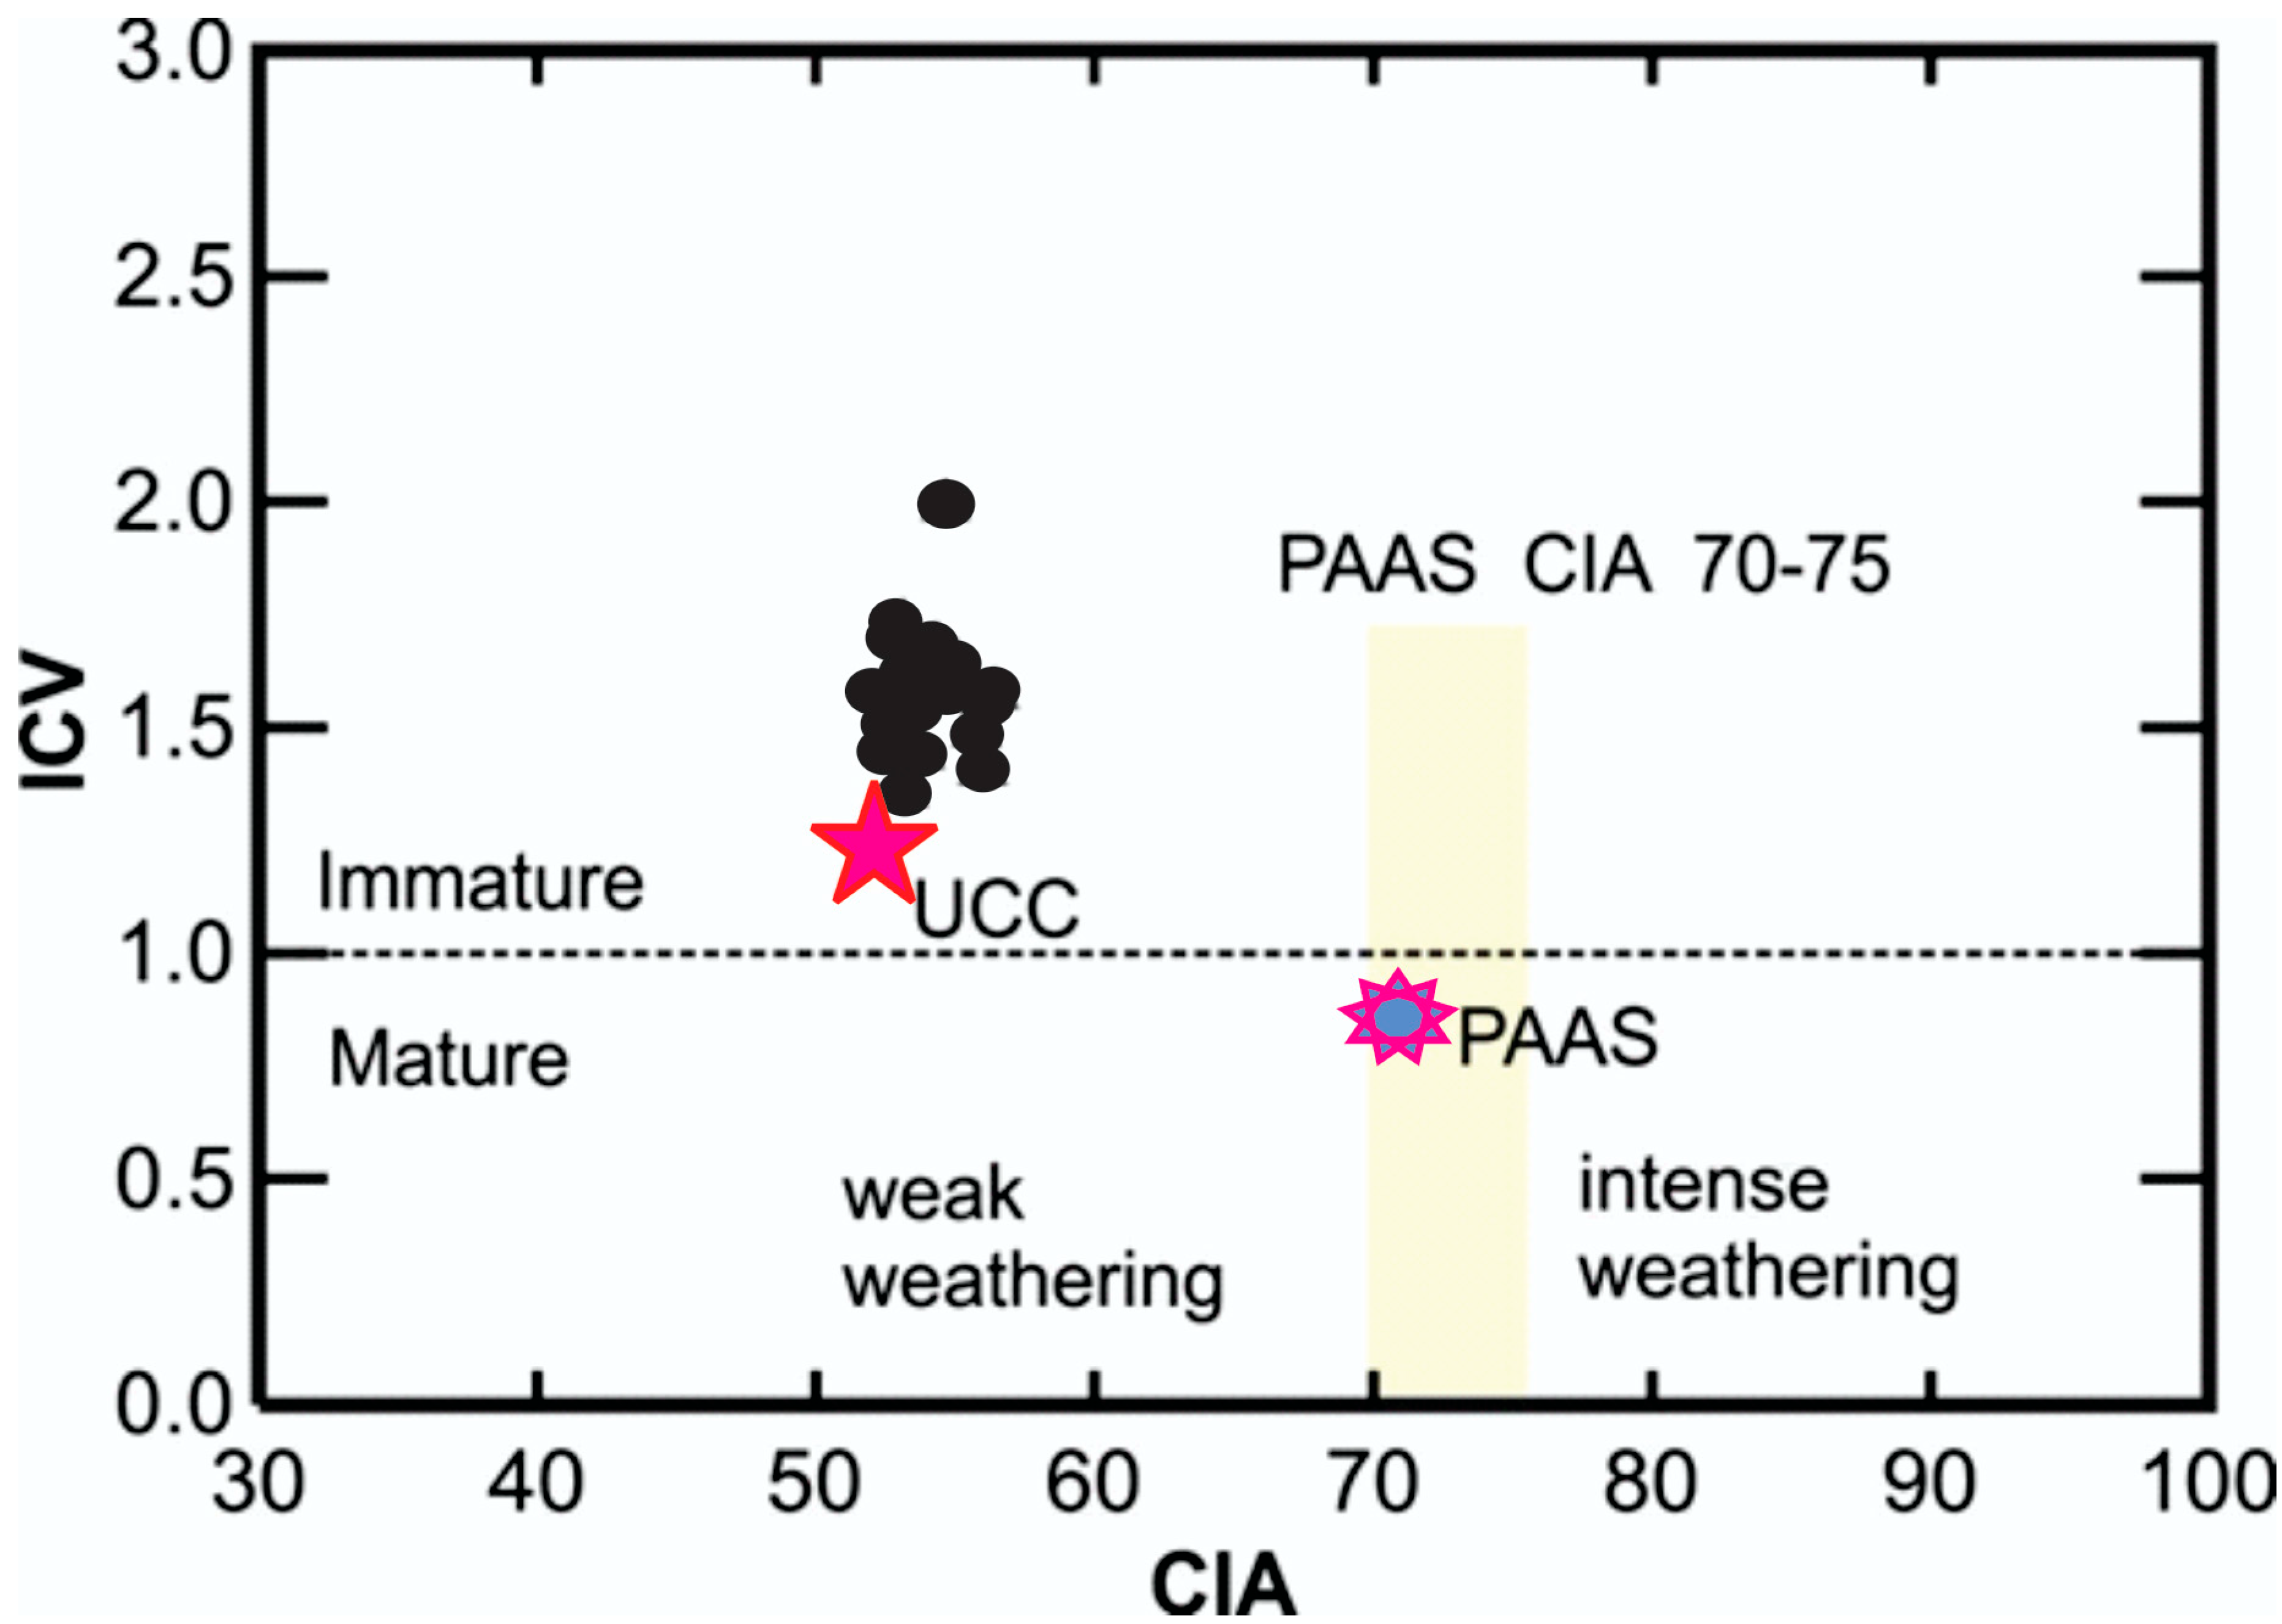
4.4.1. Weathering Indices CIA, ICV, CIW and PIA

The CIA values of the Brahmaputra River sediments varied from 52.51 to 56.43 with an average of 54.08 (Table 1), indicating the samples were derived from partially weathered materials or albitic feldspar-rich sources with low K mobility. The CIA of sediments is usually ~50 for first cycle sediments derived from weathered igneous rocks. The CIA tends to increase as chemical weathering intensifies and the proportion of residual clays such as illite, chlorite, kaolinite and gibbsite increases. Higher CIA values indicate intense weathering or recycling in humid and warm paleoclimatic conditions, reflected by the removal of labile cations (e.g., Ca, Na, K) relative to stable residual constituents such as Al and Ti. Conversely, low CIA values indicate limited or the near absence of chemical alteration, and consequently typically reflect cool and/or arid conditions. The Brahmaputra River CIA values fall between those of the Yamuna River System sediments in the Himalaya (~51 to 69; average ~60; [4]) and the Ganges River sediments (~48–55) in the southwestern Himalayas [13]. CIA values can also be plotted graphically on a Al2O3–(CaO+Na2O)–K2O (A–CN–K) diagram to more effectively evaluate weathering trends, the effects of K-metasomatism, the source composition of the clastic sediments, and tectonism [60,61,62,63,64,65]. Figure 15 shows the A-CN-K plot for the Brahmaputra River sediments with the plot also displaying potential parent source rocks from the Lesser and Higher Himalayas, detailed in the study of Singh [13]. The sediments plot near the plagioclase–K-feldspar join line, mostly close to the Higher Himalaya Source (HHS) field and close to UCC. This establishes that the source rocks have not undergone substantial chemical weathering, consistent with low clay contents. Further evidence for weak weathering comes from an assessment of the ICV. A plot of ICV versus CIA as shown in Figure 16 (after Long et al. [66]) indicated the Brahmaputra River sediments plot close to UCC and were only weakly affected by weathering, and, as a result, are compositionally immature.
Weathering effects can also be assessed in terms of the molecular percentage of the oxide components, using the chemical index of weathering (CIW). The CIA and CIW indices are interpreted similarly, with values of ~50 representing unweathered upper continental crust and values close to 100 for highly weathered materials—indicating complete removal of alkaline-earth and alkali elements [56]. The CIW values (Table 1) ranged between 61.52 and 68.01 with an average of 63.57, indicating low to moderate degrees of weathering of the source materials, in good agreement with the CIA. The intensity of the chemical weathering can also be estimated using the Plagioclase Index of Alteration (PIA). Unweathered plagioclase has a PIA value of 50. The PIA values for the studied samples varied from 53.62–59.75 averaging 55.80, indicating low to moderate degrees of weathering.

4.4.2. Element Ratios as Weathering Indices

Several authors [52,71,72] have used the Th/U ratio to decipher the weathering history of sediments, the ratio reflecting the degree of oxidation and loss of uranium during weathering. The Th/U ratio in most upper crustal rocks is typically between 3.5 and 4.0 indicating a relatively unweathered source [53] although according to Pe-Piper et al. [73], the precise value varies according to the local hinterland geology. The Th/U ratios of the Brahmaputra River samples range from 4.77 to 5.37, with an average of 4.82 indicating derivation from recycled crustal material.
The degree of the source-rock weathering can also be monitored by the Rb/Sr ratio in sediments. The Rb/Sr ratios of the Brahmaputra River sediments (Table 2) are in the range 0.03–0.59 (avg. 0.31), which is very close to the average Rb/Sr ratio for UCC (0.32) but lower than the average Rb/Sr ratio in post-Archean Australian shales (0.80). The Rb/Sr values in the studied sediment samples indicated low to moderate weathering in the source area. This finding is comparable to previous findings for the Miocene Surma Group sediments of the Bengal Basin [37] and Brahmaputra-Jamuna River sediments as discussed by Bhuiyan et al. [7].
Fractionation of Ce is recognized to occur during weathering and sedimentary processes [74]. In the primary stages of weathering, negative Ce anomalies are observed in weathering products such as secondary hydrous phosphates [75], and positive Ce anomalies are seen in intensely weathered lateritic profiles where soluble Ce3+ oxidizes to insoluble, thermodynamically stable Ce4+, and accumulating in minerals such as secondary cerianite, CeO2 [76]. The relatively low Ce anomalies in the Brahmaputra River sediments (Ce/Ce* = 0.75–0.90) (Table 2) suggest that the chemical weathering experienced by the sediments was not intensive.

4.5. Climate and Redox Conditions

Climate and rates of tectonic uplift control the degree of chemical weathering and an increase of chemical weathering intensity indicates a decrease in tectonic activity and/or a change of climate towards warm and humid conditions, which are more favorable for chemical weathering in the source region [77]. The Brahmaputra River sediments reflect low to moderate weathering conditions as determined from CIA, PIA, CIW and ICV indices (Table 1) and the near absence to only partial chemical alteration reflects cool and/or arid climate conditions [78].
Redox conditions are also important for identifying depositional environments in marine and/or non-marine sediments. Moreover, the accumulation of certain trace metals in sediments is directly or indirectly controlled by redox conditions through either a change in redox state and/or speciation [79]. For example, U/Th and Ni/Co ratios in sediments are reliable substitutions used to infer bottom water oxygenation conditions of the depositional environment [80,81,82]. A low U/Th ratio (<0.75) indicates oxic conditions, whereas high U/Th ratios (>1.25) indicate anoxic conditions [83]. The Brahmaputra River sediments displayed very low U/Th ratios (0.18–0.22, Table 2) indicating deposition in highly oxic environments. Similarly, Ni/Co ratios below 5.0 indicate oxic environments, whereas ratios above 5.0 suggest suboxic and anoxic environments [83]. The Brahmaputra River sediments showed high Ni/Co ratios (0.2–3.5; avg. 1.91, Table 2), confirming the sediments were deposited in oxic environments.
The trace elements V, Cr, Sc, U and Ni can also be used for the analysis of the redox conditions because these elements are least vulnerable to primary and secondary complications [84]. Uranium and vanadium enrichments are mainly coupled with anoxic to euxinic bottom-water conditions during deposition [85]. During early diagenetic alteration of sediments, V tends to mobilize from biogenic materials under oxic conditions, and a V/Cr ratio greater than 2.0 indicates anoxic conditions, whereas a value less than 2.0 suggests more oxidizing conditions [83]. The Brahmaputra River sediments demonstrate low V/Cr ratio (0.92–1.62; avg. 1.16, Table 2) indicating these sediments were deposited in oxidizing conditions. Similarly, V/Sc ratios below 9.1 indicate oxic depositional environments [86], and V/Sc ratios for the Brahmaputra River sediment samples were between 4.65 and 5.94 (avg. 5.34, Table 2) which indicates an oxic depositional environment.

5. Summary

Geochemical studies of major, trace and rare earth elements in sediments from the Brahmaputra River in northern Bangladesh were conducted to determine their provenance, compositional maturity, source area weathering and tectonic setting. The high concentration of SiO2 (72.9 wt.%) and low average Al2O3 (11.1 wt.%) content of the sediments was consistent with a low abundance of shale and/or clay components. All major oxides decreased as the silica content increased, and a negative linear relationship of SiO2 with Al2O3 indicated that the major element composition of the river sediments was controlled largely by the amount of quartz.
Compositionally, the sediments were classified as litharenites and based on the major, trace and RE chemistry. The Brahmaputra River sediments provided evidence of having been derived from the mixing of felsic to intermediate source rocks with a significant contribution (30%–40%) from mafic sources. The fractionated REE patterns showed enrichment in the LREE and flat HREE trends with negative Eu anomalies, indicating a highly differentiated source. The sediments had chemical affinities similar to mean compositions of upper crustal Higher Himalaya crystalline rocks but with contamination via mafic sources.
Low to intermediate weathering indices for all sediments indicated that the source rocks supplying the detrital load to the Brahmaputra River had not undergone significant chemical weathering. Low Al2O3/Na2O and K2O/Na2O ratios together with CIA values of ~52–56 indicated that physical weathering and erosion rather than silicate weathering was the dominant process. Evidence from tectonic discrimination diagrams indicated that the fluvial sediments in the Brahmaputra River were derived from rock types developed in a transitional tectonic setting ranging from ancient passive margin to an active continental margin. Deposition occurred under cool to semi-arid climatic conditions in an oxic environment.

Author Contributions

Conceptualization, M.A.R.; data curation, S.C.D.; funding acquisition, M.N.Z.; investigation, M.S.A.; supervision, J.T.; writing—review & editing, M.I.P. All authors have read and agreed to the published version of the manuscript.

Funding

The Director of BCSIR is thanked for providing financial support for Aminur Rahman to pursue a PhD in Australia and RMIT University is acknowledged for funding the PhD project through a university-funded postgraduate scholarship.

Acknowledgments

The authors gratefully acknowledge the generous support provided by the Honorable Minister, Ministry of Science and Technology, Bangladesh, and co-workers at BCSIR for assisting in the collection, preparation and analysis of samples.

Conflicts of Interest

The authors declare no conflict of interest.

References

  1. Morton, A.C.; Todd, S.P.; Haughton, P.D. Developments in Sedimentary Provenance Studies. Geol. Soc. Lond. Spec. Publ. 1991, 57, 360. [Google Scholar]
  2. Bhatia, M.R.; Crook, K.A.W. Trace element characteristics of graywackes and tectonic setting discrimination of sedimentary basins. Contrib. Miner. Petrol. 1986, 92, 181–193. [Google Scholar] [CrossRef]
  3. Basu, A. Influence of climatic and relief on compositions of sands released at source areas. In Provenance of Arenites; Zuffa, G.G., Ed.; NATO ASI Series (Series C: Mathematical and Physical Sciences); Springer: Dordrecht, The Netherlands, 1985; Volume 148, pp. 1–18. [Google Scholar]
  4. Dalai, T.K.; Krishnaswami, S.; Sarin, M.M. Major ion chemistry in the headwaters of the Yamuna river system: Chemical weathering, its temperature dependence and CO2 consumption in the Himalaya. Geochim. Cosmochim. Acta 2002, 66, 3397–3416. [Google Scholar] [CrossRef]
  5. Najman, Y. The detrital record of orogenesis: A review of approaches and techniques used in the Himalayan sedimentary basins. Earth Sci. Rev. 2006, 74, 1–72. [Google Scholar] [CrossRef]
  6. Hossain, H.M.Z.; Roser, B.P.; Kimura, J.-I. Petrography and whole-rock geochemistry of the Tertiary Sylhet succession, northeastern Bengal Basin, Bangladesh. Sedim. Geol. 2010, 228, 171–183. [Google Scholar] [CrossRef]
  7. Bhuiyan, M.A.H.; Rahman, M.J.J.; Dampare, S.B.; Suzuki, S. Provenance, tectonics and source weathering of modern fluvial sediments of the Brahmaputra–Jamuna River, Bangladesh: Inference from geochemistry. J. Geochem. Explor. 2011, 111, 113–137. [Google Scholar] [CrossRef]
  8. Roy, D.; Roser, B.P. Geochemistry of the Tertiary sequence in the Shahbajpur-1 well, Hatia Trough, Bengal Basin, Bangladesh: Provenance, source weathering and province affinity. J. Life Earth Sci. 2012, 7, 1–13. [Google Scholar] [CrossRef]
  9. Hossain, H.M.Z. Major, trace and REE geochemistry of the Meghna River sediments, Bangladesh: Constraints on weathering and provenance. Geol. J. 2019, 1–23. [Google Scholar] [CrossRef]
  10. Heroy, D.C.; Kuehl, S.A.; Goodbred, S.L. Mineralogy of the Ganges and Brahmaputra Rivers: Implications for river switching and Late Quaternary climate change. Sed. Geol. 2003, 155, 343–359. [Google Scholar] [CrossRef]
  11. France-Lanord, C.; Derry, L.; Michard, A. Evolution of the Himalaya since Miocene time: Isotopic and sedimentologic evidence from Bengal Fan. Geol. Soc. Lond. Spec. Publ. 1993, 74, 603–621. [Google Scholar] [CrossRef]
  12. Garzanti, E.; Doglioni, C.; Vezzoli, G.; Andò, S. Orogenic belts and orogenic sediment provenances. J. Geol. 2007, 115, 315–334. [Google Scholar] [CrossRef] [Green Version]
  13. Singh, P. Geochemistry and provenance of stream sediments of the Ganga River and its major tributaries in the Himalayan region, India. Chem. Geol. 2010, 269, 220–236. [Google Scholar] [CrossRef]
  14. Goodbred, S.L., Jr.; Youngs, P.M.; Ullah, M.D.S.; Pate, R.D.; Khan, S.R.; Kuehl, S.A.; Singh, S.K.; Rahaman, W. Piecing together the Ganges-Brahmaputra-Meghna river delta: Application of Sr sediment geochemistry to reconstruct river-channel histories and Holocene delta evolution. Geol. Soc. Am. Bull. 2014, 126, 1495–1510. [Google Scholar] [CrossRef]
  15. Rahman, A.; Pownceby, M.I.; Haque, N.; Bruckard, W.J.; Zaman, M.N. Characterisation of titanium-rich heavy mineral concentrates from the Brahmaputra river basin, Bangladesh. Appl. Earth Sci. 2014, 123, 222–233. [Google Scholar] [CrossRef]
  16. Rahman, A.; Pownceby, M.I.; Haque, N.; Bruckard, W.J.; Zaman, M.N. Valuable heavy minerals from the Brahmaputra river sands of Northern Bangladesh. Appl. Earth Sci. 2016, 125, 174–188. [Google Scholar] [CrossRef]
  17. Mukherjee, A.; Frayar, A.E.; Thomas, W.A. Geologic, geomorphic and hydrologic framework and evolution of the Bengal basin, India and Bang. J. Asian Earth Sci. 2009, 34, 227–244. [Google Scholar] [CrossRef]
  18. Goscombe, B.; Gray, D.; Hand, M. Crustal architecture of the Himalayan metamorphic front in eastern Nepal. Gondwana Res. 2006, 10, 232–255. [Google Scholar] [CrossRef]
  19. Valdiya, K.S. Emergence and evolution of Himalaya: Reconstructing history in the light of recent studies. Prog. Phys. Geography 2002, 26, 360–399. [Google Scholar] [CrossRef]
  20. Clark, M.K.; Bilham, R. Miocene rise of the Shillong Plateau and the beginning of the end for the Eastern Himalaya. Earth Planet. Sci. Lett. 2008, 269, 337–351. [Google Scholar]
  21. Coleman, J.M. Brahmaputra River: Channel processes and sedimentation. Sediment. Geol. 1969, 3, 129–239. [Google Scholar] [CrossRef]
  22. Bristow, C.S. Brahmaputra River: Channel migration and deposition. In Recent Developments in Fluvial Sedimentology; Ethridge, F.G., Flores, R.M., Harvey, M.D., Eds.; SEPM Special Publication: Tulsa, OK, USA, 1987; pp. 63–74. [Google Scholar]
  23. Islam, M.R.; Begum, S.F.; Yamaguchi, Y.; Ogawa, K. The Ganges and Brahmaputra rivers in Bangladesh: Basin denudation and sedimentation. Hydrol. Proc. 1999, 13, 2907–2923. [Google Scholar] [CrossRef]
  24. Jasy, J.B.; Rahman, M.J.J.; Yeasmin, R. Sand petrology of the exposed bar deposits of the Brahmaputra–Jamuna River, Bangladesh: Implications for provenance. Bang. Geosci. J. 2010, 16, 1–22. [Google Scholar]
  25. Chowdhury, M.A. Petrography of the sand samples of the Brahmaputra-Jamuna River bars. Geol. Surv. Bangladesh 1989, 5, 1–20. [Google Scholar]
  26. Garzanti, E.; Andó, S.; France-Lanord, C.; Censi, P.; Vignola, P.; Galy, V.; Lupker, M. Mineralogical and chemical variability of fluvial sediments 2. Suspended-load silt (Ganga Brahmaputra, Bangladesh). Earth Planet. Sci. Lett. 2011, 302, 107–120. [Google Scholar] [CrossRef]
  27. Kimura, J.-I.; Takaku, Y.; Yoshida, T. Igneous rock analysis using ICP-MS with internal standardization, isobaric ion overlap correction, and standard addition methods. Sci. Rep. Fukushima Univ. 1995, 56, 1–12. [Google Scholar]
  28. Thomsen, V.; Schatzlein, D.; Mercuro, D. Limits of detection in spectroscopy. Spectroscopy 2003, 18, 112–114. [Google Scholar]
  29. Elliot, S.; Knowles, M.; Kalinitchenko, I. A new direction in ICP-MS. Spectroscopy 2004, 19, 30–38. [Google Scholar]
  30. Taylor, S.R.; McLennan, S.M. The Continental Crust: Its Composition and Evolution. An Examination of the Geochemical Record Preserved in Sedimentary Rocks; Blackwell Science: Oxford, UK, 1985; p. 312. [Google Scholar]
  31. McLennan, S.M. Relationships between the trace element composition of sedimentary rocks and upper continental crust. Geochem. Geophys. Geosyst. 2001, 2. [Google Scholar] [CrossRef]
  32. Rudnick, R.L.; Gao, S. Composition of the continental crust. In The Crust Treatise on Geochemistry; Rudnick, R.L., Ed.; Elsevier-Pergamon: Oxford, UK, 2003. [Google Scholar]
  33. Herron, M.M. Geochemical classification of terrigenous sands and shales from core or log data. J. Sed. Petrol. 1988, 58, 820–829. [Google Scholar]
  34. Pettijohn, F.J.; Potter, P.E.; Siever, R. Sand and sandstones. In Late Miocene Environmental Change in Nepal and the Northern Indian Subcontinent: Stable Isotopic Evidence From Paleosols; Quade, J., Cater, J.M.L., Ojha, T.P., Adam, J., Harrison, T.M., Eds.; GSA Bulletin, 107; Springer: New York, NY, USA, 1995; pp. 1381–1397. [Google Scholar]
  35. Boggs, S. Principles of Sedimentology and Stratigraphy: International Edition, 4th ed.; Pearson Prentice-Hall: Upper Saddle River, NJ, USA, 2006. [Google Scholar]
  36. Fairbridge, R.W. The Encyclopedia of Geochemistry and Environmental Sciences; Van Nostrand Reinhold Company: New York, NY, USA, 1972; p. 1344. [Google Scholar]
  37. Rahman, M.J.J.; Suzuki, S. Geochemistry of sandstones from the Miocene Surma Group, Bengal Basin, Bangladesh: Implication for provenance, tectonic setting and weathering. Geochem. J. 2007, 41, 415–428. [Google Scholar] [CrossRef] [Green Version]
  38. Roser, B.P.; Korsch, R.J. Provenance signatures of sandstone-mudstone suites determined using discrimination function analysis of major-element data. Chem. Geol. 1988, 67, 119–139. [Google Scholar] [CrossRef]
  39. Ranjan, N.; Bannerjee, D.M. Central Himalayan crystallines as the primary source for the sandstone–mudstone suites of the Siwalik Group: New geochemical evidence. Gondwana Res. 2009, 16, 687–696. [Google Scholar] [CrossRef]
  40. Keskin, S. Geochemistry of Çamardı Formation sediments, central Anatolia (Turkey): Implication of source area weathering, provenance, and tectonic setting. Geosci. J. 2011, 15, 185–195. [Google Scholar] [CrossRef]
  41. Hayashi, K.; Fujisawa, H.; Holland, H.D.; Ohmoto, H. Geochemistry of 1.9 Ga sedimentary rocks from northeastern Labrador, Canada. Geochim. Cosmochim. Acta 1997, 61, 4115–4137. [Google Scholar] [CrossRef]
  42. Floyd, P.A.; Leveridge, B.E. Tectonic environment of the Devonian Gramscatho basin, south Cornwall; framework mode and geochemical evidence from turbiditic sandstones. J. Geol. Soc. Lond. 1987, 144, 531–542. [Google Scholar] [CrossRef]
  43. Shaw, D.M. A review of K-Rb fractionation trends by covariance analysis. Geochim. Cosmochim. Acta 1968, 32, 573–602. [Google Scholar] [CrossRef]
  44. Feng, R.; Kerrich, R. Geochemistry of fine-grained clastic sediments in the Archean Abitibi greenstone belt, Canada: Implications for provenance and tectonic setting. Geochim. Cosmochim. Acta 1990, 54, 1061–1081. [Google Scholar] [CrossRef]
  45. Cullers, R.L. The geochemistry of shales, siltstones and sandstones of Pennsylvanian-Permian age, Colorado, USA: Implications for provenance and metamorphic studies. Lithos 2000, 51, 181–203. [Google Scholar] [CrossRef]
  46. Cullers, R.L.; Podkovyrov, V.N. Geochemistry of the Mesoproterozoic Lakhanda shales in southeastern Yakutia, Russia: Implications for mineralogical and provenance control, and recycling. Precambrian Res. 2000, 104, 77–93. [Google Scholar] [CrossRef]
  47. Maheo, G.; Bertrand, H.; Guillot, S.; Villa, I.M.; Keller, F.; Capiez, P. The South Ladakh ophiolites (NW Himalaya, India): An intra-oceanic normalized arc origin with implication for the closure of the Neo-Tethys. Chem. Geol. 2004, 203, 273–303. [Google Scholar] [CrossRef]
  48. Condie, K.C. Chemical composition and evolution of the upper continental crust: Contrasting results from surface samples and shales. Chem. Geol. 1993, 104, 1–37. [Google Scholar] [CrossRef]
  49. Datta, D.K.; Subramanian, V. Texture and mineralogy of sediments from the Ganges-Brahmaputra-Meghna river system in the Bengal Basin, Bangladesh and their environmental implications. Environ. Geol. 1997, 30, 181–188. [Google Scholar] [CrossRef]
  50. Hossain, H.M.Z.; Kawahata, H.; Roser, B.P.; Sampei, Y.; Manaka, T.; Otani, S. Geochemical characteristics of modern river sediments in Myanmar and Thailand: Implications for provenence and weathering. Chem. Erde 2017, 77, 443–458. [Google Scholar] [CrossRef]
  51. Garver, J.I.; Royce, P.R.; Smick, T.A. Chromium and nickel in shale of the Taconic foreland: A case study for the provenance of fine-grained sediments with an ultramafic source. J. Sedimentary Res. 1996, 66, 100–106. [Google Scholar]
  52. Gu, X.X.; Liu, J.M.; Zheng, M.H.; Tang, J.X.; Qt, L. Provenance and tectonic setting of the Proterozoic turbidites in Hunan, South China: Geochemical Evidence. J. Sed. Res. 2002, 72, 393–407. [Google Scholar] [CrossRef]
  53. McLennan, S.M.; Hemming, S.; McDaniel, D.K.; Hanson, G.N. Geochemical approaches to sedimentation, provenance and tectonics. Geol. Soc. Am. Spec. Pap. 1993, 285, 21–40. [Google Scholar]
  54. Roser, B.P.; Korsch, R.J. Geochemical characterization, evo-lution and source of a Mesozoic accretionary wedge: The Torlesse terrane, New Zealand. Geol. Mag. 1999, 136, 493–512. [Google Scholar] [CrossRef]
  55. Cullers, R.L. The controls on the major and trace element variation of shales, siltstones, and sandstones of Pennsylvanian–Permian age from uplifted continental blocks in Colorado to platform sediment in Kansas, USA. Geochim. Cosmochim. Acta 1994, 58, 4955–4972. [Google Scholar] [CrossRef]
  56. McLennan, S.M. Weathering and global denudation. J. Geol. 1993, 101, 295–303. [Google Scholar] [CrossRef]
  57. Bhatia, M.R. Plate tectonics and geochemical composition of sandstones. J. Geol. 1983, 91, 611–627. [Google Scholar] [CrossRef]
  58. Roser, B.P.; Korsch, R.J. Determination of tectonic setting of sandstone mudstone suites using SiO2 and K2O/Na2O ratio. J. Geol. 1986, 94, 635–650. [Google Scholar] [CrossRef]
  59. Cox, R.; Low, D.R.; Cullers, R.L. The influence of sediment recycling and basement composition on evolution of mudrock chemistry in the southwestern United States. Geochim. Cosmochim. Acta 1995, 59, 2919–2940. [Google Scholar] [CrossRef]
  60. Nesbitt, H.W.; Young, G.M. Prediction of some weathering trends of plutonic and volcanic rocks based on thermodynamic and kinetic consideration. Geochim. Cosmochim. Acta 1984, 48, 1523–1534. [Google Scholar] [CrossRef]
  61. Fedo, C.M.; Nesbitt, H.W.; Young, G.M. Unraveling the effects of potassium metasomatism in sedimentary rocks and paleosols, with implications for paleoweathering conditions and provenance. Geology 1995, 23, 921–924. [Google Scholar] [CrossRef]
  62. Nesbitt, H.W.; Young, G.M. Early Proterozoic climates and plate motions inferred from major element chemistry of lutites. Nature 1982, 299, 715–717. [Google Scholar] [CrossRef]
  63. Nesbitt, H.W.; Young, G.M. Formation and diagenesis of weathering profiles. J. Geol. 1989, 97, 129–147. [Google Scholar] [CrossRef]
  64. Nesbitt, H.W.; Fedo, C.M.; Young, G.M. Quartz and feldspar stability, steady and non-steady weathering, and petrogenesis of siliciclastic sands and muds. J. Geol. 1997, 105, 173–191. [Google Scholar] [CrossRef]
  65. Fedo, C.M.; Young, G.M.; Nesbitt, H.W.; Hanchar, J.M. Potassic and sodic metasomatism in the Southern Province of the Canadian Shield: Evidence from the Paleoproterozoic Serpent Formation Huronian Supergroup, Canada. Precambrian Res. 1997, 84, 17–36. [Google Scholar] [CrossRef]
  66. Long, X.; Yuan, C.; Sun, M.; Xiao, W.; Wang, Y.; Cai, K.; Jiang, Y. Geochemistry and Nd isotopic composition of the Early Paleozoic flysch sequence in the Chinese Altai, Central Asia: Evidence for a northward-derived mafic source and insight into model ages in an accretionary orogen. Gondwana Res. 2012, 22, 554–566. [Google Scholar] [CrossRef]
  67. Le Maitre, R.W. The chemical variability of some common igneous rocks. J. Petrol. 1976, 17, 589–637. [Google Scholar] [CrossRef]
  68. Sharma, R.; Gupta, V.; Arora, B.R.; Sen, K. Petrophysical properties of the Himalayan granitoids: Implication on composition and source. Tectonophysics 2011, 497, 23–33. [Google Scholar] [CrossRef]
  69. Galy, A.; France-Lanord, C. Higher erosion rates in the Himalaya: Geochemical constraints on riverine fluxes. Geology 2001, 29, 23–26. [Google Scholar] [CrossRef]
  70. Singh, P. Major, trace and REE geochemistry of the Ganga River sediments: Influence of provenance and sedimentary processes. Chem. Geol. 2009, 266, 251–264. [Google Scholar] [CrossRef]
  71. McLennan, S.M.; Taylor, S.R.; McCulloch, M.T.; Maynard, J.B. Geochemical and Nd-Sr isotopic composition of deep-sea turbidites: Crustal evolution and plate tectonic associations. Geochim. Cosmochim. Acta 1990, 54, 2015–2050. [Google Scholar] [CrossRef]
  72. McLennan, S.M.; Hemming, S.R.; Taylor, S.R.; Eriksson, K.A. Early Proterozoic crustal evolution: Geochemical and Nd-Pb isotopic evidence from metasedimentary rocks, southwestern North America. Geochim. Cosmochim. Acta 1995, 59, 1159–1177. [Google Scholar] [CrossRef]
  73. Pe-Piper, G.; Triantafyllidis, S.; Piper, D.J.W. Geochemical identification of clastic sediment provenance from known sources of similar geology: The Cretaceous Scotian Basin, Canada. J. Sed. Res. 2008, 78, 595–607. [Google Scholar] [CrossRef]
  74. Borges, J.B.; Huh, Y.; Moon, S.; Noh, H. Provenance and weathering control on riverbed sediments of the eastern Tibetan Plateau and the Russian Far East. Chem. Geol. 2008, 254, 52–72. [Google Scholar] [CrossRef]
  75. Braun, J.J.; Viers, J.; Dupré, B.; Polvé, M.; Ndam, J.; Muller, J.P. Solid/liquid REE fractionation in the lateritic system of Goyoum, East Cameroon: The implication for the present dynamics of the soil covers of the humid tropical regions. Geochim. Cosmochim. Acta 1998, 62, 273–299. [Google Scholar] [CrossRef]
  76. Pan, Y.; Stauffer, M.R. Cerium anomaly and Th/U fractionation in the 1.85 Ga Flin Flon Paleosol: Clues from REE- and U-rich accessory minerals and implications for paleoatmospheric reconstruction. Am. Min. 2000, 85, 898–911. [Google Scholar] [CrossRef]
  77. Jacobson, A.D.; Blum, J.D.; Chamberlain, C.P.; Craw, D.; Koons, P.O. Climate and tectonic controls on chemical weathering in the New Zealand Southern Alps. Geochim. Cosmochim. Acta 2003, 37, 29–46. [Google Scholar] [CrossRef]
  78. Etemad-Saeed, N.; Hosseini-Barzi, M.; Armstrong-Altrin, J.S. Petrography and geochemistry of clastic sedimentary rocks as evidences for provenance of the Lower Cambrian Lalun Formation, Posht-e-Badam block Central Iran. J. Afr. Earth Sci. 2011, 61, 142–159. [Google Scholar] [CrossRef]
  79. McKay, J.L.; Pedersen, T.F.; Mucci, A. Sedimentary redox conditions in continental margin sediments (N.E. Pacific)—Influence on the accumulation of redox-sensitive trace metals. Chem. Geol. 2007, 238, 180–196. [Google Scholar] [CrossRef]
  80. Dypvik, H. Geochemical Compositions and Depositional Conditions of Upper Jurassic and Lower Cretaceous Yorkshire Clays, England. Geol. Mag. 1984, 121, 489–504. [Google Scholar] [CrossRef]
  81. Hatch, J.R.; Leventhal, J.S. Relationship between inferred redox potential of the depositional environment and geochemistry of the Upper Pennsylvanian (Missourian) Stark Shale Member of the Dennis Limestone, Wabaunsee County, Kansas, USA. Chem. Geol. 1992, 99, 65–82. [Google Scholar] [CrossRef]
  82. Madhavaraju, J.; Loser, H.; Lee, Y.I.; Lozano-Santacruz, R.; Pi-Puig, T. Geochemistry of Lower Cretaceous limestones of the Alisitos Formation, Baja California, Mexico: Implications for REE source and paleo-redox conditions. J. Sth. Am. Earth Sci. 2016, 66, 149–165. [Google Scholar] [CrossRef]
  83. Jones, B.; Manning, D.C. Comparison of geochemical indices used for the interpretation of paleo-redox conditions in ancient mudstones. Chem. Geol. 1994, 111, 111–129. [Google Scholar] [CrossRef]
  84. Tribovillard, N.; Algeo, T.J.; Lyons, T.; Riboulleau, A. Trace metals as paleo-redox and paleo-productivity proxies: An update. Chem. Geol. 2006, 232, 12–32. [Google Scholar] [CrossRef]
  85. Mangini, A.; Jung, M.; Laukenmann, S. What do we learn from peaks of uranium and of manganese in deep sea sediments? Mar. Geol. 2001, 177, 63–78. [Google Scholar] [CrossRef]
  86. Hetzel, A.; Böttcher, M.E.; Wortmann, U.G.; Brumsack, H. Paleo-redox conditions during OAE 2 reflected in Demerara Rise sediment geochemistry (ODP Leg 207). Palaeogeogr. Palaeoclimatol. Palaeoecol. 2009, 273, 302–328. [Google Scholar] [CrossRef]
Figure 1. Regional geology maps (a,b) and location map of the study area (c) within the northern part of the Bengal Basin catchment area (modified after Goscombe et al. [18]; Heroy et al. [10]; Valdiya [19]; Clark and Bilham [20]).
Minerals 10 00813 g001
Figure 2. Plots comparing (a) the abundance for the average major oxide (in wt.%) and trace element compositions (in ppm) of the Brahmaputra River samples normalized against data for Post-Archean Australian Shale (PAAS) and Upper Continental Crust (UCC) and (b) multi-element diagram for individual Brahmaputra River sediment samples, normalized against average upper continental crust (UCC) compositions.
Minerals 10 00813 g002
Figure 3. Selected major oxide variation diagrams for the Brahmaputra River sediments. (a) Plots of SiO2 (wt.%) vs. different oxides; (b) plots of Al2O3 (wt.%) vs. different oxides. Solid lines (fitted by eye) are indicative of trends in the studied samples. Black dots in the figure represent Brahmaputra River sediment samples. For the Y axis, major oxides are given in wt. %.
Minerals 10 00813 g003
Figure 4. Geochemical classifications of the Brahmaputra River sediments (a) log (Na2O/K2O) versus log (SiO2/Al2O3) classification diagram after Pettijohn et al. [34] and (b) log (Fe2O3*/K2O) versus log (SiO2/Al2O3) classification diagram after Herron [33]. Brahmaputra River sediment samples are represented by the black dots.
Minerals 10 00813 g004
Figure 5. Chondrite-normalized REE pattern for the Brahmaputra River sediments. Chondrite-normalized values are from Taylor and MacLennan [30], while the grey field indicates the crustal average ranges from UCC and PAAS. Chondrite/sample values are given in ppm.
Minerals 10 00813 g005
Figure 6. Major element provenance discriminant plot for the Brahmaputra River sediments. Fields for Siwalik Group sediments in NW Himalaya (India) from data in Ranjan and Banerjee [39] and the Ganges-Brahmaputra Rivers (GBR) from Hossain [9]. Stars: BA, AN, DA, RD, RH—average basalt, andesite, dacite, rhyodacite and rhyolite, as plotted by Roser and Korsch [38]. Brahmaputra River sediment samples are represented by the black dots.
Minerals 10 00813 g006
Figure 7. Bivariate log concentration plot of log (K) vs. log (Rb) of the Brahmaputra River sediments relative to a K:Rb ratio of 230, the main trend line of Shaw [43]. Upper continental crust (UCC) and post-Archaean average Australian shale (PAAS) compositions are shown for comparison. Brahmaputra River sediment samples are represented by the black dots.
Minerals 10 00813 g007
Figure 8. A Th/Sc versus Zr/Sc plot [53] for the Brahmaputra River sediments. Stars: BAS (basalt), LSA (low silica andesite), AND (andesite), DAC (dacite) and RHY (rhyolite) are average volcanic rock compositions (as plotted by Roser and Korsch [54]). PCT—primary compositional trend. Field for the Siwalik Group, NW Himalaya, India [39]. Brahmaputra River sediment samples are represented by the black dots.
Minerals 10 00813 g008
Figure 9. A Th/Sc versus Cr/Th plot for the Brahmaputra River sediments. The curved line represents the mixing curve between a mafic end member (NG) of average Nidar gabbro from the intra-oceanic tholeiitic arc, South Ladakh ophiolites (NW Himalaya, India) (NG, data from Maheo et al. [47]) and an average Phanerozoic granite (PG) (data from Condie [48]). Brahmaputra River sediment samples are represented by the black dots.
Minerals 10 00813 g009
Figure 10. V-Ni-(Th*10) plot for the Brahmaputra River sediments. Shaded areas represent composition of the felsic, mafic and ultramafic rocks. Brahmaputra River sediment samples are represented by the black dots. All data plotted in ppm.
Minerals 10 00813 g010
Figure 11. Plot of La/Th ratio versus Hf for the Brahmaputra River sediments. Fields after Floyd and Leveridge [42] and Gu et al. [52]. Brahmaputra River sediment samples are represented by the black dots.
Minerals 10 00813 g011
Figure 12. (Gd/Yb)N versus (Eu/Eu*)N plot [56] for the Brahmaputra River sediments. Fields for the Siwalik Group, India [39] and the Brahmaputra-Jamuna River (BJR—shaded region) from Bhuiyan et al. [7] are shown for comparison. Brahmaputra River sediment samples are represented by the black dots.
Minerals 10 00813 g012
Figure 13. SiO2/Al2O3 versus log (K2O/Na2O) tectonic discrimination diagram [58] for the Brahmaputra River sediments. Brahmaputra River sediment samples are represented by the black dots. A1: arc setting, basaltic and andesitic detritus; A2: evolved arc setting, felsic-plutonic detritus; PM: passive margin; ACM: active continental margin.
Minerals 10 00813 g013
Figure 14. Tectonic-setting discrimination diagrams for the Brahmaputra River sediments. Boundaries of fields are from Bhatia [57]. Brahmaputra River sediment samples are represented by the black dots. All data plotted in wt.%. (a) Al2O3/SiO2 versus (Fe2O3 + MgO) plot, (b) Al2O3/(CaO + Na2O) versus (Fe2O3 + MgO) plot, (c) TiO2 versus (Fe2O3 + MgO) plot, (d) K2O/Na2O versus (Fe2O3 + MgO) plot. All values are given in wt.%.
Minerals 10 00813 g014
Figure 15. A–CN–K diagram with CIA values with vertical axis [60,63] for the Brahmaputra River sediments. Brahmaputra River sediment samples are represented by the black dots. CIA = Chemical Index of Alteration; IWT = Ideal Weathering Trend. Solid line linking crosses is the compositional trend in pristine average igneous rocks (data from Le Maitre [67]. B = basalt, Ga = gabbro, Di = diorite, Da = dacite, G = granite, Rh = rhyolite. Dashed line parallel to the A–CN edge is the ideal weathering trend (IWT). Himalayan source rocks for comparison: (1) Cretaceous granitoids (Trans-Himalaya-Ladakh [68]); (2) Trans-Himalayan batholith [69]; (3) Tertiary leucogranite (Higher Himalaya [68]); (4) Paleozoic granitoids (Lesser Himalaya, Mandi-granite [68]; (5) Baragaon mylonitic gneisses from the Lesser Himalaya, Garhwal, India [68]. Fields for the Siwalik Group, NW Himalaya, India [39], Higher and Lesser Himalaya source rocks (HHS and LH—[70]), Ganges River sediments (GR) [70], UCC and PAAS [30] are included for comparison.
Minerals 10 00813 g015
Figure 16. ICV (Index of Compositional Variability) versus CIA (Chemical Index of Alteration) plot for the Brahmaputra River sediments (after Long et al. [66]). Brahmaputra River sediment samples are represented by the black dots. UCC (Upper Continental Crust) and PAAS (Post-Archean Australian Shale) values after Taylor and McLennan [30] are included for comparison.
Minerals 10 00813 g016
Table 1. Major oxide compositions (wt.%), oxide ratios and weathering indices values of the Brahmaputra River sediments. All data have been hydroxide normalized.
Oxides.BS1BS2BS3BS4BS5BS6BS7BS8BS9BS10BS11BS12BS13BS14BS15BS16BS17BS18BS19BS20MinMaxAverageUCCPAAS
SiO27573757076747172737673747271716972757273.4697672.96662.8
Al2O310111111111111121110101112131212111111111013111519
Fe2O34.04.53.24.83.23.54.92.84.93.34.64.14.33.04.65.24.43.34.53.52.85.24.04.56.5
MnO0.10.10.10.20.10.10.20.10.10.10.10.10.10.10.10.20.10.10.10.10.10.20.10.10.1
MgO1.21.71.22.01.01.421.91.61.11.41.62.02.01.92.11.71.31.71.612.11.62.22.2
CaO2.62.92.94.62.32.43.13.02.72.73.02.63.03.72.23.02.53.02.72.32.24.62.94.21.3
Na2O1.81.91.91.921.92.12.21.81.91.81.81.91.82.12.12.11.82.02.11.82.21.93.91.2
K2O2.83.02.32.62.53.32.93.32.42.42.92.72.53.53.32.83.02.62.93.22.33.52.83.43.7
TiO20.50.70.51.10.30.50.90.70.70.50.70.80.70.80.60.90.80.60.80.70.31.10.70.51.0
P2O50.10.20.10.30.10.10.20.20.20.10.20.20.20.20.20.20.20.10.20.10.10.30.20.20.2
LOI1.30.90.91.41.01.21.31.01.21.01.11.31.21.11.21.11.31.21.31.10.91.41.2--
Total10010099100991001009999999910010099999910010010099.59910099--
Na2O/K2O0.60.60.80.80.80.60.70.70.80.80.60.70.80.50.60.80.70.70.70.70.50.80.71.10.3
K2O/Na2O1.61.61.21.31.21.81.41.51.31.31.61.51.31.91.61.31.41.41.51.51.21.91.50.93.1
SiO2/Al2O37.46.66.86.37.36.66.26.06.97.47.07.06.35.76.15.96.46.86.56.45.77.46.64.33.3
Al2O3/SiO20.10.20.10.20.10.20.20.20.10.10.10.10.20.20.20.20.20.10.20.20.10.20.20.20.3
Fe2O3/K2O1.41.51.41.91.31.11.70.92.01.41.61.61.70.91.41.91.51.31.51.10.92.01.41.31.8
Fe2O3+MgO5.16.24.56.84.25.06.94.76.64.46.05.76.35.06.57.36.14.66.15.14.27.35.66.78.7
CaO+Na2O4.44.84.76.54.34.35.25.24.64.64.74.44.95.54.35.14.64.84.74.44.36.54.88.12.5
Al2O3/TiO221162510342313181523141318171914141813171034183018.9
Al2O3/Na2O5.85.95.95.75.36.15.45.55.85.35.85.86.07.05.65.65.46.15.75.55.37.05.83.915.8
Fe2O3/SiO20.10.10.00.10.00.00.10.00.10.00.10.10.10.00.10.10.10.00.10.00.00.10.10.10.1
CIA54545655535453535553545456565354535654535356545775
PIA55565856545654545755555658605456545856545460565986
ICV1.51.61.42.01.31.41.71.51.61.51.71.61.51.51.51.61.61.51.61.41.32.01.51.30.8
CIW6464646362656263646264646568636362656363626864--
CIA—Chemical Index of Alteration, PIA—Plagioclase Index of Alteration, CIW—Chemical Index of Weathering.
Table 2. Trace element compositions (ppm) and selected elemental ratios of the Brahmaputra River sediments.
ElementsBS1BS2BS3BS4BS5BS6BS7BS8BS9BS10BS11BS12BS13BS14BS15BS16BS17BS18BS19BS20MinMaxAverageUCCPAAS
Ba341308384308376321365361356378351346372331443360368385353350308443358550650
Cr65939210278696664739489857293649478889170641028135110
Ga18161717171717181717181716171816181717171618171717
Nb867677787787678687776872519
Ni273206201214212220281771528820181617328172055
Co915101281197139881098971299715101023
Pb244166181313201715261451121319161315326142020
Rb1354299623143133861575615093213396491315510512615781112160
Sc17171718171718171717181717171817171717171718171116
Sr281205257236268247258274266254286234209253281220273266253262205286254350200
V888685104798810790948892939293919694899891791079260150
Y14131414141314151414151413141513141414141315142227
Zr166170162215162162217195196165179211173186182192198179218190162218186190210
Hf3.303.363.303.153.373.293.183.253.193.293.353.293.283.273.343.253.243.273.273.323.153.373.285.805.00
Ta0.720.710.700.640.720.720.640.690.670.700.720.680.690.690.710.680.680.700.660.700.640.720.692.201.28
Th8.888.858.828.598.8112.308.608.718.7112.108.918.768.7912.008.808.818.728.778.7512.108.5912.309.4410.7014.6
U1.921.931.901.811.952.251.801.881.852.271.921.861.902.231.911.861.861.901.852.291.802.291.962.803.10
Rb/Sr0.480.200.390.030.090.580.520.310.590.220.520.400.100.130.340.220.480.210.420.050.030.590.310.320.80
Th/Sc0.520.520.520.480.520.720.480.510.510.710.500.520.520.710.490.520.510.520.510.710.480.720.550.970.91
Zr/Sc9.7610.009.5311.909.539.5312.111.511.59.719.9412.410.210.910.111.311.710.512.811.29.5312.810.817.313.1
Cr/Th7.3210.5010.4011.908.855.617.677.358.387.759.999.708.197.737.2710.78.9410.0010.405.795.6111.908.723.277.50
Th/Co0.990.590.880.721.101.120.961.240.671.351.111.100.881.341.100.981.250.730.971.340.591.351.021.070.63
Sc/Th1.911.921.932.101.931.382.091.951.951.402.021.941.931.412.051.931.951.941.941.411.382.101.851.001.10
Ni/Co3.000.202.000.502.501.091.563.001.692.223.502.130.701.673.500.892.861.501.781.890.203.501.912.002.39
Th/U4.634.594.644.754.525.464.784.634.715.344.644.714.635.394.614.744.694.624.735.284.775.374.823.824.71
U/Th0.220.220.220.210.220.180.210.220.210.190.220.210.220.190.220.210.210.220.210.190.210.190.210.260.21
V/Cr1.350.920.921.021.011.281.621.411.290.941.031.091.281.001.421.021.211.011.081.301.231.051.131.711.36
V/Sc5.185.065.005.784.655.185.945.295.535.185.115.475.415.475.065.655.535.245.765.354.655.945.345.459.38
Table 3. Rare earth element compositions (ppm) and elemental ratios of the Brahmaputra River sediments.
ElementsBS1BS2BS3BS4BS5BS6BS7BS8BS9BS10BS11BS12BS13BS14BS15BS16BS17BS18BS19BS20MinMaxAverageUCCPAAS
La25.826.625.727.425.826.628.326.826.925.925.826.826.226.226.426.926.526.026.626.925.728.326.530.038.2
Ce49.850.249.454.147.957.553.050.050.356.550.450.951.557.650.750.850.249.750.357.547.957.651.964.079.6
Pr6.096.155.996.135.996.036.156.056.066.086.116.086.066.086.066.126.046.086.016.045.996.156.077.108.83
Nd20.320.319.920.719.520.120.520.120.420.220.120.520.220.720.320.320.620.020.420.119.520.720.326.033.9
Sm3.974.013.943.983.954.023.953.954.034.024.033.974.013.973.984.033.983.953.983.983.944.033.994.505.55
Eu0.670.690.680.680.670.830.690.680.690.830.690.690.700.840.690.680.690.680.680.830.670.840.710.881.08
Gd3.834.033.754.023.753.884.023.843.813.873.893.894.003.983.904.013.823.833.873.933.754.033.903.804.66
Tb0.430.440.430.460.420.440.460.440.450.440.440.440.450.450.440.450.440.440.440.450.420.460.440.640.77
Dy2.742.902.683.372.532.833.362.863.002.832.872.932.902.972.873.042.922.793.023.002.533.372.923.504.68
Ho0.620.630.620.620.610.660.620.610.620.610.630.620.620.630.620.630.620.620.620.620.610.660.620.800.99
Er1.351.401.341.491.271.361.501.381.401.371.391.401.431.421.421.451.401.351.421.431.271.501.402.302.85
Tm0.200.200.200.190.200.190.190.190.190.190.200.190.190.180.200.190.190.190.190.190.180.200.190.330.41
Yb1.541.501.481.231.501.491.241.421.341.461.501.371.411.401.471.371.361.491.341.411.231.541.422.202.82
Lu0.210.200.200.190.210.200.190.200.200.200.210.200.200.200.200.200.200.200.200.200.190.210.200.320.43
∑REE 118119116125114126124119119124118120120127119120119117119127114130121146185
∑LREE 106107105112103114112107108113106108108115107108107106107115103117109132166
∑HREE 11.612.011.412.311.211.912.311.611.711.811.811.711.912.111.81211.611.611.812.110.912.811.814.818.7
∑(LREE/HREE)9.148.959.229.179.249.629.119.219.209.549.019.239.079.499.109.009.229.129.109.499.499.129.218.918.89
Eu/Eu*0.580.580.600.570.590.710.580.590.600.710.590.590.590.710.590.570.600.590.590.710.570.710.610.63-
LaN/YbN11.312.011.715.011.612.015.412.713.612.011.613.212.512.612.113.213.111.813.412.811.315.412.7--
LaN/SmN4.094.184.104.324.114.164.504.274.204.054.034.254.114.154.174.204.184.134.204.254.034.504.18--
CeN/YbN8.368.658.6311.408.269.9811.109.129.7110.08.699.619.4410.78.929.609.568.639.7010.68.2611.409.52--
CeN/SmN3.033.023.023.282.933.453.243.063.013.393.023.093.103.503.073.043.053.043.053.492.933.503.14--
EuN/YbN1.241.311.311.571.271.581.581.361.461.621.311.431.411.711.331.411.441.301.441.671.241.711.44--
GdN/YbN1.641.791.662.181.641.722.161.781.871.751.721.881.891.891.761.951.851.691.911.851.642.181.83--
La/Co2.871.772.572.283.232.423.143.832.072.883.233.352.622.913.302.993.782.162.952.981.773.832.873.001.70
La/Sc1.521.571.511.521.521.571.571.581.581.521.431.581.541.541.471.581.561.531.561.581.431.581.542.702.40
La/Th2.903.012.913.192.932.173.293.083.092.142.903.062.982.183.003.053.042.963.032.222.992.302.812.802.62
LREE—Light Rare Earth Elements, HREE—Heavy Rare Earth Elements.
Table 4. Correlation matrix of major oxides and key trace elements for the Brahmaputra River sediments. Underscoring of coefficients indicates a significant positive correlation, while a significant negative correlation is denoted by boldface type.
Oxide/
Element
SiO2Al2O3TiO2Fe2O3MnOMgOCaONa2OK2OP2O5BaSrCrNiScCoNbYZrPbRbVHfThU
SiO21.00-------------------------
Al2O3−0.671.00-----------------------
TiO2−0.850.331.00----------------------
Fe2O3−0.58−0.100.631.00---------------------
MnO−0.840.290.940.671.00--------------------
MgO−0.950.770.780.470.751.00-------------------
CaO−0.540.240.630.130.670.471.00------------------
Na2O−0.380.480.200.110.160.42−0.191.00-----------------
K2O−0.410.650.17−0.130.120.42−0.080.291.00----------------
P2O5−0.860.340.950.690.920.810.610.150.141.00---------------
Ba0.160.06−0.34−0.07−0.38−0.12−0.490.36−0.15−0.411.00---------------
Sr0.28−0.21−0.28−0.26−0.32−0.41−0.310.050.18−0.450.421.00-------------
Cr−0.09−0.110.270.070.22−0.010.56−0.35−0.340.27−0.33−0.411.00------------
Ni0.41−0.34−0.41−0.22−0.45−0.49−0.47−0.070.04−0.530.550.91−0.401.00-----------
Sc−0.440.000.450.480.470.310.330.160.110.400.150.25−0.030.151.00----------
Co−0.02−0.150.080.220.190.030.30−0.43−0.260.18−0.44−0.500.31−0.54−0.091.00---------
Nb0.26−0.13−0.28−0.25−0.33−0.32−0.440.090.36−0.430.400.90−0.510.900.15−0.621.00--------
Y0.05−0.070.00−0.17−0.11−0.12−0.050.160.18−0.160.440.81−0.210.780.47−0.520.771.00-------
Zr−0.630.230.870.480.720.600.380.320.110.79−0.15−0.050.08−0.170.33−0.14−0.060.201.00------
Pb0.46−0.38−0.41−0.27−0.45−0.55−0.45−0.080.11−0.540.400.94−0.450.960.17−0.510.940.78−0.171.00-----
Rb0.10−0.29−0.050.26−0.06−0.19−0.36−0.150.10−0.080.100.50−0.390.540.15−0.150.610.280.080.591.00----
V−0.760.260.900.620.880.690.550.230.090.84−0.19−0.130.08−0.280.54−0.01−0.180.040.85−0.290.121.00---
Hf0.54−0.18−0.67−0.34−0.70−0.50−0.60−0.150.15−0.620.220.09−0.060.27−0.20−0.140.210.06−0.660.28−0.12−0.791.00--
Th0.190.16−0.27−0.50−0.24−0.15−0.10−0.140.37−0.30−0.210.000.02−0.05−0.27−0.02−0.03−0.18−0.32−0.06−0.19−0.200.181.00-
U0.310.11−0.41−0.57−0.38−0.26−0.20−0.150.34−0.44−0.150.04−0.010.01−0.31−0.030.02−0.15−0.450.01−0.24−0.360.340.981.00

