Article

Analysis and Prediction of the Thiourea Gold Leaching Process Using Grey Relational Analysis and Artificial Neural Networks

1
School of Minerals Processing and Bioengineering, Central South University, Changsha 410083, China
2
306 Bridge of Hunan Nuclear Geology, Changsha 410083, China
*
Authors to whom correspondence should be addressed.
Rui Xu and Xiaolong Nan contributed equally to this work and should be considered as co-first authors.
Minerals 2020, 10(9), 811; https://doi.org/10.3390/min10090811
Submission received: 17 August 2020 / Revised: 8 September 2020 / Accepted: 11 September 2020 / Published: 15 September 2020
(This article belongs to the Section Mineral Processing and Extractive Metallurgy)

Abstract

:
The thiourea (TU) leaching of gold from refractory ores can be considered an alternative to cyanidation. However, the high reagent consumption causes an increase in cost, which seriously limits its use. In order to effectively reduce the TU consumption, it is necessary to analyze the influencing parameters of gold recovery and TU consumption and apply them to the prediction of the TU leaching process. This paper investigated six potential influencing parameters and used grey relational analysis (GRA) to analyze the relational degree between each parameter and gold recovery and TU consumption. Then, the artificial neural network (ANN) model was established to simultaneously predict the gold recovery and TU consumption in the TU gold leaching process. The results of the GRA indicated that the leaching time, initial pH, temperature, TU dosage, stirring speed, and ferric iron concentration were all well related to the gold recovery and TU consumption. Therefore, the incorporation of these parameters can significantly improve the ANN model validation. The predictive results noted that the prediction accuracy of gold recovery varied from 94.46% to 98.06%, and the TU consumption varied from 95.15% to 99.20%. Thus, the predicted values corresponded closely to the experimental results, which suggested that the ANN model can accurately reflect the relationship between the operational conditions and the gold recovery and TU consumption. This prediction method can be used as an auxiliary decision-making tool in the TU gold leaching process, and it has broad engineering application prospects in engineering.

1. Introduction

Cyanidation has remained a dominant technology in the gold industry for more than a century because of its simplicity and economy. However, there are some disadvantages, such as its high toxicity and slow kinetics. In some cases, gold occurs as submicroscopic particles in carbonaceous minerals; sulfides; and minerals containing arsenic, copper, and manganese, which can cause a high cyanide consumption and low gold recovery using the cyanide leaching method [1]. Therefore, it is necessary to research non-cyanide leaching reagents for gold for the depletion of ores which are open to cyanidation and to improve the environmental requirements. Proposed alternatives include thiourea (TU), thiosulfate, thiocyanate, bromine, and iodine [2,3,4]. Of the non-cyanide reagents, TU and thiosulfate have gained significant research interest over the last few decades [5,6,7]. Thiosulfate is considered a promising alternative, but it has not been applied widely due to complex chemical reactions and passivation and recovery problems [8]. The TU leaching of gold features a low environmental impact, good selectivity, and fast kinetics of leaching, and has been used in commercial production [9,10].
The initial gold leaching rates at high concentrations of TU are comparable to those of cyanide leaching [11]. However, TU is unstable and easily converts to other unwanted products (via thermal degradation, side-reactions, etc.), which causes a high TU consumption and the passivation of the gold surface, thus reducing the dissolution rate of gold [8]. In general, the leaching time (Lt), initial pH, temperature (T), TU dosage (Td), and stirring speed (Ss), etc., are the important parameters when optimization studies for the TU gold leaching process are considered [12]. TU is a kind of water-soluble organic compound which is relatively stable in acidic solution and rapidly decomposed in alkaline solution. Therefore, the TU leaching of gold is generally carried out in the pH range of 1–2 [13]. However, the TU consumption increases as the pH decreases [14]. Birich et al. [3] found that the leaching temperature has a significant effect on the mean dissolution rate of gold in TU solutions, and a trial at 45 °C was up to two times faster than a 25 °C trial. Nevertheless, when the temperature exceeds 45 °C the TU solution evaporates, resulting in a drop in pH and thus slowing down the leaching kinetics. Previous research has revealed that the gold extraction increased with the increase in the TU concentration due to the production of formamidine disulfide in the medium. Olyaei et al. [12] found that as the ferric sulfate/TU molar ratio increases, the gold recovery tends to increase and reaches a highest value at the ratio of 1/1. Additionally, the dissolution rate did not increase significantly after 5 h of leaching. Tanriverdi et al. [14] discovered that the maximum gold extraction was found at the stirring speed of 480 rpm, with 14.09 g/t Au in the ore and a 20% solid/water ratio.
In industrial processes, the goal of controlling experimental conditions is to gain the optimum performance; especially, the goal is the optimal selection of the parameters from the economic and environmental points of view. However, the simultaneous evaluation of gold recovery and TU consumption is complicated due to the numerous interactions between the operational conditions and process performance. Moreover, quantitative data on TU leaching systems are limited. It therefore seems of interest to study the matching relationship between various parameters and gold recovery and TU consumption.
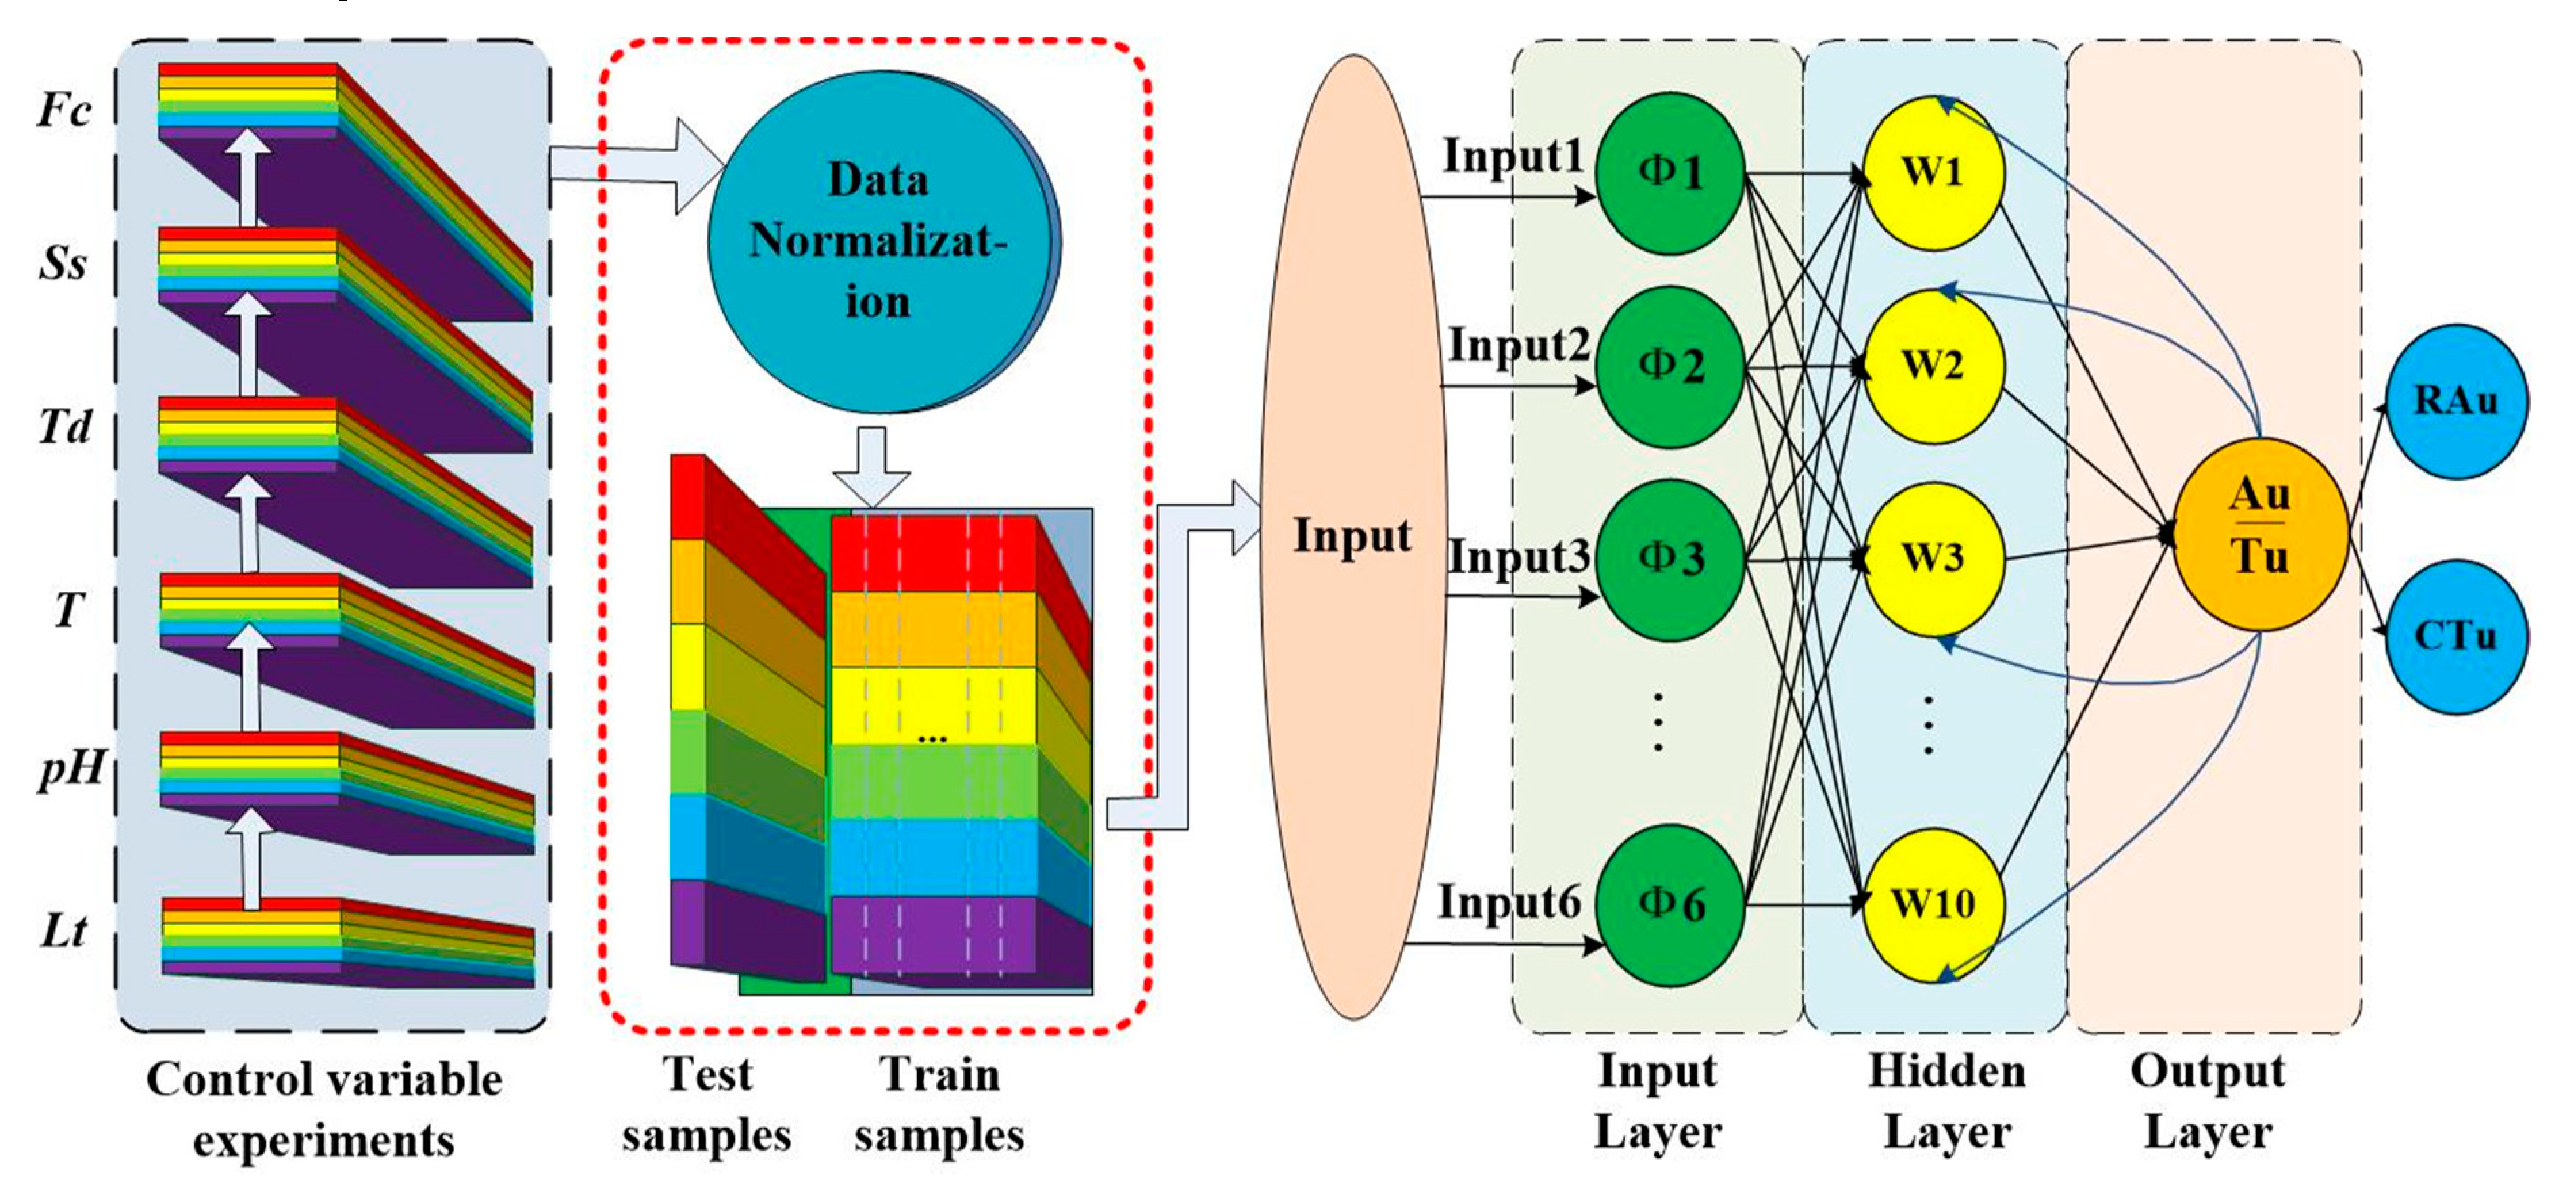
A gold recovery and TU consumption evaluation simultaneously in the leaching process by appropriate modeling can optimize experimental conditions and minimize the experiment cost. Recently, artificial neural network (ANN) models have been widely used to capture and interpret relationships where the relations between the input and output parameters are complex and nonlinear [15]. Each network consists of three parts: the first part constitutes the input layer, where the data are inputted into the network; the second part consists of the hidden layers where these collective inputs are processed; the last one is the output layer, where the target prediction values of the network model are outputted in the current state [16]. An ANN can be considered as a black box consisting of a complex set of formulas, and the outputs of the network can be related to the actual data used as inputs and the expected outputs in samples to reflect the complex mapping of multi-samples [
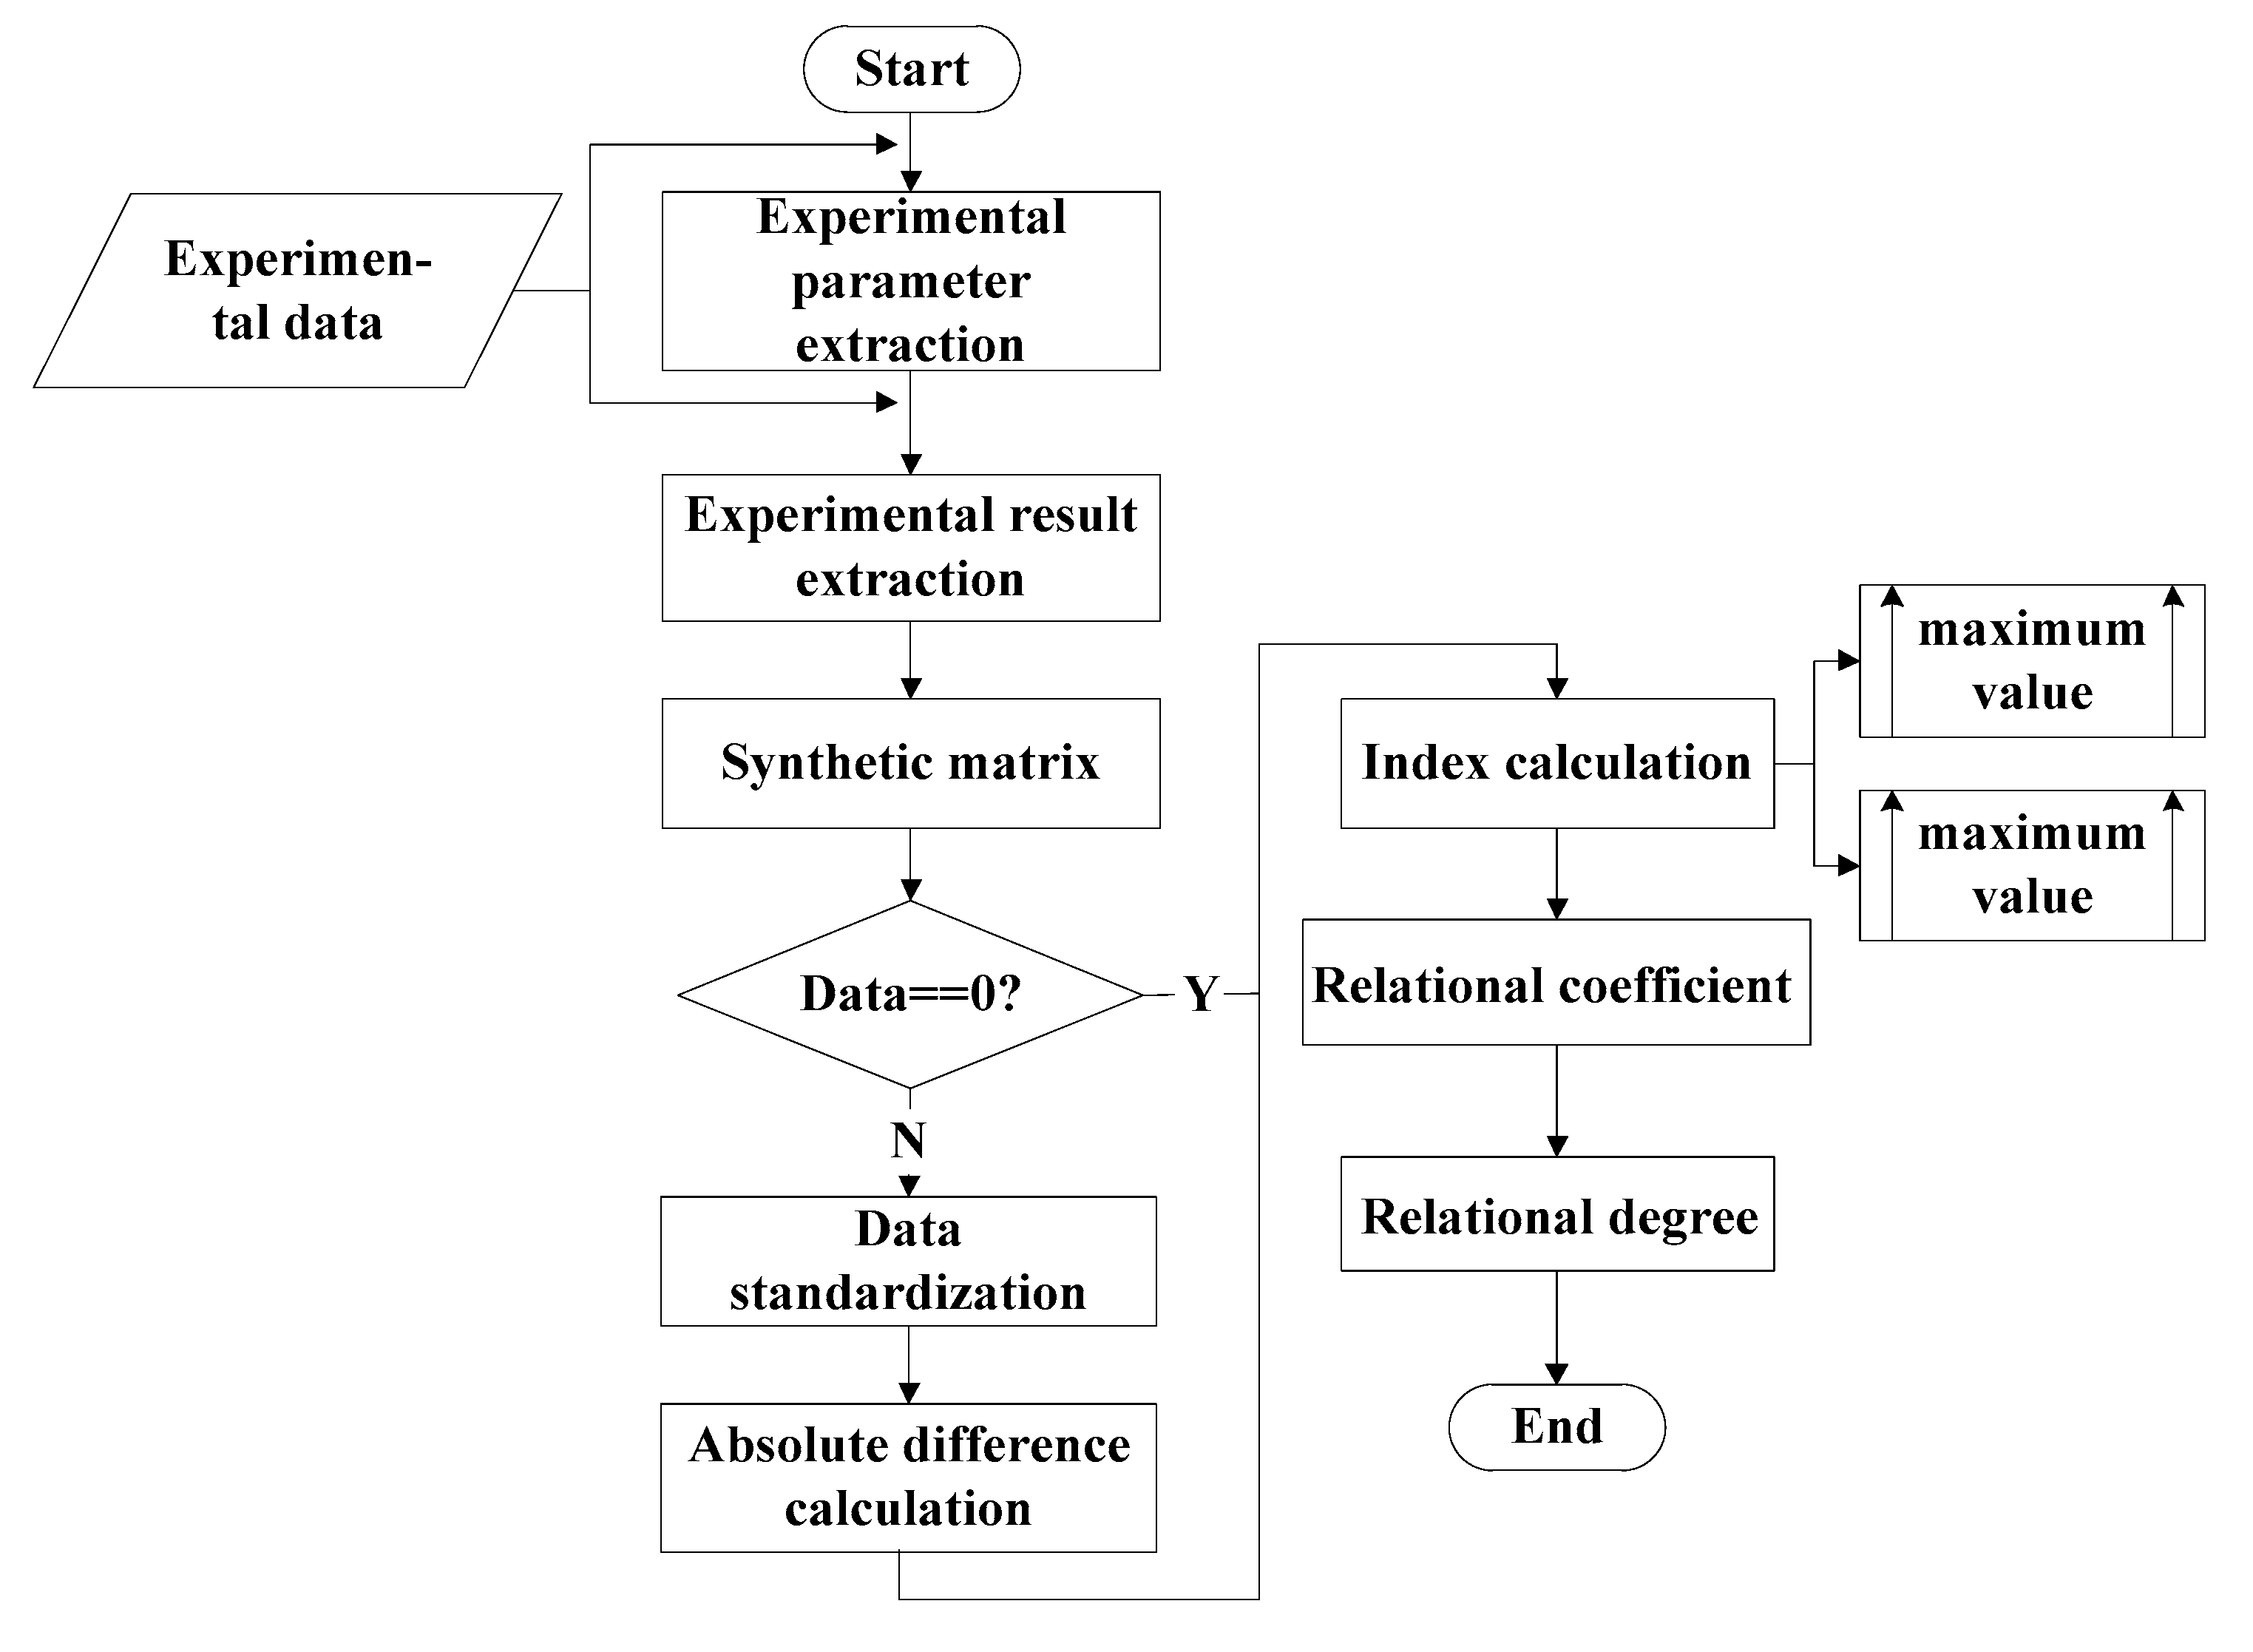
17]. However, the mathematical properties and distribution laws of some data are not obvious, and even ANN cannot reflect the internal complex mapping relationship well. Grey relational analysis (GRA) is an important multivariate analysis in the field of grey system theory, which aims to find the optimal system parameters of a grey system and make the dynamic behavior of the system most suitable for problem analysis [18]. One of the major advantages of GRA is that a small amount of data is needed to describe the system behavior, and the relational degree can be obtained to reflect the correlation between the comparison sequence and the reference sequence. With the excellent performance of GRA in analyzing the incomplete information system, GRA is particularly suitable for the analysis of processes, such as the process of the TU leaching of gold, which have limited data, complexities, uncertainties, and no prototype.
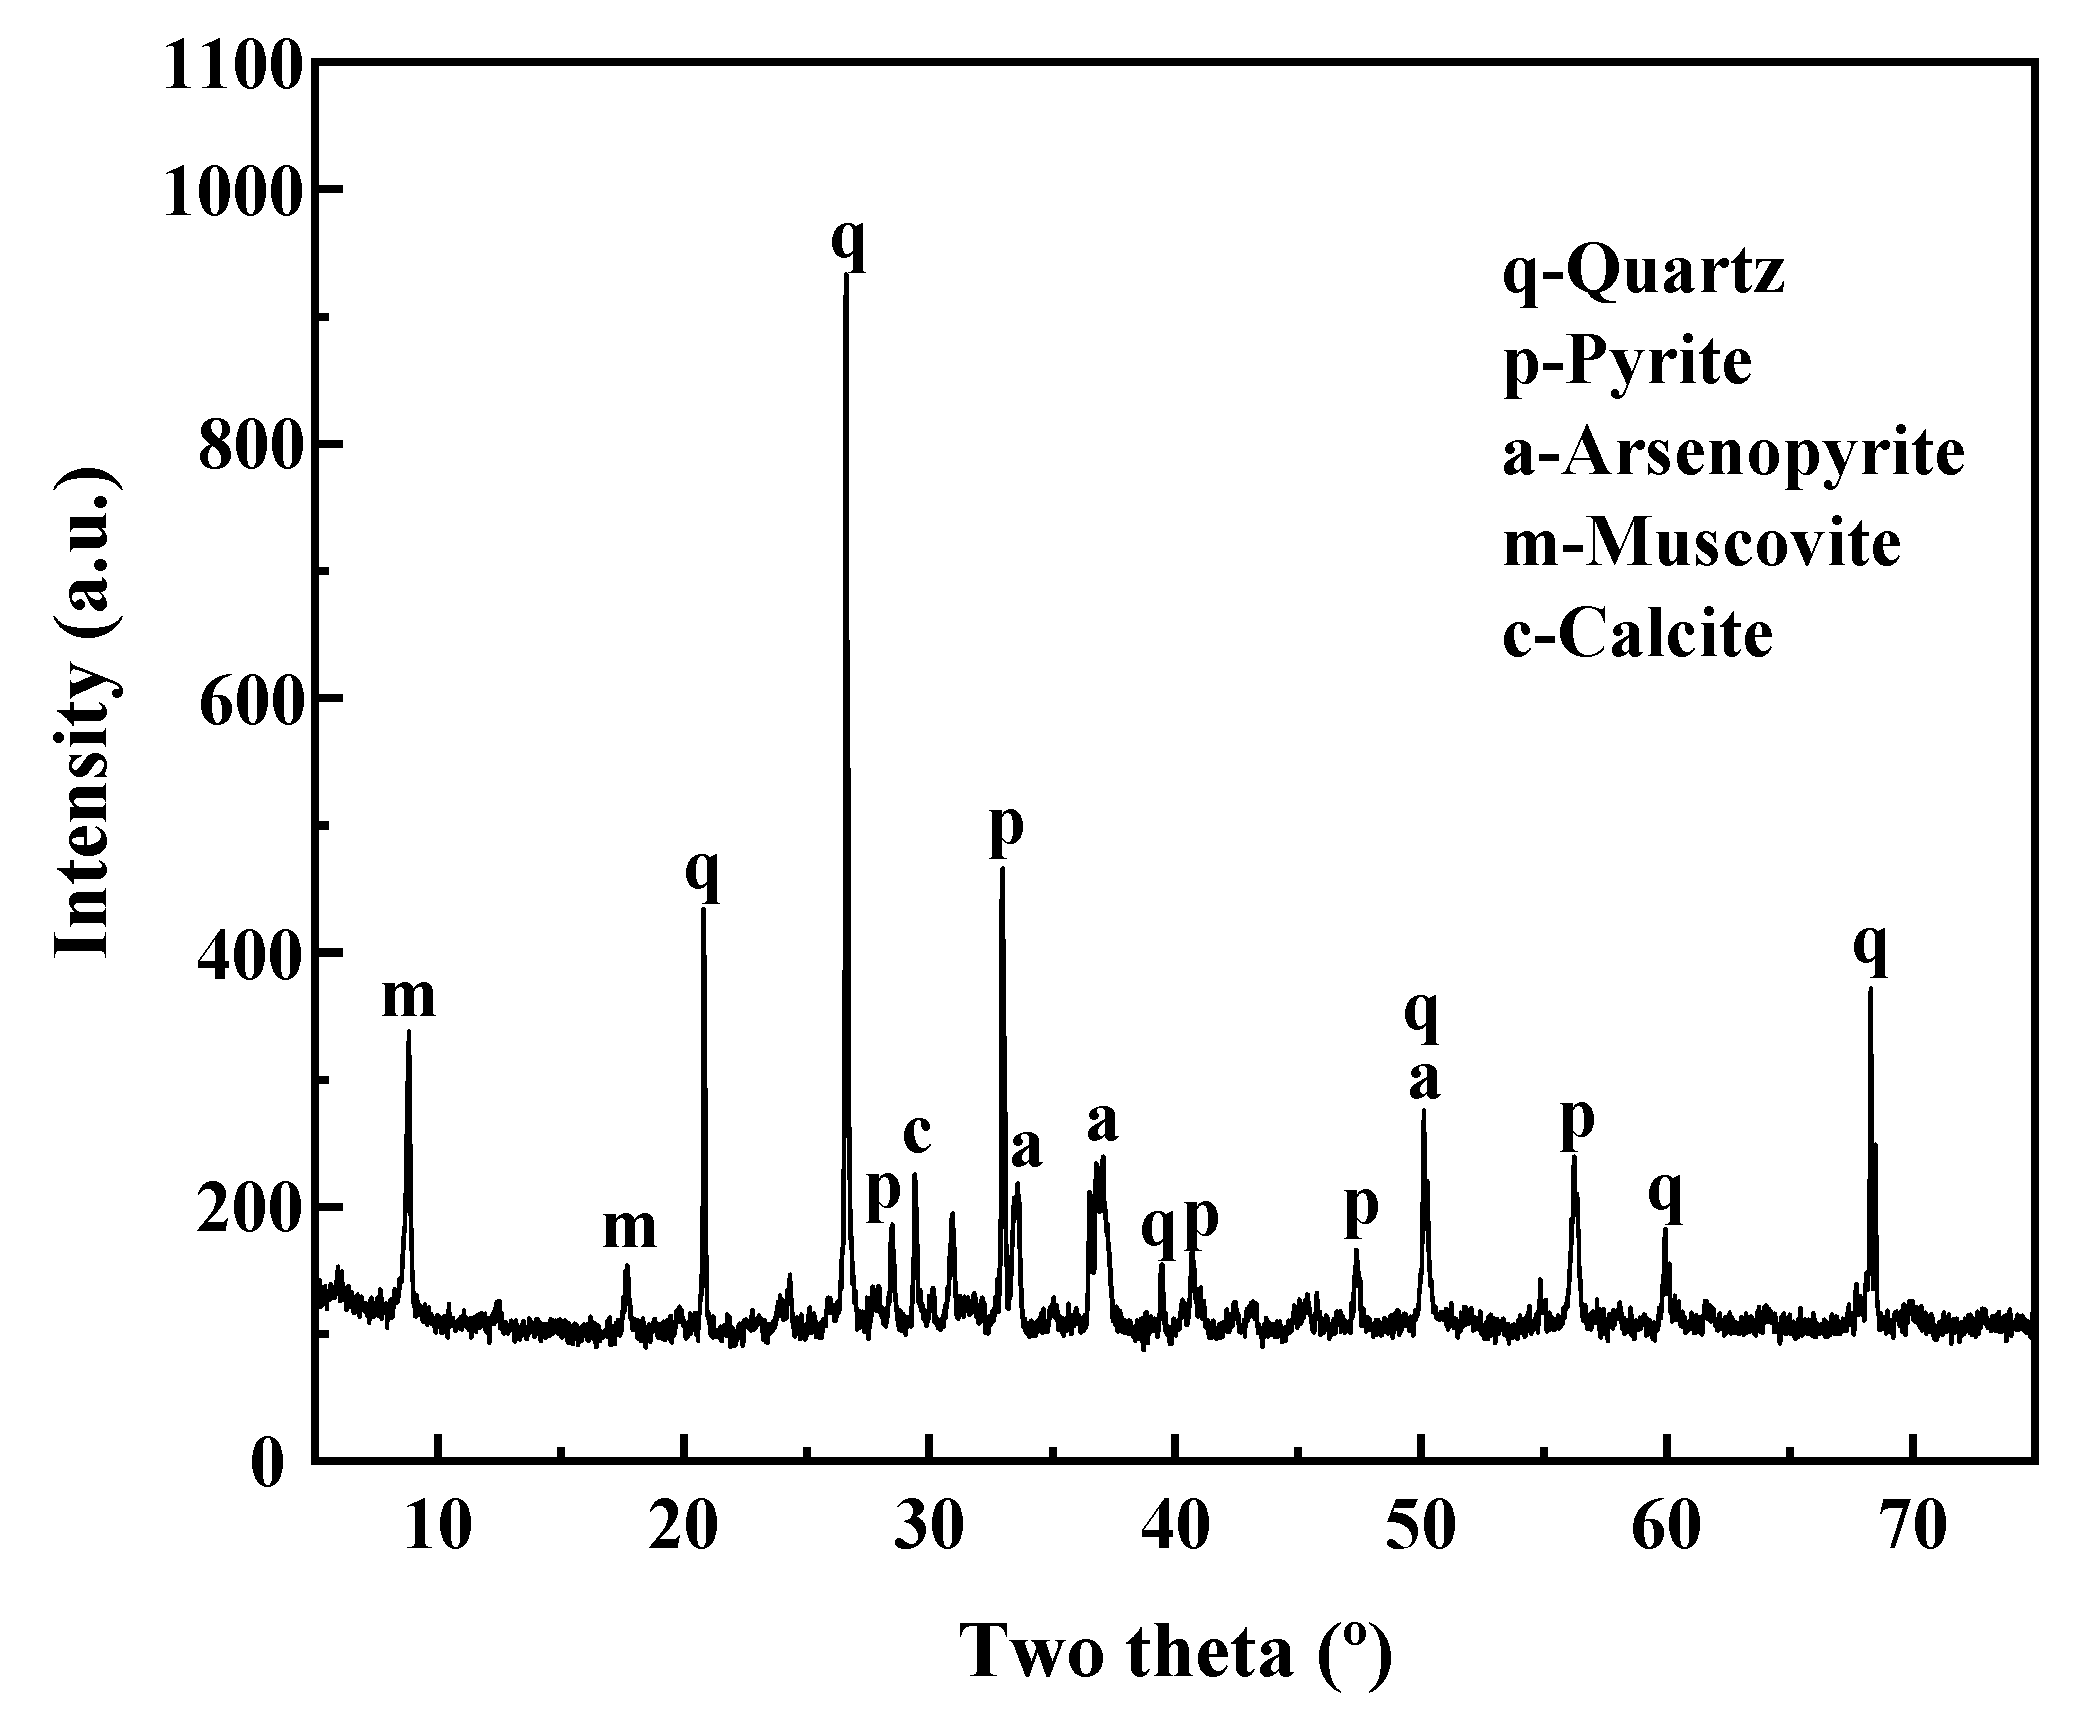
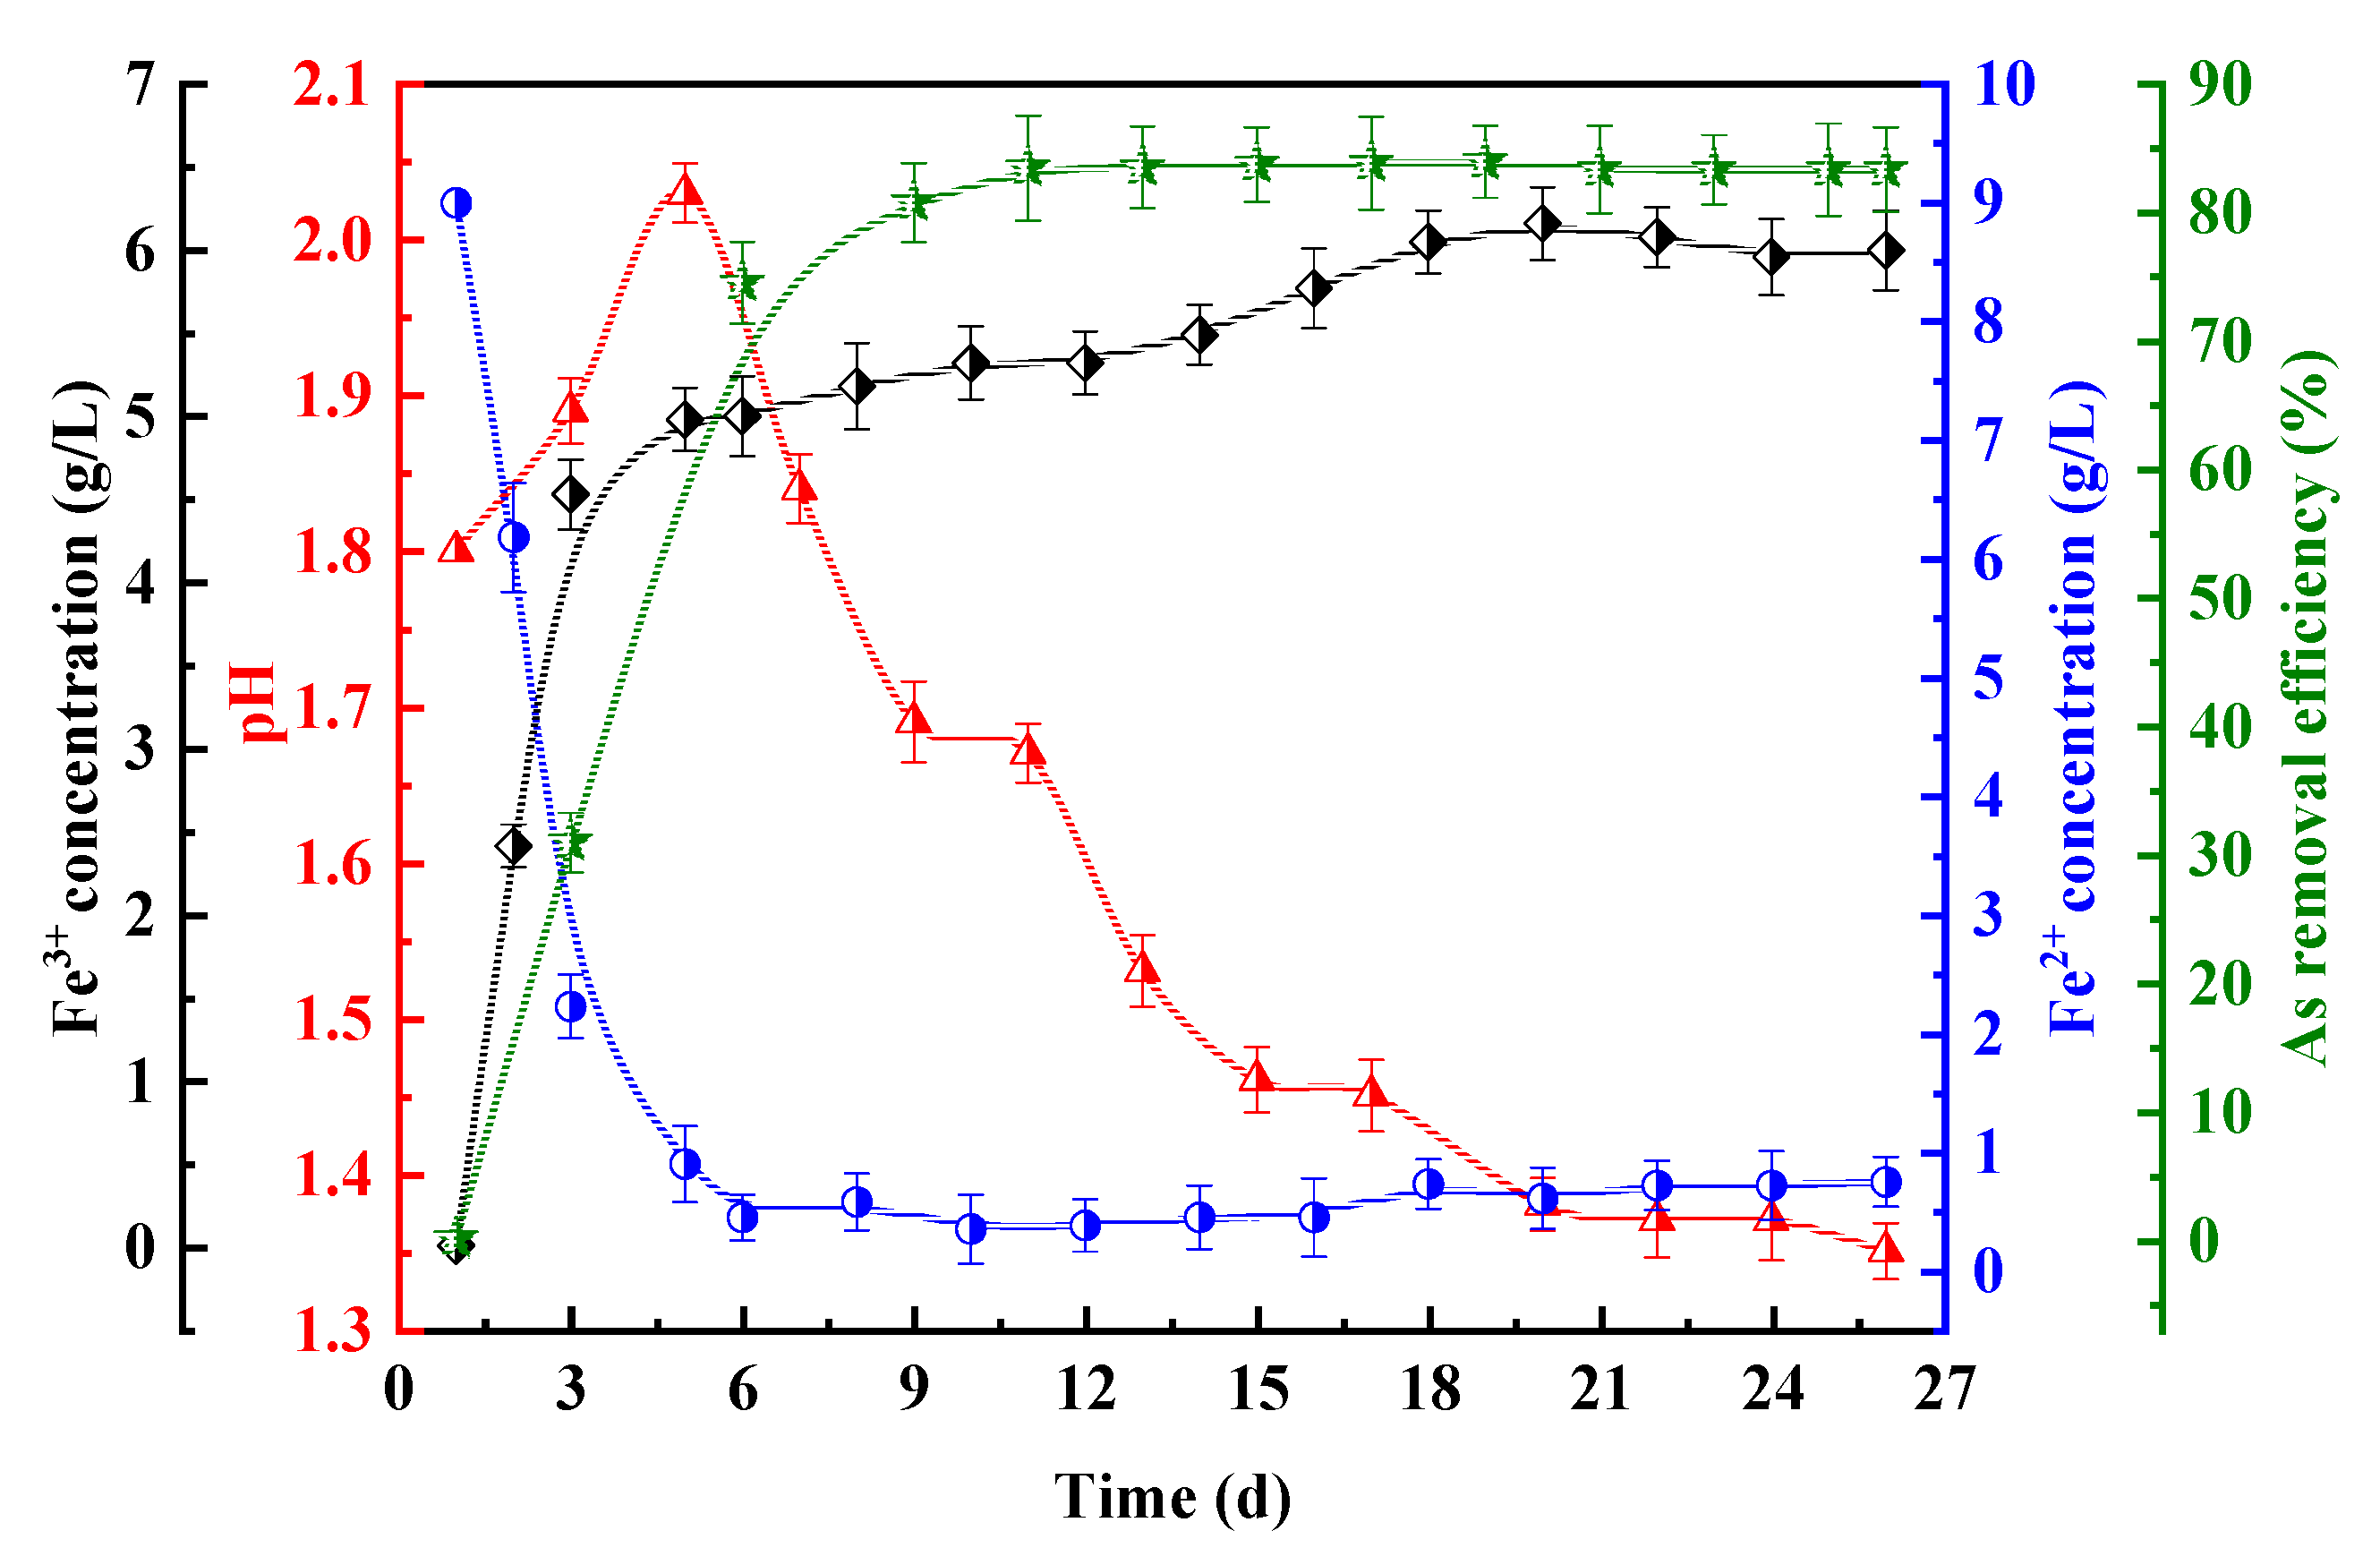
In general, the pretreatment of the refractory gold concentrate is required to improve the gold extraction. The main pretreatment technologies include roasting [19], chemical oxidation [20], pressure oxidation [21], and biological oxidation [22], and bio-oxidation technology has been proved to be cleaner than conventional methods [23]. At present, the commonly used leaching bacteria mainly include Acidithiobacillus ferrooxidans (A. ferrooxidans), Leptospirillum ferrooxidans, Acidithiobacillus thiooxidans, ect. [24]. In this work, the A. ferrooxidans was used to oxidize the refractory gold ore, and then the effects of various operational parameters such as the leaching time, initial pH, temperature, TU dosage, stirring speed, and ferric iron concentration on the gold recovery and TU consumption in the leaching process were investigated. Then, the GRA method was adopted to explore the relationship between the six influencing variables and the gold recovery and TU consumption. Finally, an ANN model was established to predict the effects of the influencing variables on the gold recovery and TU consumption. These methods can provide effective guidance for the control of experimental conditions in the TU gold leaching process.

2. Materials and Methods

2.1. Mineral Sample and Reagents

The high-sulfur and high-arsenic refractory gold concentrate utilized in this experiment was ground to a particle size of 88.0% < 48 µm. Its chemical composition is shown in Table 1 and Table 2 by X-ray fluorescence (XRF) analysis. The contents of Fe, S and As were quantitatively determined by an inductively coupled plasma-atomic emission spectrometry ICP-AES (PS-6, Baird), which revealed 18.96 ± 0.41% Fe, 19.71 ± 0.54% S, and 9.03 ± 0.29% As in the concentrate. The gold content was 34.85 g/t. Figure 1 presents the XRD pattern of this concentrate, where quartz, pyrite, arsenopyrite, muscovite, and calcite were identified. The chemical phases of Au, As, and S are shown in Table 2. As indicated, only 5.22% of gold was leachable, while others were mainly encapsulated in arsenopyrite, oxides, and sulfides. Arsenopyrite was the main gold-bearing component, and its content was 53.57%. Most (92.64%) of the S occurred as sulfide (mainly arsenopyrite and pyrite), and 67.55% of the As occurred as arsenopyrite. Experimental results showed that the leaching rate of TU from the refractory gold concentrate without biological oxidation was only 25.2%.
The reagents used in this study were all analytically pure, and redistilled water was used throughout all the experiments.

2.2. Microorganism and Culture Conditions

A. ferrooxidans used in the bio-oxidation process was isolated from a low-altitude area near the coast of Xiamen, China. It was cultured in 9K medium containing 3 g/L of (NH4)2SO4, 0.1 g/L of KCl, 0.5 g/L of MgSO4·7H2O, 0.5 g/L of K2HPO4, and 0.01 g/L of Ca(NO3)2, supplemented with 44.7 g/L of FeSO4·7H2O as the energy source. The culture was adapted to the high-arsenic gold concentrate by serially culturing the microorganism in the presence of 20 g/L refractory concentrate particles. The adaptation procedure was carried out in 250 mL Erlenmeyer flasks containing 100 mL of 9K culture medium and 15 mL of inoculum on a rotary incubator at 30 °C and 160 rpm. The initial pH was adjusted to 1.8 with 3 M of sulphuric acid.

2.3. Bio-Oxidation Experiments

The bio-oxidation experiments were carried out in 250 mL Erlenmeyer flasks with 100 mL of 9K medium (containing 44.7 g/L of FeSO4·7H2O), and the pulp density was 20 g/L of gold concentrate. The inoculations were 20 mL cell suspensions of A. ferrooxidans, with 108 cells/mL of microbial culture. The remaining experimental conditions were the same as the Section 2.2. All the oxidation residues were collected, filtered, and washed with redistilled water to remove the soluble components. Then, they were dried in a vacuum at 35 °C for 48 h and weighed for the subsequent TU leaching experiment.
The variations in parameters over time during the bio-oxidation process with A. ferrooxidans are shown in Figure 2.
It can be seen that an increase in pH was observed in the first 5 days. This may occur due to the decomposition of small amounts of alkaline oxides [25] or the H+ consumed by the growth of A. ferrooxidans (Equation (1)). Subsequently, the pH decreased from 2.03 to 1.35, and no increase was observed along the rest of the experiment. The pH reduction was caused by the H+ generation from oxidation reactions of the sulfide minerals [26], which can be explained by Equations (2)–(5). The ferrous ions initially added were oxidized to Fe3+ significantly after the first 3 days, then reached a steady state and were maintained 0.74 g/L until the end of the experiment. Meanwhile, the concentration of ferric ions increased rapidly from 0 g/L to 4.53 g/L within 3 days and finally obtained 6 g/L. The reason for this trend was that the growth of bacteria requires energy derived from the bio-oxidation of Fe2+ to Fe3+ [27]. The total dissolved Fe reduced significantly until the end of the experiment. It was stated that the soluble Fe3+ is extremely unstable under almost all environmental conditions besides low pH and high redox potential, which can form iron precipitates [1,28] such as jarosite, according to Equation (6). In addition, the Fe2+/Fe3+ ratio is an important parameter to evaluate the effect of the microbial oxidation of ferrous iron [29]. The ratio of Fe2+/Fe3+ is also related to the redox potential according to the Nernst equation (Equation (7)). The ratio of Fe2+/Fe3+ rose during the process of bio-oxidation—that is, the redox potential increased. A higher redox potential in the solution can provide a stronger driving force for the oxidation of concentrate. The As removal efficiency increased from 0% to 74.53% within the first 6 days and then increased slowly. It attained equilibrium at the 11th day and remained almost constant along the rest of the experiment, reaching a final 83.36%. It can be observed that the bio-oxidation process appeared to have been inhibited after the sixth day. This might be because the high toxicity of dissolved arsenic in the bio-oxidation system can seriously inhibit the microbial activity and further inhibit the bio-oxidation process [30].
4 Fe 2 + ( aq ) + O 2 ( aq ) + 4 H + ( aq ) A .   f e r r o o x i d a n s 4 Fe 3 + ( aq ) + 2 H 2 O ( l ) ,
2 S 0 ( s ) + 3 O 2 ( aq ) + 2 H 2 O   ( l ) A .   f e r r o o x i d a n s   4 H + ( aq ) + 2 SO 4 2 ( aq ) ,
FeAsS ( s ) + 5 Fe 3 + ( aq ) + 3 H 2 O ( l ) 6 Fe 2 + ( aq ) + H 3 AsO 3 ( aq ) + S 0 ( s ) + 3 H + ( aq ) ,
  2 Fe 3 + ( aq ) + 2 H 3 AsO 4 ( aq ) 2 FeAsO 4 ( s ) + 6 H + ( aq ) ,
F e S 2 ( s ) + 14 F e 3 + ( a q ) + 8 H 2 O ( l ) 15 F e 2 + ( a q ) + 16 H + ( a q ) + 2 S O 4 2 ( a q ) ,
3 Fe 3 + ( aq ) +   K + ( aq ) +   6 H 2 O ( l ) + 2 SO 4 2   ( a q ) KFe 3 ( SO 4 ) 2 ( OH ) 6 ( s ) + 6 H + ( aq ) ,
E = E θ R T z F ln Fe 2 + Fe 3 +

2.4. TU Leaching Experiments

TU leaching experiments were performed in 250 mL beakers placed in a water bath fitted with a stirrer. Into each beaker was added 20 g of bio-oxidation residue, and 60 mL of sterilized bio-oxidation solution or fresh 9K medium containing the desired quantities of leaching reagents were also transferred into the beaker. For the leaching experiments, the influence of six parameters, such as the leaching time, initial pH, temperature, TU dosage, stirring speed, and ferric iron concentration, on the gold recovery and TU consumption in the leaching process was investigated. The pH was kept constant throughout the experiment. All the experiments were repeated three times, and a standard deviation of 1% was obtained in this study. The results of the gold recovery and TU consumption along with the operating conditions are presented in Table 3.

2.5. Analytical Methods

The solutions and mineral samples were separately collected by filtration after bio-oxidation and TU leaching experiments for analysis. The pH was measured using a pH meter (PHSJ-4A, Shanghai Leici, Shanghai, China). The concentrations of iron, gold, and arsenic in the solutions were determined by inductively coupled plasma-atomic emission spectrometry (ICP-AES) (PS-6, Baird, TX, USA). The concentrations of Fe2+ ions in the solutions were determined by complexometric titration with potassium dichromate. The concentration of TU was detected by a complexometric titration with KIO3 [31]. The content of gold in the concentrate was analyzed by a fire assay. The mineralogical phase of the concentrate was determined using an X-ray diffractometer (XRD) (D/Max 2500, Rigaku, Tokyo, Japan).

2.6. Grey Relational Analysis

GRA can rapidly and expediently explore the main relationships among various factors and identify the relevant factors that have a significant influence on certain objectives [32]. In this paper, GRA was carried out for six influencing variables (leaching time, initial pH, temperature, TU dosage, stirring speed, ferric iron concentration) and 42 datasets, and the gold recovery and TU consumption were taken as the reference sequences. Then, the relational degree can be calculated to explore the relationship between the six influencing variables and the gold recovery and TU consumption with the range of their levels considered in this work.

2.6.1. Data Collection and Analysis

Firstly, the experimental data was collected and preprocessed for analysis. The raw influencing variables chosen were the leaching time, initial pH, temperature, TU dosage, stirring speed, and ferric iron concentration. The raw data matrix is shown as follows:
( X 1 ,   X 2 ,   X n ) = ( x 1 ( 1 ) x 2 ( 1 ) x n ( 1 ) x 1 ( 2 ) x 2 ( 2 ) x n ( 2 ) x 1 ( m ) x 2 ( m ) x n ( m ) ) ,
where n is the number of data sequences, and m is the number of parameters, and it can be converted to:
X i = ( x i ( 1 ) ,   x i ( 2 ) , , x i ( m ) ) T ,   i = 1 ,   2 , , n .
The gold recovery and TU consumption were chosen to construct the following reference matrix:
{ Y 1 = ( y 1 ( 1 ) ,   y 1 ( 2 ) , ,   y 1 ( m ) ) Y 2 = ( y 2 ( 1 ) ,   y 2 ( 2 ) , ,   y 2 ( m ) ) ,
where Y 1 represents the sequence of gold recovery, and Y 2 represents the sequence of TU consumption.

2.6.2. The Normalization of Raw Data

The physical interpretation of each parameter is different in the experiment, leading to the different ranges of the data, and is not suitable for longitudinal comparison. Therefore, data normalization need to be carried out in the GRA. The normalized experimental results were obtained using the following method:
x i ( k ) = x i ( k ) x ¯ s ,
where:
s = 1 n 1 i = 1 n ( x i ( k ) x ¯ ) 2 ,
x ¯ = 1 n i = 1 n x i ( k ) ,
where s is the standard deviation, and x ¯ is the average. The standard method for reference sequences is the same as that above.
The normalized data sequence can be expressed as the following matrix:
( Y j , X 1 , ,   X n ) = ( y j ( 1 ) x 1 ( 1 ) x n ( 1 ) y j ( 2 ) x 1 ( 2 ) x n ( 2 ) y j ( m ) x 1 ( m ) x n ( m ) ) ,   j = 1 , 2 .

2.6.3. Calculation of Maximum and Minimum Values

An important step in GRA is to use the difference between the parameter sequence and the reference sequence to measure the degree of difference. In order to avoid the negative value, the absolute value was calculated. The sequence of difference between each parameter sequence and the reference sequence was calculated by the following method:
{ A s i ( k ) = | y 1 ( k ) x i ( k ) | A s i ( k ) = | y 2 ( k ) x i ( k ) |   , k = 1 , , m , i = 1 , , n .
The following formula is used to obtain the maximum and minimum values:
{ L m i = min i = 1 n   min k = 1 m   A s i ( k ) H m i = max i = 1 n   max k = 1 m   A s i ( k )   ,   k = 1 , , m ,   i = 1 , , n ,
where Lmi and Hmi represent the minimum and maximum of the reference sequence, respectively.

2.6.4. Calculation of Relational Coefficient

The relational coefficients were calculated to reflect the relationship of the corresponding elements between the parameter sequences and reference sequences. The grey relational coefficient can be expressed as:
ζ i ( k ) = L m i + ρ H m i A s i ( k ) + ρ H m i ,   k = 1 , , m ,
where ρ is the distinguishing coefficient (0 < ρ < 1)—here, ρ = 0.5.

2.6.5. Calculation of Relational Degree

The grey relational degree can be further calculated based on the relational coefficients:
R i = k = 1 m ζ i ( k ) m .
The flow chart of the GRA is shown in Figure 3. The main analysis steps can be summarized as: (1) the pre-processing of raw data, including the normalization and difference calculation of data, etc.; (2) the calculation of the relational coefficient; and (3) the calculation of the relational degree.

2.7. Artificial Neural Network (ANN)

ANN models for predicting the gold recovery and TU consumption in the TU leaching of gold process were constructed using the neural network toolbox under the Matlab R2016a compilation environment. The Levenberg Marquardt optimization algorithm was used for training. The process of modeling was performed using the 42 datasets collected from leaching experiments (Table 3). Moreover, 36 datasets were used for training, and 6 datasets were used for testing. The choice of the subsets was performed randomly by the software (Matlab R2016a). The inputs to the network were the leaching time, initial pH, temperature, TU dosage, stirring speed, and ferric iron concentration. The outputs were the gold recovery and TU consumption. Before training, the ANN input and output datasets were normalized to reduce the outliers’ influence and increase the network training efficiency [33]. Moreover, it is necessary to determine the structure of the network and other configurations for constructing the structure of the ANN model. However, there is no general guideline to determine the optimal configurations for the network model. If these configurations are not appropriate, the ANN model will not work stably, so each layer structure and transfer function of the hidden layers were validated with several different initial conditions to ensure that the proposed model was the best solution within an acceptable limit. In this network, a feed-forward backprop (BP) artificial neural network with 6-10-2-2 arrangement and the transfer function of “TANSIG” was selected as the optimum configuration. During the training of the ANN model, the outputs were compared to the expected outputs and the errors were calculated. The selected topology was repeated 101 times to avoid random correlations as much as possible caused by the random initialization of the neuron weights. The architecture and algorithm principles for the ANN are shown in Figure 4.
Model validation and evaluation is an important element in the process of model constructing, which can effectively evaluate whether the model adopted has evolved sufficiently accurate results for the objectives [34]. In general, model validity refers to the quantitative representation of the degree of consistency between the model output results and actual system characteristics. It mainly studies the reliability and accuracy of the model. In addition, clear and objective tests of the underlying assumptions can be made by means of statistical descriptions that can be used to determine model accuracy. Therefore, the mean absolute error (MAE) and root mean square error (RMSE) were used to reflect the degree of difference between the predictive values and the actual values. The MAE is an average of the absolute errors, which can better reflect the actual situation of the predicted value error. RMSE can evaluate the degree of data deviation, and the smaller the value of the RMSE, the more accuracy the prediction model has in describing the experimental data. The MAE and RMSE are calculated according to Equations (19) and (20):
M A E = 1 N i = 1 N | y ^ i y i | ,
R M S E = 1 N i = 1 N ( y i y ^ i ) 2 ,  
where N is the number of samples, yi is the expected value, and y ^ i is the predicted value.

3. Results and Discussion

3.1. Relative Importance of Influencing Variables

The relational degree between the various influencing variables and the gold recovery and TU consumption are shown in Table 4. It can be seen that all the relational degree values were between 0 and 1, and the larger the value is, the closer the relationship is between the influencing variables and reference sequences [35]. From Table 4, it can be seen that all the influencing variables had an important influence on gold recovery. For the six influencing variables, the relational degree of temperature was the highest (relational degree: 0.783), followed by the leaching time and ferric iron concentration (relational degree: 0.779 and 0.778). In addition, the relational degree of temperature was the highest (relational degree: 0.762), followed by the leaching time (relational degree: 0.757), but stirring speed had a little influence on the TU consumption.
From these results, it is clear that the temperature was the one of the most important parameters, simultaneously affecting the gold recovery and TU consumption. This is mainly because the solution temperature can affect the diffusion rate of TU [36], and the reaction rate of TU and gold was accelerated with the increase in the solution temperature. Additionally, the decomposition rate of TU is accelerated, which leads to a large amount of reagent consumption. In addition, the TU dosage and ferric iron concentration were important parameters in acidic TU leaching, and there was a significant interaction between the TU concentration and ferric iron concentration. Previous studies have suggested that the overall recovery of gold can be improved by increasing the concentration of these reagents up to a certain value. However, the main disadvantage was the high TU consumption [12]. This process can be expressed as the following reactions [9].
2 SC ( NH 2 ) 2 + 2 Fe 3 +   =   S 2 C 2 ( NH ) 2 ( NH 2 ) 2 + 2 Fe 2 + + 2 H + ,
2 Au + 2 SC ( NH 2 ) 2 + S 2 C 2 ( NH ) 2 ( NH 2 ) 2 + 2 H +   =   2 Au ( SC ( NH 2 ) 2 ) 2 + ,
with the overall reaction:
Au + 2 SC ( NH 2 ) 2 + Fe 3 +   =   Au ( SC ( NH 2 ) 2 ) 2 + + Fe 2 + ,
S 2 C 2 ( NH ) 2 ( NH 2 ) 2   SC ( NH 2 ) 2 + H 2 NCN   +   S .
According to the reactions, formamidine disulfide (FDS), which can oxidize gold, is formed as a result of the reversible Equation (21). The oxidation product forms part of the cationic complex ligand of Au(TU)2+ (Equation (22)). However, FDS can be oxidized to by-products irreversibly, as shown in Equation (24). It may result in an increase in the TU consumption and also decrease the contacting surface area as the coverage of the ore surface by the formation of the elemental sulfur. In addition, the initial pH also had a good correlation with the TU consumption. When the initial pH of the solution was >1.78, the consumption of TU increased with the increase in pH, and thus the dissolution rate of gold reduces due to hydrolysis [9]. In addition, the dissolution rate of gold increased with the increase in the leaching time and stirring speed. However, the stability of TU decreased when the leaching time is prolonged, and elemental sulfur is generated on the surface of gold particles to form a passivation film. Further, when the stirring speed increases to a certain value, the thickness of the mass transfer boundary layer will not decrease and the energy consumption will increase. As mentioned above, it is feasible to establish a neural network model to explore the mapping between these influencing variables and the gold recovery and TU consumption.

3.2. Performance of the Independent ANN Models

The performance of the ANN model in terms of training and prediction was discussed. As shown in Figure 5, the correlation coefficients (R-value) of the ANN model were all over 0.99 in the training process, which obtained R-values of 0.99224, 0.99327, and 0.9981 for the training, testing, and validation set, respectively. This suggested that the output tracked the target very well, and the network response was satisfactory.
The primary purpose for training the ANN model is to make it have a high and stable prediction ability and to ensure its effectiveness and reliability. To further verify the prediction accuracy of the ANN model, some additional test experiments were put into effect. A total of six tests were selected randomly from each independent variable experiment. The prediction results of 101 times by ANN are presented in Figure 6. It can be seen that the absolute errors of gold recovery varied from 1.46% to 3.45%, and the accuracy of the predictions was between 94.46% and 98.06%. The absolute errors of TU consumption varied from 0.079 to 0.428 kg/t, and the accuracy of the predictions was between 95.15% and 99.20%. The values of MAE and RMSE for the output sets of the ANN model were calculated to be 1.9226 and 2.0785 for gold recovery, as well as 0.2809 and 0.3352 for Tu consumption, respectively (Table 5). The results showed a high prediction accuracy for the trained model, which proved the effectiveness of the established ANN model.
According to the above analysis, the six input variables proposed in this paper are important parameters to be considered in the design of the TU leaching of gold process. However, the experimental data and input variables were limited. Therefore, more input variables and experimental datasets need to be considered in the future, such as the slurry concentration and particle size, so as to train the neural network model with a better performance and make it adapt to the complex experimental environment and data characteristics. Since TU can be used as an alternative ligand to cyanide for gold leaching, in most gold leaching applications, the TU consumption is high [6]. Thus, the accurate prediction of gold recovery and TU consumption changes during the leaching process using the ANN model can effectively guide the selection of experimental conditions, which is of great significance for cost savings and resource extraction.

4. Conclusions

In this paper, the optimum conditions of effective parameters for the TU leaching of gold were determined. According to the results, 77.6% of gold was extracted at a leaching time of 4.0 h, with an initial pH of 1.5, temperature of 35 °C, TU concentration of 6.0 g/L, stirring speed of 400 r/min, and ferric iron concentration of 9.33 g/L using 8.1 kg/t of TU. In addition, an ANN model was established to simultaneously predict the gold recovery and TU consumption in the process of leaching gold with TU. Prior to establishing the ANN model, the GRA was performed to investigate the relational degree between the selected parameters and the gold recovery and TU consumption, which is critical for the TU leaching process prediction. The main conclusions were summarized as follows:
(1)
The relational degree of all the influencing parameters collected from the TU leaching process related to the gold recovery and TU consumption was analyzed in GRA. The results showed that the temperature, leaching time and amount of agents have a significant influence on the gold recovery and TU consumption, but the initial pH and stirring speed had a little influence.
(2)
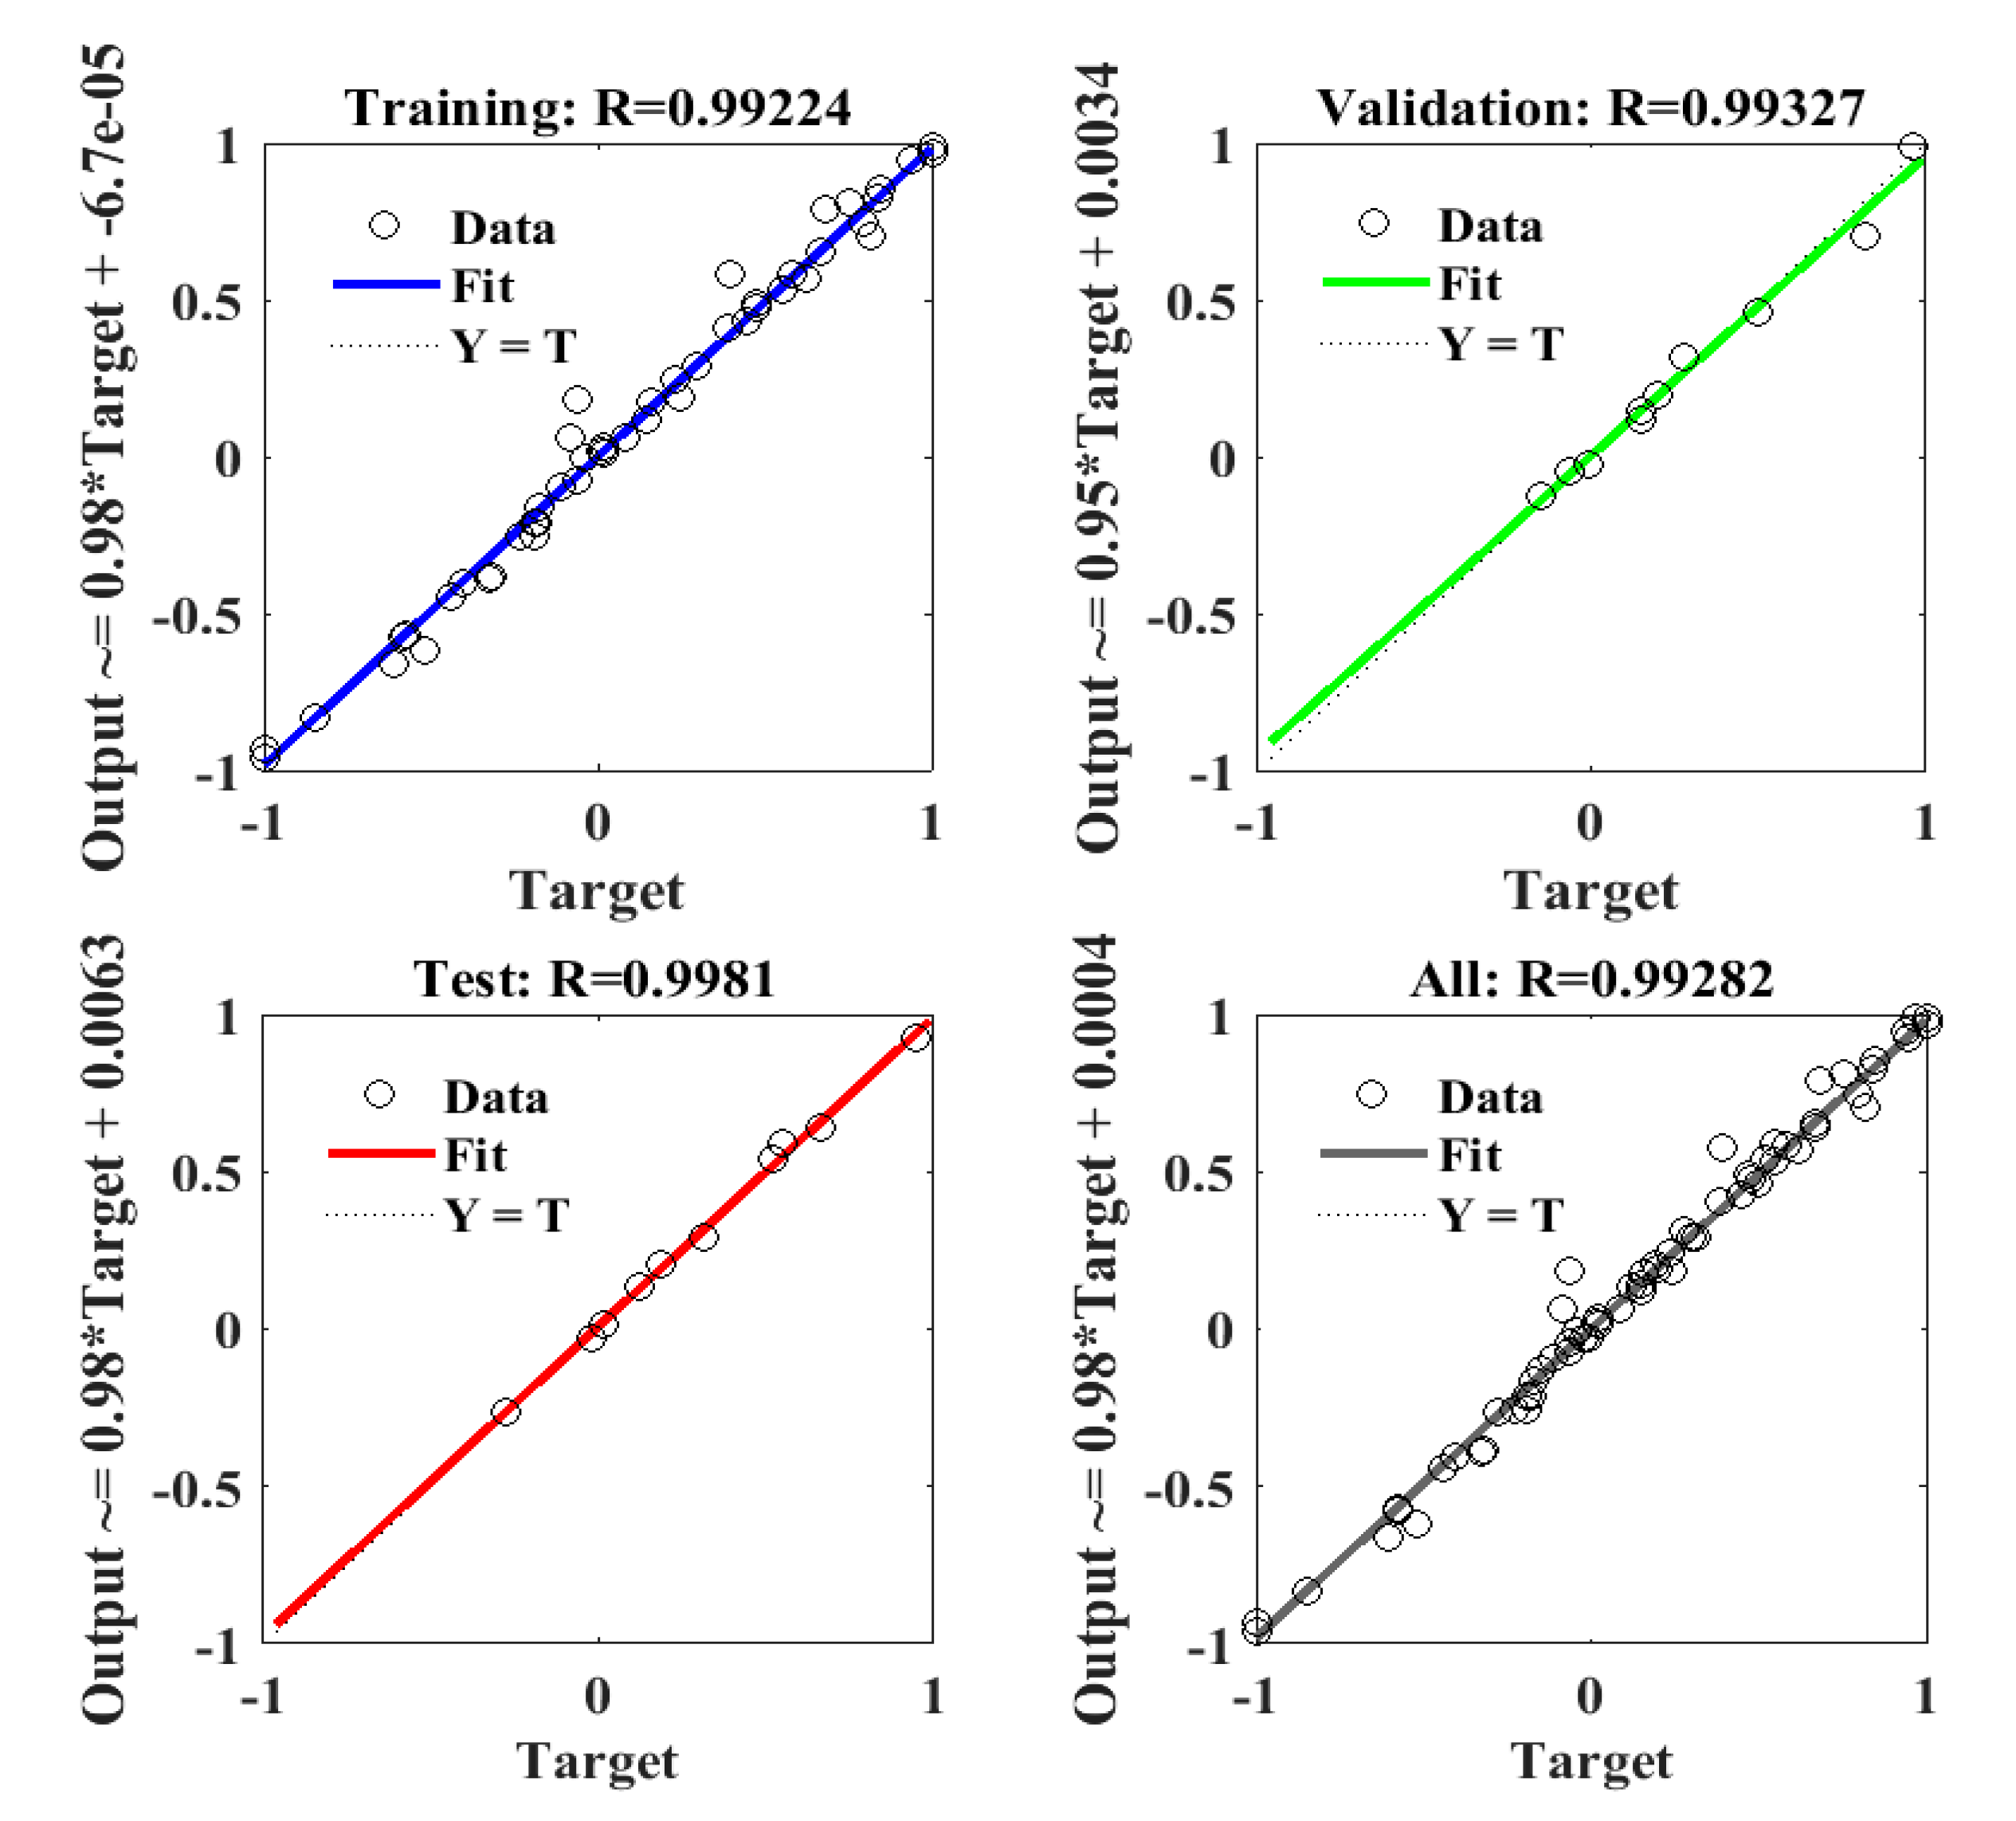
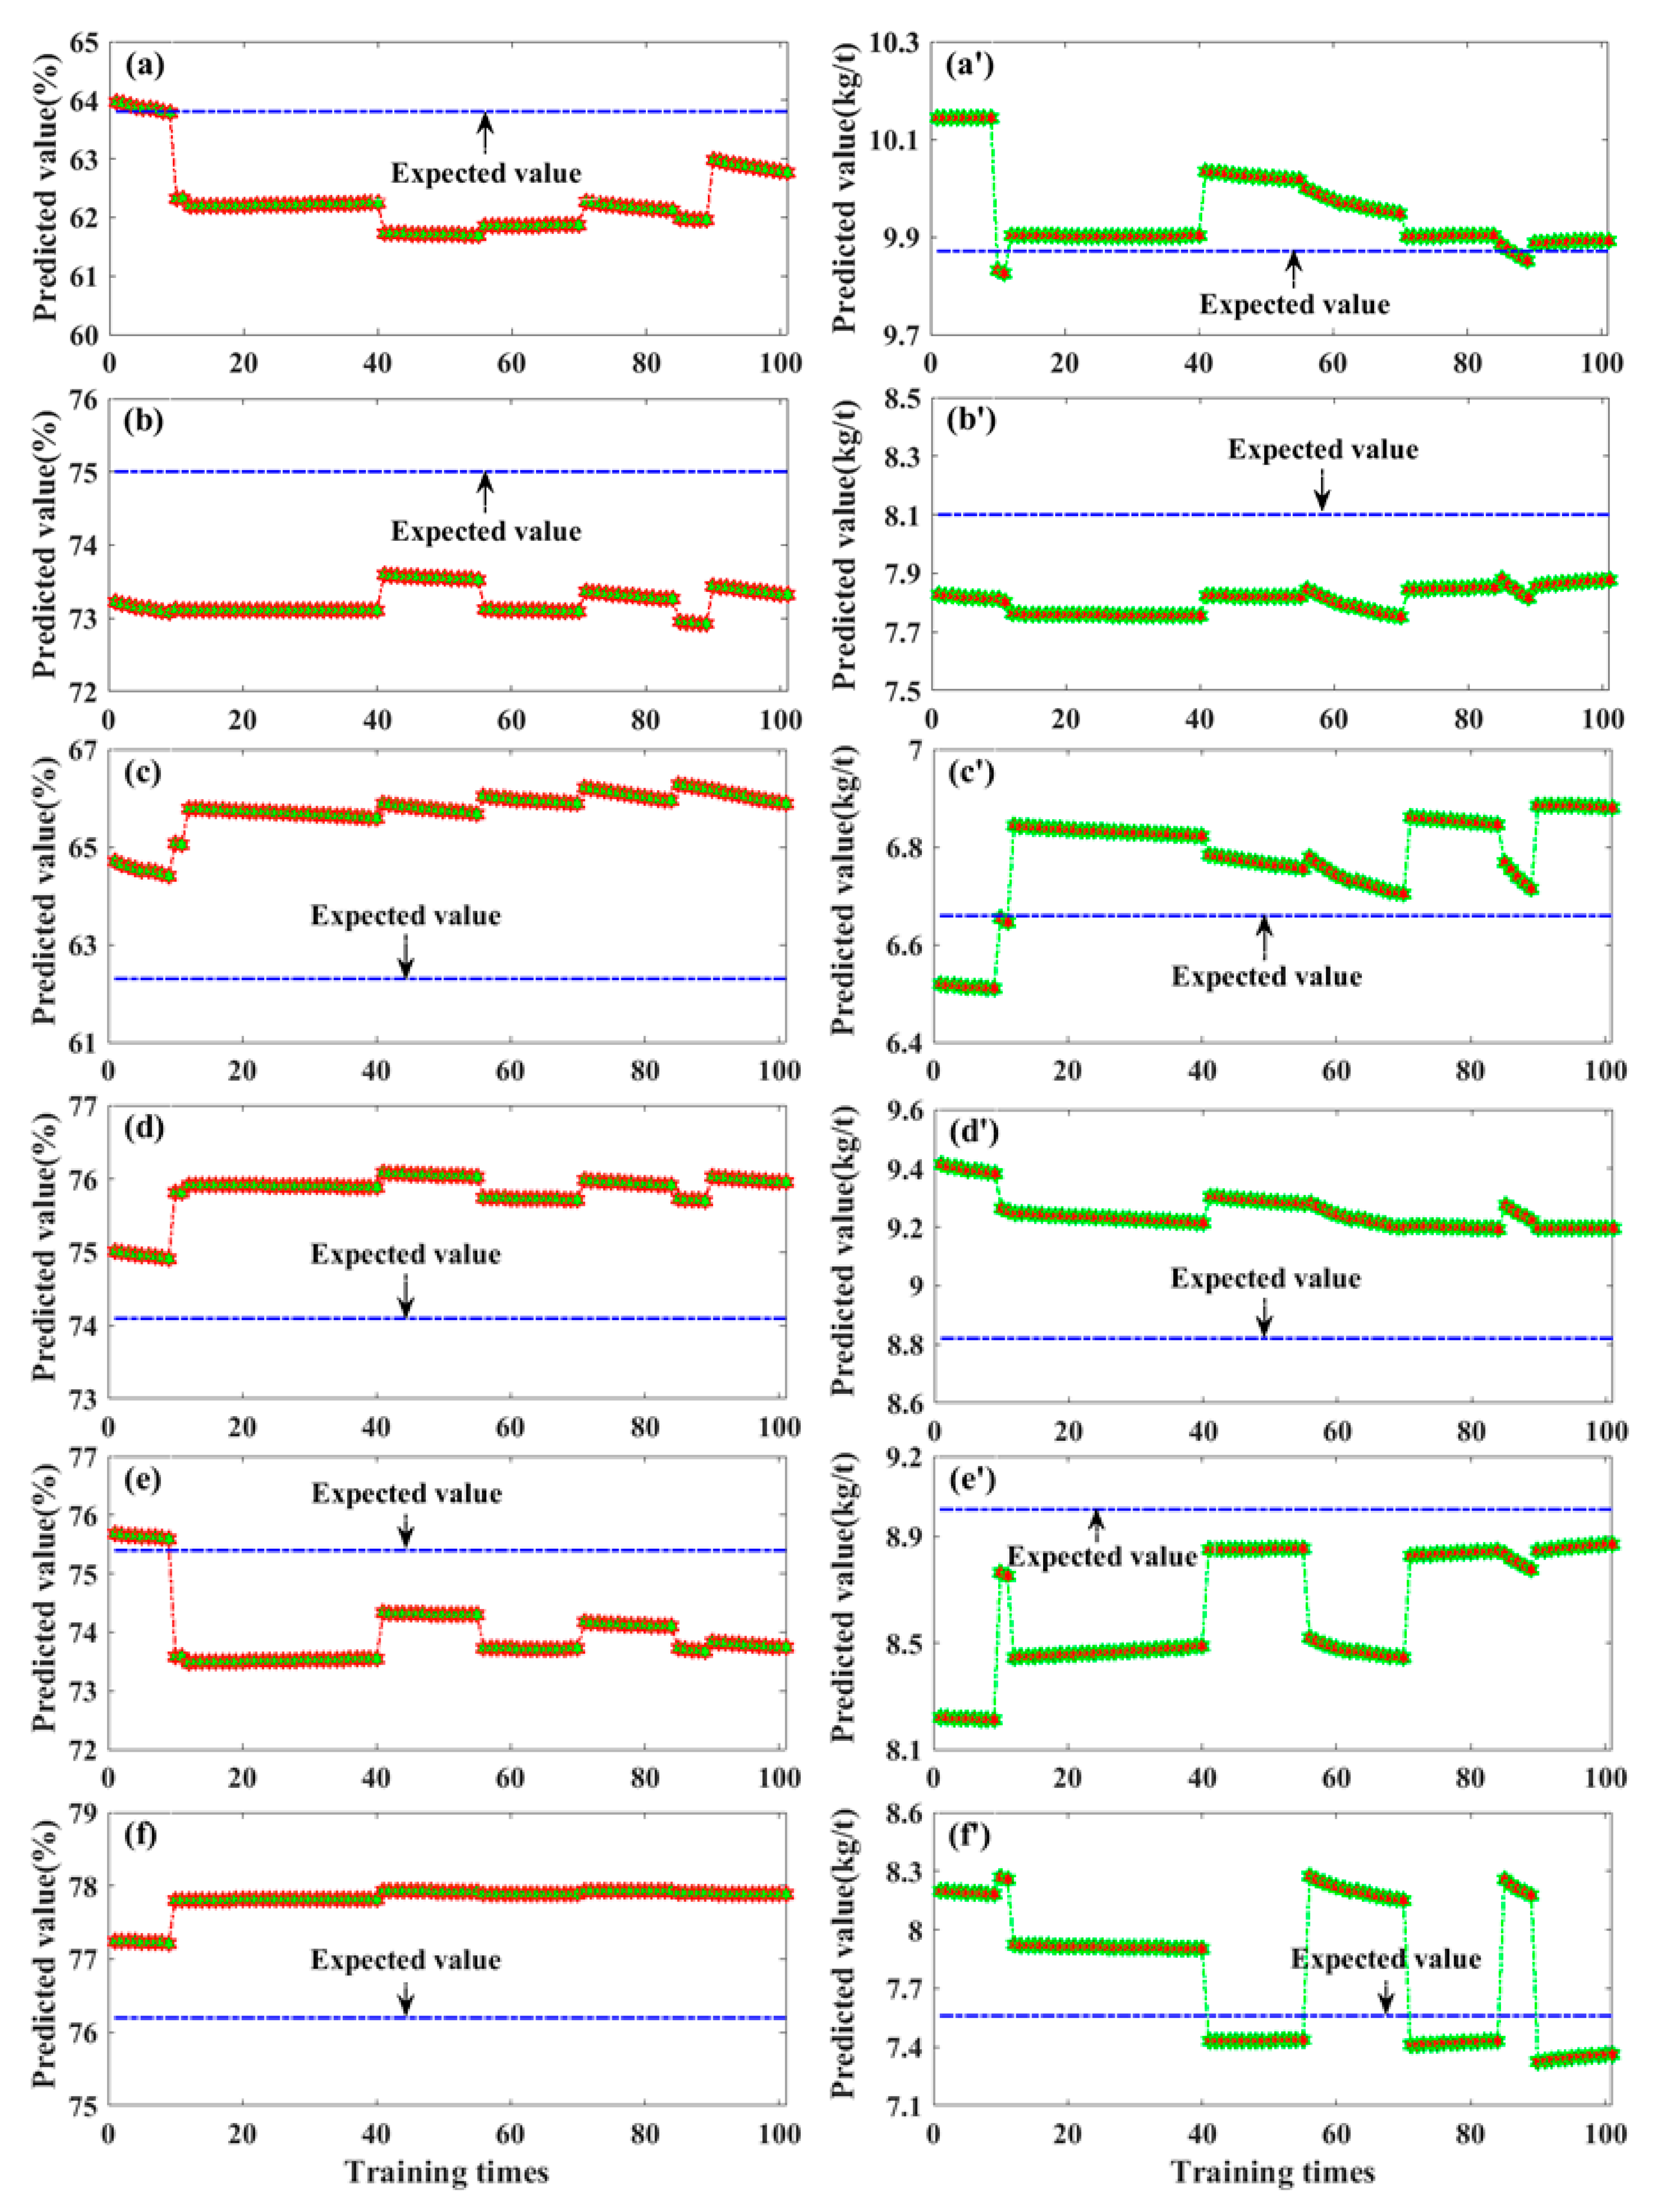
The prediction results obtained by the ANN model were quite satisfactory. It achieved quite a high correlation coefficient (R > 0.99) for the training, testing, and validation stages. The performance evaluation showed that the MAE was 1.9226 and the RMSE was 2.0785 for gold recovery, and the MAE was 0.2809 and the RMSE was 0.3352 for TU consumption. In addition, the prediction accuracy reached over 94% for gold recovery and 95% for TU consumption. These results showed that the predicted values were in excellent agreement with the experimental values, and the validity of the model was verified.
In summary, the GRA and the ANN model can reflect the practice efficiently and also provide effective suggestions for controlling the optimum parameters in the leaching process. Furthermore, more operating conditions and experimental data need to be considered in future work in order to train the neural network model with a better performance. Besides, the technical, economic, and environmental benefits should be considered together when establishing the ANN model.

Author Contributions

Software, writing—original draft preparation, visualization, R.X. and X.N.; conceptualization, methodology, investigation, F.M.; resources, writing—review and editing, funding acquisition, Q.L.; validation, formal analysis, X.C. and Y.Y.; data curation, B.X.; supervision, T.J. All authors have read and agreed to the published version of the manuscript.

Funding

Financial supports from the National Key Research and Development Program of China (No. 2018YFE0110200), the National Natural Science Foundation of China (Grant No. 51574284), and the Science and Technology Planning Project of Yunnan Province (2018ZE001) are all gratefully acknowledged.

Conflicts of Interest

The authors declare no conflict of interest.

Nomenclature

TUthiourea
ANNartificial neural network
GRAgrey relational analysis
FDSformamidine disulfide
Ltleaching time
Ttemperature
Tdthiourea dosage
Ssstirring speed
Fcferric iron concentration
sstandard deviation
CTuthiourea consumption
Ehredox potential
Asabsolute difference
Lmminimum value
Hmmaximum value
ζgrey relational coefficient
Rgrey relational degree
MAEthe mean absolute error
RMSEthe root mean square error
RAugold recovery

References

  1. Hong, J.; Silva, R.A.; Park, J.; Lee, E.; Park, J.; Kim, H. Adaptation of a mixed culture of acidophiles for a tank biooxidation of refractory gold concentrates containing a high concentration of arsenic. J. Biosci. Bioeng. 2016, 121, 536–542. [Google Scholar] [CrossRef] [PubMed]
  2. Ofori-Sarpong, G.; Osseo-Asare, K. Preg-robbing of gold from cyanide and non-cyanide complexes: Effect of fungi pretreatment of carbonaceous matter. Int. J. Miner. Process. 2013, 119, 27–33. [Google Scholar] [CrossRef]
  3. Birich, A.; Stopic, S.; Friedrich, B. Kinetic Investigation and Dissolution Behavior of Cyanide Alternative Gold Leaching Reagents. Sci. Rep. 2019, 9, 7191. [Google Scholar] [CrossRef] [PubMed]
  4. Grosse, A.C.; Dicinoski, G.W.; Shaw, M.J.; Haddad, P.R. Leaching and recovery of gold using ammoniacal thiosulfate leach liquors (a review). Hydrometallurgy 2003, 69, 1–21. [Google Scholar] [CrossRef]
  5. Xu, B.; Kong, W.; Li, Q.; Yang, Y.; Jiang, T.; Liu, X. A Review of Thiosulfate Leaching of Gold: Focus on Thiosulfate Consumption and Gold Recovery from Pregnant Solution. Metals 2017, 7, 222. [Google Scholar] [CrossRef]
  6. Guo, Y.; Guo, X.; Wu, H.; Li, S.; Wang, G.-H.; Liu, X.; Qiu, G.-Z.; Wang, D. A novel bio-oxidation and two-step thiourea leaching method applied to a refractory gold concentrate. Hydrometallurgy 2017, 171, 213–221. [Google Scholar] [CrossRef]
  7. Fleming, C.A.; McMullen, J.; Thomas, K.G.; Wells, J.A. Recent advances in the development of an alternative to the cyanidation process: Thiosulfate leaching and resin in pulp. Min. Met. Explor. 2003, 20, 1–9. [Google Scholar] [CrossRef]
  8. Parker, G.; Hope, G.A. Spectroelectrochemical investigations of gold leaching in thiourea media. Miner. Eng. 2008, 21, 489–500. [Google Scholar] [CrossRef]
  9. Gonen, N.; Körpe, E.; Yıldırım, M.; Selengil, U.; Yildirim, M. Leaching and CIL processes in gold recovery from refractory ore with thiourea solutions. Miner. Eng. 2007, 20, 559–565. [Google Scholar] [CrossRef]
  10. Hisshion, R.J.; Waller, C.G. Recovering gold with thiourea. Min. Mag. 1984, 151, 237, 239, 241, 243. [Google Scholar]
  11. Chen, C.; Lung, T.; Wan, C. A study of the leaching of gold and silver by acidothioureation. Hydrometallurgy 1980, 5, 207–212. [Google Scholar] [CrossRef]
  12. Olyaei, Y.; Noparast, M.; Tonkaboni, S.Z.S.; Haghi, H.; Amini, A. Response of low-grade gold ore to cyanidation and thiourea leaching. Part. Sci. Technol. 2017, 37, 86–93. [Google Scholar] [CrossRef]
  13. Hilson, G.; Monhemius, A.; Monhemius, A. Alternatives to cyanide in the gold mining industry: What prospects for the future? J. Clean. Prod. 2006, 14, 1158–1167. [Google Scholar] [CrossRef]
  14. Tanrıverdi, M.; Mordoğan, H.; Ipekoğlu, Ü. Leaching of Ovacık gold ore with cyanide, thiourea and thiosulphate. Miner. Eng. 2005, 18, 363–365. [Google Scholar] [CrossRef]
  15. Rahmanian, B.; Pakizeh, M.; Mansoori, S.A.A.; Abedini, R. Application of experimental design approach and artificial neural network (ANN) for the determination of potential micellar-enhanced ultrafiltration process. J. Hazard. Mater. 2011, 187, 67–74. [Google Scholar] [CrossRef] [PubMed]
  16. Ahmadzadeh, F.; Lundberg, J. Remaining useful life prediction of grinding mill liners using an artificial neural network. Miner. Eng. 2013, 53, 1–8. [Google Scholar] [CrossRef]
  17. Ghaedi, M.; Ghaedi, A.; Negintaji, E.; Ansari, A.; Mohammadi, F. Artificial neural network—Imperialist competitive algorithm based optimization for removal of sunset yellow using Zn(OH)2 nanoparticles-activated carbon. J. Ind. Eng. Chem. 2014, 20, 4332–4343. [Google Scholar] [CrossRef]
  18. Yin, X.-G.; Yu, W. Selection and Evaluation of Input Parameters of Neural Networks Using Grey Superior Analysis. Text. Res. J. 2007, 77, 375–386. [Google Scholar] [CrossRef]
  19. Kim, B.-J.; Cho, K.; Lee, S.-G.; Park, C.; Choi, N.; Lee, S. Effective Gold Recovery from Near-Surface Oxide Zone Using Reductive Microwave Roasting and Magnetic Separation. Metals 2018, 8, 957. [Google Scholar] [CrossRef] [Green Version]
  20. Bidari, E.; Aghazadeh, V. Alkaline leaching pretreatment and cyanidation of arsenical gold ore from the Carlin-type Zarshuran deposit. Can. Met. Q. 2018, 57, 283–293. [Google Scholar] [CrossRef]
  21. Salazar-Campoy, M.M.; Valenzuela-García, J.L.; Quiróz-Castillo, L.S.; Encinas-Romero, M.A.; Tiburcio-Munive, G.; Guerrero-Germán, P.; Parga-Torres, J.R. Comparative Study of Gold Extraction from Refractory Pyritic Ores through Conventional Leaching and Simultaneous Pressure Leaching/Oxidation. Mining. Met. Explor. 2020, 1–6. [Google Scholar] [CrossRef]
  22. Konadu, K.T.; Huddy, R.J.; Harrison, S.T.; Osseo-Asare, K.; Sasaki, K. Sequential pretreatment of double refractory gold ore (DRGO) with a thermophilic iron oxidizing archeaon and fungal crude enzymes. Miner. Eng. 2019, 138, 86–94. [Google Scholar] [CrossRef]
  23. Zheng, C.; Huang, Y.; Guo, J.; Cai, R.; Zheng, H.; Lin, C.; Chen, Q. Investigation of cleaner sulfide mineral oxidation technology: Simulation and evaluation of stirred bioreactors for gold-bioleaching process. J. Clean. Prod. 2018, 192, 364–375. [Google Scholar] [CrossRef]
  24. González, R.; Gentina, J.C.; Acevedo, F. Biooxidation of a gold concentrate in a continuous stirred tank reactor: Mathematical model and optimal configuration. Biochem. Eng. J. 2004, 19, 33–42. [Google Scholar] [CrossRef]
  25. Marchevsky, N.; Quiroga, M.B.; Giaveno, A.; Donati, E.R. Microbial oxidation of refractory gold sulfide concentrate by a native consortium. Trans. Nonferrous Met. Soc. China 2017, 27, 1143–1149. [Google Scholar] [CrossRef]
  26. Mubarok, M.; Winarko, R.; Chaerun, S.K.; Rizki, I.; Ichlas, Z.T. Improving gold recovery from refractory gold ores through biooxidation using iron-sulfur-oxidizing/sulfur-oxidizing mixotrophic bacteria. Hydrometallurgy 2017, 168, 69–75. [Google Scholar] [CrossRef]
  27. Jones, R.; Koval, S.; Nesbitt, H. Surface alteration of arsenopyrite (FeAsS) by Thiobacillus ferrooxidans. Geochim. Cosmochim. Acta 2003, 67, 955–965. [Google Scholar] [CrossRef]
  28. Kaksonen, A.H.; Perrot, F.; Morris, C.; Rea, S.M.; Benvie, B.; Austin, P.; Hackl, R. Evaluation of submerged bio-oxidation concept for refractory gold ores. Hydrometallurgy 2014, 141, 117–125. [Google Scholar] [CrossRef]
  29. Astudillo, C.; Acevedo, F. Effect of CO2 air enrichment in the biooxidation of a refractory gold concentrate by Sulfolobus metallicus adapted to high pulp densities. Hydrometallurgy 2009, 97, 94–97. [Google Scholar] [CrossRef]
  30. Wang, G.-H.; Xie, S.; Liu, X.; Wu, Y.; Liu, Y.; Zeng, T. Bio-oxidation of a high-sulfur and high-arsenic refractory gold concentrate using a two-stage process. Miner. Eng. 2018, 120, 94–101. [Google Scholar] [CrossRef]
  31. Orgül, S.; Atalay, Ü. Reaction chemistry of gold leaching in thiourea solution for a Turkish gold ore. Hydrometallurgy 2002, 67, 71–77. [Google Scholar] [CrossRef]
  32. Juan, W.; Pute, W.; Xining, Z. Soil infiltration based on bp neural network and grey relational analysis. Rev. Bras. Ciênc. Solo 2013, 37, 97–105. [Google Scholar] [CrossRef] [Green Version]
  33. Bonelli, M.G.; Ferrini, M.; Manni, A. Artificial neural networks to evaluate organic and inorganic contamination in agricultural soils. Chemosphere 2017, 186, 124–131. [Google Scholar] [CrossRef] [PubMed]
  34. Behnood, A.; Golafshani, E.M. Predicting the compressive strength of silica fume concrete using hybrid artificial neural network with multi-objective grey wolves. J. Clean. Prod. 2018, 202, 54–64. [Google Scholar] [CrossRef]
  35. Huang, Y.; Shen, L.; Liu, H. Grey relational analysis, principal component analysis and forecasting of carbon emissions based on long short-term memory in China. J. Clean. Prod. 2019, 209, 415–423. [Google Scholar] [CrossRef]
  36. Li, J.; Miller, J. Reaction kinetics for gold dissolution in acid thiourea solution using formamidine disulfide as oxidant. Hydrometallurgy 2002, 63, 215–223. [Google Scholar] [CrossRef]
Figure 1. The XRD pattern of the gold concentrate.
Minerals 10 00811 g001
Figure 2. Variations in parameters in solution during the bio-oxidation process.
Minerals 10 00811 g002
Figure 3. Flow chart of the grey relational analysis.
Minerals 10 00811 g003
Figure 4. Structural scheme of the BP network for the 6-10-2-2 type of ANN. Ф is the input variables, W is the hidden nodes.
Minerals 10 00811 g004
Figure 5. The correlation coefficients (R) of ANN models with the training, validation, test, and prediction set.
Minerals 10 00811 g005
Figure 6. The predicted results of (af) gold recovery and (af) TU consumption using the ANN model.
Minerals 10 00811 g006
Table 1. The main chemical composition of the gold concentrate (%).
ConstituentAu *CAsFeSiO2CaOMgOAl2O3CuPbSSb
Content34.850.989.0318.9629.153.881.614.170.233.2819.710.93
* Unit g/t.
Table 2. The phase constitution analysis of the Au, S, and As in the concentrate/(wt %).
Phase of AuExposed GoldEncapsulated in ArsenopyriteEncapsulated in SulfidesEncapsulated in OxidesEncapsulated in Other Minerals
Content *1.81918.6692.77111.0890.502
Distribution5.2253.577.9531.821.44
Phase of SElemental Sulphur Sulphate Sulphide
Content0.101 1.350 18.259
Distribution0.51 6.85 92.64
Phase of AsElemental ArsenicArsenic OxideArsenateArsenic SulphideArsenopyrite
Content0.0100.2000.4202.3006.100
Distribution0.112.214.6525.4767.55
* Unit g/t.
Table 3. Results of the experiments for gold recovery and thiourea consumption in different operational conditions.
Test No.ParametersRecoveryConsumption
Leaching TimeInitial pHTemperatureTU DosageStirring SpeedFerric Iron ConcentrationGoldTU
(h)-(°C)(g/L)(r/min)(g/L)(%)(kg/t)
12.01.535.06.0400.06.045.33.24
22.51.535.06.0400.06.054.64.9
33.01.535.06.0400.06.062.66.3
43.51.535.06.0400.06.068.87.3
54.01.535.06.0400.06.0758.1
65.01.535.06.0400.06.077.38.8
76.01.535.06.0400.06.078.210.1
84.01.435.06.0400.06.073.87.56
94.01.535.06.0400.06.0758.1
104.01.635.06.0400.06.070.28.28
114.01.735.06.0400.06.069.38.64
124.01.835.06.0400.06.065.79.36
134.01.935.06.0400.06.063.89.87
144.02.035.06.0400.06.057.310.3
154.01.525.06.0400.06.042.65.04
164.01.527.56.0400.06.057.25.61
174.01.530.06.0400.06.062.36.66
184.01.532.56.0400.06.069.657.38
194.01.535.06.0400.06.0758.1
204.01.537.56.0400.06.075.459.8
214.01.540.06.0400.06.077.111.7
224.01.535.02.0400.06.051.26.12
234.01.535.03.0400.06.060.66.66
244.01.535.04.0400.06.068.97.2
254.01.535.05.0400.06.072.37.56
264.01.535.06.0400.06.0758.1
274.01.535.07.0400.06.074.68.45
284.01.535.08.0400.06.074.18.82
294.01.535.06.0200.06.060.36.84
304.01.535.06.0250.06.063.97.2
314.01.535.06.0300.06.067.37.56
324.01.535.06.0350.06.070.757.83
334.01.535.06.0400.06.0758.1
344.01.535.06.0450.06.072.68.5
354.01.535.06.0500.06.075.49
364.01.535.06.0400.02.8050.15.76
374.01.535.06.0400.03.7356.36.66
384.01.535.06.0400.04.6763.27
394.01.535.06.0400.05.6067.47.11
404.01.535.06.0400.06.5375.37.2
414.01.535.06.0400.07.4776.27.56
424.01.535.06.0400.09.3377.68.1
Table 4. Grey relational degree of the influencing variables and the gold recovery and TU consumption.
Influencing VariablesGold RecoveryRankTU ConsumptionRank
Leaching time0.77920.7572
Initial pH0.72560.7423
Temperature0.78310.7621
TU dosage0.76540.7184
Stirring speed0.75650.7076
Ferric iron concentration0.77830.7155
Table 5. The performance of the BP network for the 6-10-2-2 type of ANN.
Training AlgorithmGold RecoveryTU Consumption
MAERMSEAccuracy (%)MAERMSEAccuracy (%)
Levenberg–Marquardt1.92262.078597.220.28090.335296.59

