Article

Application of Historical Geophysical Materials in Searching for Cu-Ag Ore Deposits—A New Direction of Research

by
Stanisław Speczik
1,2,
Lidia Dziewińska
3,
Waldemar Jóźwiak
2 and
Krzysztof Zieliński
2,*
1
Department of Geology, University of Warsaw, Żwirki i Wigury 93, 02-089 Warsaw, Poland
2
Miedzi Copper Corp, Al. Jerozolimskie 96, 00-807 Warsaw, Poland
3
Geotechnology Division, Mineral and Energy Economy Research Institute of the Polish Academy of Sciences, J. Wybickiego 7A, 31-261 Kraków, Poland
*
Author to whom correspondence should be addressed.
Minerals 2020, 10(8), 725; https://doi.org/10.3390/min10080725
Submission received: 22 July 2020 / Revised: 14 August 2020 / Accepted: 16 August 2020 / Published: 18 August 2020
(This article belongs to the Special Issue Novel Methods and Applications for Mineral Exploration, Volume II)

Abstract

:
This paper presents a new instrument in geological exploration, which uses historical geophysical data for the indication of potential zones of the occurrence of Cu-Ag ore, based on the example of the newly discovered Nowa Sól deposit in south-western Poland. Basic historical seismic and gravimetric data were applied along with transformed maps. The new method of effective reflection coefficients (ERC) allowed the utilization of archival seismic records for a more precise determination of the most vaguely traced interfaces within the Permian Zechstein unit. Compared to an amplitude-based seismic section, an ERC section is characterized by its highly increased resolution of imaging. The tracing of changes in the facies and the tectonics of Zechstein sediments, particularly in a zone of their contact with Rotliegend rocks, along with the new ERC method, enabled the establishing of precise locations of prospecting boreholes. The combined use of ERC and historical well logs also allowed more precise identification of the shape of oxidized areas and the adjacent orebodies.

1. Introduction

A new direction of research involving the use of historical geophysical data for the indication of prospective zones of Cu-Ag ore is presented based on the example of the newly documented Nowa Sól deposit (Figure 1).
At the first stage of its exploration project in the Nowa Sól, Jany, Wilcze and Zatonie concession areas, Miedzi Copper Corp. (MCC, Vancouver, BC, Canada; with a local office in Warsaw, Poland) performed extended analyses of existing historical geophysical data. The quality of these abundant data did not allow their direct application to ore prospecting. Therefore, the new effective reflection coefficients (ERC) method was proposed as a means to trace the potential zones of Cu-Ag ore [1,2,3]. The locations of prospecting boreholes (Figure 2) were established after the reprocessing of geophysical data based on this new methodology. Comparison of the results of ERC and the drilled boreholes confirmed the usefulness of its application.
In this study, the determination of the potential of copper and silver mineralization in the Zechstein copper-bearing series based on the demarcation of the most prospective, as well as possibly negative zones, focused on an area which had not been explored by drilling. The methods of gravimetry and seismic reflection were applied for the accomplishment of this task. An assessment of prospects in the region of the Fore-Sudetic Monocline and the selection of areas for the exploration of Cu-Ag ore, as well as the choice of optimal locations for the planned boreholes required the following steps:
  • The development and interpretation of gravimetric transformed maps of residual anomalies and maps presenting the directions of zones of tectonic and lithological discontinuities,
  • An analysis of the results of on-site work in terms of selecting seismic reflection lines for application of the new method of effective reflection coefficients (ERC),
  • For selected seismic profiles—application of the method of transforming two-way time wave-based sections into ERC sections, to obtain an image with higher resolution compared to a wave-based image, primarily for interfaces related to the Permian Zechstein sediments, in particular the basal Zechstein 1 (Werra) Kupferschiefer-limestone-anhydrite series.
  • Geophysical and geological interpretation of the resulting seismic sections in correlation with the results of geophysical borehole logging. Particular attention paid to the interval comprising Zechstein sediments (P2), including the zone of contact with Rotliegend sediments (P1). Correlation of drilling and ERC seismic data with data from lithological and parametric borehole logs.
  • An analysis of results with respect to the indication of potential zones of copper-silver orebodies in the Zechstein copper-bearing series, aimed at targeting exploration boreholes.

2. Geological Setting

The research area is located in Poland, in the south-western part of the Fore-Sudetic Monocline, on the southern slope of the Wolsztyn High (Figure 1). This region is interpreted as the eastern extension of the Rheno-Hercynian (RH) and Saxo-Thuringian (ST) zones demarcated within the Variscan orogen of Germany, as well as the Mid-German Crystalline Rise (MGCR) [4,5,6]. In Poland and Germany, these units are associated with the occurrence of mineral deposits [7,8,9].
The boundary between the Fore-Sudetic Monocline and the Fore-Sudetic block extends along the Middle Odra fault zone, delimited NE and SW by a complex system of tectonic discontinuities. These faults mark the boundaries of a horst located in the south, whose interior consists of crystalline rocks described as the Middle Odra Metamorphic Complex.
The Wolsztyn High is a Variscan structural palaeo-element, constituting a central part of fragmented tectonic elevations extending from Brandenburg in the west to the Pogorzela High in the south east. During the Permian, this pronounced tectonic structure separated two Rotliegend sedimentary basins—the Lower-Silesian Basin (of Zielona Góra) in the southwest from the Poznań Basin in the northeast, to which it delivered material during erosion [10]. These geological units represent deep structures forming a sub-Permian substrate of the Fore-Sudetic Monocline [4]. Information acquired from boreholes and the results of seismic surveys in the area of the monocline made it possible to distinguish the following structural complexes: Caledonian, comprising Cambrian, Ordovician and Silurian rocks; Variscan, formed by Devonian and Carboniferous sediments; Permian and Mesozoic cover rocks; as well as Palaeogene, Neogene and Quaternary sediments. The direct substratum of the platform cover of the Fore-Sudetic Monocline consists of folded Carboniferous rocks. They represent a fragment of internal/external Variscan orogenic terranes [11] located between the fault zones of Middle Odra (to the south) and Dolsk (to the north), structures with a WNW-ESE direction.
Folded Variscan rocks are overlain by Rotliegend sediments (P1), consisting of sedimentary and volcanic series. The lower sedimentary series comprises mudstones and claystones with sandstone beds. Sandstones classified as the so-called Weissliegend occur in the top part. The rocks of P1 are overlain by carbonates, sulphates and salts of the Zechstein (P2), with a deepening trend of its bottom surface from the south to the north. Permian rocks are overlain by Mesozoic sediments—primarily Triassic. Sub-Permian Palaeozoic rocks are characterized by discontinuous tectonics. Compared to the tectonics of the Variscan unit, younger strata are characterized by their relatively undisturbed position and generally monoclinal dip towards the N and NE.
The Zechstein sediments in the area of the Fore-Sudetic Monocline are represented by four sedimentary cycles. The oldest, Werra, when present in its entirety, consists of the following units: the copper-bearing shale (Kupferschiefer), the Zechstein Limestone, the Lower Anhydrite, the Oldest Rock Salt and the Upper Anhydrite (Figure 3).
The area of the Nowa Sól deposit was previously explored by drilling performed by the PGNiG Company. Two boreholes—Lubięcin-1 and Borowiec-1 ended in the rocks of P2. Rotliegend sediments were penetrated by one borehole Przyborów IG-3 located outside of the deposit, near its SW boundary (Figure 2).

3. The State of Geophysical Knowledge

The Cu-Ag deposits are categorized as epigenetic, created due to the influx of low-temperature hydrothermal solutions. Their migration pathways probably included regional and local tectonic zones. Fractures could be considered as channels for the convection of heat necessary for mineralizing processes [12,13]. Thermal characteristics indicate a considerable increase in the heat-flow rate density parameter in the SW Fore-Sudetic Monocline compared to those observed in the remaining parts of Poland [14,15], with its maximum values in the surroundings of the Sława IG-1 borehole (98.4 mW/m3) [16,17].
A seismic image prepared for today’s Nowa Sól deposit area by petroleum companies in 1980–1994 consisted of a grid of lines of varying quality, spaced 1–2 km apart. Major structures were identified in the prospective sediments of the Main Dolomite lithostratigraphic unit. Distinguishable zones are related primarily to changes in the lithology, facies and thickness of Zechstein cyclothems, in particular Stassfurt and Werra, as well as the occurrence of tectonically deformed regions.
Historical gravimetric surveys in the form of a semi-detailed image with a density of approximately 3.5 points/km2 were performed in the area of the Nowa Sol deposit and its nearest surroundings. The uniform coverage of the whole area of the deposit with gravimetric data complements the degree of geophysical exploration, particularly in sites where information from seismic surveys is missing. The sets of gravitational values constituting a basis for the preparation of a Bouguer anomaly map were developed based on the IGSN71 system and a formula for calculating a normal gravitational force field for the WGS84 ellipsoid [18]. The resulting image is a superposition of gravimetric effects originating from Mesozoic and Palaeozoic complexes as well as the deep basement and it confirms the existence of distinct characteristic changes in the morphology and density of specific stratigraphic complexes.
Proper reinterpretation processes [3] allowed the identification of structural elements of the Palaeozoic substrate (Figure 1). The gravimetric map of Bouguer anomalies features a pronounced positive anomaly extending in the Lower-Silesian Basin between Zielona Góra and Leszno. The Wolsztyn High is located in an extensive gradient zone in the north-eastern limb of the anomaly. A positive anomaly identified in the area of the Lower-Silesian basin, present over the whole analyzed depth interval, is associated with a geological structure standing out due to its high values of density. In here, the possible existence of a complex with noticeably elevated density (approx. 2900 kg/m3) relative to the surrounding rocks (2700 kg/m3) is confirmed by the results of Deep Seismic Sounding (GBS) [19,20].
As a consequence, the Wolsztyn High can be interpreted as a branch of an anomaly associated with a structural unit in the Lower-Silesian Basin, with higher density contrasts which prevail in the surface image of Bouguer anomalies.
Distinguishable tectonic directions consisting of at least two or even three lines, mark a dislocation. It is particularly easy to trace tectonic zones (Figure 1) delimiting the Wolsztyn High (A and B), a positive anomaly in the Lower-Silesian basin (B and C), as well as faults in the vicinity of the Odra river (D). Relationships between fault zone C (the Bielawa Fault) based on gravimetry and a deep tectonic rupture are confirmed by the results of Deep Seismic Sounding (GBS) [20] and by the image of the magnetic field [21]. Over a considerable length, it overlaps with the NW boundary of a regional magnetic anomaly extending from south of Zielona Góra to the western border of Poland (the Gubin region) and further to Germany. The width of the anomaly indicates a relationship with the rupture zone of middle Odra, described as a system of deeply rooted faults, probably with a strike-slip nature [22]. This anomaly has its source in rock masses of the basement, with densities and magnetic properties elevated relative to the surroundings. They probably reflect the presence of volcanic rocks with enhanced magnetic properties. This may be due to elevated amounts of ferromagnetic minerals in zones of contact with substrate rocks of different densities or related to the migration of solutions in the fault zone.

4. The Methodology of Research

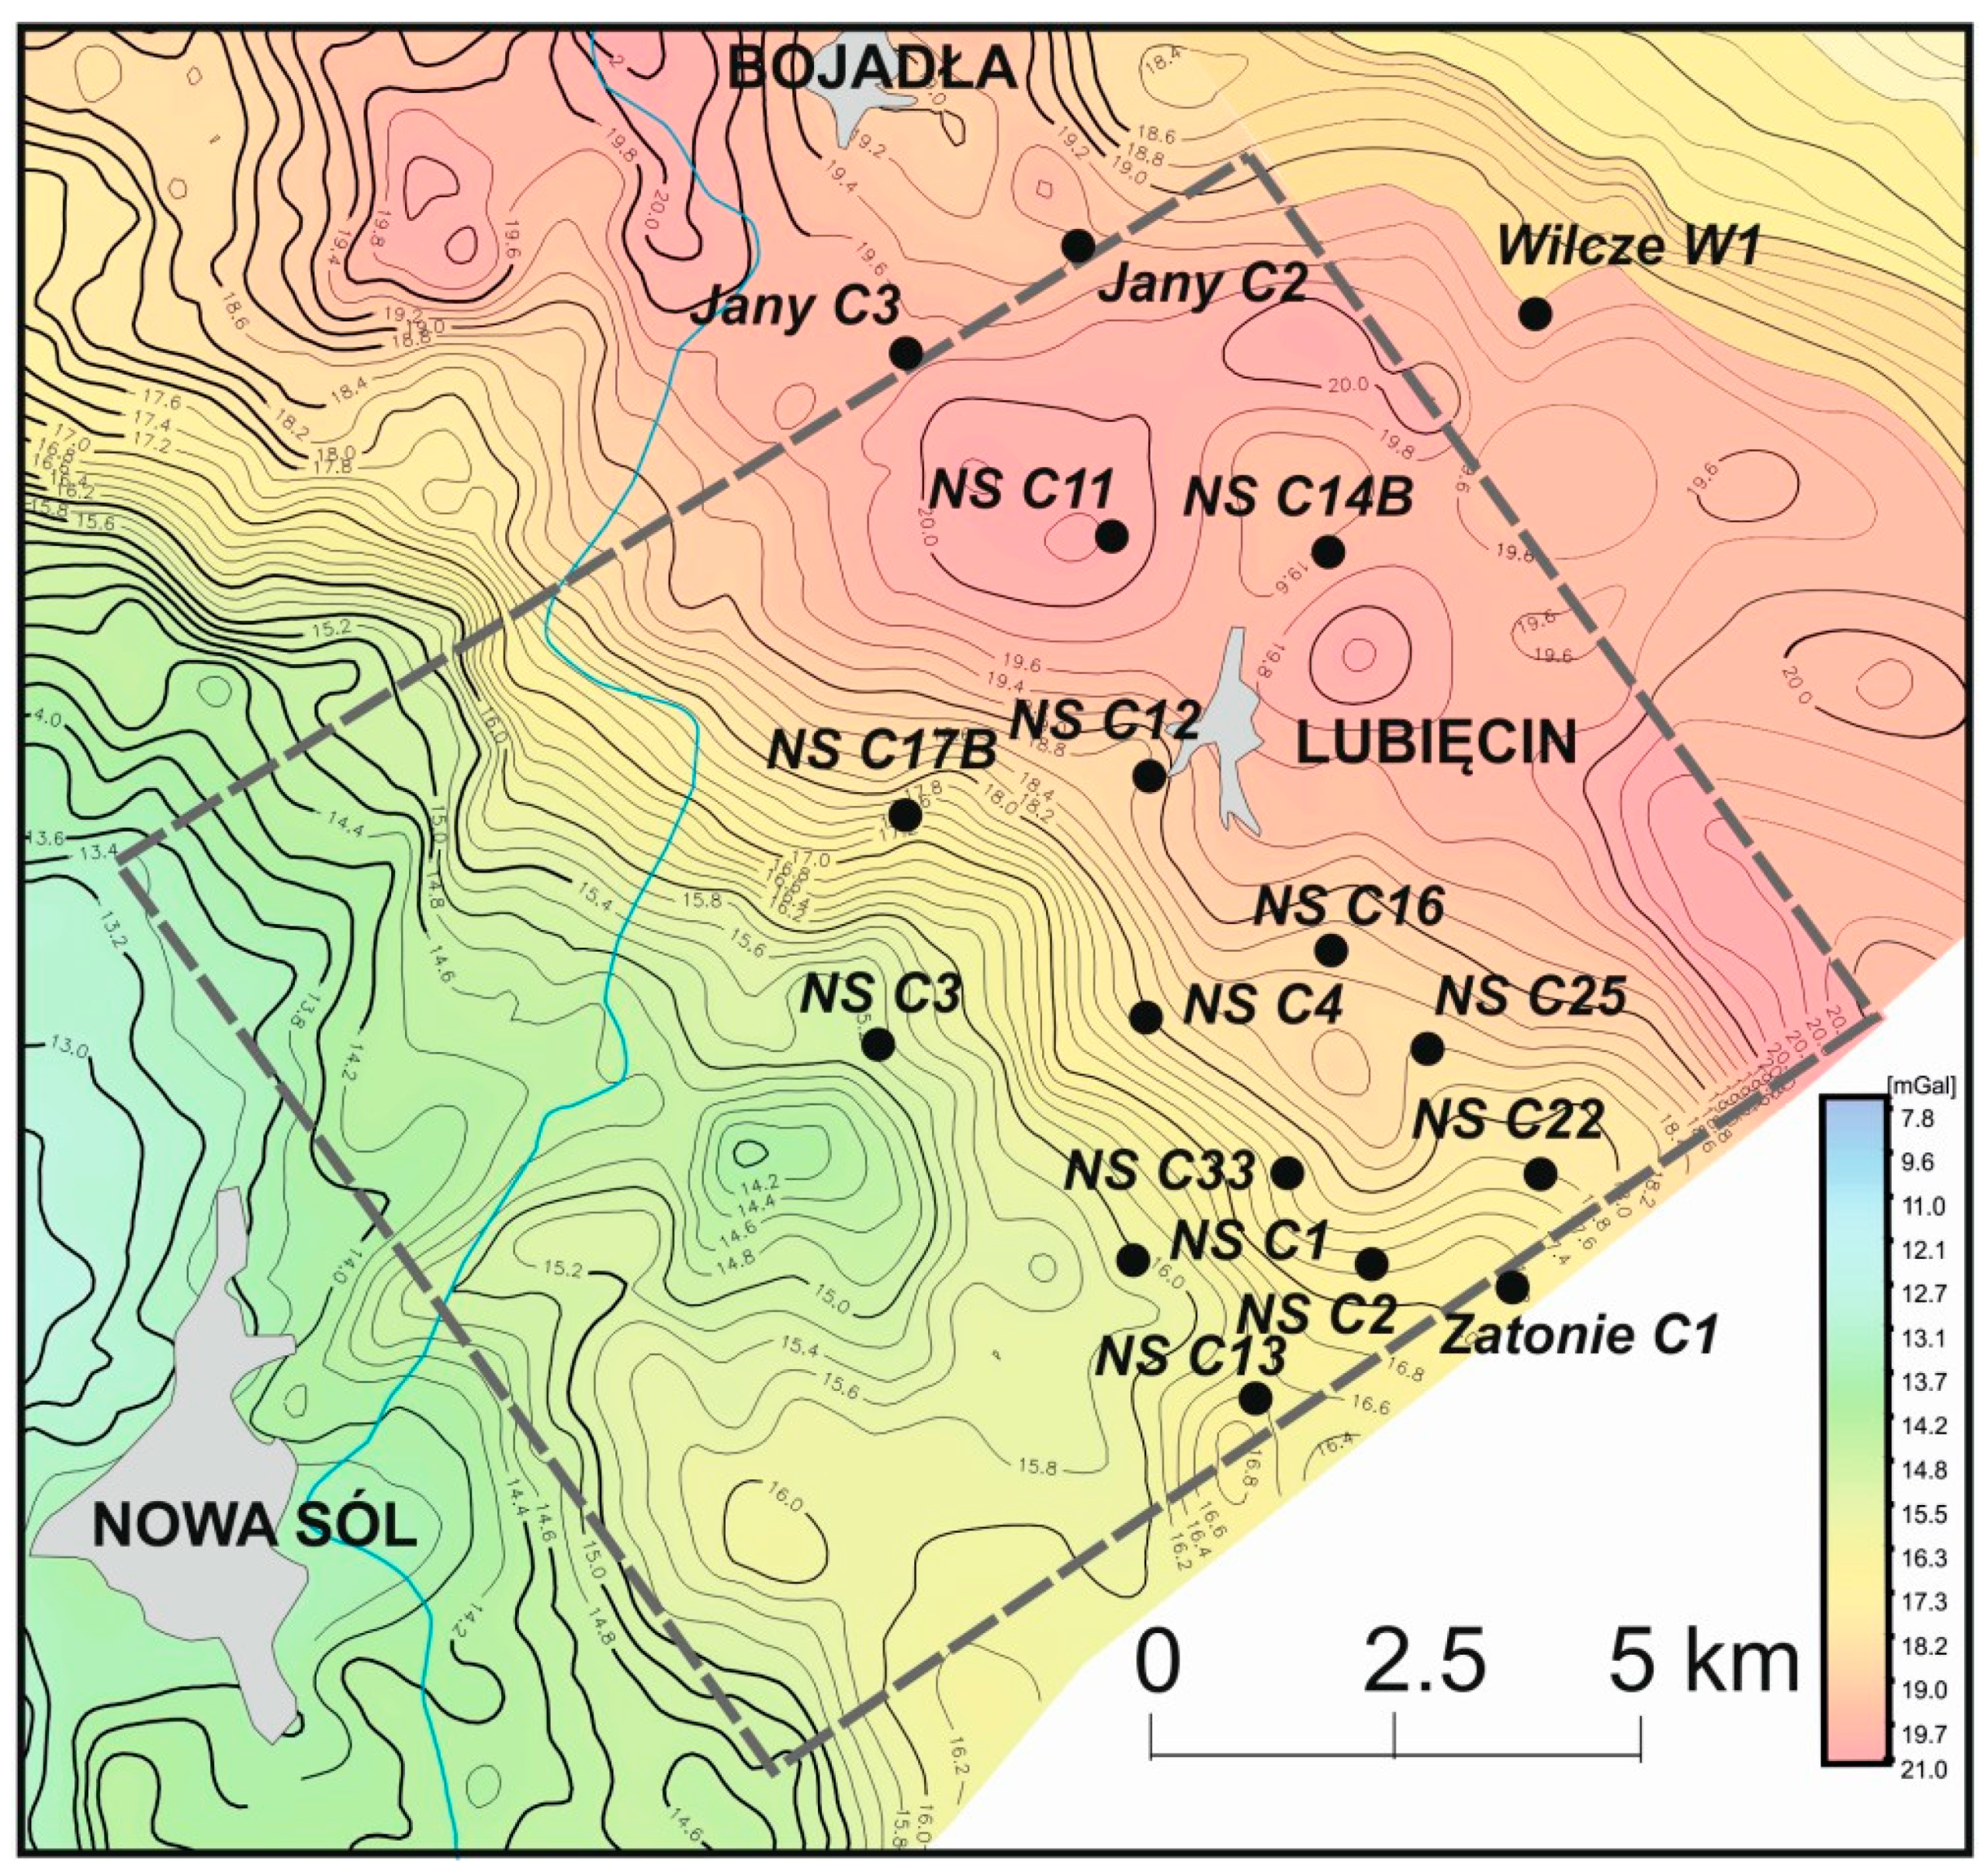
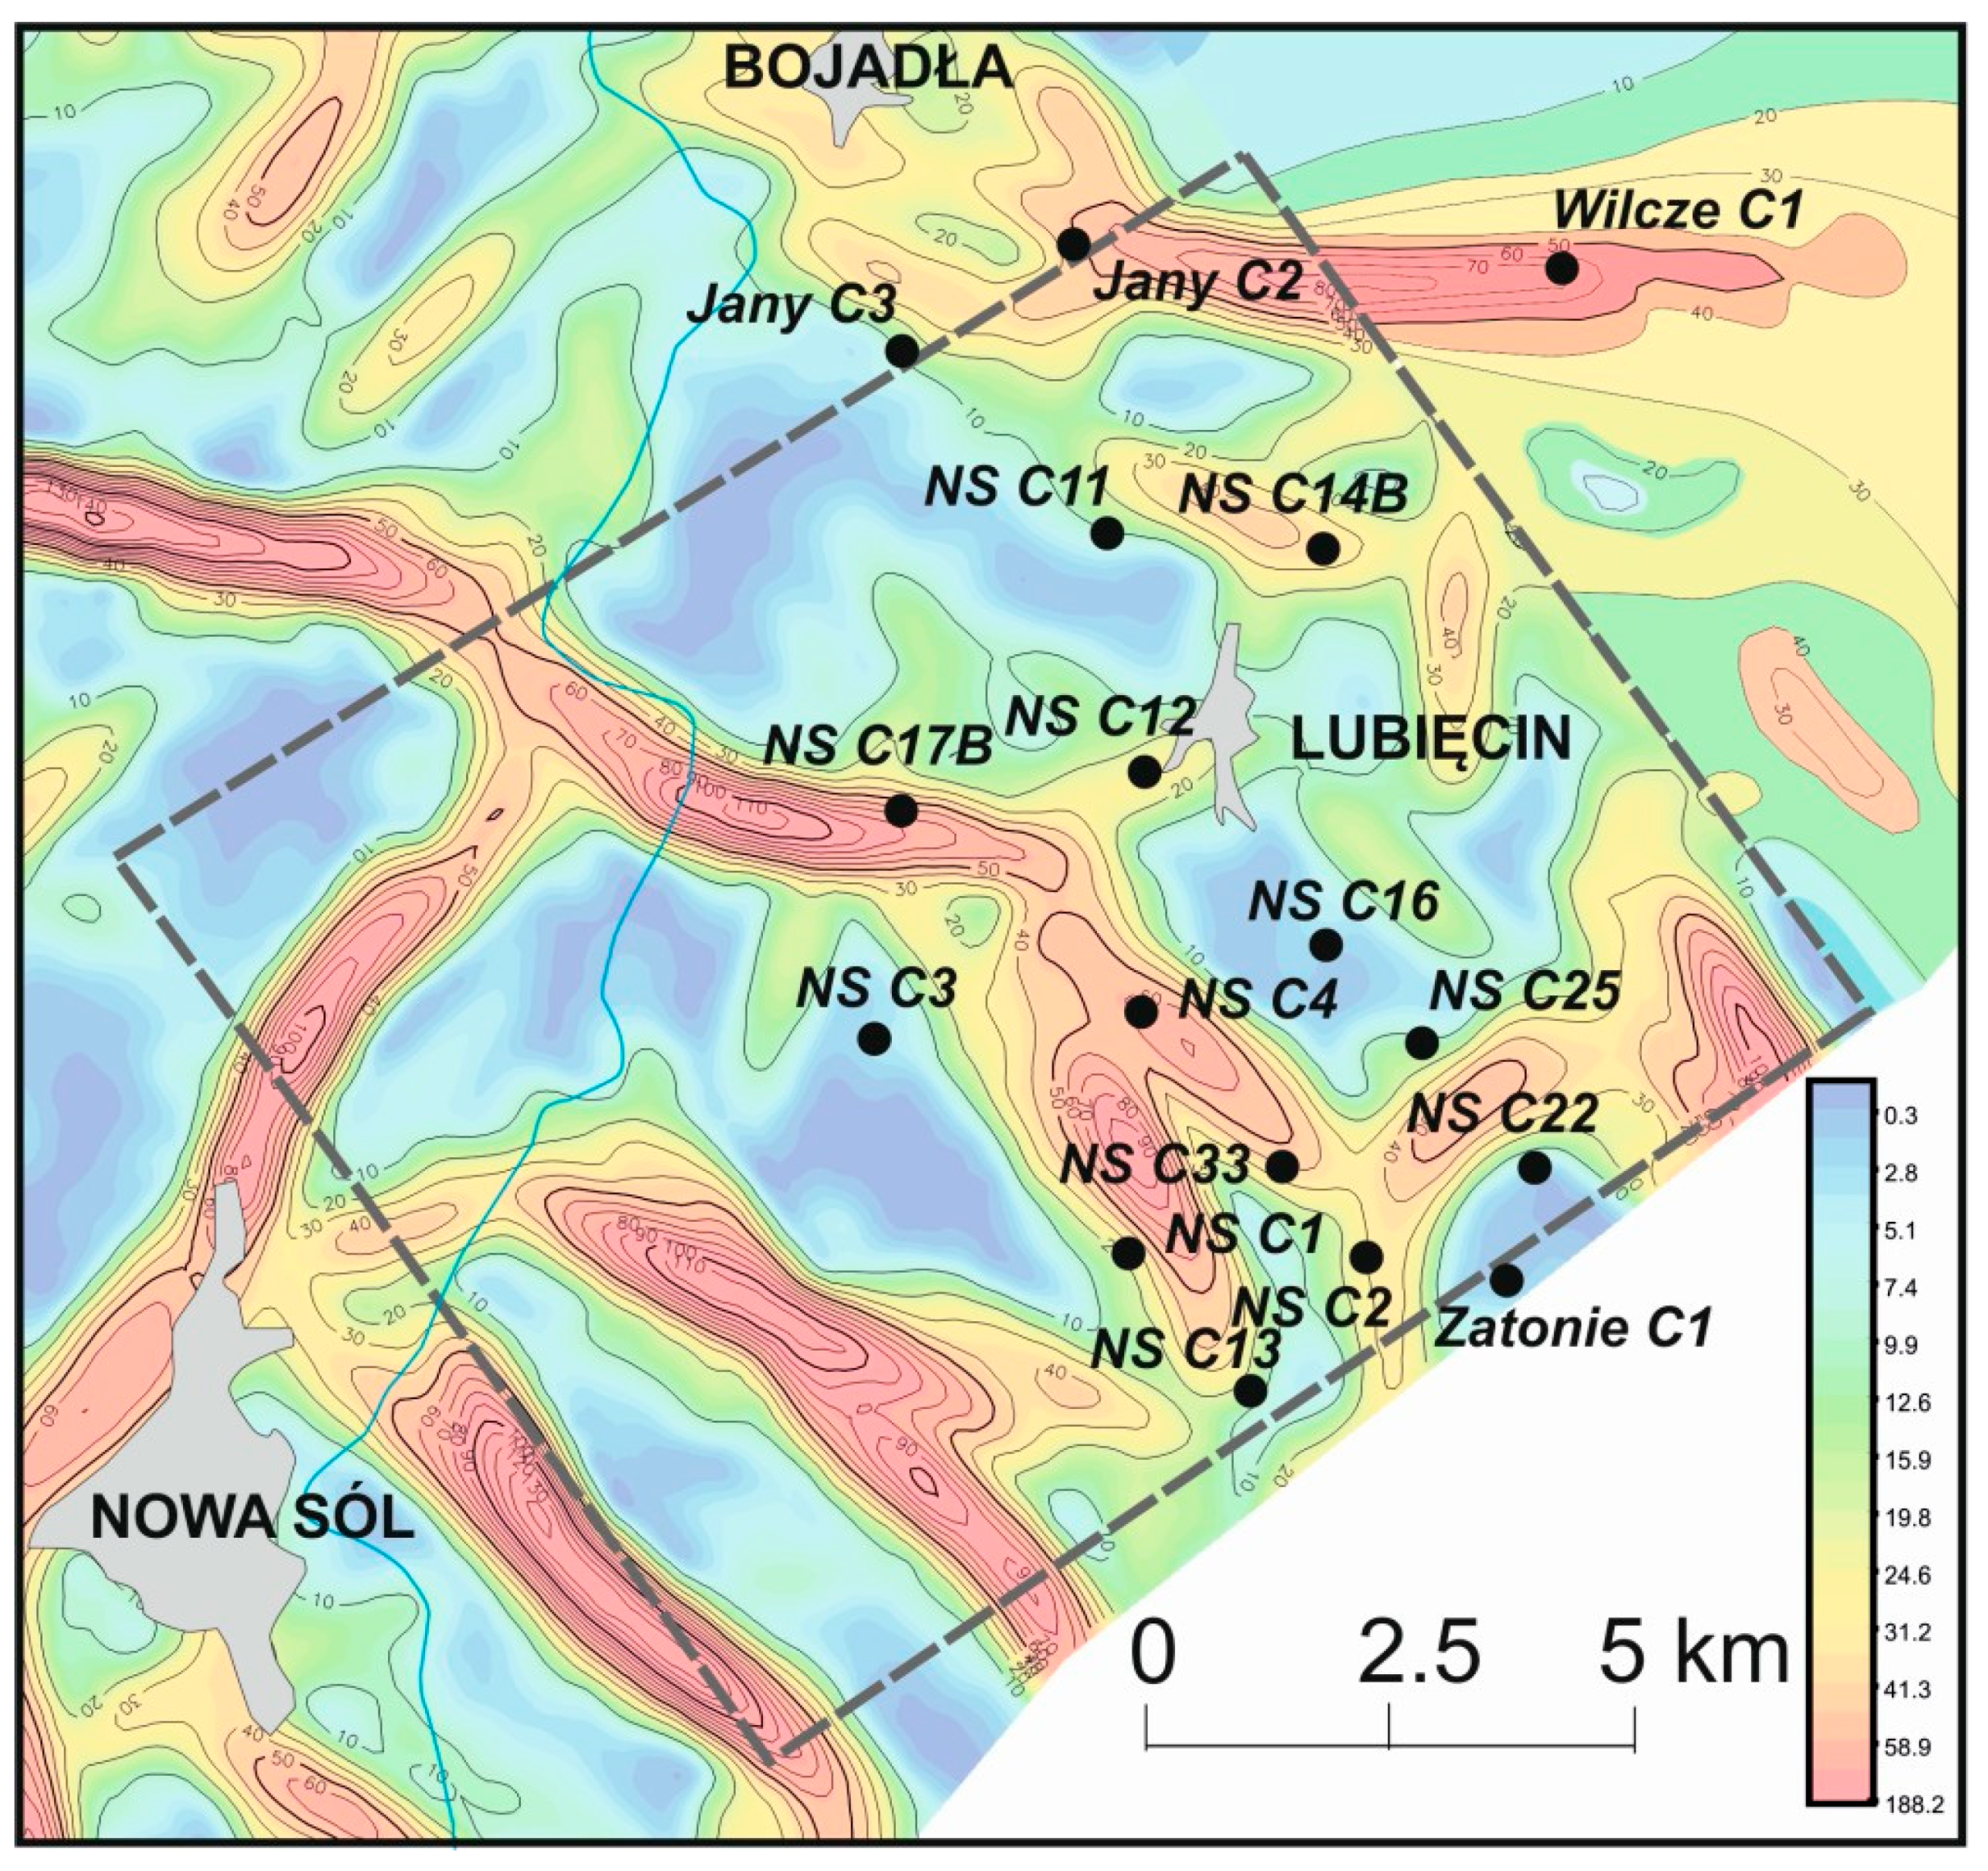
4.1. Compilation and Interpretation of Transformed Gravimetric Anomaly Maps

On the Bouguer gravity map, the Nowa Sól deposit occupies the north-eastern area of positive anomalies separated by a gradient zone from lower values in the southwest (Figure 4). The use of various methods for processing Bouguer anomalies allowed visualization of deep structural elements based on frequency filtration methods for density complexes, as well as gravimetric-tectonic maps presenting the directions of the zones of tectonic and/or lithological discontinuities. Gravimetric data is sufficient for the identification of anomalies related to Zechstein sediments and their substrate.
One characteristic element of a map of residual anomalies for a depth interval of 2800–4000 m associated with sediments underlying the Zechstein involves its considerable similarity to the image of Bouguer anomalies, indicating the impact of basement rocks on the gravimetric image. These are the dense rocks of the older Palaeozoic or metamorphic rocks of the Wolsztyn-Pogorzela High [10]. Changes in the lithology and thickness of Zechstein sediments reflect the residual anomalies for shallower depth intervals, associated with salts and anhydrites of varying densities [2].
Various transformations of the image used the methods of frequency-based filtration. Along with an analysis of zones with increased gradients, this allowed tracing geological objects with elongated shapes, like faults or anticlines, as well as changes within analyzed depth intervals. On a horizontal gradient map according to Rosenbach (Figure 5), a zone of anomalies with a NW-SE direction, approximately parallel to the Wolsztyn High, demarcates a tectonic zone located close to its south-western limb. For comparison, this map also presents geological faults and the boundary of an oxidized field interpreted based on later drilling results.
The map presented in Figure 6 provides a less ambiguous depiction of gravimetric linear elements in the form of axes of maximum horizontal gradient and lines of vertical density interfaces prepared for three depth intervals: 0–1600 m, 1600–2800 m and 2800–4000 m. This map is based on the combined data on horizontal gradient axes and vertical density interfaces. Attention should be paid to the main, regional line of discontinuities with a characteristic NW-SE direction, extending along anomalies visible on the horizontal gradient map. This zone primarily comprises depth intervals related to Zechstein sediments (1600–2800 m) and the basement (2800–4000 m)—dislocations ending in Permian rocks. In the surroundings of a regional fault zone, less pronounced zones of changes in linear elements were distinguished, also covering the shallowest depth interval. Information collected in the form of separate symbols for each depth interval enables the determination of the direction of inclination of fault planes, taking into account their association with stratigraphy.
In the gravimetric image one can also observe less pronounced lines of discontinuities, probably of a tectonic and/or lithological nature, with an NE strike direction. One of them, visible in the vicinity of Nowa Sól, intersects the abovementioned zone.
It should be noted that, although prepared prior to the initiation of the drilling program, the map of Figure 6 presents the same general directions of tectonic discontinuities as the Variscan and Alpine faults shown in Figure 5, which were interpreted based on drilling results.
For a depth interval of 1600–2800 m, as the most representative one for Zechstein sediments and their contact with their direct substrate, the shapes of gravimetric zones and the related tectonic directions are also presented on a density map of gravimetric linear elements in the form of envelopes with specific contour lines (Figure 7). It is a graphically different form of visualizing tectonic information about an analyzed area. More pronounced gradient areas belong to tectonic zones covering a wider depth interval, while in the case of wedging out and changes in sedimentary facies, these contours are less distinguishable.
To sum up, the main purpose of gravimetric interpretation was to provide a certain degree of detail on the tectonic structure of the area. This included the areas of tectonic uplift and depressions, as well as the approximate locations and primary directions of geological faults, which would be subsequently presented on the ERC sections.

4.2. Processing of Seismic Data and Development of ERC Sections

The principles of the effective coefficient method were developed in “Sibgeo Novosibirsk” in the 1980s [23]. This method was modified and adjusted to the lithological and tectonic variability of Zechstein sediments by the authors of the present paper [1]. The calculations used historical seismic data of the petroleum industry (time records, seismic sections) retaining original amplitudes.
The calculation of effective reflection coefficients (ERC) enables the conversion of a waveform seismic image into an impulse form of seismic record, meaning a temporal sequence of reflection coefficients representing layers forming a geological structure. To this end, one of the most important features of a seismic image is used—the amplitude, its size being assumed as proportional to the reflection coefficient for a specific geological boundary.
The mathematical and physical model of a geological structure is a so-called convoluted model, according to which a seismic pathway is the result of combining the pathway refection coefficients with the elementary seismic signal. The deconvolution of an amplitude-based seismic pathway allows obtaining a pathway in the form of a series of coefficients.
The pattern of processing includes three stages: determination of an elementary impulse, repeated mutual correlation of the impulse with a seismic pathway, as well as standardization (horizontal and vertical addition of the individual pathways) and the use of statistical treatment for the visualization of a seismic image.
The primary function of the system involves determining the shape of the elementary signal and establishing the impulse characteristics of the structure. The determination of an elementary seismic impulse proceeds via the addition of subsequent groups of reflected waves for a given pathway presented for the same phase, as well as the combined time of recording. In this paper, particular attention was paid to the selection of a proper elementary impulse adjusted to the objective of research—used in the process of correlation for specific time intervals, as preceded by numerous tests. The determination of elementary signal can be validated using Fourier analysis. The function of correlation of the elementary signal with each seismic pathway enables conversion of a wave-based seismic pathway into temporal series of zero-phase amplitudes called the effective reflection coefficients. It determines the time-based points of maximum correlation of signal with reflected waves in the form of values of the coefficient and sign of the amplitude.
Sets of reflection coefficients undergo standardization and they are presented in the form of a seismic section which shows seismic pathways converted into an impulse form. The verification of effectiveness involves the performance of multiple mathematical processes, until it is concluded that the residual amplitude path consists only of disrupting waves.
The reflection coefficients present seismic interfaces conforming to actual boundaries. This coefficient is defined by layer-related velocities and rock density above and below a given seismic reflecting interface. Assuming that changes in density are relatively small compared to changes in velocity, it is accepted that the coefficient depends mainly on the latter. The resulting cross-sections have the form of horizontal and vertical graphical symbols. By using the relationship between the value and sign of the reflection coefficient and velocities in strata, this method facilitates the tracing of changes occurring at the interfaces generating reflections and in the lithology of strata along seismic sections. Diverse graphics on sections of the coefficients enhance the visualization of results. The direction of impulses facilitates the recording of changes occurring at interfaces. This method is particularly useful when identifying thin layers, small dislocations and tracing changes in the lithology of a given stratum, for example, porosity, along a seismic section. The lateral tracing of a sedimentary succession in the overall image of a seismic section is facilitated by relative changes in the values of reflection coefficients. Compared to a wave image, the elimination of interference signals enhances the ability to demarcate seismic interfaces (which for most rock masses correspond to strata with thickness of about a dozen meters).
An important feature of ERC sections involves the ability to identify a given velocity-based stratum along the seismic line. Software used for the interpretation of well logging data allows tracing individual lithological-stratigraphic successions along a seismic section based on the sign and value of the reflection coefficient. In the Nowa Sól deposit there are no deep historical boreholes with geophysical logging. Therefore, the well logging data which were used originated from nearby boreholes (Klenica-1, Jany-1, Zabór-1, Borowiec-2). The criterion for the selection of boreholes was based on the presence of measurements of average velocities, penetration of the Rotliegend sediments, as well as the assessment of the quality of the performed geophysical logging. In these boreholes, the following physical parameters of rocks were determined based on historical data: velocity, as well as density and porosity. Geophysical logging performed in boreholes enabled calculations of the values of parameters for strata exceeding 4 m in thickness. The correctness of calculations is ensured by correlation of results with sample density measurements and with the measurements of average velocities in boreholes. Individual parameters were attributed to strata with specific lithological profiles. The association of reflection coefficients with the lithological and parametric logging of a borehole enables the correlation of drilling and seismic, as well as stratigraphic data along seismic sections transformed into an impulse form. The determination of synthetic reflection coefficients related to parameters of the lithological profiles of boreholes allows relatively precise connection of correlated interfaces on seismic sections to Zechstein sediments distinguished by their physical parameters (Figure 8).
Due to the use of the attributes of an impulse section and the sign of the reflection coefficient, reflected wave intensity and the place of reflection, the efficiency of identification and correlation of seismic boundaries increases along with simultaneous characterization of the geometry of strata forming a given geological structure. Disruptions in the arrangement of strata are reflected by changes in the physical properties of individual layers. The reported higher number of distortions in the seismic image compared to those interpreted on wave sections results from the capabilities of the method and is linked to their diverse nature. The disruptions may be caused by the existence of tectonic features and/or changes in the lithology (lines of tectonic and/or lithological discontinuities).
The new ERC method combined with analyses of historical drilling logs from the vicinity of the deposit allowed better identification of the extent of the Zielona Góra oxidized field. This area is directly adjacent to the orebody, which forms a zone along its eastern edge, as confirmed by the historical Jany 1 borehole. The analysis also enabled the construction of a tectonic model of the area, consisting of several blocks separated by Variscan and Alpine faults (see Figure 5). It turned out that, due to tectonic displacements, the Zielona Góra field extended further to the north-east than previously expected. This resulted in a new location for the first borehole in the Nowa Sol area, which effectively discovered the Nowa Sól deposit. Further holes confirmed the existence of a zone of Zechstein ore-bearing sediments with a width of approximately 5 to 10 km, extending NW-SE adjacent to the Zielona Góra field. The north-eastern extent of this oxidized field is shown in Figure 5, explaining why all prospecting boreholes in the Nowa Sol concession area were drilled in its NE half.
The ERC method was also applied successfully in Poland for solving a number of other issues, for example, the tracing of lithological changes in Carboniferous rocks of the Lublin Graben [24], mapping of Zechstein sediments in the NW rim of the Holy Cross Mountains [25] or the examination of geological structures selected for the storage of CO2 (e.g., References [26,27]).

5. Results

5.1. Geophysical and Geological Interpretation of Seismic ERC Sections

The analysis and interpretation of results covered 9 selected seismic lines: T0970783, TA220782, T0190790, 115-04-93K, 106-04-93K, 107-04-93K, 118-04-93K, 114-4-93K and TA230782 (Figure 1) with a total length of 82.233 km.
The coefficients were calculated based on materials derived from historical seismic data having the form of sets of time- and amplitude-related seismic sections. When choosing data for further handling, the preferred materials included those whose actual amplitudes had been retained during processing.
Initially analyzed aspects included the degree of tectonic deformations (identification of tectonic elements) and morphology of the bedding of bottom Zechstein sediments (P2). Apart from seismic sections, the morphology of sub-Zechstein strata is documented by a structural map of the P2 bottom (Figure 9) prepared based on the results of reflection lines, including those developed in the ERC version, as well as deep drilling, providing important information about the predicted depth of planned boreholes. There is a visible consistent ascent of the P2 bottom from 2140 to 1440 m near the southern boundary of the area, accompanied by considerable diversity of substrate morphology which requires consideration when establishing the location of drilling. Near the 1800 m contour line there is a major zone of changes in the density of lines. This line, corresponding to an abrupt change in the inclination of P2 bottom, coincides with the prevalent tectonic zone which constitutes the southern boundary of an elongated gravitational anomaly interpreted as the already mentioned fault C (the Bielawa Fault). Changes in the morphology of the P2 bottom surface reflect the existence of a dislocation zone with a high amplitude in the substratum (a dislocation delimiting the Middle Odra rupture from the NE), separating two different geological settings. Its independent identification based on two geophysical methods confirms the proper direction of research.
The nature of the Middle Odra rupture zone is additionally shown by the Wilków Structure (a natural gas reservoir) located SE of the Nowa Sól deposit area (Figure 1). The presented cross-section (Figure 10) shows the effectiveness of using historical seismic sets applied in the form of effective reflection coefficients for identifying the structure of not only Zechstein sediments but also those of the Rotliegend, the Carboniferous and deeper ones from the area of a regional elevation in Rotliegend strata. The ERC section presents results along a line with a direction perpendicular to the structure. Sub-Permian rocks are characterized by discontinuous tectonics and the directions of faults form a distinct block-based system. The SW limb (slope) of the structure has a more monotonous nature and features gentler dipping compared to the NE limb, cut off by a fault with a higher amplitude. The seismic section indicates the dichotomy of the interpreted object in lower Zechstein, Rotliegend and Sub-Permian rocks. The tectonic discontinuity zone (within the range of fault C traced by gravimetry) extending near the central part of the structure and parallel to it in a surface image divides it into 2 parts (NE and SW). Interpretation of the Wilków Structure constitutes an example of the ability to correlate gravimetric tectonic zones with data from seismic surveying also below the bottom of Zechstein sediments, due to the use of information from a transformed wave image in the ERC system.
The main stage of interpretation involved lithological examination of the individual stratigraphic units of P2 along ERC sections, with particular emphasis on older Zechstein sediments which are potential copper-bearing strata, as well as an analysis of the mutual arrangement of seismic horizons along with the distribution of thickness of the traced strata and identification of zones of their changes. The ultimate objective was to demarcate the probable zones of increased thickness of potential ore-bearing series. These zones are related to low values of the reflection coefficients at the Zechstein/Rotliegend boundary, identified along short segments of sections, which was possible due to high resolution of the method.
Compared to wave sections, ERC sections present a clearer and more unambiguous seismic image. The harmonization of data, as well as an improvement in the quality and resolution of the recorded interfaces, resulted in a much more precise and credible lithological, structural and tectonic image of the area in question, compared to earlier studies, which involves mainly Zechstein seismic horizons. The results allow the correlation of Triassic and Permian interfaces associated with the individual cyclothems of the Zechstein and with the top of the Rotliegend.
One characteristic feature is the arrangement of coefficients and zones of particular significance for predicting the occurrence of copper-bearing shales and the associated mineralized zones with the highest possible probability. On the seismic sections, particular attention was paid to the position of the boundary between Z1′ and Z1. Due to its interferential nature, in previous research the Z1′ interface presented uncertain correlation, as will be presented in Section 5.2.
Due to the abovementioned absence of deep boreholes in the area of the Nowa Sól deposit, the link to stratigraphy was established based on geological data from boreholes and geophysical logging originating mainly from adjacent concession blocks. Identification of the traced stratigraphic horizons is analogical to what is used traditionally in the Fore-Sudetic Monocline, as presented, for example, in Figure 10 above:
  • Tp2—interface reflecting the morphology of the top of Middle Buntsandstein (bottom of the Röt)—not presented in any of the figures due to their vertical scale
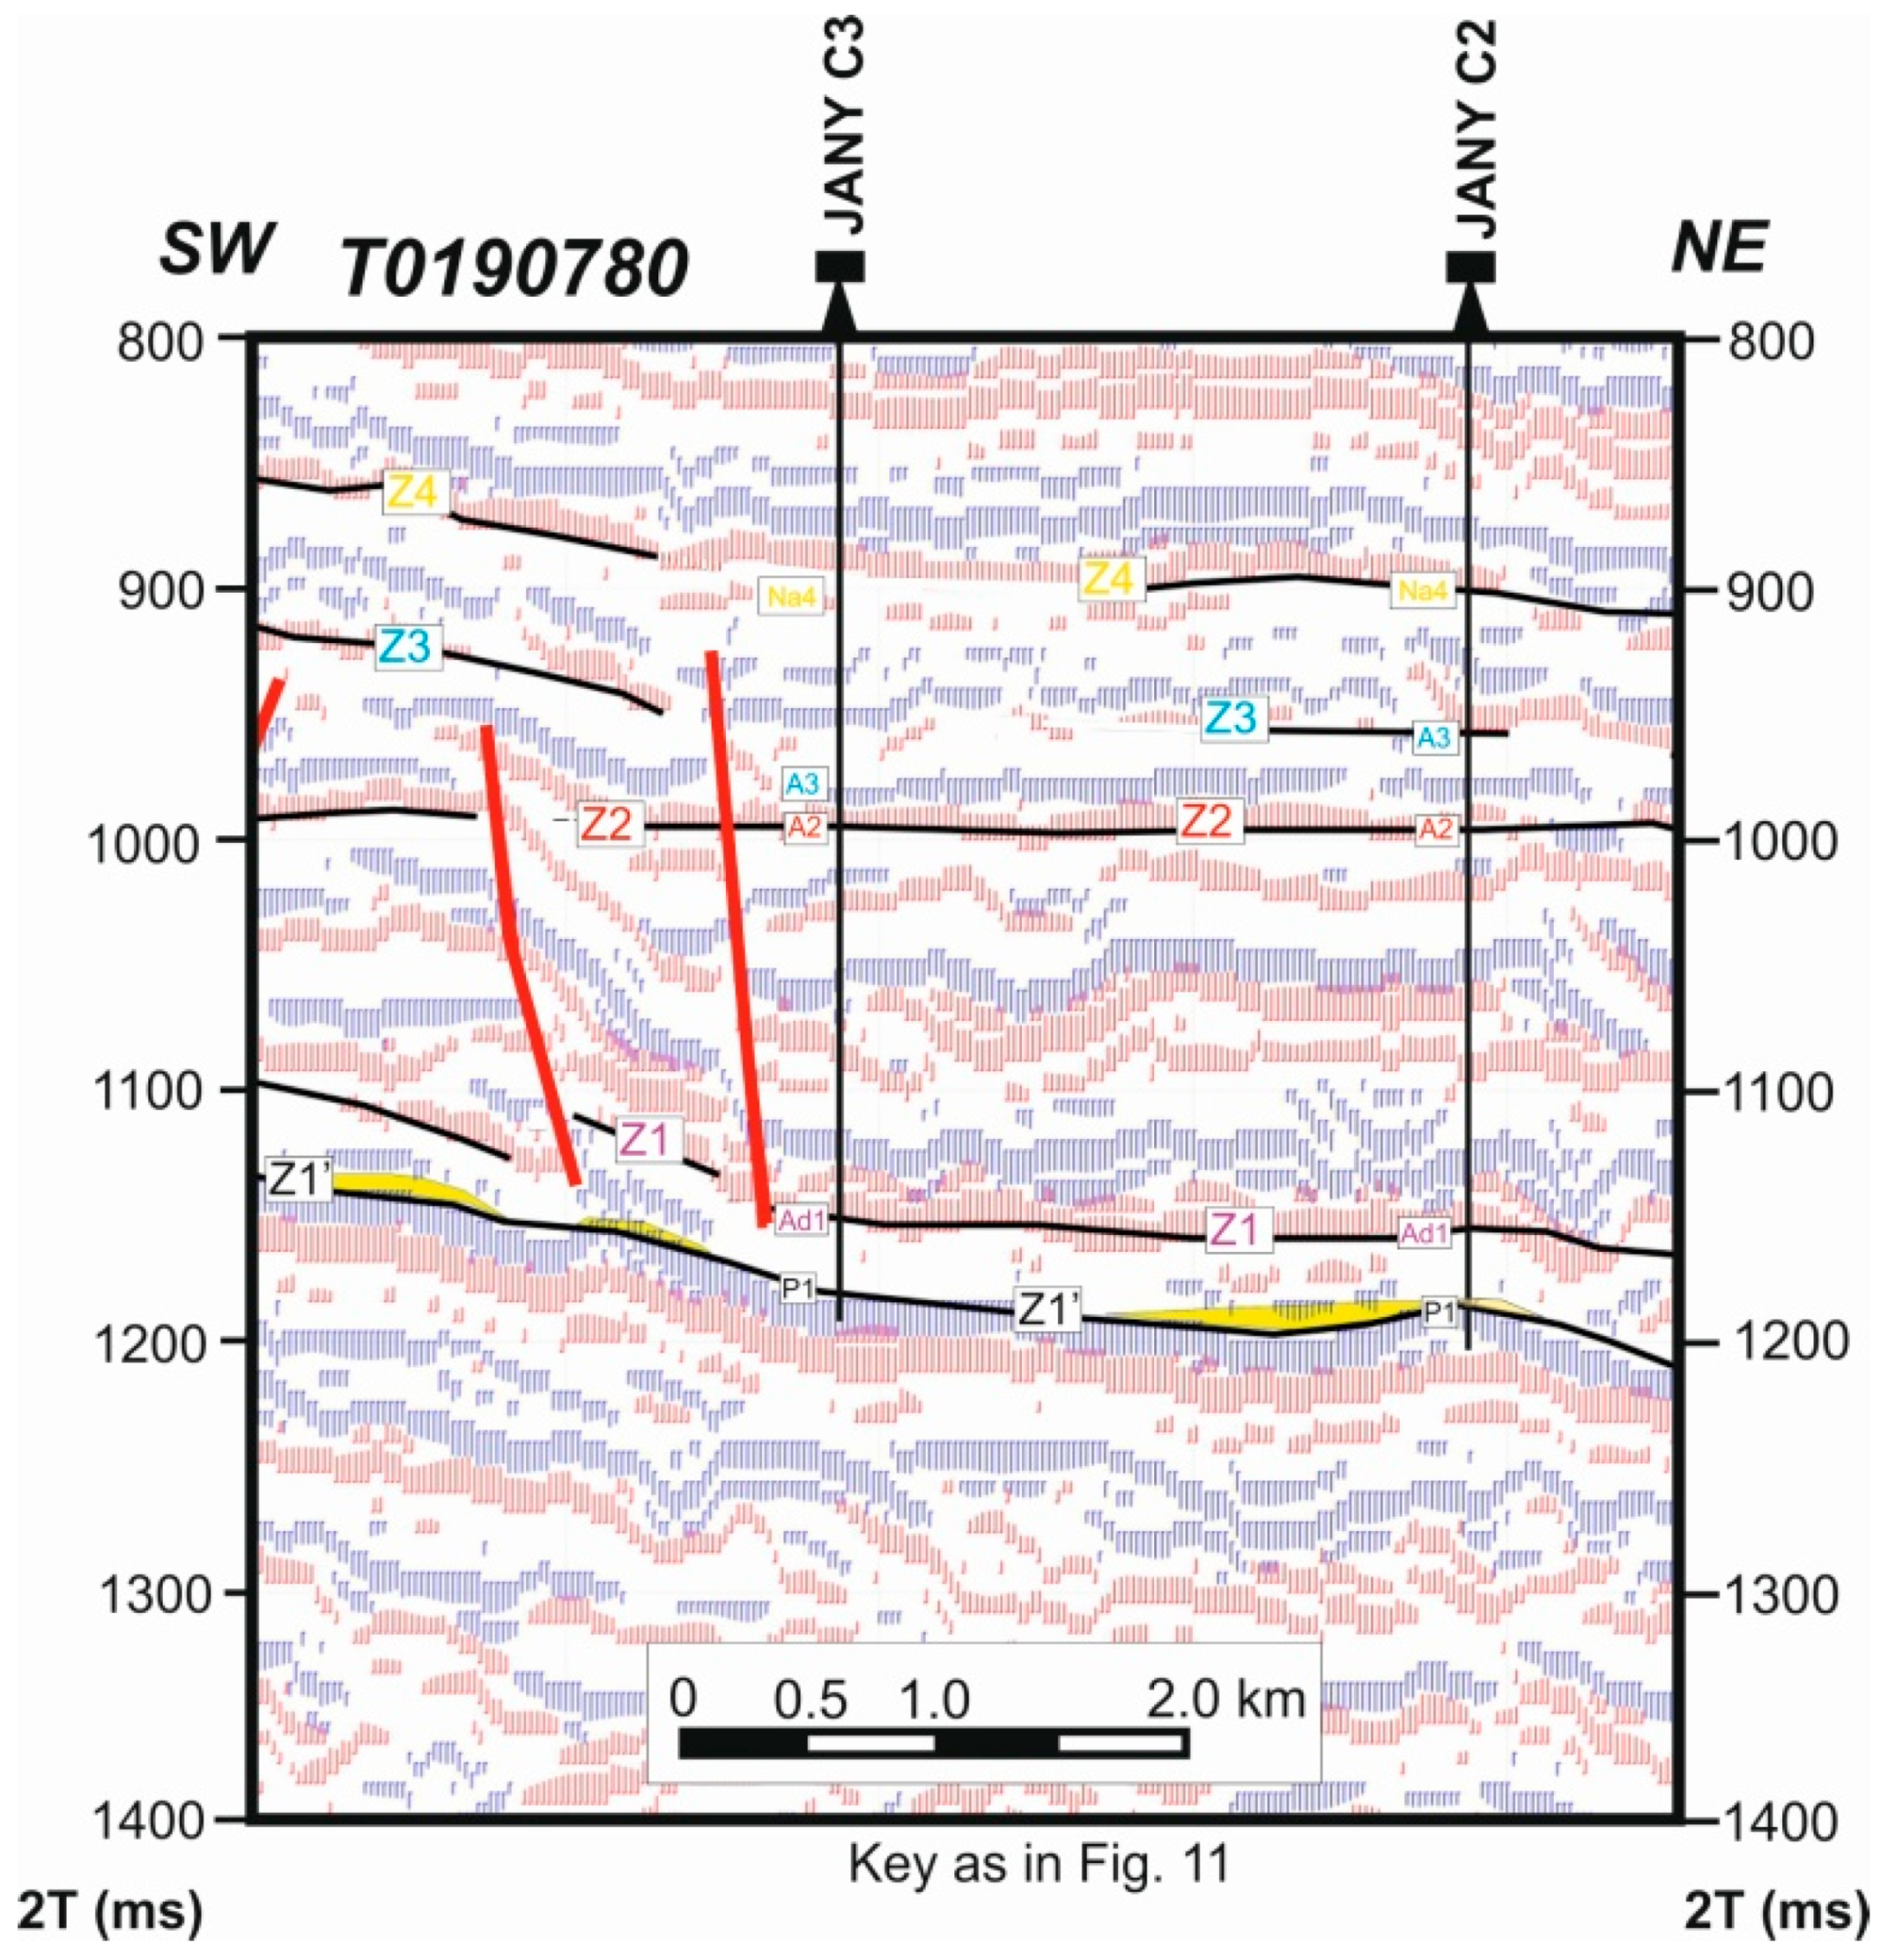
  • Z4—interface from the top of the Zechstein
  • Z3—interface from the top of the Main Anhydrite of the Leine cyclothem
  • Z2—interface from the top of the Basal Anhydrite of the Stassfurt cyclothem
  • Z1n—interface from the top of the Werra Salt—bottom of the Upper Anhydrite (difficult to trace; shown in Figure 10 above but not in the following figures)
  • Z1—interface from the bottom of the Werra Salt—top of the Lower Anhydrite
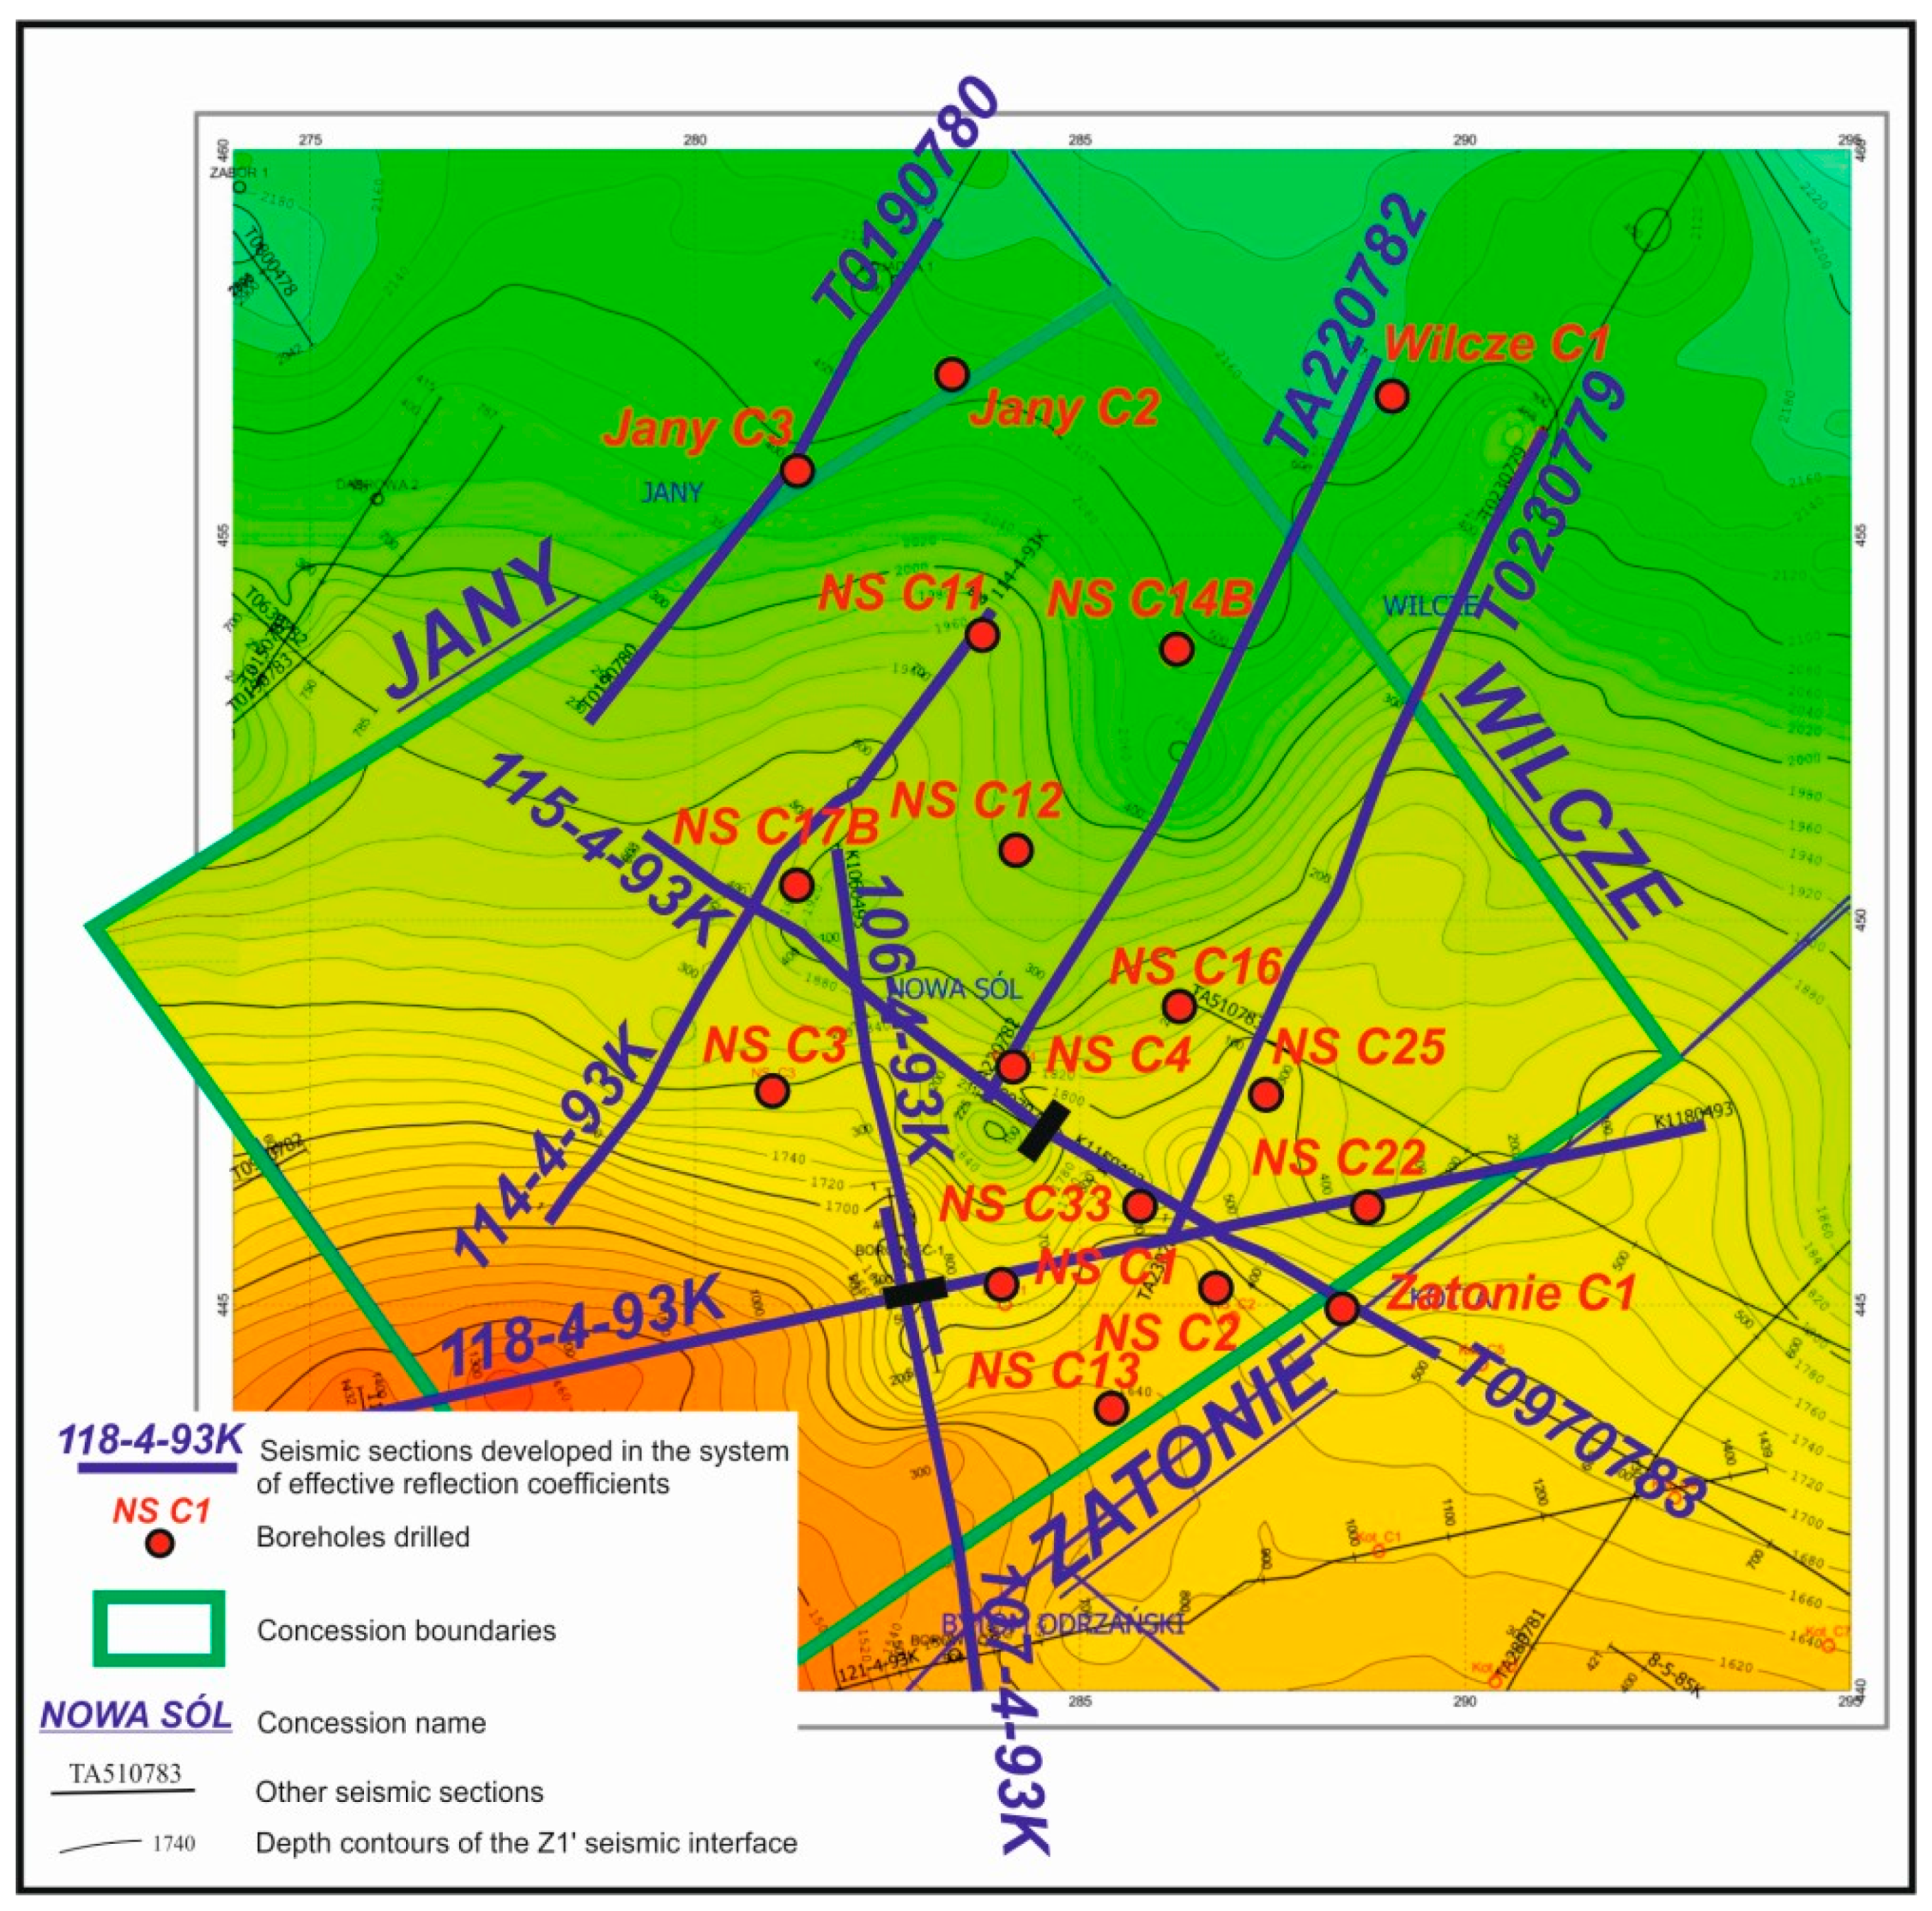
  • Z1′ (or P1, see Figure 10 above)—interface formed at the contact between the bottom of the Zechstein and the top of the Rotliegend—it corresponds to a seismic interface associated with the bottom of the Basal Limestone of the Werra cyclothem and thus it characterizes the position and shape of the top surface of P1 sandy sediments
  • C—interface from the top of the Carboniferous.
The form of the Z1′ interface associated with a negative reflection coefficient generated at the contact between high-velocity Werra sediments and sub-Zechstein rocks changes depending on the development of the near-roof parts of sub-Zechstein sediments. When the Zechstein is directly underlain by pure sandstones of sufficiently large thickness, the coefficients are clear due to the contrast of velocities between the overlying strata and the sandstones. On the other hand, when the bottom of the Zechstein is underlain by rocks with higher velocities compared to sandstones, the minimum associated with this interface is less pronounced.
Below these, there are clearly distinguishable seismic interfaces from the top part of P1, which are horizons probably corresponding to clayey and muddy insets within P1 rocks. The nature and magnitude of reflection coefficients indicate that Zechstein sediments may be underlain by insets of rocks characterized by much higher velocity compared to sandstones. The absence of drilling data and reflective interfaces along larger segments makes the interpretation more difficult. Considering the interfaces of velocity contrasts, the Tp2, Z4 and Z1′ horizons were traced along negative reflection coefficients, while the remaining ones used positive values.
The Triassic and upper Zechstein rocks lie in general conformity with each other. No presence of tectonic disruptions was recorded in Triassic rocks. Tectonic deformations affected mainly the Zechstein sediments, especially older ones. The structure of complexes of the Stassfurt and Werra cyclothems is complicated due to dislocations, whose recorded numbers far exceeded those interpreted in wave sections in previous (historical) seismic reports. The seismic image of reflection coefficients shows that their nature is highly diverse. Some distortions are caused by the existence of small faults in areas of tectonic impact. Others, caused by small changes in thickness and/or lithology, are to be interpreted as lines of lithological discontinuities. Displacements within strata are frequently recorded in the zones of low amplitude faults. Fault zones in the Z1′ horizon are associated with the diverse morphology of sub-Zechstein sediments. Most faults recorded in the Zechstein extend into older rocks, evidencing their deeper tectonic origins.
Zechstein sediments stand out on ERC sections due to boundaries with high values of the coefficients, documenting great lithological diversity of rocks which form series of salts, clays, as well as anhydrites and dolostones. The changes observed in the thickness of complexes between these horizons are caused mainly by changes in the thickness of the older salt of the Stassfurt cyclothem and the oldest salt and anhydrite of the Werra cyclothem. Based on the determined values and signs of the reflection coefficients recorded between these interfaces, it is also possible to estimate the thickness of the older and oldest rock salt in relation to the anhydrites.

5.2. Analysis of Seismic ERC Sections with Respect to Prediction of Ore Distribution

In the sediments of the Zechstein and its contact with the Rotliegend, there are distinguishable zones of lithological changes, layers with very characteristic values of the coefficients and low amplitude faults, along with wedging out zones and those where the range of individual strata is delimited by tectonic or lithological changes (Figure 11, Figure 12, Figure 13, Figure 14, Figure 15, Figure 16 and Figure 17). Considerable attention paid to the demarcation of the Z1′ interface on ERC sections resulted from the need for the highest possible precision of depicting the top of Zechstein substrate in order to fulfil the prospecting objective—the use of an analysis of changes in reflection coefficients for the identification of mineralized zones. In the Zechstein Z1′–Z1 complex there are clearly visible boundaries originating from the individual strata from the lower series (Figure 3). Attention should be paid to the high-velocity complex of Zechstein sediments directly overlying the top of the Rotliegend and to the recorded changes in reflection coefficients. Drilling results indicate that rocks associated with the orebody are several meters thick and physical parameters characterizing these sediments: velocity, density and porosity, have values similar to the highly elastic thick structure present in their overburden, consisting of limestones, anhydrites and rock salts. The distinguishable relatively lower values of the reflection coefficients compared to those of the surrounding strata enable their correlation along short segments of seismic lines, wedging out or ended with low amplitude faults. Changes in the lithology of lowermost Zechstein sediments occur above the Z1′ seismic interface as reflections with low values of the coefficients recorded in short segments of the profiles. They have been interpreted as “anomalous strata,” indicating the sites of potential mineralized zones.
The analysis of results performed in terms of the determination (demarcation) of the zones of potential occurrence of ore-bearing series is presented on ERC sections (Figure 11, Figure 12, Figure 13, Figure 14, Figure 15, Figure 16 and Figure 17). The following commentary to the results shown on several selected sections illustrates the efficiency of the method for lines extending through various geological conditions, which is also summarized in Table 1.
The table indicates that the ERC method proved to be effective in 75% of cases. The 25% failure may be caused by the fact that the resulting seismic images do not always perfectly represent the nature of detailed geological structure. This depends on the quality and number of available seismic sections. The higher the density of sections, the more precise the identification of geological structure, with a higher probability of pinpointing good drilling locations. It should be noted that the number of historical seismic sections from the Nowa Sól area was limited and that majority of the historical boreholes used for correlation were located outside that area.
Section 118-4-93K with a nearly latitudinal direction (Figure 11) is the most representative of all seismic sections selected for reprocessing. Along the Przyborów elevation and on its eastern slope, several anomalous zones were recorded at the boundary between the Zechstein and the Rotliegend, which due to the discontinuity of correlation were linked with Cu ore. Particular attention should be paid to the distinguished objects with a wider range, located between the zone of a tectonic and lithological discontinuity interpreted in the central part of the section, comprising the interval of P2 and deeper sediments and a tectonic line at the NE end. In here, a number of potential zones related to ore mineralization are located within local changes in the morphology of seismic horizons.
Section TA220782 (Figure 12) presents an undisturbed position of seismic interfaces dipping towards the NE. The interpreted potential orebodies are situated at the SW and NE ends of the section, in the central part of the line between two discontinuities delimiting a depression in the Zechstein horizon, including Z1’, as well as directly east of them. This section was also chosen to present a comparison between an ERC image and a conventional (wave-based) image (marked with the letter A). The conventional image is characterized by much higher uncertainty of the Z1′ interface.
A line with a direction resembling latitudinal consists of two profiles: 107-4-93K and 106-4-93K (Figure 13). The tectonically complex ERC image recorded in the southern section has numerous lines of lithological-tectonic discontinuities related to intra-stratum displacements in fault zones. Two interpreted zones of the occurrence of increased thickness of potential ore-bearing series are present between the individual lines of discontinuities, with one more in the location of the Borowiec 2 borehole. The P2 substrate dipping from the SW towards the NE is characterized by the monotonous structure of its northern section. An analysis of the ERC seismic record along the contact of P1 and P2 sediments indicates the lack of diversity in the distribution of reflection coefficients above an interface associated with the bottom of P2, which does not allow the identification of ore-bearing zones.
Section TO190780 (Figure 14) is characterized by its almost continuous Z1′ interface dipping from the SW towards the NE and distinct block-based tectonics in the interval of Z1–Z2 horizons. Several zones of the occurrence of increased thickness of potential ore-bearing series were interpreted between the individual lines of lithological and tectonic discontinuities.
A relatively monotonous geological structure is presented on sections 115-4-93K and T0970783 (Figure 15). An analysis of the seismic record along the contact of Rotliegend and Zechstein sediments indicates lack of variety in reflection coefficients above the Z1′ interface, making the demarcation of ore-bearing zones much more difficult. Sections 114-4-93K (Figure 16) and T0230779 (Figure 17) present characteristic groups of reflective interfaces associated with Triassic and Zechstein rocks—the substrate of Zechstein is usually and are with no correlation between reflective interfaces along larger segments. Both seismic sections provide more detail about the structure of the north-eastern gradient zone in the top of the Rotliegend.

6. Conclusions

6.1. Usefulness of the ERC Method Applied for Establishing Drilling Locations as Part of an Exploration Programme for Cu-Ag Ore Deposits

Execution of the drilling program in the Nowa Sól deposit required very precise identification of interesting structural elements. Information which is particularly crucial to specialists performing exploration involves Zechstein tectonics, the development of the bottommost series of these sediments and information on the predicted stratigraphic profiles of the planned boreholes.
The transformation of archival seismic data into effective reflection coefficients (ERC) enabled the demarcation of Z1′-Z4 interfaces in Zechstein rocks. It also allowed the identification of tectonic features and the characteristic zones of lithological changes near the Z1′ interface, which are possible hosts to orebodies. The individual elements of the seismic record were used to analyze the image recorded in Permian rocks, primarily Zechstein sediments and their contact with the Rotliegend. The bottom part of this complex usually hosts ore-bearing series, several meters thick, whose physical rock parameters do not differ significantly from values established for the whole complex. Because of this, the ore-bearing zones in the bottom parts of the Zechstein are difficult to trace in historical seismic data. Due to the high resolution of the used ERC method, the performed work resulted in the discernment of basic lithological complexes within P2, with the demarcation of its bottom surface, as well as the investigation of the geological structure—identifying the main tectonic zones and zones of smaller fractures, tracing the bottom of the shale and carbonate series Z1’. The presented assumptions and possibilities of depicting changes in mineralized zones along ERC sections have provided information about characteristic places associated with potential orebodies.
Professional interpretation of ERC sections resulted in establishing more precise locations of the planned prospecting boreholes.
In spite of the absence of characteristic anomalies associated with potential ore-bearing series on three interpreted ERC sections, the C17B borehole was drilled at the investor’s request. The negative result of the drilling confirms the assessment implied by geophysical research. Summarizing the produced results, out of twelve prospective boreholes drilled, nine remain in compliance with the ERC image and three (C3, C11, C12) present a negative result of correlation. This proves the high validity of the performed interpretation of seismic sections in relation to drilling results and justifies the adopted course of research. The developed data were used in the planning of deep boreholes for prospecting work aimed at the identification of copper and silver orebodies in the bottom series of Zechstein sediments. Boreholes drilled close to or along the interpreted seismic sections confirmed the effectiveness of the ERC method in approximately 75%. Therefore, the resulting data are to be deemed necessary for the implementation of tasks related to the drilling program. Considering the complex geological conditions of the occurrence of orebodies and the small sizes of anomalies defining areas of copper concentration, the final outcomes documented by drilling results should be regarded as a major achievement.

6.2. Summary

According to available knowledge about relationships between ore-bearing zones and Zechstein bottom morphology, the prospecting boreholes planned as part of a copper project near the N slope of a zone of higher gradients in the P2 substratum proved to have been located correctly. The majority of positive boreholes situated in the vicinity of the indicated C fault confirms the spatial relationship between more intense mineralization and regions with heavy tectonic deformations. This emphasizes the importance of tracing tectonic lines according to the assumption that deep tectonic roots had a primary impact on the development of Permian-Mesozoic rock series and as a consequence on the generation of ore deposits.
The completed drilling operations also confirmed the assumption about the position of lower Zechstein copper orebodies, forming a rather wide strip (5–10 km) placed in a zone extending NW-SE along the eastern range of the Zielona Góra oxidized field [28]. The Jany 1 borehole with abundant mineralization situated in a zone of lateral contact between reduced and oxidized sediments constituted a premise for the formulation of this pattern. However, before the beginning of the exploration program, drilling locations were modified as a result of the ERC method used in combination with analyses of historical well logs. It allowed better identification of the extent of the Zielona Góra field, which turned out to reach further to the north-east than previously expected.
Apart from conclusions related to the occurrence of potential ore-bearing zones, an additional result of reinterpretation of seismic data also involves more precise knowledge about the form and location of structural and tectonic objects present within the boundaries of the processed sections. Most of these structures have been defined by relatively minor amplitudes. The precision of the resulting information remains in a strict relationship with the number of processed seismic lines and drilled deep boreholes with geophysical logging. The identification of tectonic structures allowed the development of a new map of Variscan and Alpine faults in the area of the deposit, which was crucial to the determination of further drilling locations.
This study also has a methodical nature, showing the ability to use the impulse form of a seismic record for the identification of prognostic Cu and Ag resources, as confirmed by the results of prospecting drilling. The use of the sets of reflection coefficients in the form of ERC sections allows, for example, ongoing changes in parameters intended to present the most optimal image of the recorded section of coefficients. An increase in the density of the grid of reinterpreted seismic lines considerably affects the final result and as a consequence, the precision of outlining a potential Cu and Ag ore deposit. The high diversity of gravity field and the possibility to associate the demarcated anomalies with the identified density of specific geological series are of high significance in a comprehensive development of gravimetric and seismic data, as well as geophysical logging.
The results presented in this paper are based on historical data; therefore, they required relatively low financial expenses, with no need for costly on-site work. Proper interpretation of the prepared ERC sections allows efficient planning of other geological research, including drilling operations. This reduces the overall number of boreholes, specifically by increasing the ratio of those with positive results, which is also important in terms of environmental protection.

Author Contributions

Conceptualization, S.S. and W.J.; methodology, L.D.; validation, S.S. and K.Z.; formal analysis, K.Z.; investigation, W.J. and S.S.; resources, W.J. and S.S.; writing—original draft preparation, W.J. and L.D.; writing—review and editing, S.S. and K.Z.; visualization, K.Z.; supervision, S.S. All authors have read and agreed to the published version of the manuscript.

Funding

This research received no external funding.

Conflicts of Interest

The authors declare no known conflict of interest associated with this publication.

References

  1. Speczik, S.; Dziewińska, L.; Pepel, A.; Jóżwiak, W. Możliwość wykorzystania impulsowej postaci zapisu sejsmicznego do rozpoznania złóż prognostycznych miedzi i srebra w północnej części monokliny przedsudeckiej. Zesz. Nauk. IGSMIE-PAN 2011, 81, 117–135. [Google Scholar]
  2. Speczik, S.; Dziewińska, L.; Pepel, A.; Jóżwiak, W. Analiza i przetwarzanie danych geofizycznych jako instrument poszukiwań złóż Cu-Ag na monoklinie przedsudeckiej. Biul. Panstw. Inst. Geol. 2012, 452, 257–286. [Google Scholar]
  3. Dziewińska, L.; Pepel, A.; Tarkowski, R.; Żuk, Z. Nowe spojrzenie na wyniki badań geofizycznych monokliny przedsudeckiej w aspekcie poszukiwań surowców mineralnych. Biul. Panstw. Inst. Geol. 2017, 468, 165–174. [Google Scholar]
  4. Żelaźniewicz, A. Rejonizacja Tektoniczna Polski; Komitet Nauk Geologicznych PAN: Wrocław, Poland, 2011; 60p. [Google Scholar]
  5. Grad, M.; Polkowski, M.; Ostaficzuk, S.R. High-resolution 3D seismic model of the crustal and uppermost mantle structure in Poland. Tectonophysics 2016, 666, 188–210. [Google Scholar] [CrossRef]
  6. Nawrocki, J.; Becker, A. Atlas Geologiczny Polski; Polish Geological Institute: Warsaw, Poland, 2017. [Google Scholar]
  7. Speczik, S.; Skowronek, C.; Fredrich, G.; Diedel, R.; Schumacher, C.; Schmidt, F.P. The environment of generation of some base metal Zechstein occurrences in central Europe. Acta Geol. Pol. 1986, 36, 1–36. [Google Scholar]
  8. Franke, W.; Żelaźniewicz, A.; Porębski, S.J.; Wajsprych, B. The Saxothuringian zone in Germany and Poland: Differences and common features. Geol. Rundsch. 1993, 82, 583–599. [Google Scholar] [CrossRef]
  9. Speczik, S. The Kupferschiefer mineralization of Central Europe: New aspects and major areas of future research. Ore Geol. Rev. 1995, 9, 411–426. [Google Scholar] [CrossRef]
  10. Kiersnowski, H.; Peryt, T.M.; Buniak, A.; Mikołajewski, Z. From the intra-desert ridges to the marine carbonate island chain: Middle to late Permian (Upper Rotliegend-Lower Zechstein) of the Wolsztyn-Pogorzela high, west Poland. Geol. J. 2010, 44, 319–335. [Google Scholar] [CrossRef]
  11. Żelaźniewicz, A.; Cwojdziński, S.; England, E.W.; Zietara, P. Variscides in the Sudetes and the reworked Cadomian orogen: Evidence from the GB-2A seismic reflection profiling in southwestern Poland. Geol. Q. 1997, 41, 289–308. [Google Scholar]
  12. Speczik, S. Metalogeneza podłoża podcechsztyńskiego monokliny przedsudeckiej. Geol. Sudet. 1985, 20, 37–96. [Google Scholar]
  13. Piestrzyński, A. Historyczny rozwój poglądów na genezę złoża rud miedzi na monoklinie pzedsudeckiej- dyskusja. Biul. Państw. Inst. Geol. 2007, 423, 69–76. [Google Scholar]
  14. Speczik, S. Relation of Permian base metal occurrences to Variscan paleogeothermal field of the Fore- Sudetic Monocline; results of fluid inclusion studies and vitrinite rank determination. Fort. Miner. 1985, 63, 222. [Google Scholar]
  15. Speczik, S.; Oszczepalski, S.; Nowak, G.; Karwasiecka, M. Cechsztyński łupek miedzionośny-poszukiwanie nowych rezerw. Biul. Państw. Inst. 2007, 423, 173–188. [Google Scholar]
  16. Leszczyński, K. (Ed.) Profile Głębokich Otworów Wiertniczych Instytutu Geologicznego; Polish Geological Institute: Warsaw, Poland, 2015; p. 146. [Google Scholar]
  17. Majorowicz, J.; Safanda, J. Lithosphere Thickness from New Heat-Flow Data of the Odra Variscan Area, SW Poland. Pure Appl. Geophys. 2018, 175, 4343–4354. [Google Scholar] [CrossRef]
  18. Królikowski, C.; Petecki, Z. Gravimetric Atlas of Poland 1:500,000 and 1:750,000; Polish Geological Institute: Warsaw, Poland, 1995. [Google Scholar]
  19. Cwojdziński, S.; Młynarski, S.; Dziewińska, L.; Jóźwiak, W.; Zientara, P.; Baziuk, T. Pierwszy sejsmiczny profil głębokich badań refleksyjnych (GBS) na Dolnym Śląsku. Przegląd Geol. 1995, 43, 727–737. [Google Scholar]
  20. Młynarski, S.; Pokorski, J.; Dziewińska, L.; Jóźwiak, W.; Zientara, P. Deep reflection seismic experiments in western Poland. Geol. Q. 2000, 44, 175–181. [Google Scholar]
  21. Narkiewicz, M.; Petecki, Z. Basement structure of the Palaeozoic Platform in Poland. Geol. Q. 2017, 61, 502–520. [Google Scholar]
  22. Kiersnowski, H.; Petecki, Z. Budowa geologiczna podcechsztyńskiego podłoża Legnicko-Głogowskiego Okręgu Miedziowego (LGOM) i jego otoczenia: Spojrzenie krytyczne. Biul. Państw. Inst. Geol. 2017, 468, 175–198. [Google Scholar]
  23. Rudnickaja, D.I.; Danenberg, E.E.; Belozerov, V.B. Principy vydelenija sejsmociklitov v kontinentalnyh otlozhenijah jury Zapadno-Sibirskoj plity v svjazi s poiskami neantiklinalnyh zalezhej nefti i gaza. In Prikladnye Voprosy Sedimentacionnoj Ciklichnosti i Neftegazonosnosti; Nauka: Novosybirsk, Russia, 1987; pp. 67–72. [Google Scholar]
  24. Dziewińska, L.; Jóźwiak, W. Zmiany litologiczne w utworach karbonu rowu lubelskiego w świetle interpretacji geofizycznej. Biul. Państw. Inst. Geol. 2000, 39, 5–48. [Google Scholar]
  25. Dziewińska, L.; Petecki, Z. Kompleksowa interpretacja badań geofizycznych północnego obrzeżenia Gór Świętokrzyskich. Instr. Metod. Badań Geol. 2004, 58, 107. [Google Scholar]
  26. Dziewińska, L.; Petecki, Z.; Tarkowski, R. Budowa geologiczna utworów permu struktury Wilków (monoklina przedsudecka) w świetle interpretacji sekcji współczynników odbicia. Przegląd Gór. 2011, 67, 64–72. [Google Scholar]
  27. Dziewińska, L.; Tarkowski, R. Sejsmiczna interpretacja struktury Wierzchowa dla potrzeb podziemnego składowania CO2 z wykorzystaniem efektywnych współczynników odbicia. Zesz. Nauk. IGSMIE-PAN 2016, 92, 261–274. [Google Scholar]
  28. Zieliński, K.; Speczik, S. Głębokie złoża miedzi i srebra szansą dla górnictwa metali w Polsce. Biul. Państw. Inst. Geol. 2017, 468, 153–164. [Google Scholar]
Figure 1. Interpretative gravity map presenting the surroundings of the Nowa Sól deposit.
Minerals 10 00725 g001
Figure 2. Location of seismic sections reinterpreted using the effective reflection coefficients (ERC) method, as well as historical and prospecting boreholes within the boundaries of the Nowa Sól concession area and deposit.
Minerals 10 00725 g002
Figure 3. Lithostratigraphy of the Zechstein Copper-bearing Series.
Minerals 10 00725 g003
Figure 4. Bouguer gravity map of the Nowa Sól concession area showing the locations of prospecting boreholes; density in the reduction layer 2.25, reference level 0 mamsl.
Minerals 10 00725 g004
Figure 5. Gravity map of the Nowa Sól concession area - Horizontal gradient after Rosenbach against the distribution of prospecting boreholes. Geological faults and boundaries of the oxidized field interpreted from drilling data.
Minerals 10 00725 g005
Figure 6. Gravity map of the Nowa Sól concession area—Axes of maximum horizontal gradient and vertical density interfaces in depth intervals of 0–1800 m, 1800–2800 m and 2800–4000 m and the locations of prospecting boreholes.
Minerals 10 00725 g006
Figure 7. Gravimetric densities of linear elements in the Nowa Sól concession area in a depth interval of 1600–2800 m.
Minerals 10 00725 g007
Figure 8. Lithological profile of the historical Borowiec 2 borehole relative to the geophysical section; geophysical parameters logged in this borehole included rock density and sonic velocity, suitable for seismic interpretation. Abbreviations: Q—Quaternary, Tr—Palaeogene + Neogene, T 2—Muschelkalk (Middle Triassic), T1 1 to T1 3—Lower to Upper Buntsandstein (Lower Triassic), Z1 to Z4—Zechstein sedimentary cycles (Permian), P1 2—Upper Rotliegend (Permian).
Minerals 10 00725 g008
Figure 9. Seismic map of the Zechstein in the Nowa Sól concession area—depth of P2 bottom.
Minerals 10 00725 g009
Figure 10. An example of using the ERC method. Additional symbols: C—top of the Carboniferous, P1—top of the Rotlegend, Z1—top of the Lower Anhydrite (Zechstein), Z1n—bottom of the Upper Anhydrite (Zechstein), Z2—top of the Basal Anhydrite (Zechstein), Z3—top of the Main Anhydrite (Zechstein).
Minerals 10 00725 g010
Figure 11. Time-converted seismic reflection coefficients in section 118-4-93K of a Zechstein deposit. Additional symbols: Na4—Youngest Rock Salt, A3—Main Anhydrite, A2—Basal Anhydrite, Ad1—Lower Anhydrite, P1—Rotliegend.
Minerals 10 00725 g011
Figure 12. Time-converted seismic reflection coefficients in section TA220782 of a Zechstein deposit compared to a conventional wave-based image (A).
Minerals 10 00725 g012
Figure 13. Time-converted seismic reflection coefficients in sections 106-4-93K and 107-4-93K of a Zechstein deposit.
Minerals 10 00725 g013
Figure 14. Time-converted seismic reflection coefficients in section T0190780 of a Zechstein deposit.
Minerals 10 00725 g014
Figure 15. Time-converted seismic reflection coefficients in sections 115-4-93K and T0970783 of a Zechstein deposit.
Minerals 10 00725 g015
Figure 16. Time-converted seismic reflection coefficients in section 114-4-93K of a Zechstein deposit.
Minerals 10 00725 g016
Figure 17. Time-converted seismic reflection coefficients in section T0230779 of a Zechstein deposit.
Minerals 10 00725 g017
Table 1. Efficiency of the used ERC method.
Borehole SignatureCorrelation with ERC ImageSeismic Section No.
NS C1compliance118-4-93K, 106-4-93K
NS C2compliance118-4-93K, T0970783
NS C3no confirmation118-4-93K, T0970783
NS C4complianceTA220782, 115-4-93K
NS C11no confirmation114-4-93K
NS C12no confirmationTA220782, 114-4-93K
NS C13compliance118-4-93K, 107-4-93K
NS C14BcomplianceTA220782
NS C16complianceTA220782, TA230782
NS C17Bcompliance115-4-93K, 114-4-93K, 106-4-93K
NS C22compliance118-4-93K, T0970783
NS C33compliance118-4-93K, T0970783

