Influence of Titaniferous Phases on Tungsten Mineralizing Processes at the Giant Sisson Brook W-Mo Deposit, New Brunswick, Canada: Mineral-Chemical and Geochronological Assessment


Abstract
:1. Introduction
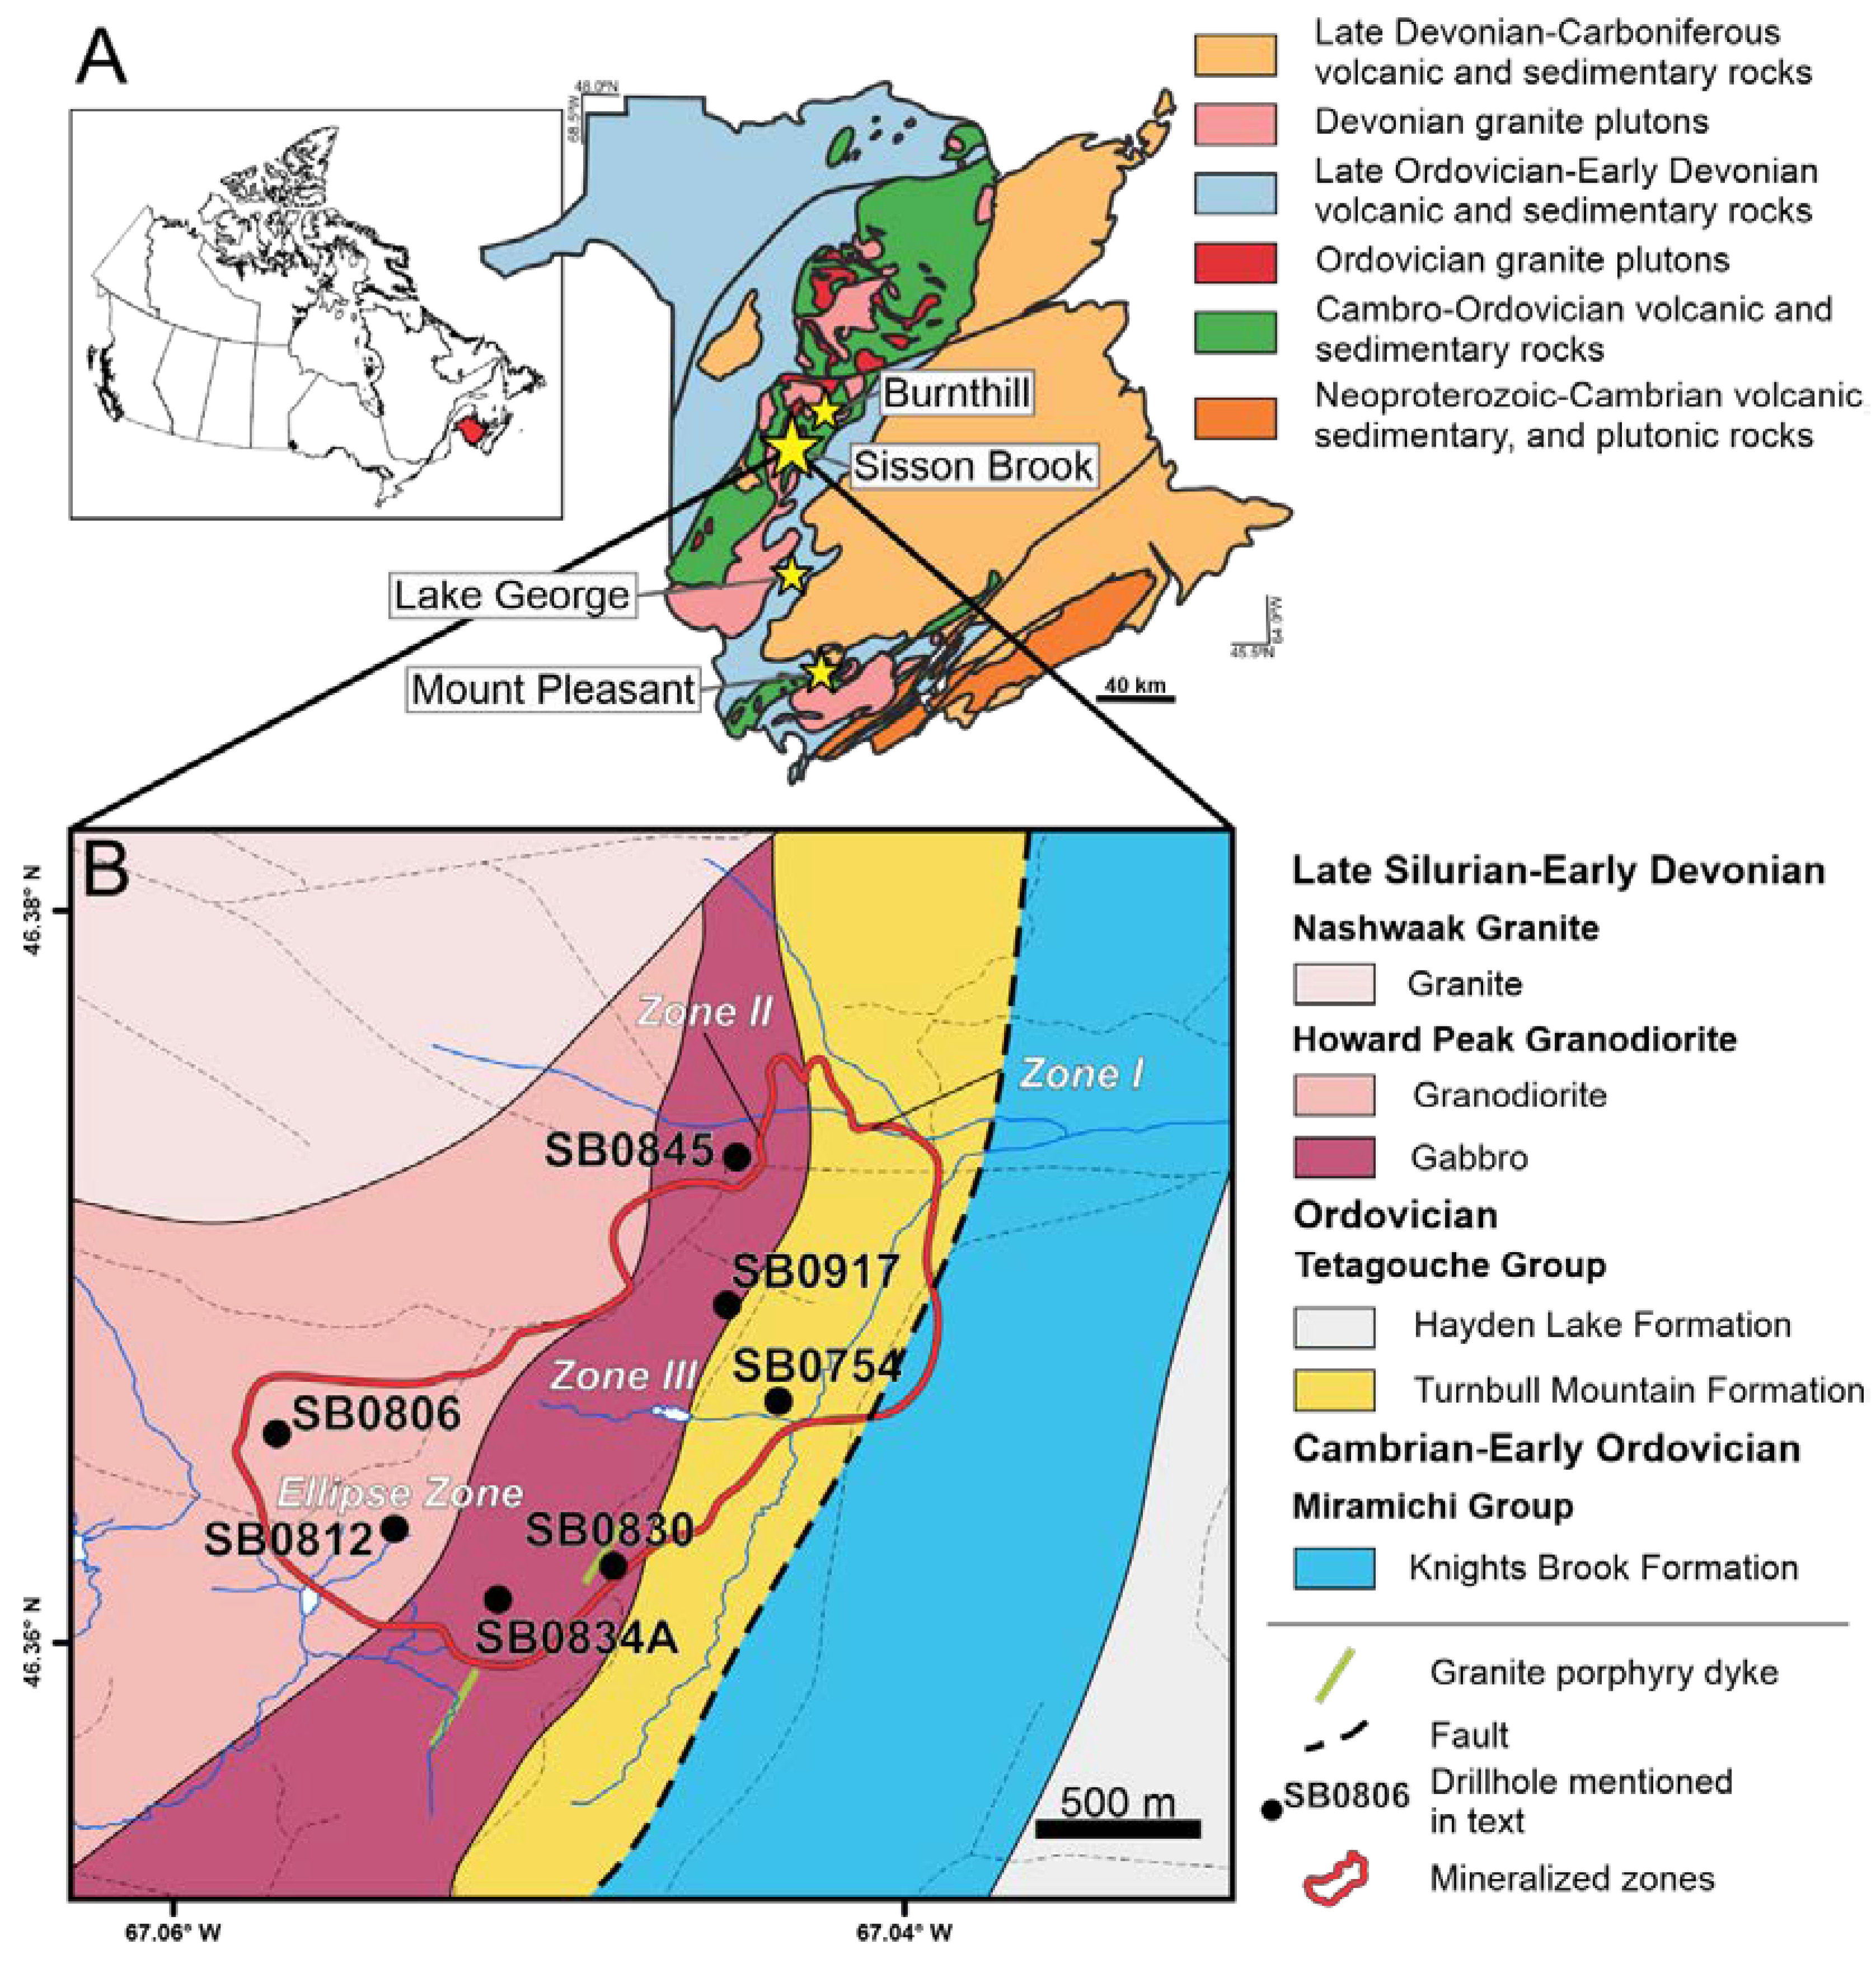
2. Geological Setting
2.1. Geological Setting
2.2. Mineralization
3. Methods
3.1. Petrography
3.2. Micro-XRF Mapping
3.3. Image Analysis
3.4. Mineral Element Mapping
3.5. Whole Rock Geochemistry
3.6. U-Pb Dating
4. Results
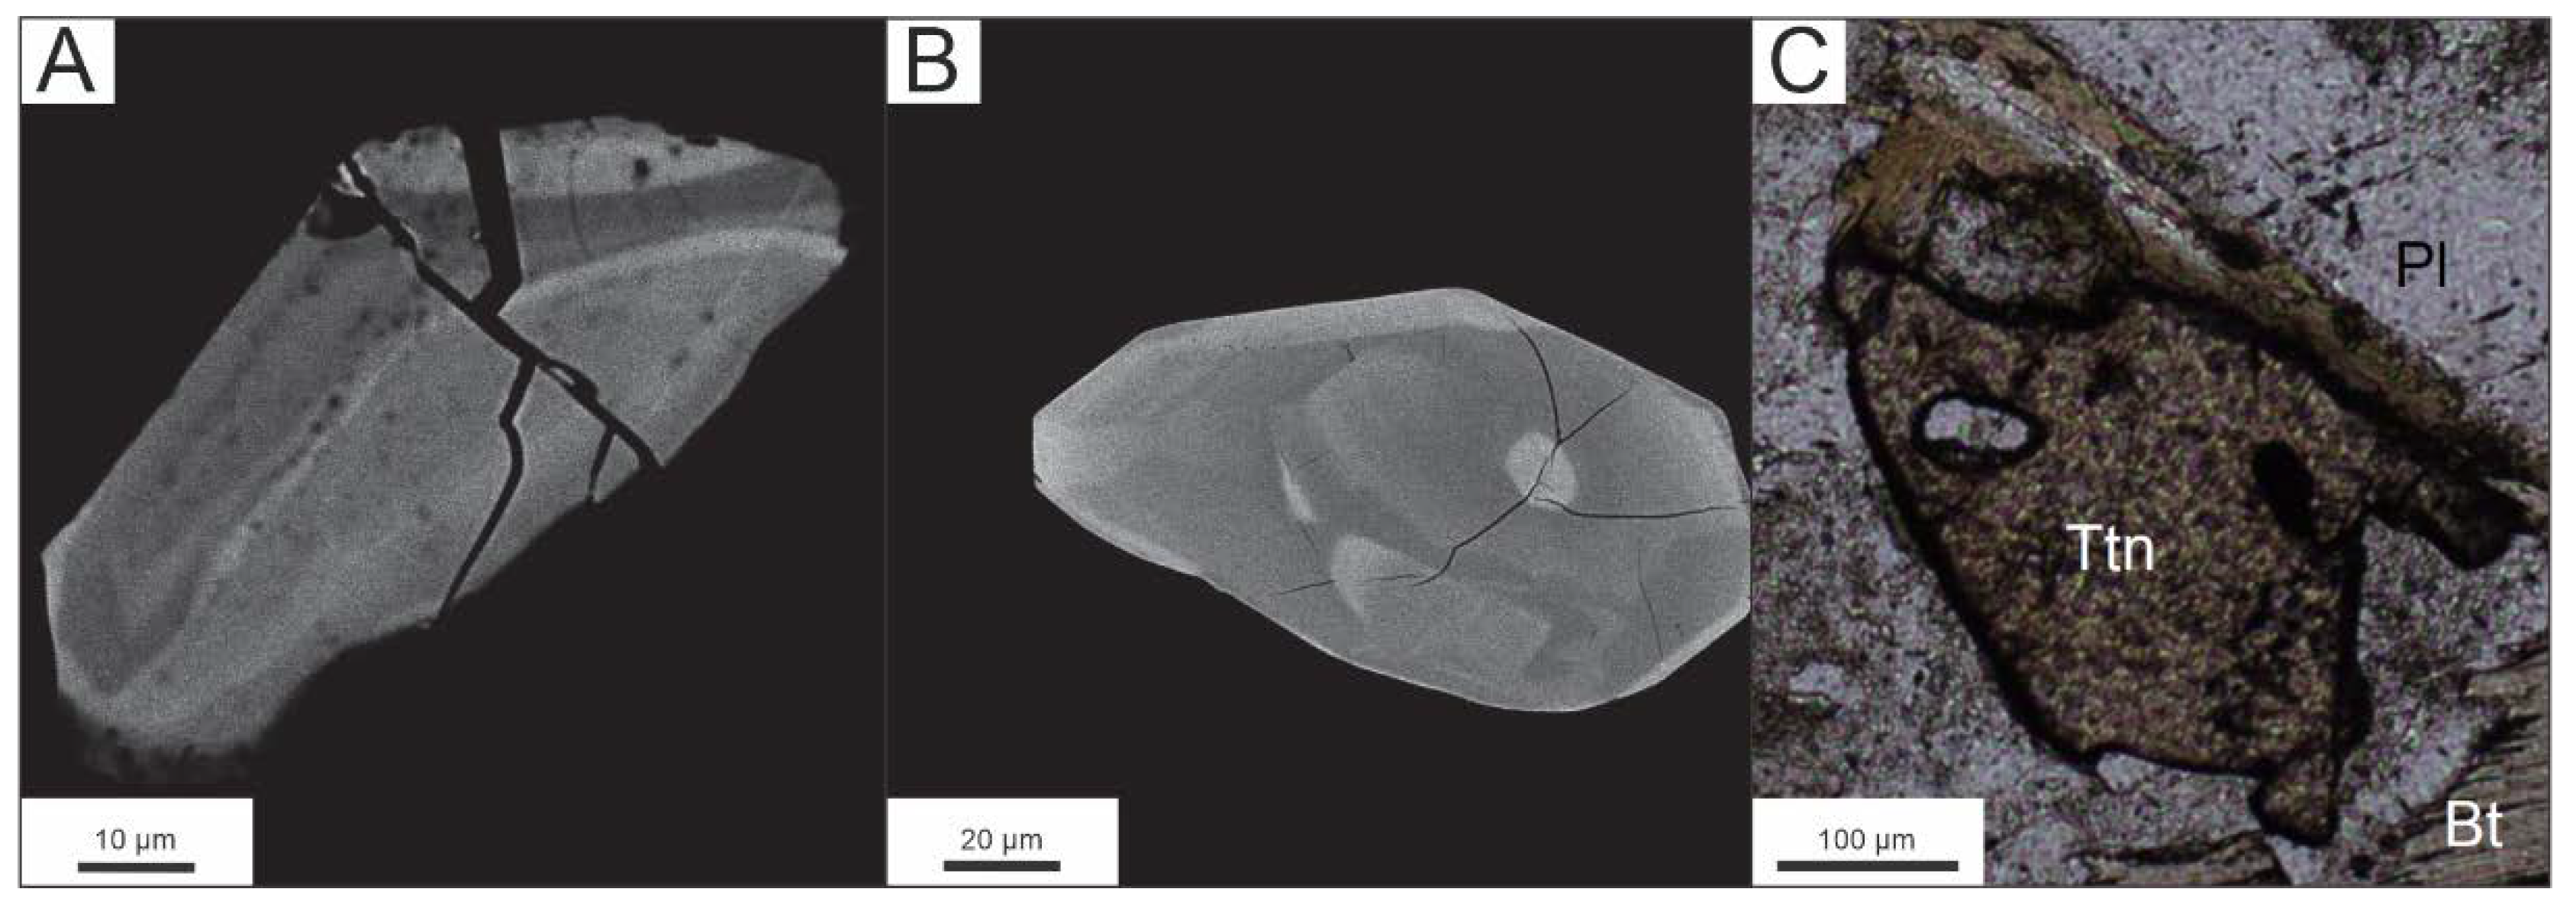
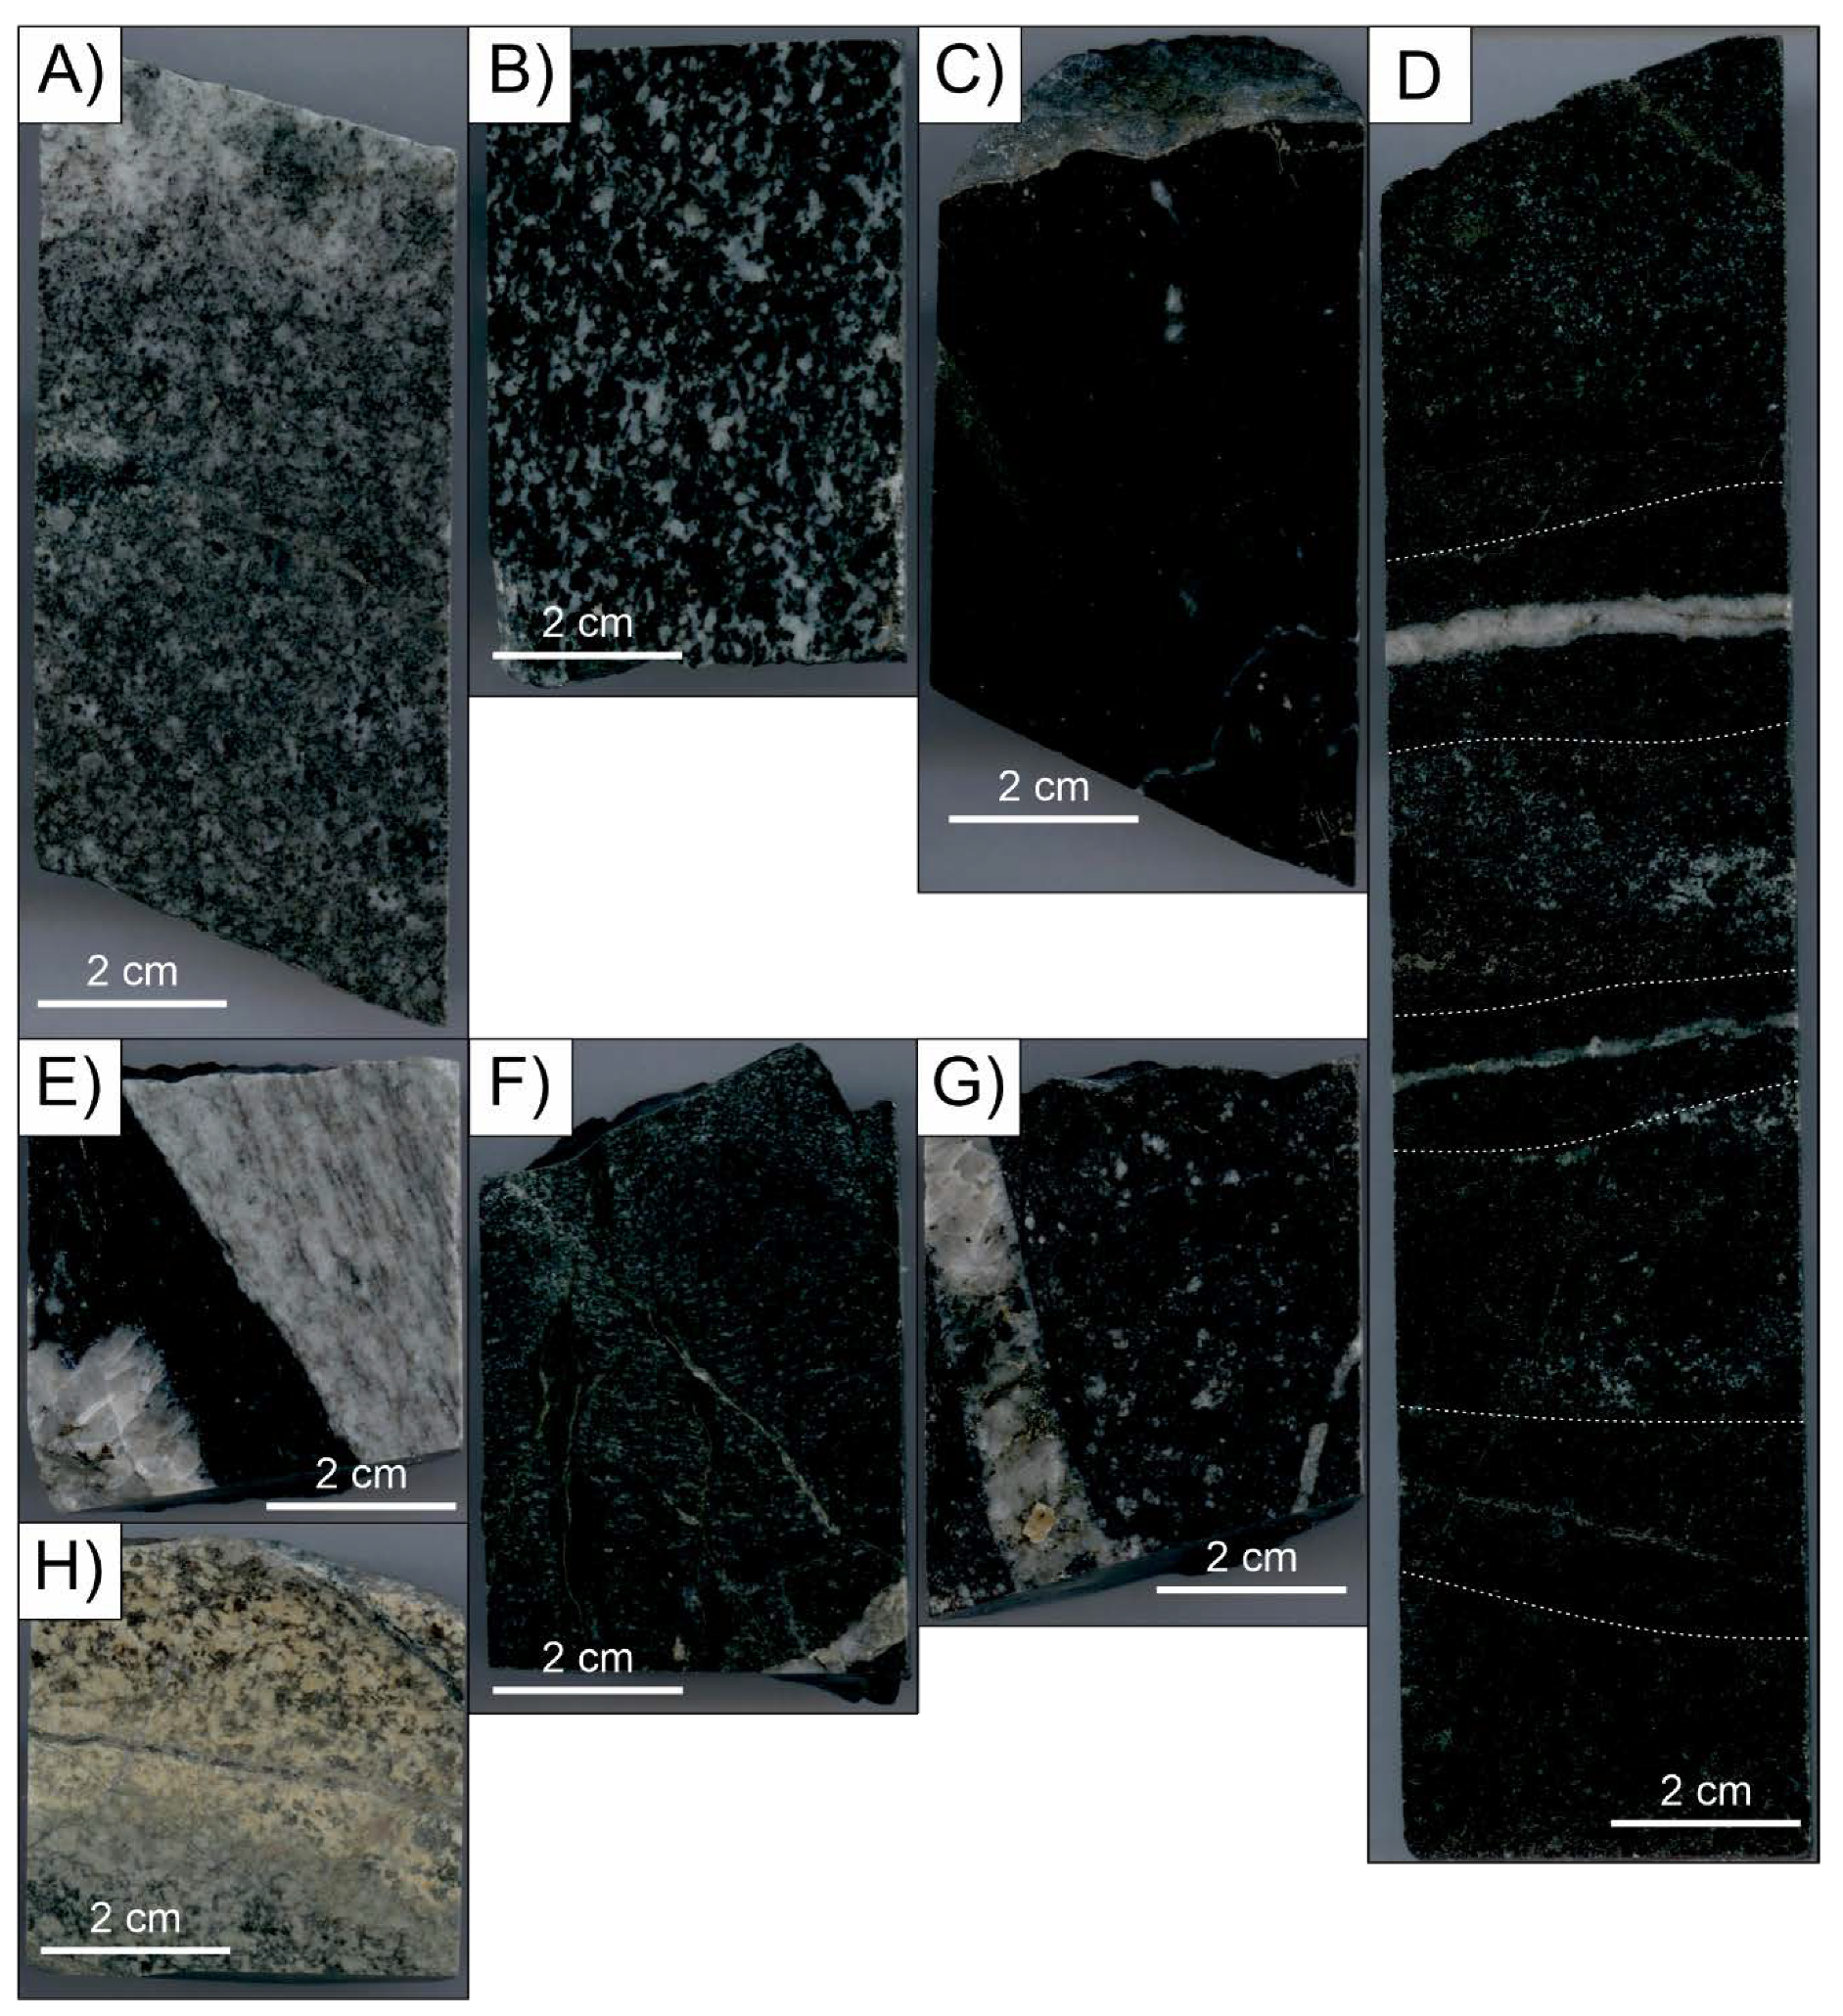
4.1. Petrography
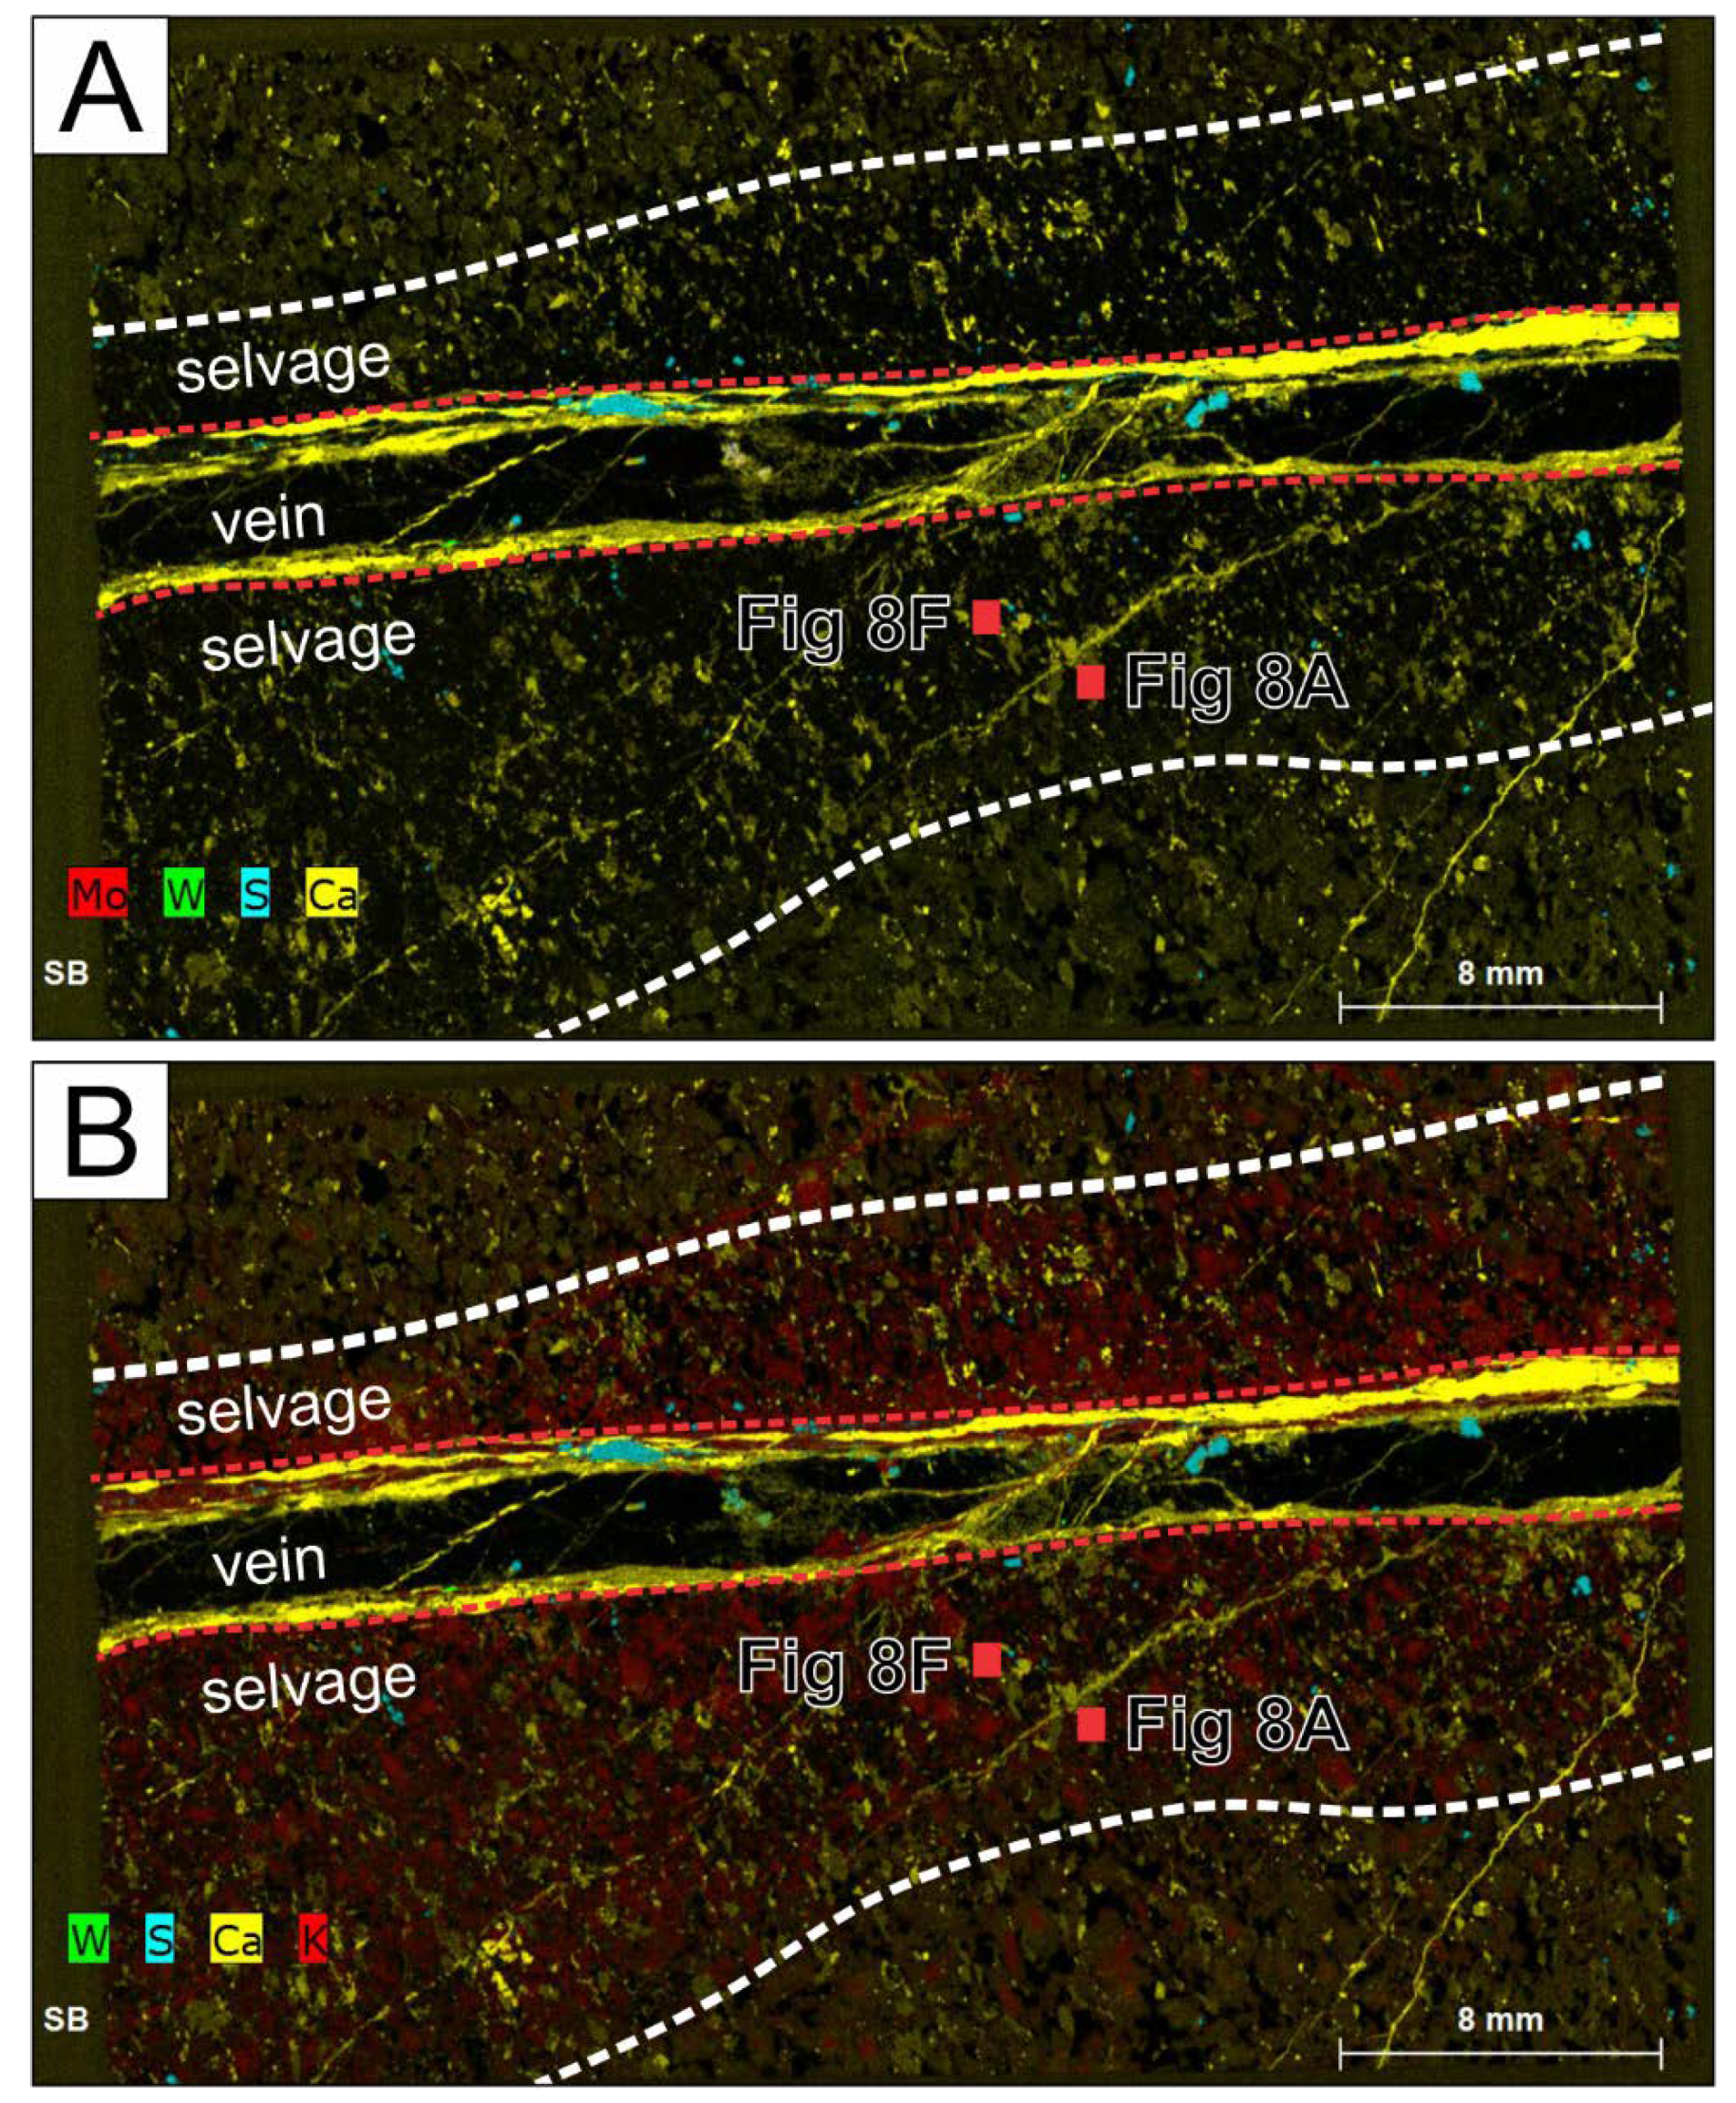
4.2. Micro-XRF Mapping
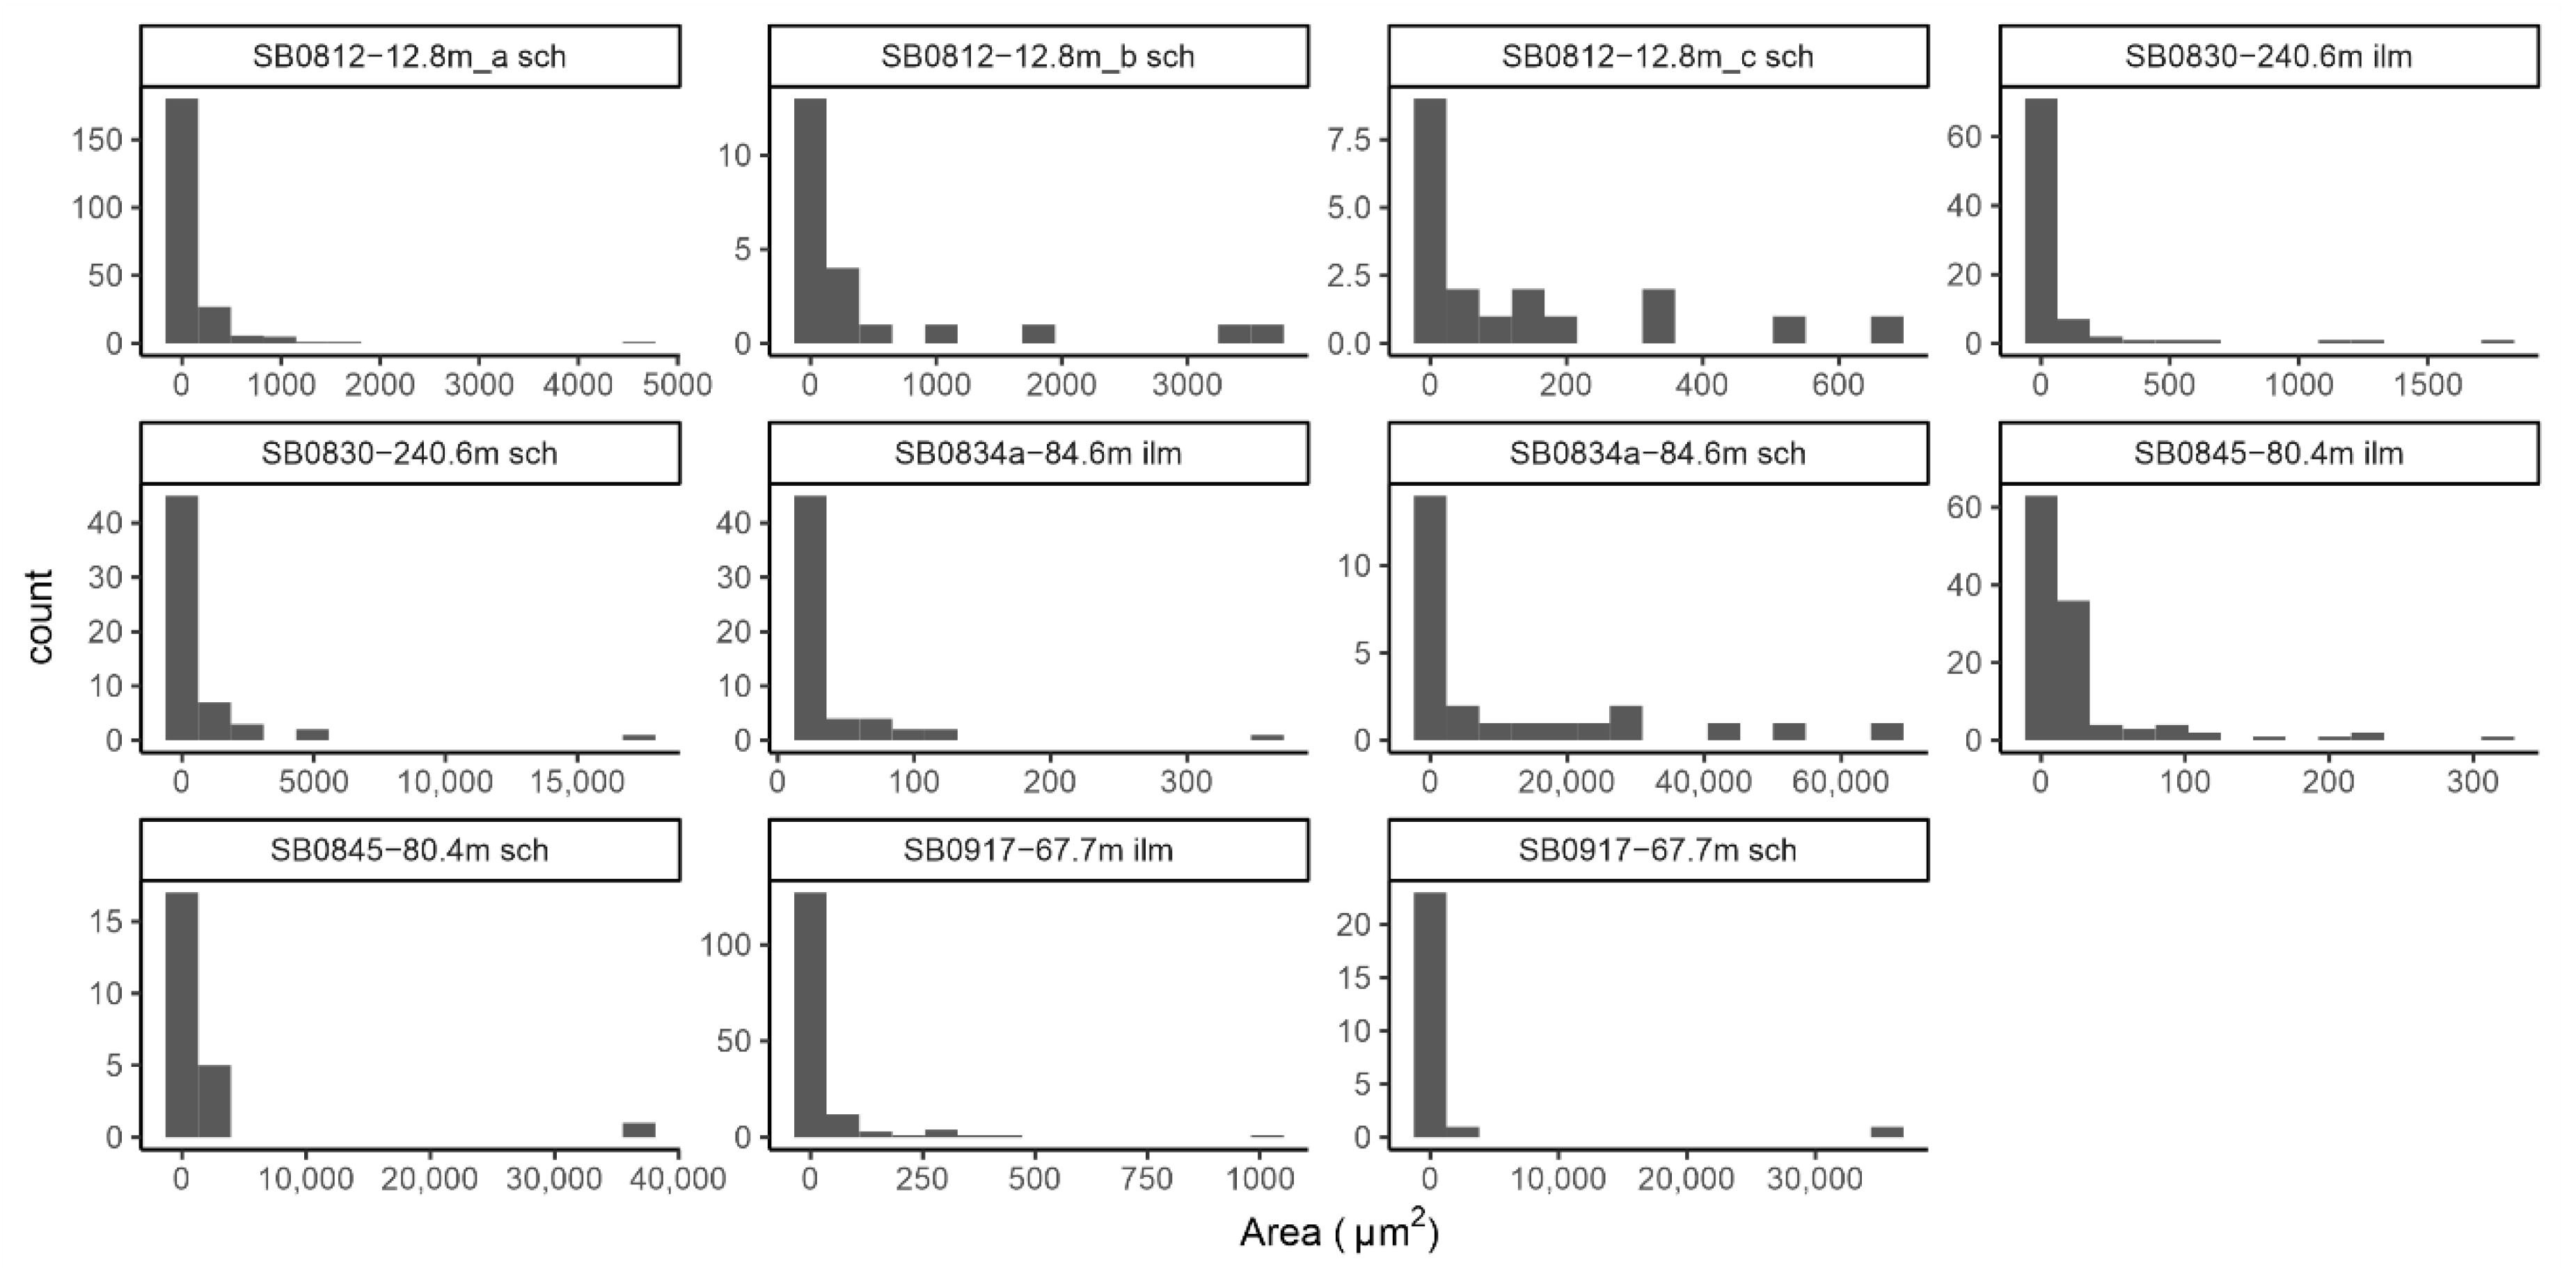
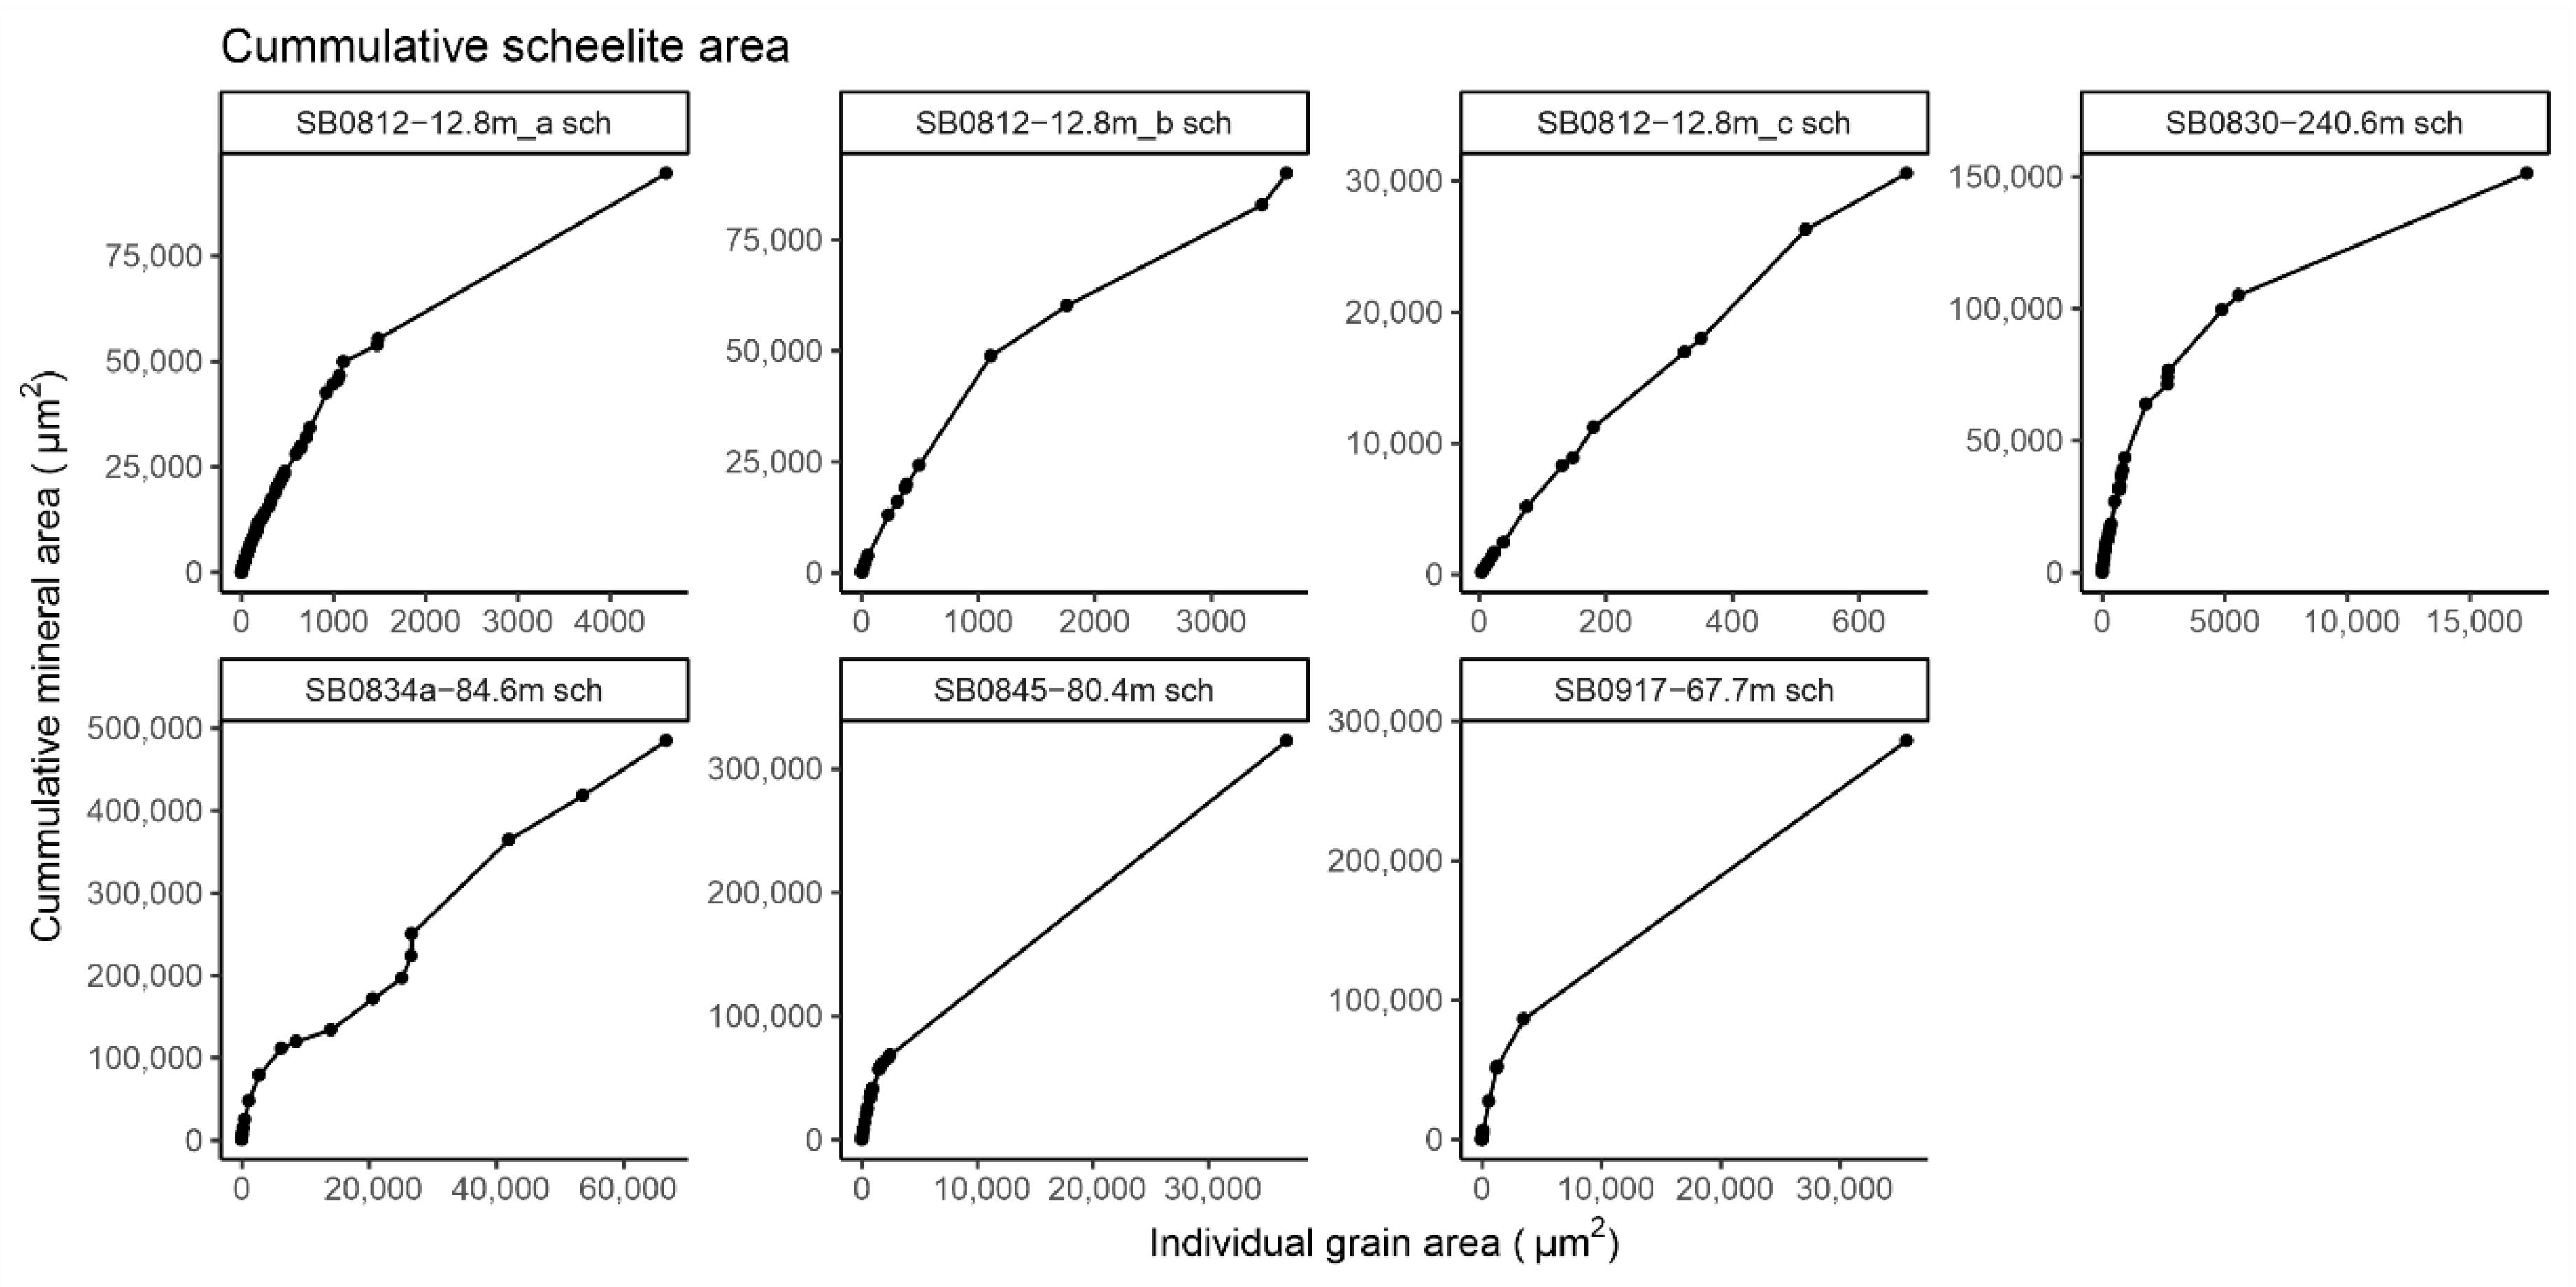
4.3. Grain Size Analysis
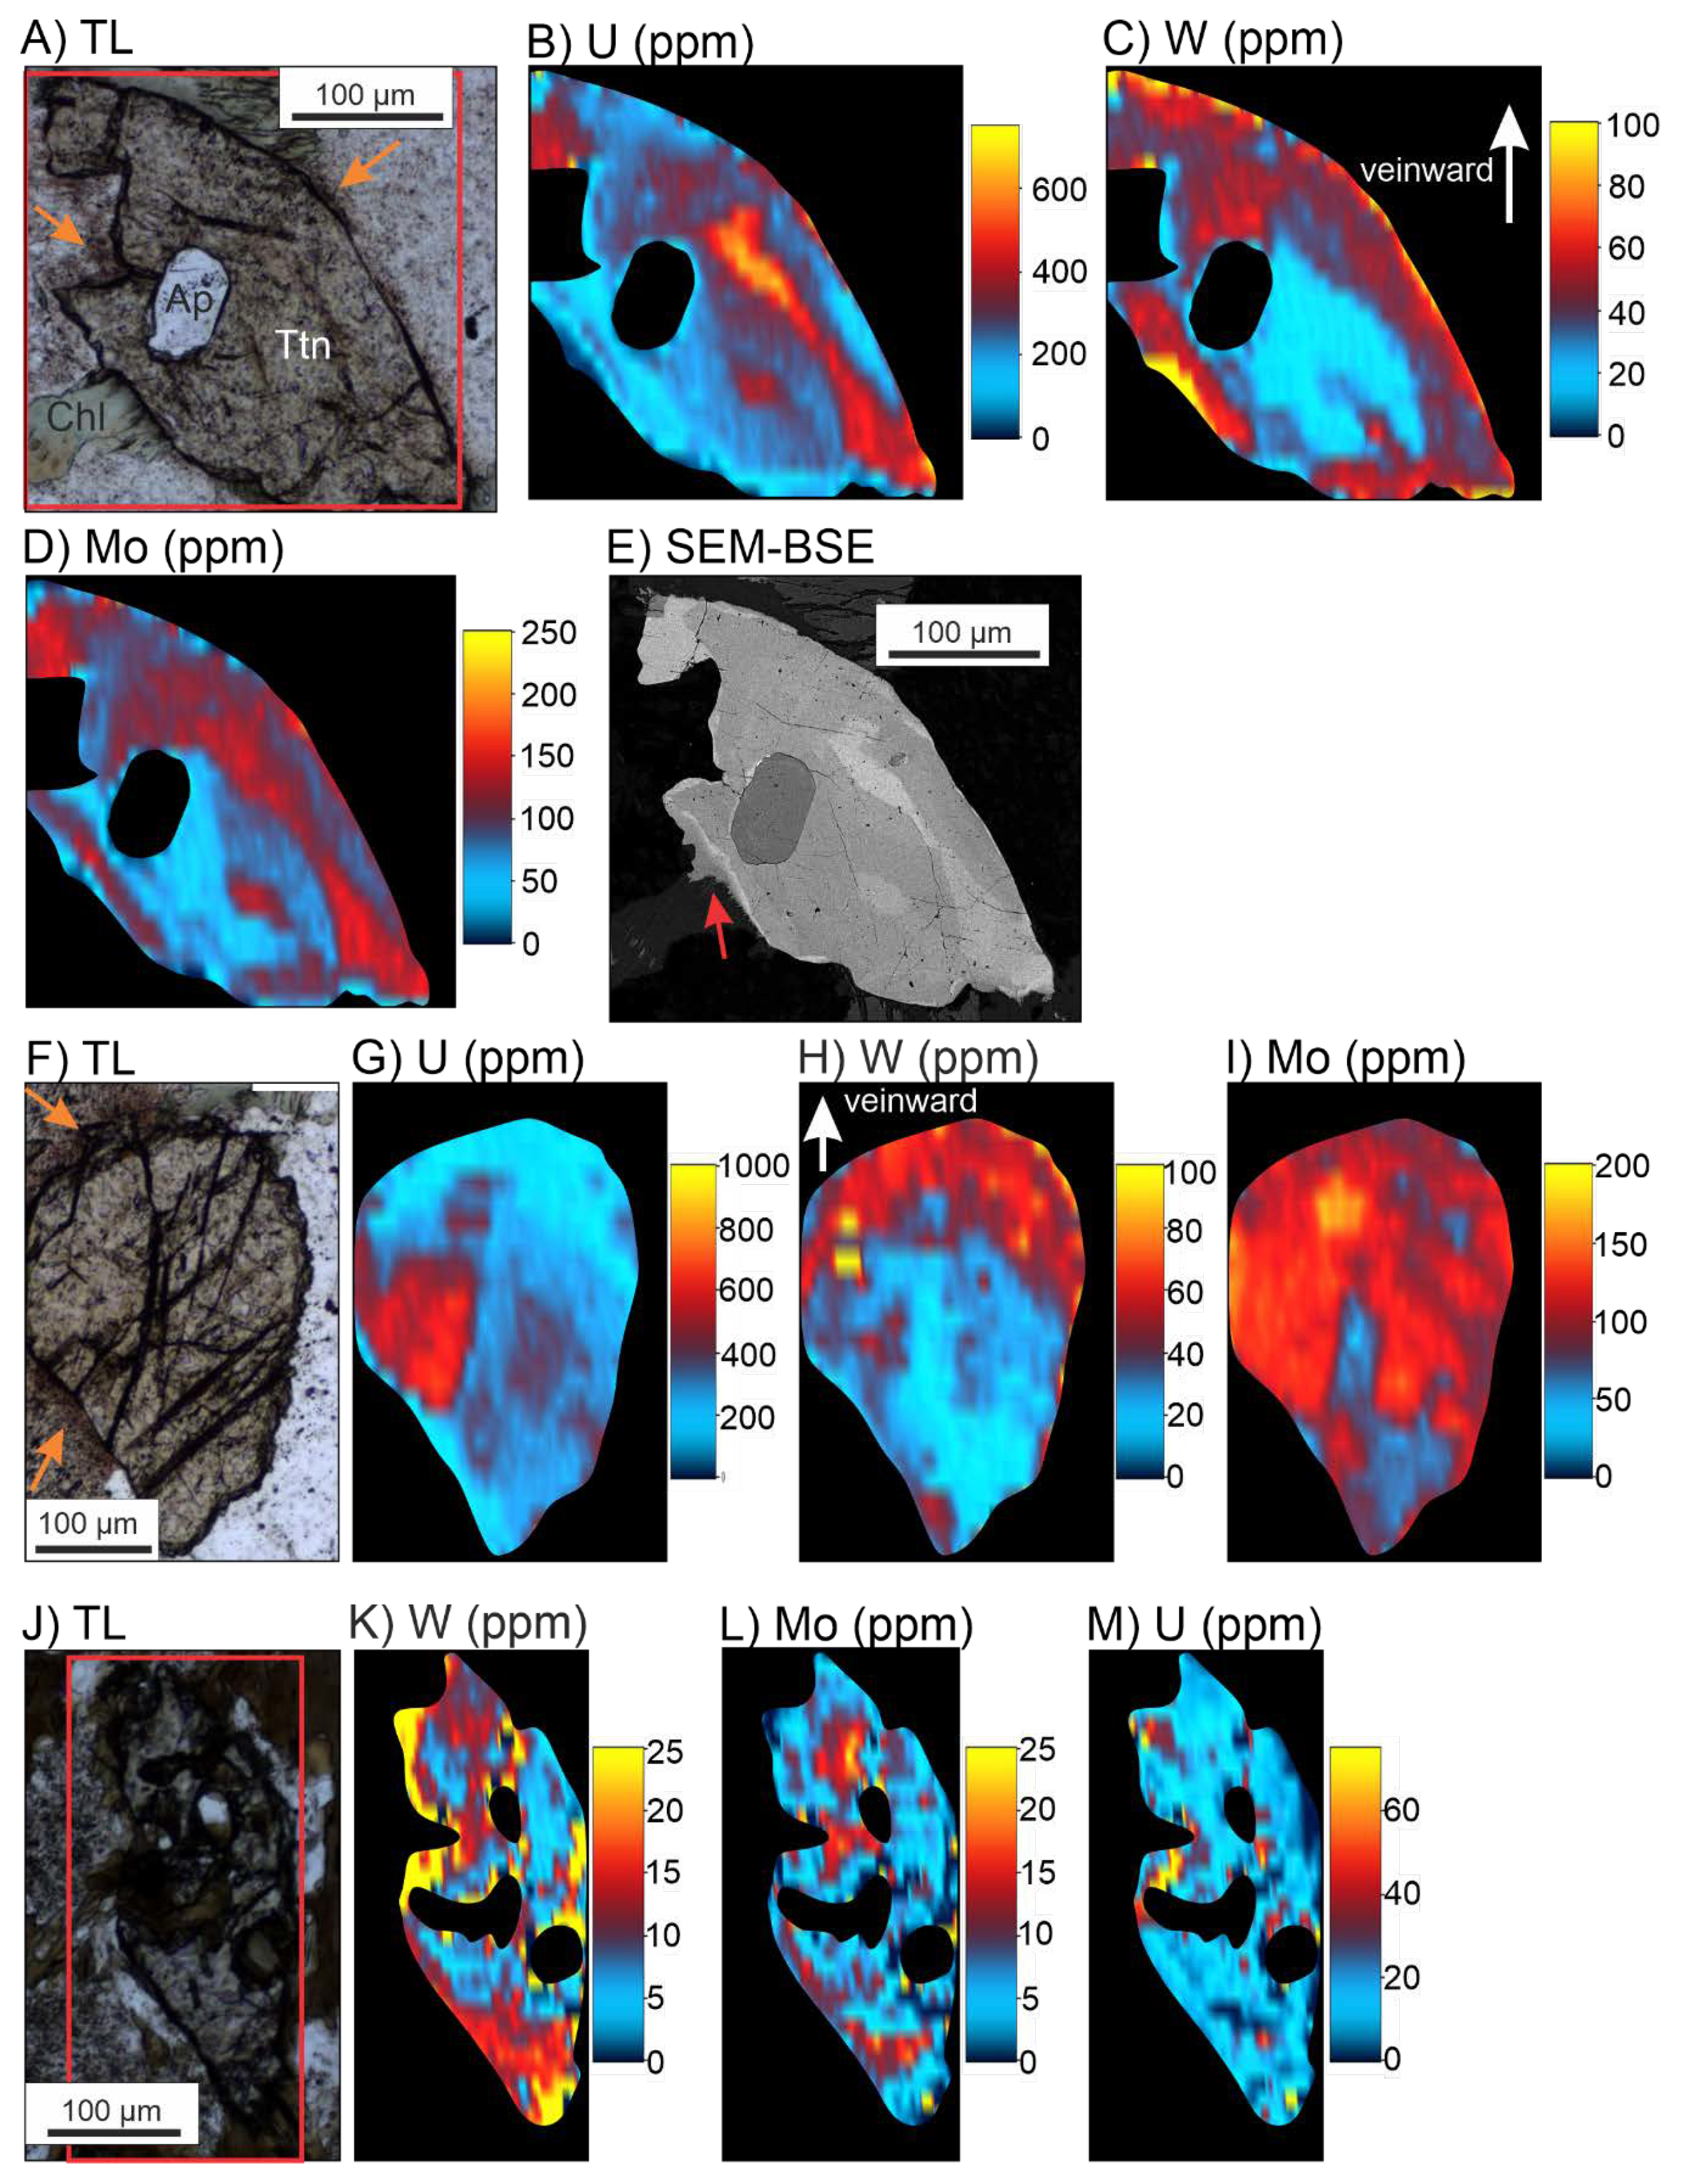
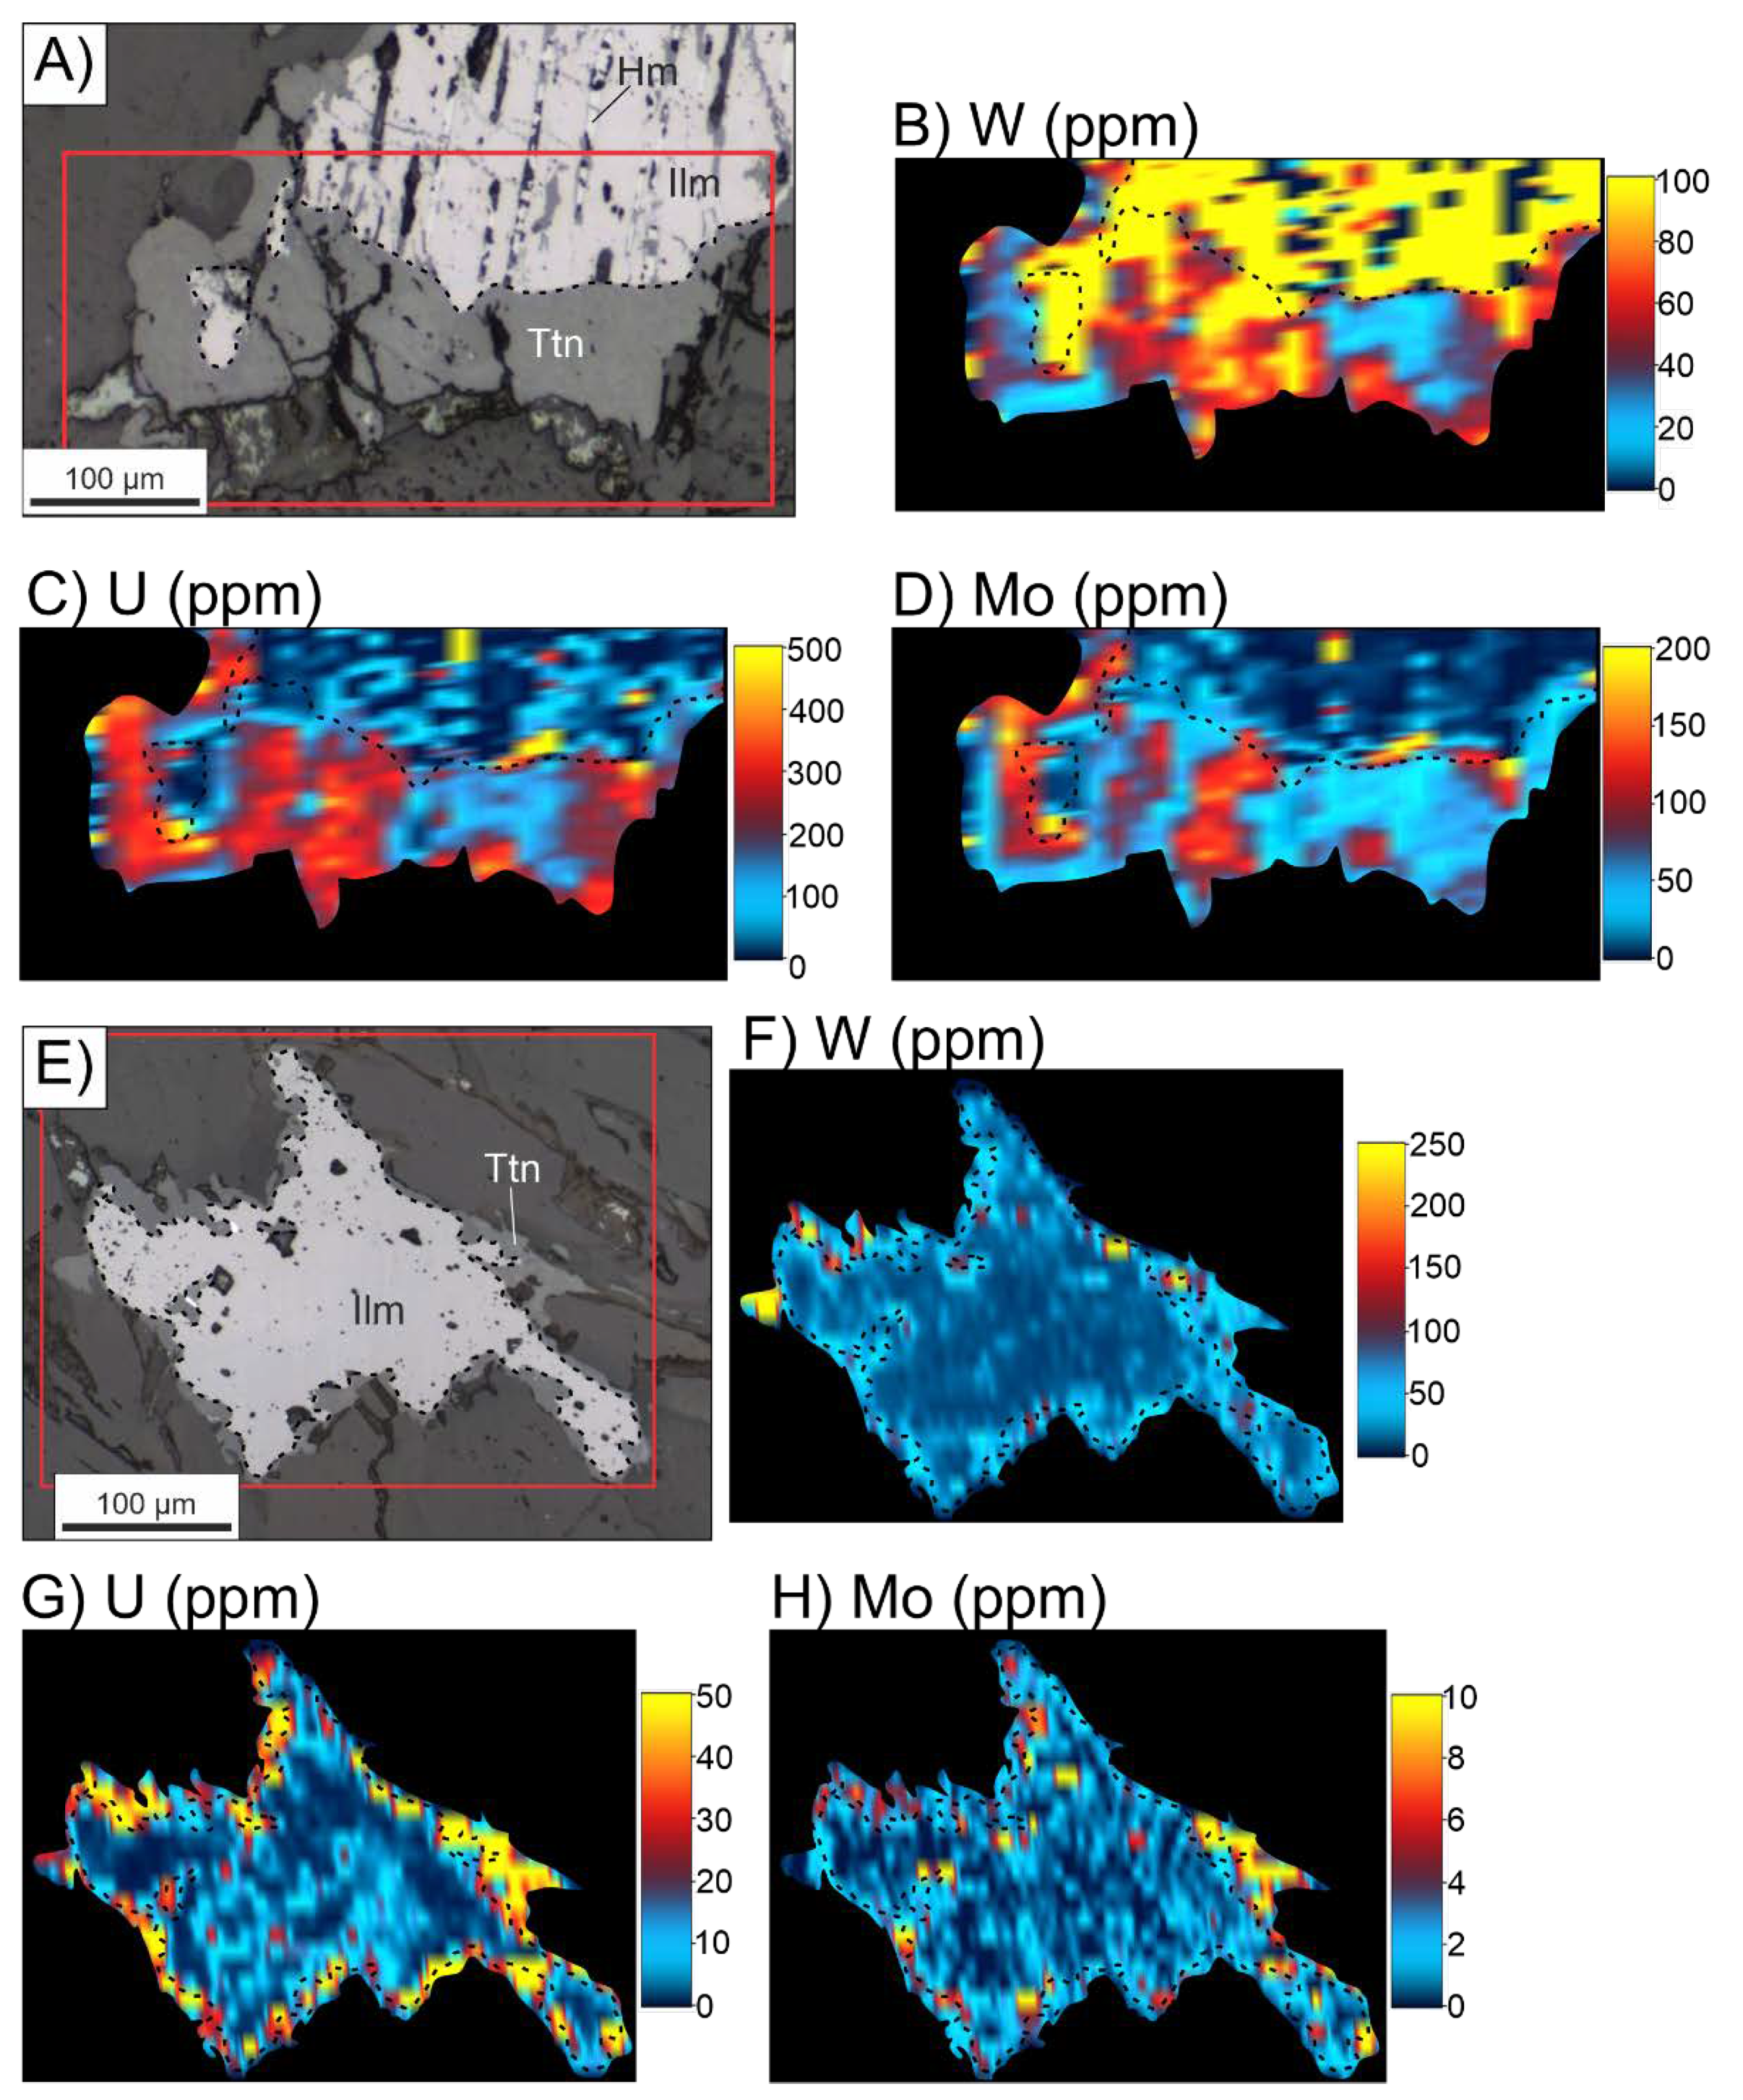
4.4. Mineral Element Maps
4.5. Whole Rock Geochemistry
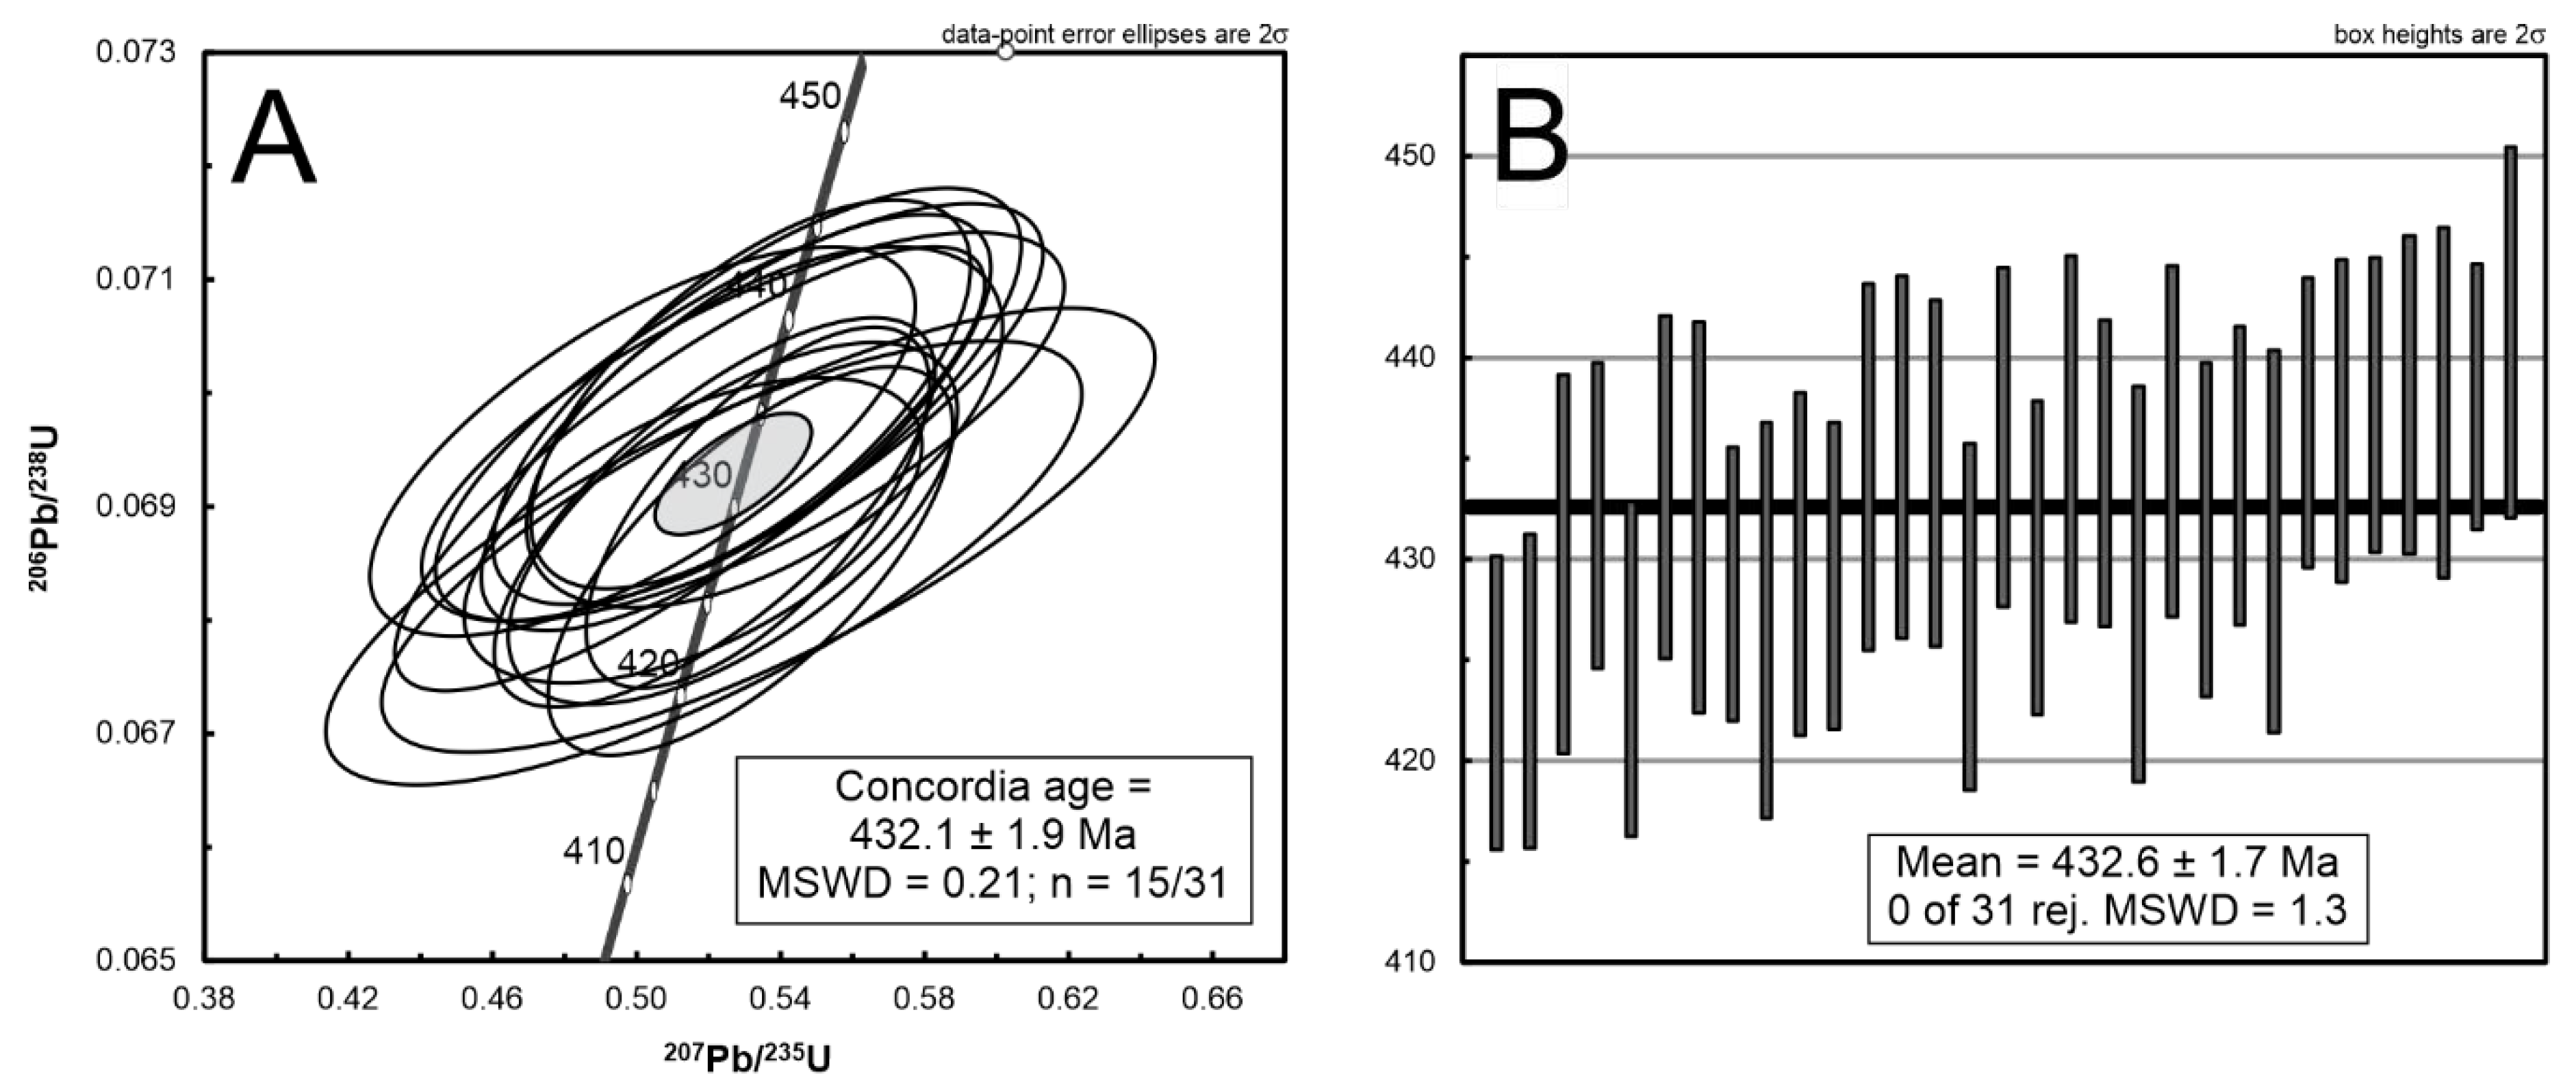
4.6. U-Pb Geochronology
5. Discussion
5.1. Compositional Zoning Resulting from Mineralization
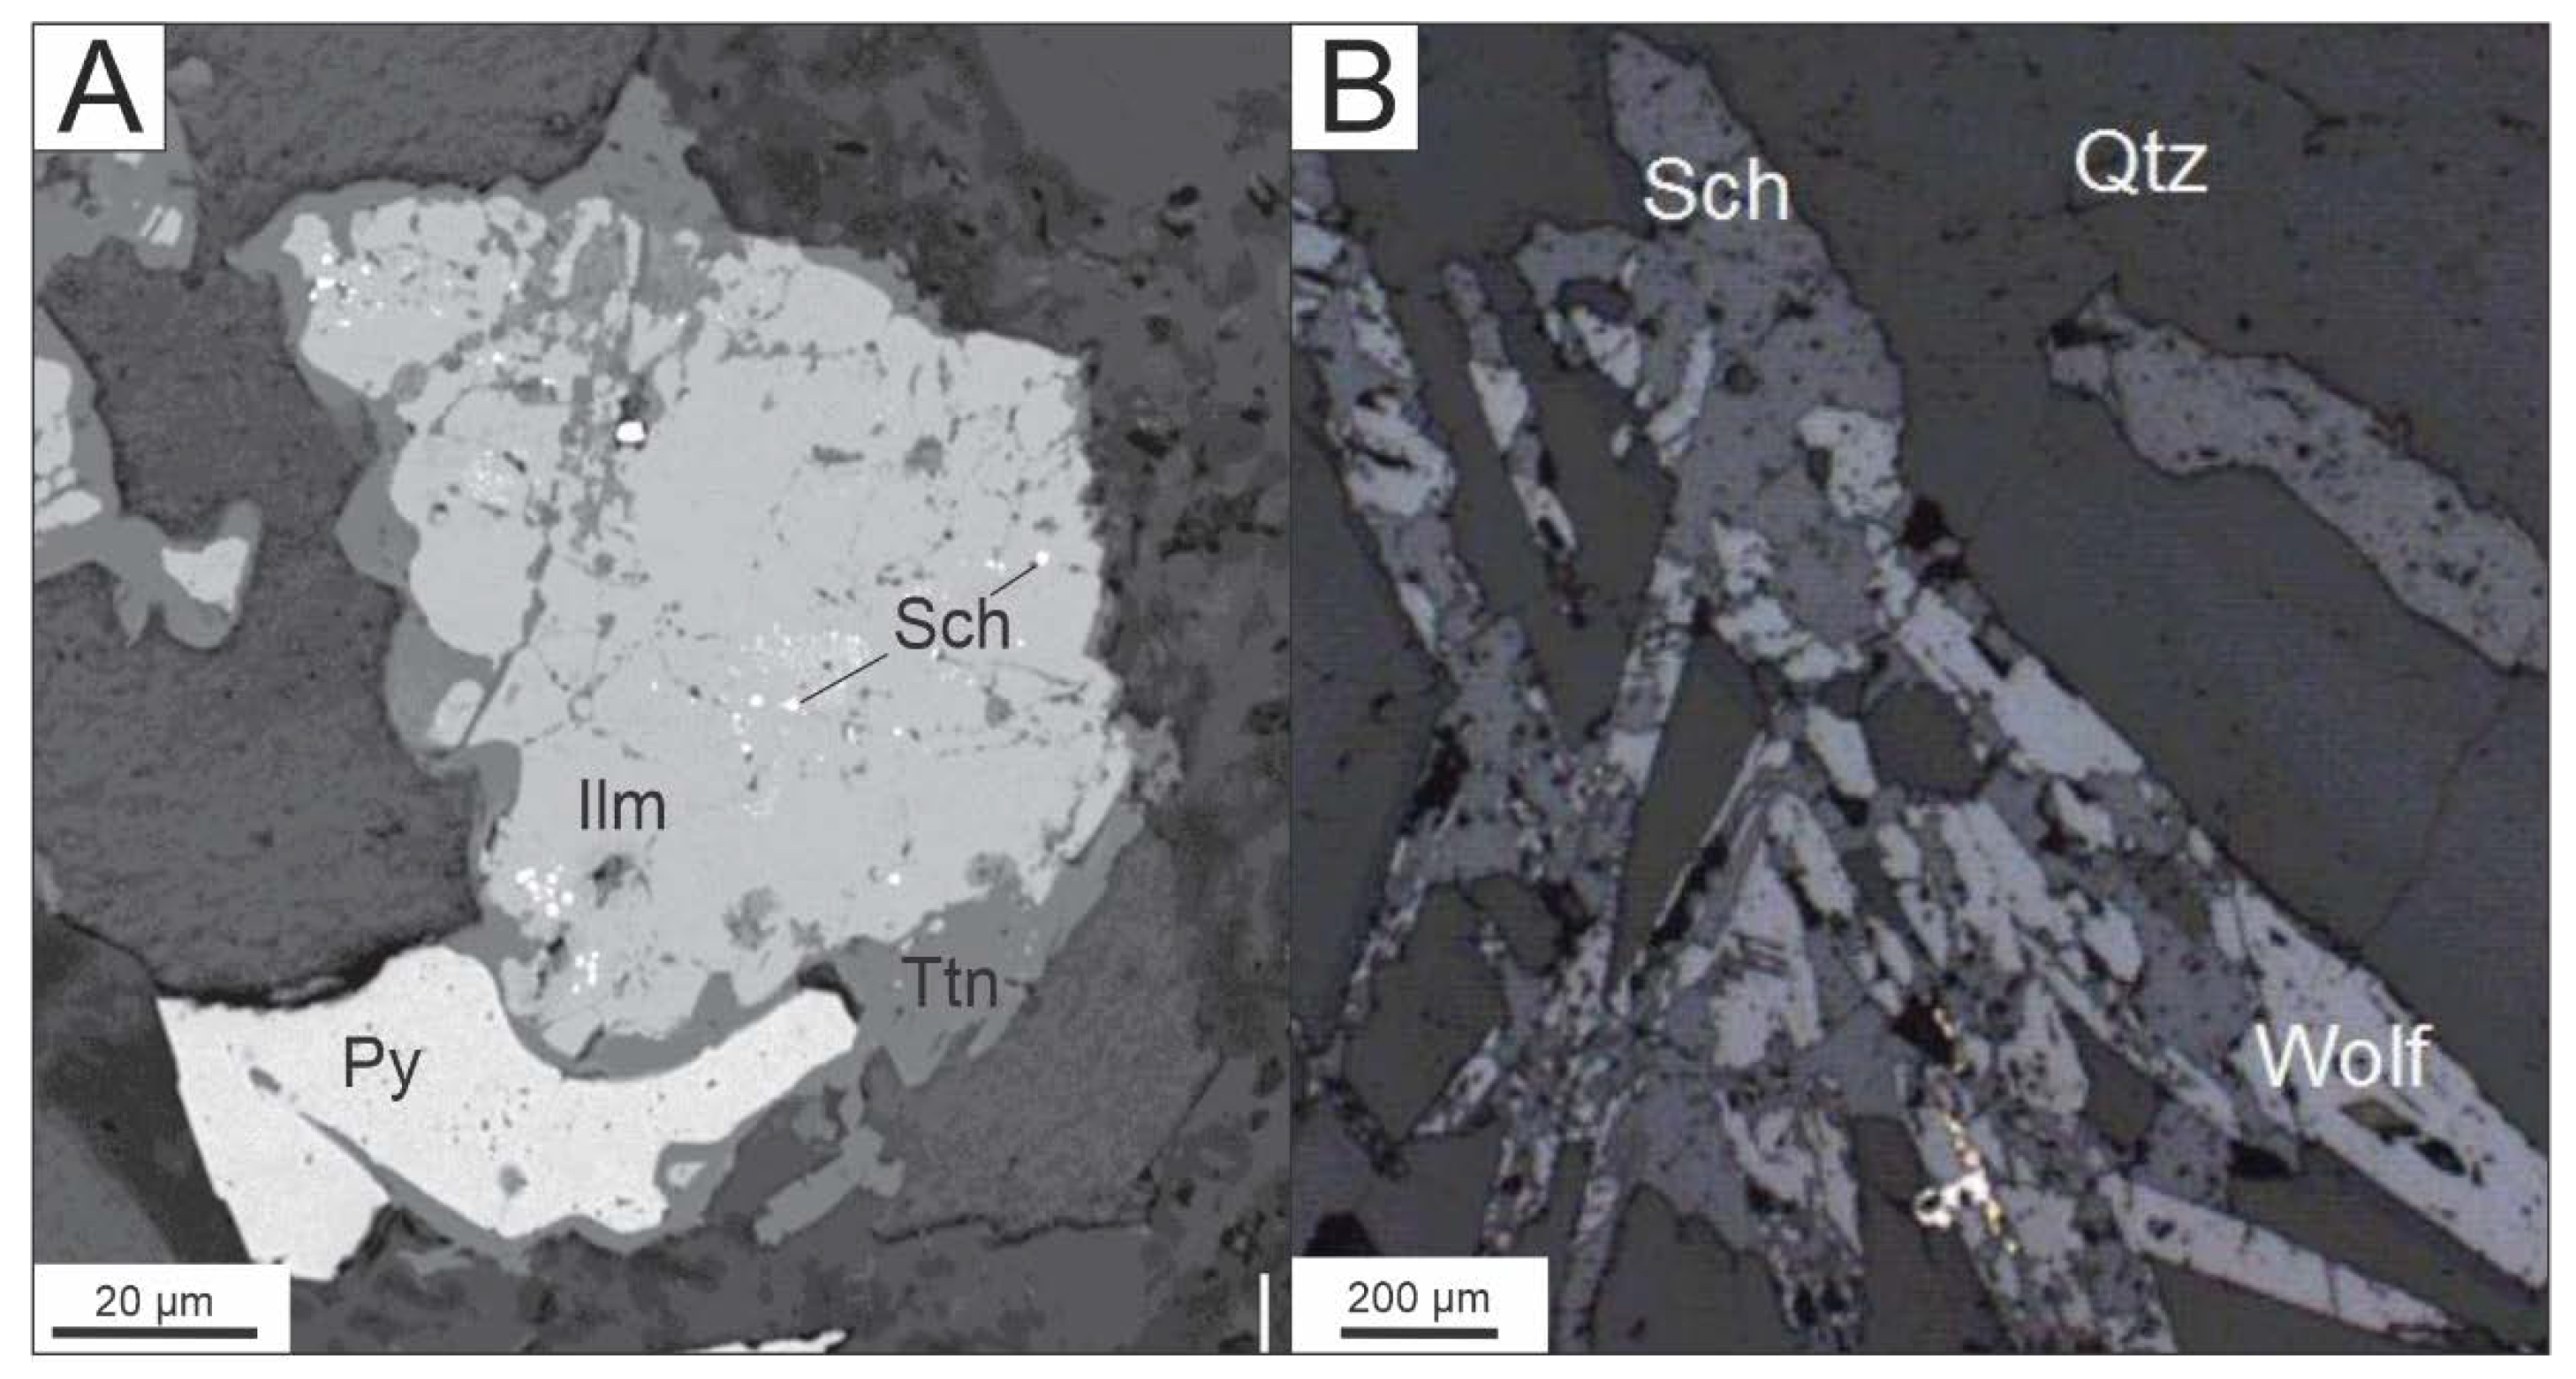
5.2. Scheelite Versus Wolframite Saturation
Biotite [K(Fe,Mg)3AlSi3O10(OH)2] + Scheelite [CaWO4] + Ilmenite [FeTiO3]
Titanite [CaTiSiO5] + Pyrite [Fe2S] + Chlorite [(Mg,Al,Fe)3(Si,Al)4O10(OH)2⋅(Mg,Al,Fe)3(OH)6] + K(OH)
6. Conclusions
- Compositional mapping at various scales (micro-XRF and LA ICP-MS) demonstrates that both magmatic and metasomatic titanite grains can, in the case of Sisson Brook, record signatures of mineralizing fluids. Magmatic titanite grains examined show inhomogeneous enrichment of both W and Mo with the highest enrichments occurring on the veinward side of the grain, and metasomatic titanites record both mineralized and non-mineralized fluids.
- The distribution of titaniferous phases in host rocks influences the distribution of W mineralization phases by exerting controls on Fe and Ca activities. Although petrologic observations indicate Ti and Ca phases are important for the distribution of W mineralization phases (i.e., scheelite and wolframite), preliminary bulk Ca and Ti concentrations do not appear to correlate with W, and therefore do not influence the grade of W mineralization based on the samples examined.
- Unaltered domains of magmatic titanite returned a U-Pb age of 432.1 ± 1.9 Ma for the Howard Peak Granodiorite. This age is approximately 10 Myr older than that of the Nashwaak Granite (419.2 ± 1.8 and 422.2 ± 1.7 Ma; U-Pb zircon [19]) and 54 Myr older than the age of molybdenite mineralization (378.5 ± 1.7 and 376.5 ± 1.6 Ma; Re-Os model ages [7]), indicating that the Sisson Brook area has undergone protracted magmatic and hydrothermal activity. Dating of the metasomatic titanite rims surrounding ilmenite and other metasomatic U-bearing phases could be done to refine the timing of W relative to Mo mineralization.
Supplementary Materials
Author Contributions
Funding
Acknowledgments
Conflicts of Interest
References
- Linnen, R.; Che, X. Evaluation of titanite as an indicator mineral for tungsten-skarn mineralization. In Yukon Exploration Geology 2009; MacFarlane, K.E., Weston, L.H., Blackburn, L.R., Eds.; Yukon Geological Survey: Whitehorse, YT, Canada, 2010; pp. 223–228. [Google Scholar]
- Li, J.D.; Li, X.F.; Xiao, R. In situ LA-ICP-MS U-Pb geochronology and trace element analysis of hydrothermal titanite from the Jiepai W-Cu deposit, South China: Implications for W mineralization. Can. Mineral. 2020, 58, 45–69. [Google Scholar] [CrossRef]
- Horie, K.; Hidaka, H.; Gauthier-Lafaye, F. Elemental distribution in apatite, titanite and zircon during hydrothermal alteration: Durability of immobilization mineral phases for actinides. Phys. Chem. Earth Parts A/B/C 2008, 33, 962–968. [Google Scholar] [CrossRef]
- Xie, L.; Wang, R.-C.; Chen, J.; Zhu, J.-C. Mineralogical evidence for magmatic and hydrothermal processes in the Qitianling oxidized tin-bearing granite (Hunan, South China): EMP and (MC)-LA-ICPMS investigations of three types of titanite. Chem. Geol. 2010, 276, 53–68. [Google Scholar] [CrossRef]
- Che, X.D.; Linnen, R.L.; Wang, R.C.; Groat, L.A.; Brand, A.A. Distribution of trace and rare earth elements in titanite from tungsten and molybdenum deposits in Yukon and British Columbia, Canada. Can. Mineral. 2013, 51, 415–438. [Google Scholar] [CrossRef]
- Frost, B.R.; Chamberlain, K.R.; Schumacher, J.C. Sphene (titanite): Phase relations and role as a geochronometer. Chem. Geol. 2001, 172, 131–148. [Google Scholar] [CrossRef]
- Zhang, W. Petrological and Metallogenic Studies of the Nashwaak Granite and Felsic Dykes Associated with the Sisson Book W-Mo-(Cu) Deposit, West-Central New Brunswick, Canada. Ph.D. Thesis, University of New Brunswick, Fredericton, NB, Canada, 2015. [Google Scholar]
- Carocci, E.; Marignac, C.; Cathelineau, M.; Truche, L.; Lecomte, A.; Pinto, F. Rutile from Panasqueira (Central Portugal): An excellent pathfinder for wolframite deposition. Minerals 2019, 9, 9. [Google Scholar] [CrossRef] [Green Version]
- Sun, J.; Yang, J.; Wu, F.; Xie, L.; Yang, Y.; Liu, Z.; Li, X. In situ U-Pb dating of titanite by LA-ICPMS. Chin. Sci. Bull. 2012, 57, 2506–2516. [Google Scholar] [CrossRef] [Green Version]
- Fu, Y.; Sun, X.; Zhou, H.; Lin, H.; Yang, T. In-situ LA–ICP–MS U–Pb geochronology and trace elements analysis of polygenetic titanite from the giant Beiya gold–polymetallic deposit in Yunnan Province, Southwest China. Ore Geol. Rev. 2016, 77, 43–56. [Google Scholar] [CrossRef]
- Bineli Betsi, T.; Lentz, D.R.; Mcfarlane, C. The Nucleus deposit: Superposed Au–Ag–Bi–Cu mineralization systems at Freegold Mountain, Yukon, Canada. Resour. Geol. 2016, 66, 419–454. [Google Scholar] [CrossRef]
- Sinclair, W.D. Porphyry deposits. In Mineral Deposits of Canada: A Synthesis of Major Deposit Types, District Metallogeny, the Evolution of Geological Provinces and Exploration Methods; Special Publication, no. 5; Goodfellow, W.D., Ed.; Geological Association of Canada, Mineral Deposits Division: St. John’s, NL, Canada, 2007; pp. 223–243. [Google Scholar]
- Kirkham, R.V.; Sinclair, W.D. Porphyry copper, gold, molybdenum, tungsten, tin, silver. In Geology of Canadian Mineral Deposit Types; Geology of Canada, no. 8; Eckstrand, O.R., Sinclair, W.D., Thorpe, R.I., Eds.; Geological Survey of Canada: Ottawa, ON, Canada, 1996; pp. 421–446. [Google Scholar]
- Sinclair, W.D. Vein-stockwork tin, tungsten. In Geology of Canadian Mineral Deposit Types; Geology of Canada, no. 8; Eckstrand, O.R., Sinclair, W.D., Thorpe, R.I., Eds.; Geological Survey of Canada: Ottawa, ON, Canada, 1996; pp. 409–420. [Google Scholar]
- Ruitenberg, A.A.; Fyffe, L.R. Characteristics and Tectonic Settings of Granitoid-Related Mineral Deposits in New Brunswick; Mineral Resources, Geoscience Report 91-1; New Brunswick Department of Natural Resources and Energy: Fredericton, NB, Canada, 1991.
- Brown, T.; Pitfield, P. Tungsten. In Critical Metals Handbook; John Wiley & Sons: Hoboken, NJ, USA, 2014; pp. 385–413. [Google Scholar]
- Stewart, H.J.; McLeod, M.J.; Thorne, K.G. Tungsten; Mineral Commodity Profile No 7; New Brunswick Department of Natural Resources, Lands, Minerals, and Petroleum Division: Fredericton, NB, Canada, 2011.
- Zhang, W.; Lentz, D.R.; Thorne, K.G.; McFarlane, C. Geochemical characteristics of biotite from felsic intrusive rocks around the Sisson Brook W–Mo–Cu deposit, west-central New Brunswick: An indicator of halogen and oxygen fugacity of magmatic systems. Ore Geol. Rev. 2016, 77, 82–96. [Google Scholar] [CrossRef] [Green Version]
- Zhang, W.; Lentz, D.R.; Thorne, K.G.; Massawe, R.J.R. Late Silurian-Early Devonian slab break-off beneath the Canadian Appalachians: Insights from the Nashwaak Granite, west-central New Brunswick, Canada. Lithos 2020, 358, 105393. [Google Scholar] [CrossRef]
- Rennie, D.W. Technical Report on the Sisson Project, New Brunswick, Canada; Prepared for Northcliff Resources Ltd.: Vancouver, BC, Canada, 2012; p. 161. [Google Scholar]
- Nast, H.J. The Geology and Petrochemistry of the Sisson Brook W-Cu-Mo Deposit, New Brunswick. Master’s Thesis, McGill University, Montreal, QC, Canada, 1985. [Google Scholar]
- Nast, H.J.; Williams-Jones, A.E. The role of water-rock interaction and fluid evolution in forming the porphyry-related Sisson Brook W-Cu-Mo deposit, New Brunswick. Econ. Geol. 1991, 86, 302–317. [Google Scholar] [CrossRef]
- Zhang, W.; Lentz, D.R.; Thorne, K.G. Petrogenesis of the Nashwaak Granite, West-Central New Brunswick, Canada: Evidence from Trace Elements, O and Hf Isotopes of Zircon, and O Isotopes of Quartz. Minerals 2020, 10, 614. [Google Scholar] [CrossRef]
- Bustard, A.L.; Zhang, W.; McFarlane, C.R.M.; Lentz, D.R. Tungsten mineralization processes at the Sisson Brook W-Mo-Cu deposit, Central New Brunswick: The role of formation of titaniferous phases at reaction fronts. Acta Geol. Sin. Engl. Ed. 2013, 87, 672–675. [Google Scholar] [CrossRef]
- Fyffe, L.R.; Thorne, K.G.; Dunning, G.R.; Martin, D.A. U-Pb geochronology of the Sisson Brook Granite Porphyry, York County, west-central New Brunswick. In Geological Investigations in New Brunswick for 2007; Minerals, Policy and Planning Division; Martin, G.L., Ed.; New Brunswick Department of Natural Resources: Fredericton, NB, Canada, 2007; pp. 35–54. [Google Scholar]
- Whalen, J.B.; Fyffe, L.R.; Longstaffe, F.J.; Jenner, G.A. The position and nature of the Gander–Avalon boundary, southern New Brunswick, based on geochemical and isotopic data from granitoid rocks. Can. J. Earth Sci. 1996, 33, 129–139. [Google Scholar] [CrossRef]
- Fyffe, L.; Johnson, S.; van Staal, C. A review of Proterozoic to Early Paleozoic lithotectonic terranes in the northeastern Appalachian orogen of New Brunswick, Canada, and their tectonic evolution during Penobscot, Taconic, Salinic, and Acadian orogenesis. Atl. Geol. 2011, 47, 211–248. [Google Scholar] [CrossRef] [Green Version]
- Tharalson, E.R.; Monecke, T.; Reynolds, T.J.; Zeeck, L.; Pfaff, K.; Kelly, N.M. The distribution of precious metals in high-grade banded quartz veins from low-sulfidation epithermal deposits: Constraints from µXRF mapping. Minerals 2019, 9, 740. [Google Scholar] [CrossRef] [Green Version]
- Flude, S.; Haschke, M.; Storey, M.; Harvey, J. Application of benchtop micro-XRF to geological materials. Mineral. Mag. 2017, 81, 923–948. [Google Scholar] [CrossRef] [Green Version]
- Schindelin, J.; Arganda-Carreras, I.; Frise, E.; Kaynig, V.; Longair, M.; Pietzsch, T.; Preibisch, S.; Rueden, C.; Saalfeld, S.; Schmid, B. Fiji: An open-source platform for biological-image analysis. Nat. Methods 2012, 9, 676–682. [Google Scholar] [CrossRef] [Green Version]
- Preibisch, S.; Saalfeld, S.; Tomancak, P. Globally optimal stitching of tiled 3D microscopic image acquisitions. Bioinformatics 2009, 25, 1463–1465. [Google Scholar] [CrossRef]
- Petruk, W. Image analysis of minerals. In Short Course on Image Analysis Applied to Mineral and Earth Sciences; Petruk, W., Ed.; Mineralogical Association of Canada: Quebec City, QC, Canada, 1989; pp. 6–18. [Google Scholar]
- Ulrich, T.; Kamber, B.S.; Jugo, P.J.; Tinkham, D.K. Imaging element-distribution patterns in minerals by laser ablation-inductively coupled plasma-mass spectronomy (LA–ICP–MS). Can. Mineral. 2009, 47, 1001–1012. [Google Scholar] [CrossRef]
- Jenner, F.E.; Arevalo, R.D., Jr. Major and trace element analysis of natural and experimental igneous systems using LA–ICP–MS. Elements 2016, 12, 311–316. [Google Scholar] [CrossRef]
- Paton, C.; Hellstrom, J.; Paul, B.; Woodhead, J.; Hergt, J. Iolite: Freeware for the visualisation and processing of mass spectrometric data. J. Anal. At. Spectrom. 2011, 26, 2508–2518. [Google Scholar] [CrossRef]
- McFarlane, C.R.M.; Luo, Y. U-Pb Geochronology Using 193 nm Excimer LA-ICP-MS Optimized for In-Situ Accessory Mineral Dating in Thin Sections. Geosci. Can. 2012, 39, 158–172. [Google Scholar]
- Faye, G.H.; Sutarno, R. Certified compositional reference materials for the earth sciences. Can. Mineral. 1976, 14, 164–171. [Google Scholar]
- Harley, S.L.; Kelly, N.M. Zircon tiny but timely. Elements 2007, 3, 13–18. [Google Scholar] [CrossRef]
- Rubin, J.N.; Henry, C.D.; Price, J.G. The mobility of zirconium and other “immobile” elements during hydrothermal alteration. Chem. Geol. 1993, 110, 29–47. [Google Scholar] [CrossRef]
- Wang, X.; Chen, J.; Ren, M. Hydrothermal zircon geochronology: Age constraint on Nanling Range tungsten mineralization (Southeast China). Ore Geol. Rev. 2016, 74, 63–75. [Google Scholar] [CrossRef]
- Heaman, L.M. The application of U–Pb geochronology to mafic, ultramafic and alkaline rocks: An evaluation of three mineral standards. Chem. Geol. 2009, 261, 43–52. [Google Scholar] [CrossRef]
- Petrus, J.A.; Kamber, B.S. VizualAge: A novel approach to laser ablation ICP-MS U-Pb geochronology data reduction. Geostand. Geoanal. Res. 2012, 36, 247–270. [Google Scholar] [CrossRef]
- Ludwig, K.R. Isoplot 3.75: A Geochronological Toolkit for Microsoft Excel; Special Publication (Vol. 5); Berkeley Geochronology Center: Berkeley, CA, USA, 2012. [Google Scholar]
- Reimann, C.; Filzmoser, P.; Garrett, R.; Dutter, R. Statistical Data Analysis Explained: Applied Environmental Statistics with R; John Wiley & Sons: Hoboken, NJ, USA, 2011. [Google Scholar]
- Lentz, C.; Thorne, K.; McFarlane, C.R.M.; Archibald, D.A. U-Pb, Ar-Ar, and Re-Os geochronological constraints on multiple magmatic–hydrothermal episodes at the Lake George Mine, Central New Brunswick. Minerals 2020, 10, 566. [Google Scholar] [CrossRef]
- Deng, X.-D.; Li, J.-W.; Zhou, M.-F.; Zhao, X.-F.; Yan, D.-R. In-situ LA-ICPMS trace elements and U–Pb analysis of titanite from the Mesozoic Ruanjiawan W–Cu–Mo skarn deposit, Daye district, China. Ore Geol. Rev. 2015, 65, 990–1004. [Google Scholar] [CrossRef]
- Wood, S.A.; Samson, I.M. The hydrothermal geochemistry of tungsten in granitoid environments: I. Relative solubilities of ferberite and scheelite as a function of T, P, pH, and mNaCl. Econ. Geol. 2000, 95, 143–182. [Google Scholar] [CrossRef] [Green Version]
- Lecumberri-Sanchez, P.; Vieira, R.; Heinrich, C.A.; Pinto, F.; Wӓlle, M. Fluid-rock interaction is decisive for the formation of tungsten deposits. Geology 2017, 45, 579–582. [Google Scholar] [CrossRef]
- Monnier, L.; Salvi, S.; Melleton, J.; Bailly, L.; Béziat, D.; de Parseval, P.; Gouy, S.; Lach, P. Multiple Generations of Wolframite Mineralization in the Echassieres District (Massif Central, France). Minerals 2019, 9, 637. [Google Scholar] [CrossRef] [Green Version]
- Monnier, L.; Salvi, S.; Jourdan, V.; Sall, S.; Bailly, L.; Melleton, J.; Béziat, D. Contrasting fluid behavior during two styles of greisen alteration leading to distinct wolframite mineralizations: The Echassières district (Massif Central, France). Ore Geol. Rev. 2020, 124, 103648. [Google Scholar] [CrossRef]
- Van Baalen, M.R. Titanium mobility in metamorphic systems: A review. Chem. Geol. 1993, 110, 233–249. [Google Scholar] [CrossRef]
- Rice, C.M.; Darke, K.E.; Still, J.W.; Lachowski, E.E. Tungsten-bearing rutile from the Kori Kollo gold mine, Bolivia. Mineral. Mag. 1998, 62, 421–429. [Google Scholar] [CrossRef]
- Yuan, F.; Liu, J.; Carranza, E.J.M.; Zhai, D.; Wang, Y.; Zhang, S.; Sha, Y.; Liu, G.; Wu, J. The Guangshigou uranium deposit, northern Qinling Orogen, China: A product of assimilation-fractional crystallization of pegmatitic magma. Ore Geol. Rev. 2018, 99, 17–41. [Google Scholar] [CrossRef]


| Sample | Host Rock Type | Scale (Pixels/μm2) | Area (μm2) | Total Sch Area (μm2) | % Sch by Area | WO3 % (% Sch × 0.8) | Total Ilm Area (μm2) * | % Ilm by Area | Ilm/Sch |
|---|---|---|---|---|---|---|---|---|---|
| SB0830-240.6m | gabbro | 1.379 | 11,266,947 | 46,259 | 0.41 | 0.33 | 7841 | 0.07 | 0.17 |
| SB0834A-118.6 | gabbro | 0.985 | 11,953,933 | 141 | 0.001 | 0.001 | - | - | - |
| SB0834A-84.6m | gabbro | 0.788 | 38,557,124 | 295,668 | 0.77 | 0.61 | 2153 | 0.01 | 0.01 |
| SB0845-80.4m | mafic tuff | 1.379 | 15,411,563 | 54,301 | 0.35 | 0.28 | 3260 | 0.02 | 0.06 |
| SB0917-67.7m | felsic tuff | 2.956 | 3,128,848 | 42,692 | 1.36 | 1.09 | - | - | - |
| SB0812-12.8mA | diabase | 1.379 | 8,716,779 | 31,519 | 0.36 | 0.29 | - | - | - |
| SB0812-12.8mB | diabase | 1.379 | 7,568,149 | 12,013 | 0.16 | 0.13 | - | - | - |
| SB0812-12.8mC | diabase | 1.379 | 3,614,850 | 2558 | 0.07 | 0.06 | - | - | - |
| Comments | Used for Age Calculation | U (ppm) * | Th (ppm) * | 207Pb 235U | 2σ | 206Pb 238U | 2σ | 206Pb 238U Age | 2σ |
|---|---|---|---|---|---|---|---|---|---|
| 63.7 m_ttn3c | - | 273 | 538 | 0.514 | 0.057 | 0.0678 | 0.0012 | 422.9 | 7.3 |
| 63.7 m_ttn2r | - | 281 | 612 | 0.452 | 0.052 | 0.0679 | 0.0013 | 423.5 | 7.8 |
| 63.7 m_ttn8r-2 | - | 226 | 726 | 0.460 | 0.059 | 0.0689 | 0.0015 | 429.8 | 9.4 |
| 63.7 m_tt5c | - | 277 | 652 | 0.479 | 0.056 | 0.0694 | 0.0013 | 432.2 | 7.6 |
| 63.7 m_ttn1r | - | 261 | 729 | 0.499 | 0.060 | 0.0681 | 0.0014 | 424.6 | 8.3 |
| 63.7 m_ttn6r-5 | yes | 334 | 935 | 0.502 | 0.062 | 0.0696 | 0.0014 | 433.6 | 8.5 |
| 63.7 m_ttn4r-3 | yes | 233 | 605 | 0.515 | 0.067 | 0.0693 | 0.0016 | 432.1 | 9.7 |
| 63.7 m_ttn5r-2 | yes | 292 | 1049 | 0.516 | 0.052 | 0.0688 | 0.0011 | 428.8 | 6.8 |
| 63.7 m_ttn4r | yes | 164 | 437 | 0.519 | 0.086 | 0.0685 | 0.0016 | 427.0 | 9.8 |
| 63.7 m_ttn6r-3 | yes | 362 | 913 | 0.522 | 0.050 | 0.0690 | 0.0014 | 429.8 | 8.5 |
| 63.7 m_ttn2c | yes | 284 | 742 | 0.527 | 0.051 | 0.0689 | 0.0013 | 429.2 | 7.6 |
| 63.7 m_ttn3r | yes | 248 | 686 | 0.528 | 0.058 | 0.0697 | 0.0015 | 434.6 | 9.1 |
| 63.7 m_ttn4c | yes | 249 | 884 | 0.529 | 0.069 | 0.0698 | 0.0015 | 435.1 | 9.0 |
| 63.7 m_ttn5r | yes | 240 | 623 | 0.530 | 0.073 | 0.0697 | 0.0014 | 434.3 | 8.6 |
| 63.7 m_ttn6c | yes | 342 | 834 | 0.532 | 0.046 | 0.0685 | 0.0014 | 427.2 | 8.6 |
| 63.7 mttn1c | yes | 295 | 836 | 0.532 | 0.050 | 0.0700 | 0.0014 | 436.1 | 8.4 |
| 63.7 m_ttn11r | yes | 392 | 843 | 0.534 | 0.039 | 0.0690 | 0.0013 | 430.1 | 7.8 |
| 63.7 m_ttn9r-2 | yes | 261 | 722 | 0.534 | 0.060 | 0.0700 | 0.0015 | 436.0 | 9.1 |
| 63.7 m_ttn7r | yes | 256 | 800 | 0.536 | 0.054 | 0.0697 | 0.0013 | 434.3 | 7.6 |
| 63.6 m_ttn6r | yes | 189 | 525 | 0.537 | 0.088 | 0.0688 | 0.0016 | 428.8 | 9.8 |
| 63.7 m_ttn8c | - | 206 | 438 | 0.539 | 0.068 | 0.0700 | 0.0015 | 435.9 | 8.7 |
| 63.7 m_ttn6r-2 | - | 313 | 1193 | 0.540 | 0.052 | 0.0692 | 0.0014 | 431.5 | 8.3 |
| 63.7 m_ttn10c | - | 257 | 555 | 0.569 | 0.051 | 0.0697 | 0.0012 | 434.2 | 7.4 |
| 63.7 m_ttn8r-1 | - | 202 | 426 | 0.604 | 0.070 | 0.0691 | 0.0016 | 430.9 | 9.5 |
| 63.7 m_ttn11r-2 | - | 274 | 680 | 0.532 | 0.049 | 0.0701 | 0.0012 | 436.8 | 7.2 |
| 63.7 m_ttn4r-2 | - | 306 | 886 | 0.540 | 0.049 | 0.0701 | 0.0013 | 436.9 | 8.0 |
| 63.7 m_ttn11r-3 | - | 251 | 593 | 0.533 | 0.056 | 0.0703 | 0.0012 | 437.7 | 7.3 |
| 63.7 m_ttn9r | - | 342 | 853 | 0.541 | 0.046 | 0.0703 | 0.0013 | 438.2 | 7.9 |
| 63.7 m_ttn6r-4 | - | 274 | 534 | 0.534 | 0.054 | 0.0703 | 0.0014 | 437.8 | 8.7 |
| 63.7 m_ttn7c | - | 325 | 707 | 0.598 | 0.052 | 0.0703 | 0.0011 | 438.1 | 6.6 |
| 63.7 m_ttn7r-3 | - | 253 | 569 | 0.542 | 0.055 | 0.0709 | 0.0015 | 441.3 | 9.2 |
© 2020 by the authors. Licensee MDPI, Basel, Switzerland. This article is an open access article distributed under the terms and conditions of the Creative Commons Attribution (CC BY) license (http://creativecommons.org/licenses/by/4.0/).
Share and Cite
Bustard, A.L.; Zhang, W.; Lentz, D.R.; McFarlane, C.R.M. Influence of Titaniferous Phases on Tungsten Mineralizing Processes at the Giant Sisson Brook W-Mo Deposit, New Brunswick, Canada: Mineral-Chemical and Geochronological Assessment. Minerals 2020, 10, 637. https://doi.org/10.3390/min10070637
Bustard AL, Zhang W, Lentz DR, McFarlane CRM. Influence of Titaniferous Phases on Tungsten Mineralizing Processes at the Giant Sisson Brook W-Mo Deposit, New Brunswick, Canada: Mineral-Chemical and Geochronological Assessment. Minerals. 2020; 10(7):637. https://doi.org/10.3390/min10070637
Chicago/Turabian StyleBustard, Aaron L., Wei Zhang, David R. Lentz, and Christopher R. M. McFarlane. 2020. "Influence of Titaniferous Phases on Tungsten Mineralizing Processes at the Giant Sisson Brook W-Mo Deposit, New Brunswick, Canada: Mineral-Chemical and Geochronological Assessment" Minerals 10, no. 7: 637. https://doi.org/10.3390/min10070637