Article

Simultaneous Quantification of Forsterite Content and Minor–Trace Elements in Olivine by LA–ICP–MS and Geological Applications in Emeishan Large Igneous Province

1
State Key Laboratory of Lithospheric Evolution, Institute of Geology and Geophysics, Chinese Academy of Sciences, Beijing 100029, China
2
Innovation Academy for Earth Science, Chinese Academy of Sciences, Beijing 100029, China
*
Author to whom correspondence should be addressed.
Minerals 2020, 10(7), 634; https://doi.org/10.3390/min10070634
Submission received: 9 June 2020 / Revised: 13 July 2020 / Accepted: 14 July 2020 / Published: 17 July 2020
(This article belongs to the Special Issue Analytical Tools to Constrain the Origin of Minerals)

Abstract

:
Olivine forsterite contents [Fo = 100 × Mg/(Mg + Fe) in mol%] and minor–trace element concentrations can aid our understanding of the Earth’s mantle. Traditionally, these data are obtained by electron probe microanalysis for Fo contents and minor elements, and then by laser ablation–inductively coupled plasma–mass spectrometry (LA–ICP–MS) for trace elements. In this study, we demonstrate that LA–ICP–MS, with a simplified 100% quantification approach, allows the calculation of Fo contents simultaneously with minor–trace elements. The approach proceeds as follows: (1) calculation of Fo contents from measured Fe/Mg ratios; (2) according to the olivine stoichiometric formula [(Mg, Fe)2SiO4] and known Fo contents, contents of Mg, Fe and Si can be computed, which are used as internal standards for minor–trace element quantification. The Fo content of the MongOLSh 11-2 olivine reference material is 89.55 ± 0.15 (2 s; N = 120), which agrees with the recommended values of 89.53 ± 0.05 (2 s). For minor–trace elements, the results matched well with the recommended values, apart from P and Zn data. This technique was applied to olivine phenocrysts in the Lijiang picrites from the Emeishan large igneous province. The olivine compositions suggest that the Lijiang picrites have a peridotitic mantle source.

1. Introduction

Olivine is the most abundant mineral in the Earth’s upper mantle; it is a common mineral in many mafic rocks and mantle peridotites, and also occurs in diamonds [1]. Thus, it has a special significance in our understanding of mantle geodynamics and melting processes [2,3]. Olivine has a simple major element composition consisting of MgO, FeO and SiO2, with a molecular formula of (Mg, Fe)2SiO4. These three oxides commonly comprise > 99% of the olivine mass. The forsterite (Fo) content, as expressed by the molar ratio 100 × Mg/(Mg + Fe), is an important compositional indicator, and is widely used to identify primary mantle-derived melts, assess the degree of evolution experienced by magmas [2,3,4], and estimate magma crystallization and mantle potential temperatures [5,6]. Despite its simple major element composition, olivine contains a number of petrogenetically significant minor–trace elements [1], such as Ni, Mn, Ca, Al, Sc, Cr, Co, Zn, V and Y. The mass fraction of these elements varies by several orders of magnitude, from a few ng/g to several thousand μg/g. Olivine minor–trace element data have been increasingly used as a tool to understand mantle lithologies and melting processes [1,2,3,6,7,8,9], track magma evolution processes [10,11], and estimate oxygen fugacities and magma temperatures [12,13,14,15,16].
Electron probe microanalysis (EPMA) in combination with laser ablation–inductively coupled plasma–mass spectrometry (LA–ICP–MS) has been traditionally used to acquire such analytical data for olivine [17]. Commonly, minor elements (e.g., Ni, Mn and Cr) along with the major elements (Si, Mg and Fe) are measured by EPMA [7], and then other trace elements (usually < 200 μg/g; e.g., Sc, Zn and Y) are determined by LA–ICP–MS [18,19,20]. However, this combined technique is time-consuming and requires a strict match of the analyzed locations. In addition, EPMA has a spatial resolution of 1–5 µm, whereas LA–ICP–MS has a spatial resolution of 15–100 µm. This mismatch in sampling volume can also lead to a bias in the analytical data, particularly for olivine that shows diffusion profiles. To avoid this issue, a high-precision (HP) EPMA technique was developed by Sobolev et al. [2,3], and further modified by Batanova et al. [21] and Su et al. [22]. This technique allows the analysis of a range of trace elements (e.g., Ni, Mn, Ca, Al, Cr, Na, P, Zn and Ti) with a limit of detection (LODs) of tens of μg/g. Advances in HP-EPMA have been achieved by using a high electron beam current (ca. 900 nA), increased accelerating voltage (ca. 25 kV) and extended counting times (ca. 15 min per analysis) [2,3,21,22,23,24]. However, this technique is time-consuming (>15 min per spot analysis) and requires careful laboratory procedures, which may limit its use in routine analyses.
The LA–ICP–MS technique is rapid (<2 min per spot analysis), has low LODs (sub-ng/g), and is widely available [25]. This technique has been used to simultaneously quantify major and trace element in silicate glasses and minerals using the conventional 100% oxide normalization approach [26,27,28,29]. However, its applicability to olivine has not been well investigated. In this study, we demonstrate that a single LA–ICP–MS, along with a simplified 100% method, is able to simultaneously determine the Fo contents and minor–trace elements contents of olivine samples. The accuracy and precision of these Fo contents were experimentally and theoretically evaluated based on the measured Fe/Mg ratios. This technique was further validated by analyzing a well-characterized olivine reference material (RM) MongOLSh 11-2 [30], an in-house olivine RM XEN [21], and a large suite of natural olivines (N = 154) with Fo contents of 81–93. This method was applied to olivine phenocrysts in the Lijiang picrites from the Emeishan large igneous province. With the advantages of low LODs, high sample throughput and being simple to undertake, the LA–ICP–MS method may have the potential of wide applicability in the field of olivine geochemistry.

2. Materials and Methods

2.1. Reference Materials and Olivine Samples

GOR132-G glass is one of the MPI–DING series RMs. It has been well-characterized in previous studies [31,32]. This glass was made from a komatiitic rock powder, and has a chemical composition closer to olivine than any other available glass RMs. In this study, GOR132-G glass was used as the primary calibration standard for quantifying Fo contents and minor–trace element concentrations in olivine. Reference values for GOR132-G were taken from the GeoReM database (http://georem.mpch-mainz.gwdg.de/) [32,33], and are provided in Electronic Supplementary Material (ESI) Table S1 for method traceability. Recently, a new olivine RM (MongOLSh11-2) for in situ analysis has been developed [30]. This olivine RM was prepared from the central portion of a large (20 cm × 20 cm × 10 cm) mantle peridotite xenolith, in a ca. 0.5-Ma basaltic breccia from Shavaryn–Tsaram, Tariat region, central Mongolia. A total of 27 major and trace elements were characterized by various techniques, including Electron probe microanalysis (EPMA), X-Ray fluorescence spectrometer (XRF), LA–ICP–MS, secondary ion mass spectrometry (SIMS) and isotope dilution (ID)–ICP–MS. Another internal laboratory olivine RM (XEN) was also used in this study. This olivine has previously been characterized by Batanova et al. [21] using EPMA and LA–ICP–MS techniques. To further confirm the robustness and usefulness of LA–ICP–MS and this simplified 100% approach, a large set of natural olivines (N = 154) was analyzed. These olivine crystals were hand-picked from the Dali, Pingchuan and Lijiang picrites from the Emeishan large igneous province (LIP). Prior to LA–ICP–MS analysis, the Fo contents of the olivine samples were determined by EPMA. The details of EPMA analysis are given in ESI S1.

2.2. LA–ICP–MS

These analyses were carried out using a GeolasHD 193 nm ArF excimer LA system (Coherent; Göttingen, Germany) coupled to an Element XR sector field (SF)–ICP–MS (Thermo Fisher Scientific; Bremen, Germany) at the Institute of Geology and Geophysics, Chinese Academy of Sciences (IGGCAS), Beijing, China. Details of the LA–ICP–MS analysis technique are given in Wu et al. [34,35]. Helium was used as the carrier gas to improve the transport efficiency of the ablated aerosols [36,37]. A novel “wave” signal-smoothing device was used to improve the signal stability [38,39]. Daily optimization of instrumental performance with the USGS BCR-2G standard involved maximizing the signal to background intensity ratios for 25Mg+, 57Fe+ and 89Y+, while maintaining low oxide production (ThO+/Th+ < 0.1%), low doubly charged ion production (Ca2+/Ca+ < 1.0%), and minimal ICP-induced elemental fractionation [sensitivity ratio S(U+)/S(Th+) = 0.95/1.05]. In this study, the SF–ICP–MS was running without using the guard electrode to maintain a low level of oxide spectral interference (e.g., 29Si16O+ on 45Sc+). Table 1 summarizes the LA–ICP–MS instrumental conditions. Since the SF–ICP–MS is running at low mass resolution (M/ΔM = 300), the method described in this study should be readily applicable to quadrupole ICP–MS instruments.

2.3. Data Acquisition

The locations of laser spots were selected after careful binocular microscopic examination of the samples so as to avoid cracks and inclusions. We also suggest checking the locations with the support of SEM images. The signal intensities of 7Li, 23Na, 25Mg, 27Al, 29Si, 31P, 43Ca, 45Sc, 49Ti, 51V, 53Cr, 55Mn, 57Fe, 59Co, 60Ni, 63Cu, 67Zn, 69Ga and 89Y were monitored during each analysis. A total of six analytical sessions were performed during a period of six months (ESI Table S2). All data were acquired by firing the laser for 40 s, after 10 s of gas background measurement, which was followed by 10 s of monitoring the signal “washout”. Prior to analysis, possible surface contamination was removed in a pre-ablation step with three laser pulses. GOR132-G reference glass was used to correct for the instrument- and time-dependent fractionations of Fe/Mg ratios and all minor–trace elements. We selected GOR132-G reference glass as the primary calibrator for three reasons, as follows: (1) this glass is widely distributed and used in LA–ICP–MS laboratories around world; (2) its compositions of major and some trace elements are comparable to those of nature olivines; (3) compared to natural olivines, this glass has high abundances of Cu, Ga and Y, and therefore it is more suitable for use as the calibrator for low-content trace elements. Olivine RM MongOLSh11-2 and XEN were analyzed for data quality control purposes. A standard–sample bracketing approach was adopted, which involved the analysis of eight unknown samples followed by one analysis each of GOR132-G, MongOLSh11-2 and XEN.

2.4. Data Reduction Approach

The 100% oxide normalization approach is documented elsewhere [26,27,28,40,41]. This strategy requires the measurement of all major, minor and trace elements, and then quantifies major and trace elements based on the total matrix normalized to 100%. Olivine has a predictably simple chemistry. Therefore, this conventional 100% method can be simplified as follows: (1) calculation of Fo contents from the measured Fe/Mg ratios; (2) according to the olivine stoichiometric formula [(Mg, Fe)2SiO4] and known Fo contents, the contents of Mg, Fe and Si can be computed, which are used as internal standards for minor–trace element quantification. Details are shown below:
The Fe/Mg ratios in the olivine samples were calculated by standardization to GOR132-G glass, as follows:
F e M g o l i v i n e = i n t e n s i t y   ( F e M g o l i v i n e ) i n t e n s i t y   ( F e M g G O R 132 G ) × 0.5812
The Fe/Mg ratio is given as a weight ratio, and 0.5812 is the recommended Fe/Mg ratio for GOR132-G glass. The molar Fo content can be rewritten in a weight format:
Fo = 100 1 + Fe Mg × 0.4352
The constant 0.4352 is the coefficient between the molar- and weight-based Fe/Mg ratios. This shows that the Fo content can be obtained once the Fe/Mg ratio is known.
For olivine, three major oxide components (MgO, SiO2 and FeO) commonly comprise > 99% of the mass. Therefore, we assumed that the sum of MgO, SiO2 and FeO is 100%, as follows:
MgO + FeO + SiO 2 = 100 % .
Based on the molecular formula [(Mg, Fe)2SiO4] of olivine, we have
MgO 80.608 + FeO 143.688 = SiO 2 60.084
The molar Fo content can be rewritten in an oxide format (i.e., FeO and MgO) as follows:
FeO MgO = ( 100 Fo 1 ) × 1.7826
Combining Equations (3), (4) and (5) yields
Mg = 100 × Fo 252.79 0.7826 × Fo / 1.6583
Fe = 17826 178.26 × Fo 252.79 0.7826 × Fo / 1.2865
Si = 7453 252.79 0.7826 × Fo / 2.1393
Here, 1.6583, 1.2865 and 2.1393 in the denominator are the coefficients between element and oxide for Mg, Fe and Si, respectively. Using this approach, the accuracies of the Mg, Fe and Si are better than 1.5%, relative to the recommended values. All minor–trace element data were quantified using the internal standardization approach [42], as follows:
C e l | o l i v i n e = i n t e n s i t y   ( e l ) i n t e n s i t y   ( M g , F e ,   S i ) | o l i v i n e × i n t e n s i t y   ( M g , F e ,   S i ) i n t e n s i t y   ( e l ) | G O R 132 G × C e l C M g | G O R 132 G × c M g , F e ,   S i | o l i v i n e
Where C represents the concentration of a target element and el is the element. The mass fractions of Mg, Fe and Si were calculated from Equations (6)–(8).
A DRS code in Iolite software was programmed to facilitate this simplified 100% strategy (see supplementary files). It should be noted that the conventional 100% method [40] using only Si, Mg and Fe yields results nearly identical to this simplified 100% method. To a certain extent, this simplified 100% method is repackaged from that conventional 100% method [40]. We repackaged it in a way that allows the easier evaluation of the precision and accuracy of Fo contents.

3. Results and Discussion

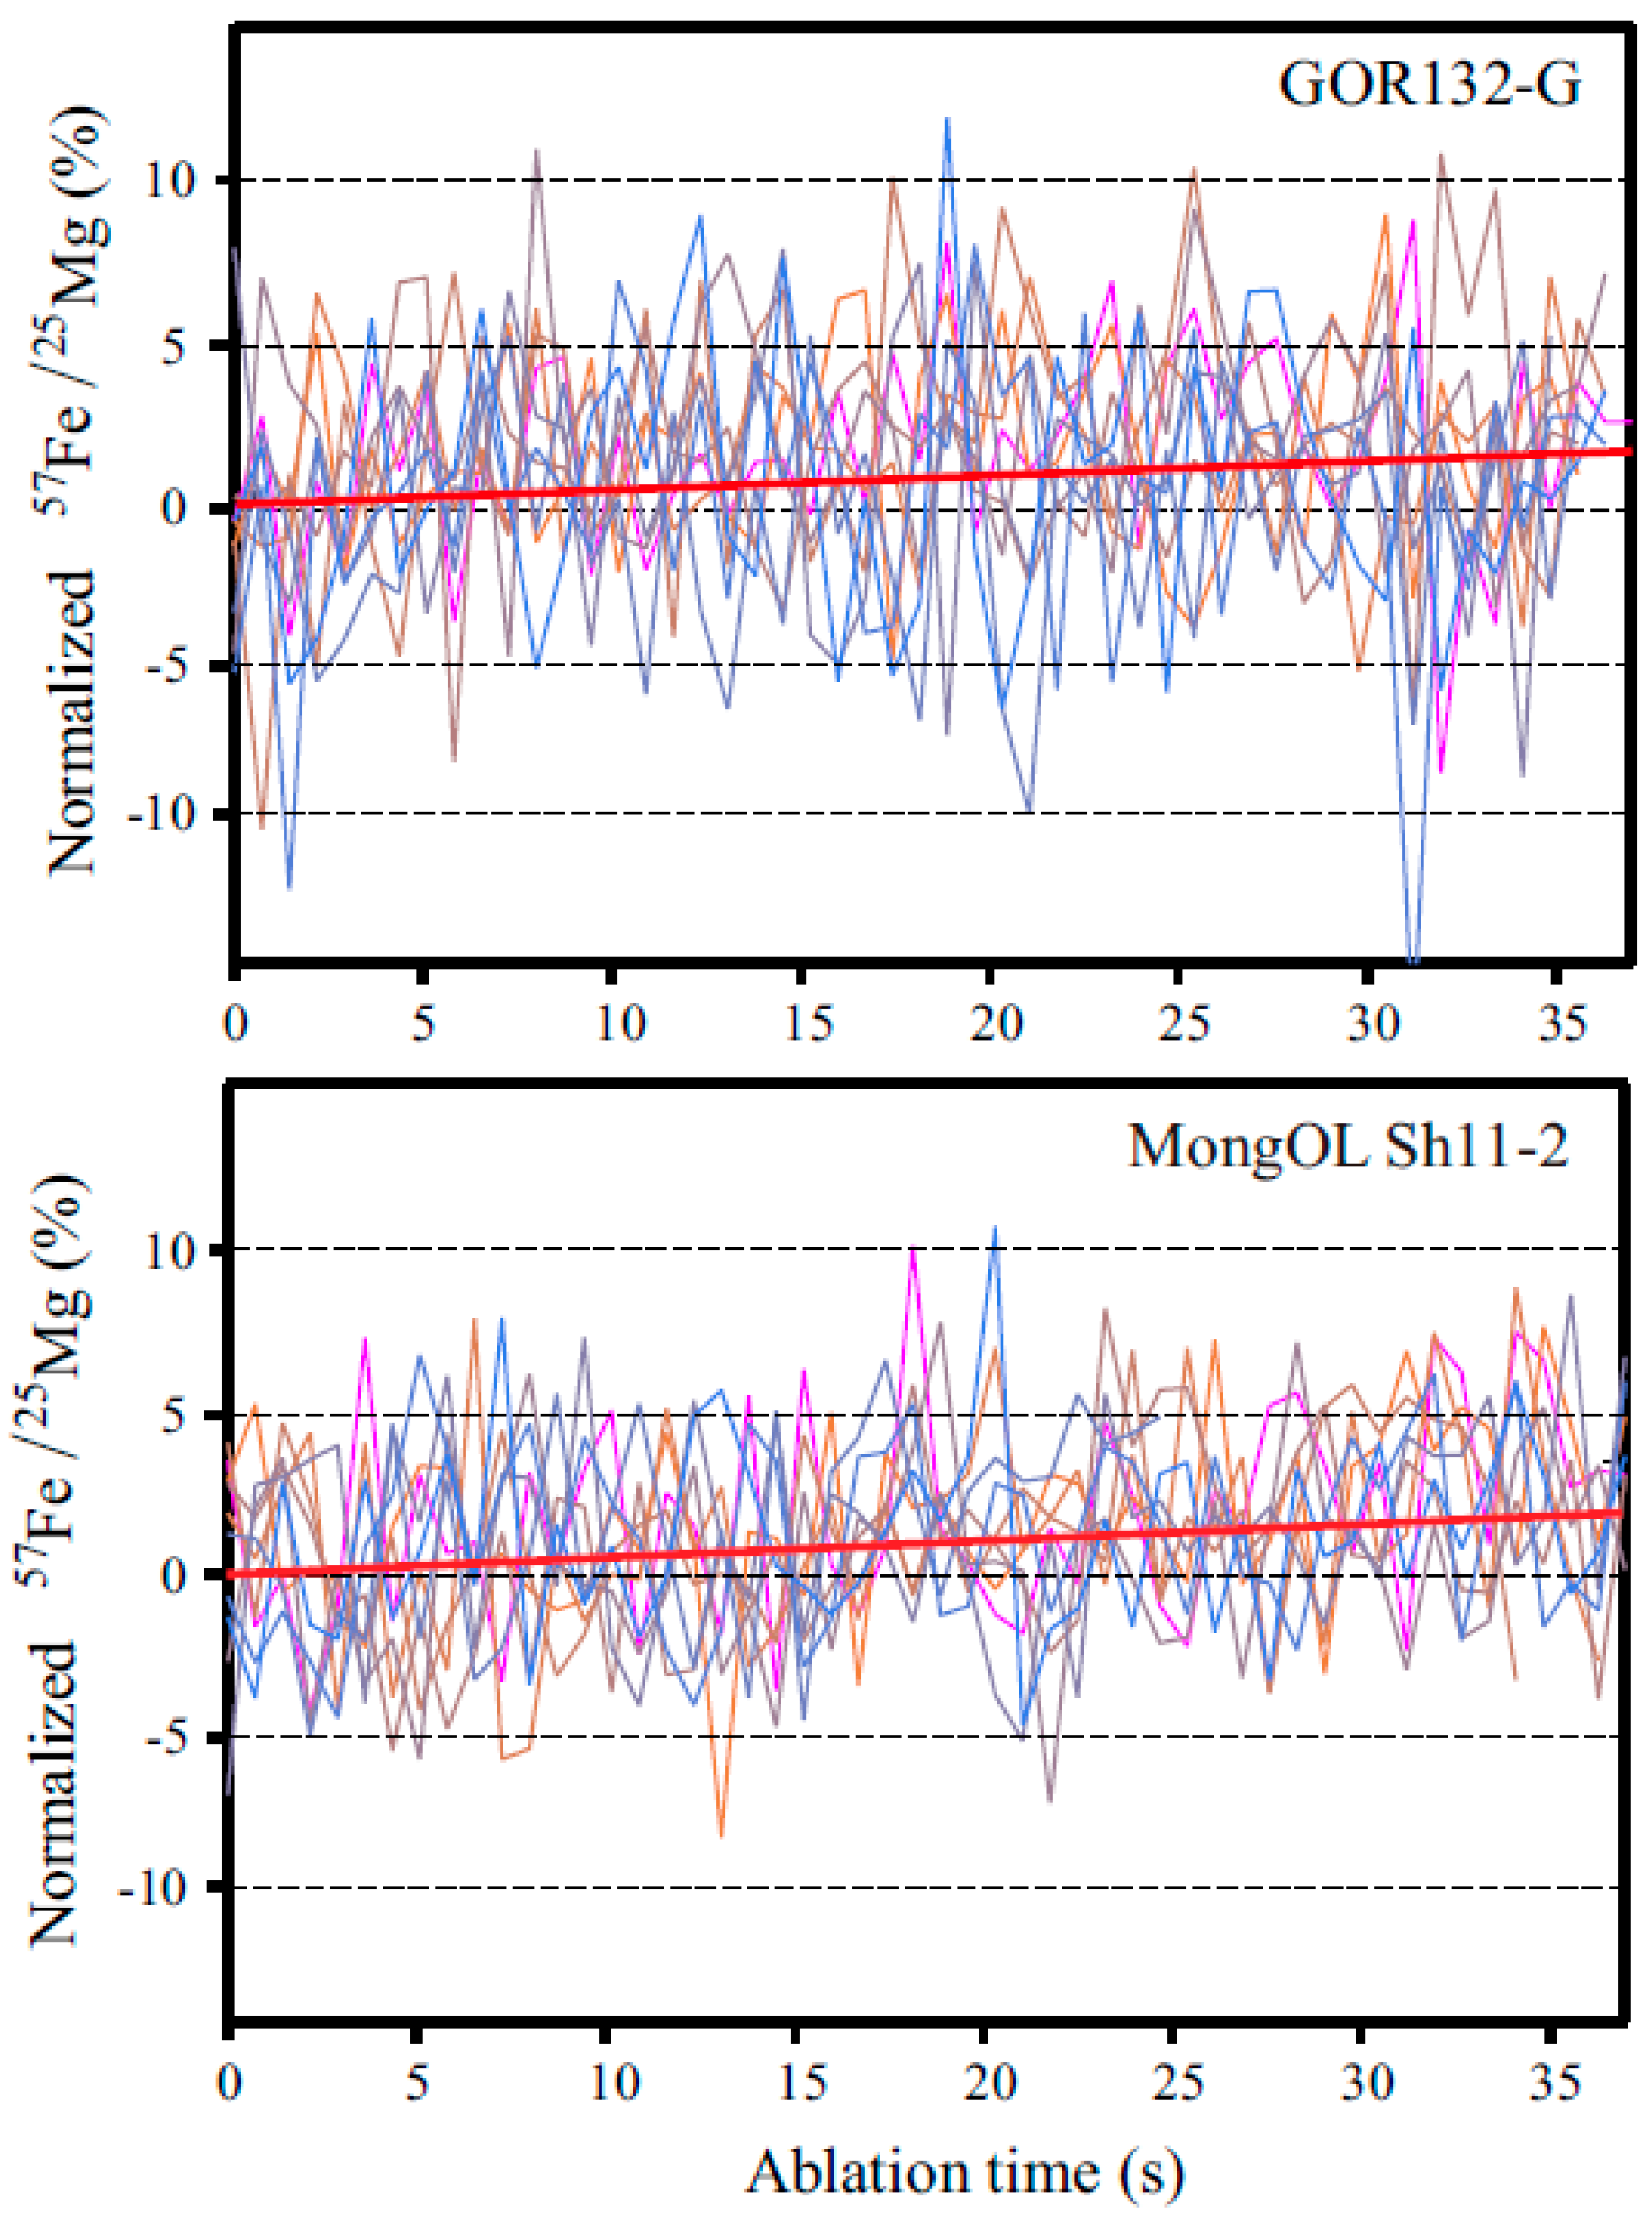
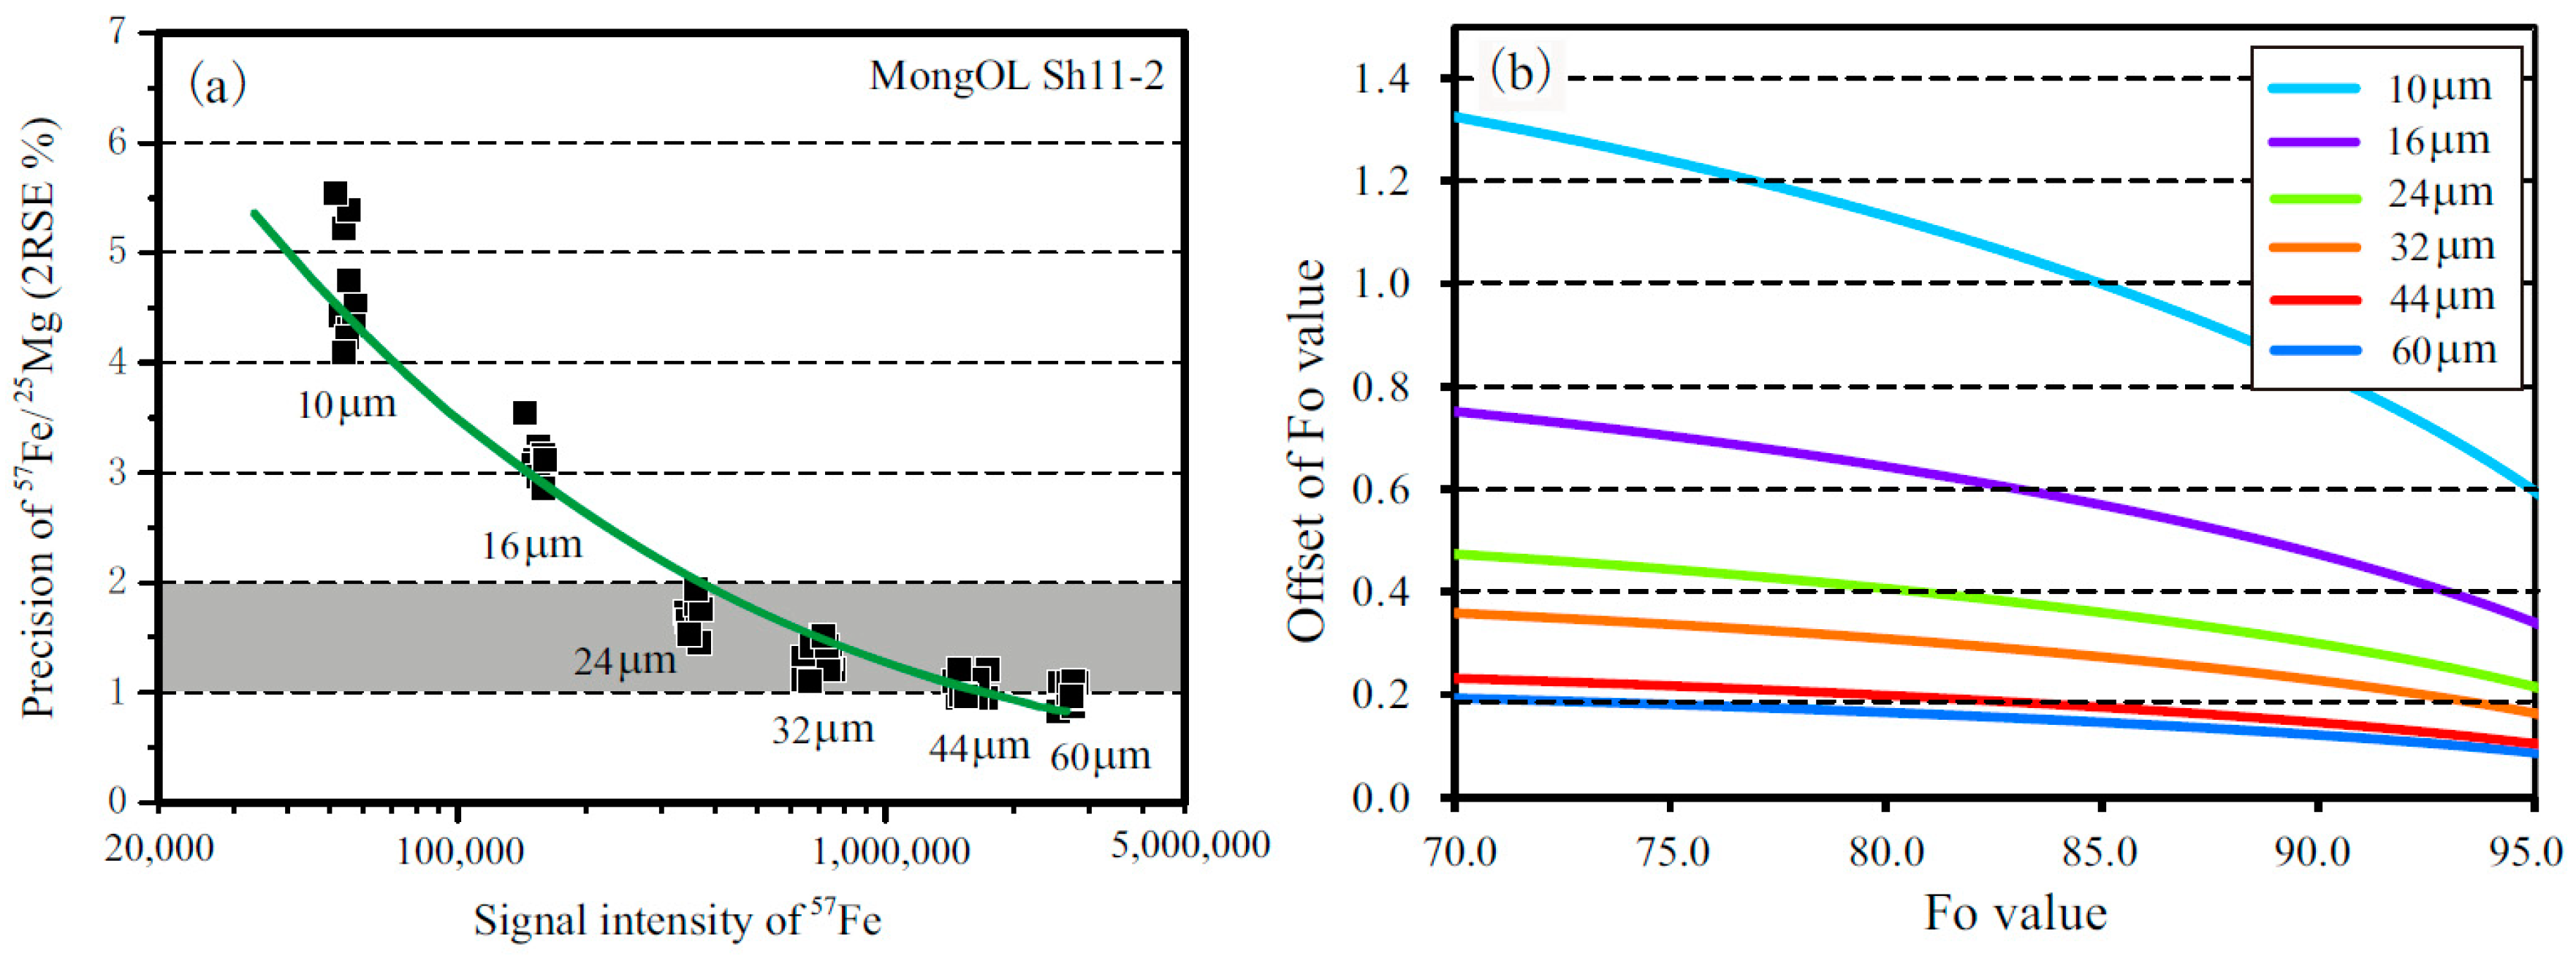
3.1. Precision of the Fe/Mg Ratio and its Influence on Fo Content

As shown in Equation (2), the analytical precision of Fe/Mg ratios directly depends on the Fo contents. There are two main sources controlling the analytical precision of the Fe/Mg ratios: (1) Down-hole fractionation (DHF), and (2) the counting statistics of signal intensity. DHF is defined as the progressive, volatility-controlled fractionation between a pair of elements as the laser pit deepens [43,44]. A severe DHF can significantly degrade the analytical precision. The DHF effect has been widely documented in zircon U–Pb geochronology studies [45,46]. Jochum et al. [47] reported a detectable DHF between refractory lithophile and chalcophile-siderophile elements. Iron is a refractory siderophile element based on the cosmochemical classification of this element, while Mg is a refractory lithophile element. Figure 1 shows the DHF behavior of the 57Fe/25Mg ratio in GOR132-G glass and MongOLSh11-2 olivine. A slightly larger scatter of 57Fe/25Mg ratios was observed for GOR132-G glass, which is mainly due to the relatively low concentration of Fe and Mg. The results illustrate that Fe/Mg ratios slightly increase with a longer ablation time, illustrating the different fractionation behavior of Fe and Mg. However, these fractionations are almost identical in both sample matrixes, indicating a very limited DHF-induced bias for the Fe/Mg ratio between the GOR132-G glass and the MongOLSh11-2 olivine. This slight DHF has a negligible effect (<1%) on the analytical precision of the measured Fe/Mg ratios. Based on these observations, we did not conduct any DHF corrections on the Fe/Mg ratios.
The signal intensity of 57Fe and 25Mg is another factor influencing the measured precision due to counting statistics. The signal intensity of 25Mg is one order of magnitude greater than that of 57Fe, which is mainly due to its higher concentration (MgO: ca. 48 wt.%) and abundance of measured isotopes (25Mg: 10 atom%). Figure 2 shows the precision of the Fe/Mg ratios as a function of the 57Fe intensity for MngOLSh11-2 olivine. The variation in 57Fe intensity was simply achieved by changing the laser spot size (10, 16, 24, 32, 44 and 60 µm). Figure 2a illustrates that the precision of the Fe/Mg ratio improves with greater 57Fe signal intensity. In general, the precision is <2% with a 57Fe signal intensity of >300,000 cps (or a laser spot size of >24 µm). A laser spot size of 44 µm was used in this study, yielding an analytical precision of <1.5%. It should be emphasized that the instrument sensitivity can vary depending on the daily instrument tuning, different samples, the condition of the skimmer cones, and the state of the secondary electron multiplier (SEM) detector. These factors may slightly affect the precision of the Fe/Mg ratios.
As shown in Equation (2), the uncertainty on the Fo content from the precision of the Fe/Mg ratios can be modeled based on their reciprocal relationship. Figure 2b shows the modeled uncertainty of Fo content as a function of laser spot size (10, 16, 24, 32, 44 and 60 μm). The modeled Fo uncertainty is calculated based on the below Equation (10). k is the conversion factor between the Fo and Fe/Mg ratio.
δ F o ~   k × δ F e M g = ( δ F e M g O l i v i n e ) 2 + ( δ F e M g G O R 132 G ) 2
In general, a high Fo content is less affected than a low Fo content by a specific laser spot size. Figure 3 also indicates that when using a spot size of 44 μm, the Fo uncertainty is ≤0.15 for Fo > 90, 0.15–0.20 for Fo = 80–90, and 0.20–0.22 for Fo = 70–80. These uncertainties are inferior to those obtained using HP-EPMA (0.05–0.10) [2,3], but comparable to those obtained using the normal EPMA technique (0.10–0.30) [7]. These results indicate that the uncertainty of Fo contents obtained from the LA–ICP–MS technique (spot size: 44 μm) is sufficient for olivine geochemical studies.

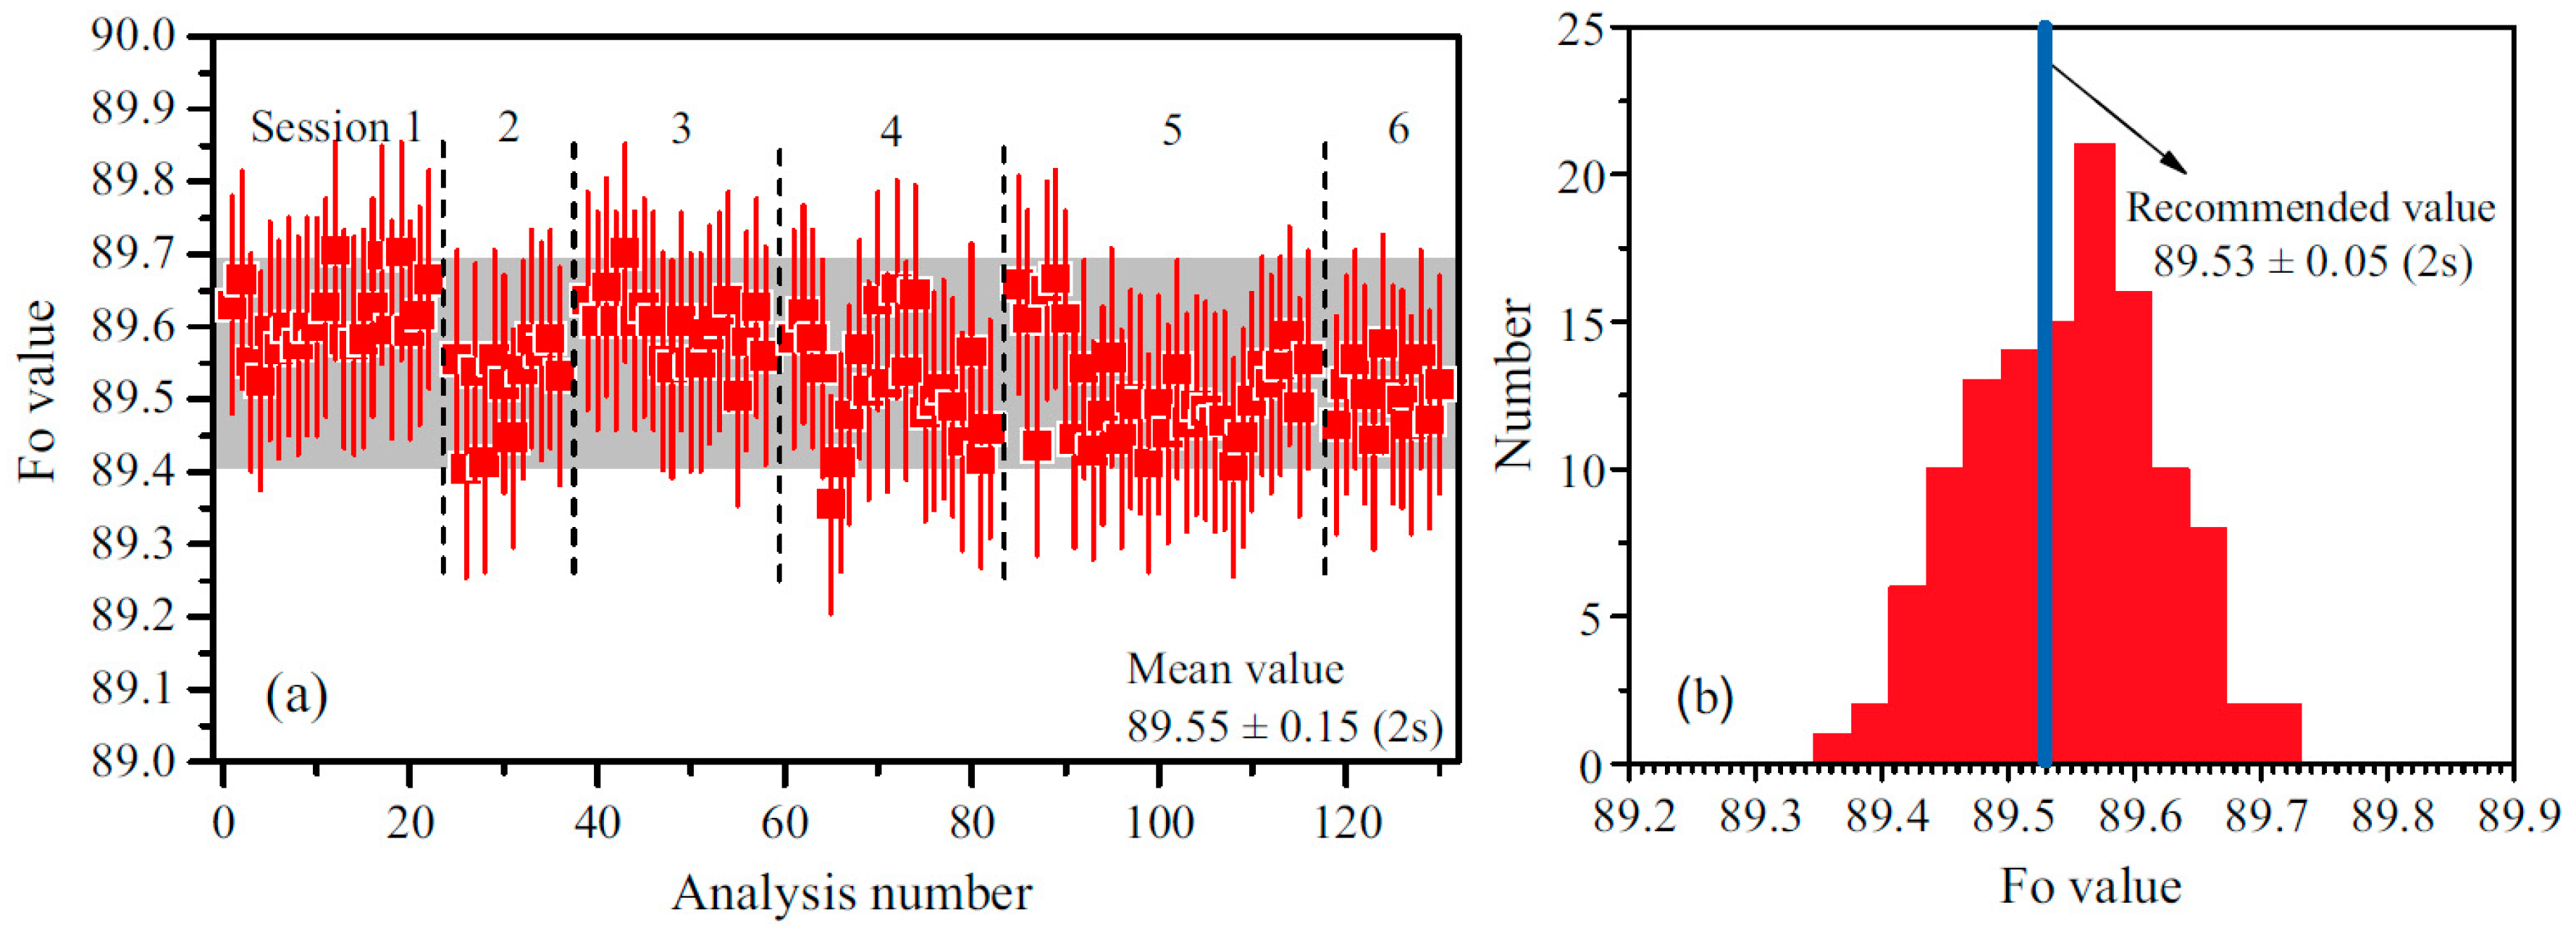
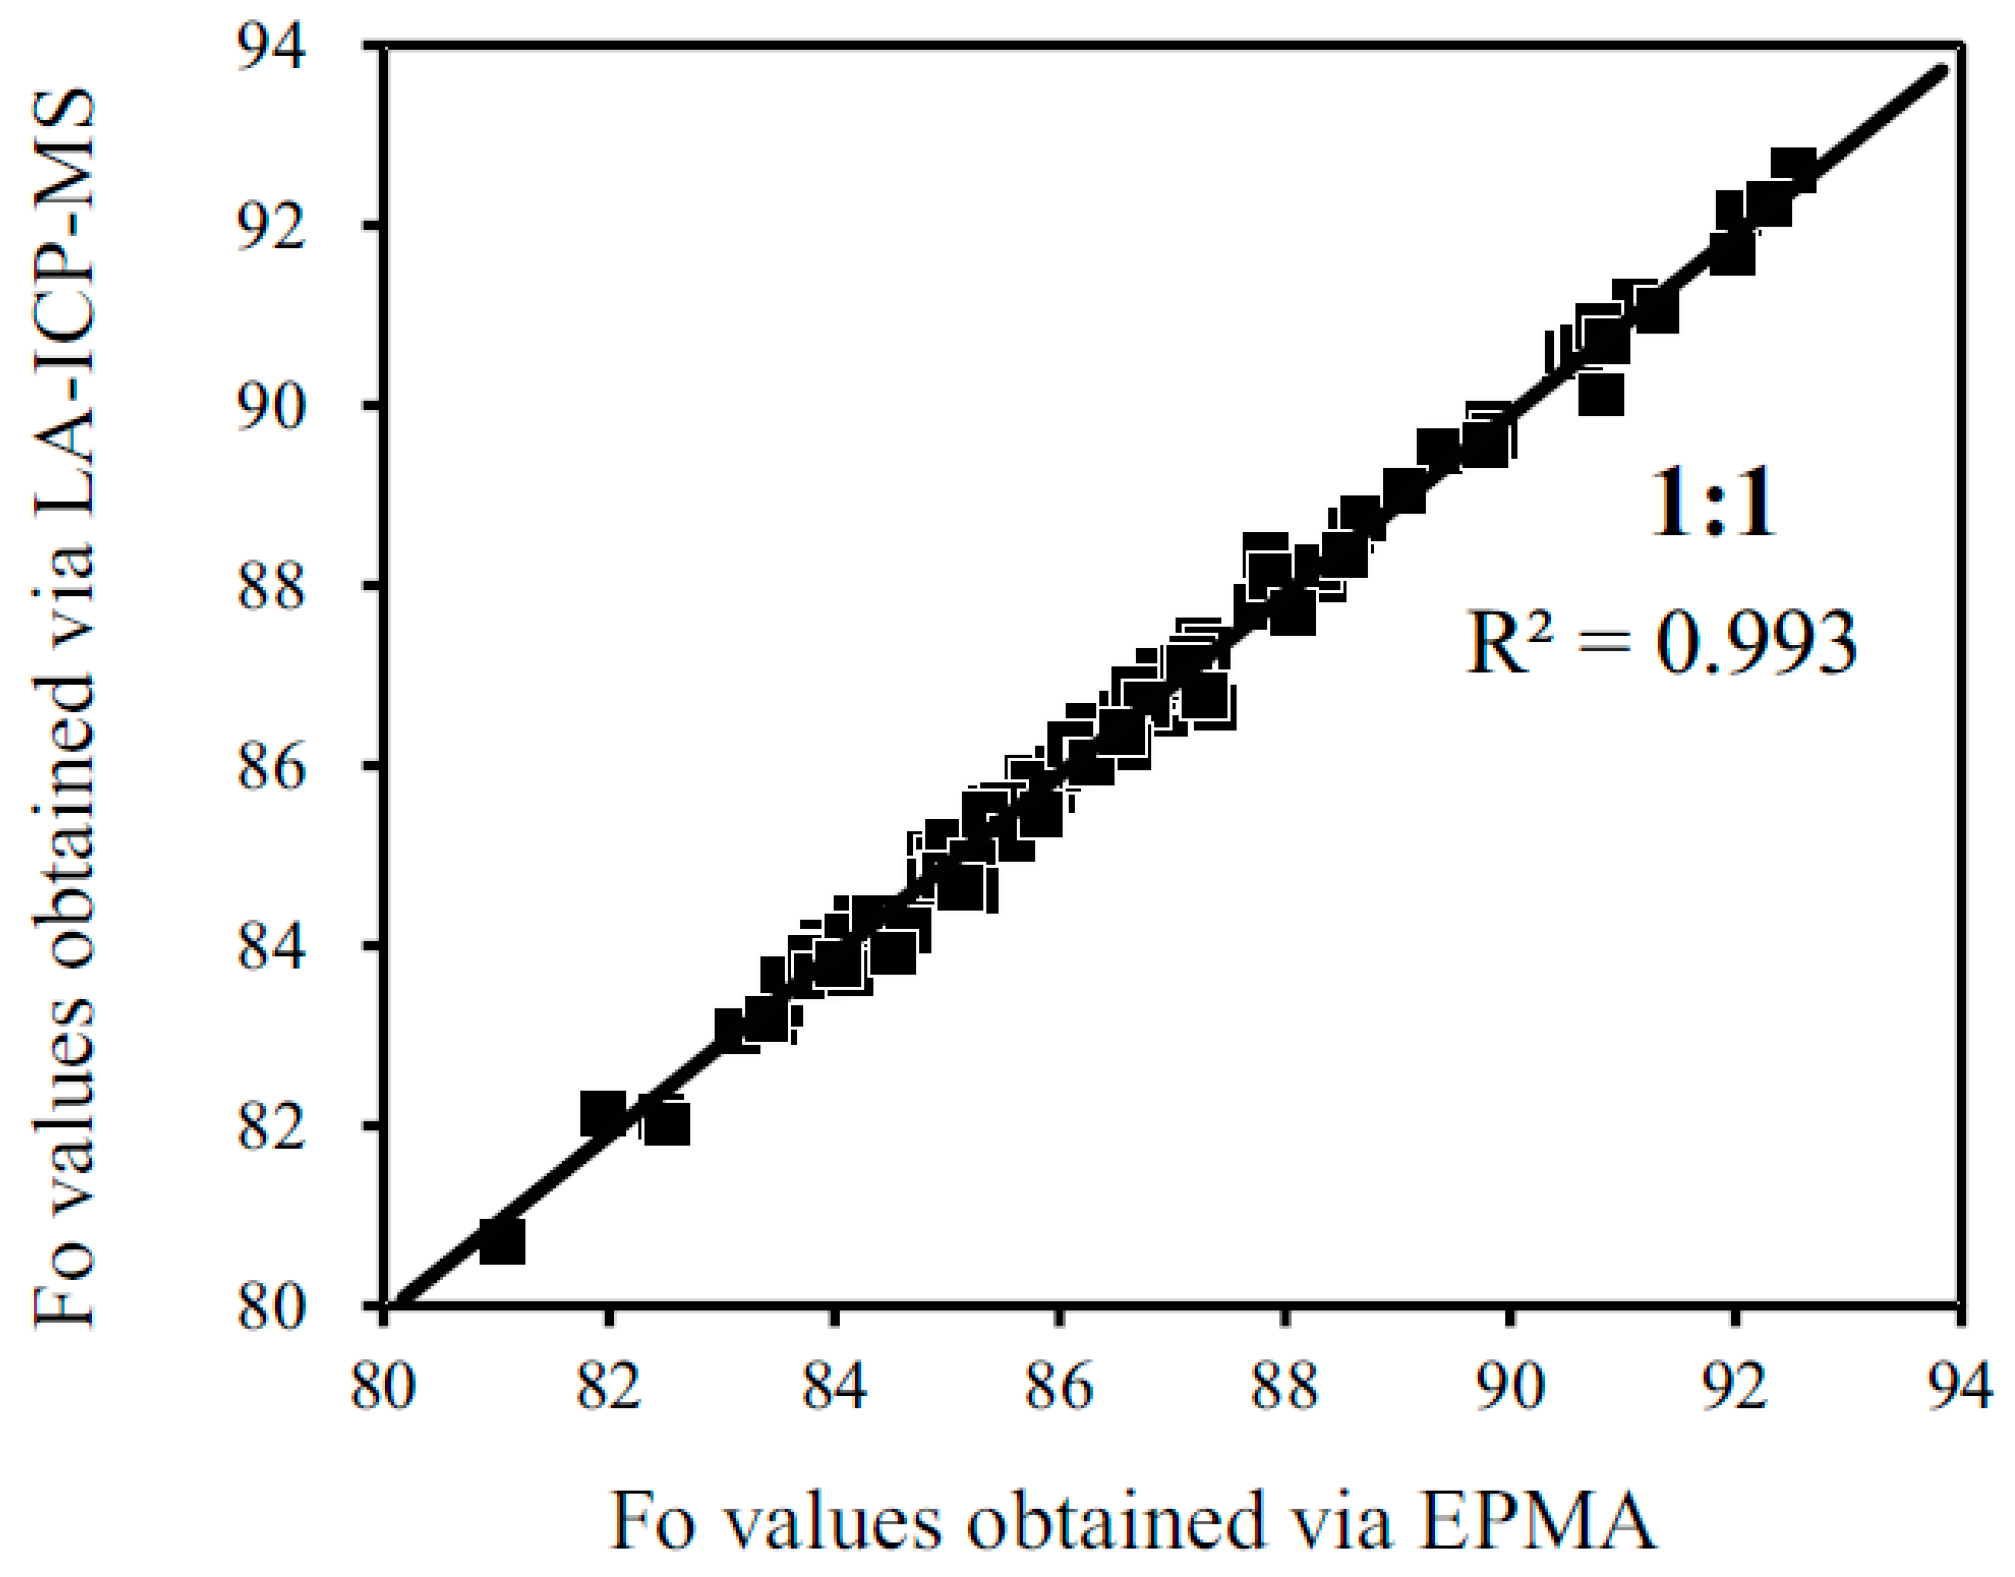
3.2. Accuracy of Fo Contents and Long-Term Reproducibility

To evaluate the accuracy of the LA–ICP–MS technique for Fo determinations, MongOLSh11-2 samples were analyzed. The Fo values were calculated based on Equations (1) and (2). The results are summarized in Figure 3 and the ESI Table S2. The plotted error bars are the internal precision calculated from Equation (10). The average of the internal precision is 0.15. MongOLSh11-2 was analyzed as the data quality control material in six analytical sessions over a period of six months. A total of 120 analyses yielded a mean value of 89.55 ± 0.15 (2 s), which is in agreement with the recommended value of 89.53 ± 0.05 (2 s) [30]. The long-term reproducibility of the LA–ICP–MS technique was established by repeated measurements of MongOLSh11-2 over six months. Figure 3a shows that the long-term analytical reproducibility for Fo (given as 2 Relative Standard Deviation R.S.D.%) is ± 0.17%, which is similar to that reported by the normal EPMA technique [7]. Figure 3b shows a histogram of Fo contents (N = 120), which is clearly a Gaussian distribution, further demonstrating the stability of the LA–ICP–MS technique for the determination of Fo contents.
To further confirm the accuracy of the LA–ICP–MS technique for Fo determinations, XEN and a large suite of natural olivine grains (N = 154) were measured. XEN was repeatedly analyzed in five analytical sessions over a period of five months. A total of 98 analyses yielded a mean value of 90.73 ± 0.14 (2 s), which is comparable to the published value of 90.78 ± 0.06 (2 s) [21]. The natural olivines are from the Dali, Pingchuan and Lijiang picrites, which are part of the Emeishan LIP. These olivine phenocrysts have variable Fo contents (from 81 to 93). Figure 4 shows that the LA–ICP–MS results match the EPMA results with a R2 value of 0.993. Some small scatter from the 1:1 line was observed, which is probably related to the compositional heterogeneity of the olivine phenocrysts and the different sampling volumes of the EPMA and LA–ICP–MS techniques. Using this simplified 100% approach, LA–ICP–MS is robust and reliable in quantifying Fo contents over a wide range of Fo compositions. Despite its different chemical and physical composition, our results indicate the GOR132-G glass is a suitable RM for quantifying olivine Fo contents. This is due to the similar fractionations of Fe and Mg during ablation (Figure 1).

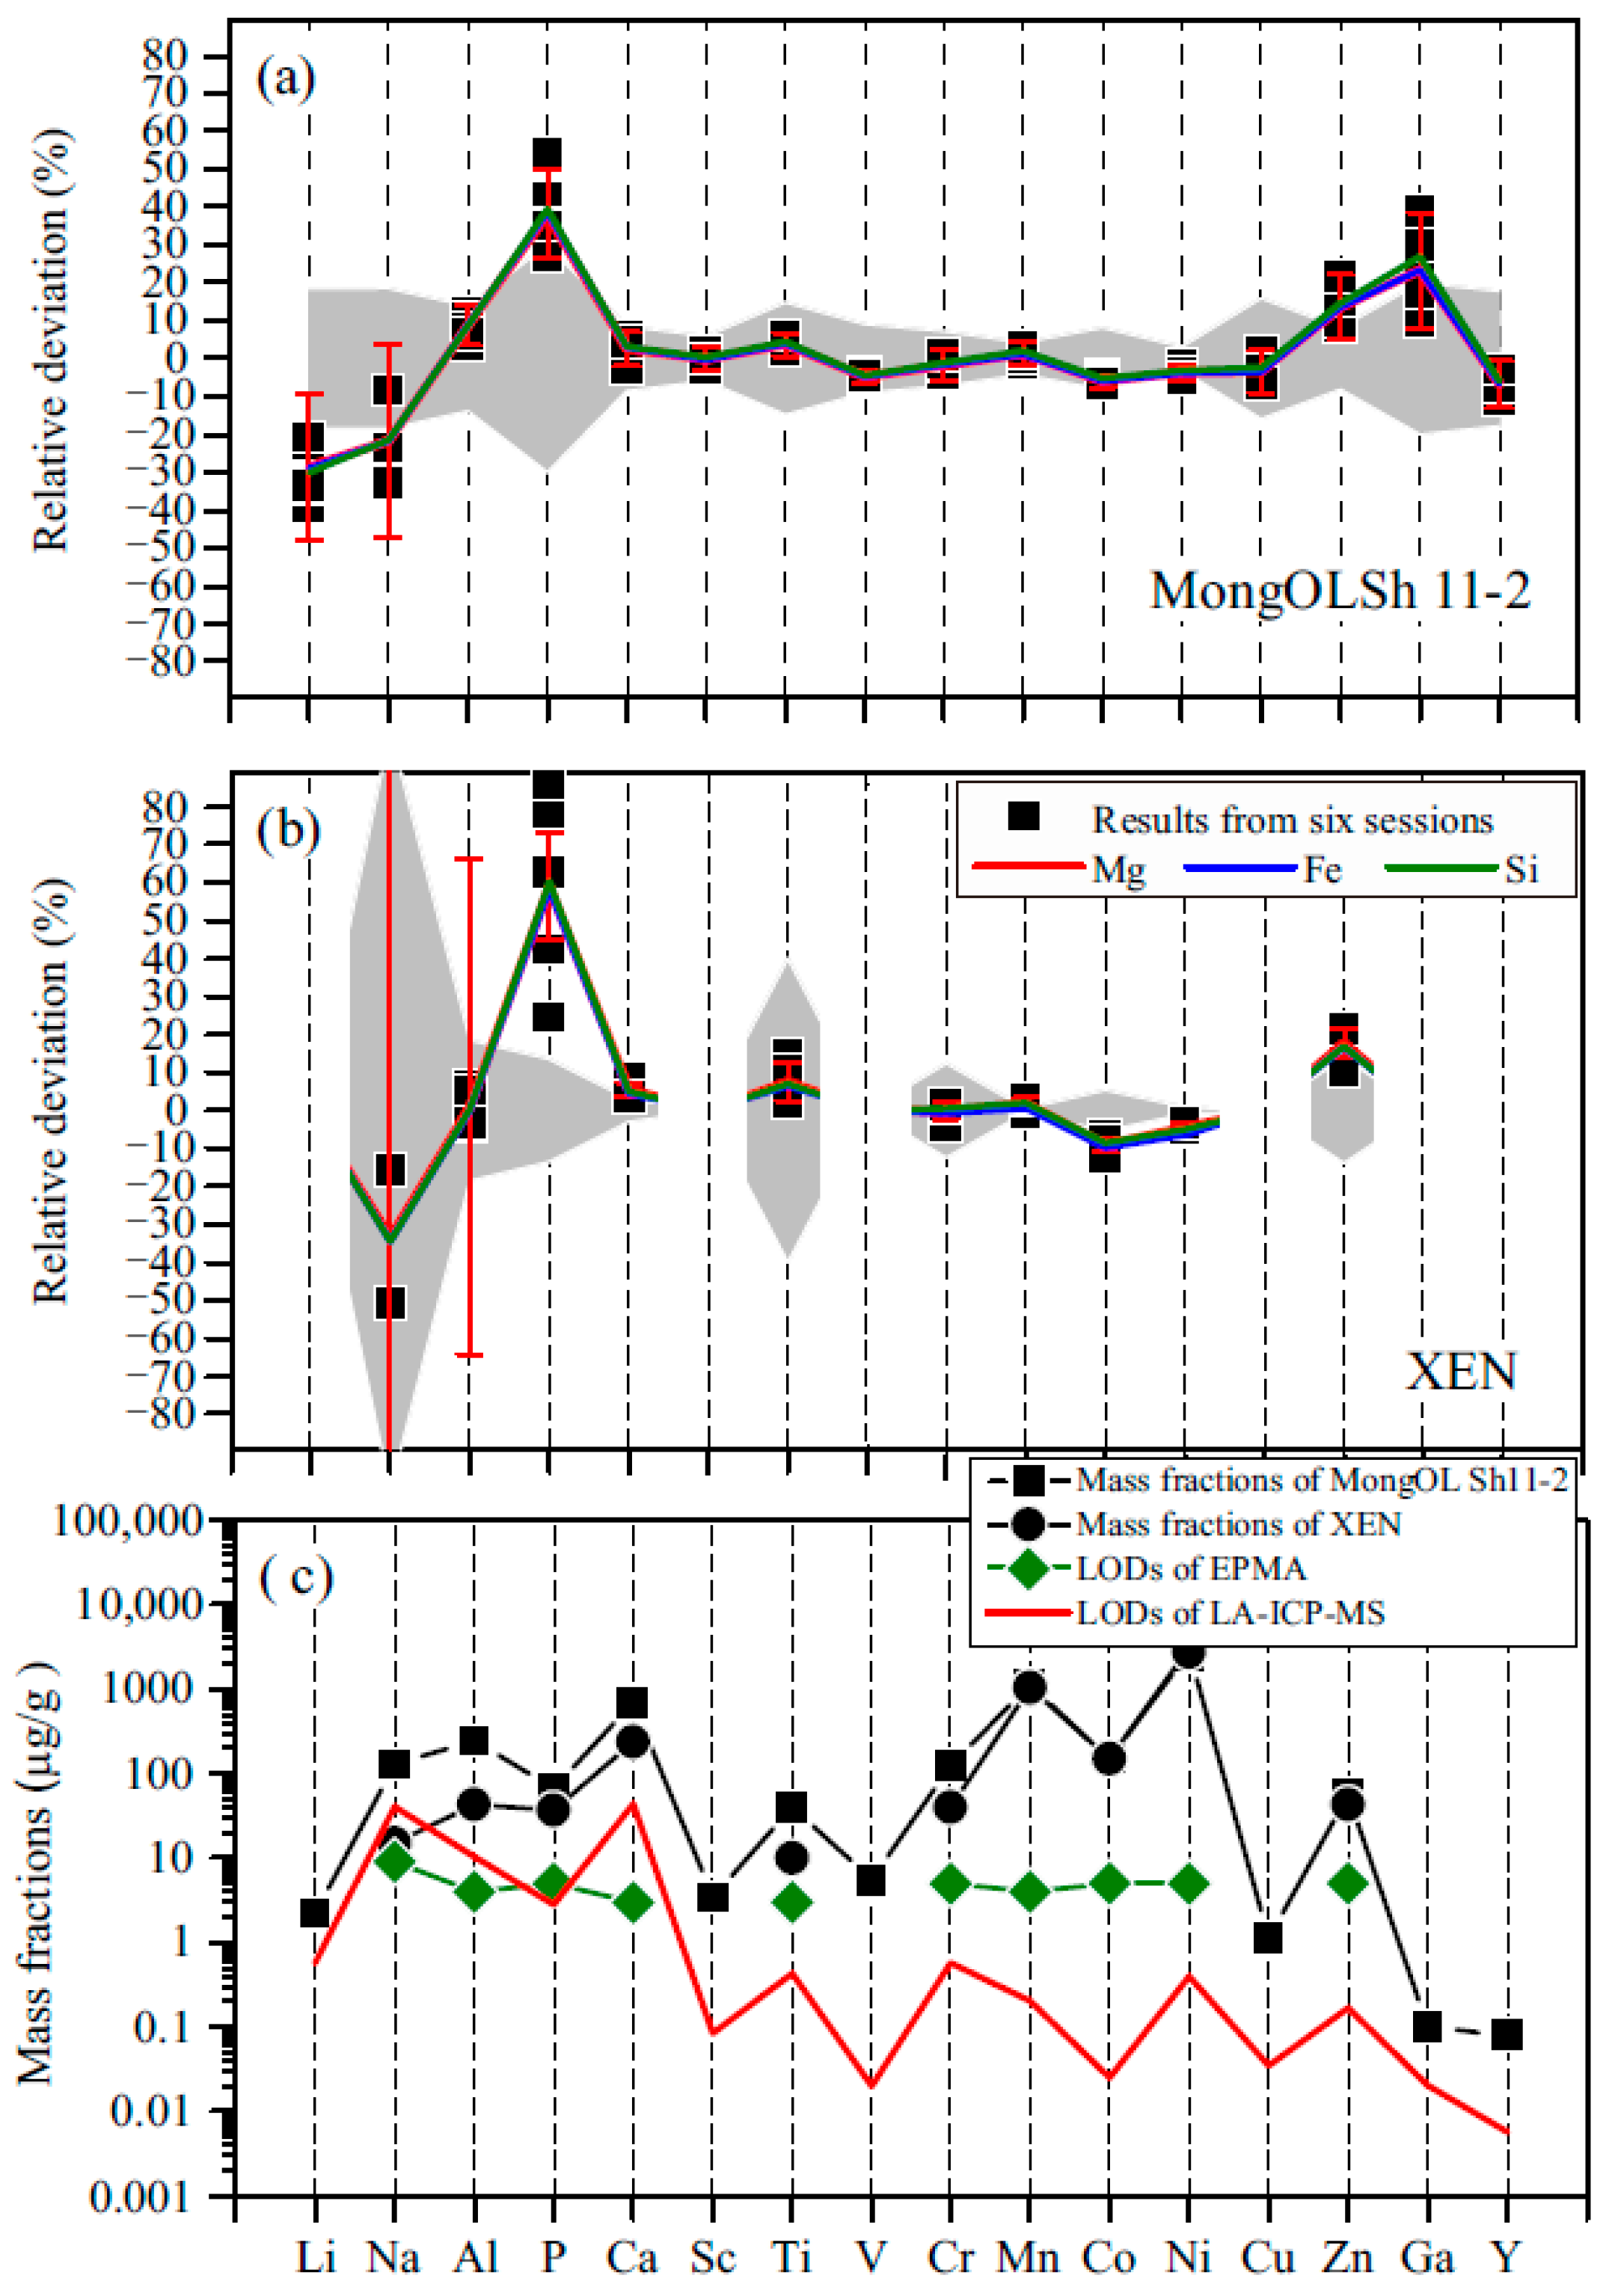
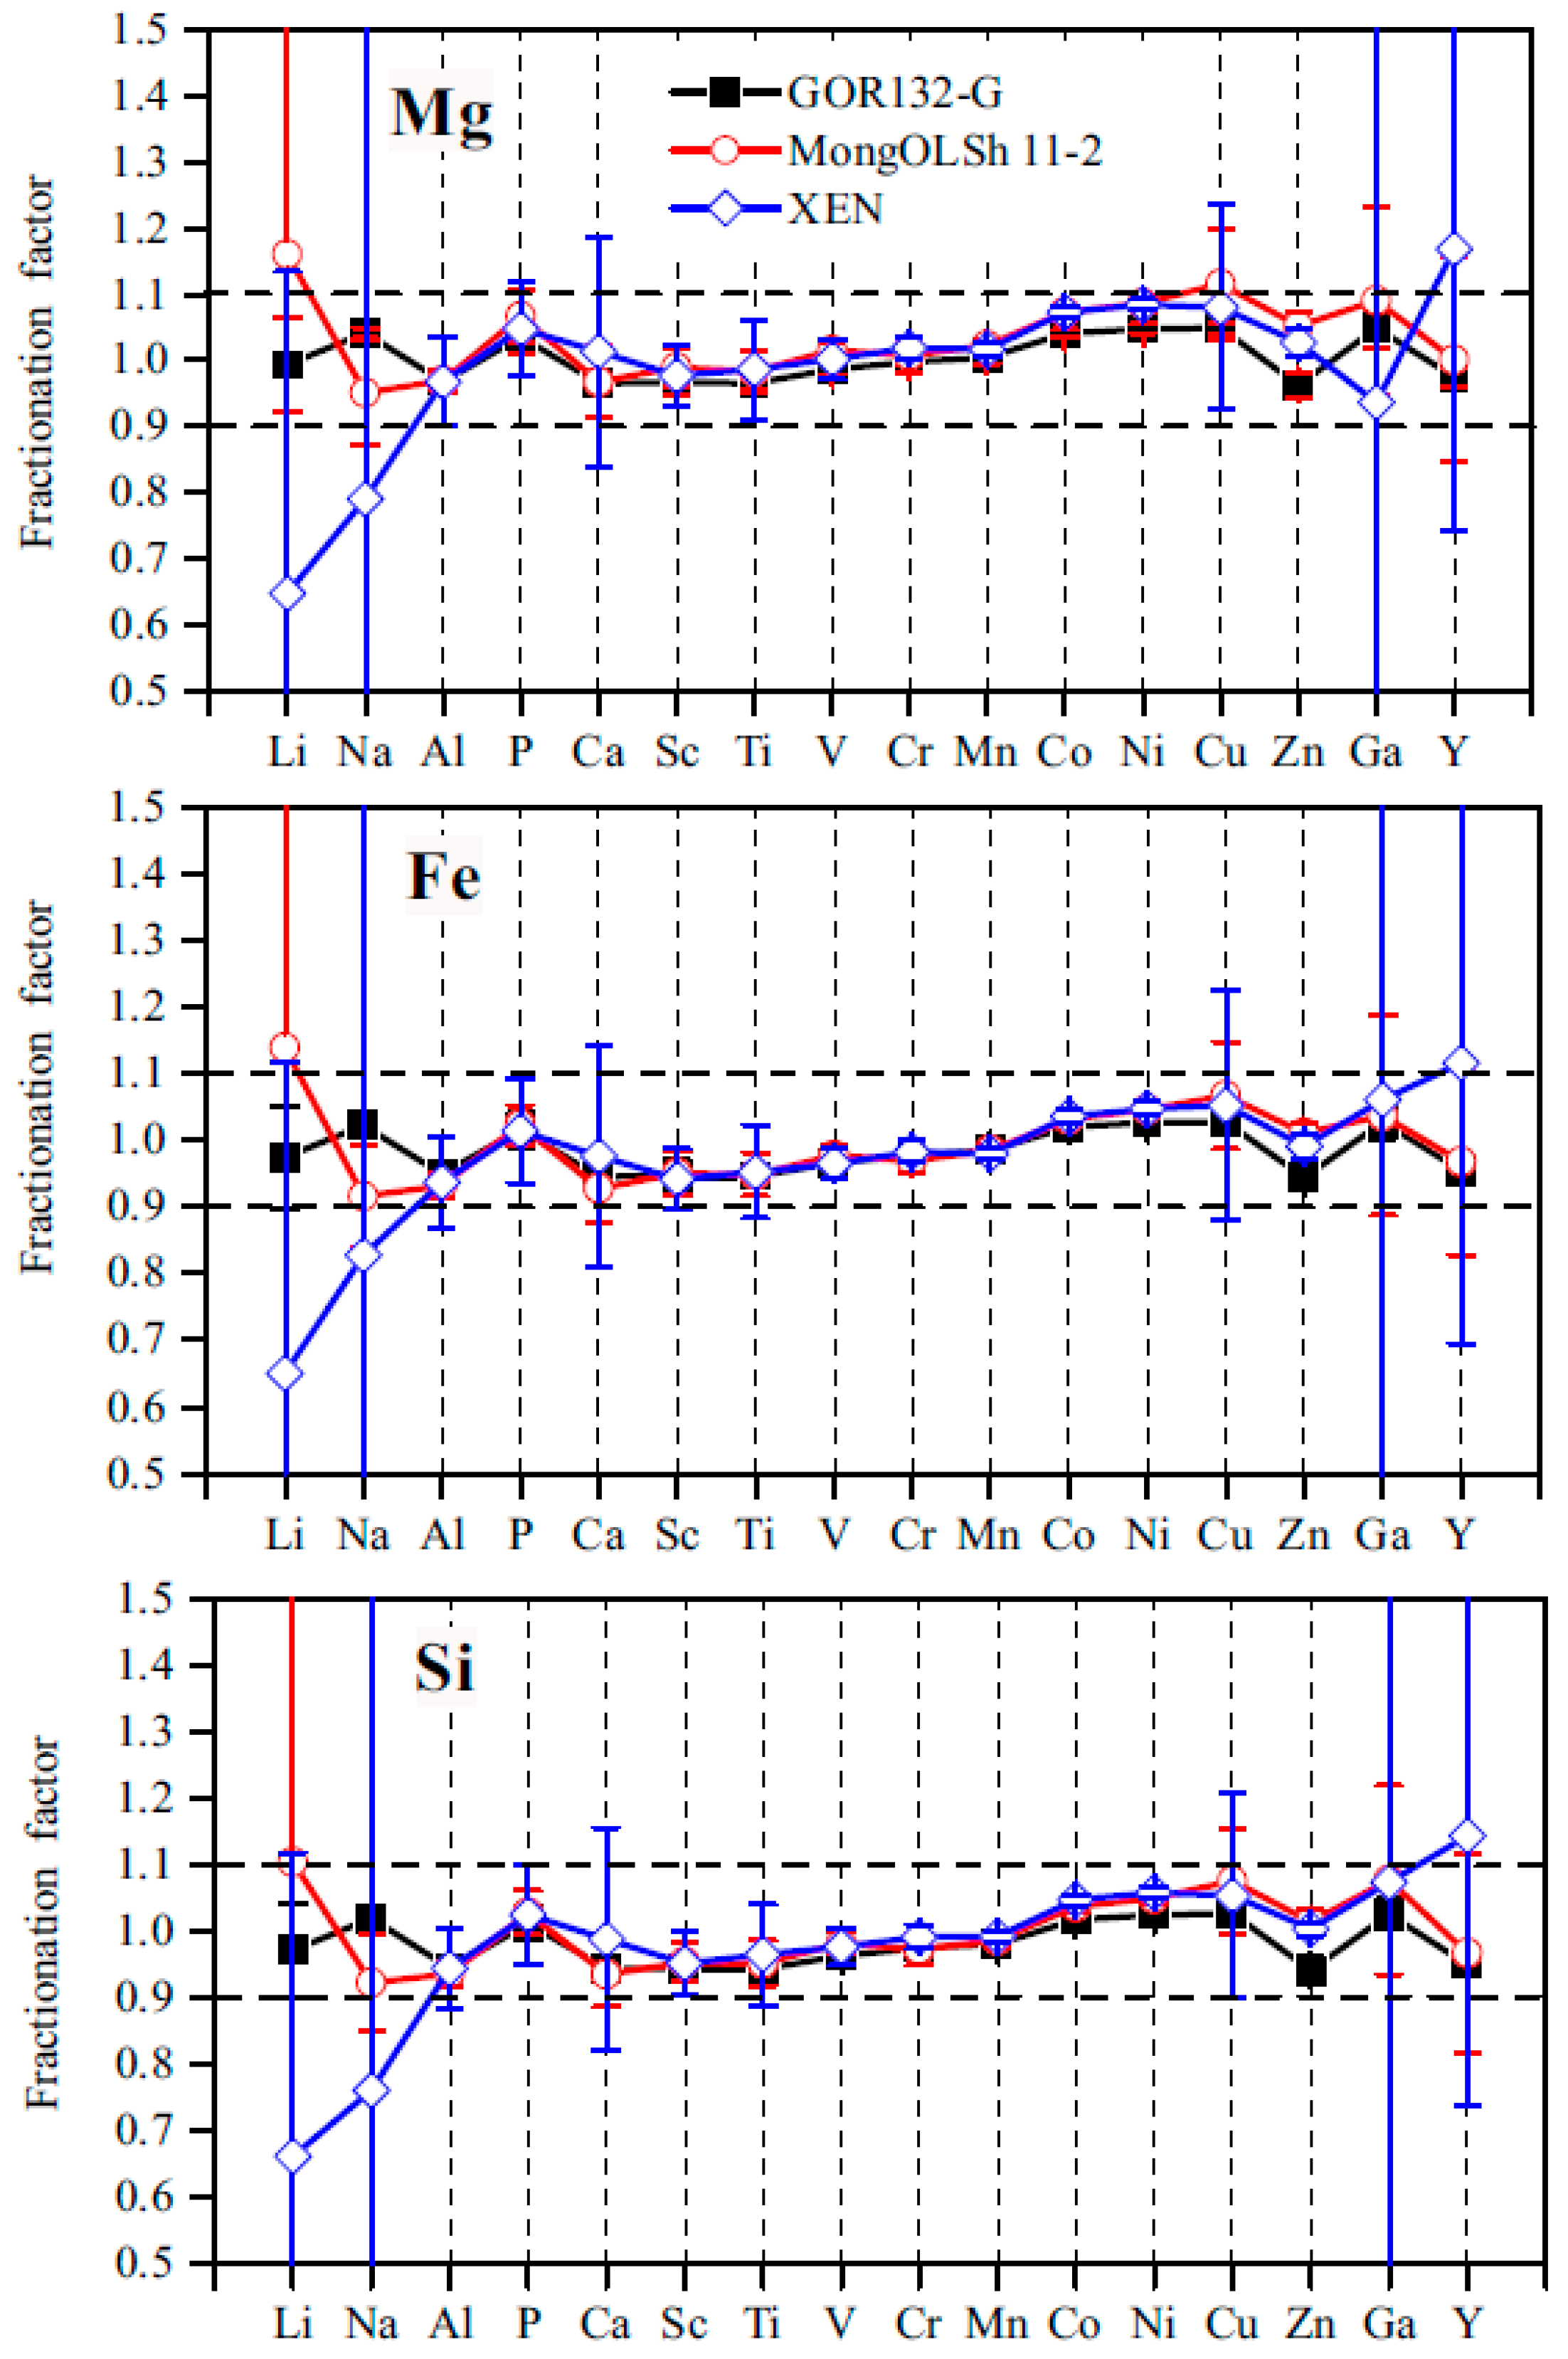
3.3. Accuracy of Minor–Trace Elements

In this study, the well-characterized MongOLSh11-2 olivine RM and the in-house XEN RM were analyzed for minor–trace elements, and the accuracies of the measurements were evaluated. The accuracy is given as the relative deviation (%), which is defined as the discrepancy (%) from the recommended value. Figure 5 plots the data of MongOLSh11-2 and XEN, which were calculated using the simplified 100% method with Mg, Fe and Si as internal standards. The complete dataset is given in ESI Table S2. The accuracies of the Mg, Fe and Si are better than 1.5%, relative to the recommended value (ESI Table S2). The LODs are calculated as three times the standard deviation of a sample that contains zero analyte (here, we used the gas blank), as proposed by Longerich et al. [42]. Figure 5c shows that, for most elements, the LODs from the LA–ICP–MS is < 0.1 μg/g, which is clearly better than these of HP–EPMA.
As shown in Figure 5, the results for most minor–trace elements agree with the recommended values, except for those of Li, Na, P, Zn and Ga. These results demonstrate that LA–ICP–MS, along with this simplified 100% method, is practical for the quantification of minor–trace elements. Figure 5 also illustrates that the accuracies are not affected by the used internal standards (Mg, Fe, and Si) with GOR132-G as calibrator, which can be interpreted via the similar DHF behaviors of Mg, Fe and Si in GOR132-G and the olivine samples (Figure 1 and ESI Figure S1). Bussweiler et al. [20] reported a detectable laser-induced inter-element fractionation (e.g., Na, Zn, Ni, Co and P) between olivine and commonly used silicate glass calibration materials (NIST SRM 612, GSD-1G and BHVO-2G) using a laser spot size smaller than 100 µm. Here, we evaluated the laser-induced inter-element fractionation between GOR132-G and olivine samples. Figure 6 plots the fractionation factors (FI, as proposed by Fryer et al. [43]) of GOR132-G, MongOLSh11-2 and XEN olivines. Fractionation factors describe the degree of fractionation during ablation of a given isotope relative to an internal standard (25Mg, 56Fe and 29Si). The observed FIs for the investigated elements are in the range of 0.9 to 1.1. Importantly, the trends of the FIs for individual elements (except for Zn) are very similar (within 10%) for GOR132-G, MongOLSh11-2 and XEN, indicating the negligible laser-induced bias between GOR132-G glass and olivine samples. Compared with NIST SRM 612, the chemical composition of GOR132-G glass is more similar to olivine, which likely minimizes the laser-induced inter-element fractionations, and thus reduces the matrix effects. ESI Figure S2 compares the results for the Fo content and minor–trace elements of one Lijiang olivine quantified using GOR132-G and MongOLSh11-2 as calibration standards. The results show that the data calibrated by GOR132-G match with the data by MongOLSh11-2 within 10%, except for Li, Na, P, Zn and Ga.
Large variations for Li, Na and Ga are mainly attributed to their low concentrations, which are close to the LODs (Figure 5c). The results for these elements can be improved with a longer dwell time (e.g., 30 ms). The results for P in MongOLSh11-2 are systematically higher than the recommended value (Figure 5a), which may be related to the interference of 30Si1H on 31P. We have investigated this issue using the SF–ICP–MS middle resolution, and the results indicate that the effect of 30Si1H on 31P is limited and can be ignored. Instead, The P value in GOR132-G is given as the information value with an uncertainty of 33% [32], which may be attributed to this offset. Due to the persistence of this offset in all six analytical sessions, a bias factor (1.38) derived from the MongOLSh 11-2 was used to correct the P data from XEN and the other olivine samples. Table 2 shows that the corrected P result for XEN (42.6 ± 12.2 μg/g) agrees well with the value from the literature (37.0 ± 2.0 μg/g), obtained by LA–ICP–MS [21].
Three Zn isotopes have potential overlaps between Mg or Si: 24Mg40Ar+ on 64Zn+, 26Mg40Ar+ on 66Zn+, and 28Si40Ar+ on 68Zn+. De Hoog et al. [7] recommended the use of 66Zn, because their tests showed only limited formation of 26Mg40Ar+ in the plasma. Foley et al. [17] suggested using the 67Zn isotope because it is free of interferences from argides of the major element Si, Mg and Fe, whereas the 67Zn isotope has only a 4% abundance. In this study, the Zn data for MongOLSh11-2, calculated from 64Zn, 66Zn and 67Zn, are 104.1 μg/g, 71.0 μg/g and 64.0 μg/g, respectively. The data from 67Zn is the closest one to the recommended value (56.3 ± 4.6 μg/g1), indicating 67Zn is preferable for Zn quantification. However, even using the 67Zn isotope, the Zn data for MongOLSh11-2 are still systematically high, by 8–15%, which is probably related to the DHF effect between volatile the Zn and refractory Mg. MongOLSh11-2 exhibits greater DHF compared with GOR132-G (Figure 6). A bias factor (1.10) derived from the MongOLSh 11-2 analysis was used to correct the Zn data for XEN and other olivine samples. The corrected Zn result for XEN is in agreement with the recommended value (Table 2), demonstrating the robustness of this correction. Currently, only a few data have been reported for XEN. Table 2 summarizes the major and minor–trace elements data using LA–ICP–MS. This data may be useful for the certification of XEN.

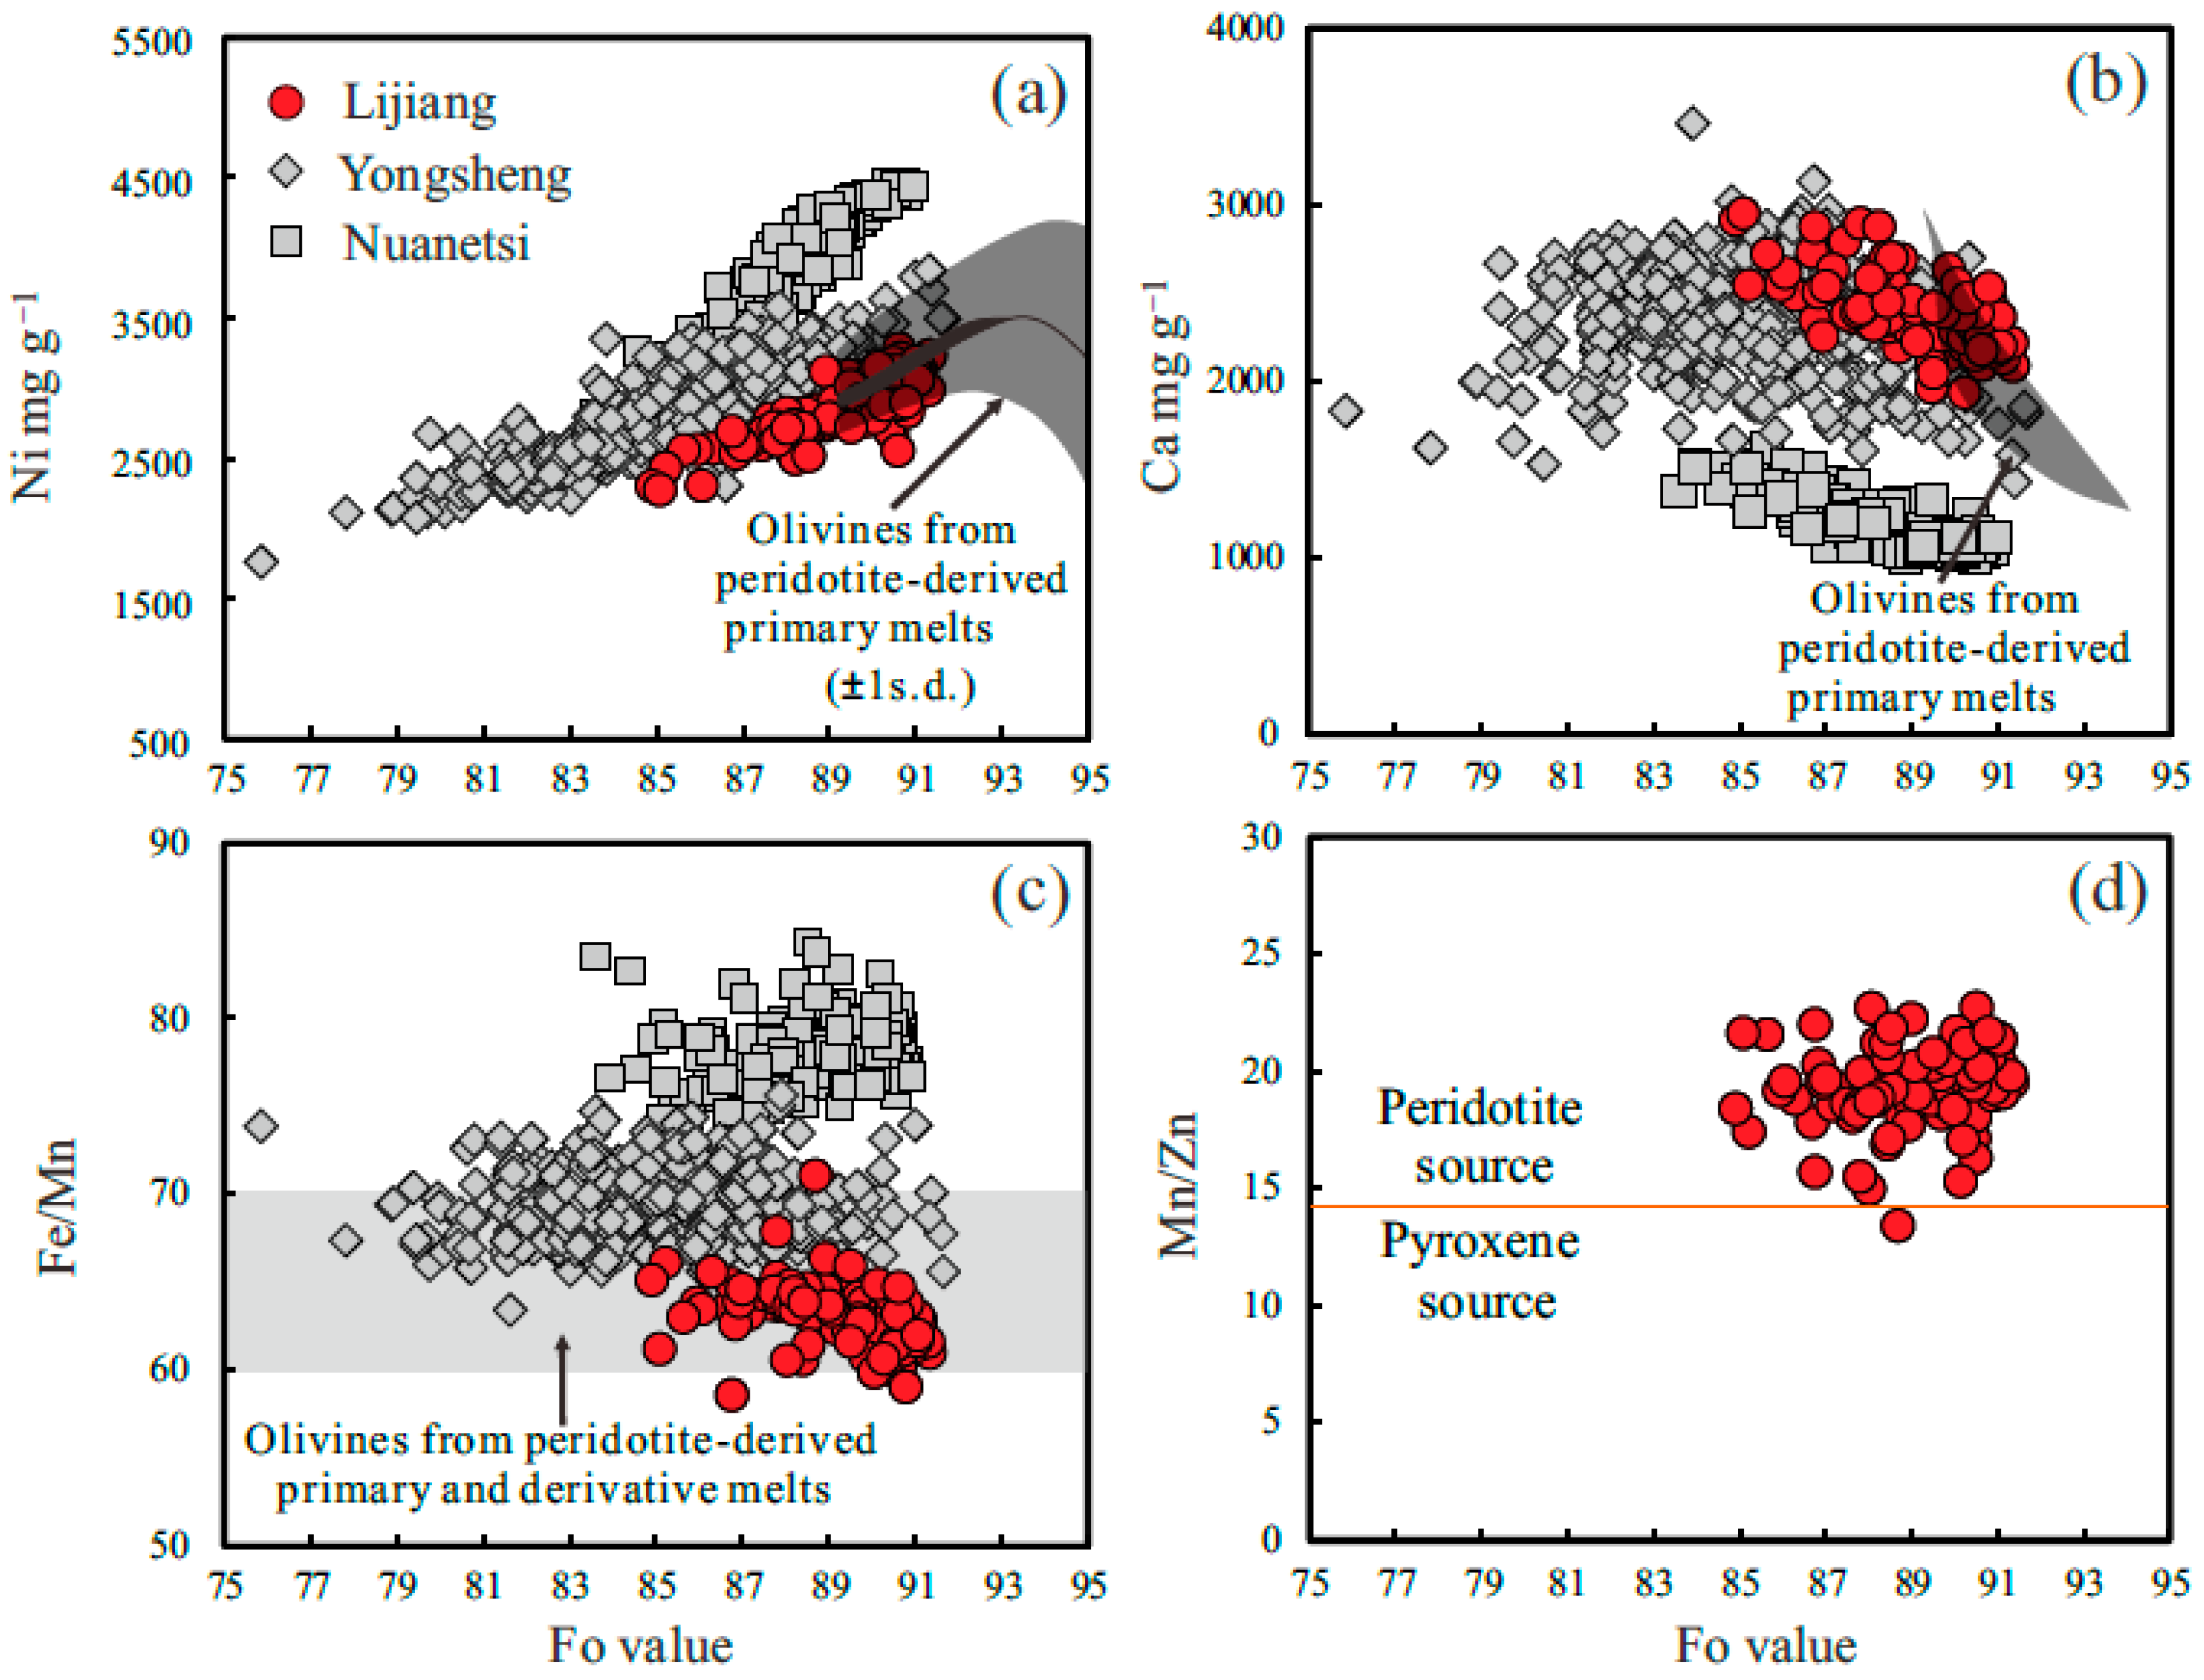
3.4. Olivine Phenocrysts in the Lijiang Picrites from the Emeishan Large Igneous Province

Using the LA–ICP–MS technique and the simplified 100% approach, we analyzed olivine phenocrysts in the Lijiang picrites from the Emeishan LIP. The picrites have high Ti/Y ratios (Ti/Y = 650) and are belong to high-Ti-type rocks (Ti/Y > 500) [48]. These olivine compositions were also compared with those from other high-Ti picrites (Yongsheng picrites [49], Emeishan LIP, with Ti/Y = 782, and Nuanetsi picrites [50], Karoo LIP, with Ti/Y = 650). Olivines from the Lijiang picrites have relatively low Ni contents and Fe/Mn ratios, and high Ca contents, consistent with the olivines that crystallize from peridotite-derived melts (Figure 7). These features, combined with the high Mn/Zn ratios [51] of the Lijiang olivines, indicate derivation from a peridotite source. In contrast, olivines from the Yongsheng and Nuanetsi picrites have systematically higher Ni contents and Fe/Mn ratios, and lower Ca contents, than those from the Lijiang picrites, which indicates the involvement of a pyroxenite component in their mantle sources (Figure 7). The different olivine compositions observed in these picrites require multiple mantle sources for high-Ti picrites, as proposed by Kamenetsky et al. [51].

3.5. Advantages and Limitations

Compared with HP-EPMA, the main advantage of the LA–ICP–MS technique is the low LODs. For most trace elements, the LODs are < 0.1 μg/g (Figure 5c). This provides more reliable data for elements with concentrations near to or below the LODs of HP–EPMA (ca. 10 μg/g). This is particularly important for some incompatible elements (e.g., Sc and Y). Another advantage is the high sample throughput. Routinely, a single spot can be analyzed in 2 min, which is much faster than HP-EPMA (>15 min per spot analysis). As such, this technique is suitable for analyzing a large number of samples; for example, in the field of diamond indicator mineral research, where tens of thousands of olivines need to be analyzed. However, LA–ICP–MS has a spatial resolution of 15–100 µm, which limits its application to fine-grained olivine (<15 µm), and/or compositional zonation crystals, or the small-size olivine inclusions in host minerals. However, LA–ICP–MS with this simplified 100% strategy is robust, and may have a wide range of applications in the field of olivine geochemistry.

4. Conclusions

In this study, we demonstrate that LA–ICP–MS is a suitable technique for the routine, in situ, simultaneous determination of Fo contents and minor–trace element contents in olivine. The robustness and usefulness of this technique were validated by analyzing a well-characterized olivine RM (MongOLSh 11-2) and an internal olivine RM (XEN), and further verified by analysis of a large suite of natural olivines (N = 154) with a wide range of Fo contents (81–93). The accuracy and precision of the Fo contents obtained by LA–ICP–MS are comparable to those obtained by conventional EPMA.
For minor–trace elements, most results are in agreement with the recommended values given to the analytical uncertainties, apart from P and Zn data. A bias factor derived from analyses of MongOLSh11-2 needs to be corrected for other olivine samples. We also demonstrate that GOR132-G is a suitable calibration material for the quantification of Fo contents and minor–trace elements in olivine. This technique was initially applied to olivine phenocrysts in the Lijiang picrites from the Emeishan LIP, which showed that these rocks have a peridotitic mantle source. LA–ICP–MS with this simplified 100% method, for the simultaneous determination of Fo contents and minor–trace elements, has the advantage of low LODs, a high sample throughput, and is simple to undertake. Thus, it may have a wide range of applications in the field of olivine geochemistry, particularly for the field where tens of thousands of olivines need to be analyzed.

Supplementary Materials

The following are available online at https://www.mdpi.com/2075-163X/10/7/634/s1, ESI1: Details of EPMA analysis; Table S1: Reference values for GOR132-G glass; Figure S1: Comparison of down-hole fractionation of 29Si/25Mg ratios in GOR132-G and MongOL Sh11-2; Figure S2: Results of Fo contents and minor–trace element in one Lijiang olivine quantified using GOR132-G and MongOLSh11-2 as calibration standards. ESI2: Table S2: Data of Fo content and minor–trace elements of MongOL Sh11-2 and XEN from six sessions. ESI3: The programmed Iolite DRS code for the simplified 100% strategy.

Author Contributions

Conceptualization, S.W.; methodology, Y.W.; formal analysis, Y.Y., H.W., C.H., L.X., J.Y.; writing—original draft preparation, S.W. and Y.W.; writing—review and editing, S.W. and Y.W. All authors have read and agreed to the published version of the manuscript.

Funding

This research was funded by the open funding of the State Key Laboratory of Lithospheric Evolution (No. SKL-K201805), National Natural Science Foundation of China (Nos. 41903024 and 41525012), China Postdoctoral Science Foundation (2020M670450) and National Key R&D Program of China (2018YFA0702602).

Acknowledgments

We thank Bin Wu for assistance with EPMA analyses. Valentina G. Batanova is thanked for kindly providing us with the MongOLSh11-2 and XEN olivine reference materials. Klaus Peter Jochum is thanked for providing the GOR132-G glass reference material. Aaron Stallard is thanked for the polishing of language.

Conflicts of Interest

The authors declare no conflict of interest. The funders had no role in the design of the study; in the collection, analyses or interpretation of data; in the writing of the manuscript, or in the decision to publish the results.

References

  1. Foley, S.F.; Prelevic, D.; Rehfeldt, T.; Jacob, D.E. Minor and trace elements in olivines as probes into early igneous and mantle melting processes. Earth Planet. Sci. Lett. 2013, 363, 181–191. [Google Scholar] [CrossRef]
  2. Sobolev, A.V.; Hofmann, A.W.; Sobolev, S.V.; Nikogosian, I.K. An olivine-free mantle source of Hawaiian shield basalts. Nature 2005, 434, 590–597. [Google Scholar] [CrossRef] [PubMed]
  3. Sobolev, A.V.; Hofmann, A.W.; Kuzmin, D.V.; Yaxley, G.M.; Arndt, N.T.; Chung, S.-L.; Danyushevsky, L.V.; Elliott, T.; Frey, F.A.; Garcia, M.O. The amount of recycled crust in sources of mantle-derived melts. Science 2007, 316, 412–417. [Google Scholar] [CrossRef]
  4. Stead, C.V.; Tomlinson, E.L.; Kamber, B.S.; Babechuk, M.G.; McKenna, C.A. Rare Earth Element Determination in Olivine by Laser Ablation-Quadrupole-ICP-MS: An Analytical Strategy and Applications. Geostand. Geoanalytical Res. 2017, 41, 197–212. [Google Scholar] [CrossRef] [Green Version]
  5. Putirka, K.D.; Perfit, M.; Ryerson, F.; Jackson, M.G. Ambient and excess mantle temperatures, olivine thermometry, and active vs. passive upwelling. Chem. Geol. 2007, 241, 177–206. [Google Scholar] [CrossRef] [Green Version]
  6. Herzberg, C. Basalts as temperature probes of Earth’s mantle. Geology. 2011, 39, 1179–1180. [Google Scholar] [CrossRef] [Green Version]
  7. De Hoog, J.C.; Gall, L.; Cornell, D.H. Trace-element geochemistry of mantle olivine and application to mantle petrogenesis and geothermobarometry. Chemical Geol. 2010, 270, 196–215. [Google Scholar] [CrossRef] [Green Version]
  8. Le Roux, V.; Lee, C.T.A.; Turner, S.J. Zn/Fe systematics in mafic and ultramafic systems: Implications for detecting major element heterogeneities in the Earth’s mantle. Geochim. Cosmochim. Acta 2010, 74, 2779–2796. [Google Scholar] [CrossRef]
  9. Li, C.; Ripley, E.M. The relative effects of composition and temperature on olivine-liquid Ni partitioning: Statistical deconvolution and implications for petrologic modeling. Chem. Geol. 2010, 275, 99–104. [Google Scholar] [CrossRef]
  10. Herzberg, C.; Vidito, C.; Starkey, N.A. Nickel–cobalt contents of olivine record origins of mantle peridotite and related rocks. Am. Miner. 2016, 101, 1952–1966. [Google Scholar] [CrossRef]
  11. Lynn, K.J.; Shea, T.; Garcia, M.O. Nickel variability in Hawaiian olivine: Evaluating the relative contributions from mantle and crustal processes. Am. Miner. 2017, 102, 507–518. [Google Scholar] [CrossRef]
  12. Wan, Z.; Coogan, L.A.; Canil, D. Experimental calibration of aluminum partitioning between olivine and spinel as a geothermometer. Am. Miner. 2008, 93, 1142–1147. [Google Scholar] [CrossRef]
  13. Mallmann, G.; O’Neill, H.S.C. Calibration of an Empirical Thermometer and Oxybarometer based on the Partitioning of Sc, Y and V between Olivine and Silicate Melt. J. Petrol. 2013, 54, 933–949. [Google Scholar] [CrossRef] [Green Version]
  14. Coogan, L.; Saunders, A.; Wilson, R. Aluminum-in-olivine thermometry of primitive basalts: Evidence of an anomalously hot mantle source for large igneous provinces. Chem. Geol. 2014, 368, 1–10. [Google Scholar] [CrossRef]
  15. Gavrilenko, M.; Herzberg, C.; Vidito, C.; Carr, M.J.; Tenner, T.; Ozerov, A. A Calcium-in-Olivine Geohygrometer and its Application to Subduction Zone Magmatism. J. Petrol. 2016, 57, 1811–1832. [Google Scholar] [CrossRef]
  16. Mallmann, G.; O’Neill, H.S.C. The Crystal/Melt Partitioning of V during Mantle Melting as a Function of Oxygen Fugacity Compared with some other Elements (Al, P, Ca, Sc, Ti, Cr, Fe, Ga, Y., Zr and Nb). J. Petrol. 2009, 50, 1765–1794. [Google Scholar] [CrossRef]
  17. Foley, S.F.; Jacob, D.E.; O’Neill, H.S.C. Trace element variations in olivine phenocrysts from Ugandan potassic rocks as clues to the chemical characteristics of parental magmas. Contrib. Mineral. Petrol. 2011, 162, 1–20. [Google Scholar] [CrossRef]
  18. Eggins, S.M.; Rudnick, R.L.; McDonough, W.F. The composition of peridotites and their minerals: A laser-ablation ICP–MS study. Earth Planet. Sci. Lett. 1998, 154, 53–71. [Google Scholar] [CrossRef]
  19. Jeffries, T.; Perkins, W.; Pearce, N. Measurements of trace elements in basalts and their phenocrysts by laser probe microanalysis inductively coupled plasma mass spectrometry (LPMA-ICP-MS). Chem. Geol. 1995, 121, 131–144. [Google Scholar] [CrossRef]
  20. Bussweiler, Y.; Giuliani, A.; Greig, A.; Kjarsgaard, B.; Petts, D.; Jackson, S.; Barrett, N.; Luo, Y.; Pearson, D. Trace element analysis of high-Mg olivine by LA-ICP-MS–Characterization of natural olivine standards for matrix-matched calibration and application to mantle peridotites. Chem. Geol. 2019, 524, 136–157. [Google Scholar] [CrossRef]
  21. Batanova, V.G.; Sobolev, A.V.; Kuzmin, D.V. Trace element analysis of olivine: High precision analytical method for JEOL JXA-8230 electron probe microanalyser. Chem. Geol. 2015, 419, 149–157. [Google Scholar] [CrossRef]
  22. Su, B.; Chen, Y.; Mao, Q.; Zhang, D.; Jia, L.-H.; Guo, S. Minor elements in olivine inspect the petrogenesis of orogenic peridotites. Lithos. 2019, 344, 207–216. [Google Scholar] [CrossRef]
  23. Jercinovic, M.J.; Williams, M.L. Analytical perils (and progress) in electron microprobe trace element analysis applied to geochronology: Background acquisition, interferences, and beam irradiation effects. Am. Mineral. 2005, 90, 526–546. [Google Scholar] [CrossRef]
  24. Donovan, J.J.; Lowers, H.A.; Rusk, B.G. Improved electron probe microanalysis of trace elements in quartz. Am. Mineral. 2011, 96, 274–282. [Google Scholar] [CrossRef]
  25. Sylvester, P.J.; Jackson, S.E. A Brief History of Laser Ablation Inductively Coupled Plasma Mass Spectrometry (LA–ICP–MS). Elem. 2016, 12, 307–310. [Google Scholar] [CrossRef]
  26. Liu, Y.S.; Hu, Z.C.; Gao, S.; Gunther, D.; Xu, J.; Gao, C.G.; Chen, H.H. In situ analysis of major and trace elements of anhydrous minerals by LA-ICP-MS without applying an internal standard. Chem. Geol. 2008, 257, 34–43. [Google Scholar]
  27. Humayun, M.; Davis, F.A.; Hirschmann, M.M. Major element analysis of natural silicates by laser ablation ICP-MS. J. Anal. At. Spectrom. 2010, 25, 998–1005. [Google Scholar] [CrossRef]
  28. Gagnon, J.E.; Fryer, B.J.; Samson, I.M.; Williams-Jones, A.E. Quantitative analysis of silicate certified reference materials by LA-ICPMS with and without an internal standard. J. Anal. At. Spectrom. 2008, 23, 1529–1537. [Google Scholar] [CrossRef]
  29. Guillong, M.; Hametner, K.; Reusser, E.; Wilson, S.A.; Günther, D. Preliminary Characterisation of New Glass Reference Materials (GSA-1G, GSC-1G, GSD-1G and GSE-1G) by Laser Ablation-Inductively Coupled Plasma-Mass Spectrometry Using 193 nm, 213 nm and 266 nm Wavelengths. Geostand. Geoanalytical Res. 2005, 29, 315–331. [Google Scholar] [CrossRef]
  30. Batanova, V.G.; Thompson, J.M.; Danyushevsky, L.V.; Portnyagin, M.V.; Garbe-Schönberg, D.; Hauri, E.; Kimura, J.-I.; Chang, Q.; Senda, R.R.; Goemann, R.; et al. New Olivine Reference Material for In Situ Microanalysis. Geostand. Geoanalytical Res. 2019, 43, 453–473. [Google Scholar] [CrossRef] [Green Version]
  31. Jochum, K.P.; Dingwell, D.B.; Rocholl, A.; Stoll, B.; Hofmann, A.W.; Becker, S.; Besmehn, A.; Bessette, D.; Dietze, H.J.; Dulski, P. The Preparation and Preliminary Characterisation of Eight Geological MPI--DING Reference Glasses for In-Situ Microanalysis. Geostand. Newsl. 2000, 24, 87–133. [Google Scholar] [CrossRef]
  32. Jochum, K.P.; Stoll, B.; Herwig, K.; Willbold, M.; Hofmann, A.W.; Amini, M.; Aarburg, S.; Abouchami, W.; Hellebrand, E.; Mocek, B.; et al. MPI-DING reference glasses for in situ microanalysis: New reference values for element concentrations and isotope ratios. Geochem. Geophys. Geosyst. 2006, 7, 1–44. [Google Scholar] [CrossRef]
  33. Jochum, K.P.; Nohl, U. Reference materials in geochemistry and environmental research and the GeoReM database. Chem. Geol. 2008, 253, 50–53. [Google Scholar] [CrossRef]
  34. Wu, S.; Karius, V.; Schmidt, B.C.; Simon, K.; Wörner, G. Comparison of Ultrafine Powder Pellet and Flux--free Fusion Glass for Bulk Analysis of Granitoids by Laser Ablation--Inductively Coupled Plasma--Mass Spectrometry. Geostand. Geoanalytical Res. 2018, 42, 575–591. [Google Scholar] [CrossRef]
  35. Wu, S.; Wörner, G.; Jochum, K.P.; Stoll, B.; Simon, K.; Kronz, A. The Preparation and Preliminary Characterisation of Three Synthetic Andesite Reference Glass Materials (ARM-1, ARM-2, ARM-3) for In Situ Microanalysis. Geostand. Geoanalytical Res. 2019, 43, 567–584. [Google Scholar] [CrossRef] [Green Version]
  36. Eggins, S.M.; Kinsley, L.P.J.; Shelley, J.M.G. Deposition and element fractionation processes during atmospheric pressure laser sampling for analysis by ICP-MS. Appl. Surf. Sci. 1998, 127, 278–286. [Google Scholar] [CrossRef]
  37. Günther, D.; Heinrich, C.A. Comparison of the ablation behaviour of 266 nm Nd: YAG and 193 nm ArF excimer lasers for LA-ICP-MS analysis. J. Anal. At. Spectrom. 1999, 14, 1369–1374. [Google Scholar] [CrossRef]
  38. Hu, Z.; Liu, Y.; Gao, S.; Xiao, S.; Zhao, L.; Guenther, D.; Li, M.; Zhang, W.; Zong, K. A “wire” signal smoothing device for laser ablation inductively coupled plasma mass spectrometry analysis. Spectrochim. Acta Part. B-At. Spectrosc. 2012, 78, 50–57. [Google Scholar] [CrossRef]
  39. Hu, Z.; Zhang, W.; Liu, Y.; Gao, S.; Li, M.; Zong, K.; Chen, H.; Hu, S. “Wave” Signal-Smoothing and Mercury-Removing Device for Laser Ablation Quadrupole and Multiple Collector ICPMS Analysis: Application to Lead Isotope Analysis. Anal. Chem. 2015, 87, 1152–1157. [Google Scholar] [CrossRef] [PubMed]
  40. Halicz, L.; Gunther, D. Quantitative analysis of silicates using LA-ICP-MS with liquid calibration. J. Anal. At. Spectrom. 2004, 19, 1539–1545. [Google Scholar] [CrossRef]
  41. Paton, C.; Hellstrom, J.; Paul, B.; Woodhead, J.; Hergt, J. Iolite: Freeware for the visualisation and processing of mass spectrometric data. J. Anal. At. Spectrom. 2011, 26, 2508–2518. [Google Scholar] [CrossRef]
  42. Longerich, H.P.; Jackson, S.E.; Günther, D. Inter-laboratory note. Laser ablation inductively coupled plasma mass spectrometric transient signal data acquisition and analyte concentration calculation. J. Anal. Spectrom. 1996, 11, 899–904. [Google Scholar] [CrossRef]
  43. Fryer, B.J.; Jackson, S.E.; Longerich, H.P. The design, operation and role of the laser-ablation microprobe coupled with an inductively coupled plasma-mass spectrometer (LAM-ICP-MS) in the earth sciences. Can. Mineral. 1995, 33, 303–312. [Google Scholar]
  44. Sylvester, P.J. Matrix effects in laser ablation ICP-MS. Laser Ablation ICP-MS in the Earth Sciences: Current Practices and Outstanding Issues (P. Sylvester, ed.). Mineral. Assoc. Can. Short Course Ser. 2008, 40, 67–78. [Google Scholar]
  45. Horn, I.; Rudnick, R.L.; McDonough, W.F. Precise elemental and isotope ratio determination by simultaneous solution nebulization and laser ablation-ICP-MS: Application to U–Pb geochronology. Chem. Geol. 2000, 164, 281–301. [Google Scholar] [CrossRef]
  46. Paton, C.; Woodhead, J.D.; Hellstrom, J.C.; Hergt, J.M.; Greig, A.; Maas, R. Improved laser ablation U--Pb zircon geochronology through robust downhole fractionation correction. Geochem. Geophys. Geosystems. 2010, 11, 1–36. [Google Scholar] [CrossRef]
  47. Jochum, K.P.; Scholz, D.; Stoll, B.; Weis, U.; Wilson, S.A.; Yang, Q.C.; Schwalb, A.; Borner, N.; Jacob, D.E.; Andreae, M.O. Accurate trace element analysis of speleothems and biogenic calcium carbonates by LA-ICP-MS. Chem. Geol. 2012, 318, 31–44. [Google Scholar] [CrossRef]
  48. Xu, Y.; Chung, S.-L.; Jahn, B.-M.; Wu, G. Petrologic and geochemical constraints on the petrogenesis of Permian–Triassic Emeishan flood basalts in southwestern China. Lithos. 2001, 58, 145–168. [Google Scholar] [CrossRef]
  49. Kamenetsky, V.S.; Chung, S.-L.; Kamenetsky, M.B.; Kuzmin, D.V. Picrites from the Emeishan Large Igneous Province, SW China: A compositional continuum in primitive magmas and their respective mantle sources. J. Petrol. 2012, 53, 2095–2113. [Google Scholar] [CrossRef] [Green Version]
  50. Kamenetsky, V.S.; Maas, R.; Kamenetsky, M.B.; Yaxley, G.M.; Ehrig, K.; Zellmer, G.F.; Bindeman, I.N.; Sobolev, A.V.; Kuzmin, D.V.; Ivanov, A.V. Multiple mantle sources of continental magmatism: Insights from “high-Ti” picrites of Karoo and other large igneous provinces. Chem. Geol. 2017, 455, 22–31. [Google Scholar] [CrossRef]
  51. Howarth, G.H.; Harris, C. Discriminating between pyroxenite and peridotite sources for continental flood basalts (CFB) in southern Africa using olivine chemistry. Earth Planet. Sci. Lett. 2017, 475, 143–151. [Google Scholar] [CrossRef]
Figure 1. Comparison of down-hole fractionation (DHF) of Fe/Mg in GOR132-G glass and MongOL Sh11-2 olivine. Laser spot size is 44 μm. In order to compare at the same scale, the 57Fe/25Mg ratios are normalized to the mean value of the initial two seconds. The observed large scatter of 57Fe/25Mg ratios in GOR132-G glass is mainly attributed to the relatively low concentrations of Fe and Mg.
Minerals 10 00634 g001
Figure 2. (a) Precision of Fe/Mg ratio as a function of 57Fe intensity. The sample shown here is MngOL Sh11-2 olivine. Precision is given as two times the relative standard error (RSE), which is automatically exported by the Iolite software. The grey zone represents the precision in a range of 1–2%. The detector is set in triple mode. The analogue mode was tripped for 57Fe and 25Mg with spot sizes of 32, 44 and 60 μm. The counting mode was tripped for 57Fe, and the analogue mode was tripped for 25Mg, with spot sizes of 10, 16 and 24 μm. (b) Simulated uncertainty of Fo value is plotted as a function of laser spot sizes (10, 16, 24, 32, 44 and 60 μm).
Minerals 10 00634 g002
Figure 3. (a) Variability of Fo values obtained for MongOL Sh11-2 over a period of six months (N = 120). The gray zone represents the “Mean ± 2 s”. “Mean ± 2 s” was calculated from 120 repeated analyses. (b) The frequency distribution of Fo values in MongOL Sh11-2.
Minerals 10 00634 g003
Figure 4. Plots of one-to-one lines of Fo values (N = 154) obtained via EPMA and LA–ICP–MS. Samples shown here are the natural olivines present in the Dali, Pingchuan and Lijiang picrites, Emeishan large igneous province (LIP).
Minerals 10 00634 g004
Figure 5. Relative deviations of minor/trace elements in MongOL Sh11-2 (a) and XEN olivine (b). The results were collected from six sessions over a period of six months. Relative deviation is given as the discrepancy (%) from the reference value [(analyzed result-recommended value)/recommended value × 100]. The grey zones are the uncertainties of reference values, which are collected from Batanova et al. (2015) [21] and Batanova et al. (2019) [30]. (c) Plots of element contents in MongOL Sh11-2 and XEN, and the LODs of LA–ICP–MS and HP-EPMA. The LODs of LA-ICP-MS is defined as the detection capability from three times standard deviation of background intensity. The LODs of HP-EPMA was collected from the publication of Batanova et al. (2015) [21].
Minerals 10 00634 g005
Figure 6. Plots of the fractionation factors for GOR132-G, MongOLSh11-2 and XEN olivines. Fractionation factors describe the degree of fractionation during ablation of a given isotope relative to an internal standard (25Mg, 56Fe and 29Si).
Minerals 10 00634 g006
Figure 7. Chemistry of olivine phenocrysts in the Lijiang picrites, Emeishan LIP. Data for olivine from Yongsheng 50 and Nuanetsi picrites 51 are plotted for comparison. (a) Fo value versus Ni (μg/g−1) illustrating Ni depletion in Lijiang olivine relative to Yongsheng and Nuanetsi. (b) Fo value versus Ca (μg/g−1) illustrating Ca enrichment in Lijiang olivine relative to Yongsheng and Nuanetsi. (c) Fo value versus Fe/Mn ratios illustrating lower Fe/Mn ratios in Lijiang olivine relative to Yongsheng and Nuanetsi. (d) Fo value versus Mn/Zn ratios illustrating sources of peridotite-derived melts for Lijiang olivine.
Minerals 10 00634 g007
Table 1. Typical instrument conditions for LA–ICP–MS analyses.
Laser Ablation System
Make, model and typeCoherent, Geolas HD
Ablation cell and volumeCell developed in-house; aerosol dispersion volume of < 3 cm3
Laser wavelength193 nm
Pulse width20 ns
Energy density/fluenceca. 3 J/cm
Repetition rate5 Hz
Spot size44 μm
Sampling mode/patternSingle hole drilling; three cleaning pulses
Ablation gas flowca. 0.75 L/min (He)
Ablation duration40 s
SF–ICP–MS
Make, model and typeThermo Fisher Scientific Element XR
RF power1320 W
Guard electrodeoff
Sample coneNickel Standard
Skimmer coneNickel H
Coolant gas flow (Ar)15.0 L/min
Auxiliary gas flow (Ar)0.80 L/min
Carrier gas flow (Ar)0.95 L/min
Enhancement gas flow (N2)None
Scan modeE-scan
Isotopes measured (m/z) + dwell times7Li, 23Na, 25Mg, 27Al, 29Si, 31P, 43Ca, 45Sc, 49Ti, 51V, 53Cr, 55Mn, 57Fe, 59Co, 60Ni, 63Cu, 67Zn, 69Ga and 89Y; 10 ms for each isotope
Mass window20%
Sample per peak20
Detection systemSingle SEM detector in triple mode (pulse counting, analog and Faraday cup)
Resolution (M/∆M)Low (ca. 300)
Total integration time per reading0.90 s
Table 2. Minor and trace element concentrations in MongOL Sh11-2 and XEN olivine reference materials. Recommended values for MongOL Sh11-2 are from Batanova et al. (2019) [30] and recommended values for XEN are from Batanova et al. (2015) [21]. For XEN, values with superscript “a” and “b” are from LA–ICP–MS and EPMA, respectively. “-” = below the detection limit “*” = corrected results using a bias factor. “S.D.” = standard deviation.
MongOL Sh11-2XEN
Recommended ValuesThis Study (N = 120)Recommended ValuesThis Study (N = 98)
Mass Fraction
(μg/g)
2 S.D.
(μg/g)
Mean
(μg/g)
2 S.D.
(μg/g)
Mass Fraction
(μg/g)
2 S.D.
(μg/g)
Mean
(μg/g)
2 S.D.
(μg/g)
Li2.180.401.560.30--1.210.34
Na130241012615 b15 b--
Al245342661446.0 a/43.0 b6.0 a/8.0 b43.44.0
P66.420--37.0 a/17.0 b2.0 a/5.0 b42.6*12.2
Ca6885970632246 a/239 b19 a/7 b25210
Sc3.400.203.390.10--2.030.14
Ti40.26.041.71.311.0 a/10.0 b1.0 a/4.0 b10.81.1
V5.50.55.20.1--1.870.16
Cr1259123540.0 b5.0 b40.01.7
Mn1119471133331043 a/1032 b15 a/6 b105034
Co148121393145 a/149 b2 a/8 b1356
Ni2822872717573166 a/3132 b55 a/31 b299563
Cu1.130.181.090.06--0.590.06
Zn56.34.6--44.0 a/43.0 b2.0 a/6.0 b41.0*3.2*
Ga0.100.020.120.02--0.0600.060
Y0.0790.0140.0740.005--0.0300.030

