Effect of Ultrasound on the Oxidative Copper Leaching from Chalcopyrite in Acidic Ferric Sulfate Media


Abstract
:1. Introduction
2. Experimental
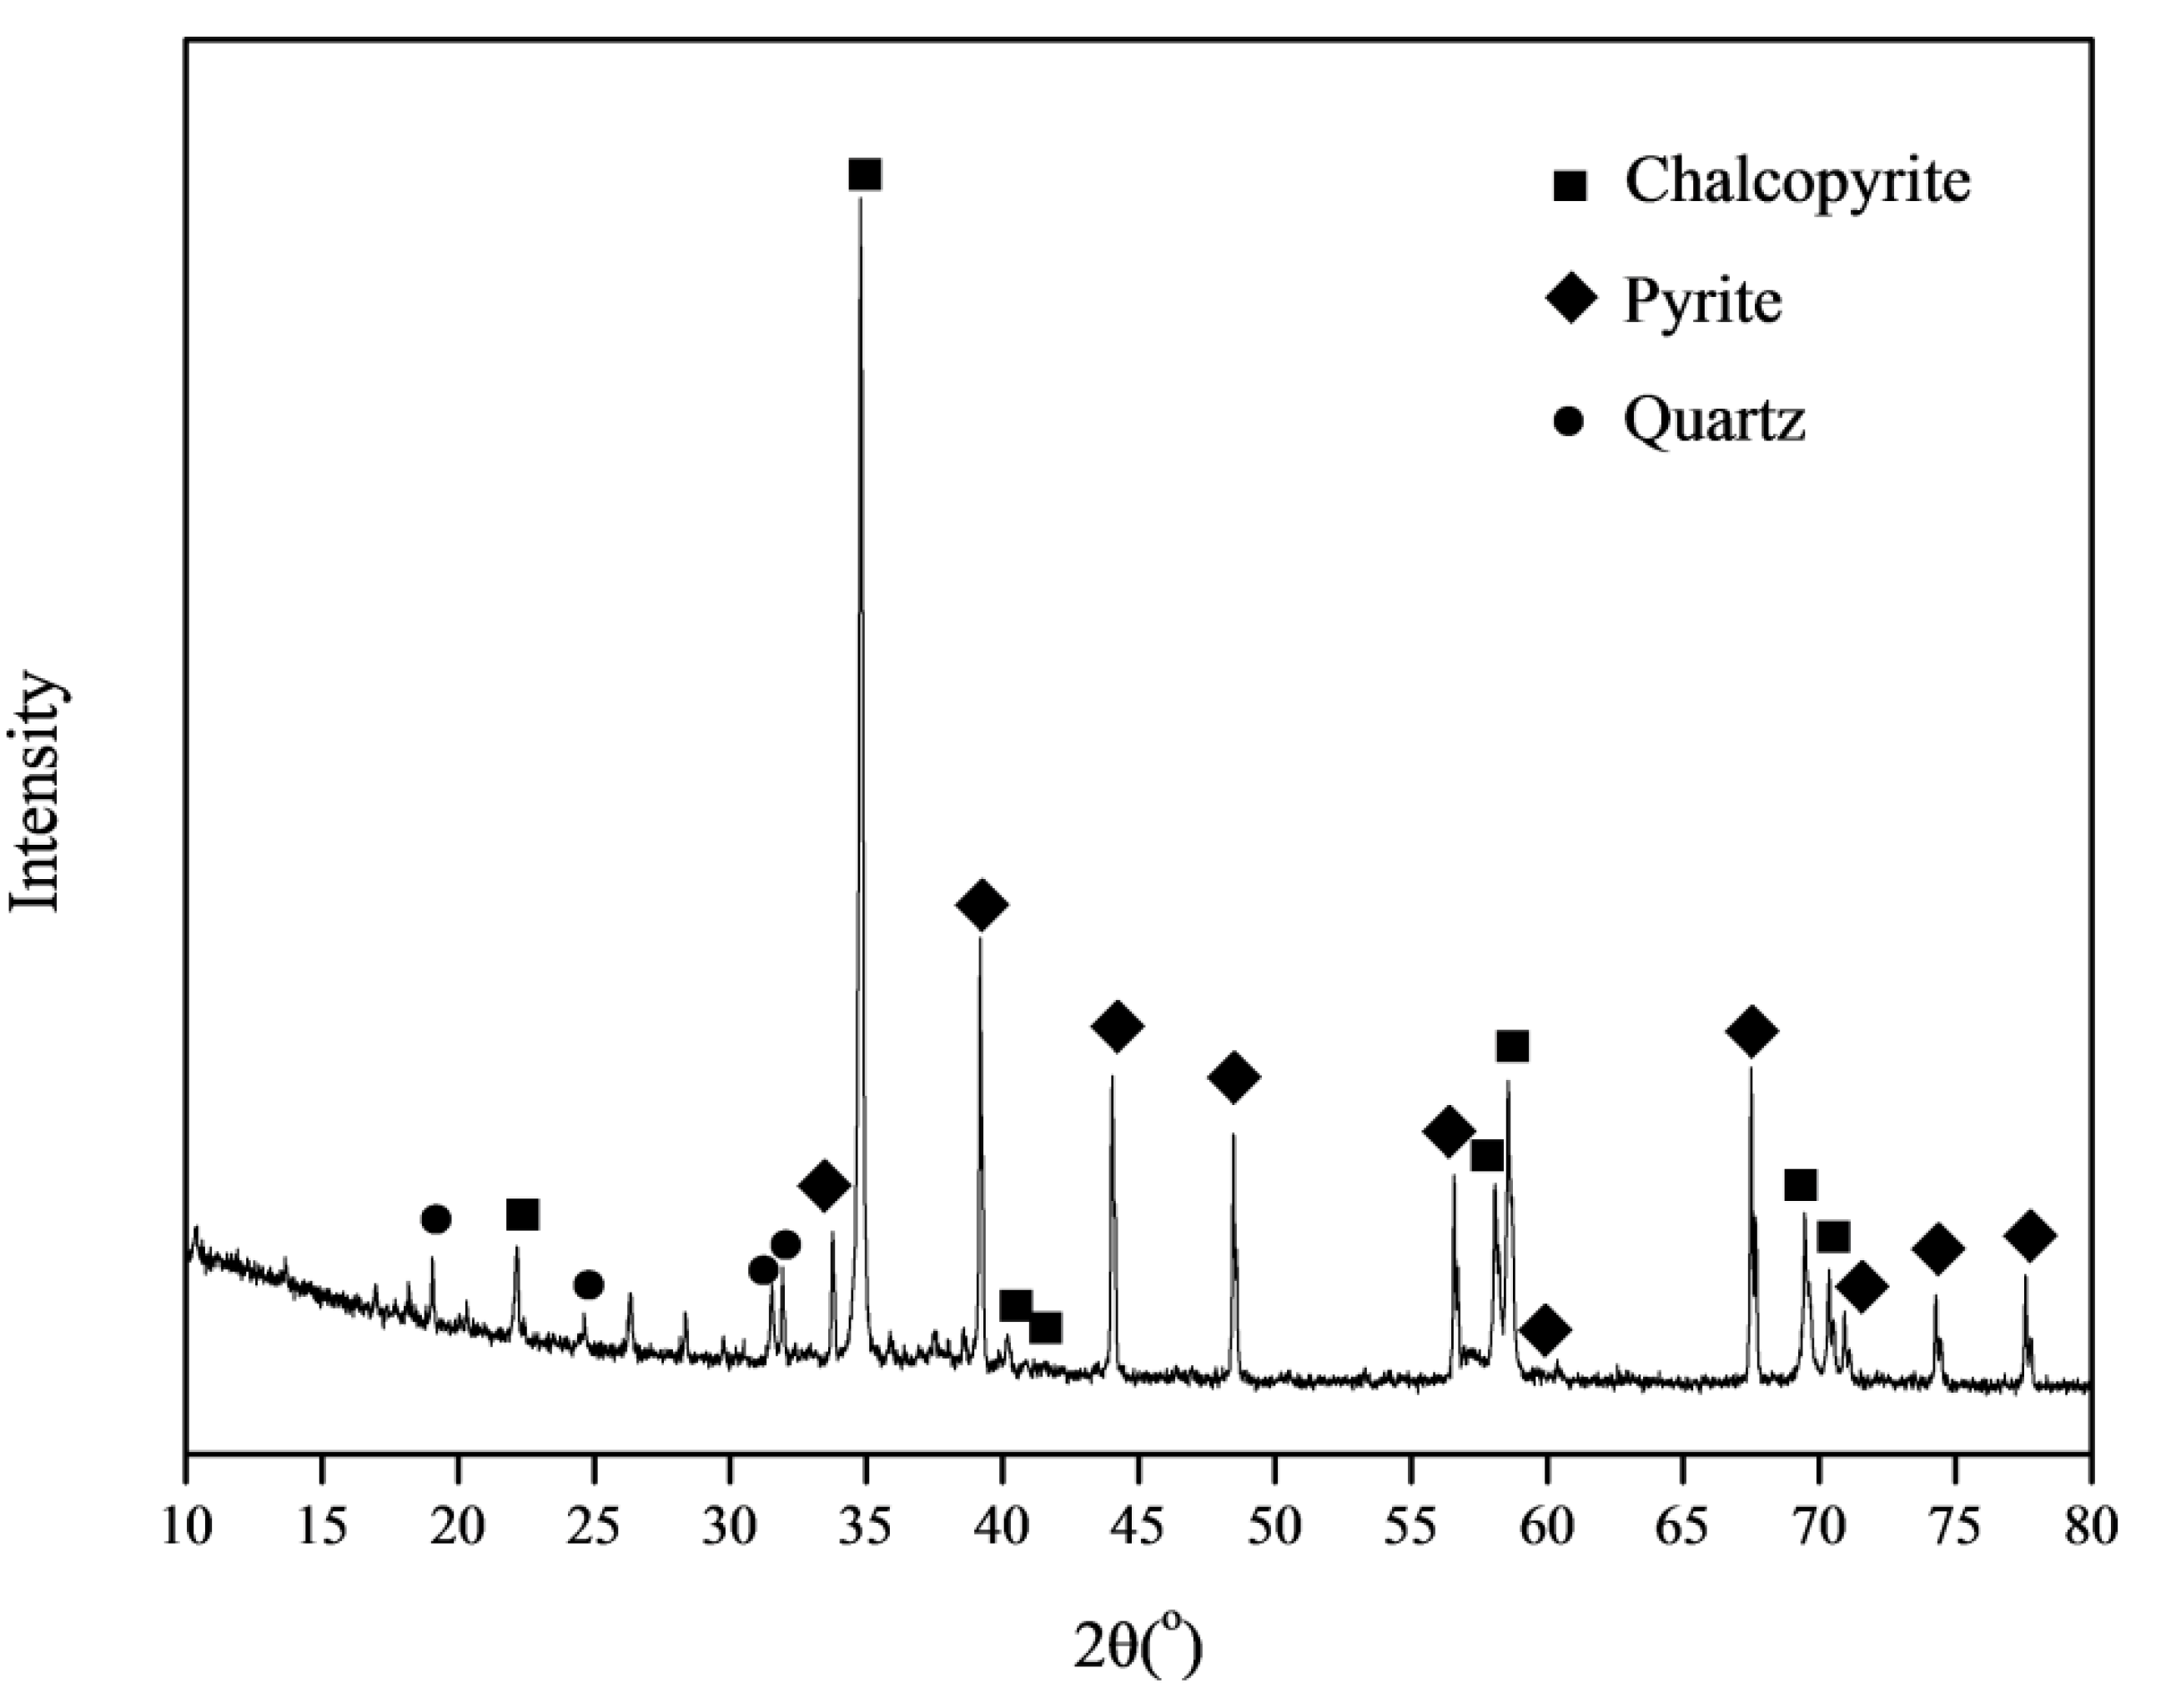
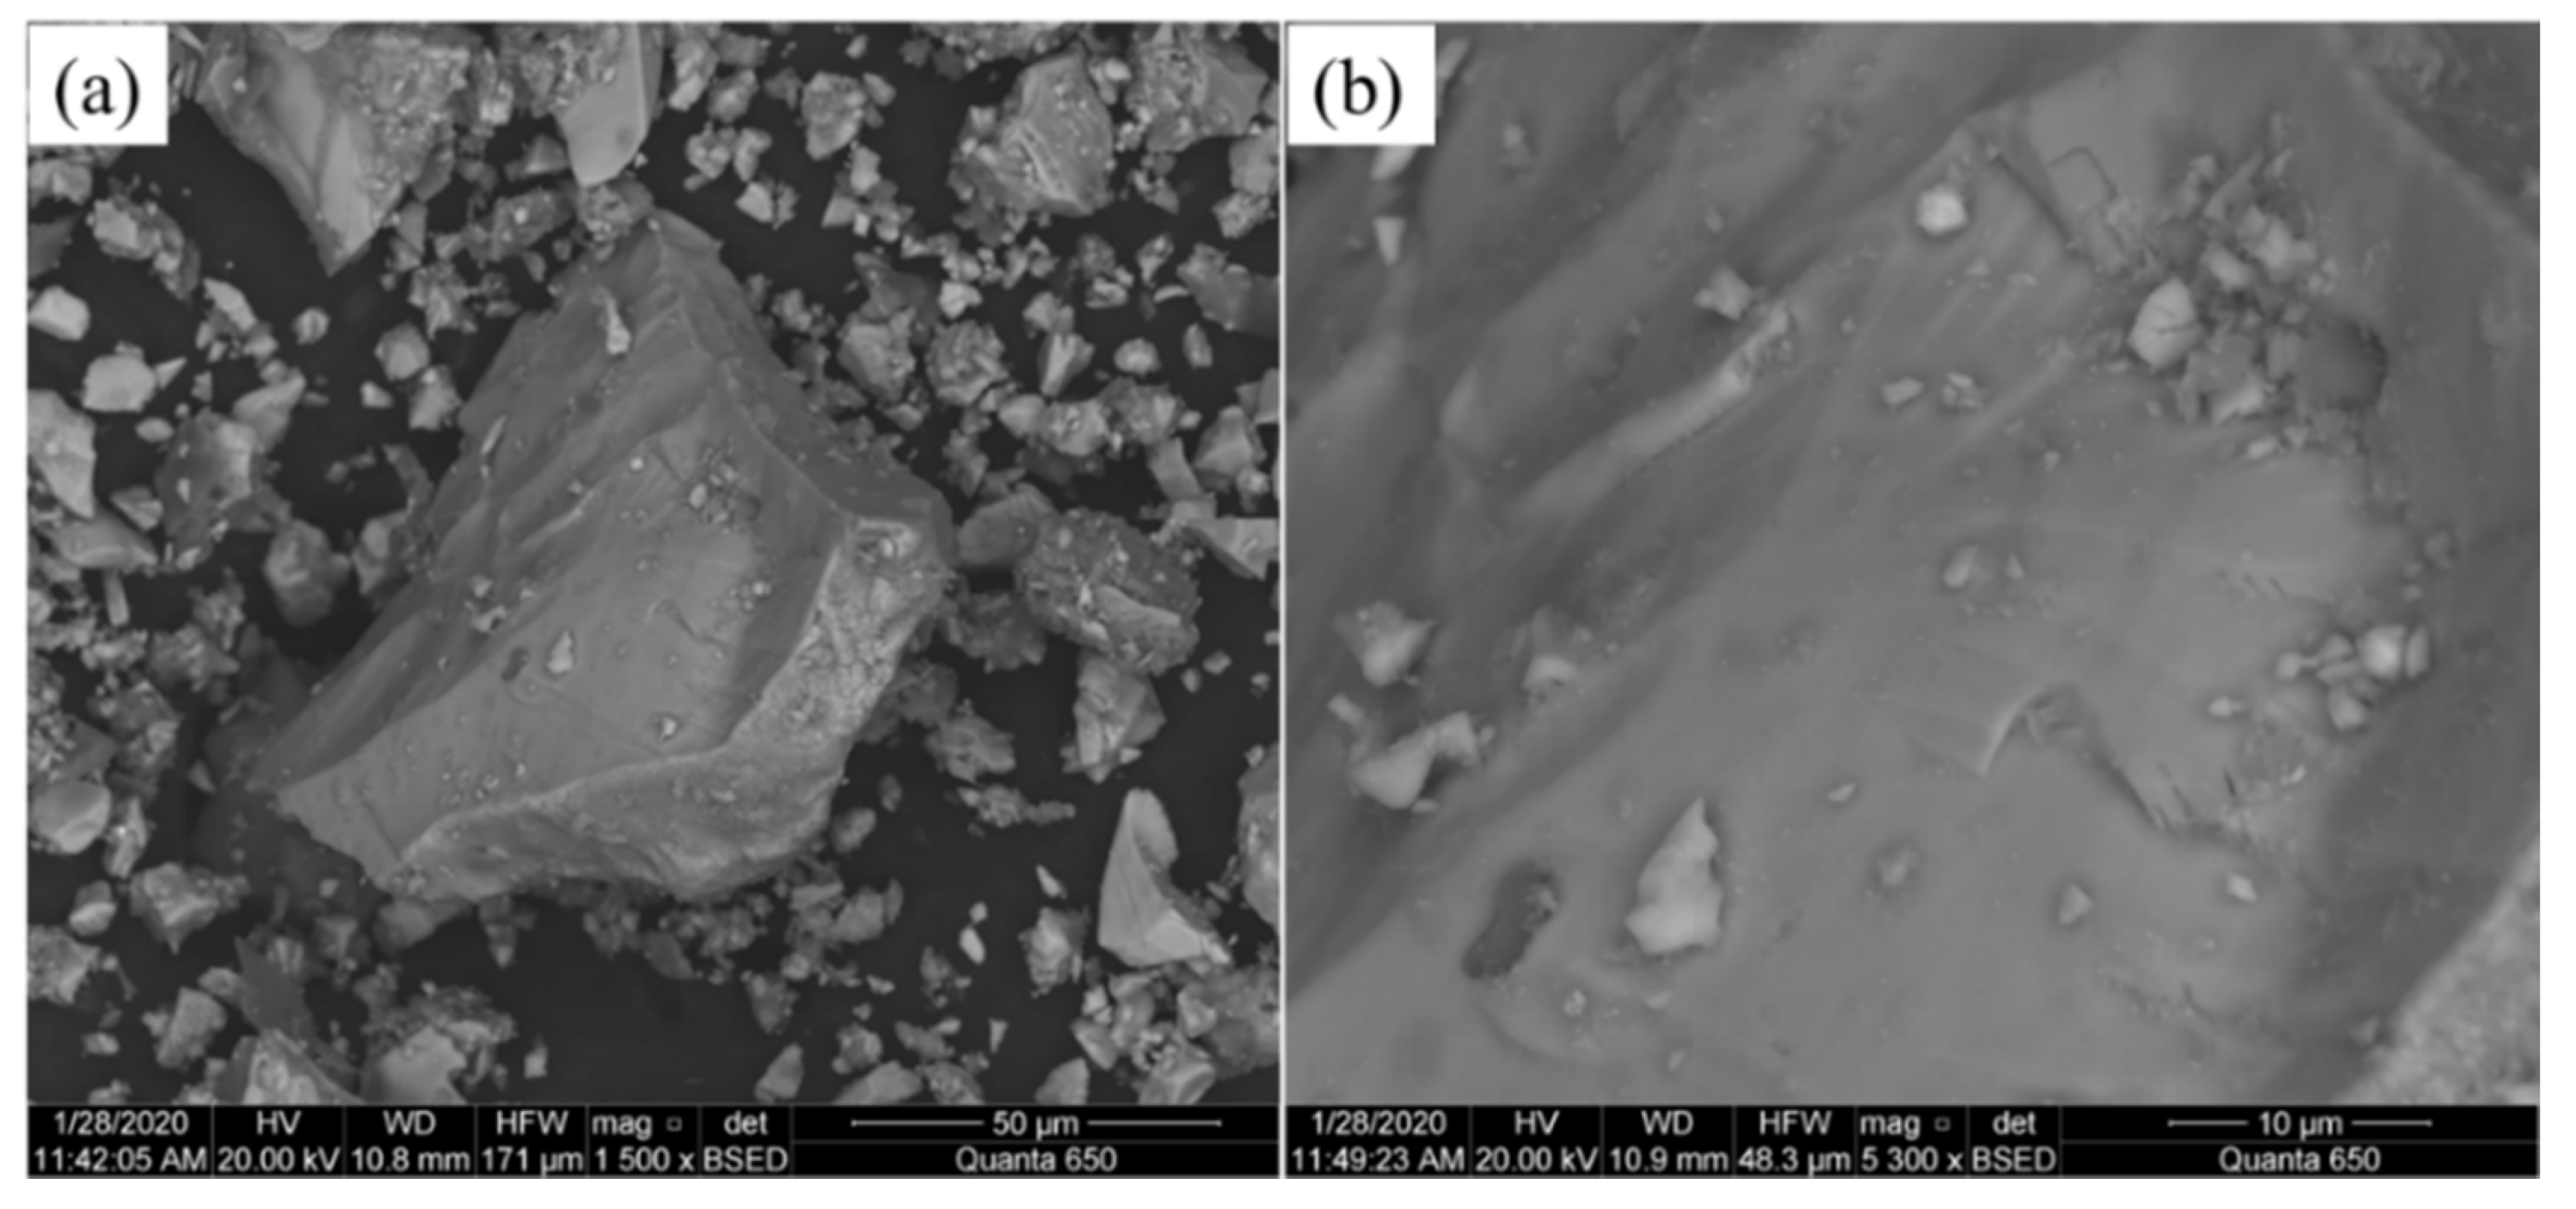
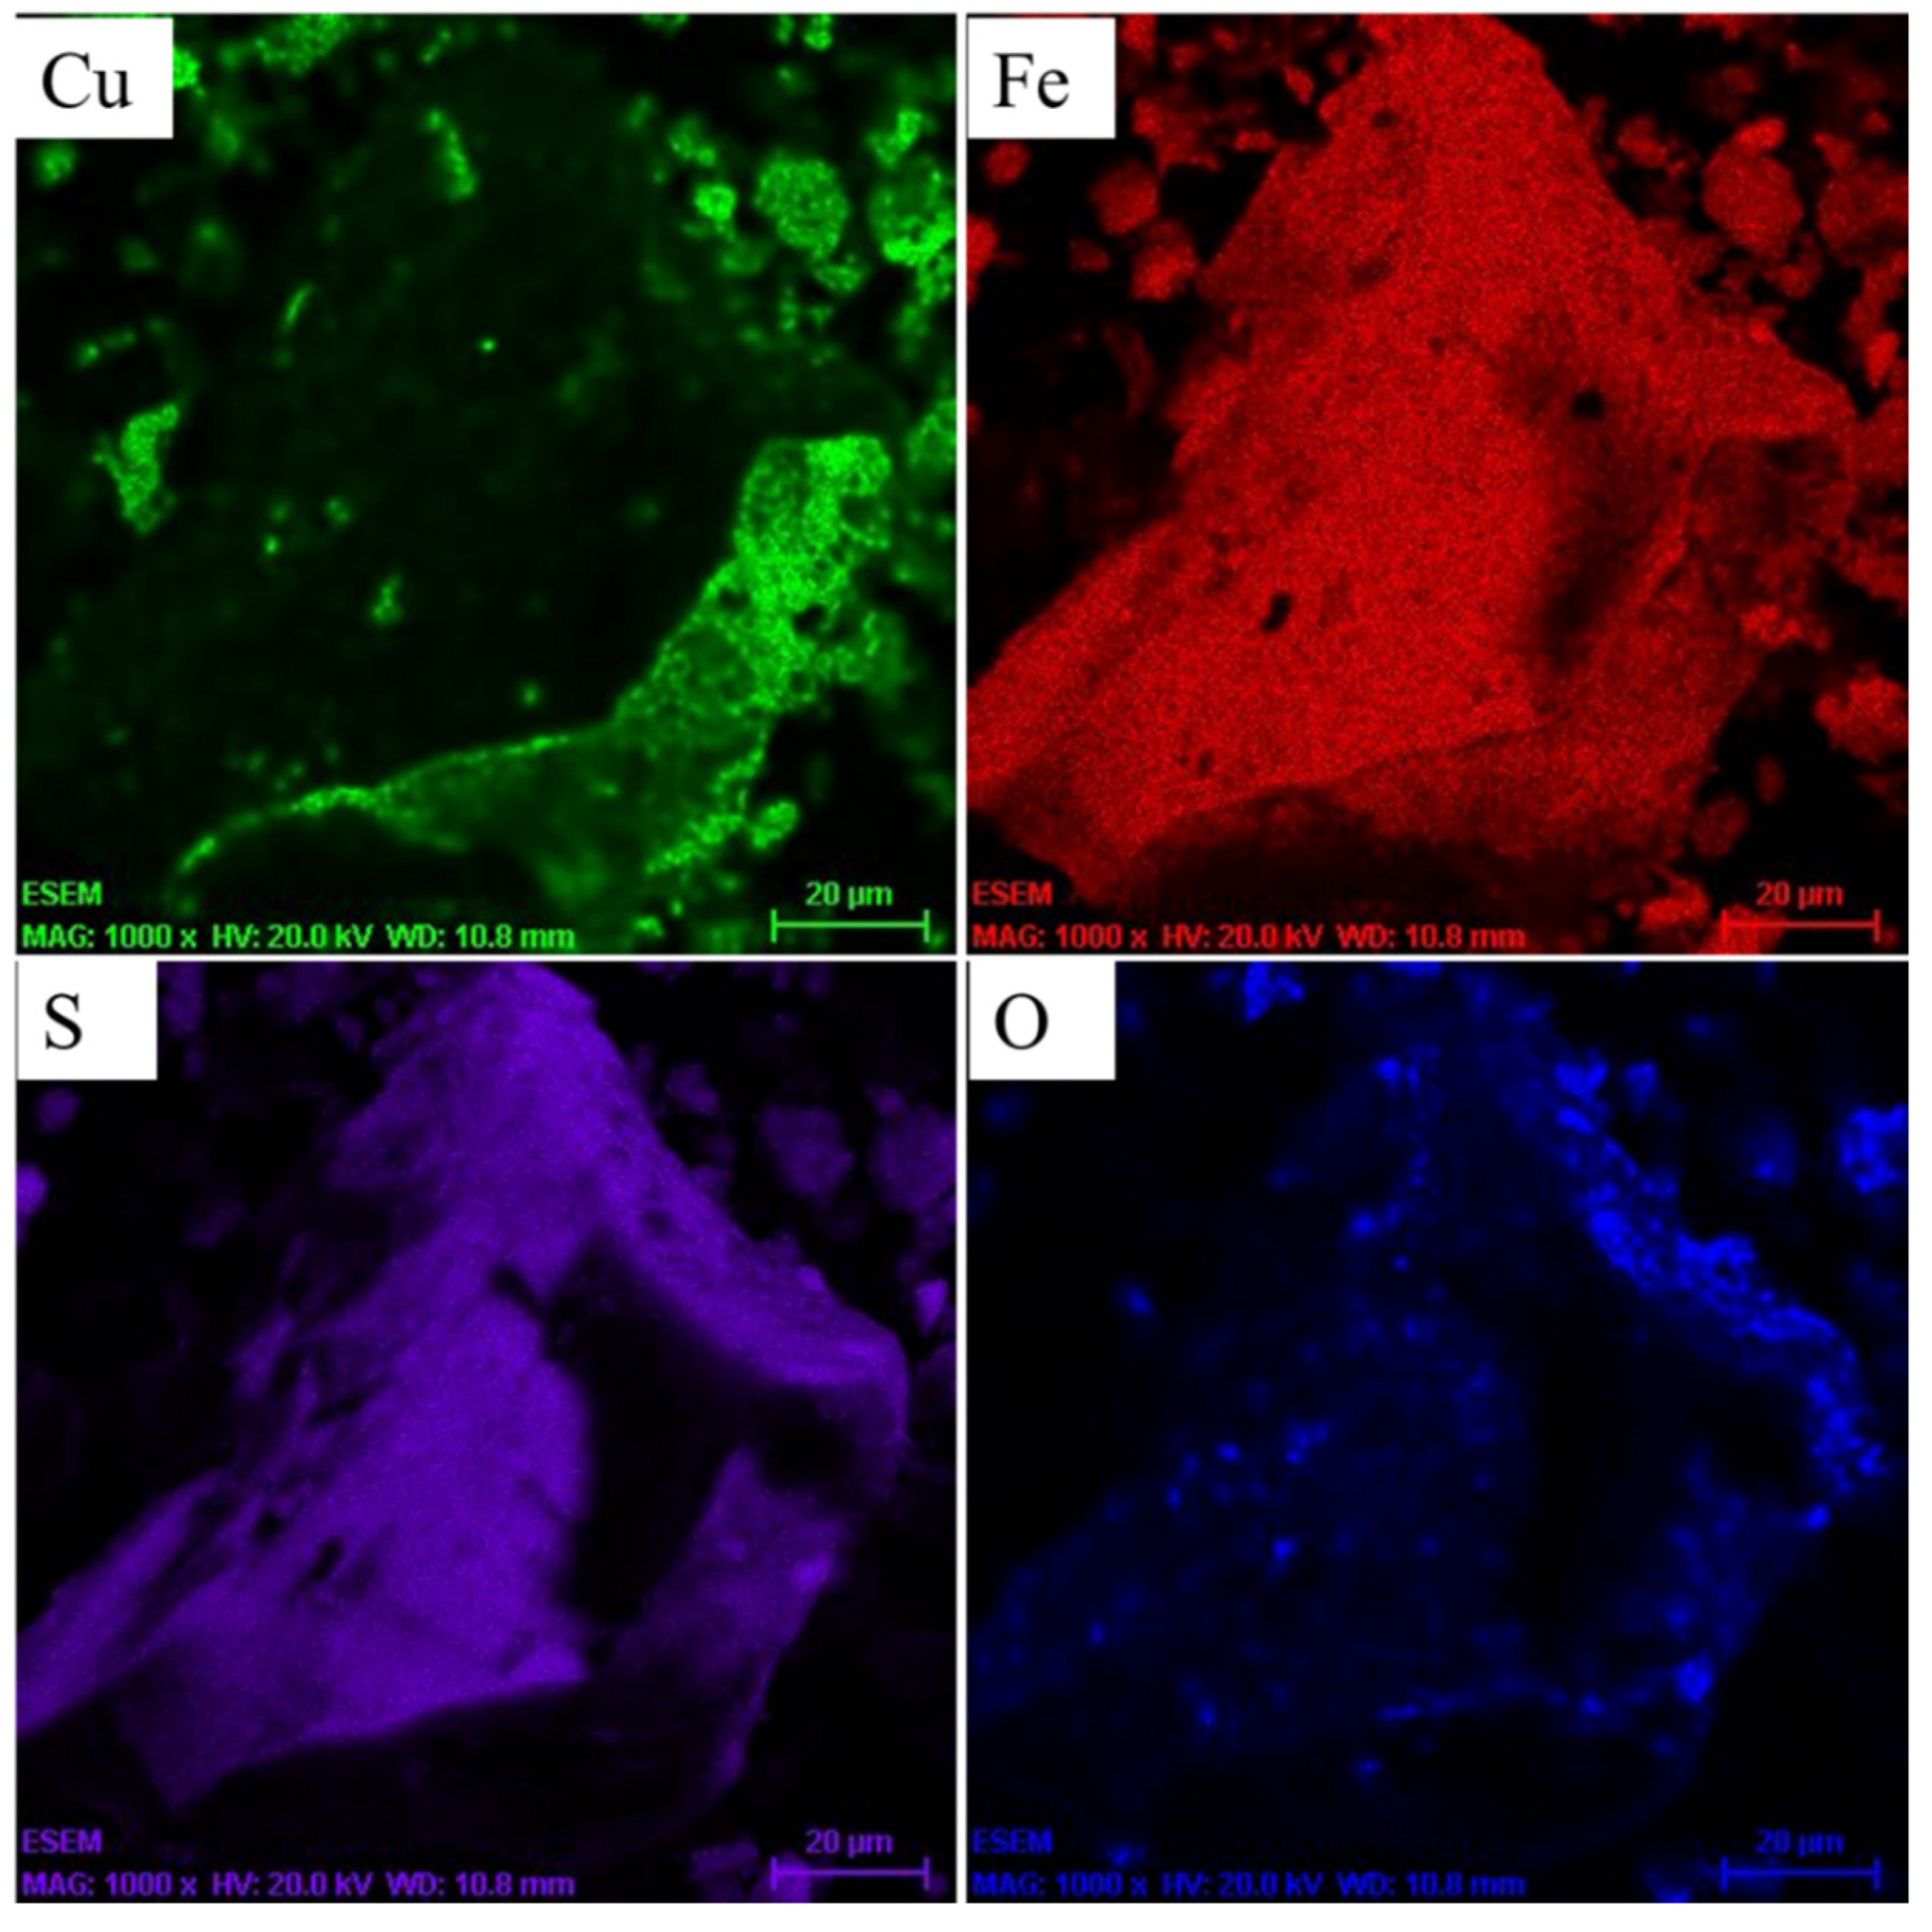
2.1. Materials
2.2. Experimental Design
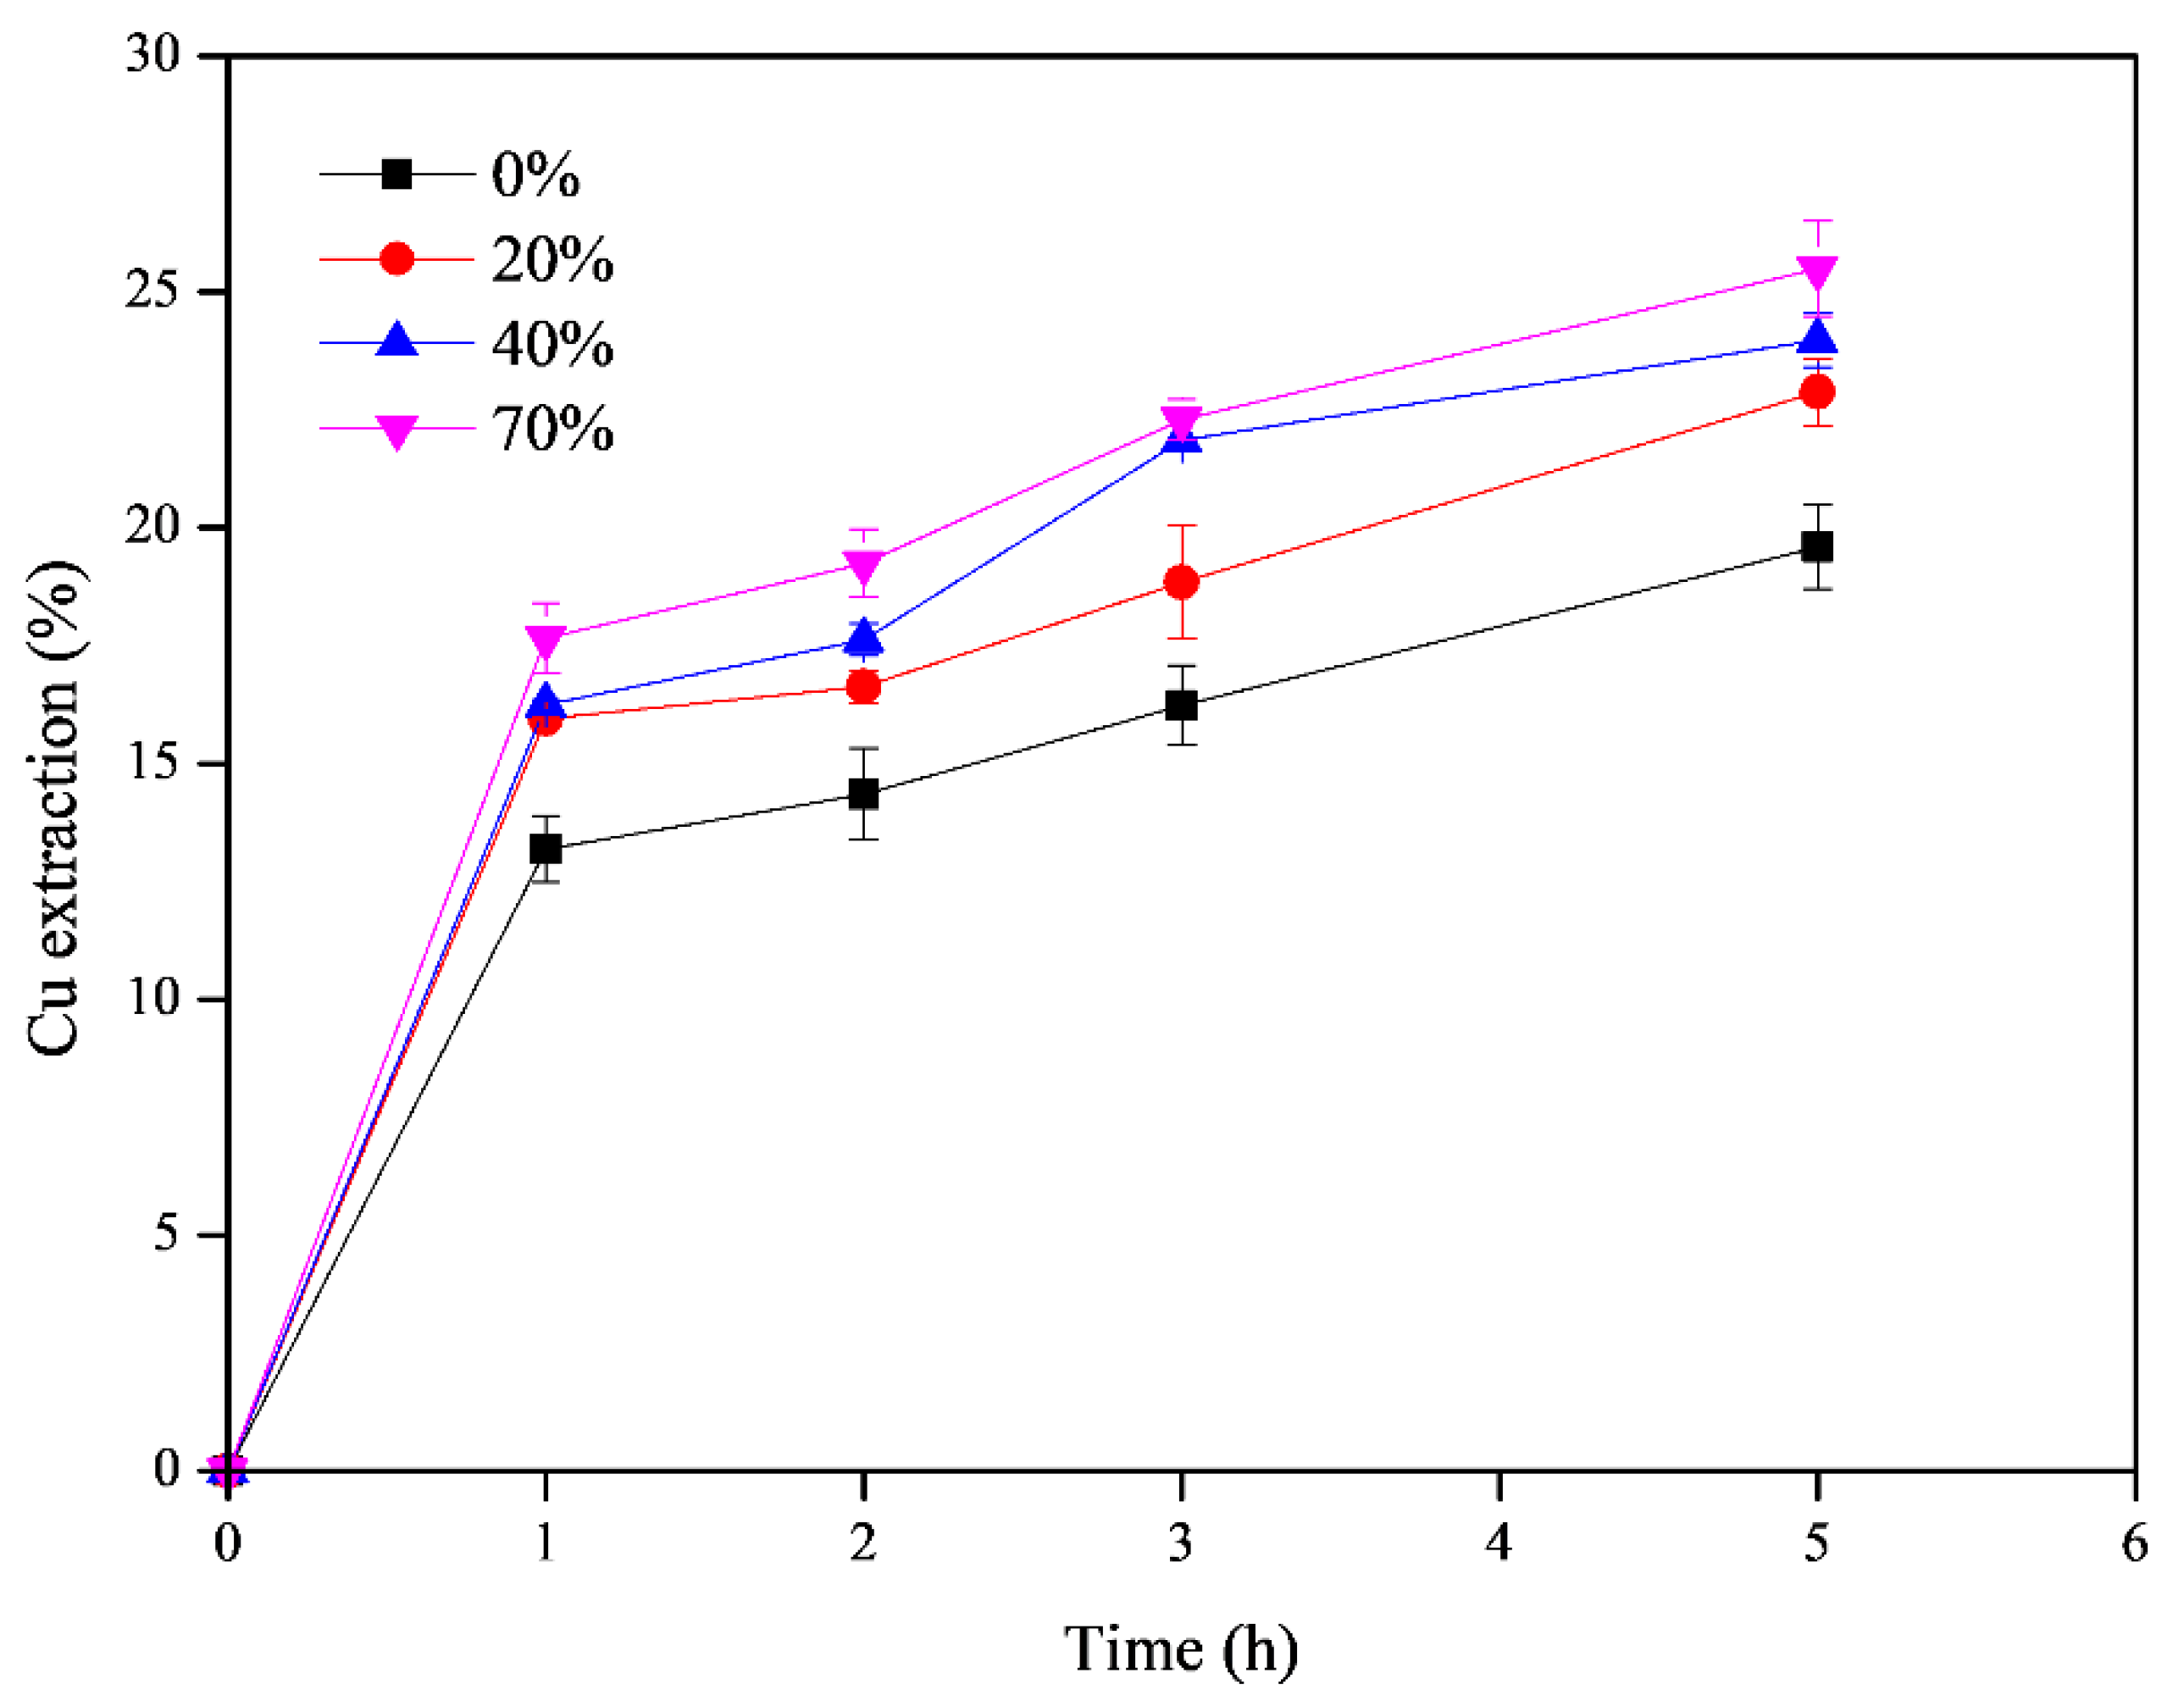
- The effect of ultrasonic power was studied at four amplitudes (0, 20, 40, and 70%) at 10% S/L, 0.5 M sulfuric acid concentration, 50 °C leaching temperature, and 800 rpm stirring speed.
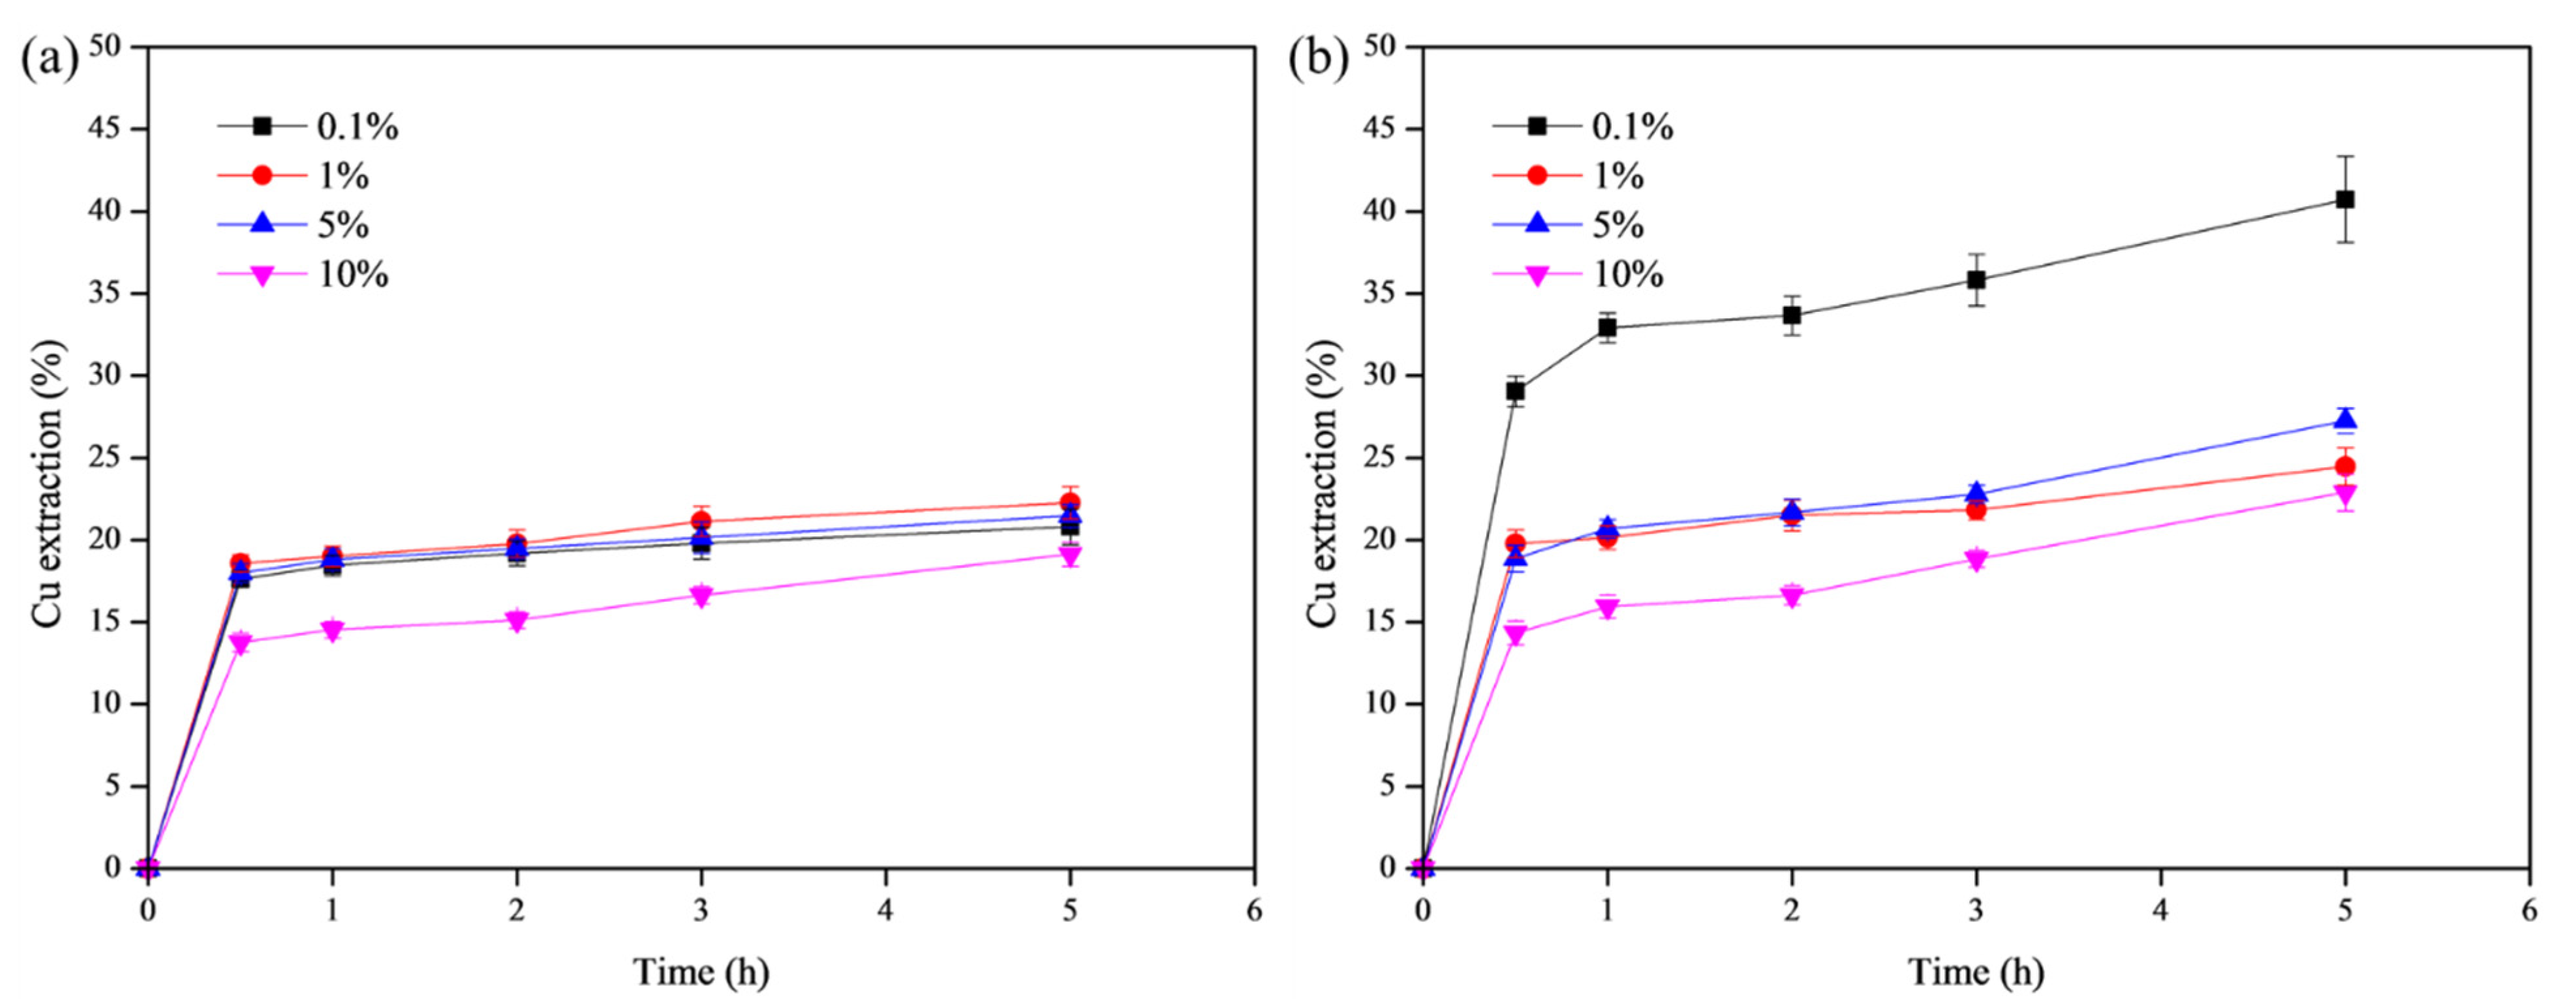
- Non-UAL (power 0%) and UAL (power 20%) experiments tested the effect of S/L (0.1, 1.0, 5.0, and 10%) at 0.5 M sulfuric acid concentration, 50 °C leaching temperature, and 800 rpm stirring speed.
- Non-UAL (power 0%) and UAL (power 20%) experiments tested the effects of the sulfuric acid concentration (0.01, 0.1, 0.5, and 1.0 M H2SO4) at 1% S/L, 50 °C leaching temperature, and 800 rpm stirring speed.
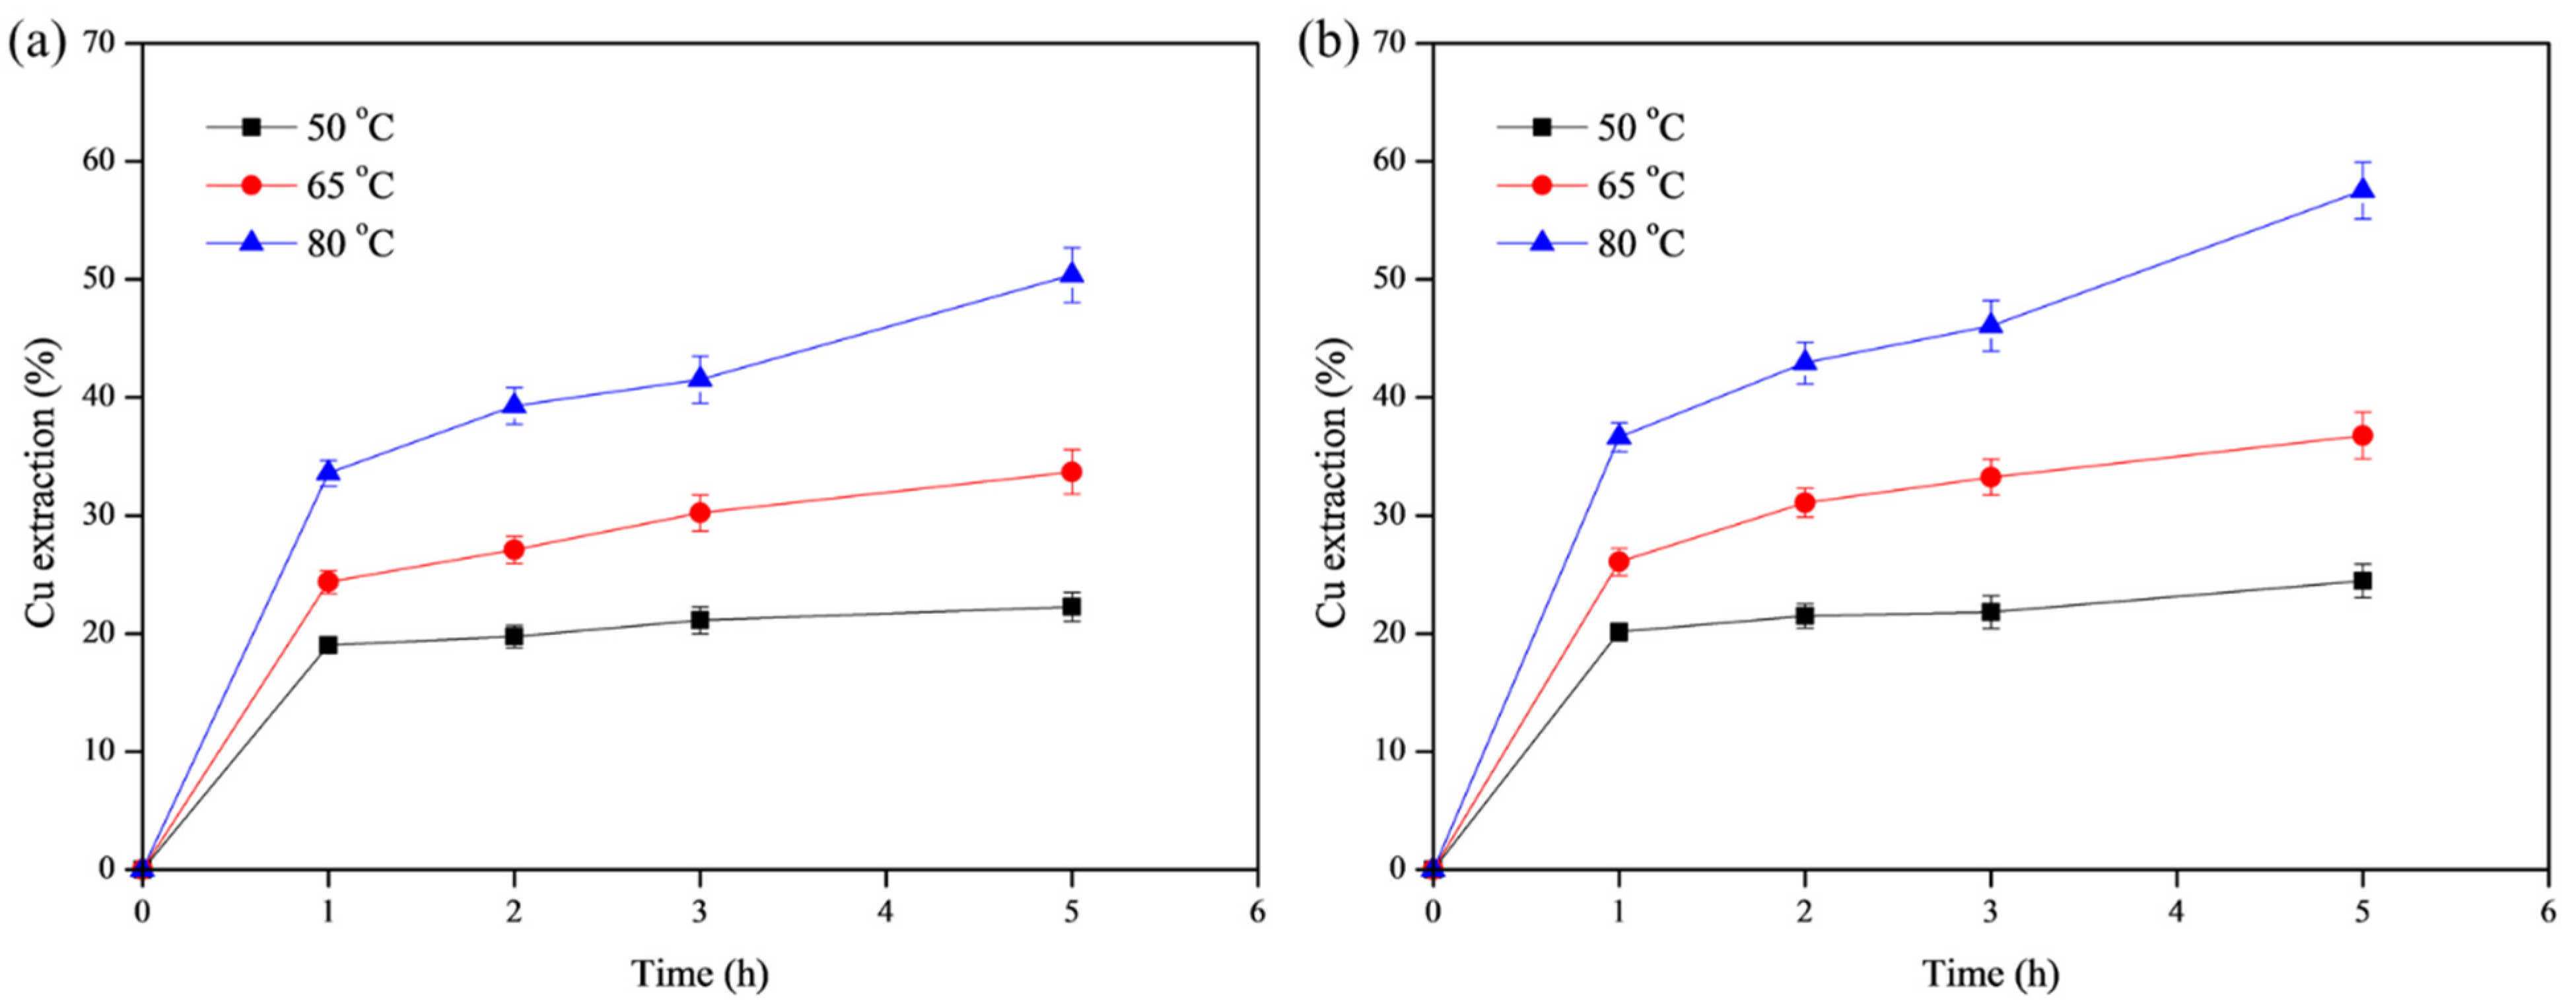
- Non-UAL (power 0%) and UAL (power 20%) experiments tested the effect of leaching temperature (50, 65, and 80 °C) at 1% S/L, 0.5 M sulfuric acid concentration, and 800 rpm stirring speed.
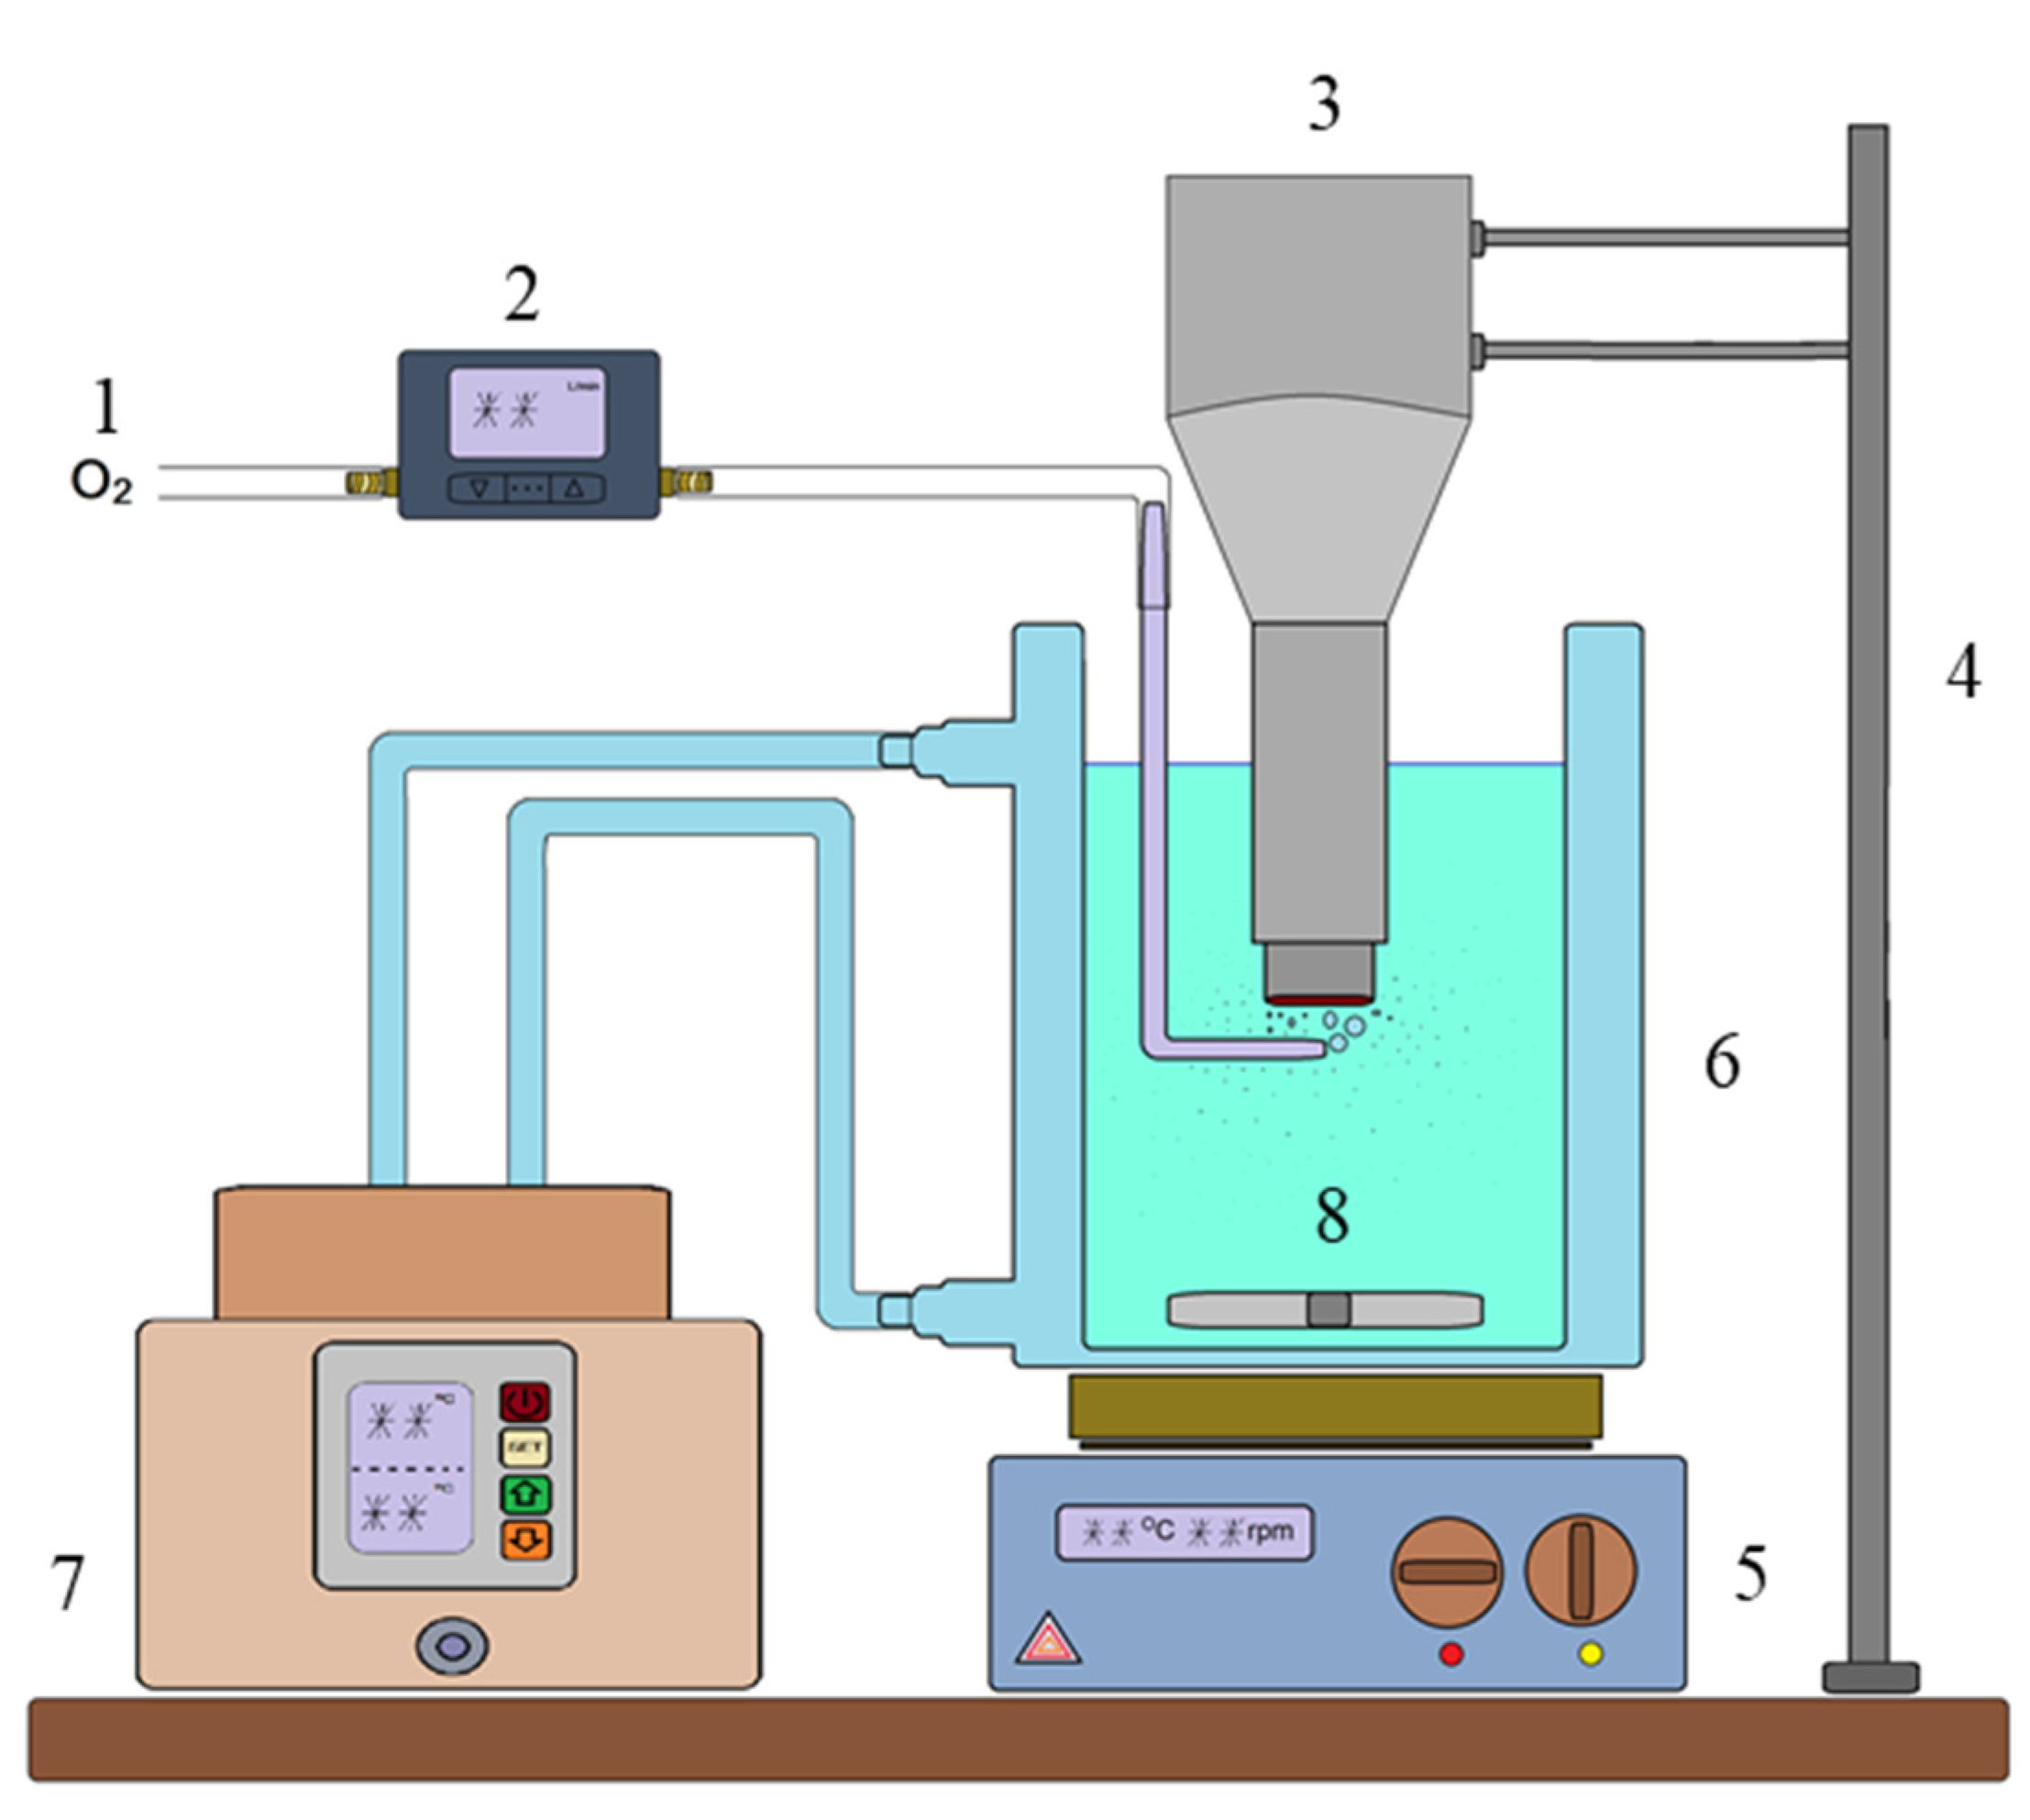
2.3. Experimental Procedure
2.4. Analysis and Characterization
3. Results and Discussion
3.1. Effect of Leaching Parameters on Copper Extraction
3.1.1. Effect of Ultrasonic Power
3.1.2. Effect of the Solid-to-Liquid Ratio
3.1.3. Effect of Acid Concentration
3.1.4. Effect of Temperature
3.1.5. Leaching Results Summary
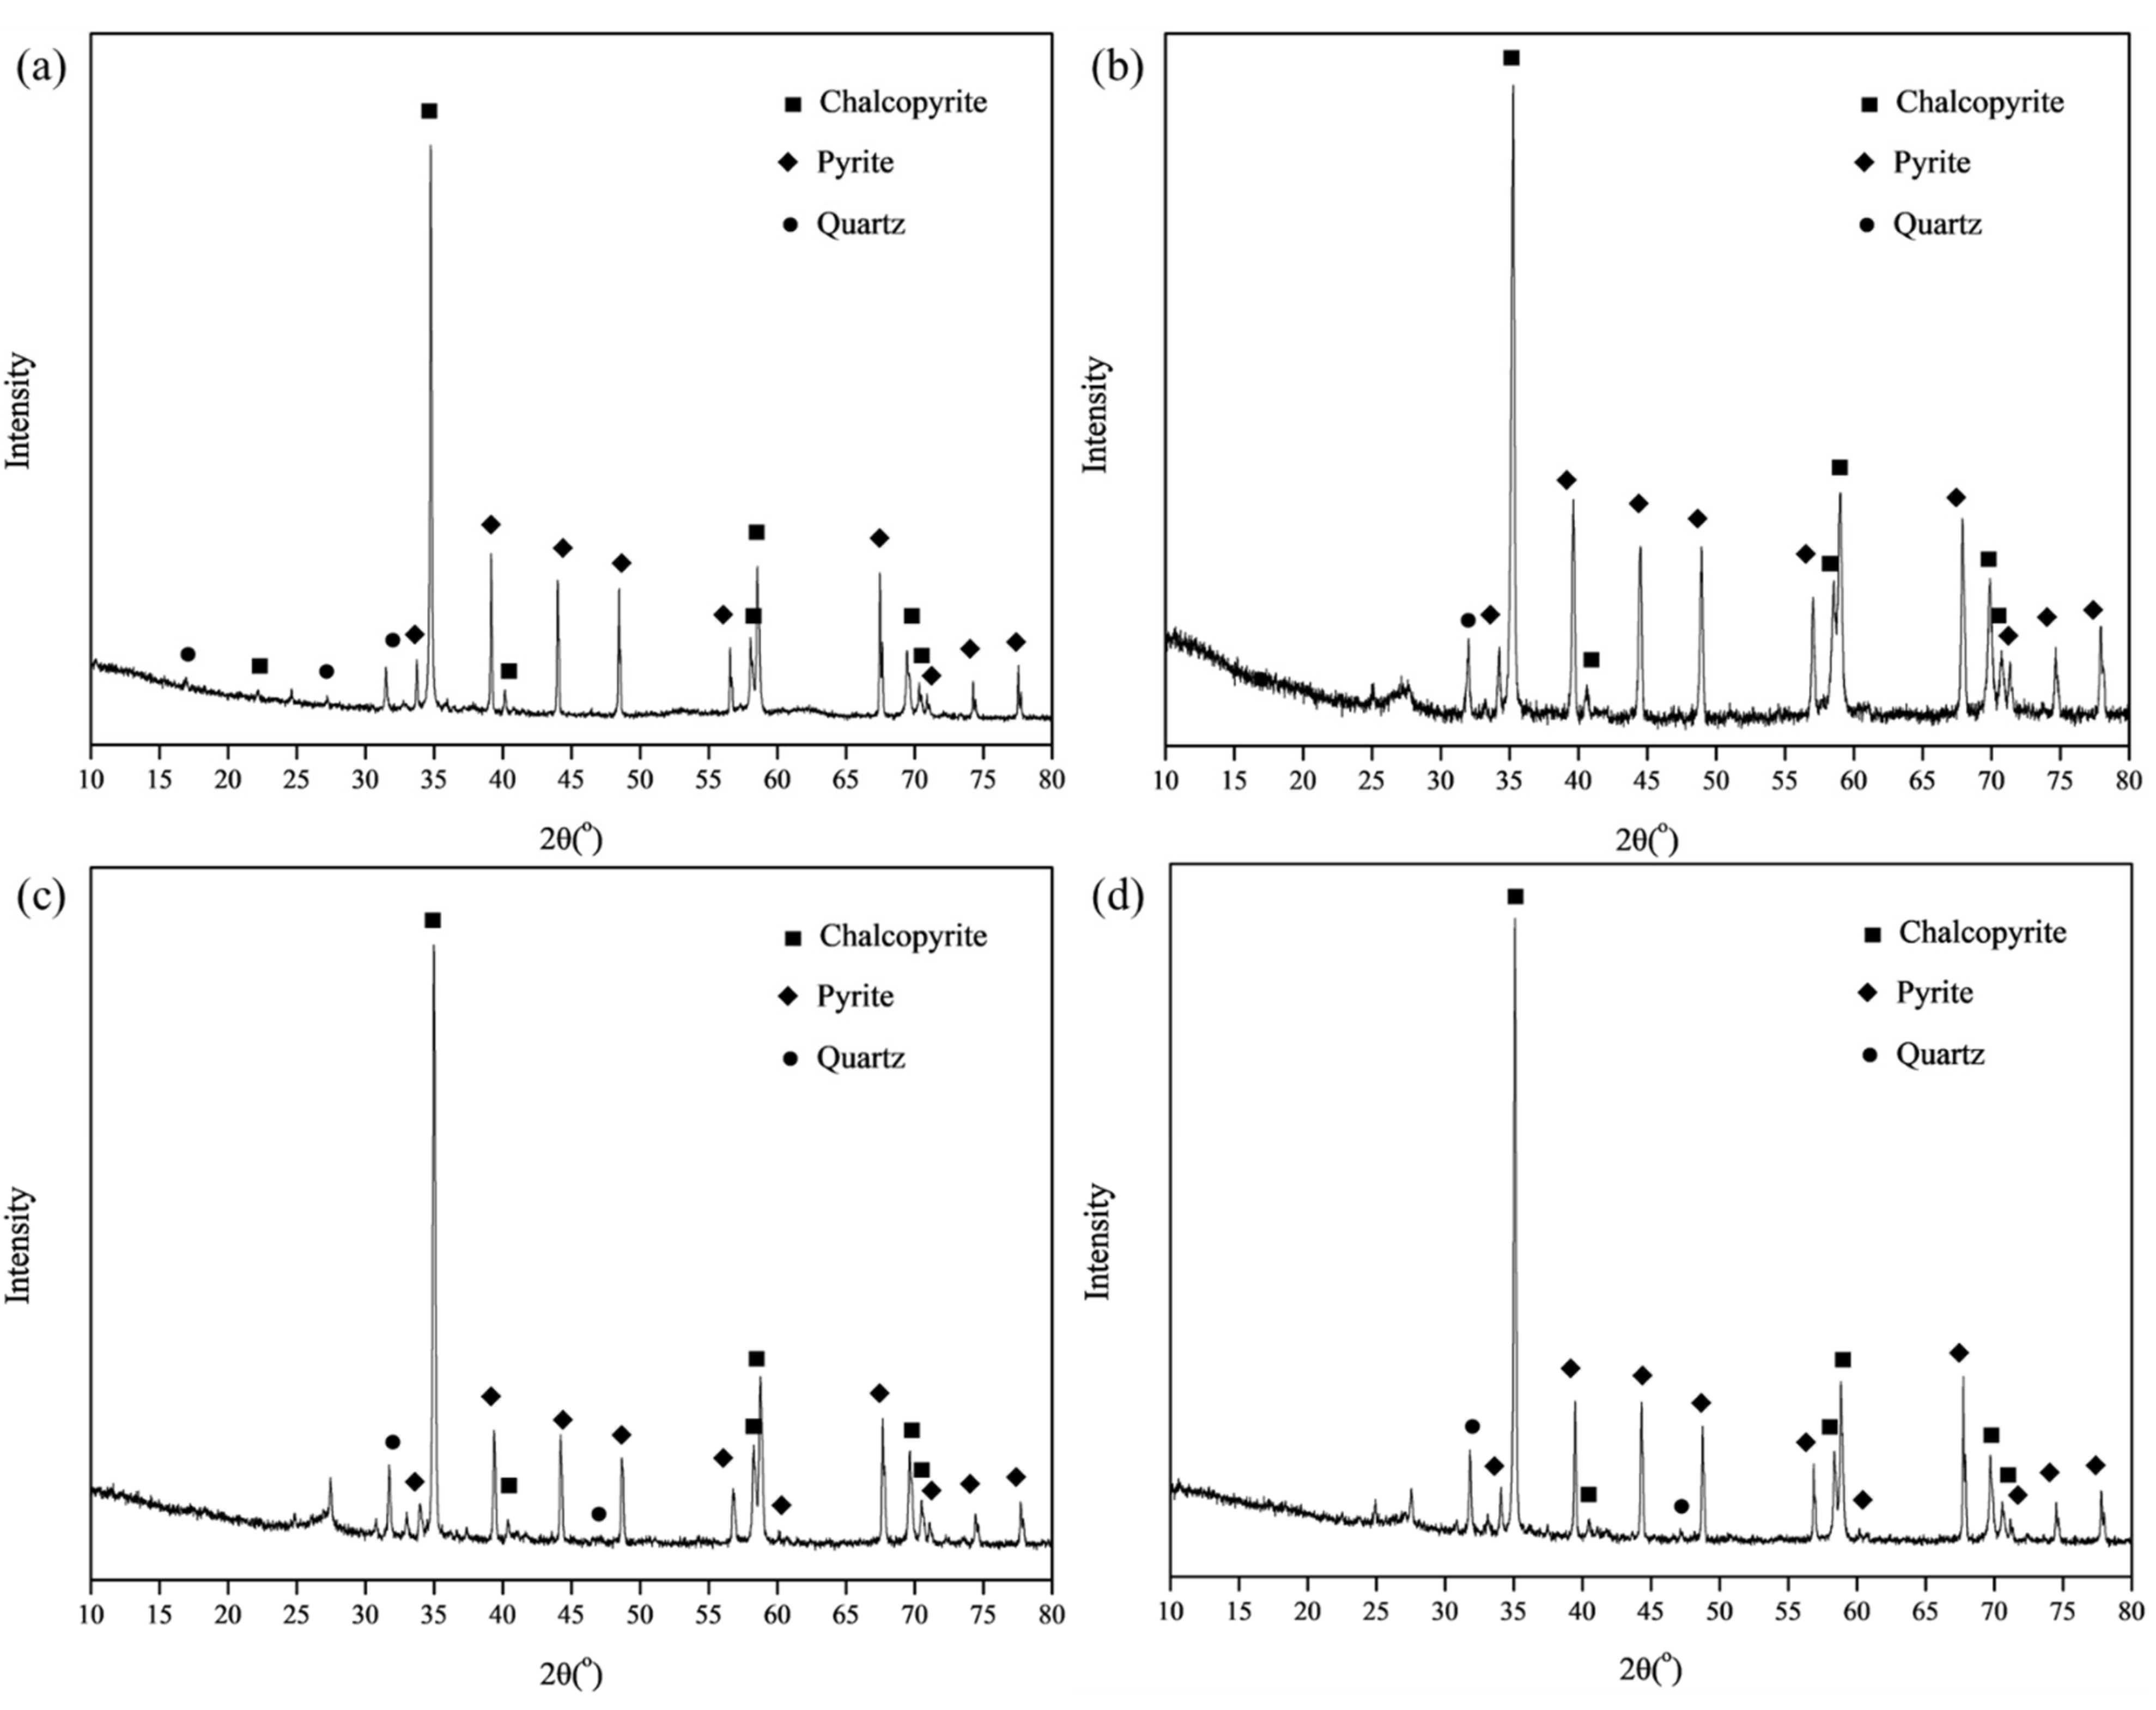
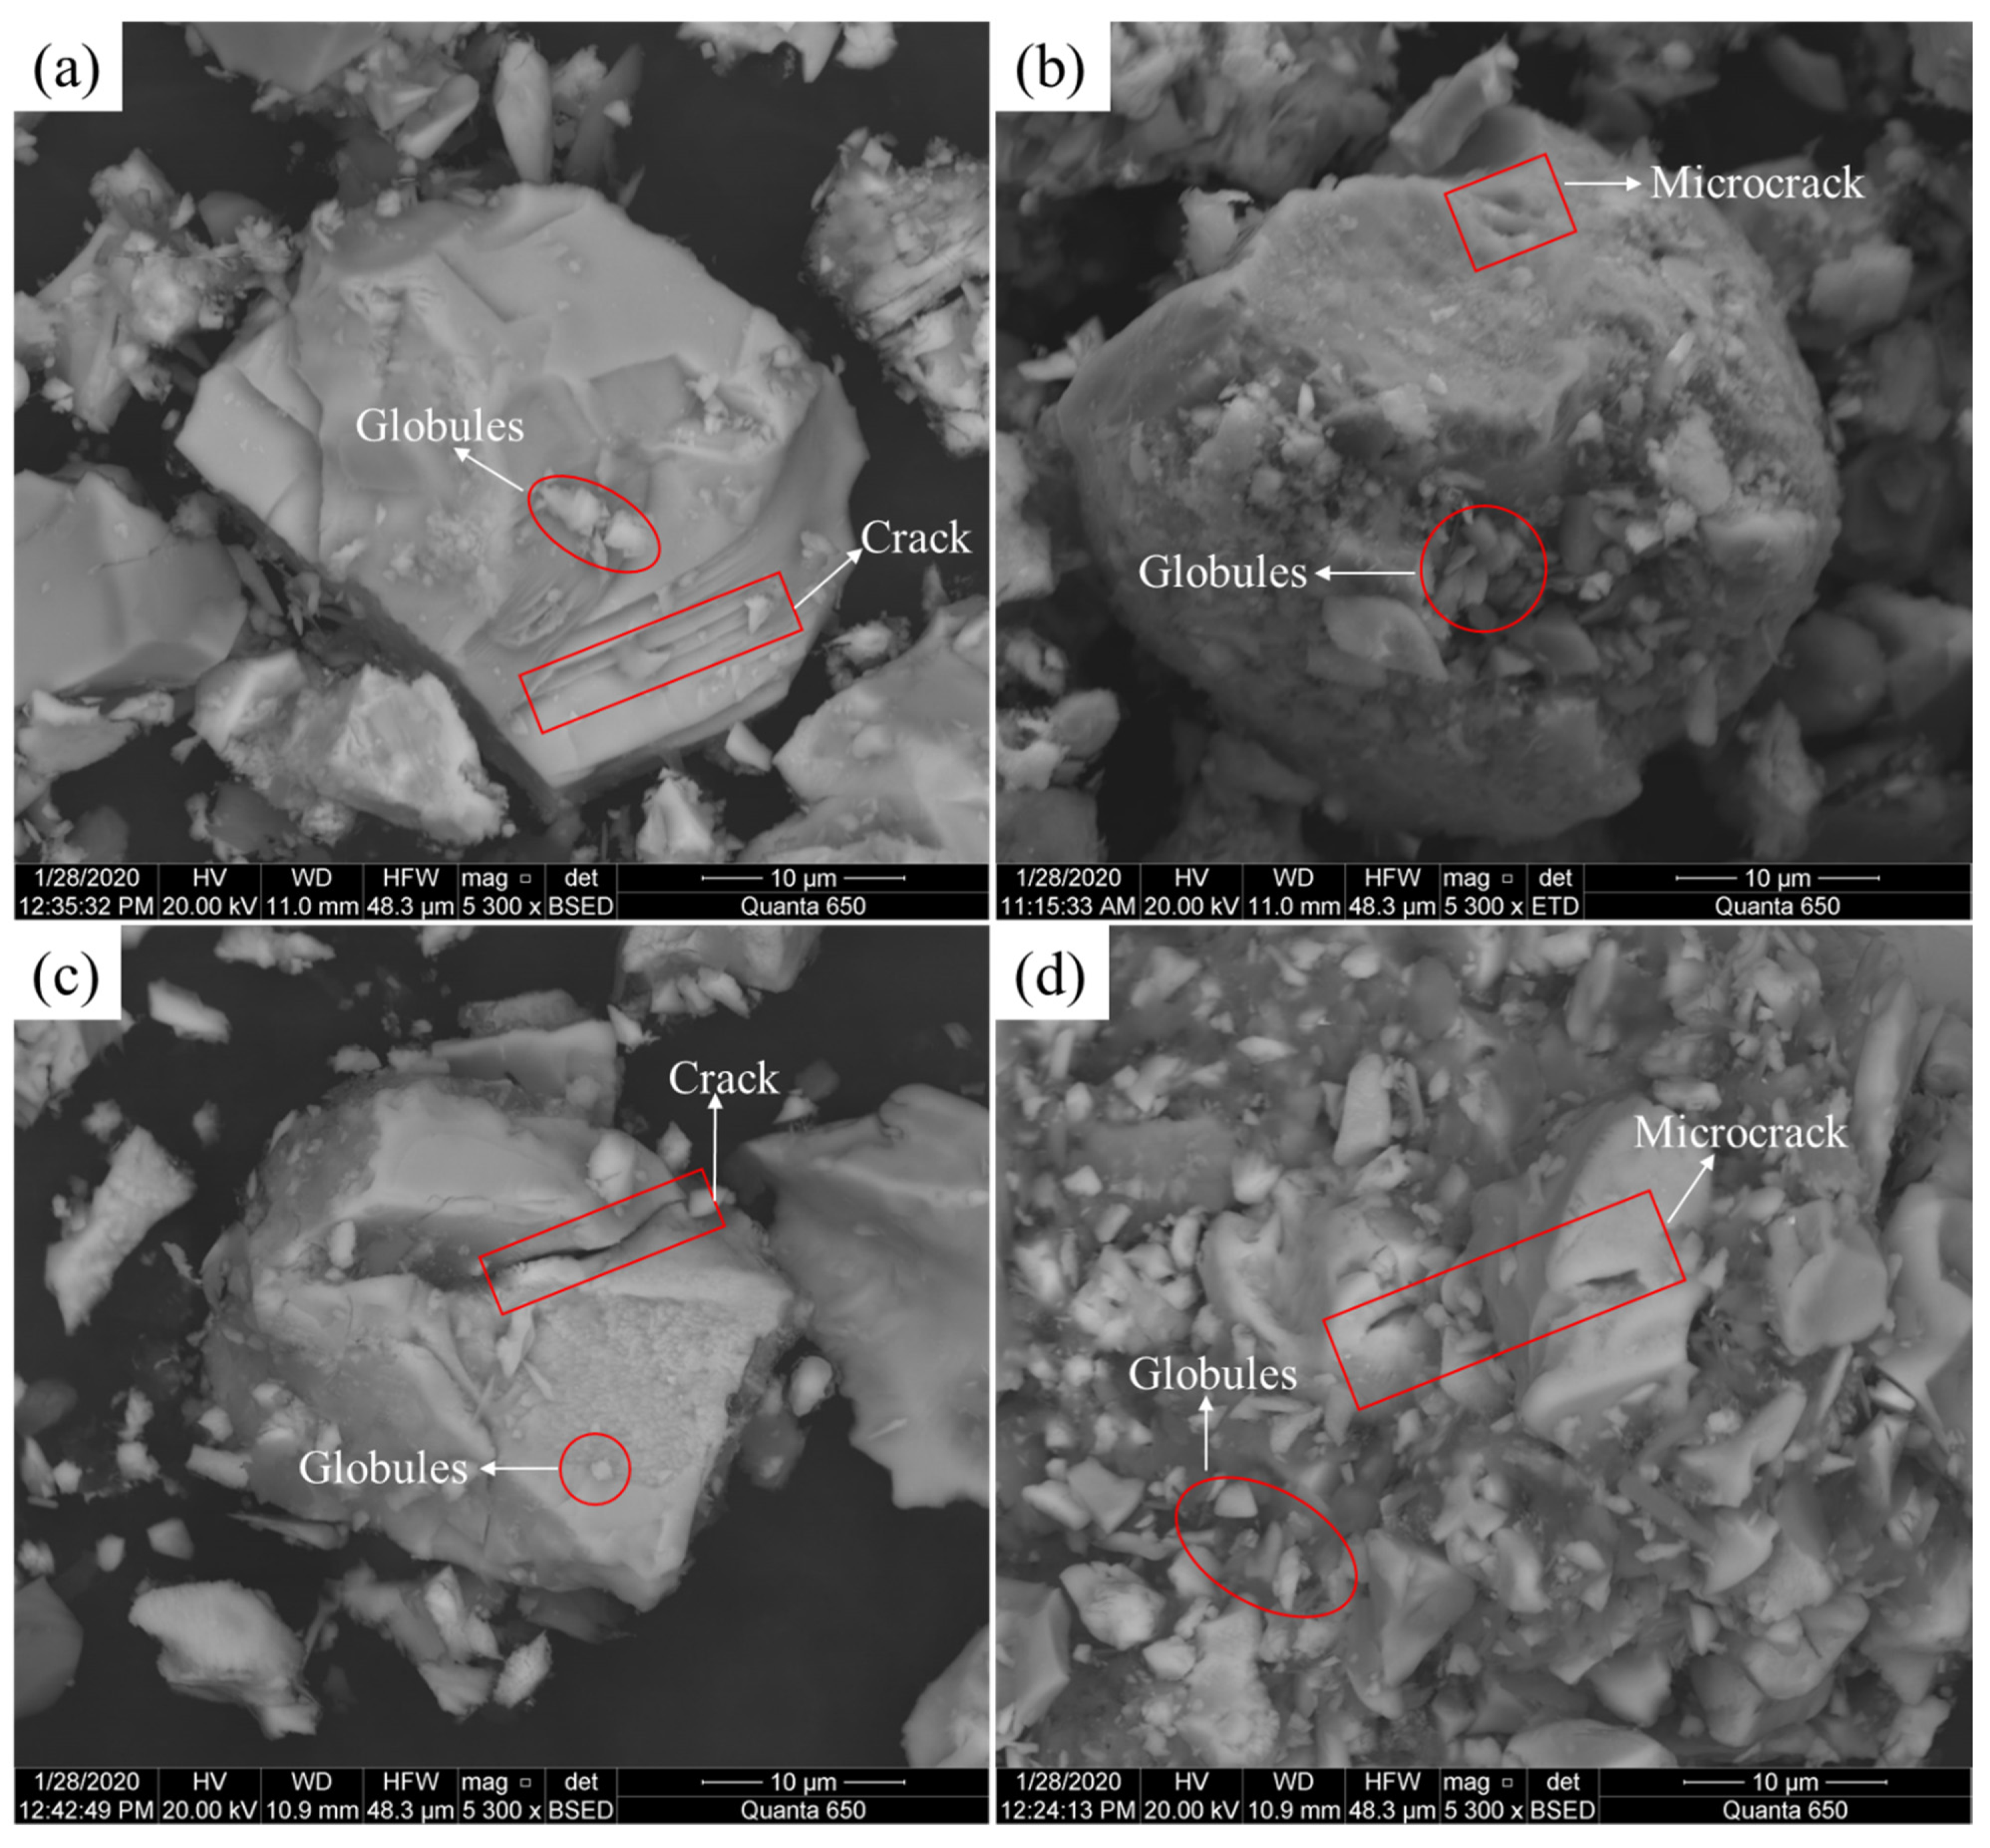
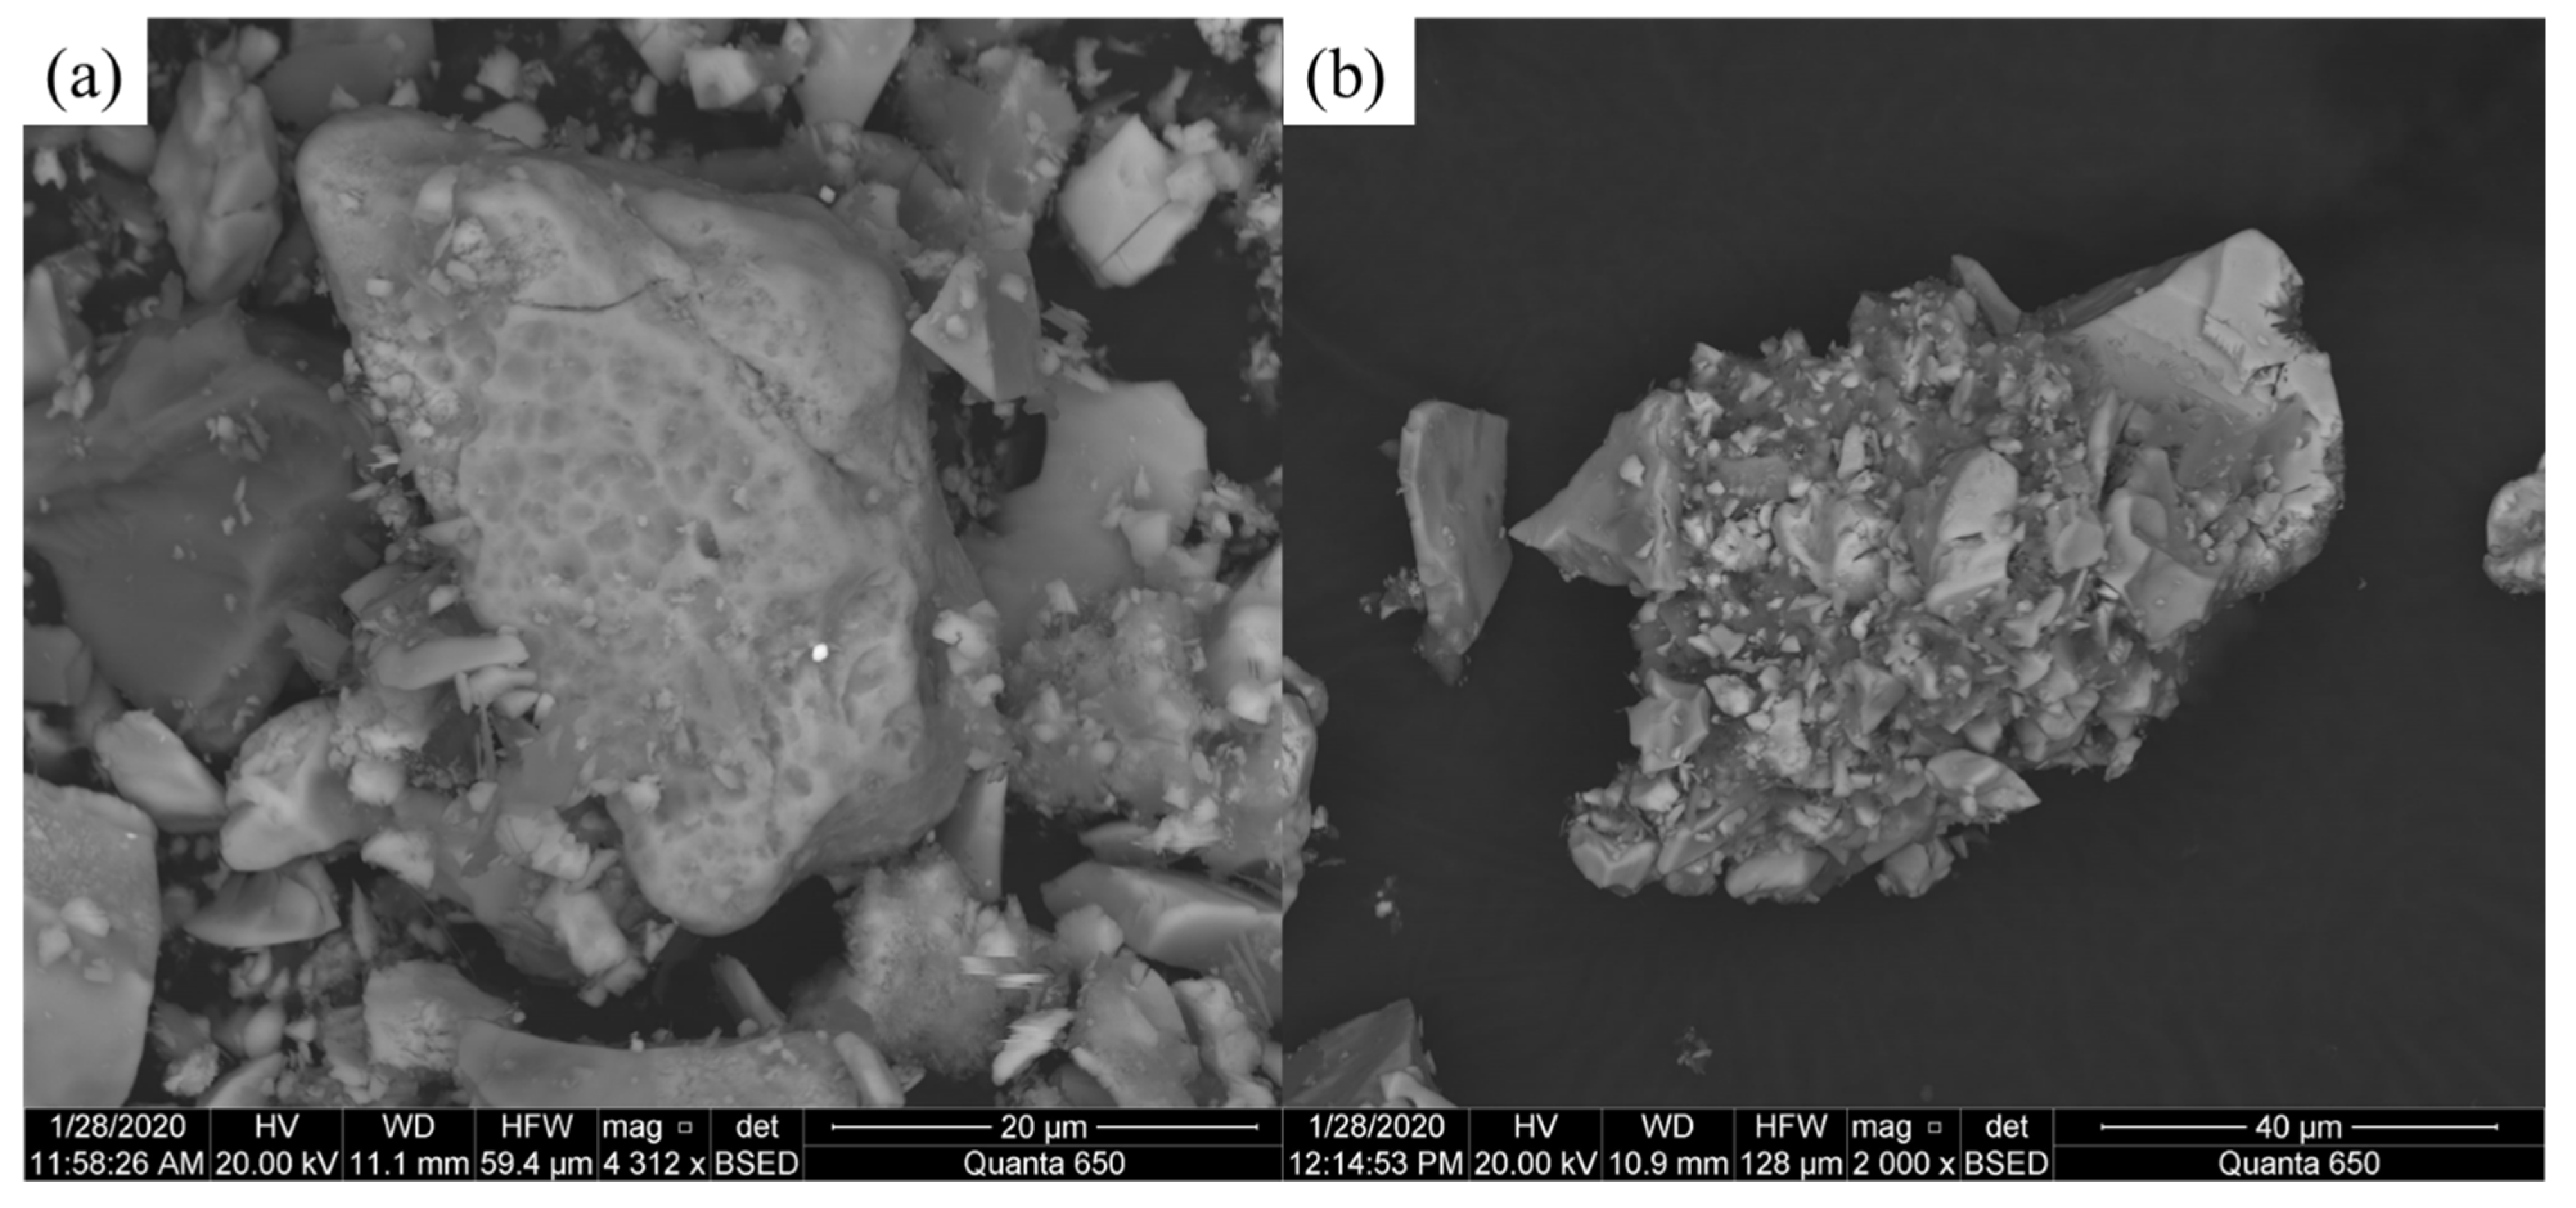
3.2. Residue Characterization
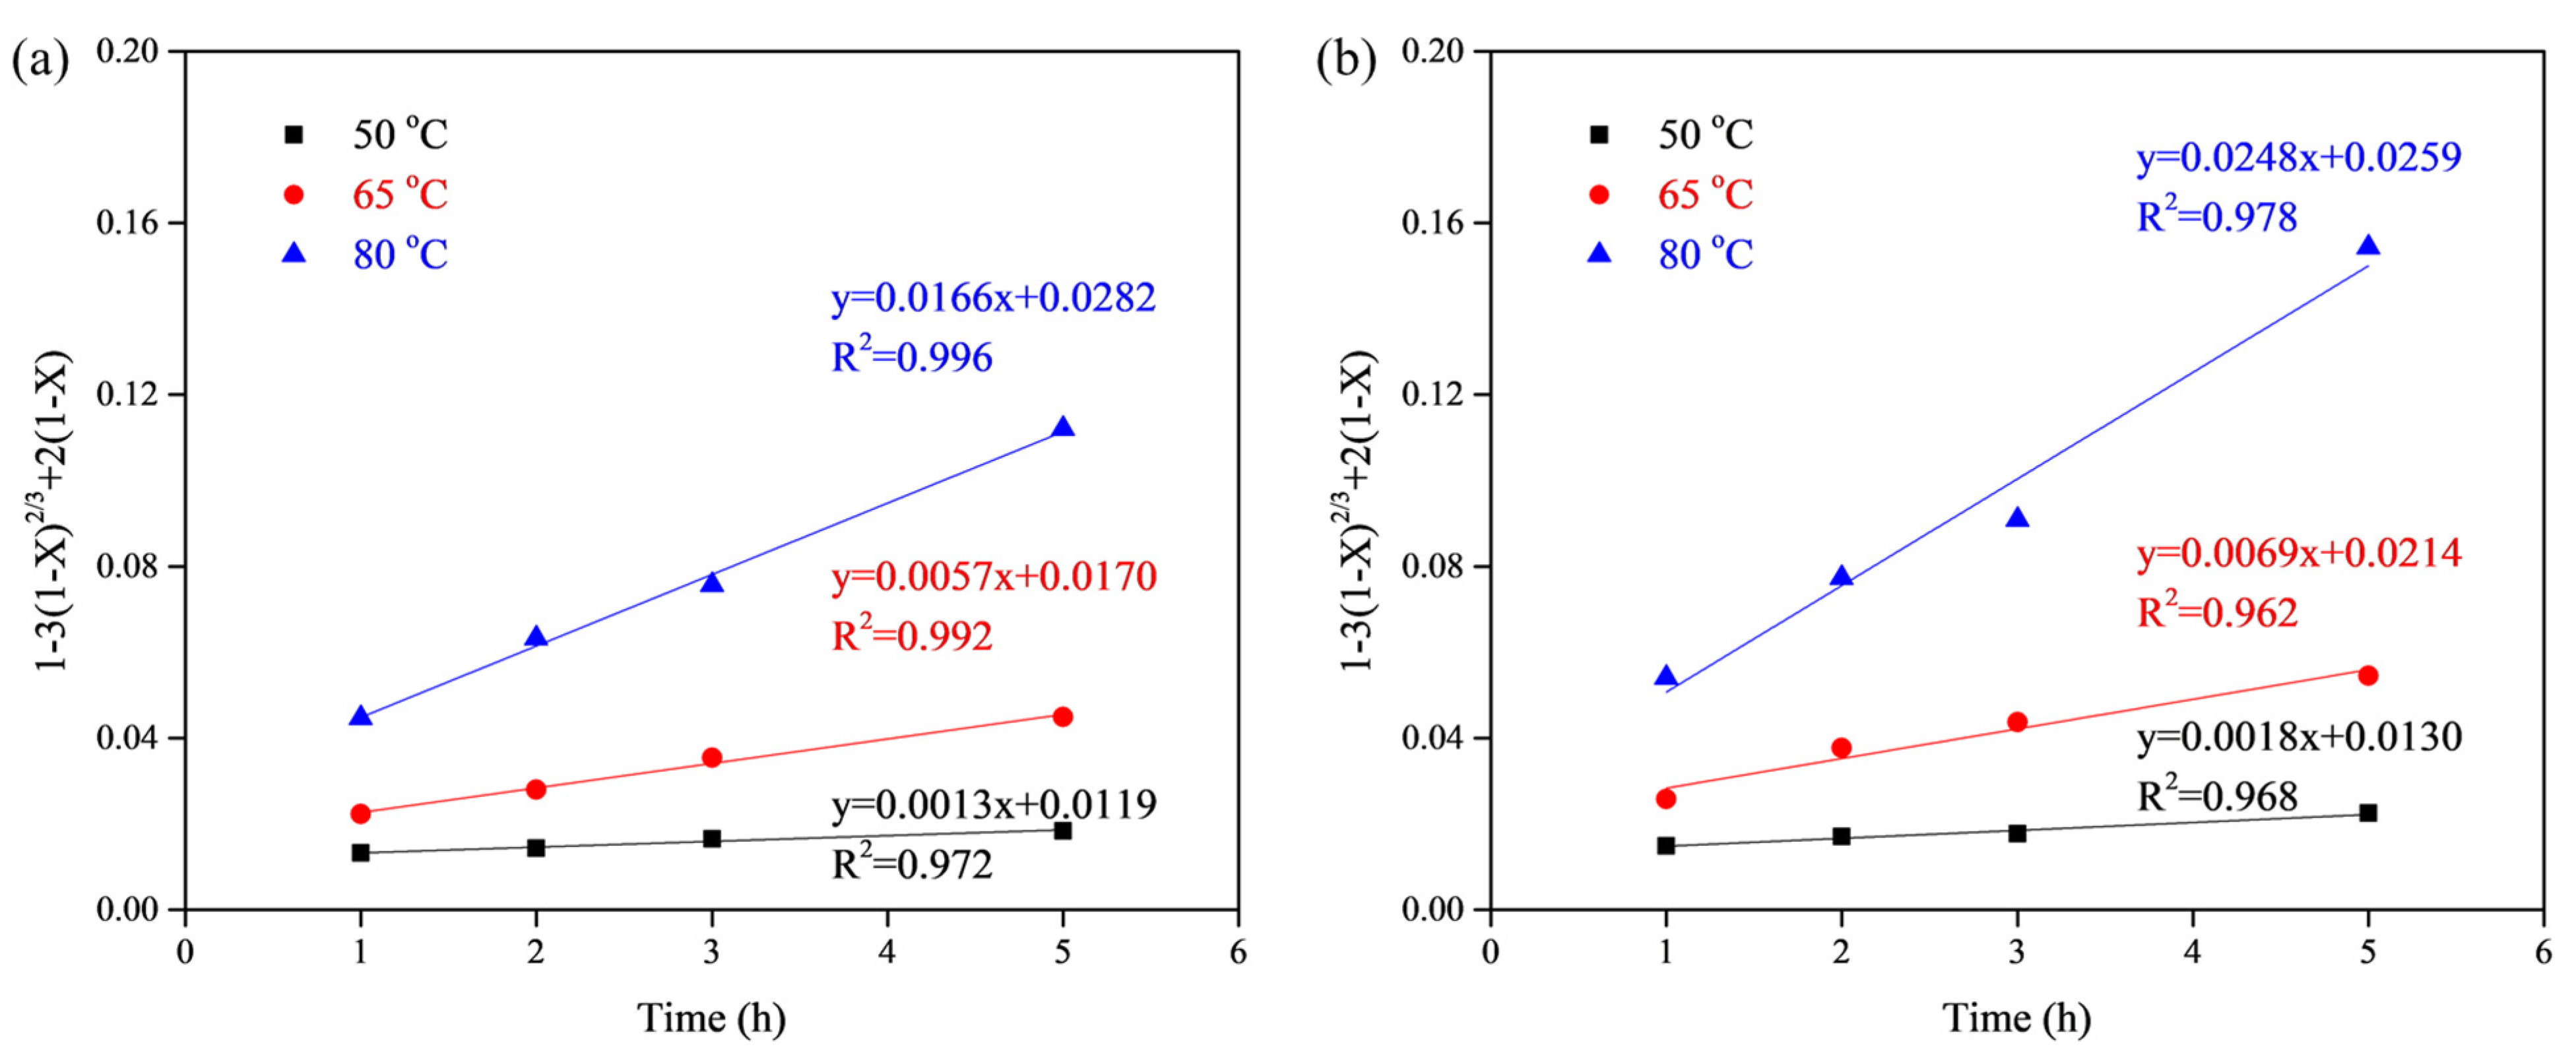
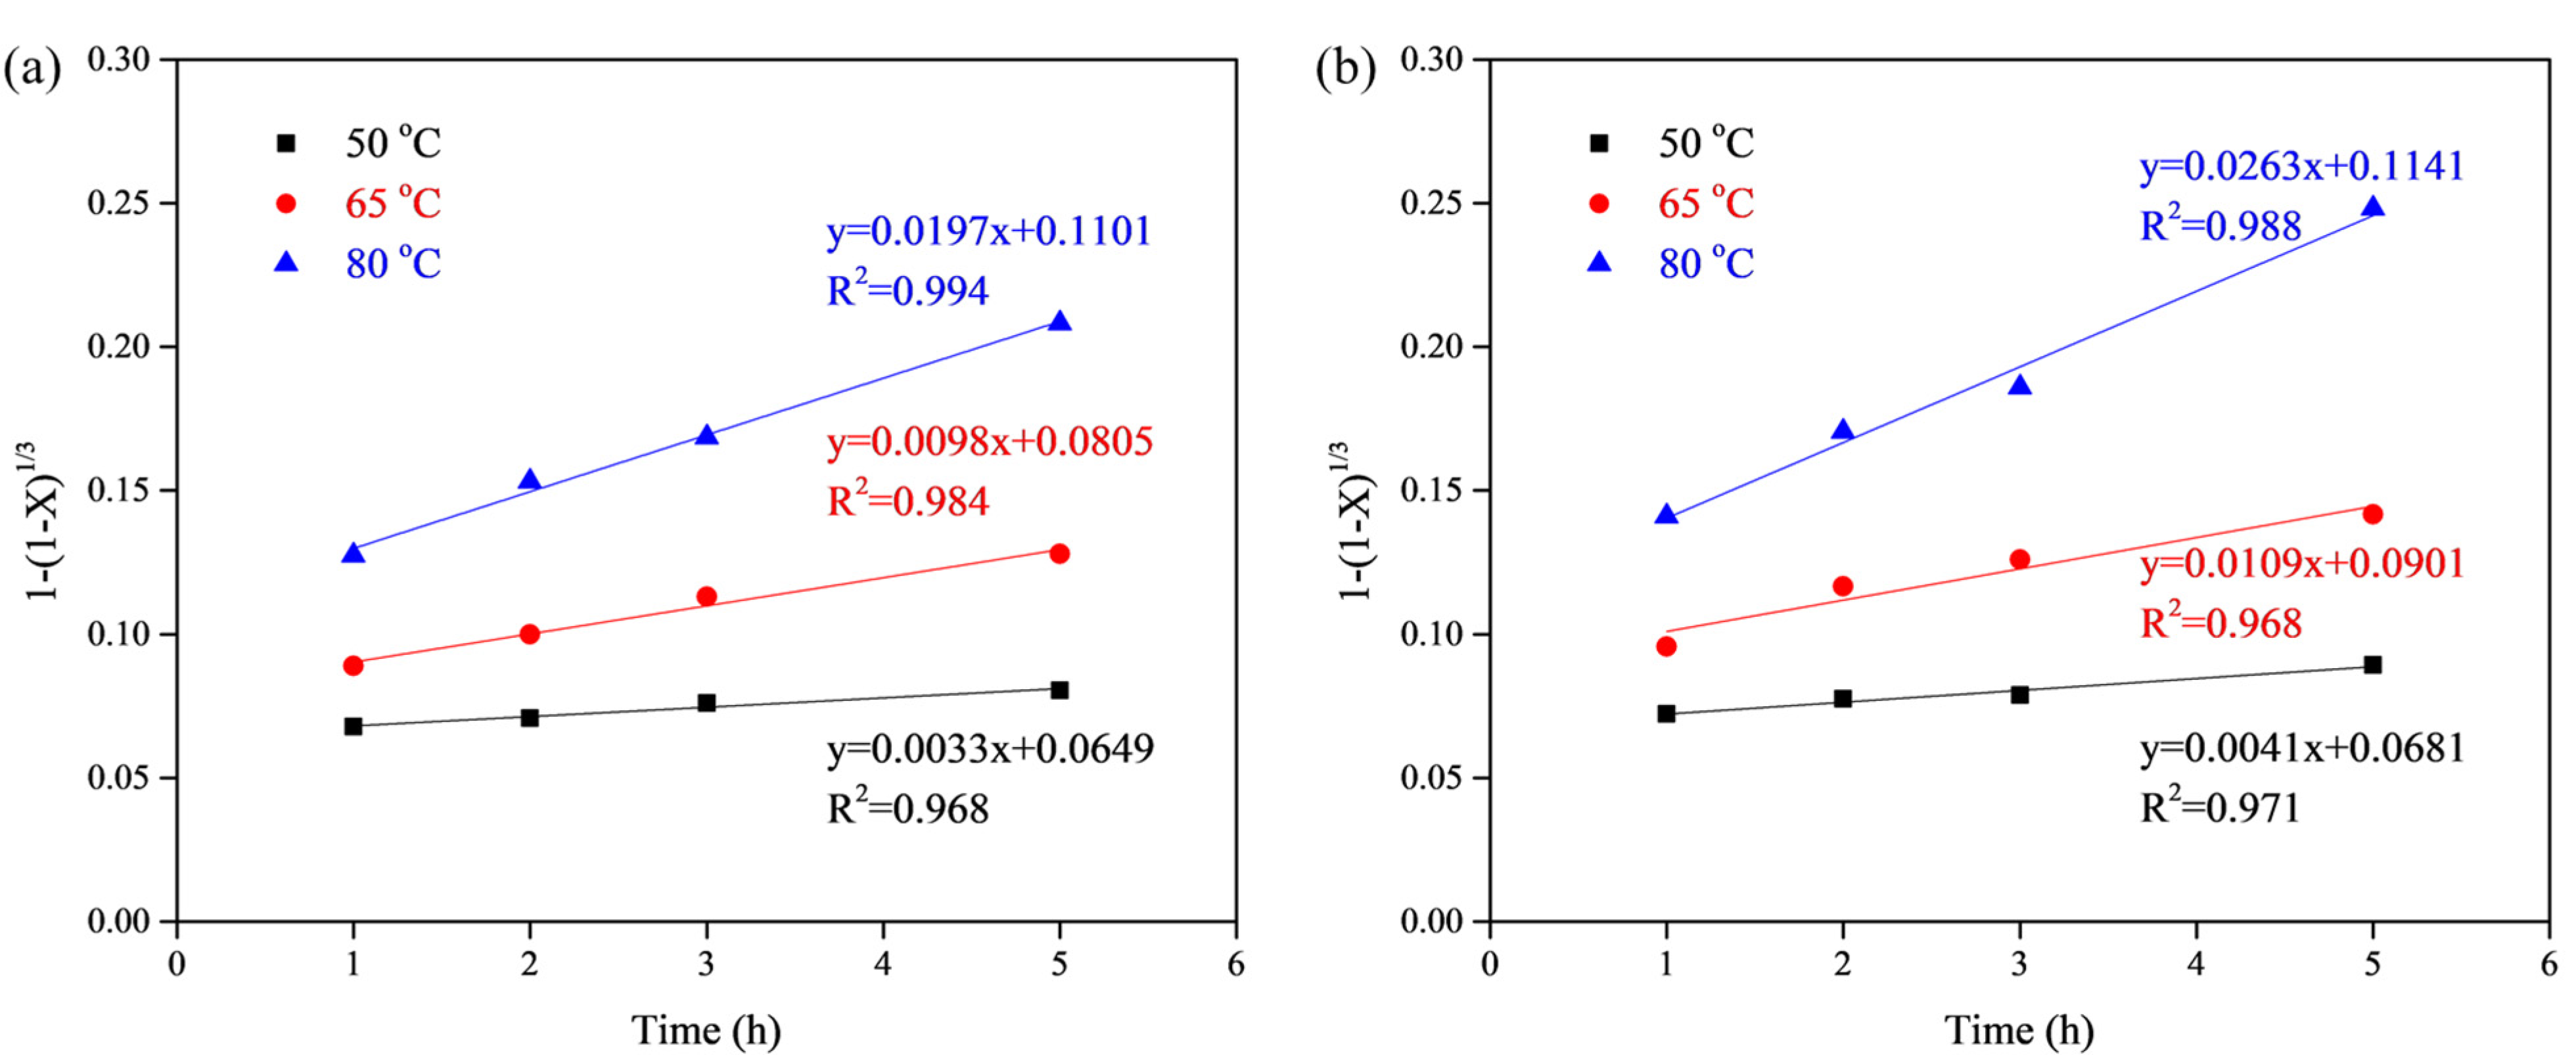
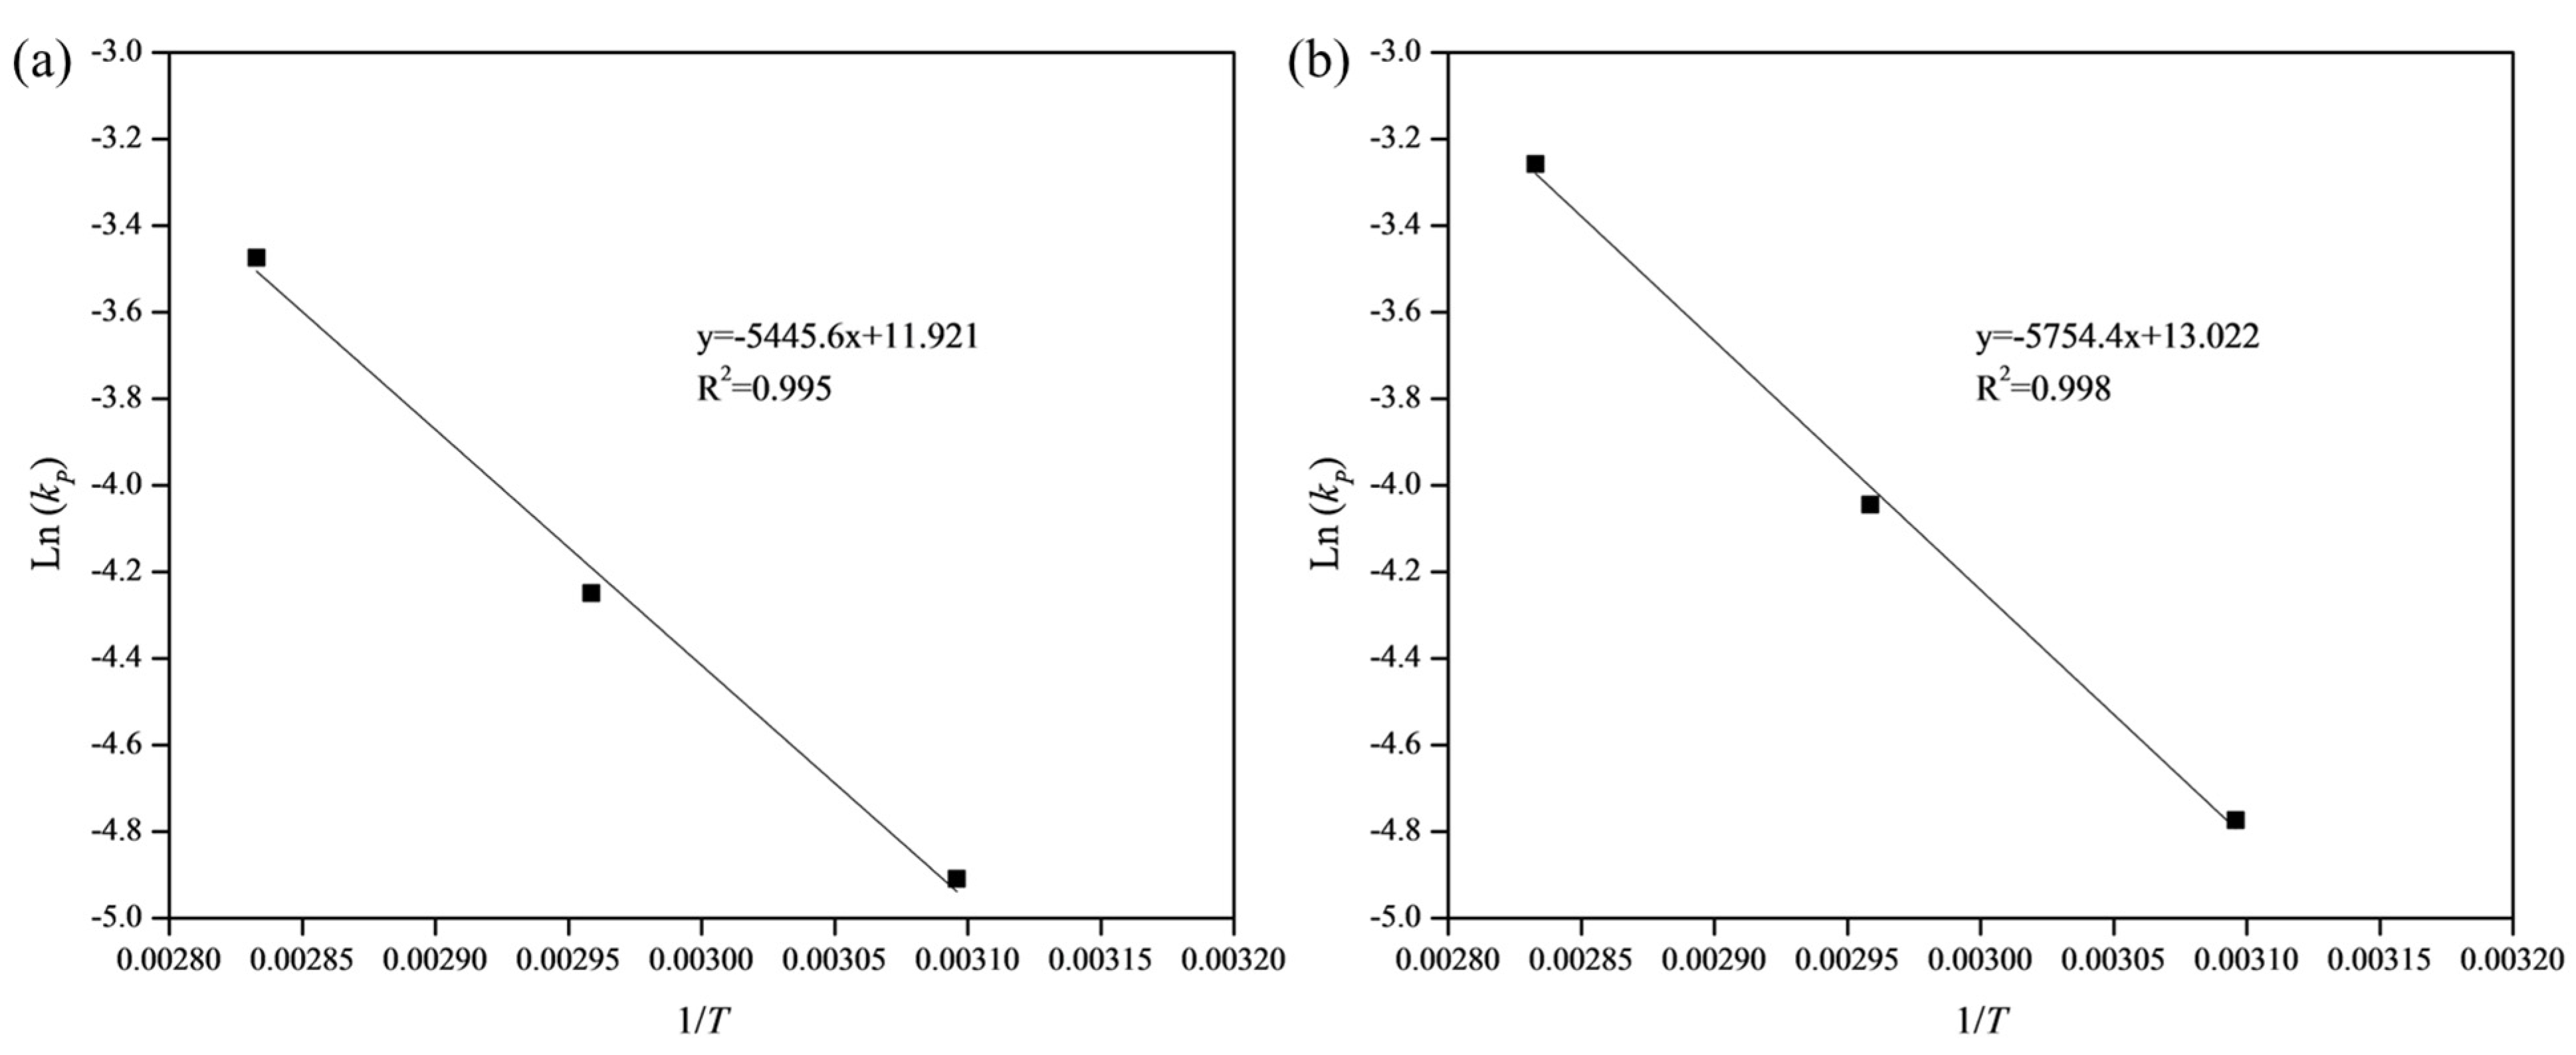
3.3. Kinetic Analysis
- diffusion through the liquid film;
- diffusion through the ash/product layer (if present); and
- chemical reaction at the surface of the solid.
4. Conclusions
Author Contributions
Funding
Conflicts of Interest
References
- Koleini, S.M.J.; Aghazadeh, V.; Sandström, Å. Acidic sulphate leaching of chalcopyrite concentrates in presence of pyrite. Miner. Eng. 2011, 24, 381–386. [Google Scholar] [CrossRef]
- Habashi, F. Copper metallurgy at the crossroads. J. Min. Metall. Sect. B Metall. 2007, 43, 1–19. [Google Scholar] [CrossRef]
- Wang, S. Copper leaching from chalcopyrite concentrates. JOM 2005, 57, 48–51. [Google Scholar] [CrossRef]
- Li, Y.; Kawashima, N.; Li, J.; Chandra, A.P.; Gerson, A.R. A review of the structure, and fundamental mechanisms and kinetics of the leaching of chalcopyrite. Adv. Colloid Interface Sci. 2013, 197–198, 1–32. [Google Scholar] [CrossRef] [PubMed]
- Ghahremaninezhad, A.; Dixon, D.G.; Asselin, E. Electrochemical and XPS analysis of chalcopyrite (CuFeS2) dissolution in sulfuric acid solution. Electrochim. Acta 2013, 87, 97–112. [Google Scholar] [CrossRef]
- Xian, Y.J.; Wen, S.M.; Deng, J.S.; Liu, J.; Nie, Q. Leaching chalcopyrite with sodium chlorate in hydrochloric acid solution. Can. Metall. Q. 2012, 51, 133–140. [Google Scholar] [CrossRef]
- Sokić, M.D.; Marković, B.; Živković, D. Kinetics of chalcopyrite leaching by sodium nitrate in sulphuric acid. Hydrometallurgy 2009, 95, 273–279. [Google Scholar] [CrossRef]
- Copur, M.; Kizilca, M.; Kocakerim, M.M. Determination of the optimum conditions for copper leaching from chalcopyrite concentrate ore using taguchi method. Chem. Eng. Commun. 2015, 202, 927–935. [Google Scholar] [CrossRef]
- Koleini, S.M.J.; Jafarian, M.; Abdollahy, M.; Aghazadeh, V. Galvanic leaching of chalcopyrite in atmospheric pressure and sulfate media: Kinetic and surface studies. Ind. Eng. Chem. Res. 2010, 49, 5997–6002. [Google Scholar] [CrossRef]
- Ghomi, M.A.; Mozammel, M.; Moghanni, H.; Shahkar, L. Atmospheric leaching of chalcopyrite in the presence of some polar organic reagents: A comparative study and optimization. Hydrometallurgy 2019, 189, 105120. [Google Scholar] [CrossRef]
- Nazari, G.; Dixon, D.G.; Dreisinger, D.B. Enhancing the kinetics of chalcopyrite leaching in the GalvanoxTM process. Hydrometallurgy 2011, 105, 251–258. [Google Scholar] [CrossRef]
- Dakubo, F.; Baygents, J.C.; Farrell, J. Peroxodisulfate assisted leaching of chalcopyrite. Hydrometallurgy 2012, 121–124, 68–73. [Google Scholar] [CrossRef]
- Naderi, H.; Abdollahy, M.; Mostoufi, N.; Koleini, M.J.; Shojaosadati, S.A.; Manafi, Z. Kinetics of chemical leaching of chalcopyrite from low grade copper ore: Behavior of different size fractions. Int. J. Miner. Metall. Mater. 2011, 18, 638–645. [Google Scholar] [CrossRef]
- Hiroyoshi, N.; Kuroiwa, S.; Miki, H.; Tsunekawa, M.; Hirajima, T. Synergistic effect of cupric and ferrous ions on active-passive behavior in anodic dissolution of chalcopyrite in sulfuric acid solutions. Hydrometallurgy 2004, 74, 103–116. [Google Scholar] [CrossRef]
- Mohammadabad, F.K.; Hejazi, S.; Khaki, J.V.; Babakhani, A. Mechanochemical leaching of chalcopyrite concentrate by sulfuric acid. Int. J. Miner. Metall. Mater. 2016, 23, 380–388. [Google Scholar] [CrossRef]
- Debernardi, G.; Carlesi, C. Chemical-electrochemical approaches to the study passivation of chalcopyrite. Miner. Process. Extr. Metall. Rev. 2013, 34, 10–41. [Google Scholar] [CrossRef]
- Granata, G.; Miura, A.; Liu, W.; Pagnanelli, F.; Tokoro, C. Iodide-assisted leaching of chalcopyrite in acidic ferric sulfate media. Hydrometallurgy 2019, 186, 244–251. [Google Scholar] [CrossRef]
- Dixon, D.G.; Mayne, D.D.; Baxter, K.G. GalvanoxTM—A novel galvanically-assisted atmospheric leaching technology for copper concentrates. Can. Metall. Q. 2008, 47, 327–336. [Google Scholar] [CrossRef]
- Klauber, C. A critical review of the surface chemistry of acidic ferric sulphate dissolution of chalcopyrite with regards to hindered dissolution. Int. J. Miner. Process. 2008, 86, 1–17. [Google Scholar] [CrossRef]
- Omran, M.; Fabritius, T.; Elmahdy, A.M.; Abdel-Khalek, N.A.; Gornostayev, S. Improvement of phosphorus removal from iron ore using combined microwave pretreatment and ultrasonic treatment. Sep. Purif. Technol. 2015, 156, 724–737. [Google Scholar] [CrossRef] [Green Version]
- Huang, Z.; Xie, F.; Ma, Y. Ultrasonic recovery of copper and iron through the simultaneous utilization of Printed Circuit Boards (PCB) spent acid etching solution and PCB waste sludge. J. Hazard. Mater. 2011, 185, 155–161. [Google Scholar] [CrossRef]
- Wang, X.; Srinivasakannan, C.; Duan, X.H.; Yang, J.H.; Yang, D.J.; Ju, S.H. Leaching kinetics of zinc residues augmented with ultrasound. Sep. Purif. Technol. 2013, 115, 66–72. [Google Scholar] [CrossRef]
- Tiwari, B.K. Ultrasound: A clean, green extraction technology. TrAC Trends Anal. Chem. 2015, 71, 100–109. [Google Scholar] [CrossRef]
- Dogan, H.T.; Kurtbas, A.; Tekin, T. The effect of ultrasound on the dissolution of pyrite ores in acidic and Fe2(SO4)3 solutions. Chem. Eng. Technol. 2004, 27, 87–89. [Google Scholar] [CrossRef]
- Beşe, A.V. Effect of ultrasound on the dissolution of copper from copper converter slag by acid leaching. Ultrason. Sonochem. 2007, 14, 790–796. [Google Scholar] [CrossRef] [PubMed]
- Zhang, J.; Wu, A.-X.; Wang, Y.-M.; Chen, X.-S. Experimental research in leaching of copper-bearing tailings enhanced by ultrasonic treatment. J. China Univ. Min. Technol. 2008, 18, 98–102. [Google Scholar] [CrossRef]
- Yoon, H.S.; Kim, C.J.; Chung, K.W.; Lee, J.Y.; Shin, S.M.; Kim, S.R.; Jang, M.H.; Kim, J.H.; Lee, S.I.; Yoo, S.J. Ultrasonic-assisted leaching kinetics in aqueous FeCl3-HCl solution for the recovery of copper by hydrometallurgy from poorly soluble chalcopyrite. Korean J. Chem. Eng. 2017, 34, 1748–1755. [Google Scholar] [CrossRef]
- Chen, B.; Bao, S.; Zhang, Y.; Li, S. A high-efficiency and sustainable leaching process of vanadium from shale in sulfuric acid systems enhanced by ultrasound. Sep. Purif. Technol. 2020, 240, 116624. [Google Scholar] [CrossRef]
- Zhang, R.L.; Zhang, X.F.; Tang, S.Z.; Huang, A.D. Ultrasound-assisted HCl-NaCl leaching of lead-rich and antimony-rich oxidizing slag. Ultrason. Sonochem. 2015, 27, 187–191. [Google Scholar] [CrossRef]
- Avvaru, B.; Roy, S.B.; Chowdhury, S.; Hareendran, K.N.; Pandit, A.B. Enhancement of the leaching rate of uranium in the presence of ultrasound. Ind. Eng. Chem. Res. 2006, 45, 7639–7648. [Google Scholar] [CrossRef]
- Munoz, P.B.; Miller, J.D.; Wadsworth, M.E. Reaction mechanism for the acid ferric sulfate leaching of chalcopyrite. Metall. Trans. B 1979, 10, 149–158. [Google Scholar] [CrossRef]
- Guo, P.; Wang, S.; Zhang, L. Selective removal of antimony from refractory gold ores by ultrasound. Hydrometallurgy 2019, 190, 105161. [Google Scholar] [CrossRef]
- Ghahremaninezhad, A.; Dixon, D.G.; Asselin, E. Kinetics of the ferric-ferrous couple on anodically passivated chalcopyrite (CuFeS 2) electrodes. Hydrometallurgy 2012, 125–126, 42–49. [Google Scholar] [CrossRef]
- Yue, G.; Asselin, E. Kinetics of ferric ion reduction on chalcopyrite and its influence on leaching up to 150 °C. Electrochim. Acta 2014, 146, 307–321. [Google Scholar] [CrossRef]
- Ma, J.; Zhang, Y.; Qin, Y.; Wu, Z.; Wang, T.; Wang, C. The leaching kinetics of K-feldspar in sulfuric acid with the aid of ultrasound. Ultrason. Sonochem. 2017, 35, 304–312. [Google Scholar] [CrossRef]
- Cháidez, J.; Parga, J.; Valenzuela, J.; Carrillo, R.; Almaguer, I. Leaching chalcopyrite concentrate with oxygen and sulfuric acid using a low-pressure reactor. Metals 2019, 9. [Google Scholar] [CrossRef] [Green Version]
- Nazari, G.; Dixon, D.G.; Dreisinger, D.B. The role of silver-enhanced pyrite in enhancing the electrical conductivity of sulfur product layer during chalcopyrite leaching in the GalvanoxTM process. Hydrometallurgy 2012, 113–114, 177–184. [Google Scholar] [CrossRef]
- Córdoba, E.M.; Muñoz, J.A.; Blázquez, M.L.; González, F.; Ballester, A. Leaching of chalcopyrite with ferric ion. Part III: Effect of redox potential on the silver-catalyzed process. Hydrometallurgy 2008, 93, 97–105. [Google Scholar] [CrossRef]
- Safari, V.; Arzpeyma, G.; Rashchi, F.; Mostoufi, N. A shrinking particle-shrinking core model for leaching of a zinc ore containing silica. Int. J. Miner. Process. 2009, 93, 79–83. [Google Scholar] [CrossRef]
- Levenspiel, O. Chemical reaction engineering. Ind. Eng. Chem. Res. 1999, 38, 4140–4143. [Google Scholar] [CrossRef]
- Zhang, Y.F.; Ma, J.; Qin, Y.H.; Zhou, J.F.; Yang, L.; Wu, Z.K.; Wang, T.L.; Wang, W.G.; Wang, C.W. Ultrasound-assisted leaching of potassium from phosphorus-potassium associated ore. Hydrometallurgy 2016, 166, 237–242. [Google Scholar] [CrossRef]
- Golmohammadzadeh, R.; Rashchi, F.; Vahidi, E. Recovery of lithium and cobalt from spent lithium-ion batteries using organic acids: Process optimization and kinetic aspects. Waste Manag. 2017, 64, 244–254. [Google Scholar] [CrossRef] [PubMed]
- Tekin, T.; Tekin, D.; Bayramoǧlu, M. Effect of ultrasound on the dissolution kinetics of phosphate rock in HNO3. Ultrason. Sonochem. 2001, 8, 373–377. [Google Scholar] [CrossRef]
- Ferrero, F.; Periolatto, M. Ultrasound for low temperature dyeing of wool with acid dye. Ultrason. Sonochem. 2012, 19, 601–606. [Google Scholar] [CrossRef] [PubMed]
- Mesci, A.K.; Sevim, F. Dissolution of magnesia in aqueous carbon dioxide by ultrasound. Int. J. Miner. Process. 2006, 79, 83–88. [Google Scholar] [CrossRef]


| Chalcopyrite | Cu | Fe | S | Pb | Zn | Al | As | Ca | K | Mg | P | Na |
|---|---|---|---|---|---|---|---|---|---|---|---|---|
| wt% | 18.2 | 30.0 | 34.3 | 0.16 | 0.2 | 0.5 | 0.23 | 1.0 | 0.2 | 0.2 | 0.2 | 0.75 |
| Treatment | Residue (g) | Total Sulfur (g) | Elemental Sulfur (g) |
|---|---|---|---|
| 50 °C, non-UAL | 1.5455 | 0.5687 | 0.0780 |
| 50 °C, UAL | 1.5676 | 0.5876 | 0.0361 |
| 80 °C, non-UAL | 1.4641 | 0.4964 | 0.1091 |
| 80 °C, UAL | 1.4652 | 0.5778 | 0.0672 |
© 2020 by the authors. Licensee MDPI, Basel, Switzerland. This article is an open access article distributed under the terms and conditions of the Creative Commons Attribution (CC BY) license (http://creativecommons.org/licenses/by/4.0/).
Share and Cite
Wang, J.; Faraji, F.; Ghahreman, A. Effect of Ultrasound on the Oxidative Copper Leaching from Chalcopyrite in Acidic Ferric Sulfate Media. Minerals 2020, 10, 633. https://doi.org/10.3390/min10070633
Wang J, Faraji F, Ghahreman A. Effect of Ultrasound on the Oxidative Copper Leaching from Chalcopyrite in Acidic Ferric Sulfate Media. Minerals. 2020; 10(7):633. https://doi.org/10.3390/min10070633
Chicago/Turabian StyleWang, Jingxiu, Fariborz Faraji, and Ahmad Ghahreman. 2020. "Effect of Ultrasound on the Oxidative Copper Leaching from Chalcopyrite in Acidic Ferric Sulfate Media" Minerals 10, no. 7: 633. https://doi.org/10.3390/min10070633