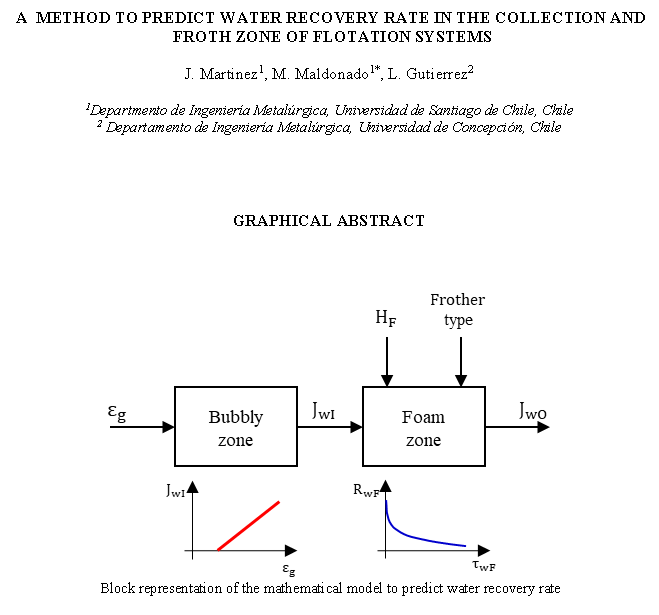
A Method to Predict Water Recovery Rate in the Collection and Froth Zone of Flotation Systems


Abstract
:
1. Introduction
2. Experimental
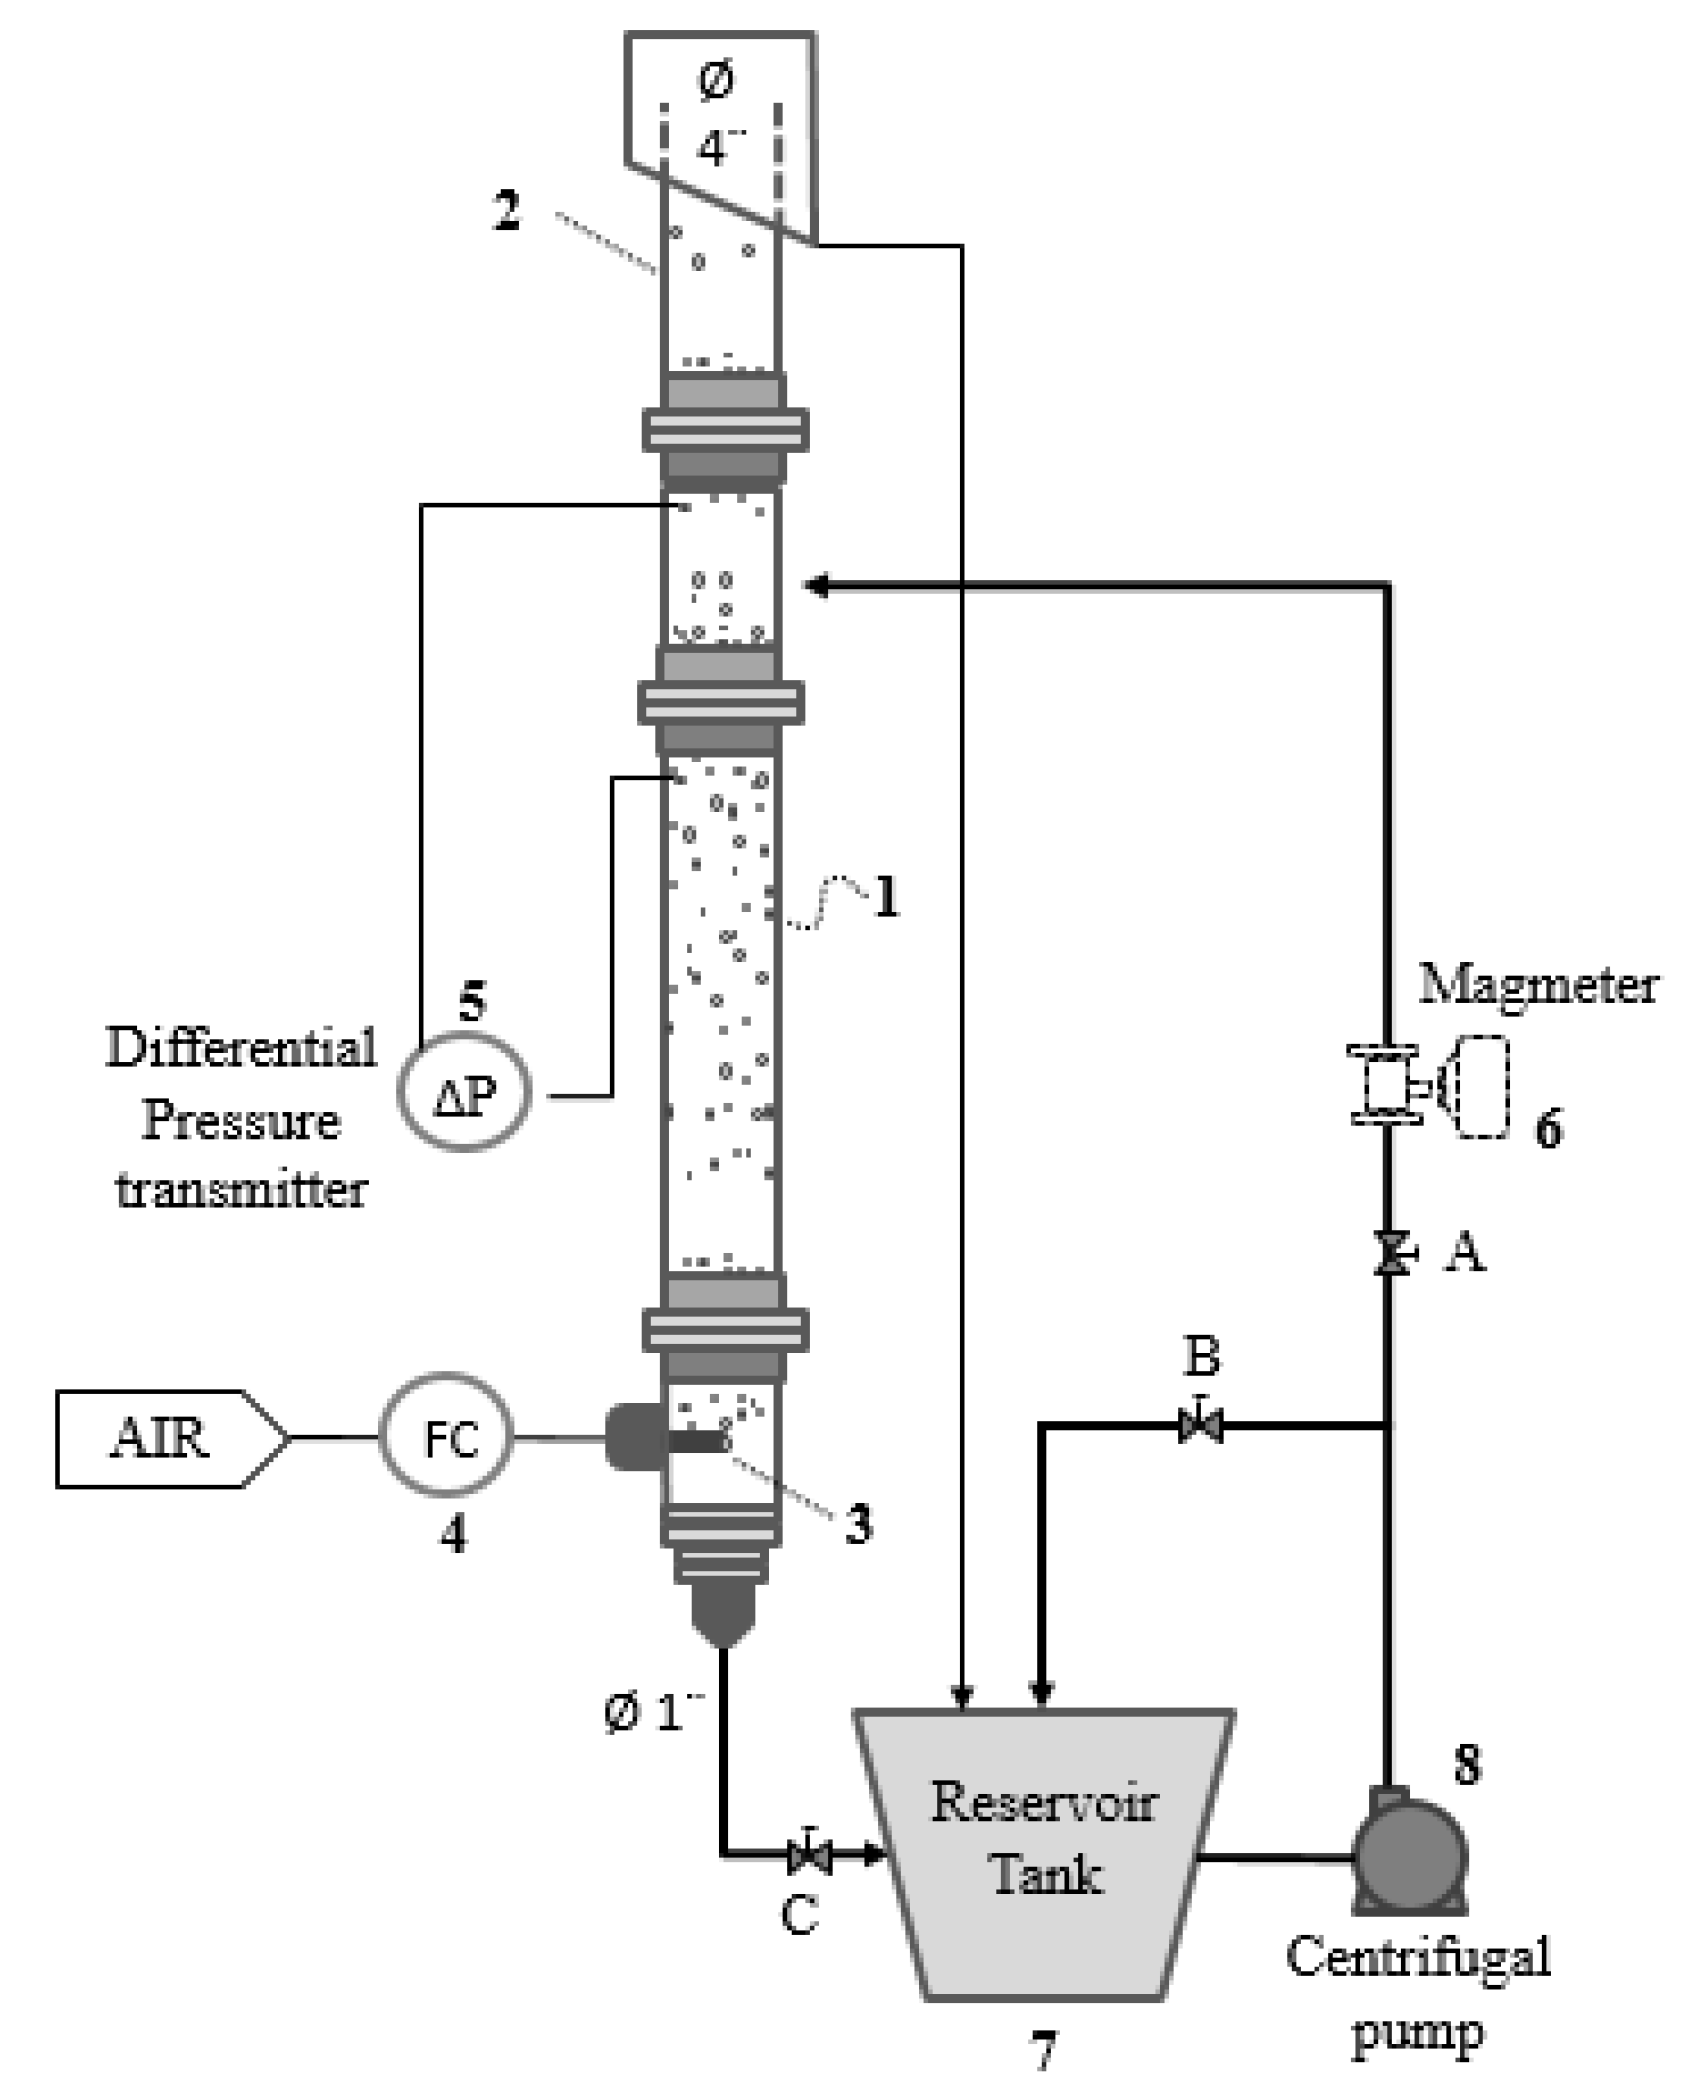
2.1. Column Set Up
2.2. Test Conditions
3. Results
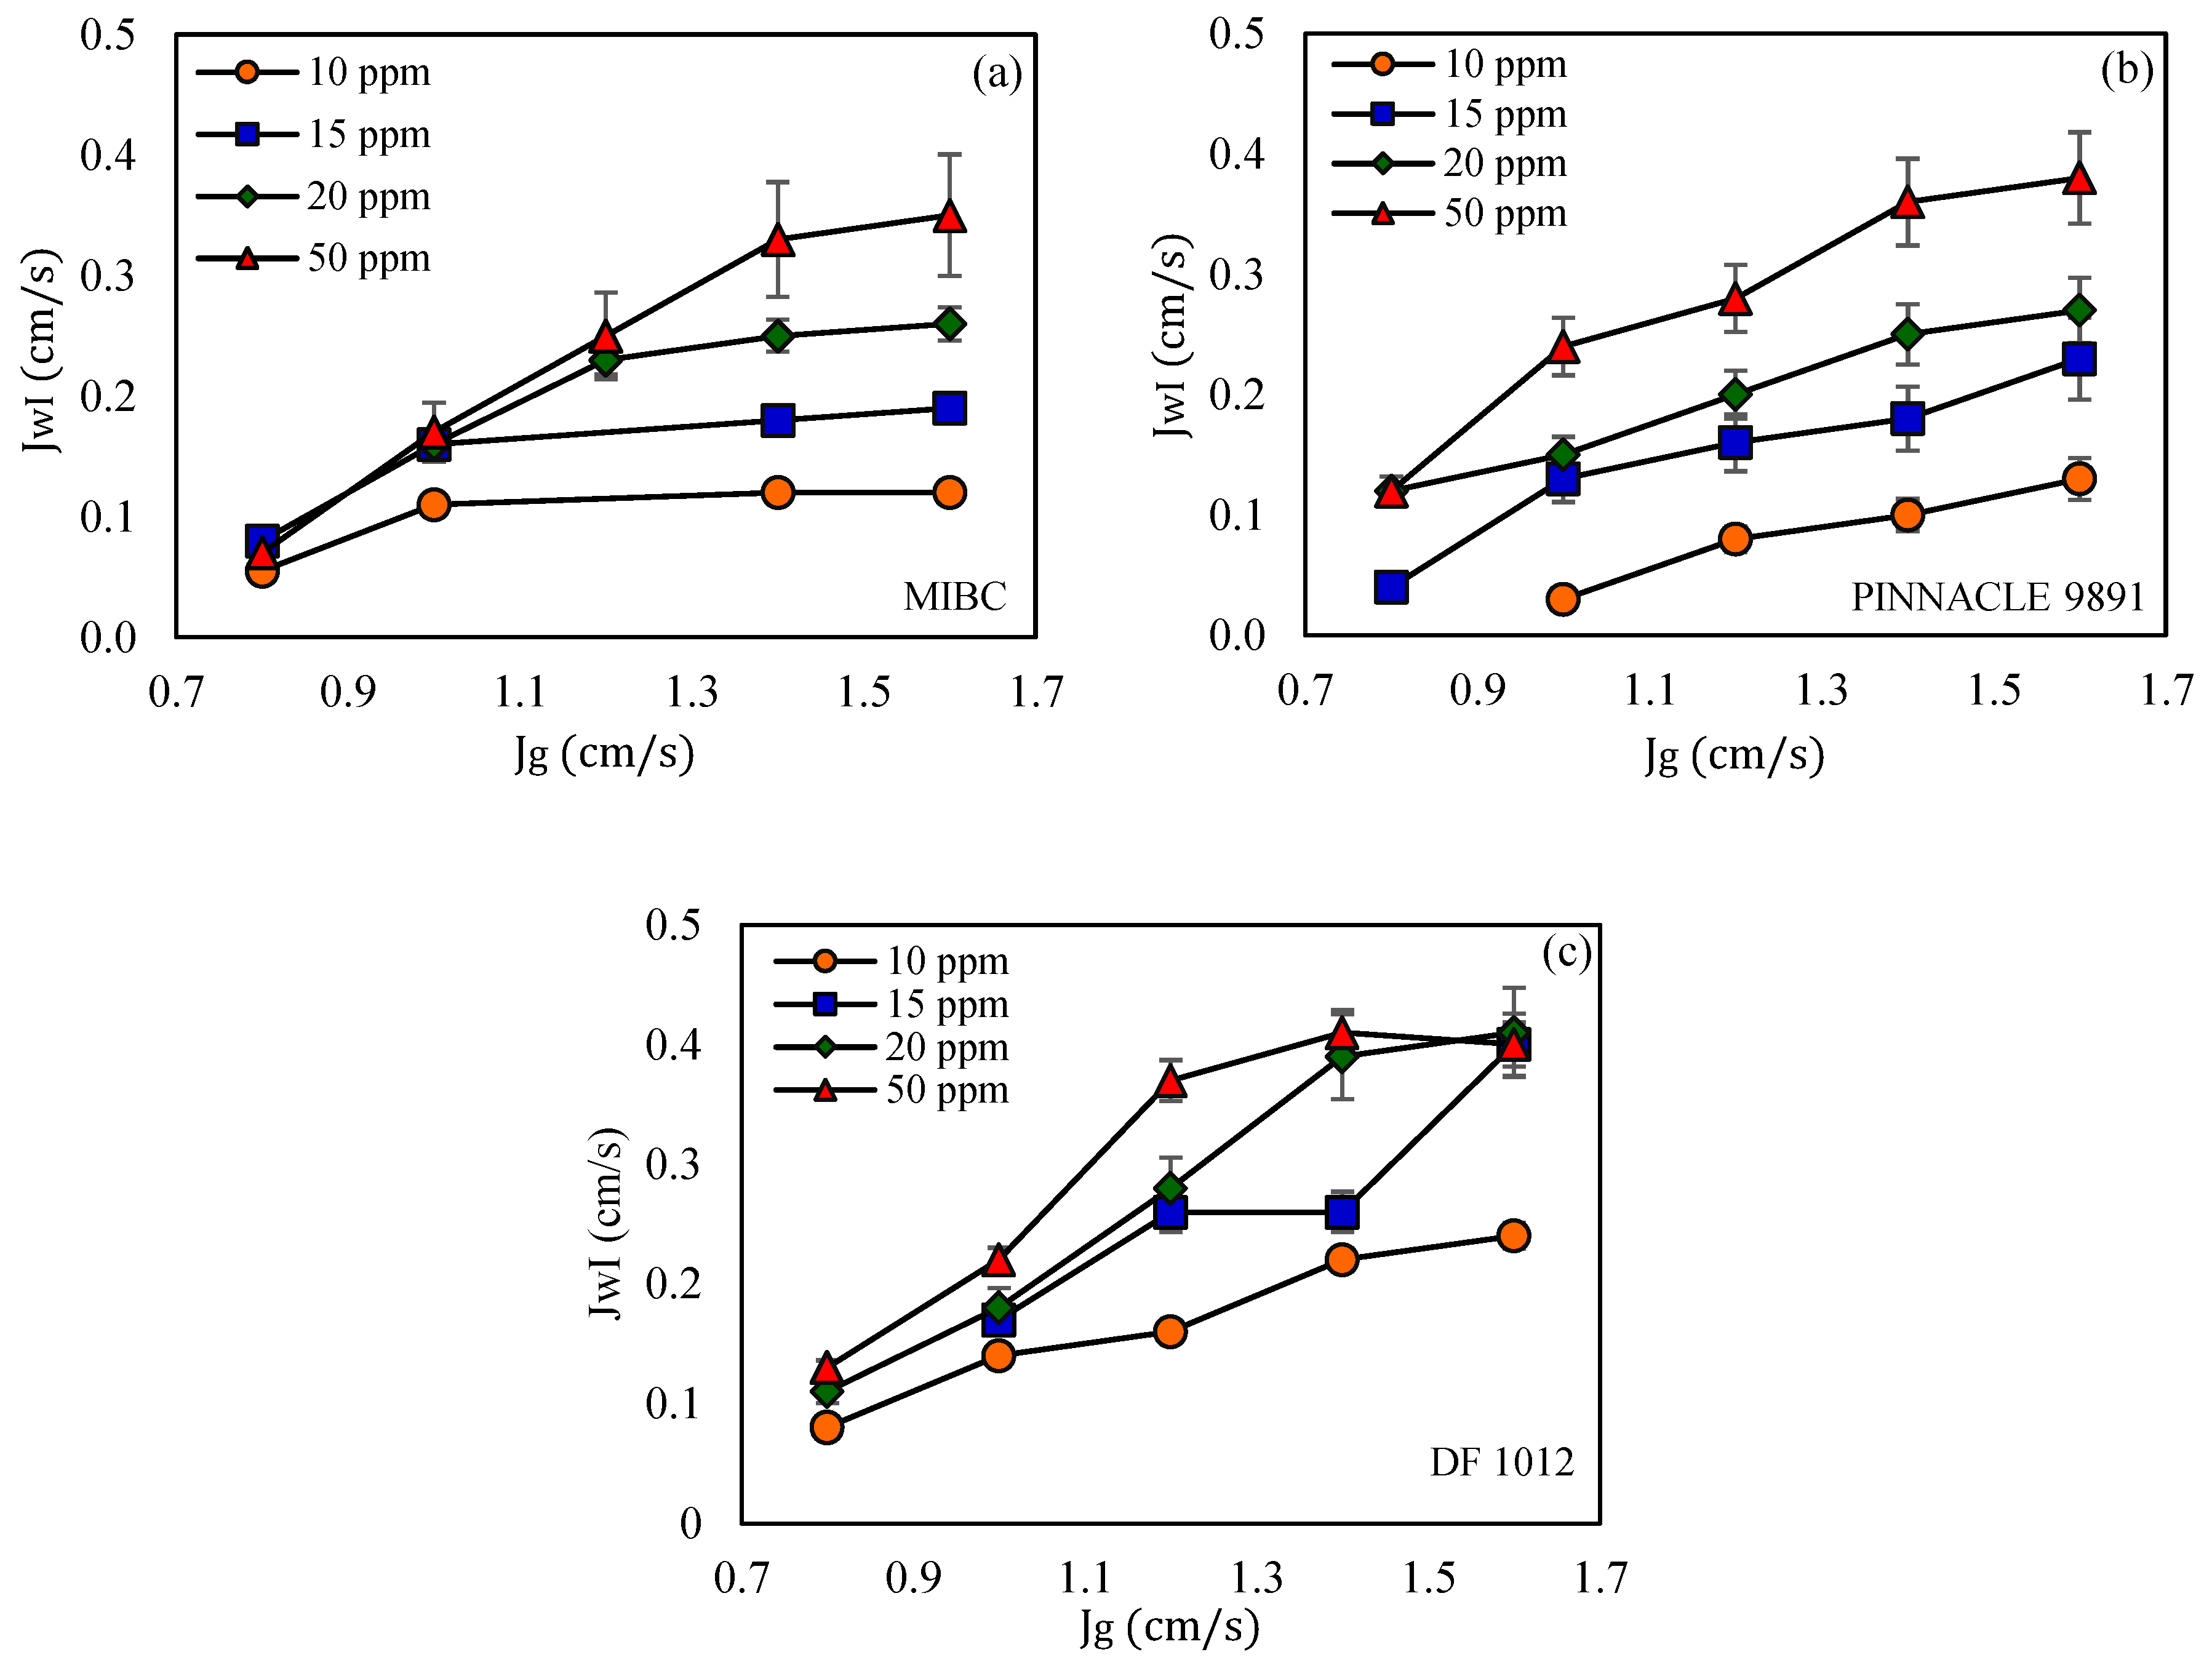
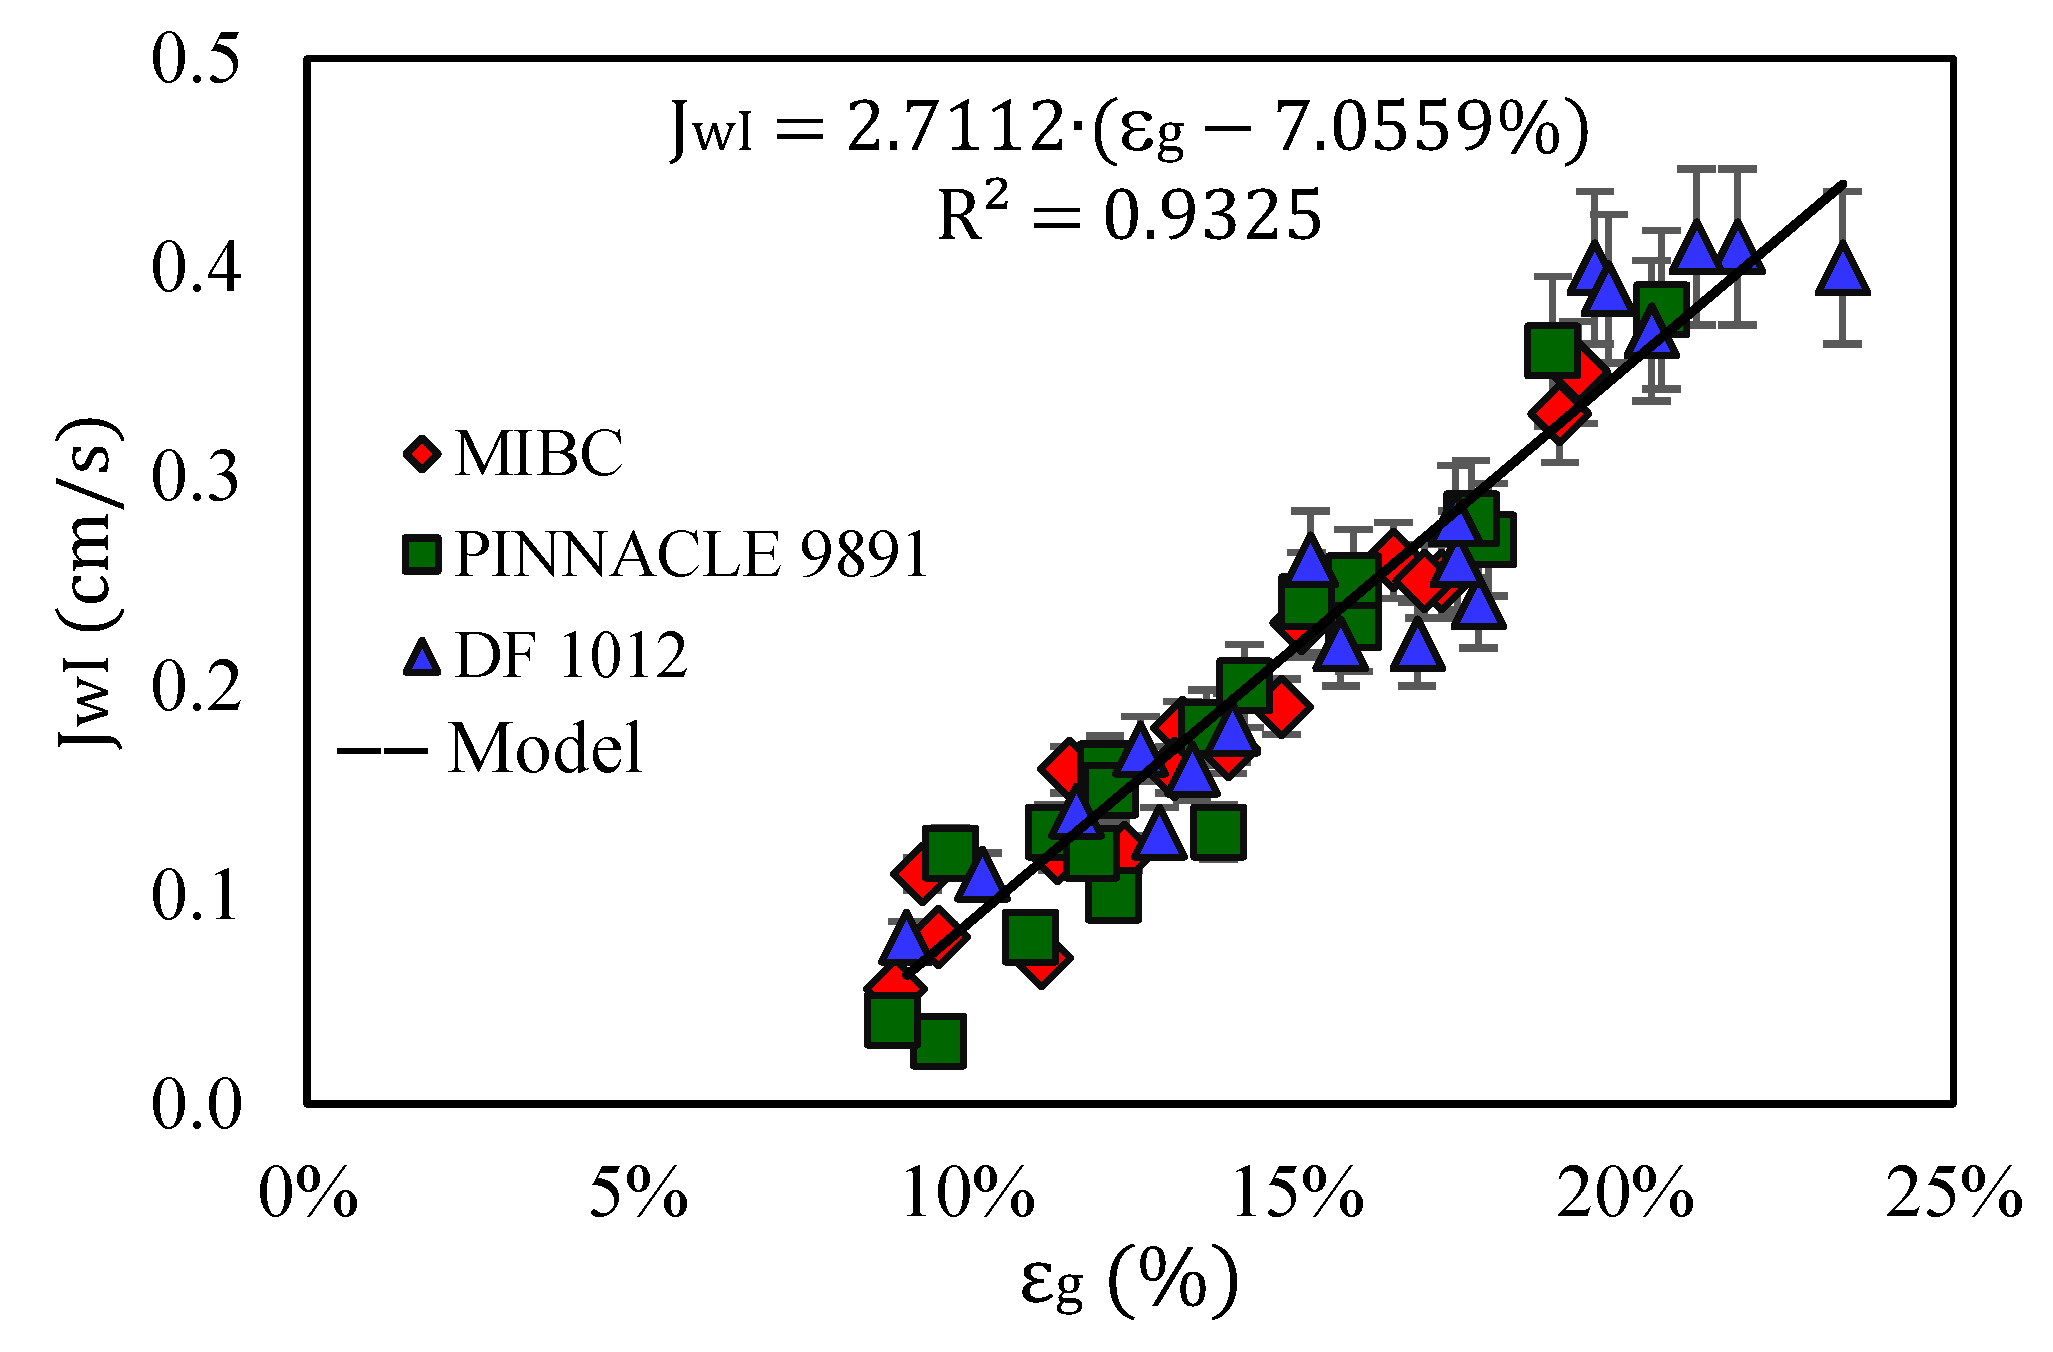
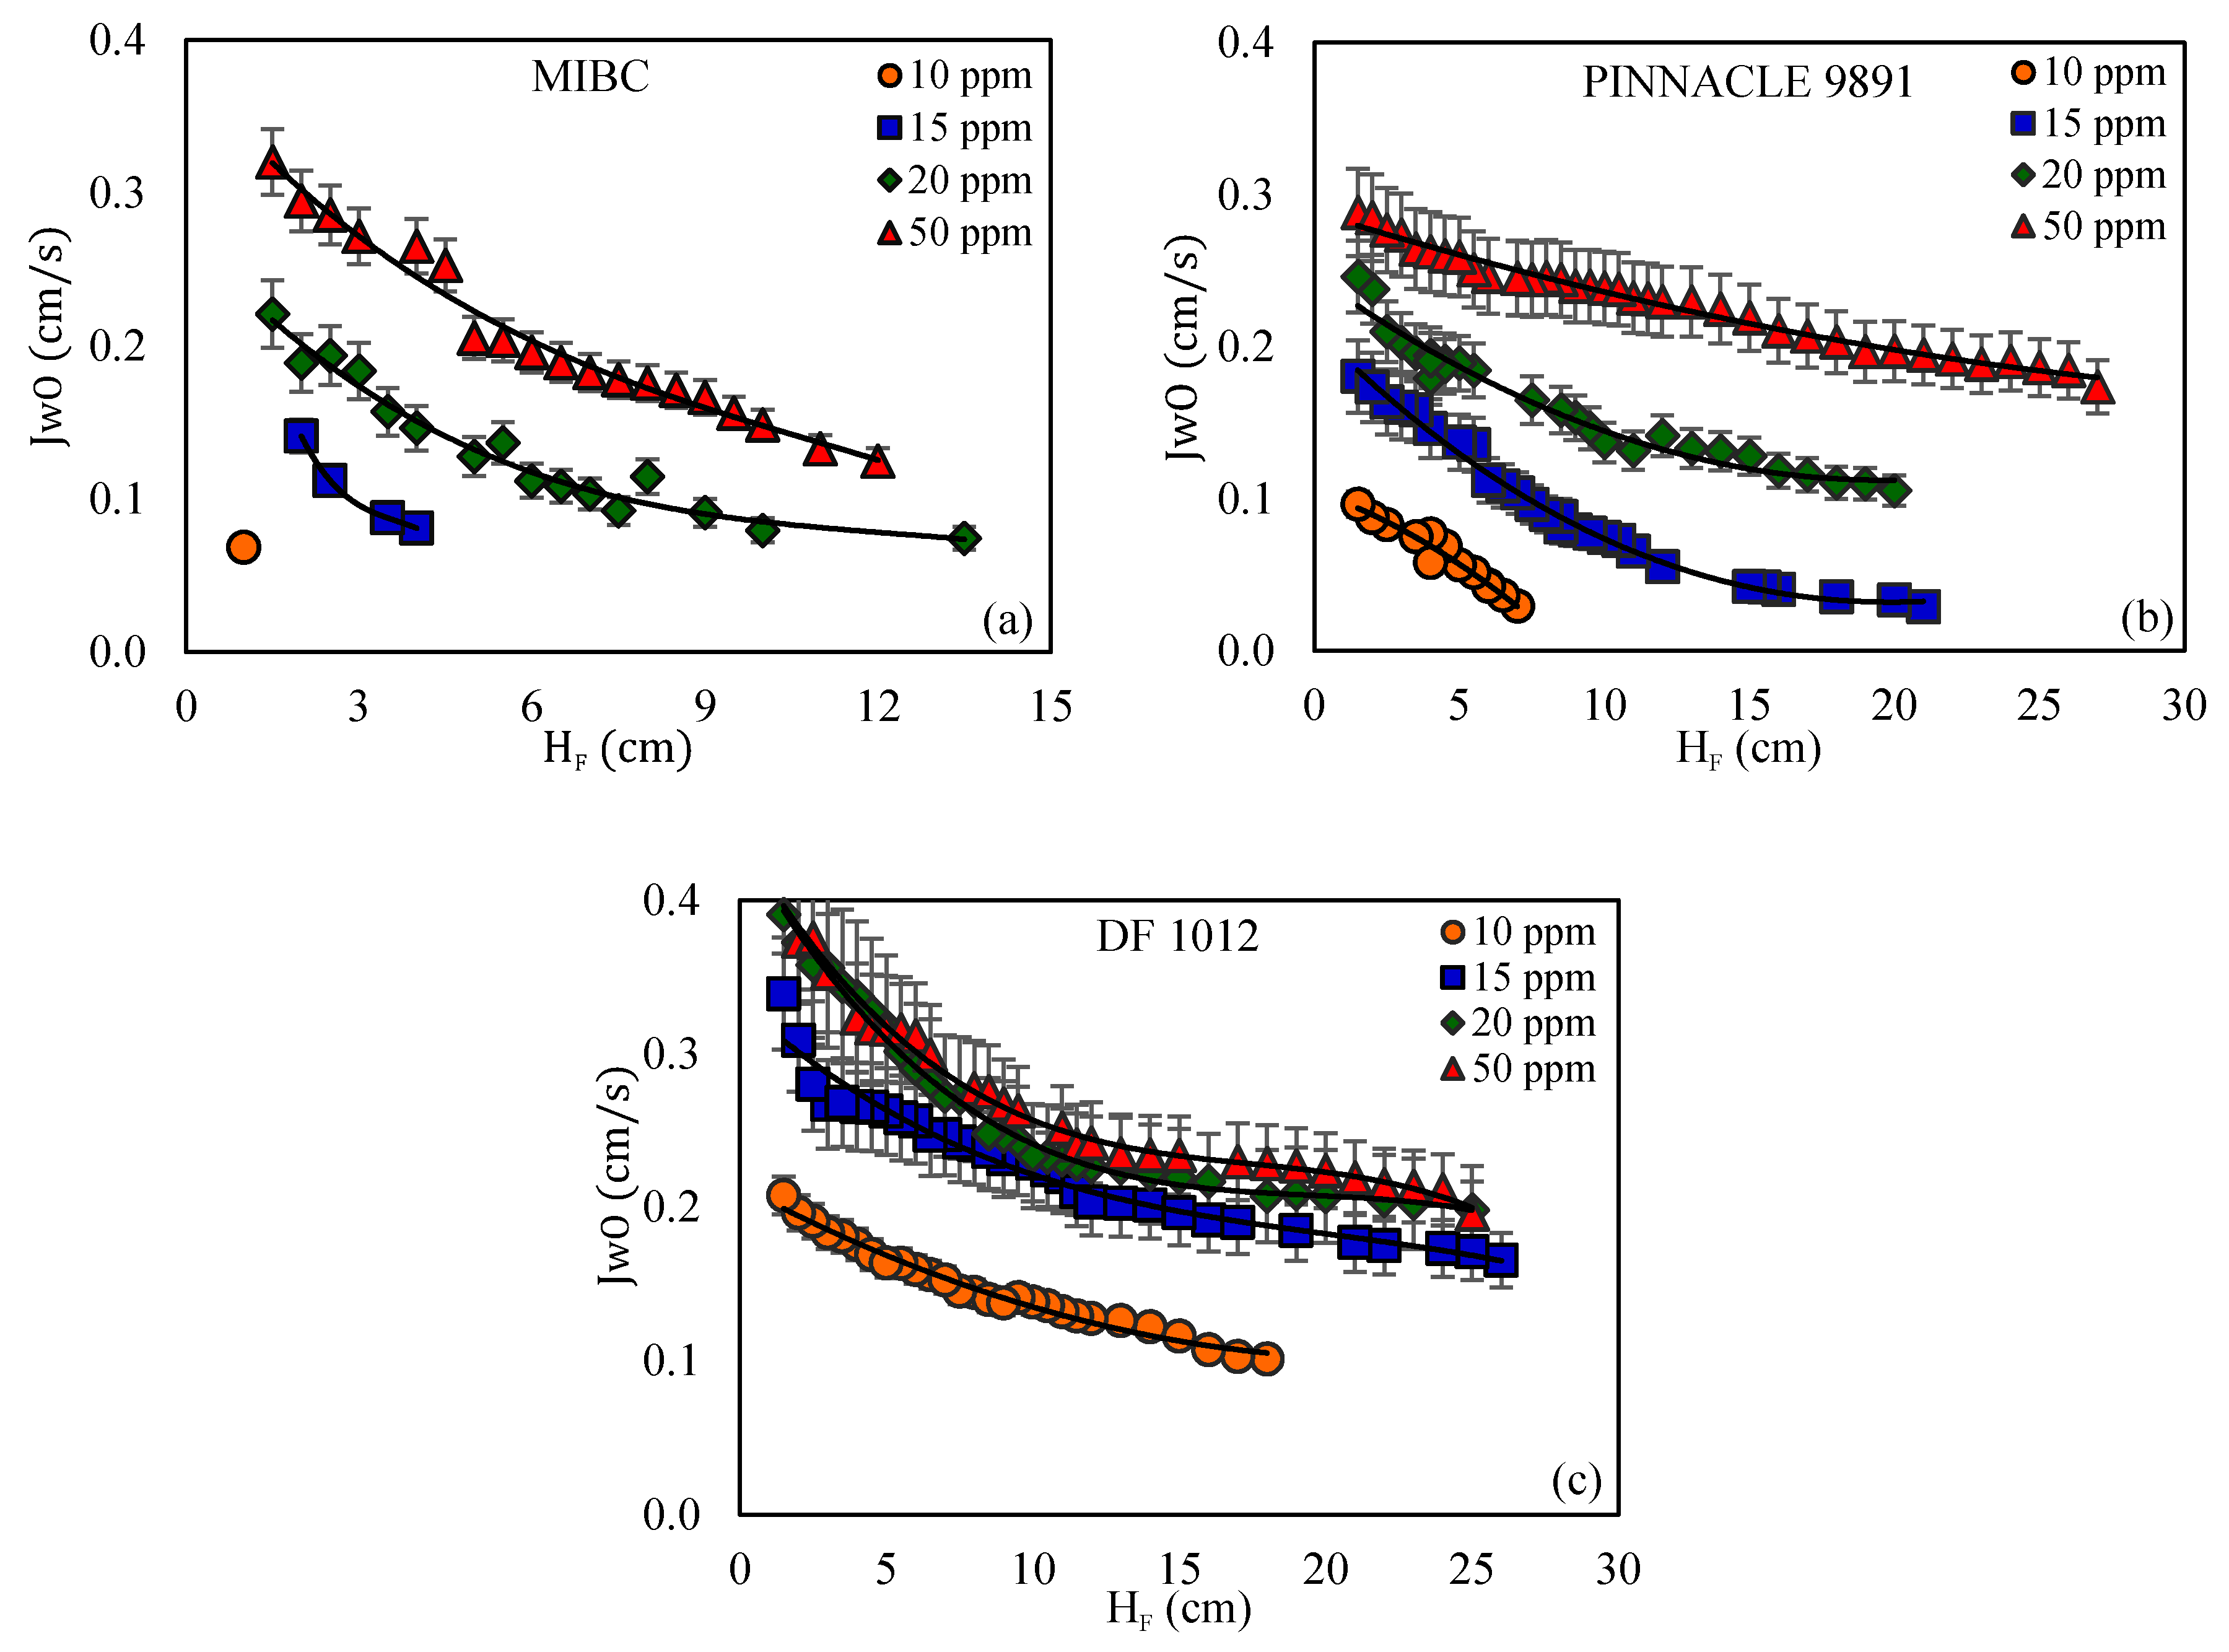
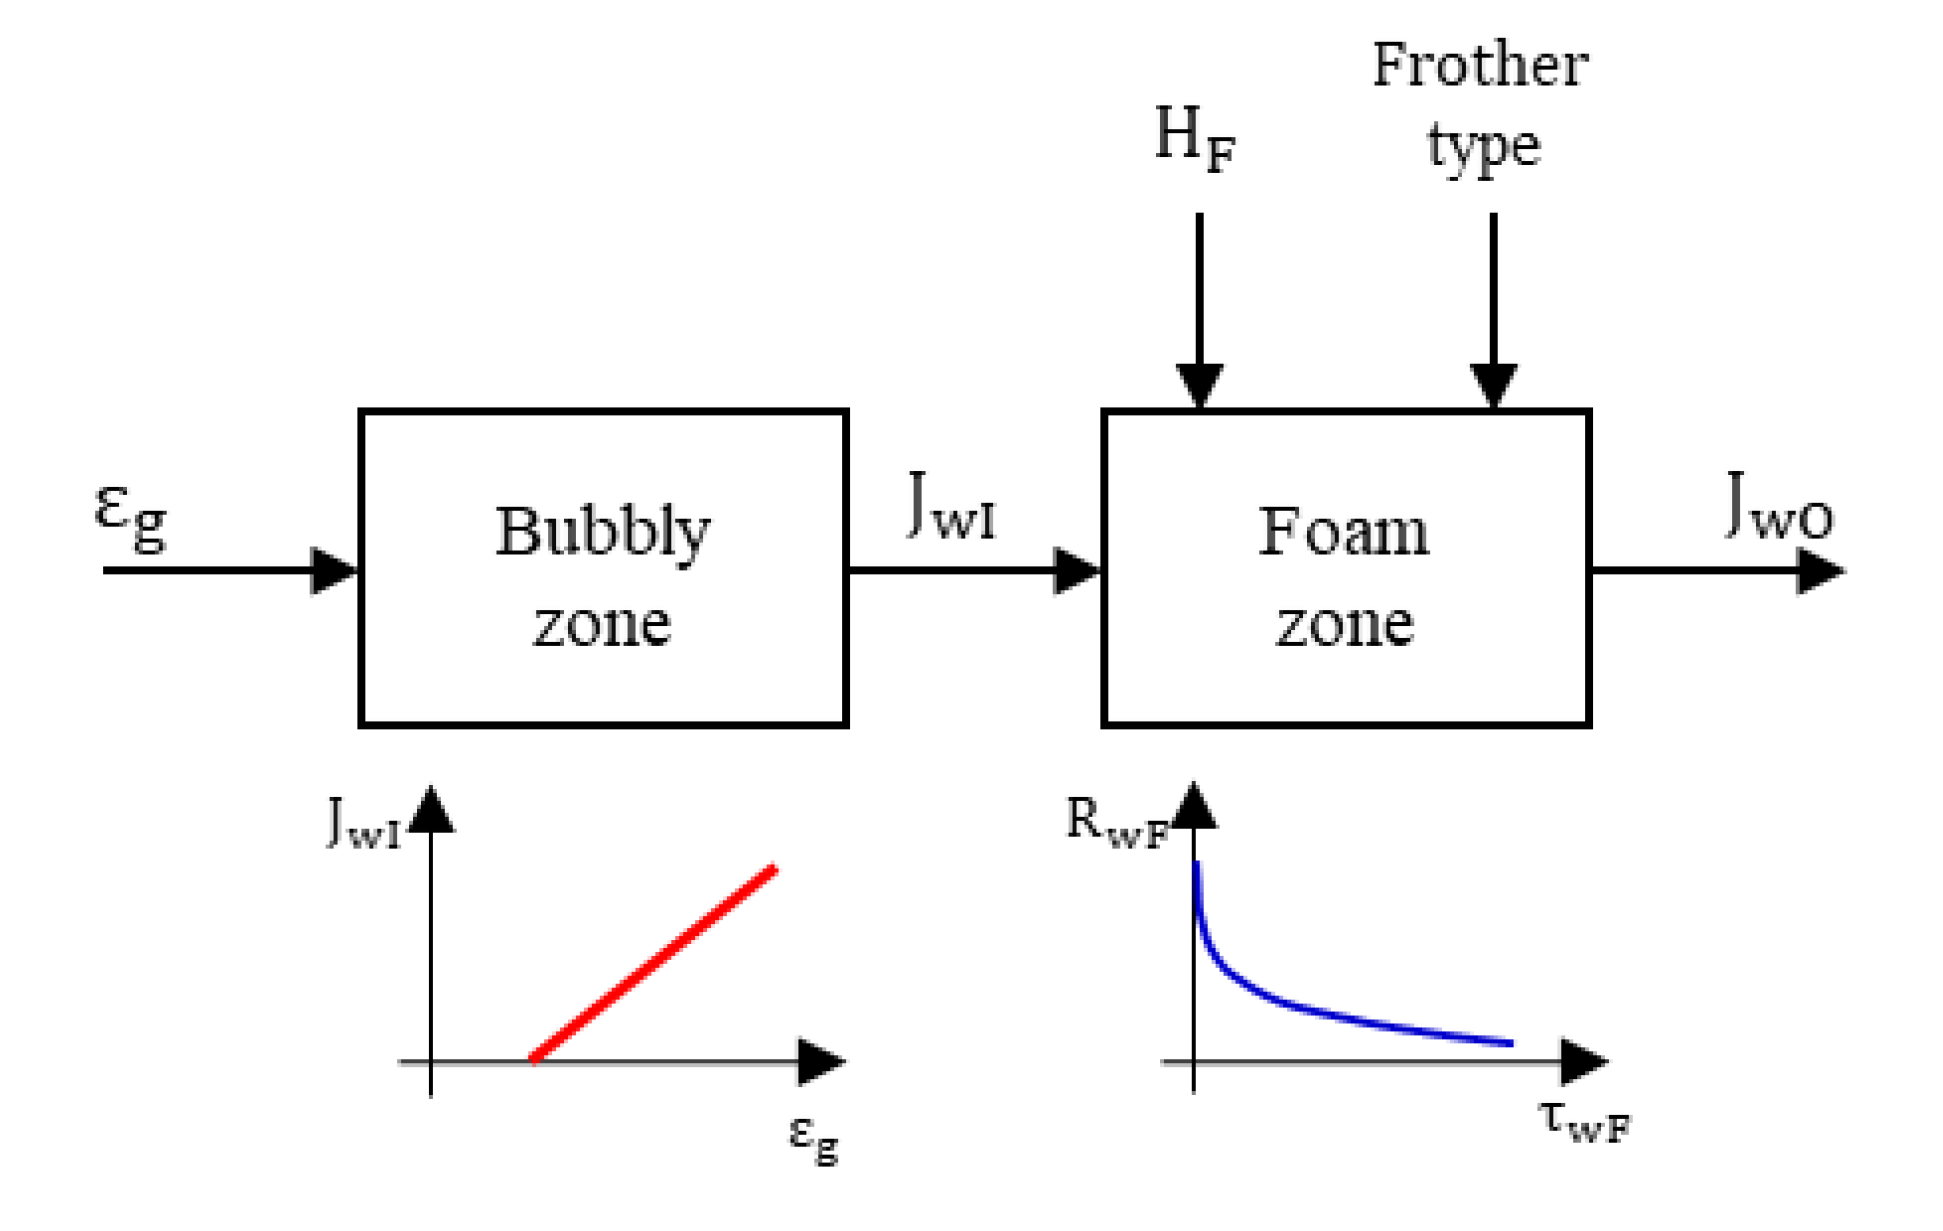
3.1. Collection Zone Water Carrying Rate
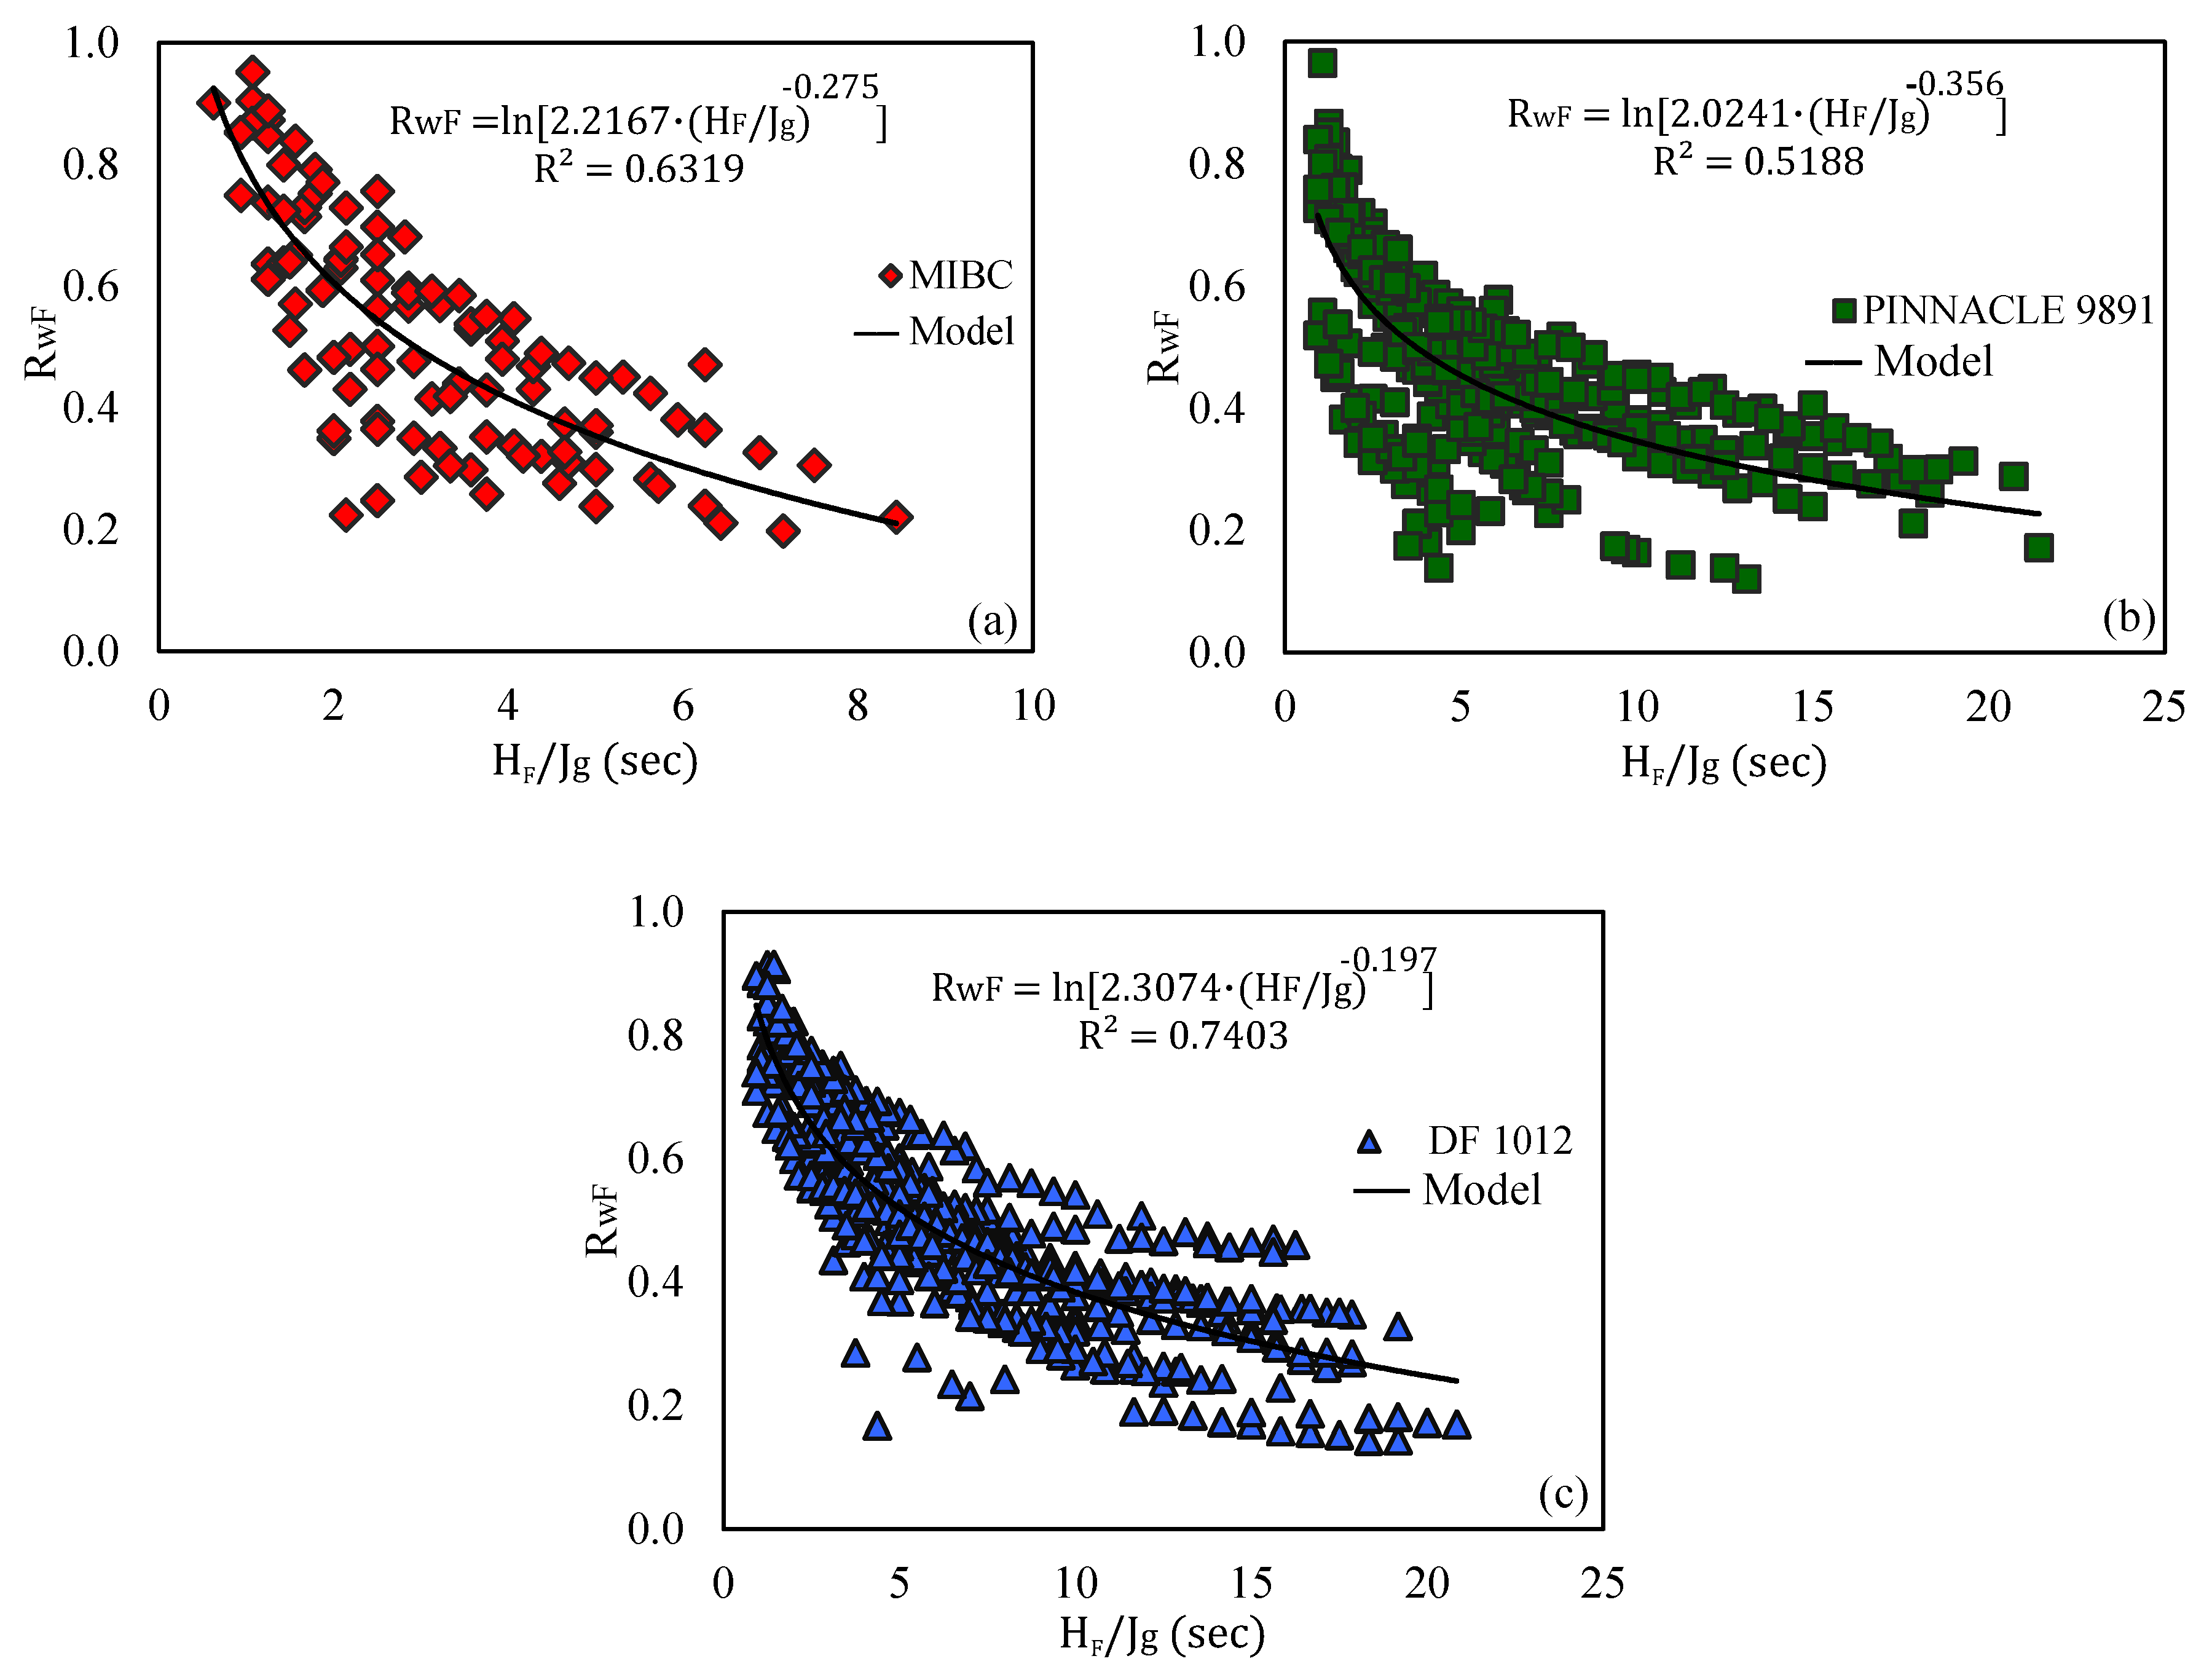
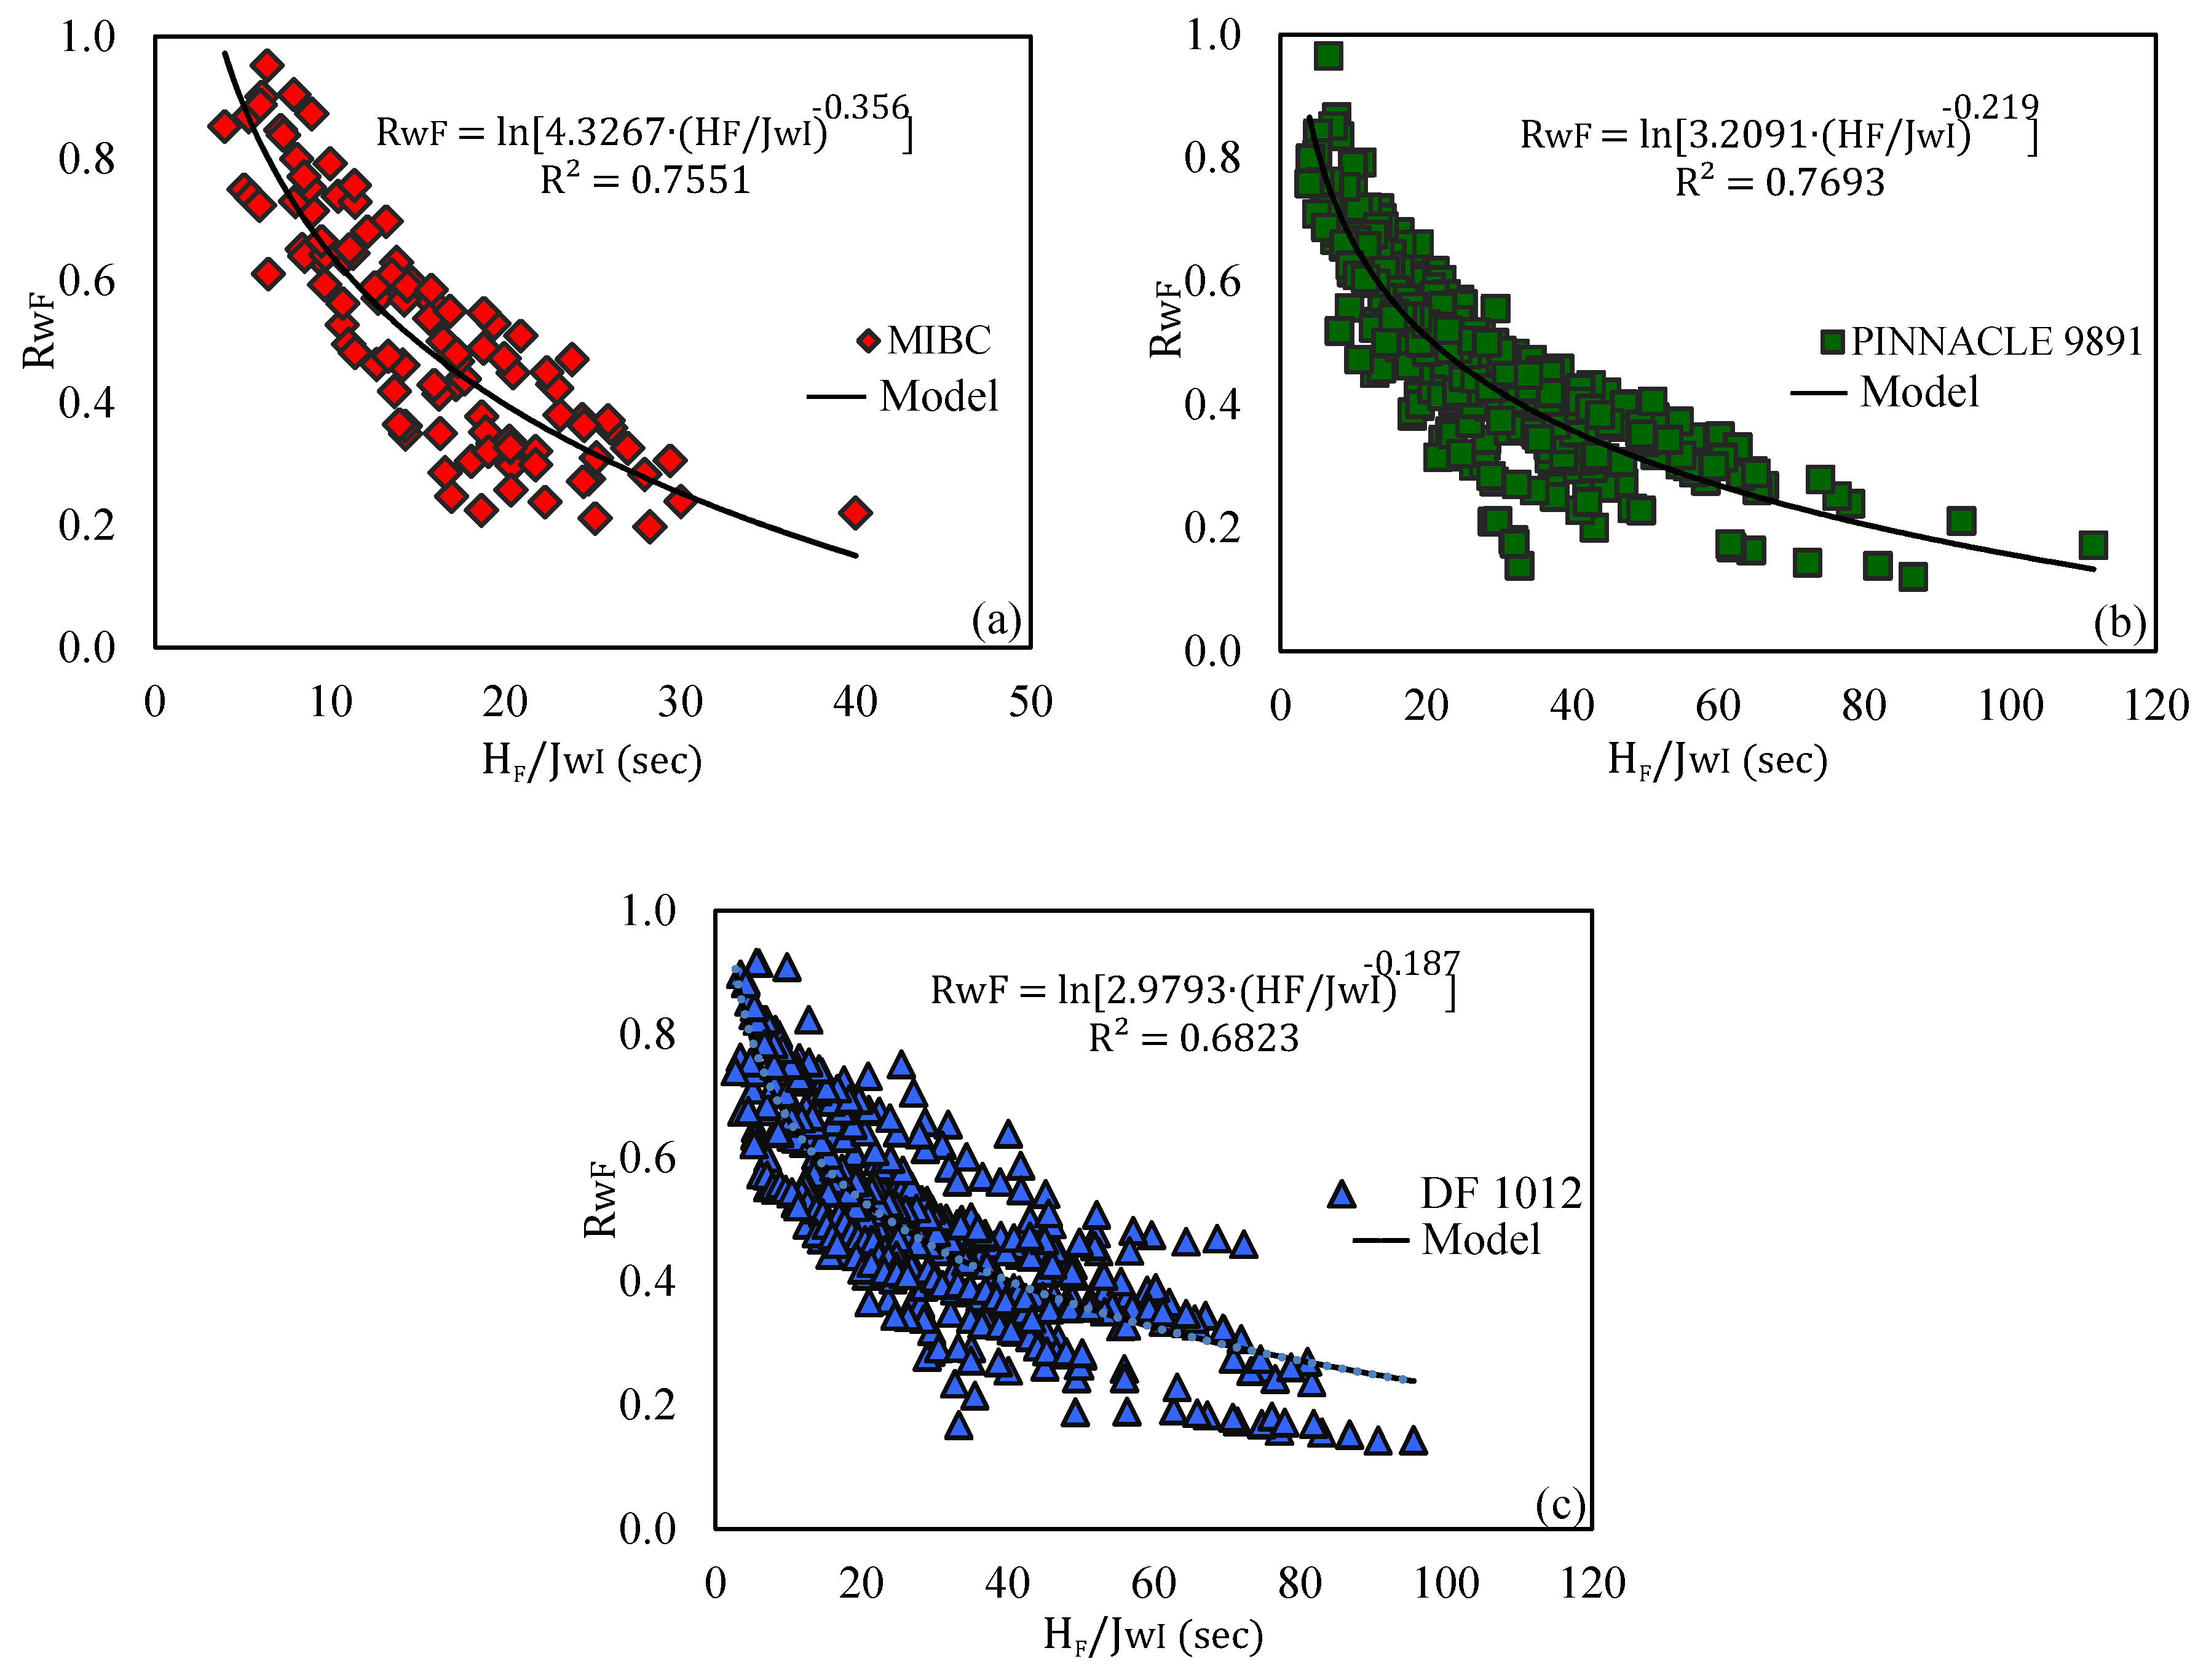
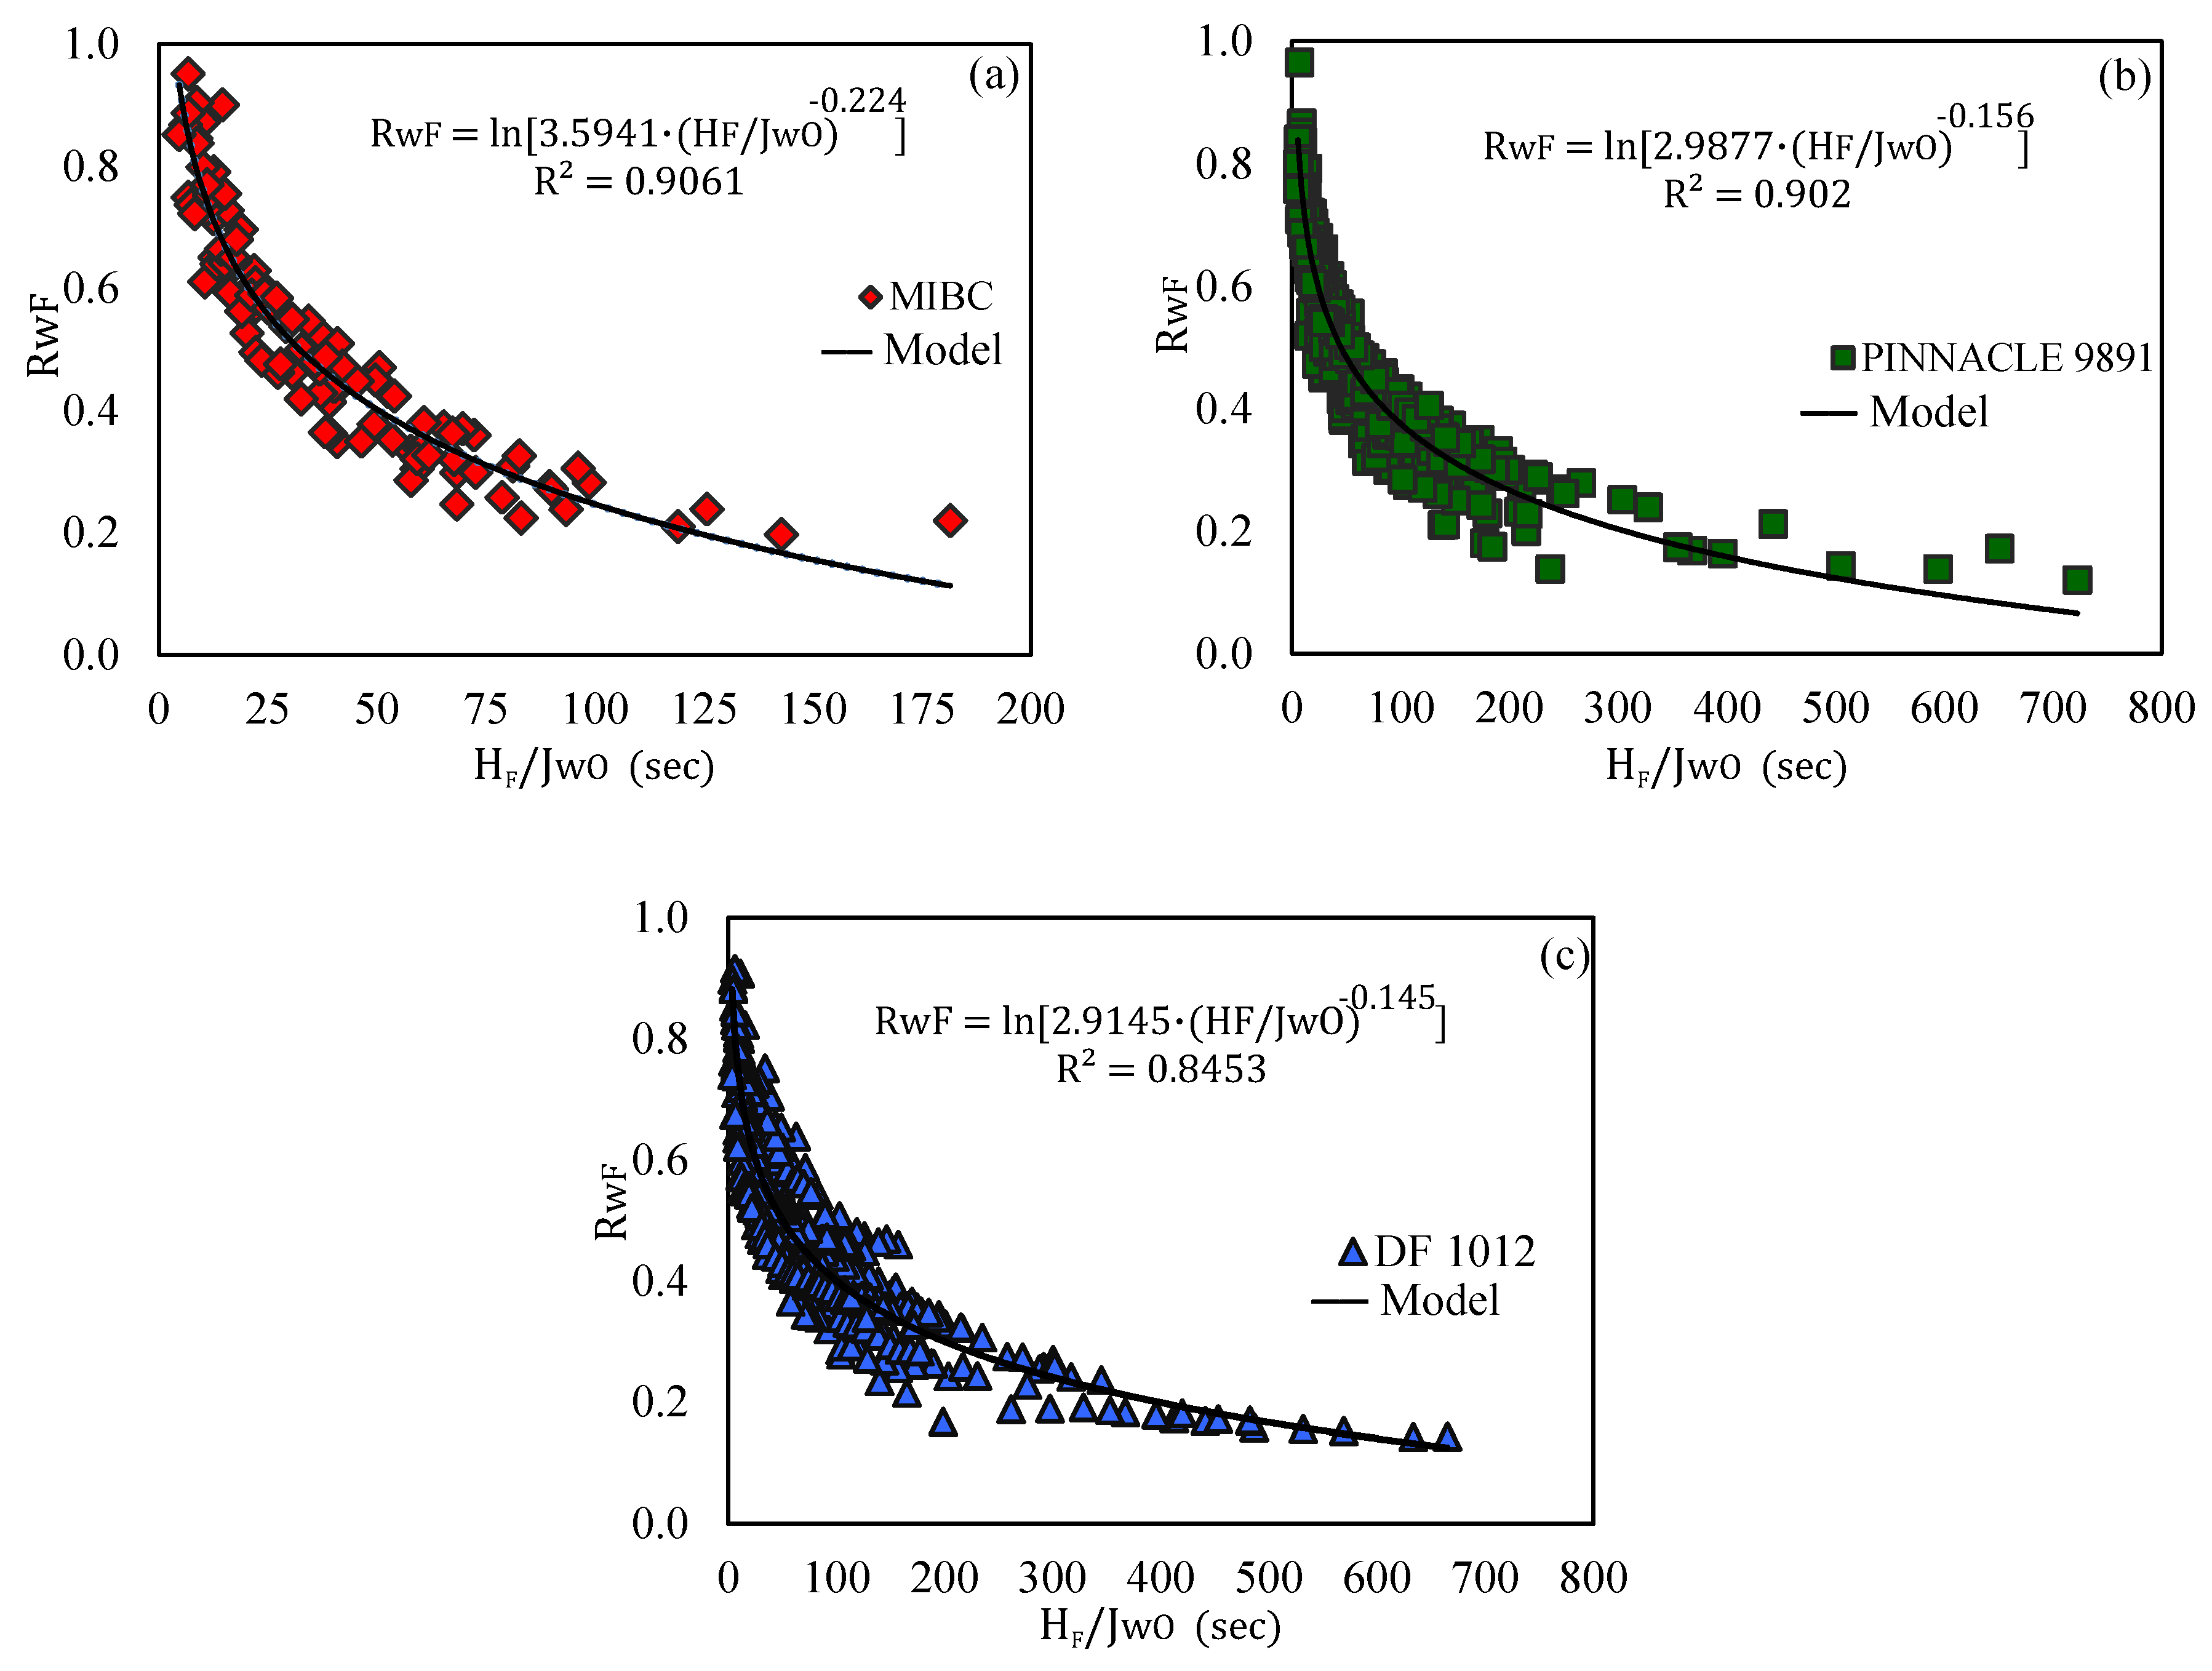
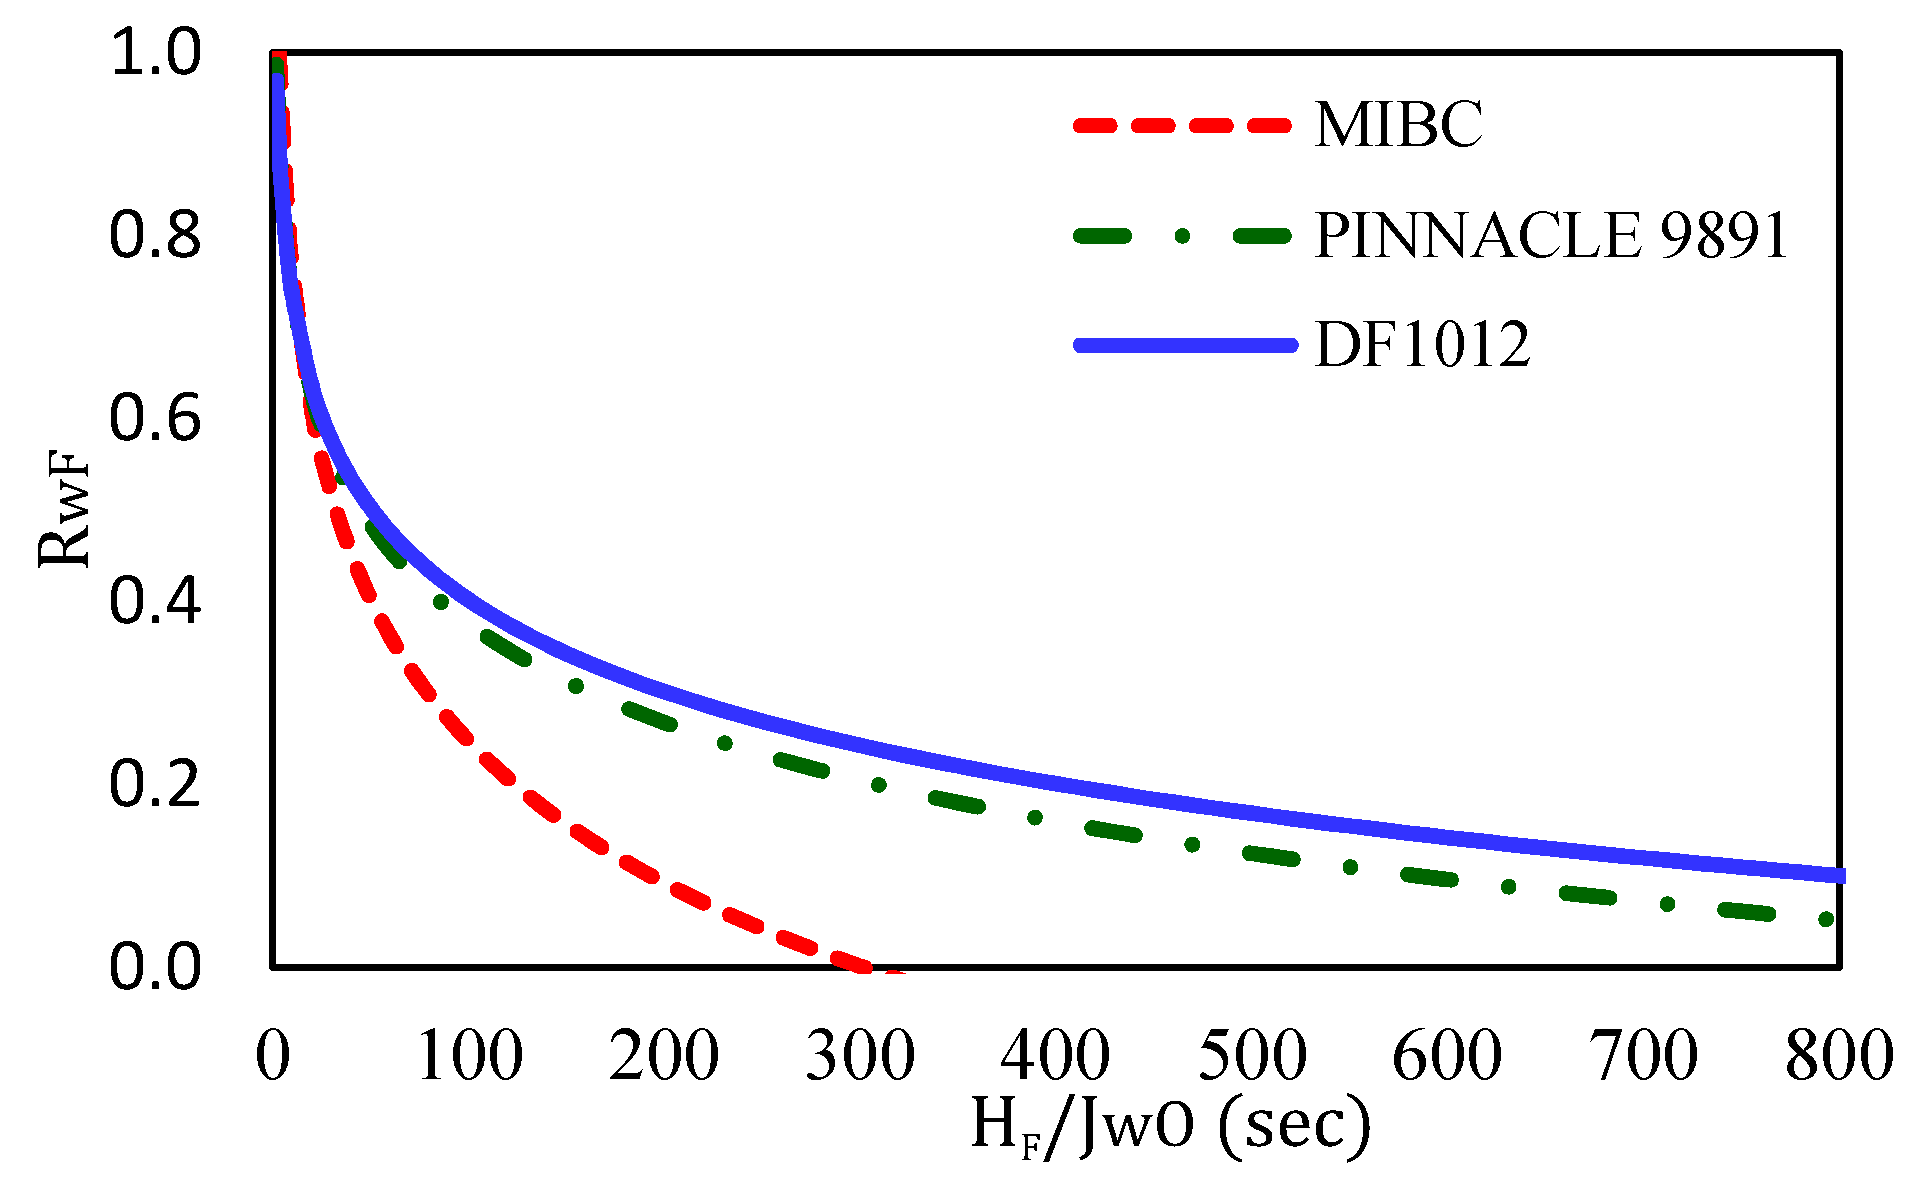
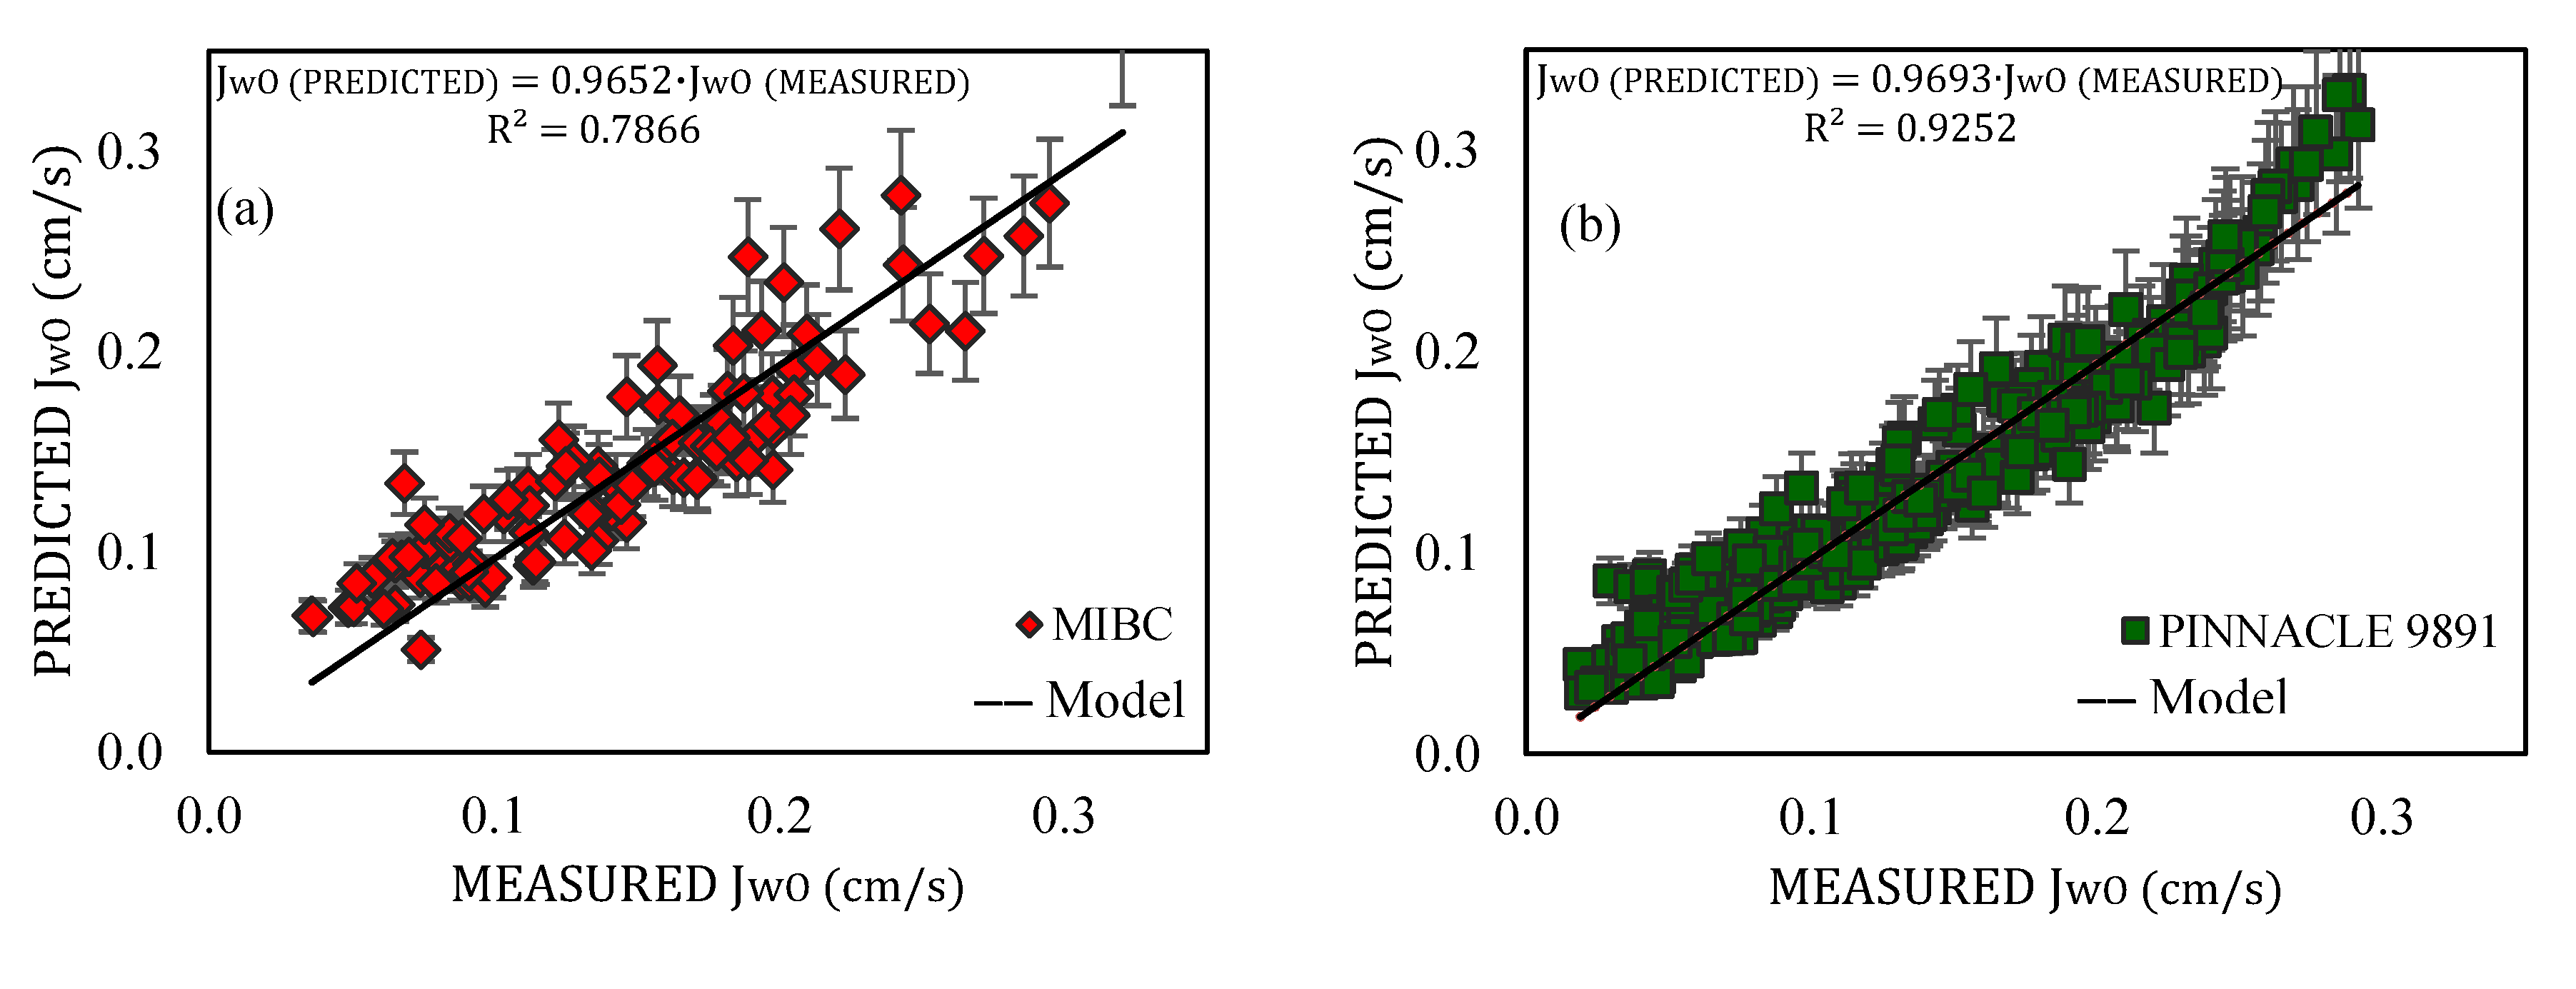
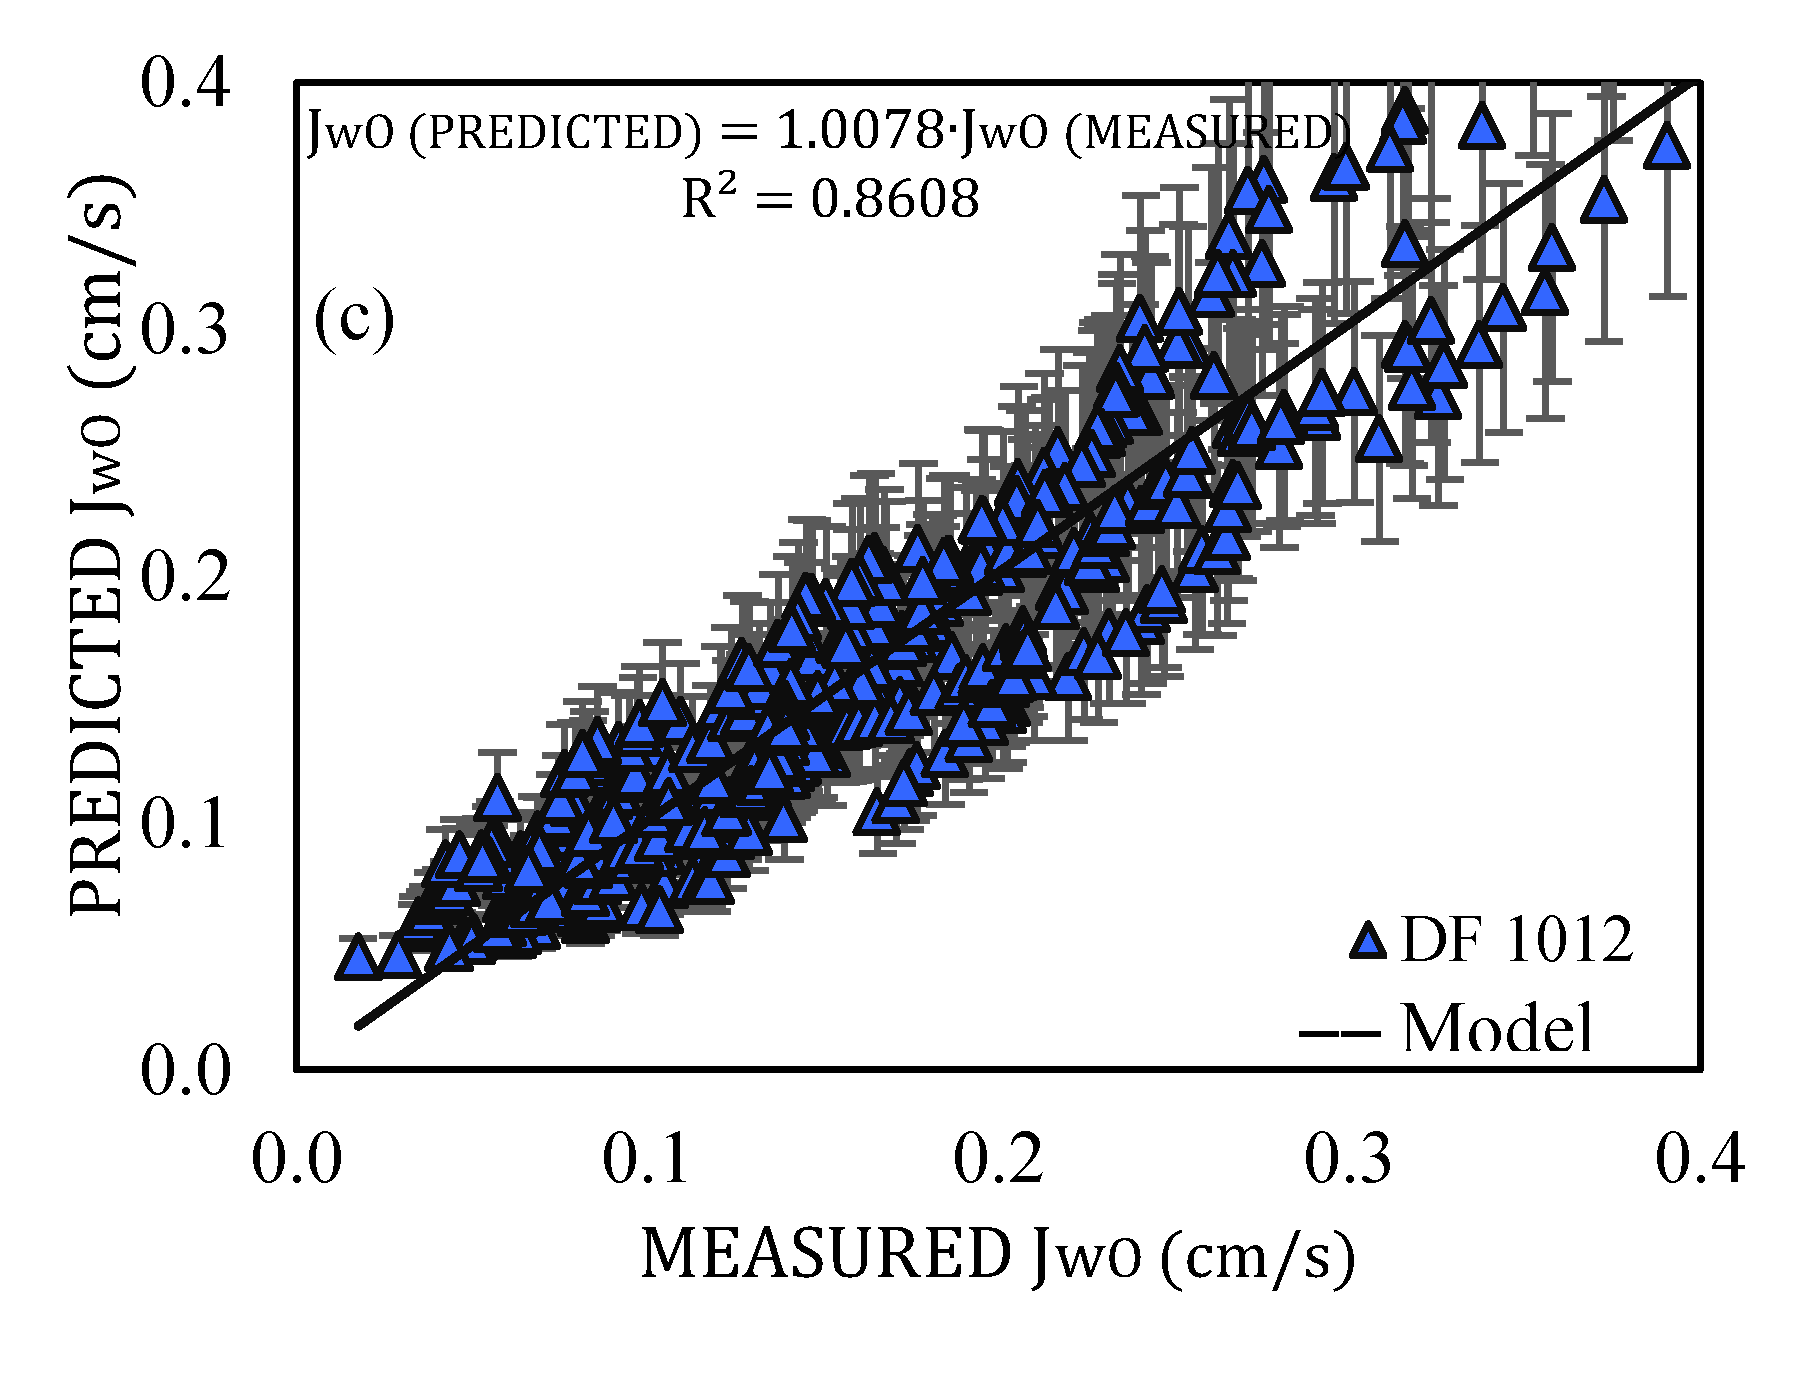
3.2. Froth Zone Water Rate
4. Discussion
5. Conclusions
Author Contributions
Funding
Acknowledgments
Conflicts of Interest
References
- Elgelbrecht, J.; Woodburn, E. The effects of froth height, aeration rate and gas precipitation on flotation. J. South. Afr. Inst. Min. Metall. 1975, 76, 125–132. [Google Scholar]
- Johnson, N.W. A review of entrainment and its modelling in industrial flotation processes. In Proceedings of the Centenary of Flotation Symposium, Brisbane, Australia, 6–9 June 2005. [Google Scholar]
- Singh, N.; Finch, J.A. Bank profiling and separation efficiency. Miner. Eng. 2014, 66–68, 191–196. [Google Scholar] [CrossRef]
- Smith, P.G.; Warren, L.J. Entrainment of particles into flotation froths. Miner. Process. Extr. Metall. Rev. 1989, 5, 123–145. [Google Scholar] [CrossRef]
- Lynch, A.J.; Johnson, N.W.; Manlapig, E.V.; Thorne, G.C. Mineral. and Coal Flotation Circuits: Their Simulation and Control; Elsevier: Amsterdam, The Nederlandg, 1981. [Google Scholar]
- Harris, T.A. The Development of a Flotation Simulation and Methodology Towards an Optimization Study of UG2 Platinum Flotation Circuits. Ph.D. Thesis, University of Cape Town, Cape Town, South Africa, 2000. [Google Scholar]
- Gorain, B.; Harris, M.; Franzidis, J.-P.; Manlapig, E. The effect of froth residence time on the kinetics of flotation. Miner. Eng. 1998, 11, 627–638. [Google Scholar] [CrossRef]
- Moys, M.H. Residence time distribution and mass transport in the froth phase of the flotation process. Inter. J. Miner. Process. 1984, 13, 117–142. [Google Scholar] [CrossRef]
- Bascur, O.; Herbst, J.A. Dynamic modelling of a flotation cell with a view toward automatic control. In Proceedings of the International Minerals Processing Congress, Toronto, ON, Canada, 17–23 October 1982; pp. 1–21. [Google Scholar]
- Alford, R.A. An improved model for design of industrial column flotation circuits in sulphide application. In Sulphide Deposits—Their Origin and Processing; Gary, P.M.J., Ed.; IMM: London, UK, 1990. [Google Scholar]
- Uribe, A.S.; Vazuez, D.V.; Perez, R.G.; Nava, F.A. A statistical model for the concentrate water in flotation columns. Miner. Eng. 1999, 12, 937–948. [Google Scholar] [CrossRef]
- Boylu, F.; Laskowski, J. Rate of water transfer to flotation froth in the flotation of low-rank coal that also requires the use of oily collector. Int. J. Min. Procc. 2007, 83, 125–131. [Google Scholar] [CrossRef]
- Zheng, X.; Franzidis, J.; Johnson, N. An evaluation of different models of water recovery in flotation. Miner. Eng. 2006, 19, 871–882. [Google Scholar] [CrossRef]
- Neethling, S.; Lee, H.; Cilliers, J. Simple relationships for predicting the recovery of liquid from flowing foams and froths. Miner. Eng. 2003, 16, 1123–1130. [Google Scholar] [CrossRef]
- Nguyen, A.V.; Harvey, P.A.; Jameson, G.J. Influence of gas flow rate and frothers on water recovery in a froth column. Miner. Eng. 2003, 16, 1143–1147. [Google Scholar] [CrossRef]
- Stevenson, P.; Stevanov, C.; Jameson, G.J. Liquid overflow from a column of rising aqueous froth. Miner. Eng. 2003, 16, 1045–1052. [Google Scholar] [CrossRef]
- Wang, L.; Peng, Y.; Runge, K.; Bradshaw, D. A review of entraiment: Mechanisms, contributing factors and modelling in flotation. Miner. Eng. 2015, 70, 77–91. [Google Scholar] [CrossRef]
- Finch, J.A.; Gelinas, S.; Moyo, P. Frother-related research at McGill University. Miner. Eng. 2006, 19, 726–733. [Google Scholar] [CrossRef]
- Moyo, P. Characterization of frother by water carrying rate. Master’s Thesis, McGill University, Montreal, QC, Canada, 2005. [Google Scholar]
- Moyo, P.; Gomez, C.O.; Finch, J.A. Characterizing frothers using water carrying rate. Can. Metall. Q. 2007, 46, 215–220. [Google Scholar] [CrossRef]
- Maldonado, M.; Gomez, C. A new approach to measure gas holdup in industrial flotation machines part I: Demonstration of working principle. Miner. Eng. 2018, 118, 1–8. [Google Scholar] [CrossRef]
- Maldonado, M.; Cretier, R.; Melendez, M.; Gomez, C.O. A new approach to measure gas holdup in industrial flotation machines Part II. Effect of fluid properties. Miner. Eng. 2020, 148, 106177. [Google Scholar] [CrossRef]


| Frother Type | Molecular Weight (g/mol) | Superficial Gas Velocity (cm/s) | Frother Concentration (ppm) | Froth Depth Range (cm) |
|---|---|---|---|---|
| MIBC | 102.17 | 0.8–1–1.2–1.4–1.6 | 10–15–20–50 | 0.5–13.5 |
| PINNACLE® 9891 | not available | 0.8–1–1.2–1.4–1.6 | 10–15–20–50 | 0.5–27 |
| DF1012 | 397.95 | 0.8–1–1.2–1.4–1.6 | 10–15–20–50 | 0.5–26 |
© 2020 by the authors. Licensee MDPI, Basel, Switzerland. This article is an open access article distributed under the terms and conditions of the Creative Commons Attribution (CC BY) license (http://creativecommons.org/licenses/by/4.0/).
Share and Cite
Martinez, J.; Maldonado, M.; Gutierrez, L. A Method to Predict Water Recovery Rate in the Collection and Froth Zone of Flotation Systems. Minerals 2020, 10, 630. https://doi.org/10.3390/min10070630
Martinez J, Maldonado M, Gutierrez L. A Method to Predict Water Recovery Rate in the Collection and Froth Zone of Flotation Systems. Minerals. 2020; 10(7):630. https://doi.org/10.3390/min10070630
Chicago/Turabian StyleMartinez, Jose, Miguel Maldonado, and Leopoldo Gutierrez. 2020. "A Method to Predict Water Recovery Rate in the Collection and Froth Zone of Flotation Systems" Minerals 10, no. 7: 630. https://doi.org/10.3390/min10070630