Incorporating Far-Infrared Data into Carbonate Mineral Analyses


Abstract
:
1. Introduction
2. Materials and Methods
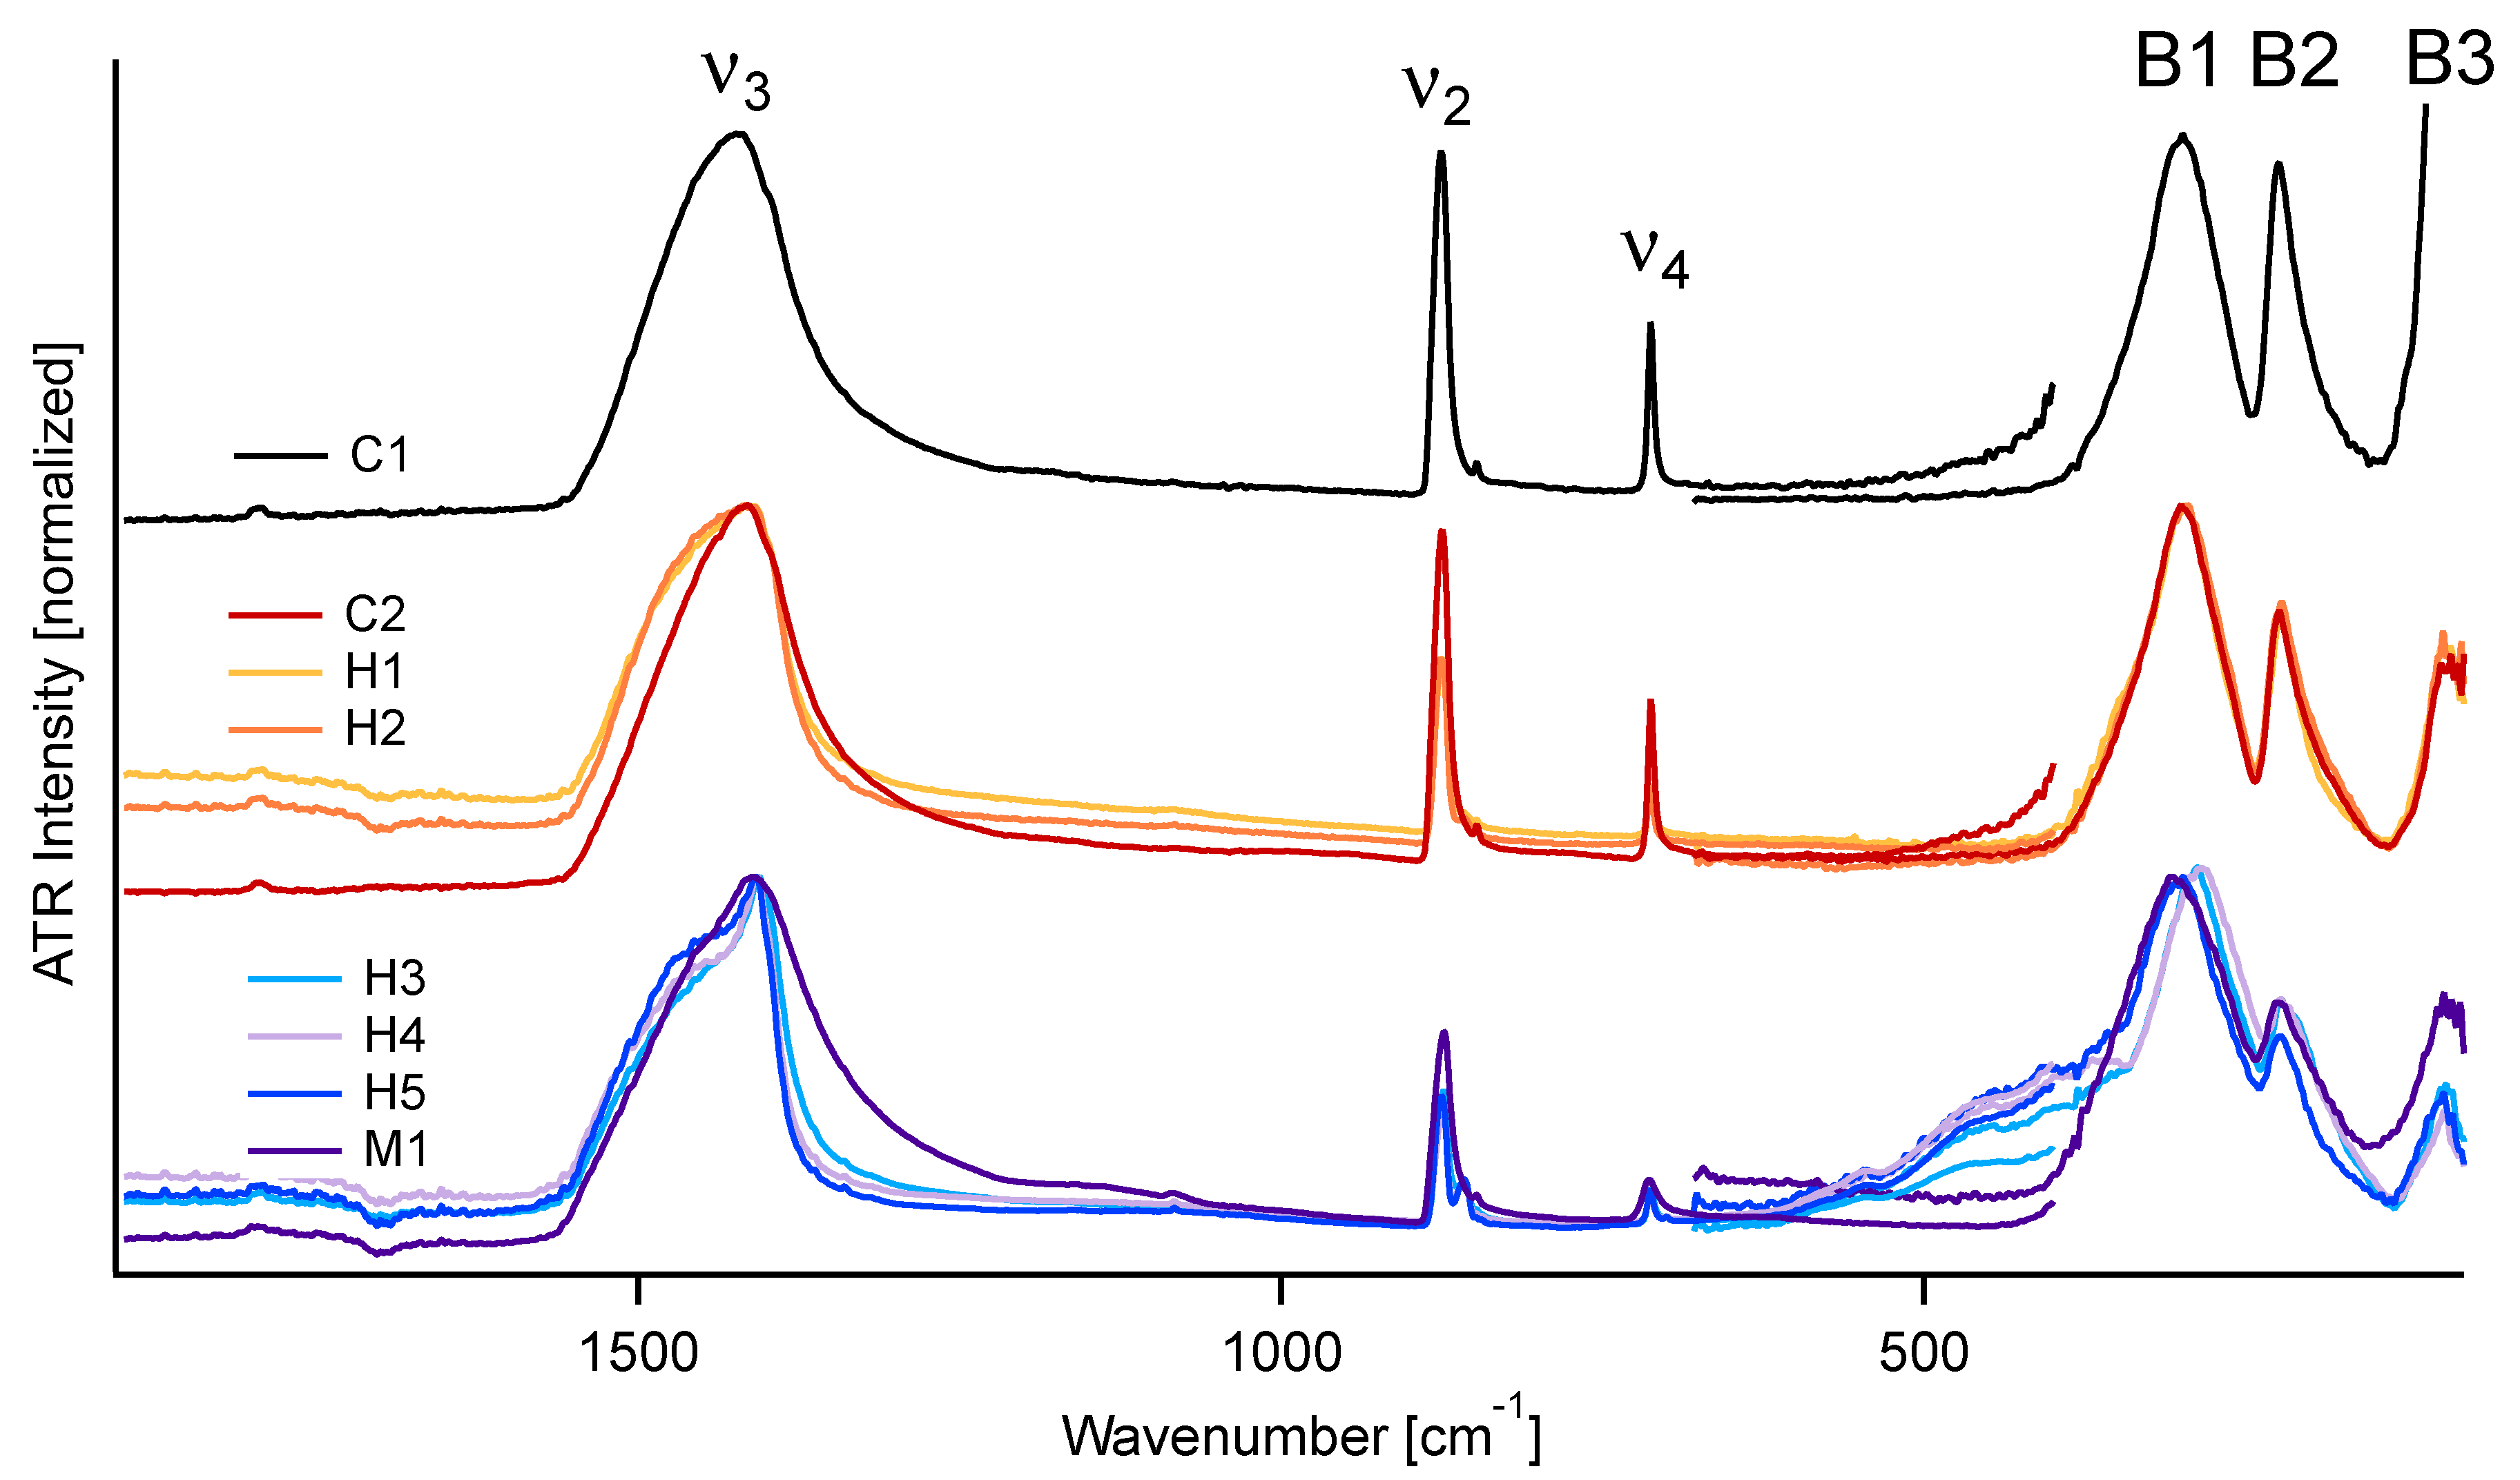
2.1. Calcite Crystal Structure and Vibrational Modes
2.2. Samples
2.3. Attenuated Total Reflectance IR Spectroscopy
2.4. Powder X-ray Diffraction
3. Results
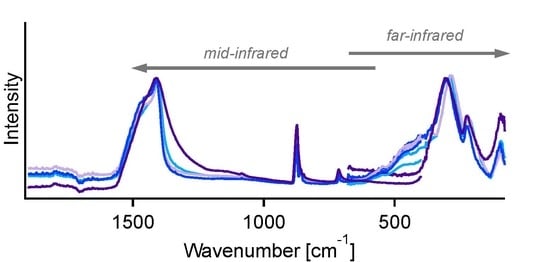
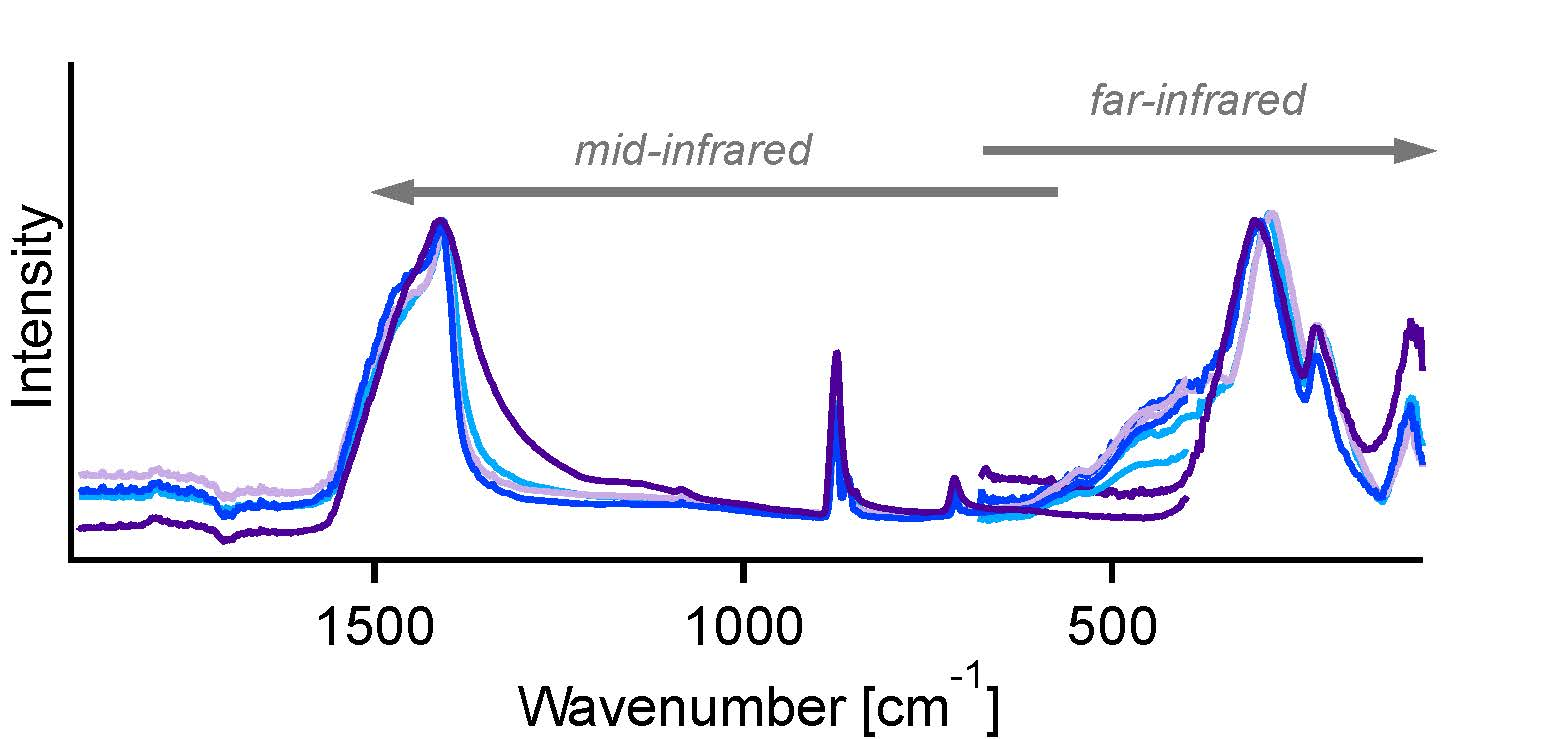
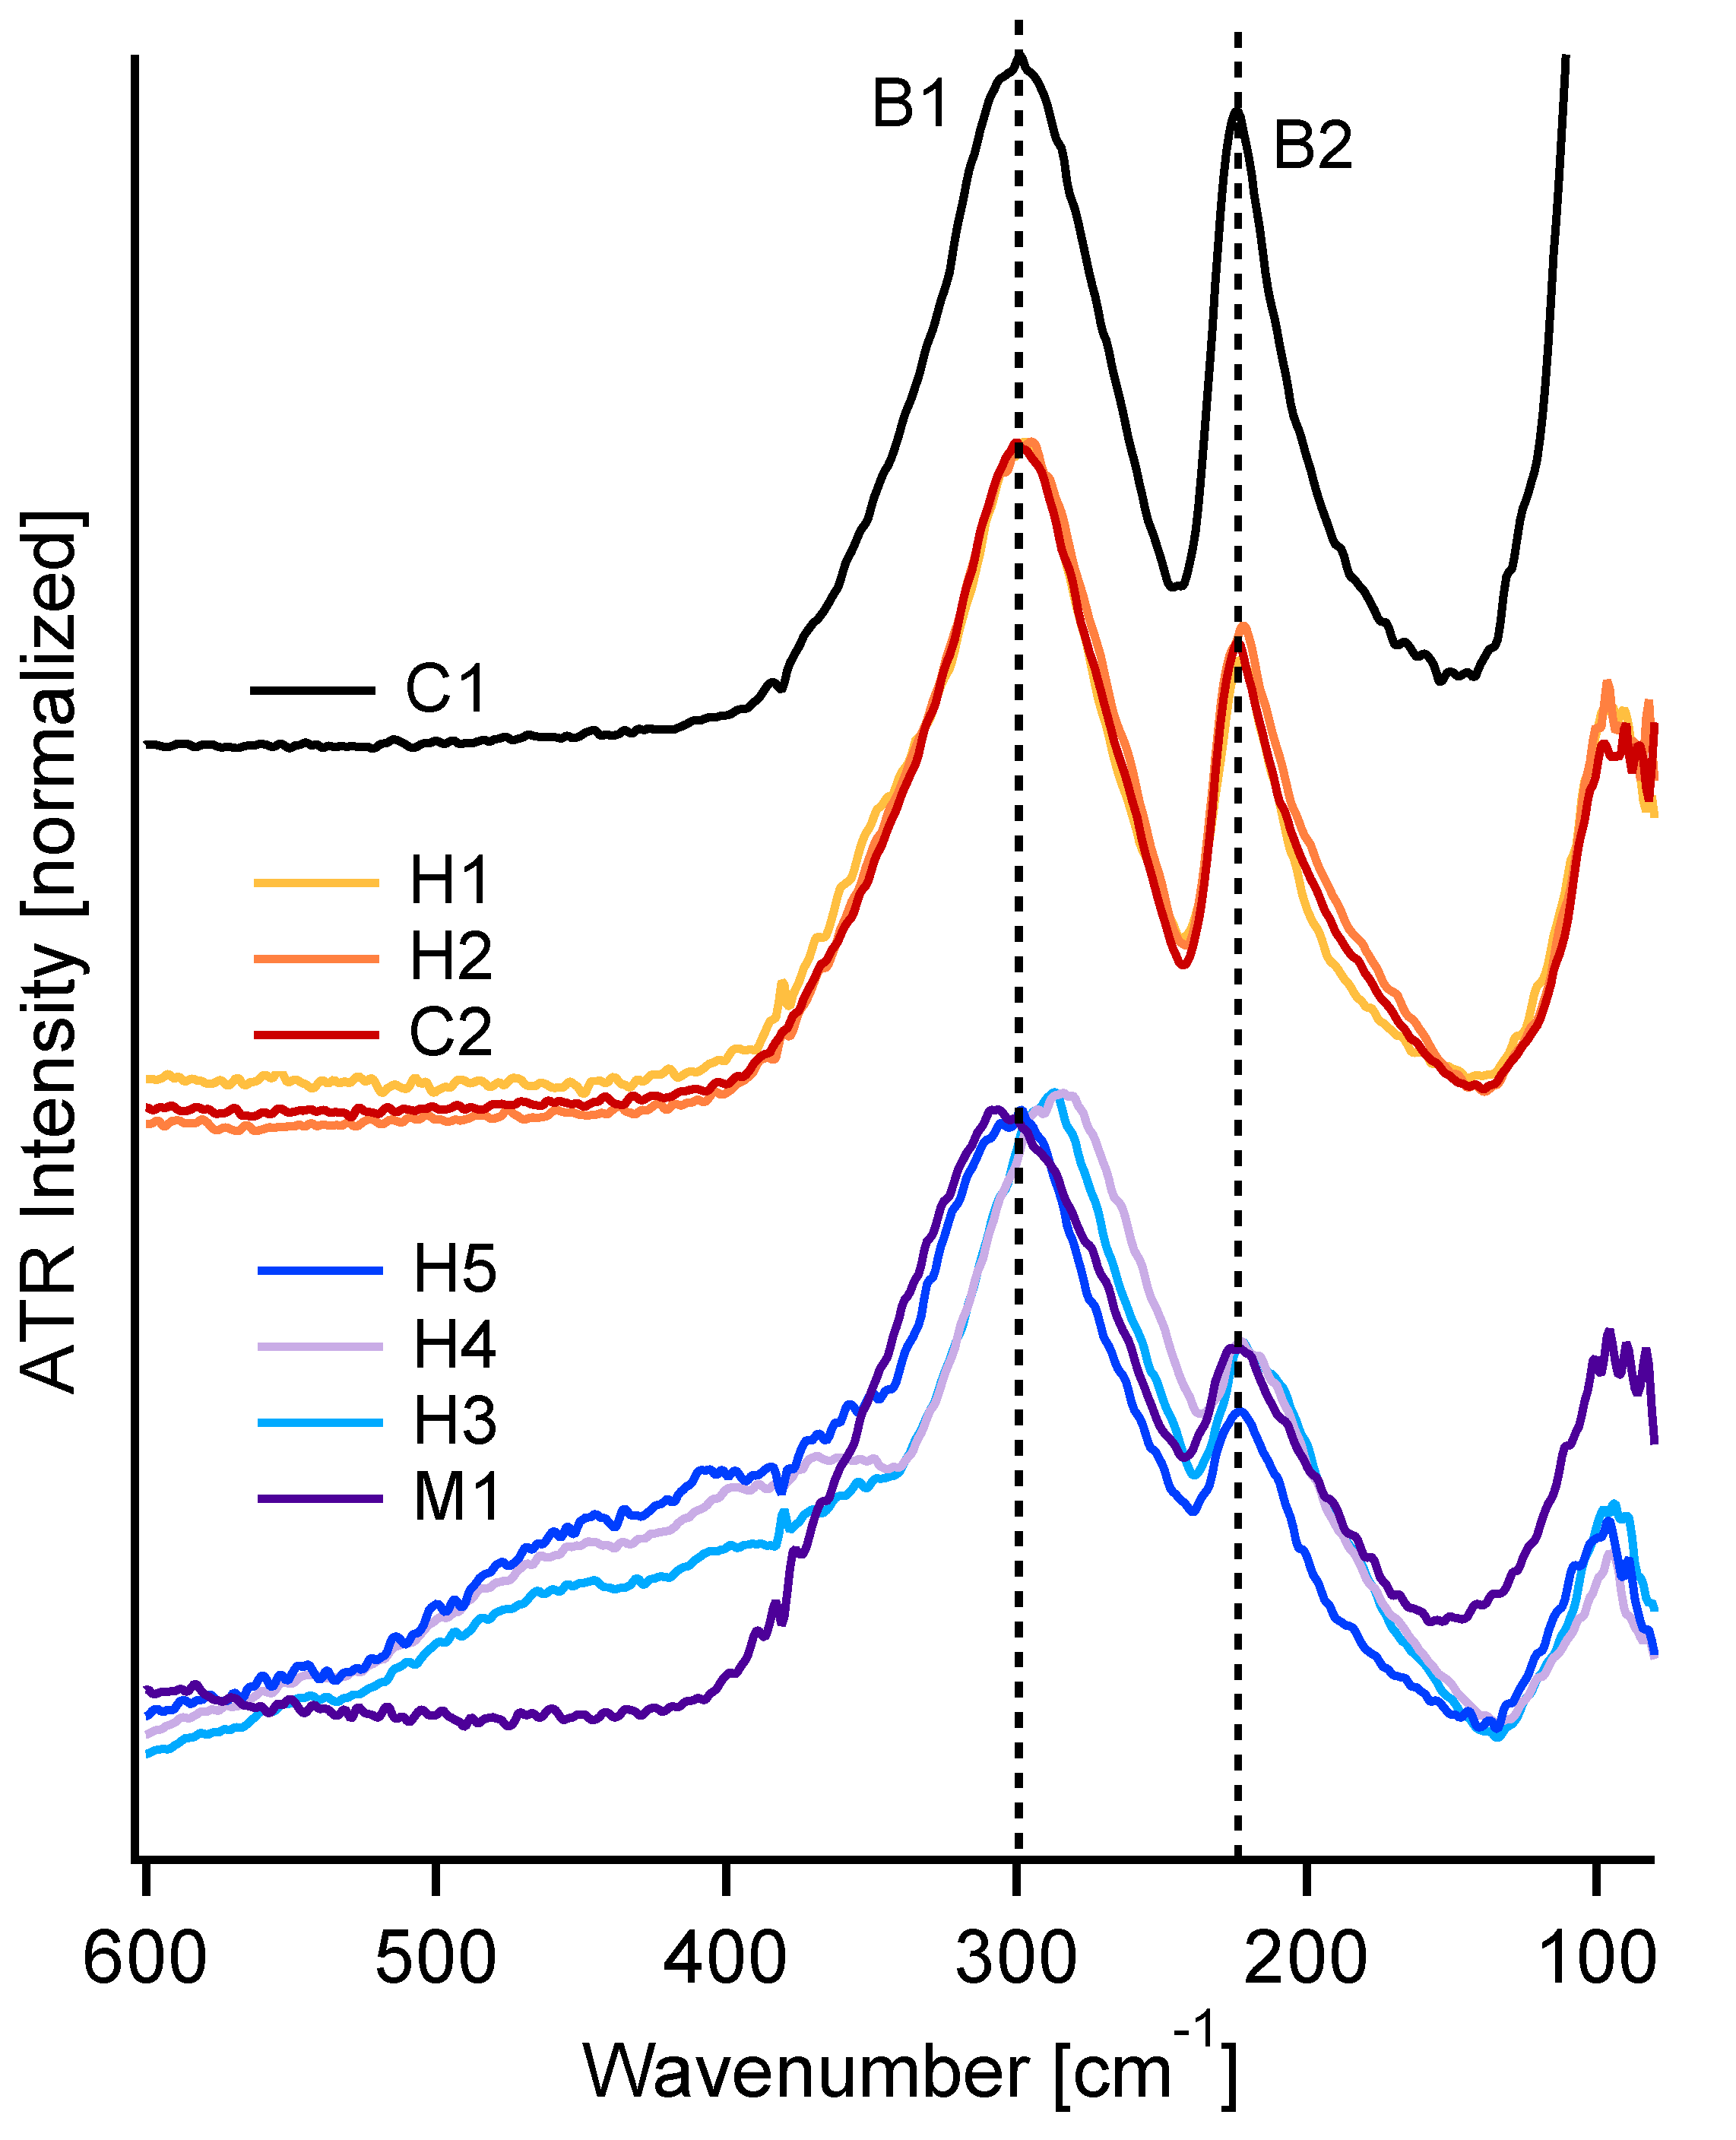
3.1. FIR-ATR
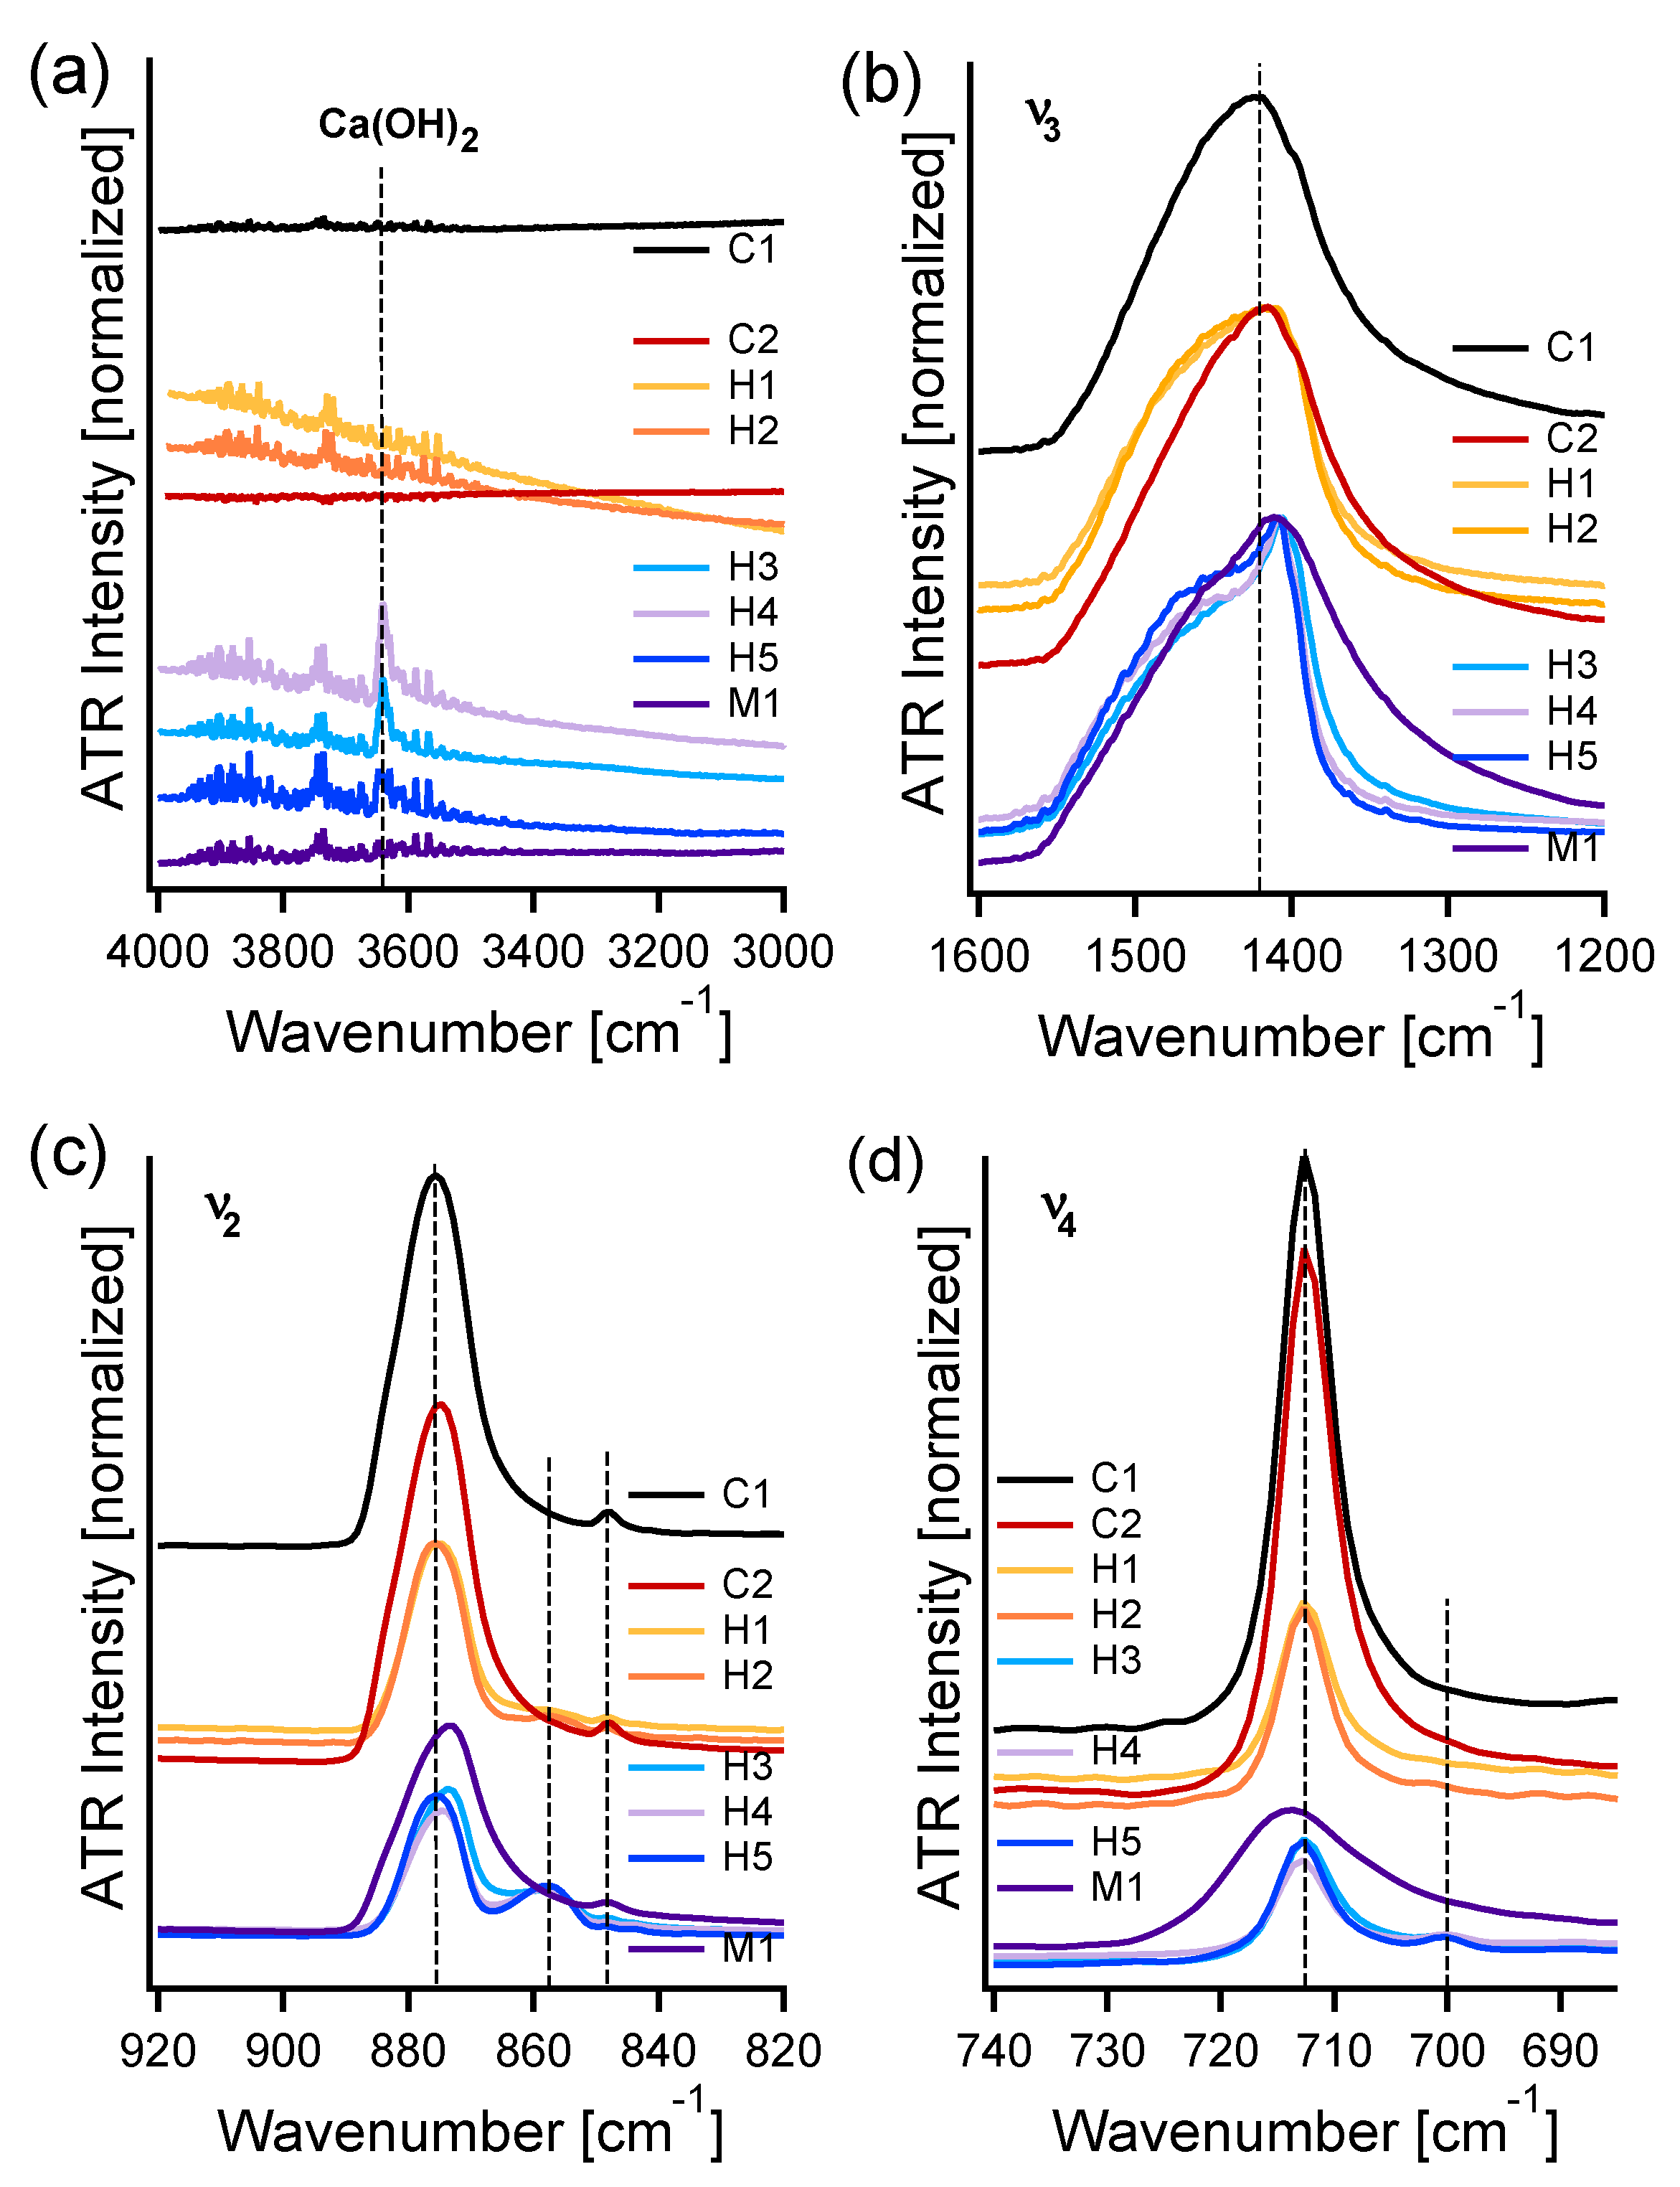
3.2. MIR-ATR
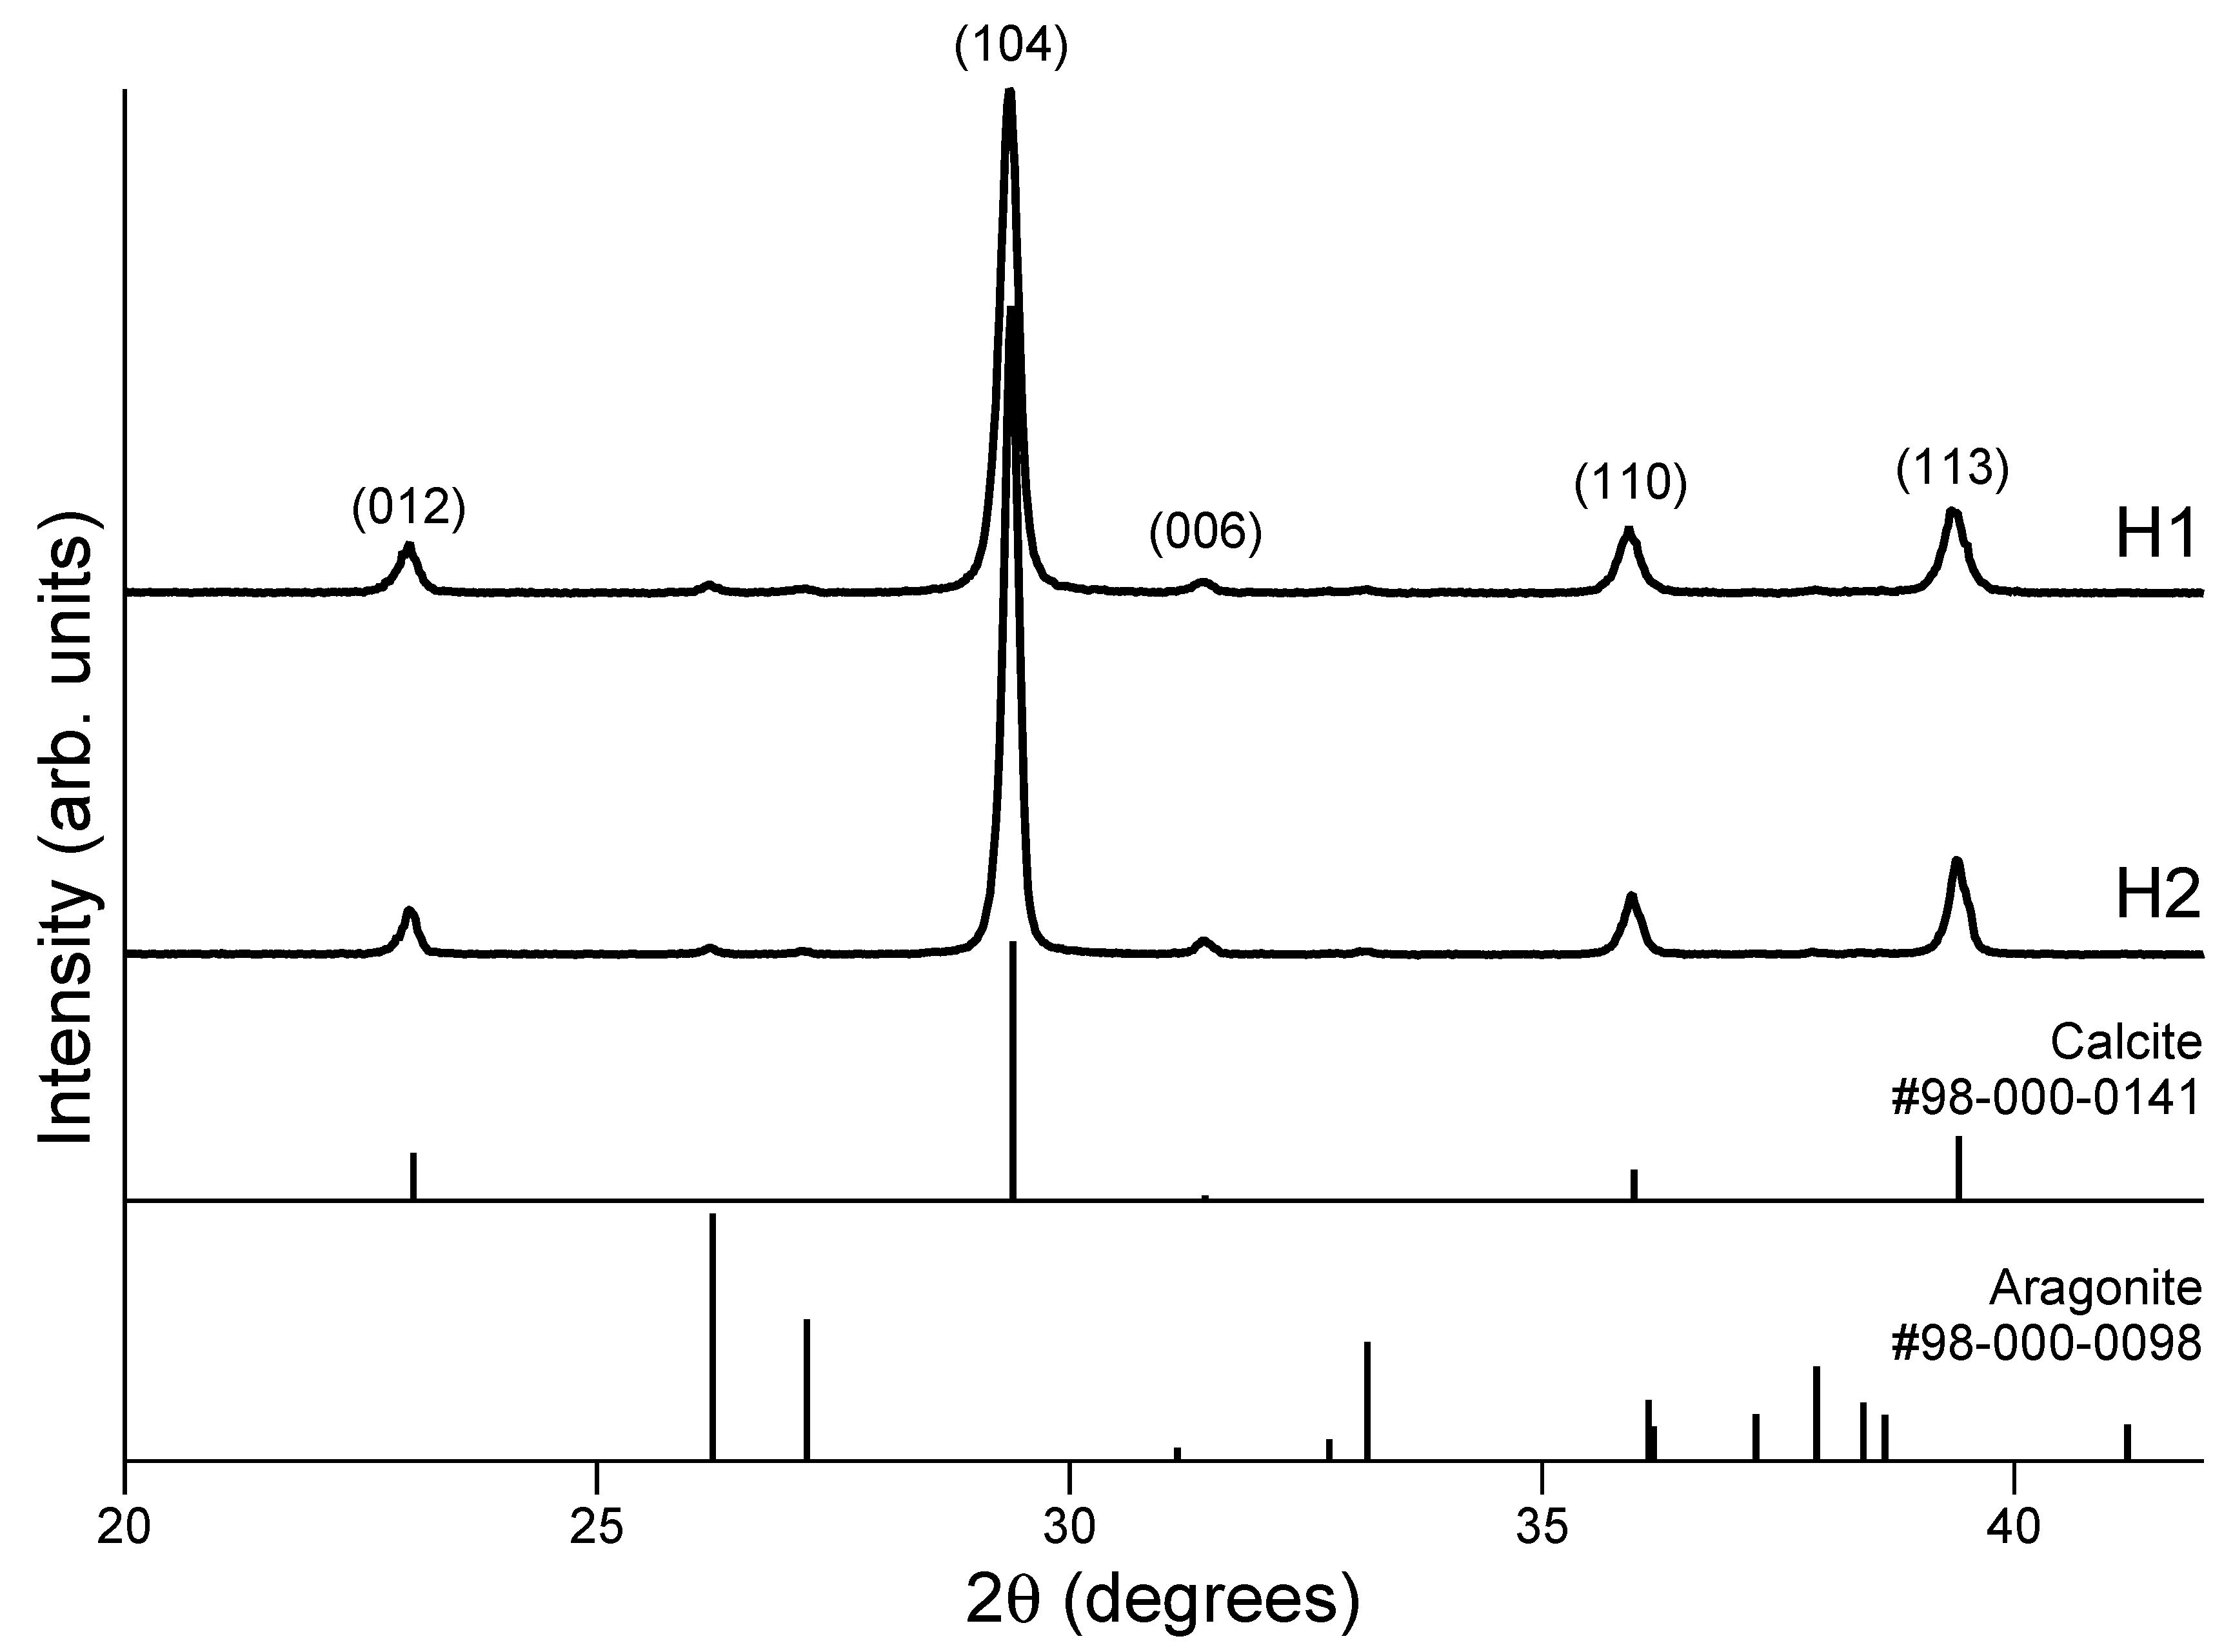
3.3. PXRD
4. Discussion
4.1. FIR Peak Positions
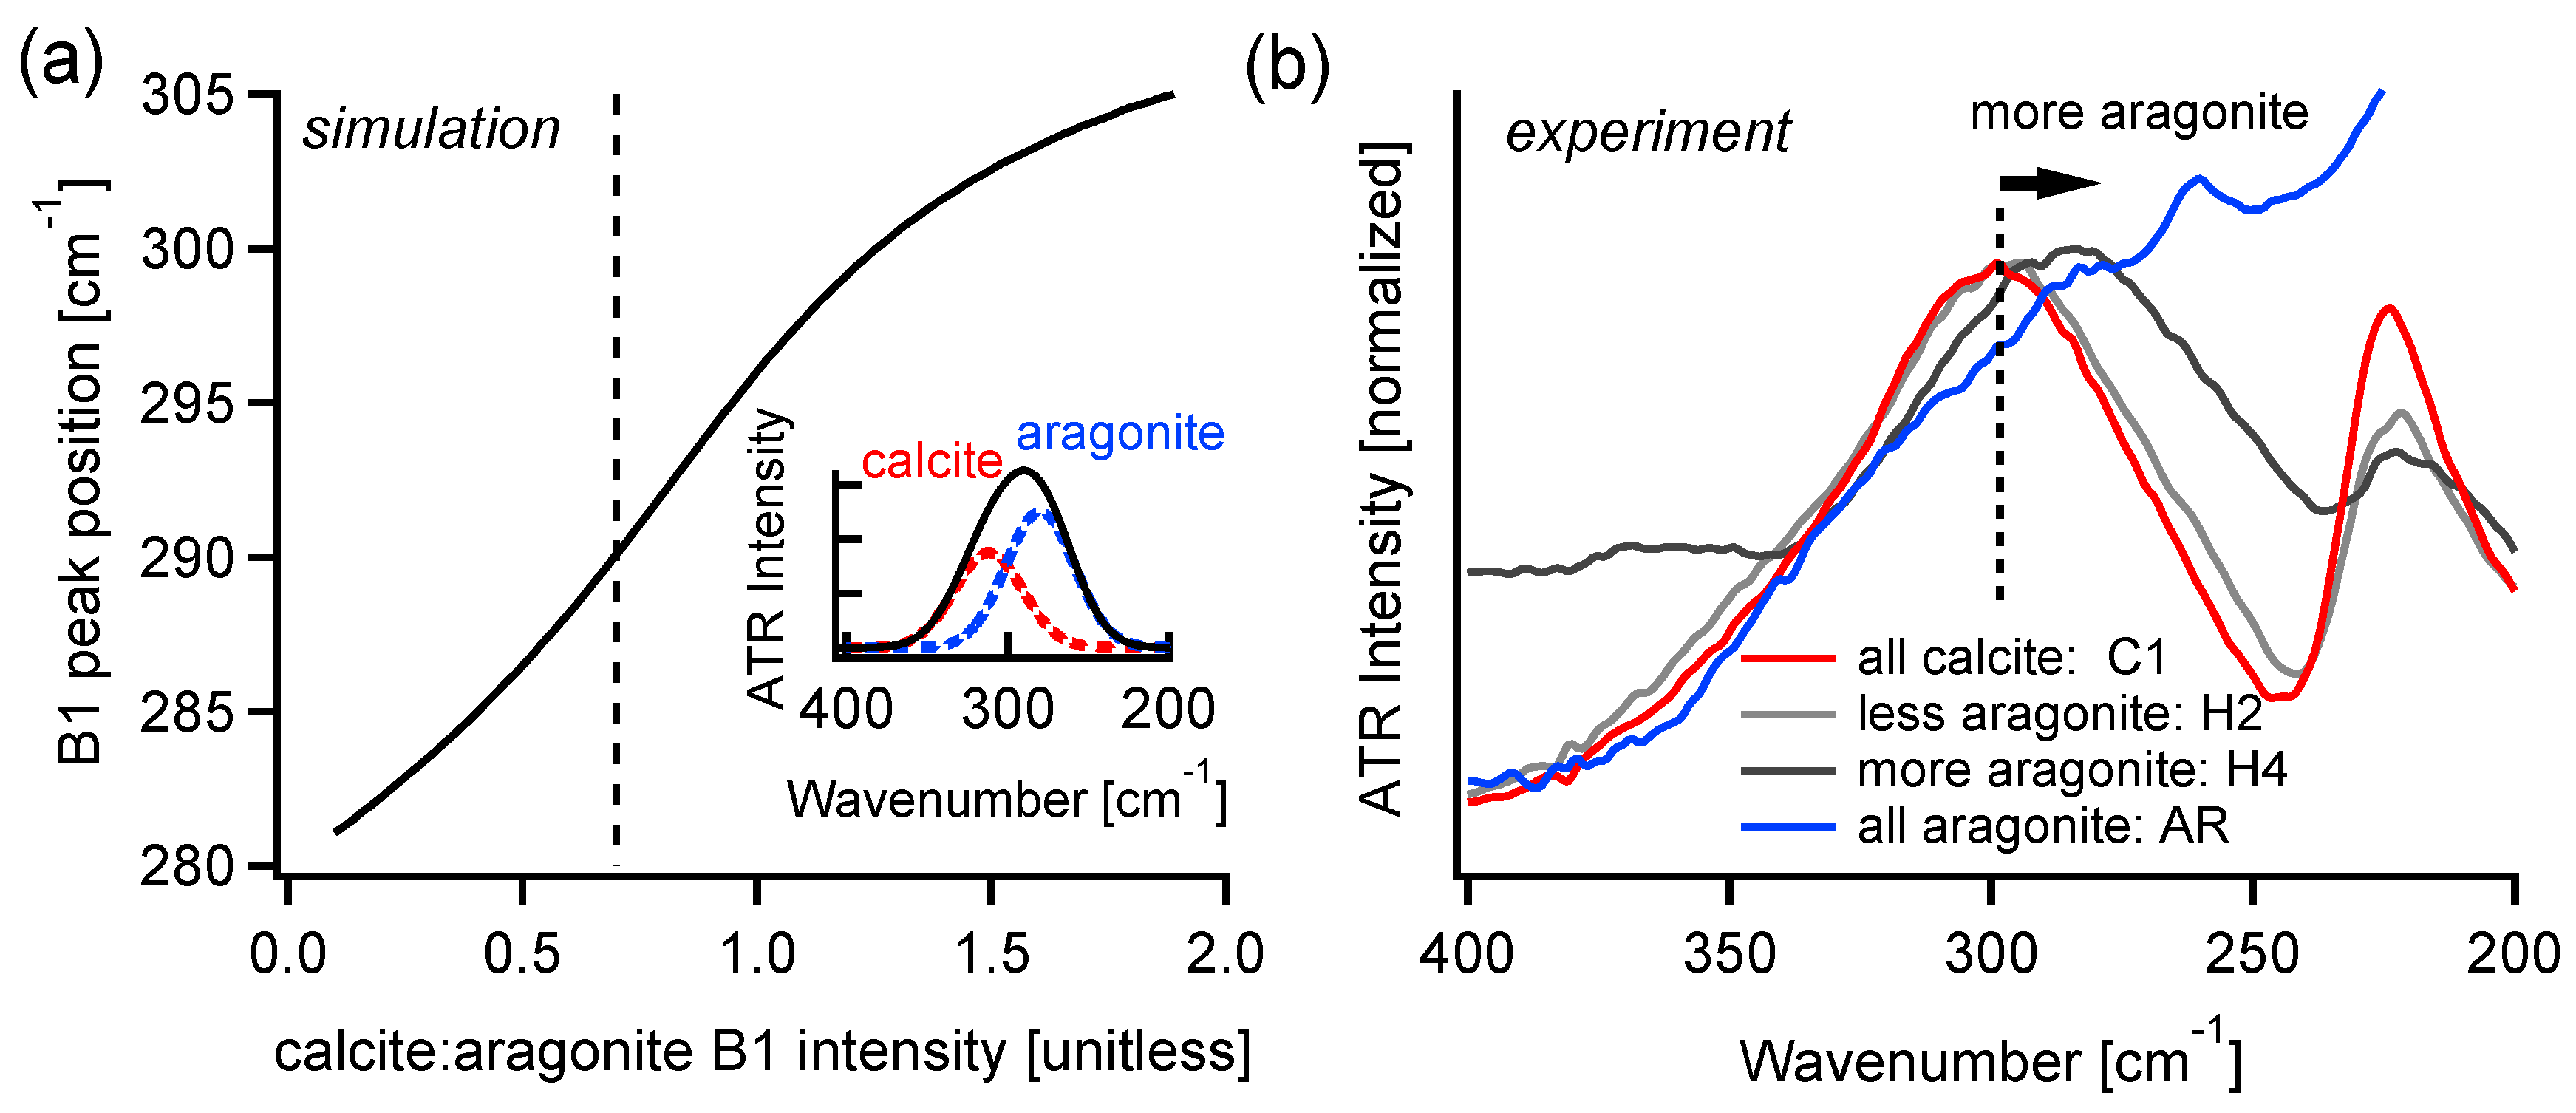
4.2. FIR Relative Peak Intensities
5. Conclusions
Supplementary Materials
Author Contributions
Funding
Acknowledgments
Conflicts of Interest
References
- Hussin, M.; Bhutta, M.; Azreen, M.; Ramadhansyah, P.; Mirza, J. Performance of blended ash geopolymer concrete at elevated temperatures. Mater. Struct. 2015, 48, 709–720. [Google Scholar] [CrossRef]
- Brusentsova, T.N.; Peale, R.E.; Maukonen, D.; Harlow, G.E.; Boesenberg, J.S.; Ebel, D. Far infrared spectroscopy of carbonate minerals. Am. Mineral. 2010, 95, 1515–1522. [Google Scholar] [CrossRef]
- Zhu, Y.; Ma, N.; Jin, W.; Wu, S.; Sun, C. Genomic and transcriptomic insights into calcium carbonate biomineralization by marine actinobacterium Brevibacterium linens BS258. Front. Microbiol. 2017, 8, 602. [Google Scholar] [CrossRef] [PubMed] [Green Version]
- Pan, J.; Zhao, H.; Tucker, M.E.; Zhou, J.; Jiang, M.; Wang, Y.; Zhao, Y.; Sun, B.; Han, Z.; Yan, H. Biomineralization of Monohydrocalcite Induced by the Halophile Halomonas Smyrnensis WMS-3. Minerals 2019, 9, 632. [Google Scholar] [CrossRef] [Green Version]
- Regev, L.; Poduska, K.M.; Addadi, L.; Weiner, S.; Boaretto, E. Distinguishing between calcites formed by different mechanisms using infrared spectrometry: Archaeological applications. J. Archaeolog. Sci. 2010, 37, 3022–3029. [Google Scholar] [CrossRef] [Green Version]
- Toffolo, M.B.; Boaretto, E. Nucleation of aragonite upon carbonation of calcium oxide and calcium hydroxide at ambient temperatures and pressures: A new indicator of fire-related human activities. J. Archaeolog. Sci. 2014, 49, 237–248. [Google Scholar] [CrossRef]
- Xu, B.; Poduska, K.M. Linking crystal structure with temperature-sensitive vibrational modes in calcium carbonate minerals. Phys. Chem. Chem. Phys. 2014, 16, 17634–17639. [Google Scholar] [CrossRef] [PubMed] [Green Version]
- Xu, B.; Toffolo, M.B.; Regev, L.; Boaretto, E.; Poduska, K.M. Structural differences in archaeologically relevant calcite. Anal. Methods 2015, 7, 9304–9309. [Google Scholar] [CrossRef] [Green Version]
- Gueta, R.; Natan, A.; Addadi, L.; Weiner, S.; Refson, K.; Kronik, L. Local atomic order and infrared spectra of biogenic calcite. Angew. Chem. Int. Ed. 2007, 46, 291–294. [Google Scholar] [CrossRef] [PubMed]
- Valenzano, L.; Noel, Y.; Orlando, R.; Zicovich-Wilson, C.; Ferrero, M.; Dovesi, R. Ab initio vibrational spectra and dielectric properties of carbonates: Magnesite, calcite and dolomite. Theor. Chem. Acc. 2007, 117, 991–1000. [Google Scholar] [CrossRef]
- Gates-Rector, S.D.; Blanton, T.N. The Powder Diffraction File: A Quality Materials Characterization Database. Powder Diffr. 2019, 34, 352–360. [Google Scholar] [CrossRef] [Green Version]
- Lou, D.; Sun, F.; Li, L. Study on vibrational modes by group theory and infrared spectra by DFT for calcite crystal. Chin. Opt. Lett. 2007, 5, 370–372. [Google Scholar]
- Jiang, C.L.; Zeng, W.; Liu, F.S.; Tang, B.; Liu, Q.J. First-principles analysis of vibrational modes of calcite, magnesite and dolomite. J. Phys. Chem. Solids 2019, 131, 1–9. [Google Scholar] [CrossRef]
- White, W.B. The Carbonate Minerals. In The Infrared Spectra of Minerals; Mineralogical Society of Great Britain and Ireland: Twickenham, UK, 1974. [Google Scholar] [CrossRef]
- Xu, B.; Toffolo, M.B.; Boaretto, E.; Poduska, K.M. Assessing local and long-range structural disorder in aggregate-free lime binders. Ind. Eng. Chem. Res. 2016, 55, 8334–8340. [Google Scholar] [CrossRef]
- Poduska, K.M.; Regev, L.; Boaretto, E.; Addadi, L.; Weiner, S.; Kronik, L.; Curtarolo, S. Decoupling local disorder and optical effects in infrared spectra: Differentiating between calcites with different origins. Adv. Mater. 2011, 23, 550–554. [Google Scholar] [CrossRef] [PubMed] [Green Version]
- MDI. JADE; Version 2010; Computer Software; Materials Data: Livermore, CA, USA, 2010. [Google Scholar]
- Poduska, K.M.; Regev, L.; Berna, F.; Mintz, E.; Milevski, I.; Khalaily, H.; Weiner, S.; Boaretto, E. Plaster characterization at the PPNB site of Yiftahel (Israel) including the use of 14C: Implications for plaster production, preservation, and dating. Radiocarbon 2012, 54, 887–896. [Google Scholar] [CrossRef] [Green Version]
- Xu, B.; Hirsch, A.; Kronik, L.; Poduska, K.M. Vibrational properties of isotopically enriched materials: The case of calcite. RSC Adv. 2018, 8, 33985–33992. [Google Scholar] [CrossRef] [Green Version]
- Sakai, S.; Yang, D.; Yasuda, T.; Akiyama, K.; Kuga, T.; Kano, A.; Shiraishi, F.; Amekawa, S.; Ohtsuka, S.; Nakaguchi, K.; et al. Pulsed Terahertz Radiation for Sensitive Quantification of Carbonate Minerals. ACS Omega 2019, 4, 2702–2707. [Google Scholar] [CrossRef] [PubMed]


| Name | Description |
|---|---|
| C1 | Purchased calcite |
| C2 | Geogenic calcite |
| M1 | Biogenic Mg-calcite |
| H1 | Field-heated calcite [5] |
| H2 | Field-heated calcite [5] |
| H3 | Lab-synthesized lime binder [15] |
| H4 | Lab-synthesized lime binder [15] |
| H5 | Lab-synthesized lime binder [15] |
| AR | Lab-synthesized aragonite |
| Name | a (Å) | c (Å) |
|---|---|---|
| Literature [11] | 4.989 | 17.061 |
| C1 | 4.9895(4) | 17.061(1) |
| H1 | 4.988(1) | 17.049(2) |
| H2 | 4.990(1) | 17.048(2) |
© 2020 by the authors. Licensee MDPI, Basel, Switzerland. This article is an open access article distributed under the terms and conditions of the Creative Commons Attribution (CC BY) license (http://creativecommons.org/licenses/by/4.0/).
Share and Cite
Campbell, S.; Poduska, K.M. Incorporating Far-Infrared Data into Carbonate Mineral Analyses. Minerals 2020, 10, 628. https://doi.org/10.3390/min10070628
Campbell S, Poduska KM. Incorporating Far-Infrared Data into Carbonate Mineral Analyses. Minerals. 2020; 10(7):628. https://doi.org/10.3390/min10070628
Chicago/Turabian StyleCampbell, Stephen, and Kristin M. Poduska. 2020. "Incorporating Far-Infrared Data into Carbonate Mineral Analyses" Minerals 10, no. 7: 628. https://doi.org/10.3390/min10070628