Article

Experimental Procedure for the Determination of the Critical Coalescence Concentration (CCC) of Simple Frothers

1
Department of Mining Engineering, Adana AlparslanTürkeş Science and Technology University, Sarıçam, Adana 01250, Turkey
2
Department of Mining Engineering, Istanbul University-Cerrahpaşa, Buyukcekmece, Istanbul 34500, Turkey
3
Department of Physical Chemistry, Sofia University,1 James Bourchier Blvd, Sofia 1164, Bulgaria
4
Department of Mineral Processing Engineering, Istanbul Technical University, Maslak, Istanbul 34469, Turkey
5
Rectorate, Harran University, Şanlıurfa 63510, Turkey
*
Authors to whom correspondence should be addressed.
Minerals 2020, 10(7), 617; https://doi.org/10.3390/min10070617
Submission received: 29 May 2020 / Revised: 2 July 2020 / Accepted: 6 July 2020 / Published: 9 July 2020
(This article belongs to the Special Issue Surfactants at Interfaces and Thin Liquid Films)

Abstract

:
In this study, the critical coalescence concentrations (CCC) of selected commercial frother solutions, namely polypropylene glycols (PPG 200, 400, and 600), tri propylene glycol (BTPG), triethylene glycol (BTEG), dipropylene glycol (BDPG), and as a reference, methyl isobutyl carbinol (MIBC), were determined using a bubble column based on light absorption. The results for all seven frothers showed that BTEG has the worst bubble inhibiting performance, and PPG 600 has the best bubble inhibiting performance. While critical coalescence concentration (CCC) was found as 3 ppm for PPG 600, it increased to 25 ppm for BTEG. In the case of MIBC, which was the reference point, the CCC value was found as 10 ppm, which was consistent with the literature. The surface tension isotherms of the frothers were determined and analyzed with one of the latest adsorption models. The results indicated that the polypropylene glycol frothers showed more surface activity compared to alcohol or other frothers investigated. This is due to the additional reorganization of the PPG molecules on the air/water interface, thus boosting its surface activity.

1. Introduction

Flotation has been used for over a century as an important industrial process to recover valuable minerals. Besides the contribution of parameters, such as liberation size, reagent type, and other physical and chemical parameters, the effect of frother type and, accordingly, the size of bubbles, is a key variable in the flotation process [1,2,3,4,5]. Thus, the particular characteristics of bubbles in the presence of either electrolyte or frothers can be ascribed to the interactions between bubbles [6,7]. As is well known, a thin liquid film forms when two bubbles approach each other, pressed toward each other by the capillary pressure, which squeezes the liquid between them, thinning the film until it ruptures. This in turn results in “bubble coalescence,” which will eventually change the size of the bubbles [8,9,10]. Since the main aim of the frothers is to control the froth stability and produce fine bubbles, the optimization of bubble size and hence “coalescence” come into prominence for improving flotation recoveries [11,12]. Many parameters like gas hold up [5], bubble velocity [13], salt concentration [1], frother concentration [14], etc. may affect the onset of this critical point.
In the literature, numerous studies have been carried out to investigate the effects of concentration, bubble size, and other underlying mechanisms for coalescence conditions of different frothers [5,10,15,16,17,18,19,20]. Several methods towards this aim have been utilized to determine the coalescence conditions and their effects on froth characteristics. In a very recent study by Gungoren et al. 2018 [10], the bubble–particle attachment timer unit was modified to measure the bubble–bubble coalescence time in the presence of methyl isobutyl carbinol (MIBC), NaCl, and CaCl2 to show the contribution of both concentration and specific ion effect on the critical coalescence concentration (CCC) value of the frother. As a result, the bubble coalescence was found to be determined with the bubble contact time measurements, which were in line with the previous findings in the literature [15,21]. In another study for MIBC [19], a McGill bubble size analyzer unit was used to determine the coalescence in terms of Sauter mean diameter (d32) and found almost the same concentrations to produce coalescence for both commercial and analytical grade reagents [19]. This in turn showed that the chemical composition should be taken into account for the evaluation of tests. In addition to these well-known methods, the use of sound for the determination of bubble coalescence was studied by Kracht and Finch, 2009 [11]. They found that a sound signal could well be linked to the formation of bubble coalescence with the help of high-speed cinematography. In another study using different salt solutions, the variation of salt concentration on coalescence formation was followed by changes in solution turbidity with the help of light intensities [13]. They found that both hydrodynamics and salt properties may influence the transition of salt concentration in terms of its effects on bubble coalescence and gas hold-up. Consequently, these findings in the literature emphasized that although similar results may be obtained for the same type of frothers, the methodology provides a different approach to applicability and evaluation of the results.
As mentioned above, in order to determine the CCC values of the frother, there is a need to capture the pictures of bubbles in the system using cameras and to calculate the size of the bubbles. However, this method is very complex because of the need to focus on the bubble coalescence seen by the high-speed camera and to investigate the high number of frames shot in high-speed. Furthermore, this method is rather expensive due to the high prices of high-speed cameras, appropriate lenses, and the experimental set-up with motion mechanisms. On the contrary, in this study, we used an optical system for measuring the light intensity passing through the frother solutions and obtained the changes in the solution; the turbidity values were measured by the light intensity, and the changes were converted to bubble coalescence percentages.
As also known from the literature, salts promote bubble coalescence because of the effect of increasing the surface tension and suppressing the electrostatic repulsion between the bubbles [22,23]. Therefore, surprisingly, some salts inhibit bubble coalescence while others have no effect. For example, Bournival et al. (2012) reported that NaCl at higher concentrations was as effective as MIBC in preventing bubble coalescence in a dynamic environment. The coalescence of the bubbles is a stochastic process. For this reason, it should be studied stochastically. In the literature, the researchers used a unique parameter—salt transition concentration (Ctrans)—to examine the effect of salt ions on bubble coalescence [10,13,22,24]. Ctrans is defined as the concentration at which bubble coalescence is 50%, where 100% is for pure water. For instance, Ctrans is about 0.02 mol/L for MgCl2 and CaCl2, and that of NaCl and KCl is 0.08 mol/L and 0.1 mol/L, respectively [25,26]. Our method in this study to determine the CCC value of the frothers was also based on these studies.
The present work aimed to investigate the critical coalescence concentration for the different commercial frothers of PPG200, PPG400, PPG600, BTPG, BDPG, BTEG, and MIBC, via measuring the variation of solution turbidity as a function of light intensity. In addition, to better understand the surface activity of the frothers, the surface tension isotherms of these frothers were determined and analyzed, employing one of the latest adsorption models in the literature: The Ivanov Model [27].

2. Materials and Methods

2.1. Materials

This study determined the critical coalescence concentration (CCC) values of selected frothers obtained from BASF, Ludwigshafen, Germany, namely, polypropylene glycols (PPG 200, 400, and 600), tri propylene glycol (BTPG), triethylene glycol (BTEG), dipropylene glycol (BDPG), and isobutyl alcohol (MIBC). All the measurements were conducted at constant room temperature: 23 ± 1 °C. All glassware was rinsed with ethylene alcohol (99% purity, MERCK, Kenilworth, NJ, USA) and washed with distilled water, followed by steam cleaning and drying in a clean oven. To ensure that the frothers were dispersed in solutions, each frother solution was stirred at 500 rpm for 4 min.
Generally, these frothers consist of the hydrophobic alkyl chain (–CnH2n + 1) and ethylene, and the hydrophilic oxide (ethoxy, propylene oxide (PO), and ethylene oxide (EO)) group (–C3H6O–) and (–C2H4O–) with the –O– linkage. The physical and chemical properties of the frothers are presented in Table 1.

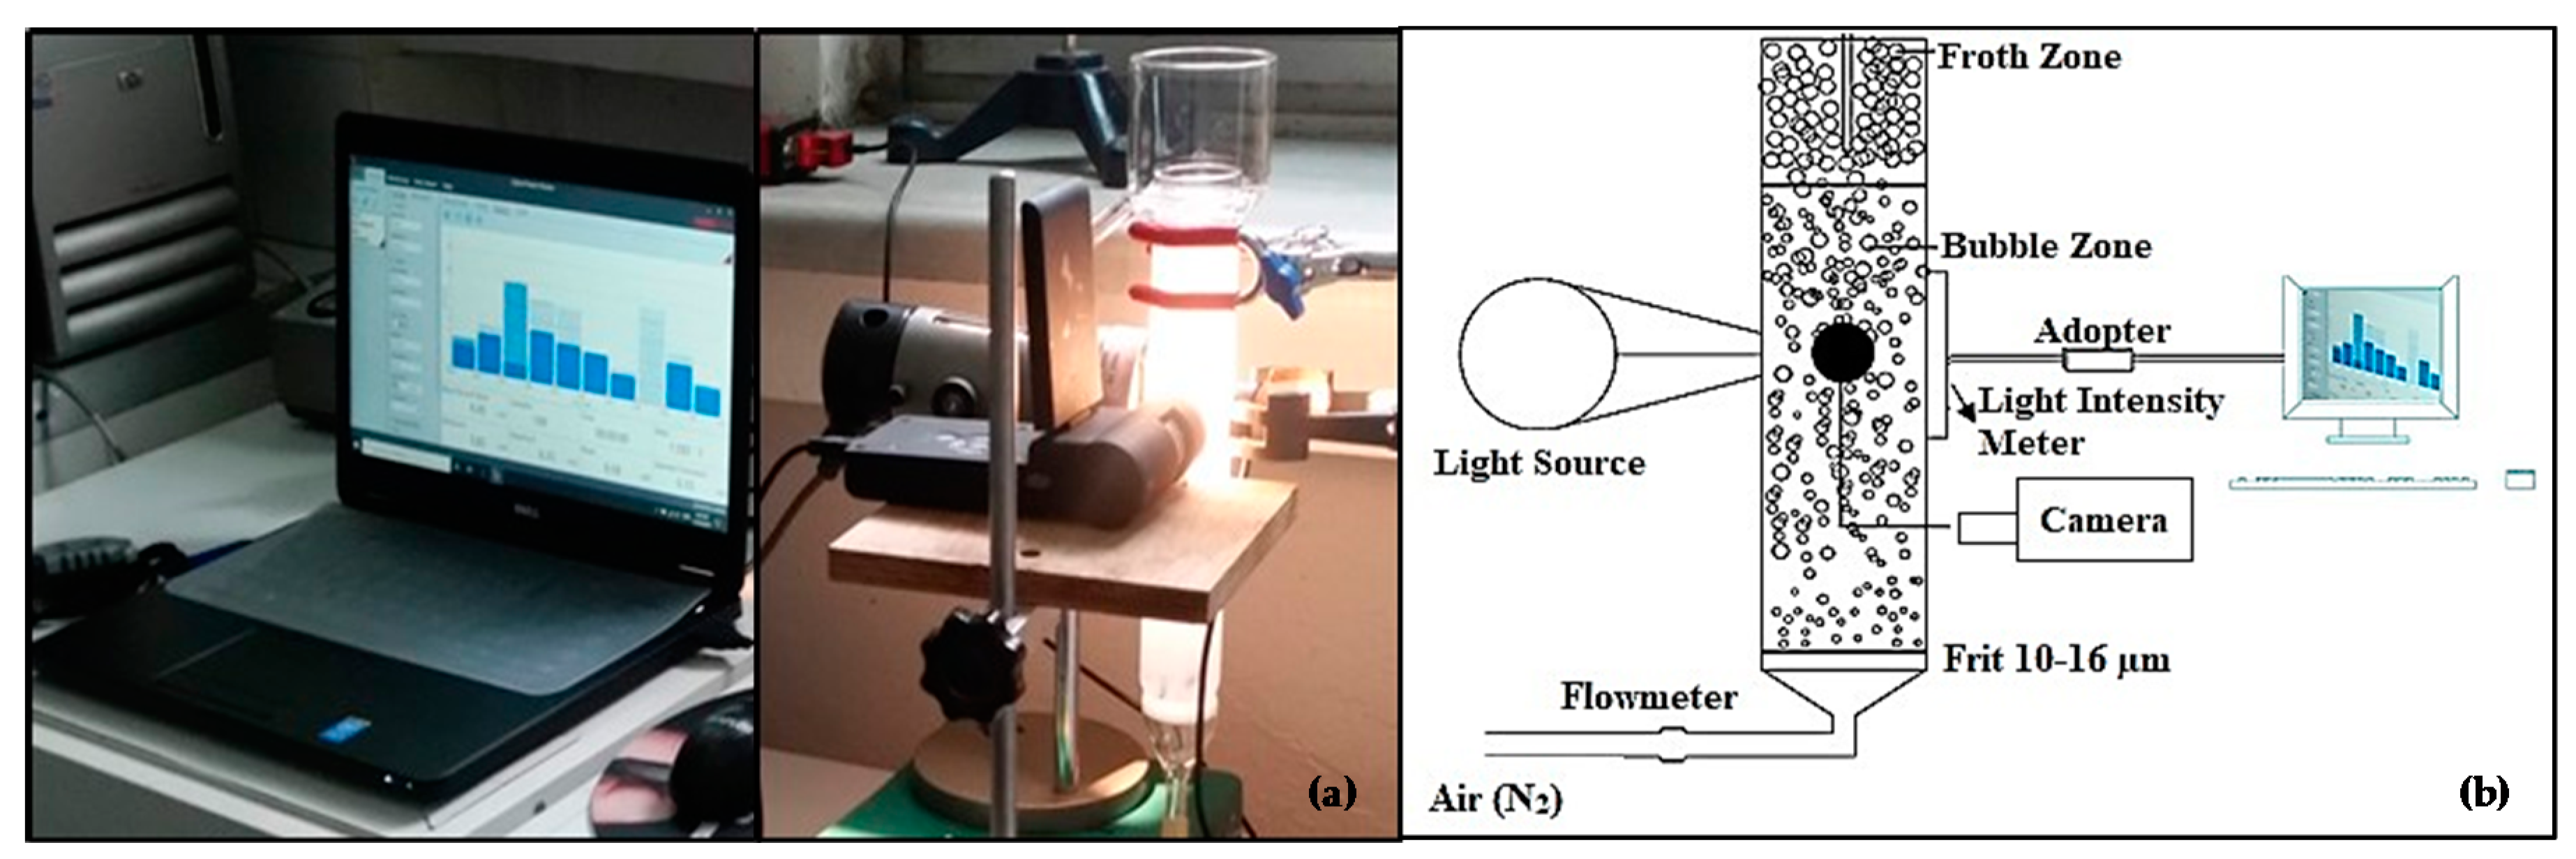
2.2. Bubble Coalescence Measurements

In this scope, a new method for determining the critical coalescence concentration of frothers was used. The bubble coalescence measurements for the frothers were carried out as a function of frother concentration (ppm) using the set-up shown in Figure 1a. As seen in Figure 1a, a 4 × 20 cm micro-flotation cell, 10–16 µm pore diameter frit was used. Nitrogen was used as the carrier gas in the experiments, at an air volume of 50 cm3/min.
The schematic presentation of the measurements is seen in Figure 1b. In this method, a light source is sent through the column filled with frother solutions. While some of the light passing through the column is absorbed by the solution, depending on the coalescence of bubbles in the presence of frothers, a light intensity (mW) of the portion (non-absorbed) leaving the column is measured by the adapter (Thorlabs, Newton, NJ, USA). The measurements start with no light absorbed by the solution, which means bubble coalescence occurs in the system until no light is received, which means no bubble coalescence occurs. The critical coalescence concentration for the frothers was determined at 50% values of the bubble coalescence [13]. The experiments were repeated 3 times, and the average error for the measurements was about ± 2 mW.

2.3. Determination of Surface Tension Isotherms

The surface tension isotherms of the frothers were determined by the method of profile analysis tensiometry using an automatic tensiometer/goniometer (model 290, Ramé-Hart Instrument Co., Succasunna, NJ, USA). The aqueous solutions were situated in a cuvette, in which a glass hooked capillary tube, connected to the dispenser, was immersed. The dispenser was controlled by a computer, thus forming a bubble with approx. a volume of 10 cm3, protruding from the capillary tube. Due to the adsorption of the frother, the bubble slowly changed its aspect ratio until reaching a thermodynamic equilibrium. The image of the bubble was captured by a camera connected to the computer taking shots every third second. The pictures were then delivered automatically to the computer, with software analyzing the images of the bubbles. Hence, the surface tension related to each one of the images was calculated automatically by solving the Young–Laplace equation. The surface tension of the bubble at each third second upon its formation was determined in this way. Therefore, the surface tension versus time profile was obtained in a time frame up to 2 h (in some cases up to 3 h), which practically coincided with the equilibrium surface tension. The aqueous solutions of the frothers were prepared by using freshly prepared deionized water (PureLab Option Q7, ElgaLabwater, High Wycombe, UK). The surface tension isotherms were determined from the very diluted aqueous solutions until the critical micelle concentration (CMC) of each frother was reached.

3. Results

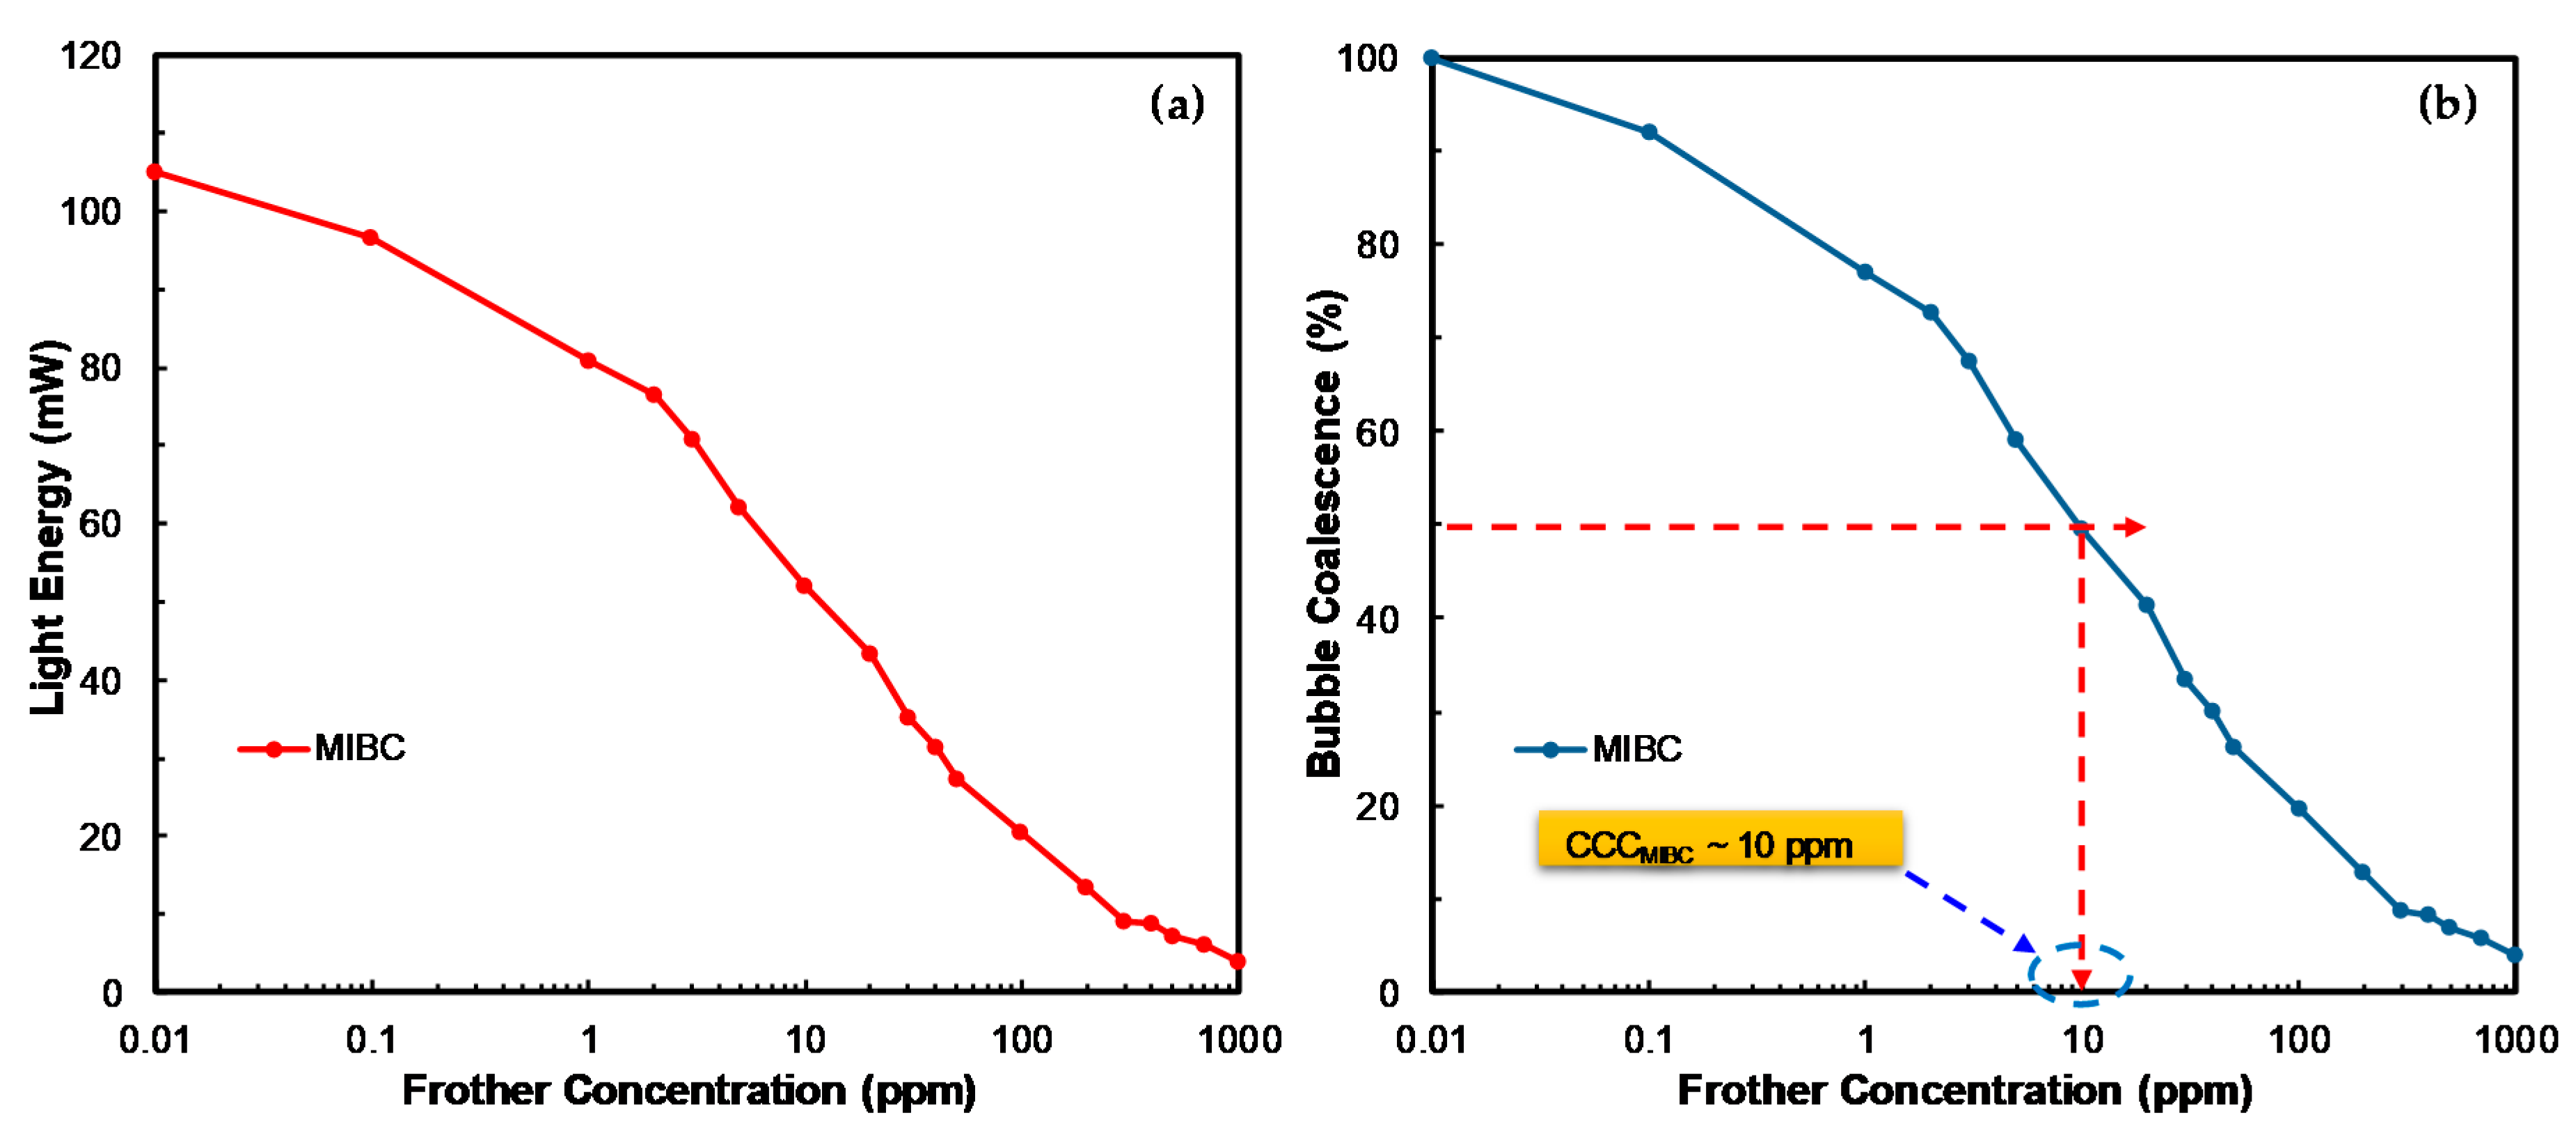
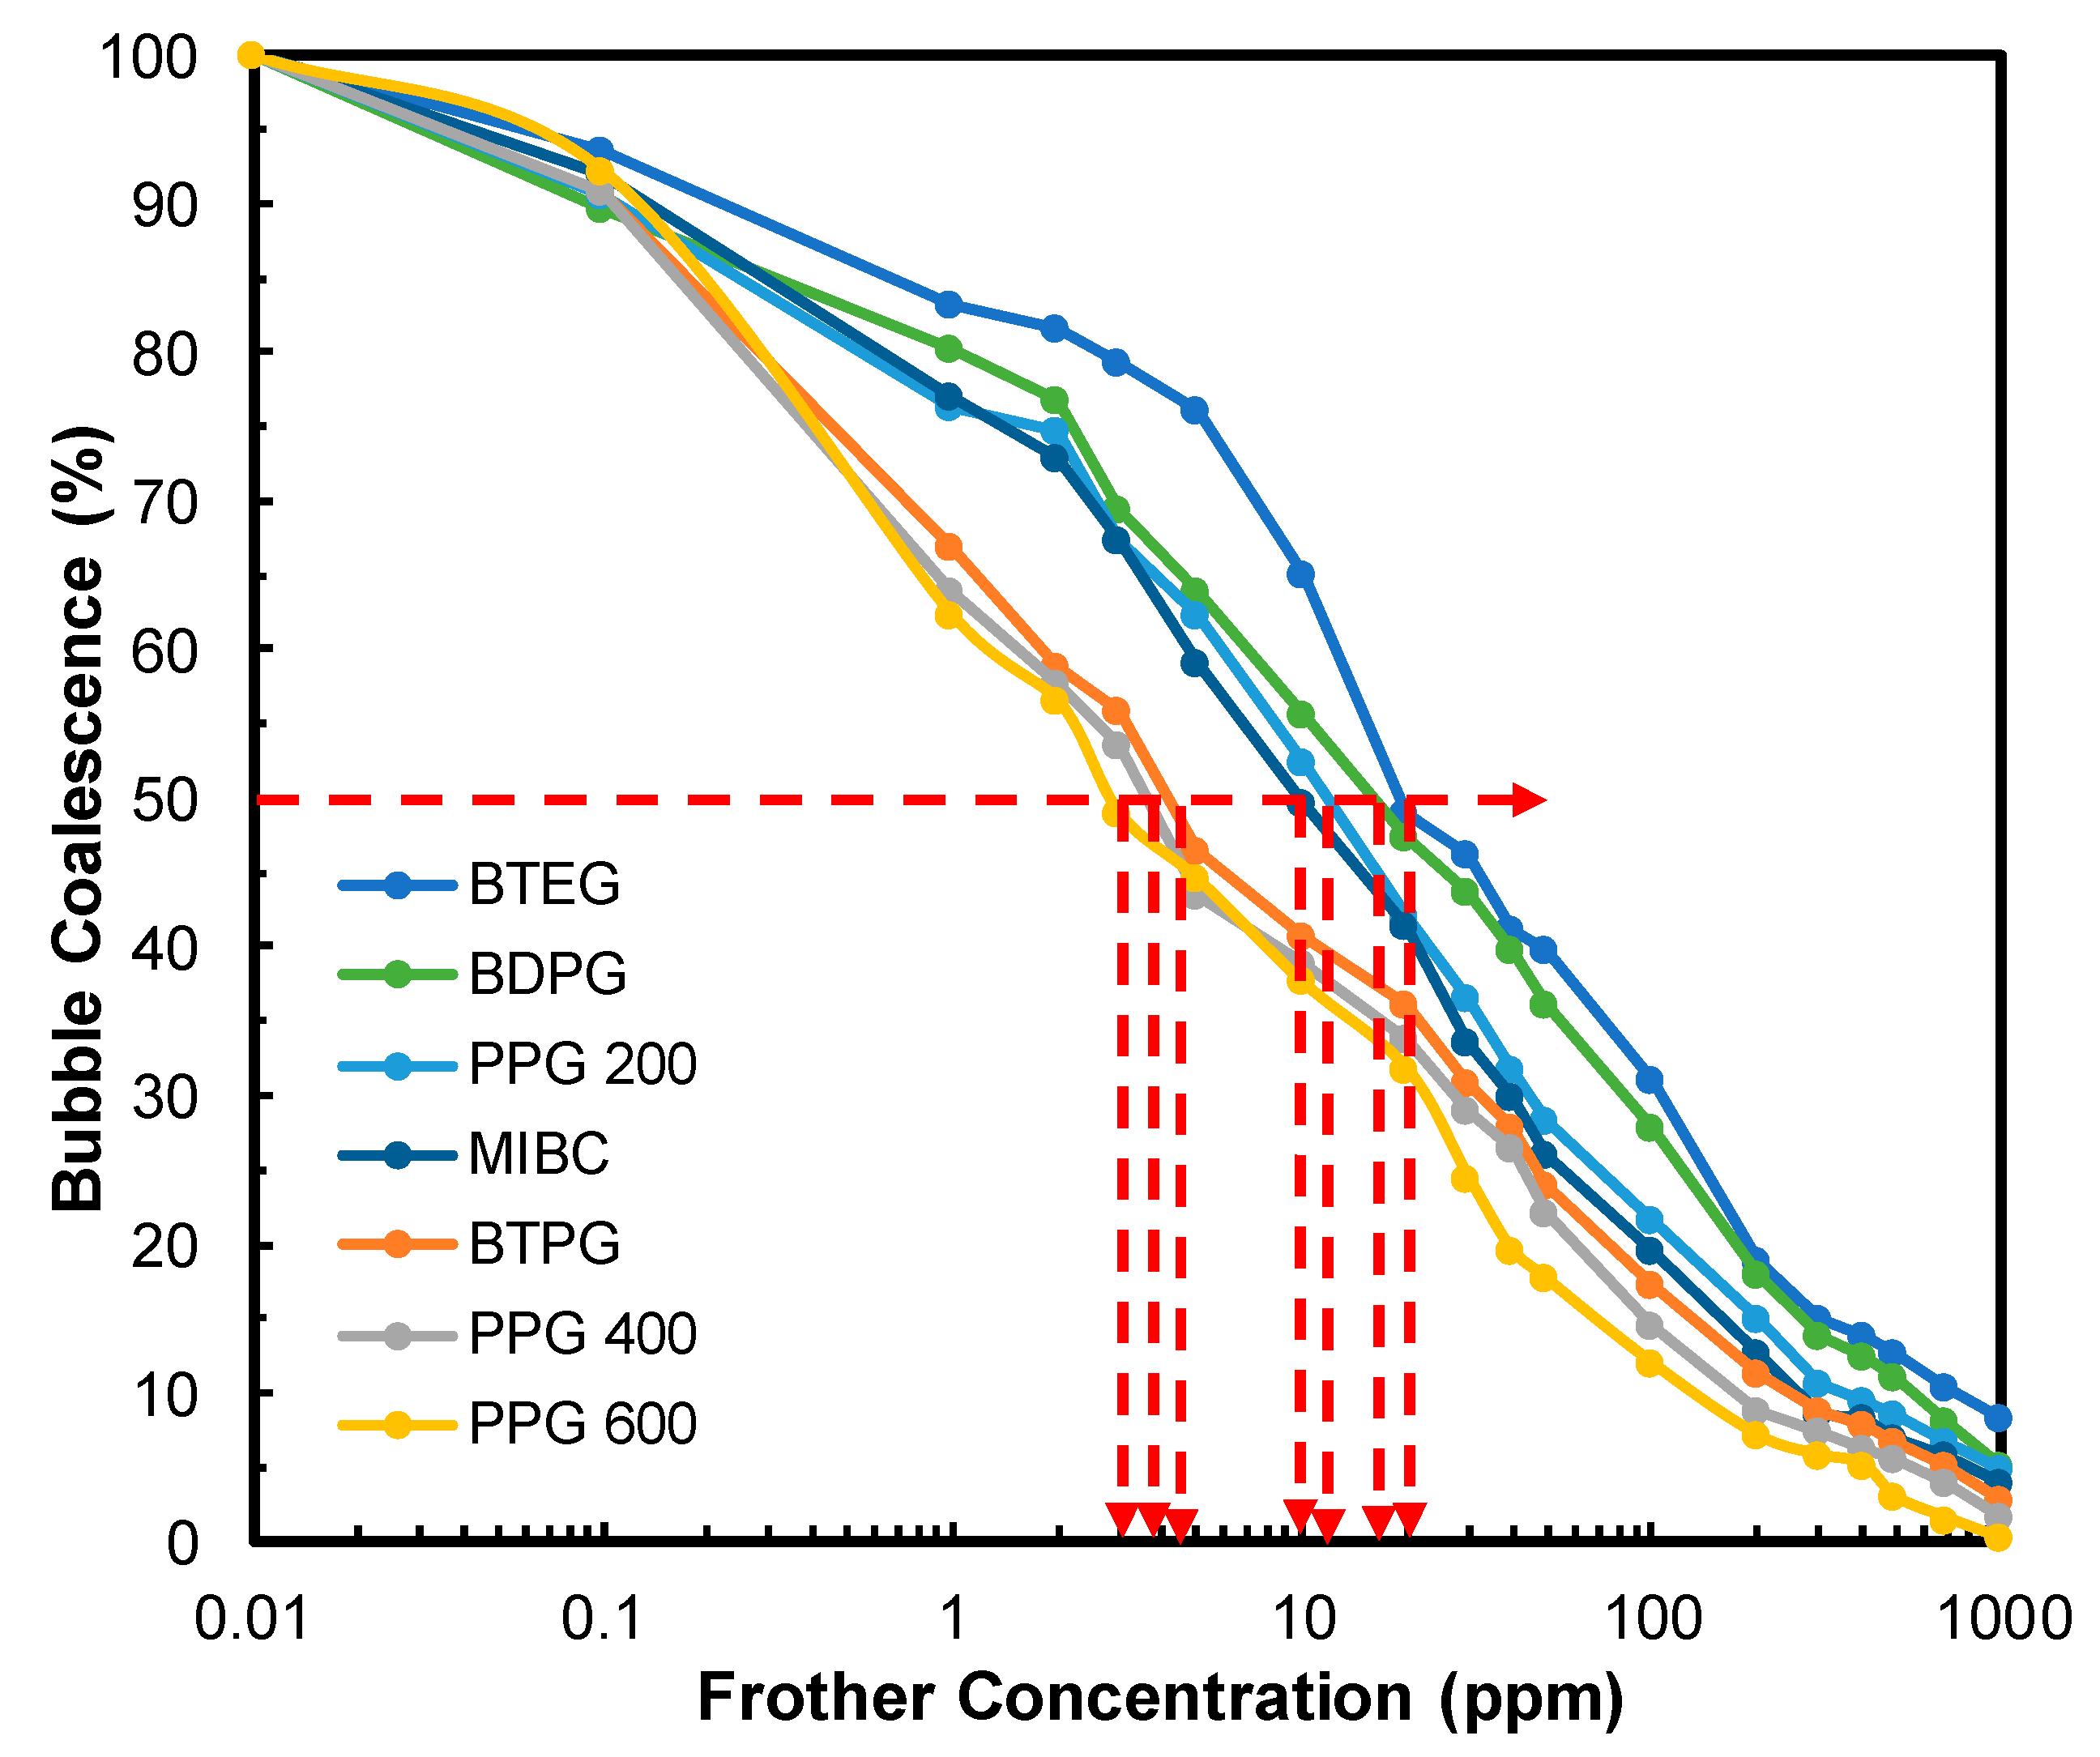
3.1. CCC Values of the Frothers

Figure 2 shows the results of light energy and bubble coalescence for MIBC. As seen in Figure 2a, the energy of light passing through the column in the presence of MIBC decreases with respect to concentration and reaches almost 0 mW at 1000 ppm MIBC, in which the bubble coalescence was almost completely inhibited. Moreover, the results were converted to the percentage of bubble coalescence and plotted in Figure 2b; the bubble coalescence value of 10 ppm for MIBC at 50% was considered as the CCC.
The measurements were then performed for all commercial frothers to determine the CCC values, and the results are presented in Figure 3. As seen in Figure 3, the bubble coalescence behavior for all frothers changed as a type and function of frothers. For example, the bubble coalescence in the presence of BTEG was higher as a function concentration; however, the inhibition of bubble coalescence was lower in the presence of PPG 600. Additionally, the order of bubble coalescence for the frothers based on the measurements is as follows:
PPG 600 > PPG 400 > BTPG > MIBC > PPG 200 > BDPG > BTEG
It can be concluded from the results that, in particular, the frothers of the polyglycol family reached CCC values at low concentrations compared to the alcohol family or other types of frothers, as evident in Table 2.

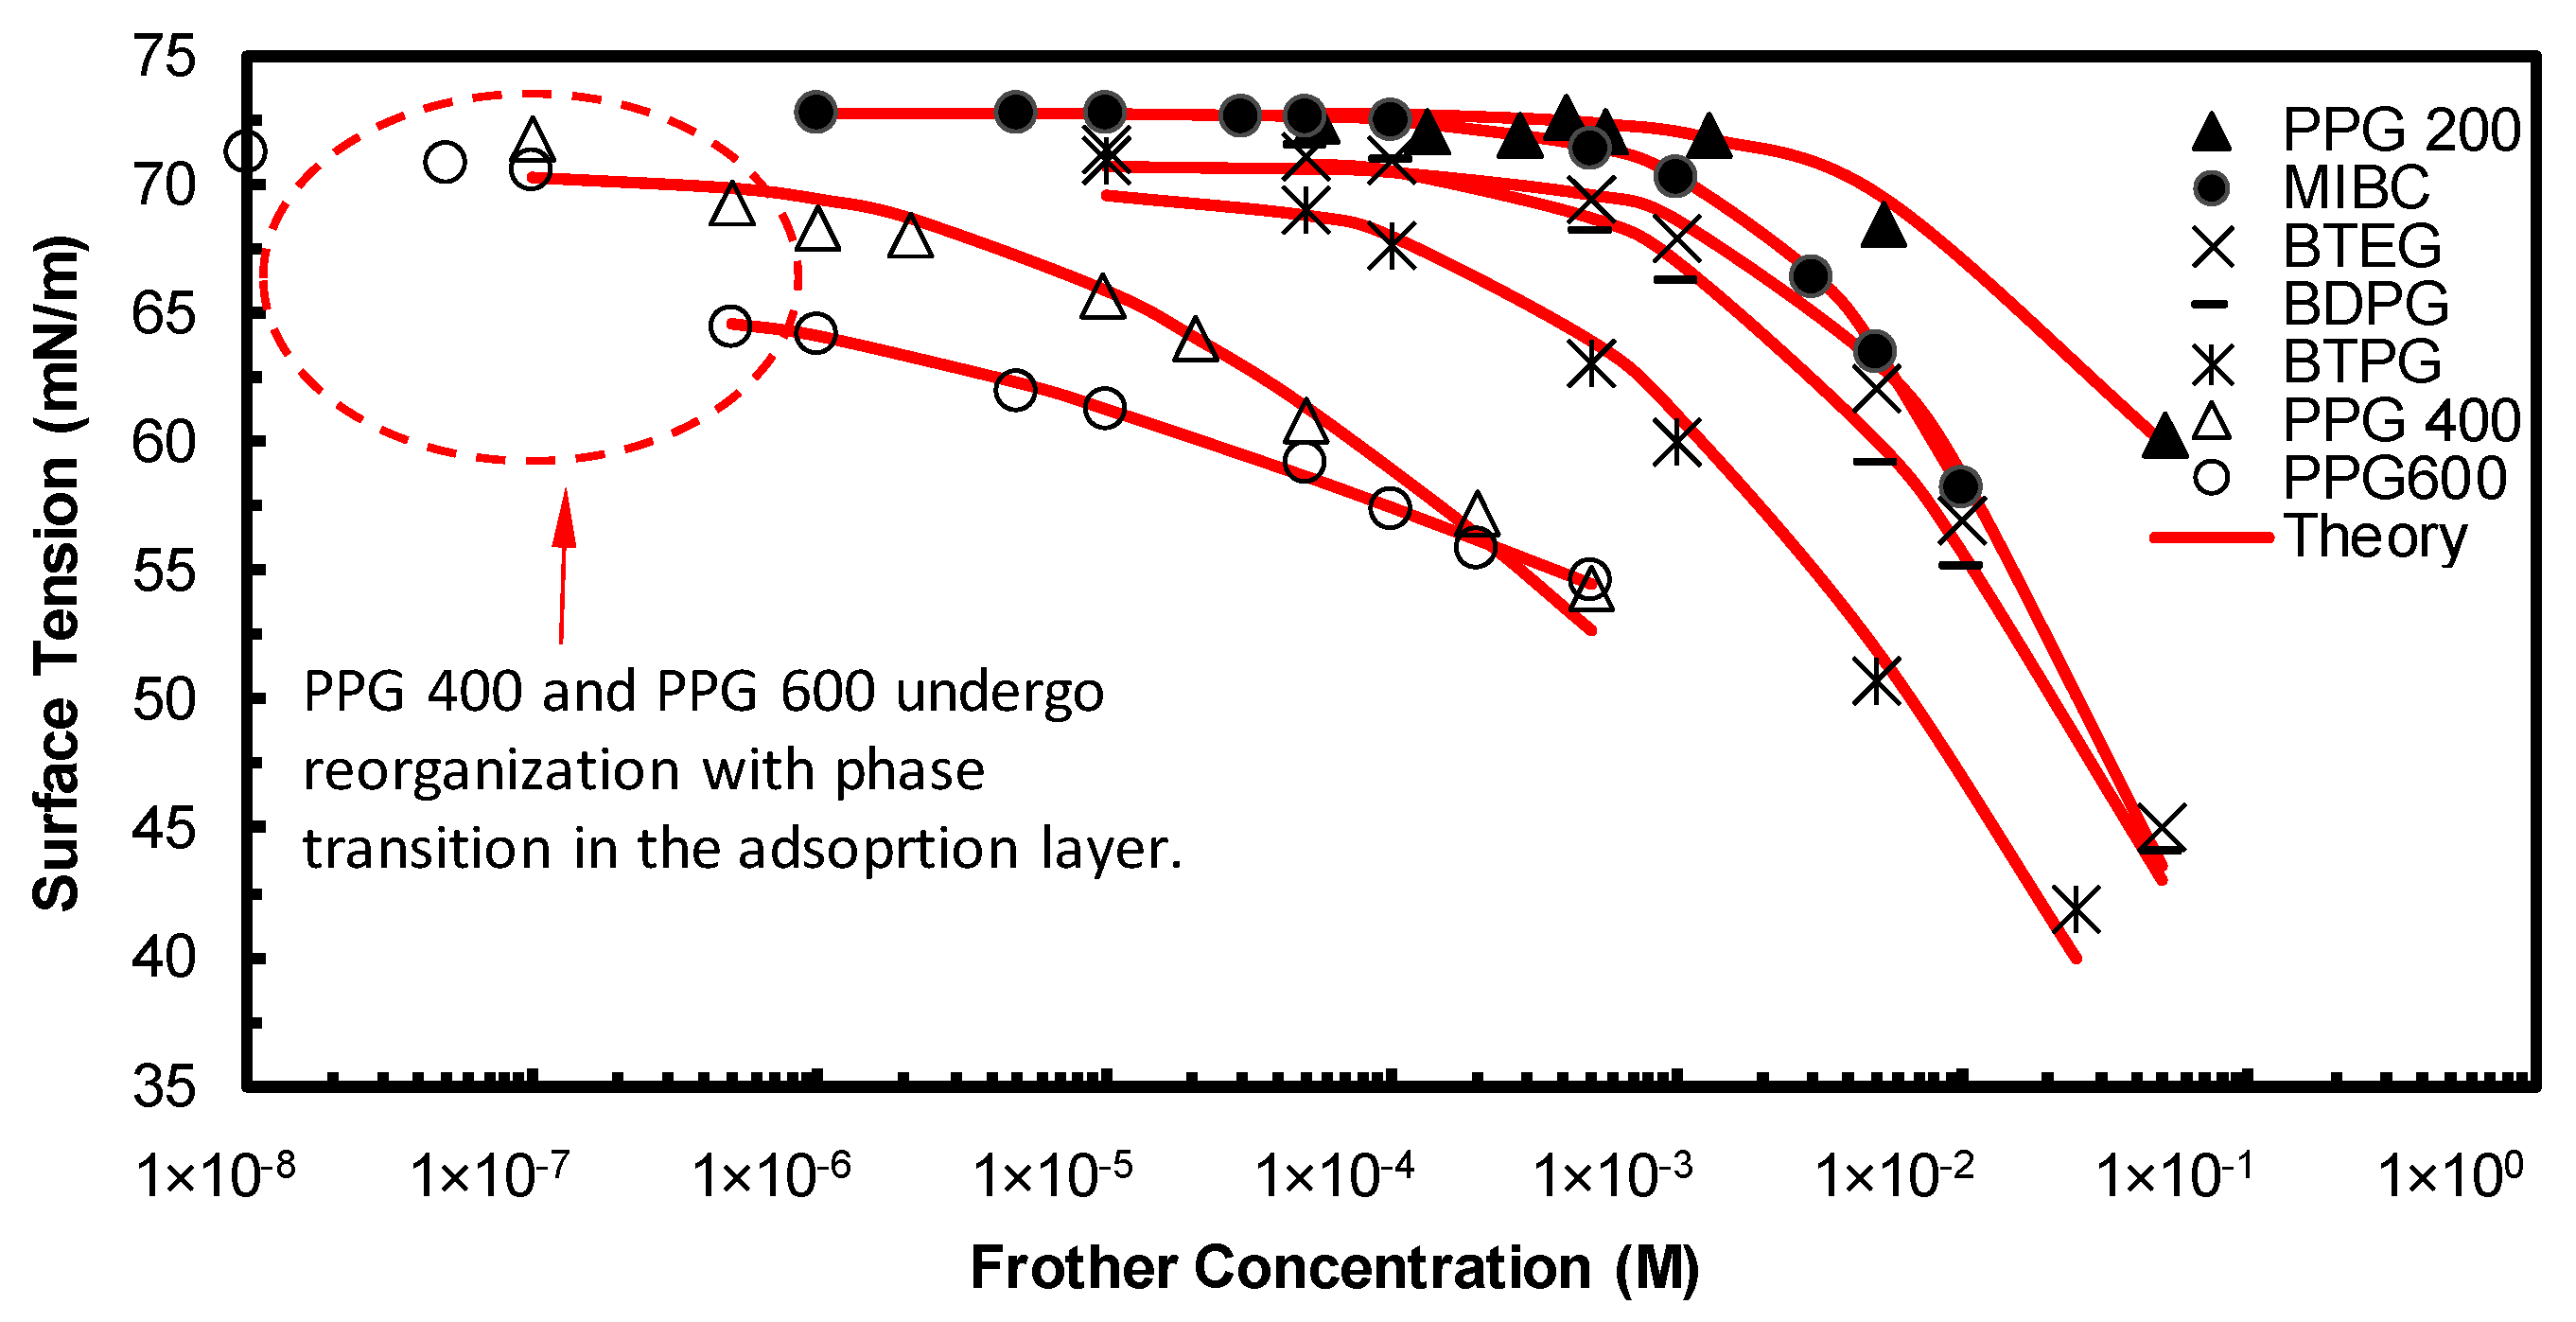
3.2. Surface Tension Isotherms and Theoretical Analysis

The adsorption model of Ivanov [27] used in the present study is one of the latest models in the literature and is based on the Helfand–Frish–Lebowitz 2D equation of the state [28] of moving circles in a plane, which was later developed by Ivanov et.al. [27,29] using Baxter sticky potential [30]. The adsorption model of Ivanov operates with the following adsorption isotherm and equation of state:
K s C s = Γ s ( 1 α Γ s ) ( 2 1 + R β ) 1 + 8 β 4 β × e x p [ α Γ s ( 4 3 α Γ s ) ( α Γ s ) 2 × 2 1 + R β ]
σ = σ 0 Γ s ( 1 α Γ s ) 2 × 2 1 + R β k B T ,   R β = 1 + 16 β α Γ s 1 α Γ s
where K s equilibrium adsorption is constant, C s is the frother concentration, Γ s is the frother’s adsorption on the air/water interface, α is the cross-sectional area of the molecule of the frother on the air/water interface, σ is the surface tension of the frother’s surfactant solution, σ 0 is the surface tension of the solvent (water), β is the interaction parameter, k B is the Boltzmann constant, and T is the absolute temperature. The model has 3 fitting parameters— K s α , and β —which are obtained by processing each one of the adsorption isotherms via the Least square method using the Visual Basic for Applications (VBA) module of Microsoft Excel. The experimental and theoretical surface tension isotherms are presented in Figure 4. One can see that the agreement between the experimental data and theory is good.
The adsorption parameters of the frothers derived using Equation (1) and their CCC values are presented in Table 3. One can see a general correlation between the molecular weight and the cross-sectional area of the molecule at the air/water interface. There is certainly a relationship between the adsorption parameters and the molecular structure of the frothers, but due to the lack of sufficient clarity, we do not want to speculate on it.
One can see that BTEG and MIBC have quite similar adsorption parameters, and CCC values as well. They have quite small cross-sectional areas α at the air/water interface and equilibrium adsorption constants K s BDPG has a larger value of K s and α corresponding to a lower CCC value. The further increase of K s values correlates well with the decrease of the CCC values of the frother (excluding PPG 200). The larger the value of K s the more surface-active the frother and the smaller the value of the CCC. One can see as well that only in the case of PPG 600, β > 0, which is an indication of attraction between the PPG molecules, in contrast to the other frothers, which do not exhibit any interaction between themselves. It is interesting to note that the equilibrium surface tension of PPG 600 at a concentration of about 5 × 10⁻⁷ mol/L drops irregularly from σ = 70 mN/m to σ = 64 mN/m. This indicates a reorganization of the adsorption layer via the 2D phase transition, causing a significant drop in the surface tension value. We suspect that such a phenomenon occurs with PPG 400, although significantly more weakly expressed.

4. Discussion

Today in mineral flotation applications, use of frothers is dominated by two groups of nonionic surfactants: alcohols (general formula: (CnH2n + 1OH) and polyglycols (R (X)y OH, where R = H or CnH2n + 1 and X are the most common propylene oxide), PO (–C3H6O–) or ethylene oxide means EO (–C2H4O–), i.e., polypropylene glycols and polyethylene glycols, respectively [31]. While at a certain defrothing concentration (CCC) the coalescence of bubbles is completely prevented. Increasing the frother concentration above the CCC value also does not affect the bubble size [32,33]. Laskowski et al. [15,32,33,34] also showed that the frothers reduce the size of the bubbles by preventing the coalescence of bubbles. After this concentration, the size of the bubbles does not change much.
Various experimental set-ups have been developed in the literature to characterize frothers and determine appropriate frother types and concentrations. Among these, the CCC values of MIBC determined using different methods are presented in Table 4. As seen in Table 4, the CCC values show differences depending on the method used. Thus, the CCC value of MIBC (10 ppm) obtained from this study was found to be almost the same compared to the ones determined with other methods for the same frother. This in turn showed that the results closely agree with the literature. As can be seen from Table 4, many different set-ups, including several process steps, have been adapted to find CCC values. However, the use of light intensity used in this study is somewhat easier and quicker than other ones. Thus, considering very similar results for the CCC value of MIBC determined with other methods, it can be concluded that this method is an easy and quick way to determine the extent of bubbles coalescence (CCC). As mentioned above, the CCC values of the frothers correlate well with the adsorption parameters of the frothers, although the CCC values are located at the very beginning of the surface tension isotherm. We believe that this established correlation can be used in the future for theoretical modeling of CCC values of frothers. The only exclusion is PPG 200, which has a smaller K s value than that of BDPG and a smaller CCC value than that of BDPG. This could be due to the surface reorganization of the adsorption layer, which cannot be detected with the tensiometer.

5. Conclusions

In this study, the critical coalescence concentrations (CCC) of conventional (commercial) frothers (PPG 200, 400, and 600; BTPG; BTEG; BDPG; and MIBC as a reference) was investigated in terms of bubble-coalescence measurements using a bubble column based on light intensity. The results showed that the CCC value for PPG 600 was 3 ppm (5.00 × 10⁻⁶ mol/L); however, BTEG had the highest CCC value at 20 ppm (9.7 × 10⁻⁵ mol/L) among the further frothers investigated in this study. These results indicated that the inhibition of bubble coalescence in the presence of BTEG was the worst one, while PPG 600 exhibited the best performance. This is not surprising because the equilibrium adsorption constant K s of PPG 600 is significantly higher than that of BTEG. Overall, the adsorption parameters of the frothers correlate well (excluding PPG 200) with their CCC values. The larger the K s value, the smaller the CCC value of the frother. The surface tension of PPG 600 at 5 × 10⁻⁷ mol/L drops with about 6 mN/m (from σ = 70 mN/m to σ = 64 mN/m), in contrast to conventional surfactants, with which such sudden drop cannot be observed. This could be due to surface reorganization related to the 2D phase transition of the adsorption layer. The latter can cause such a significant drop in the surface tension value. In addition, PPG 600 is the only frother investigated in the present study whose molecules attract each other ( β > 0). The other frothers have β = 0.
Overall, our method had similar results to other methods for determining CCC values as verified by MIBC results, and it can be considered to be an easy and quick method for determining the value of CCC in the laboratory.

Author Contributions

Experimental methodology, O.G, K.B., O.O., F.B.; validation, S.I.K. N.A.G.; investigation, O.G, K.B., O.O.; resources, O.G, O.O., F.B., M.S.Ç.; original draft preparation, O.G. and O.O.; writing—review and editing, O.G, O.O., S.I.K., M.S.Ç.; supervision, O.O., M.S.Ç.; project administration, M.S.Ç. All authors have read and agreed to the published version of the manuscript.

Funding

This research and the APC were funded by EUROPEAN UNION’S HORIZON 2020, grant number 821265.

Conflicts of Interest

The authors declare no conflict of interest.

References

  1. Castro, S.; Miranda, C.; Toledo, P.; Laskowski, J.S. Effect of frothers on bubble coalescence and foaming in electrolyte solutions and seawater. Int. J. Miner. Process. 2013, 124, 8–14. [Google Scholar] [CrossRef]
  2. Farrokhpay, S. The significance of froth stability in mineral flotation—A review. Adv. Colloid Interface Sci. 2011, 166, 1–7. [Google Scholar] [CrossRef]
  3. Finch, J.A.; Nesset, J.E.; Acuña, C. Role of frother on bubble production and behaviour in flotation. Miner. Eng. 2008, 21, 949–957. [Google Scholar] [CrossRef]
  4. Hernandez-Aguilar, J.R.; Gomez, C.O.; Finch, J.A. A technique for the direct measurement of bubble size distributions in industrial flotation cells. In Proceedings of the 34th Annual Meeting of the Canadian Mineral Processors, Ottawa, ON, Canada, 22–24 January 2002; pp. 389–402. [Google Scholar]
  5. Tan, Y.H.; Rafiei, A.A.; Elmahdy, A.; Finch, J.A. Bubble size, gas holdup and bubble velocity profile of some alcohols and commercial frothers. Int. J. Miner. Process. 2013, 119, 1–5. [Google Scholar] [CrossRef]
  6. Firouzi, M.; Nguyen, A.V. On the effect of van der Waals attractions on the critical salt concentration for inhibiting bubble coalescence. Miner. Eng. 2014, 58, 108–112. [Google Scholar] [CrossRef]
  7. Nguyen, A.V.; Evans, G.M. Movement of fine particles on an air bubble surface studied using high-speed video microscopy. J. Colloid Interface Sci. 2004, 273, 271–277. [Google Scholar] [CrossRef]
  8. Orvalho, S.; Ruzicka, M.C.; Olivieri, G.; Marzocchella, A. Bubble coalescence: Effect of bubble approach velocity and liquid viscosity. Chem. Eng. Sci. 2015, 134, 205–216. [Google Scholar] [CrossRef]
  9. Bournival, G.; Ata, S.; Karakashev, S.I.; Jameson, G.J. An investigation of bubble coalescence and post-rupture oscillation in non-ionic surfactant solutions using high-speed cinematography. J. Colloid Interface Sci. 2014, 414, 50–58. [Google Scholar] [CrossRef] [PubMed]
  10. Gungoren, C.; Islek, E.; Baktarhan, Y.; Kursun, I.; Ozdemir, O. A novel technique to investigate the bubble coalescence in the presence of surfactant (MIBC) and electrolytes (NaCl and CaCl2). Physicochem. Probl. Miner. Process. 2018, 54, 1215–1222. [Google Scholar]
  11. Kracht, W.; Finch, J.A. Using sound to study bubble coalescence. J Colloid Interface Sci. 2009, 332, 237–245. [Google Scholar] [CrossRef]
  12. Wang, L.; Qu, X. Impact of interface approach velocity on bubble coalescence. Miner. Eng. 2012, 26, 50–56. [Google Scholar] [CrossRef]
  13. Nguyen, P.T.; Hampton, M.A.; Nguyen, A.V.; Birkett, G.R. The influence of gas velocity, salt type and concentration on transition concentration for bubble coalescence inhibition and gas holdup. Chem. Eng. Res. Des. 2012, 90, 33–39. [Google Scholar] [CrossRef]
  14. Bournival, G.; Pugh, R.J.; Ata, S. Examination of NaCl and MIBC as bubble coalescence inhibitor in relation to froth flotation. Miner. Eng. 2012, 25, 47–53. [Google Scholar] [CrossRef]
  15. Cho, Y.S.; Laskowski, J.S. Effect of flotation frothers on bubble size and foam stability. Int. J. Miner. Process. 2002, 64, 69–80. [Google Scholar] [CrossRef]
  16. Grau, R.A.; Heiskanen, K. Bubble size distribution in laboratory scale flotation cells. Miner. Eng. 2005, 18, 1164–1172. [Google Scholar] [CrossRef]
  17. Kracht, W.; Rebolledo, H. Study of the local critical coalescence concentration (l-CCC) of alcohols and salts at bubble formation in two-phase systems. Miner. Eng. 2013, 50–51, 77–82. [Google Scholar] [CrossRef]
  18. Laskowski, J.S. Testing flotation frothers. Physicochem. Probl. Miner. Process. 2004, 38, 13–22. [Google Scholar]
  19. Grandon, F.; Alvarez, J.; Gomez, C. Frother dosage in laboratory flotation testing. In Proceedings of the 11th International Mineral Processing Conference, Santiago, Chile, 21–23 October 2015. [Google Scholar]
  20. Veras, M.M.; Baltar, C.A.M.; Paulo, J.B.A.; Leite, J.Y.P. Comparative study of the main flotation frothers using a new HYDROMESS adapted technique. Rev. Esc. Minas 2014, 67, 87–92. [Google Scholar] [CrossRef] [Green Version]
  21. Kowalczuk, P.B. Determination of critical coalescence concentration and bubble size for surfactants used as flotation frothers. Ind. Eng. Chem. Res. 2013, 52, 11752–11757. [Google Scholar] [CrossRef]
  22. Marucci, G.; Nicodemo, L. Coalescence of gas bubbles in aqueous solutions of inorganic electrolytes. Chem. Eng. Sci. 1967, 22, 1257–1265. [Google Scholar] [CrossRef]
  23. Ozdemir, O.; Du, H.; Karakashev, S.I.; Nguyen, A.V.; Celik, M.S.; Miller, J.D. Understanding the role of ion interactions in soluble salt flotation with alkylammonium and alkylsulfate collectors. Adv. Colloid Interface Sci. 2011, 163, 1–22. [Google Scholar] [CrossRef]
  24. Chan, B.S.; Tsang, Y.H. A theory on bubble-size dependence of the critical electrolyte concentration for inhibition of coalescence. J. Colloid Interface Sci. 2005, 286, 410–413. [Google Scholar] [CrossRef] [PubMed]
  25. Craig, V.S.J.; Ninham, B.W.; Pashley, R.M. Effect of electrolytes on bubble coalescence. Nature (London) 1993, 364, 317–319. [Google Scholar] [CrossRef]
  26. Craig, V.S.J.; Ninham, B.W.; Pashley, R.M. The effect of electrolytes on bubble coalescence in water. J. Phys. Chem. 97, 10192–10197. [CrossRef]
  27. Slavchov, R.I.; Karakashev, S.I.; Ivanov, I.B. Ionic Surfactants and Ion-Specific Effects: Adsorption, Micellization, Thin Liquid Films; in Surfactant Science and Technology: Retrospects and Prospects; Romsted, L.S., Ed.; Taylor & Francis Group Publishing: Abingdon, UK, 2013; In press. [Google Scholar]
  28. Helfand, E.; Frish, H.; Lebowitz, J. Theory of the Two- and One-Dimensional Rigid Sphare Fluids. J. Chem. Phys. 1961, 34, 1037–1042. [Google Scholar] [CrossRef]
  29. Ivanov, I.B.; Danov, K.D.; Dimitrova, D.; Boyanov, M.; Ananthapadmanabhan, K.P.; Lips, A. Equations of state and adsorption isotherms of low molecular non-ionic surfactants. Coll. Surf. A 2010, 354, 118–133. [Google Scholar] [CrossRef]
  30. Baxter, R.J. Percus-Yevick equation for hard spheres with surface adhesion. J. Chem. Phys. 1969, 49, 2770–2774. [Google Scholar] [CrossRef]
  31. Tan, Y.H.; Zhang, W.; Finch, J.A. Frother structure-property relationship: Effect of polyethylene glycols on bubble rise velocity. Miner. Eng. 2018, 116, 56–61. [Google Scholar] [CrossRef]
  32. Laskowski, J.S.; Cho, Y.S.; Ding, K. Effect of frothers on bubble size and foam stability in potash ore flotation systems. Can. J. Chem. Eng. 2003, 81, 63–69. [Google Scholar] [CrossRef]
  33. Laskowski, J.S.; Tlhone, T.; Williams, P.; Ding, K. Fundamental properties of the polyoxypropylene alkyl ether flotation frothers. Int. J. Miner. Process. 2003, 72, 289–299. [Google Scholar] [CrossRef]
  34. Cho, Y.S.; Laskowski, J.S. Bubble coalescence and its effect on dynamic foam stability. Canadian J. Chem. Eng. 2002, 80, 299–305. [Google Scholar] [CrossRef]
  35. Gupta, A.K.; Banerjee, P.K.; Mishra, A. Effect of Frothers on Foamability, Foam Stability, and Bubble Size. Coal Prep. 2007, 27, 107–125. [Google Scholar] [CrossRef]
  36. Khoshdast, H.; Sam, A. Flotation Frothers: Review of Their Classifications, Properties and Preparation. Open Miner. Process. J. 2011, 4, 25–44. [Google Scholar]
  37. Srinivas, A.; Ghosh, P. Coalescence of bubbles in aqueous alcohol solutions. Ind. Eng. Chem. Res. 2012, 51, 795–806. [Google Scholar]
  38. Castillo, P.; Alvarez, J.; Gomez, C. Analytical method to calculate the critical coalescence concentration (CCC). In Proceedings of the XXVII International Mineral Processing Congress (IMPC 2014), Santiago, Chile, 20–24 October 2014; 2014. [Google Scholar]
  39. Corona-Arroyo, M.A.; López-Valdivieso, A.; Laskowski, J.S.; Encinas-Oropesa, A. Effect of frothers and dodecylamine on bubble size and gas holdup in a downflow column. Miner. Eng. 2015, 81, 109–115. [Google Scholar] [CrossRef]
  40. Zhu, H.; Valdivieso, A.L.; Zhu, J.; Song, S.; Min, F.; Corona Arroyo, M.A. A study of bubble size evolution in Jameson flotation cell. Chem. Eng. Res. Des. 2018, 137, 461–466. [Google Scholar] [CrossRef]
  41. Drzymala, J.; Kowalczuk, P.B. Classification of flotation frothers. Minerals 2018, 8, 53. [Google Scholar] [CrossRef] [Green Version]
Figure 1. (a) Experimental set-up of bubble coalescence measurement, (b) Schematic representation of bubble coalescence measurements.
Minerals 10 00617 g001
Figure 2. (a) Light energy, (b) % bubble coalescence values as a function of MIBC concentration.
Minerals 10 00617 g002
Figure 3. Variation of % bubble coalescence against concentration of different frothers.
Minerals 10 00617 g003
Figure 4. Experimental and theoretical surface tension isotherms.
Minerals 10 00617 g004
Table 1. Physical and chemical properties of frothers.
ChemicalHydroxyl Value
(mgKOH/g)
Molecular Weight
(g/mol)
FormulaHLBpH
(1% Solution)
Molecular Structure
PPG 200
n ~ 3.5
510–623180–220HO(C3H6O)nH10.555.0–7.0 Minerals 10 00617 i001
Minerals 10 00617 i002
PPG 400
n ~ 6.5
255–312360–440HO(C3H6O)nH8.695.0–7.0
PPG 600
n ~ 10
170–208540–660HO(C3H6O)nH8.255.0–7.0
BTPG
n = 3
~75 Polyglycols248.36C4H9(C3H6O)nOH6.635.0–7.0 Minerals 10 00617 i003
BTEG
n = 3
≥50%–<100%
Polyglycols
206.2793C4H9(C2H4O)nOH8.055.0–7.0 Minerals 10 00617 i004
Minerals 10 00617 i005
BDPG
n = 2
98.5
Polyglycols
190.28C4H9(C3H6O)nOH6.755.0–7.0 Minerals 10 00617 i006
Minerals 10 00617 i007
MIBCw/w:≥100%102.17CH3CH(OH)CH2−−CH(OH)CH36.535.0–6.0 Minerals 10 00617 i008
Table 2. CCC values of the frothers investigated in this study.
FrotherCCC (ppm)CCC (mol/L)
PPG 60035.00 × 10−6
PPG 40049.52 × 10−6
BTPG52.01 × 10−5
MIBC109.78 × 10−5
PPG 200115.73 × 10−5
BDPG178.93 × 10−5
BTEG209.7 × 10−5
Table 3. Adsorption parameters and CCC values of the frothers investigated in this study.
FrothersMolecular Weight
(g/mol)
K s ( cm ) α (A2) β CCC
(mol/L)
PPG 600540–6600.05166.000.685.00 × 106
PPG 400360–4400.0549.2809.52 × 106
BTPG248.369.72 × 10−423.0002.01 × 105
PPG 200180–2203.60 × 10−521.8505.73 × 105
BDPG190.282.46 × 10−419.9608.93 × 105
BTEG206.27939.79 × 10−512.3909.70 × 105
MIBC102.171.17 × 10−49.9309.78 × 105
Table 4. Determination of CCC values for MIBC using different techniques.
FrotherCCC
(mmol/L)
CCC
(ppm)
MethodLiterature
MIBC0.0798.1Three-hole sparger, open-top flotation cell University of Cape Town, (UCT) bubble size analyzer and D32[15]
MIBC0.1111.2Sauter mean bubble diameter (D32) UCT bubble sizer and DFI-CCC diagram[18]
MIBC0.35236.0Camera and image analysis Sauter mean diameter (D50)[35]
MIBC0.1111.2UCT bubble size analyzer and Sauter mean bubble diameter CCC values[36]
MIBC/DF-2000.0949.6
MIBC/DF-2500.0676.85
MIBC/DF-10240.0495.01
MIBC0.09810.0Scatter the HeNe laser and stochastic mode/Hydrophillic Lipophillic Balance (HLB)[37]
MIBC0.10811.0The capillary tube was studied; acoustic emissions were recorded[17]
MIBC0.09810.0HLB and Sauter mean bubble diameter[21]
MIBC0.12412.7Calculated from the average and standard deviation of 5 measurements[38]
MIBC0.19620.0Sauter mean bubble diameter (D32)[20]
MIBC
(analytical grade)
0.077.2McGill bubble size analyzer/D32 mm Sauter mean bubble diameter[19]
MIBC
(commercial)
0.0687.0
MIBC0.0798.1Sauter mean diameter (D32) and HLB group number calculated[39]
MIBC CC950.0596.0Sauter mean diameter (D32)[40]
MIBC CC900.0464.7
MIBC CC850.0383.9
MIBC0.1111.2Sauter mean bubble diameter/HLB/MW[41]
MIBC0.09810.0Bubble-bubble contact time[10]
MIBC*0.098 ± 0.03510.02 ± 3.56
* Average value of MIBC calculated from the data in Table 4 (min and max values were excluded from the calculation).

