Article

In Situ Geochemical Analysis of Organics in Growth Lines of Antarctic Scallop Shells: Implications for Sclerochronology

by
Alberto Pérez-Huerta
1,*,
Sally E. Walker
2 and
Chiara Cappelli
1
1
Department of Geological Sciences, The University of Alabama, Tuscaloosa, AL 35487, USA
2
Department of Geology, University of Georgia, Athens, GA 30602, USA
*
Author to whom correspondence should be addressed.
Minerals 2020, 10(6), 529; https://doi.org/10.3390/min10060529
Submission received: 10 May 2020 / Revised: 3 June 2020 / Accepted: 4 June 2020 / Published: 10 June 2020

Abstract

:
Bivalve shells are extensively used as bioarchives for paleoclimate and paleoenvironmental reconstructions. Proxy calibrations in recent shells are the basis for sclerochronology and the applications of geochemistry data to fossils. Shell geochemical information, however, could be altered with the disappearance of intercrystalline organic matrix components, including those linked to shell growth increments, during early diagenesis. Thus, an evaluation of the chemistry of such organics is needed for the correct use of sclerochronological records in fossil shells. Here, we use atom probe tomography (APT) for in situ geochemical characterization of the insoluble organic matrix in shell growth increments in the Antarctic scallop, Adamussium colbecki. We confirm the presence of carboxylated S-rich proteoglycans, possibly involved in calcite nucleation and growth in these scallops, with significant concentrations of magnesium and calcium. Diagenetic modification of these organic components could impact proxy data based on Mg/Ca ratios, but more importantly the use of the δ15N proxy, since most of the shell nitrogen is likely bound to the amide groups of proteins. Overall, our findings reinforce the idea that shell organics need to be accounted for in the understanding of geochemical proxies.

1. Introduction

Chemical proxy data from calcium-carbonate-based biomineral structures are extensively used for paleoclimate and paleoenvironmental reconstruction [1,2]. This proxy information is especially significant for high-resolution climate records and environmental monitoring in the context of sclerochronology [3]. Proxy calibrations using sclerochronology of bivalve shells are significant for the understanding of past environmental events, in particular for archeological and Holocene records [3,4]. However, these calibrations could be compromised if the geochemistry of the organics associated with shell growth is not considered [5] in the development and applications of proxies. Thus, the precise chemical characterization of organics in growth lines is important in the development and application of proxies in the context of sclerochronology. However, the in situ geochemical characterization of such organics is challenging because non-destructive techniques, with the exception of nano-SIMS (Secondary Ion Mass Spectrometry), can rarely target shell elements with dimensions below 5 µm, which is the case for bivalve shell growth lines.
In this study, we use the atom probe tomography (APT) technique for the geochemical analysis of organics within growth lines of the Antarctic scallop, Adamussium colbecki. This species was chosen because of its importance within the benthic communities of Antarctica [6] and its potential as a high-resolution bioarchive to understand glacial ice dynamics in Antarctica [7,8]. Furthermore, we discuss the implications of the geochemical make-up of growth lines for shell biomineralization. Finally, we evaluate the potential impact of diagenesis in proxy applications for this species and other bivalves used in sclerochronological studies.

2. Materials and Methods

2.1. Materials

Living shells of the Antarctic scallop, Adamussium colbecki, were collected in November 2008 from Explorers Cove (77°34.259′ S, 163°30.699′ E), located in western McMurdo Sound, Antarctica [6] (Figure 1).

2.2. Methods

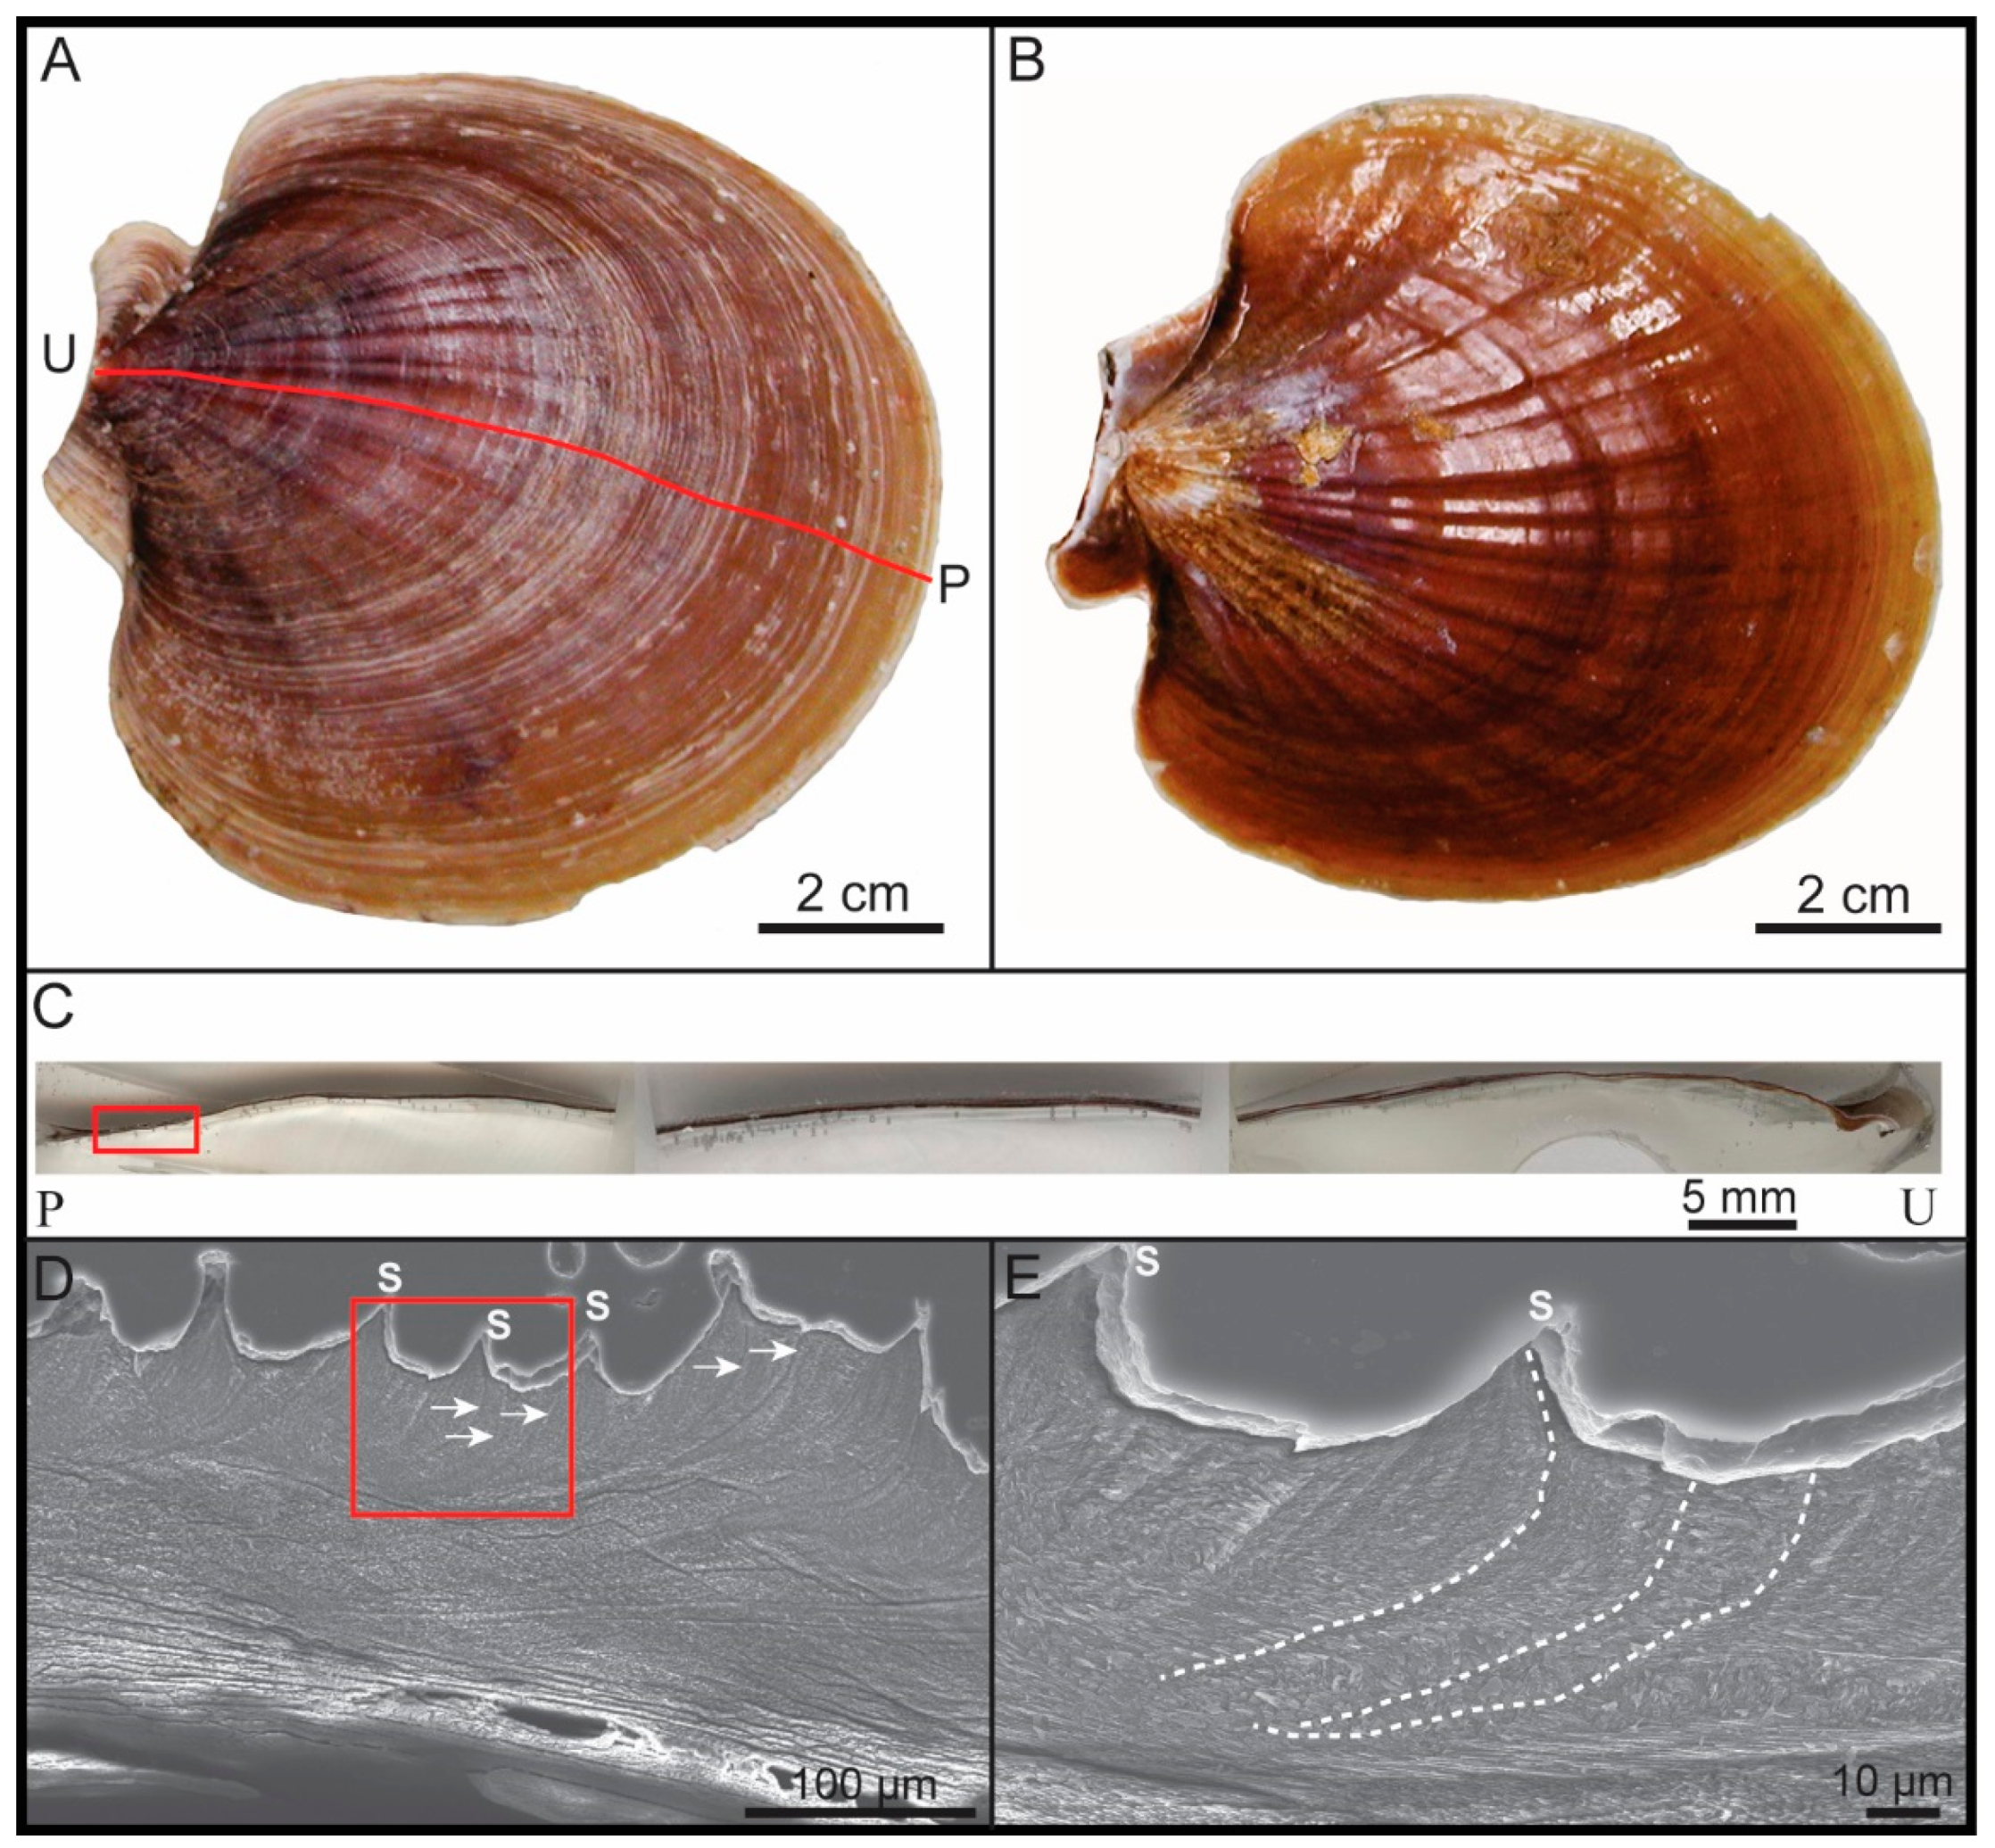
2.2.1. General Sample Preparation and Selection of Regions of Interest

From a group of disarticulated, tissue-free valves, one right valve was selected and embedded in resin. After embedding, the valve was sectioned along the length (from the umbo region to the posterior region; Figure 1) and the resulting sections were ultrapolished with a suspension of alumina (Micropolish II Buehler, USA; 1.0 micron for 5 min and 0.3 micron for 10 min) on polishing cloths. After polishing, sections were ultrasonicated with dionized water for 3 min. One section was used to study the microstructure through SEM imaging, whereas the other section was used for APT sample preparation.
The SEM imaging was conducted in the posterior shell region (Figure 1C) to analyze the different types of growth lines and their locations in relation to the surficial striae (Figure 1D,E). Several substrial growth lines measuring ~1.5 μm in thickness were found in the same location as the striae on the shell surface (Figure 1E). In the polished section, the growth lines were also visible, and thus we could easily identify the location of areas for sample preparation. Each stria has a bundle of two substrial lines that correspond to the same growth increment (Figure S1). Multiple attempts were made to capture the growth lines (Figure S1) and we finally managed to target each pair of substriae underpinning a certain stria in order to make APT samples, with one wedge in each of them (Figure 2).

2.2.2. Scanning Electron Microscopy (SEM) Imaging

The valve section, in contrast to the one used for APT preparation, was etched with 2% HCl for 30 s and sputter coated with gold for 120 s. Imaging was conducted using a JEOL 7000 FEG-SEM (JEOL, Tokyo, Japan; 30 kV, medium (10) spot size, and 11 mm working distance) housed at the Alabama Analytical Research Center (AARC) of the University of Alabama.

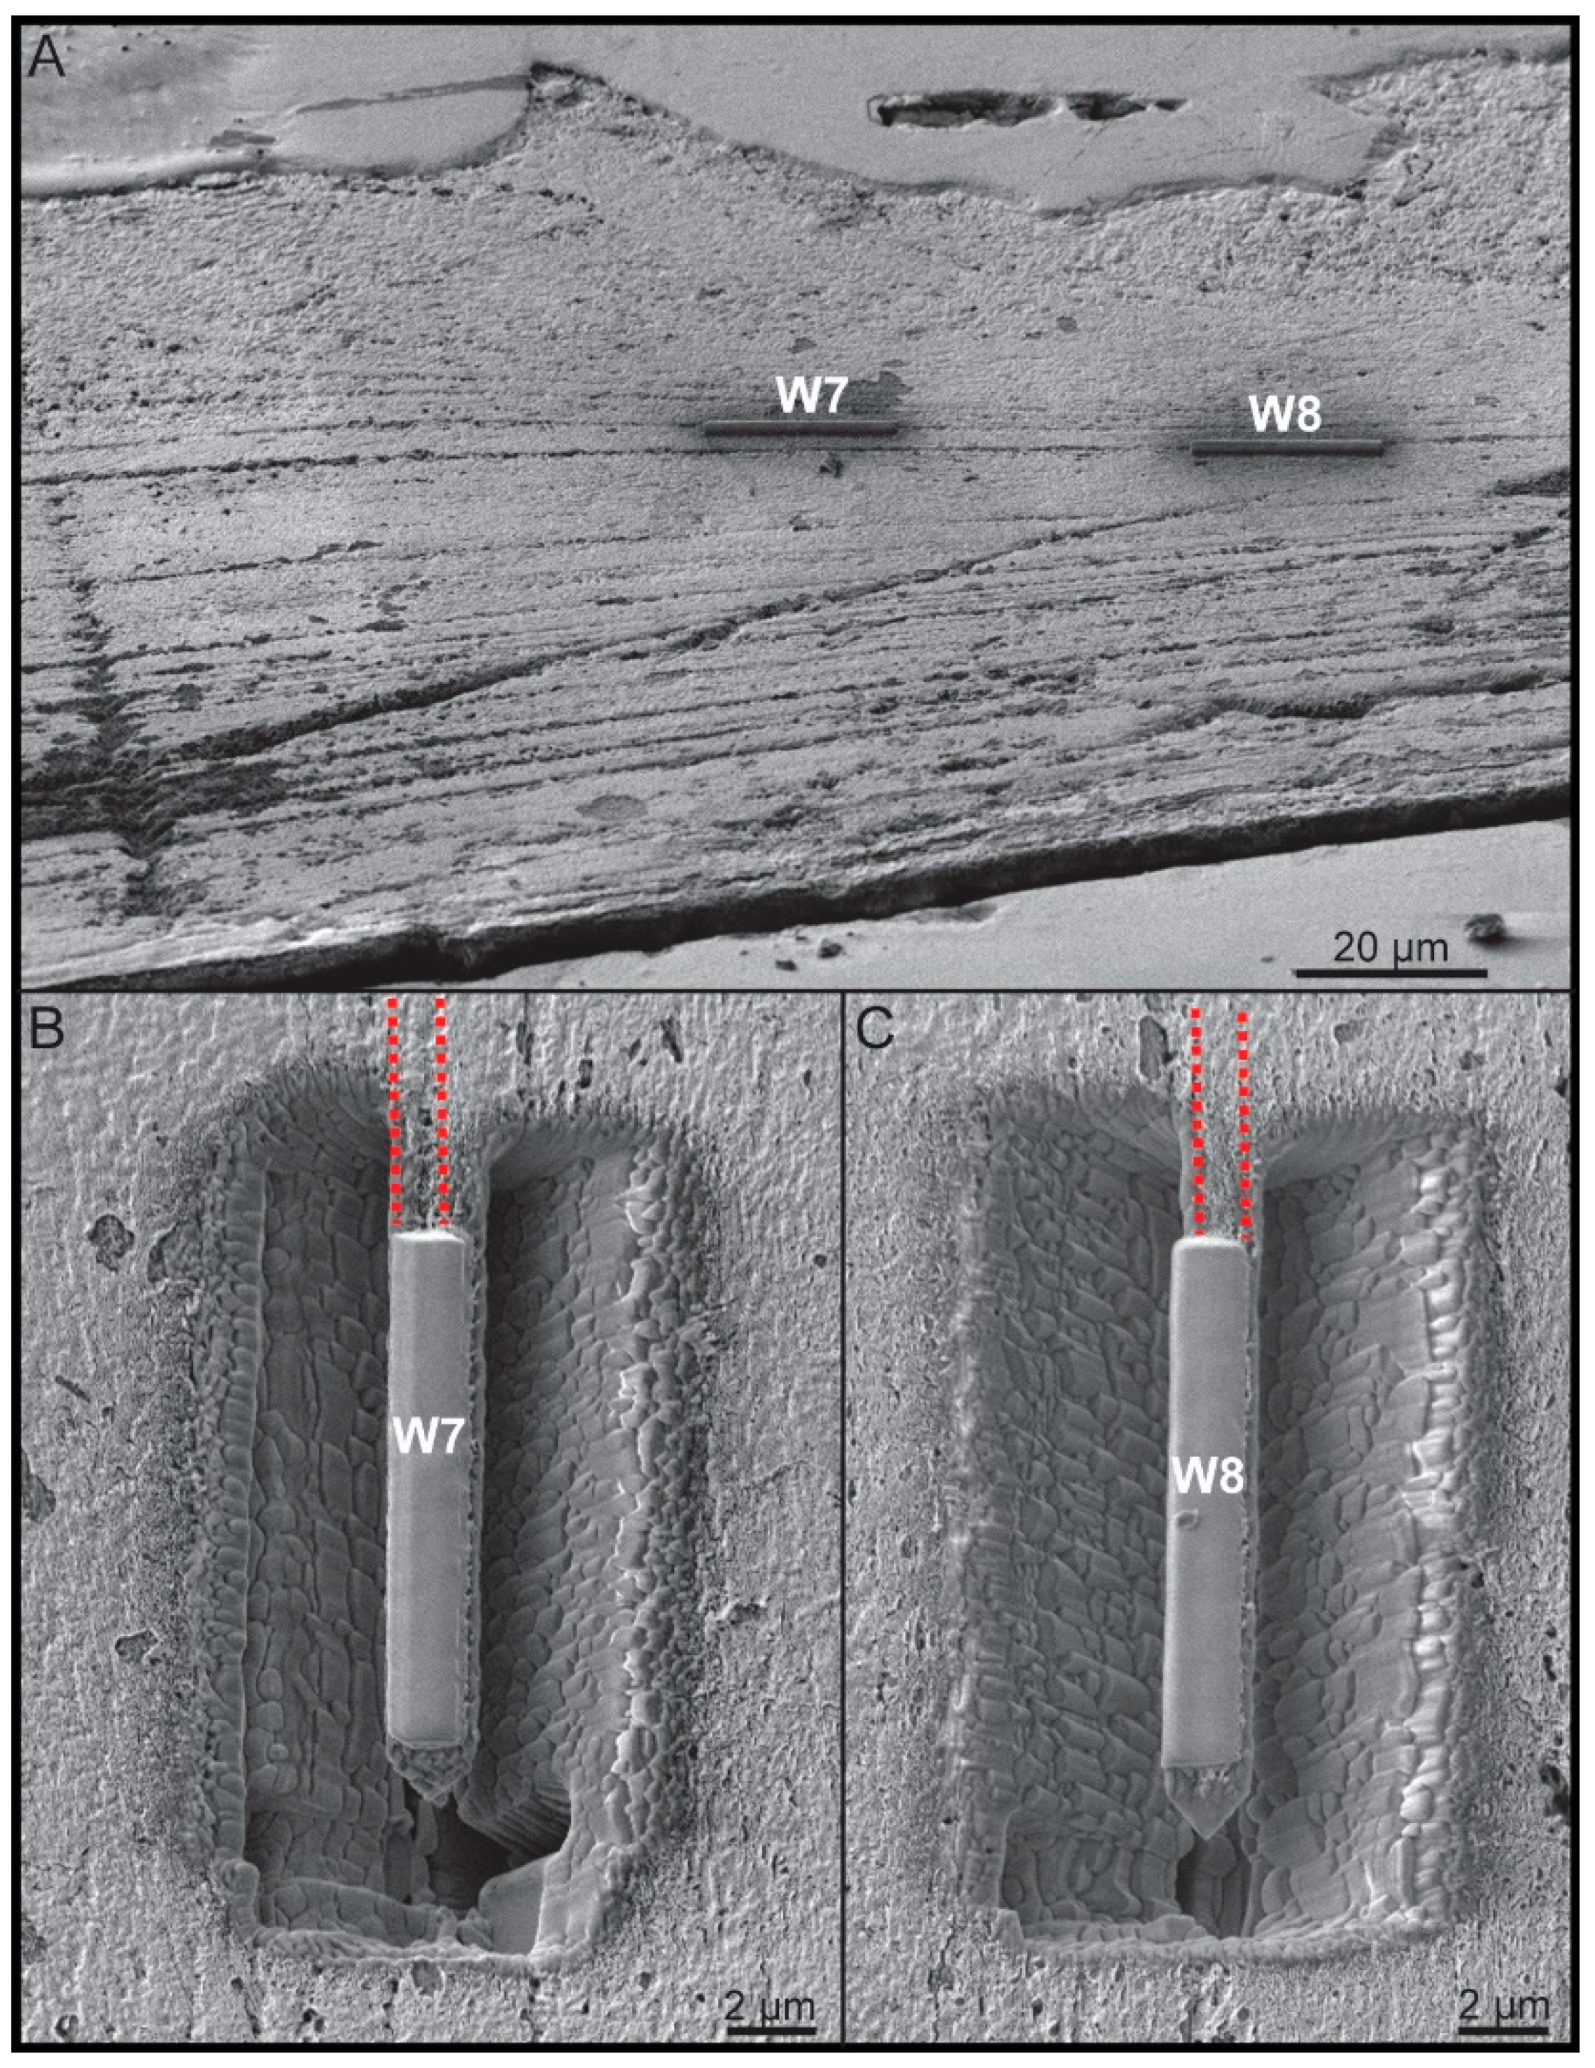
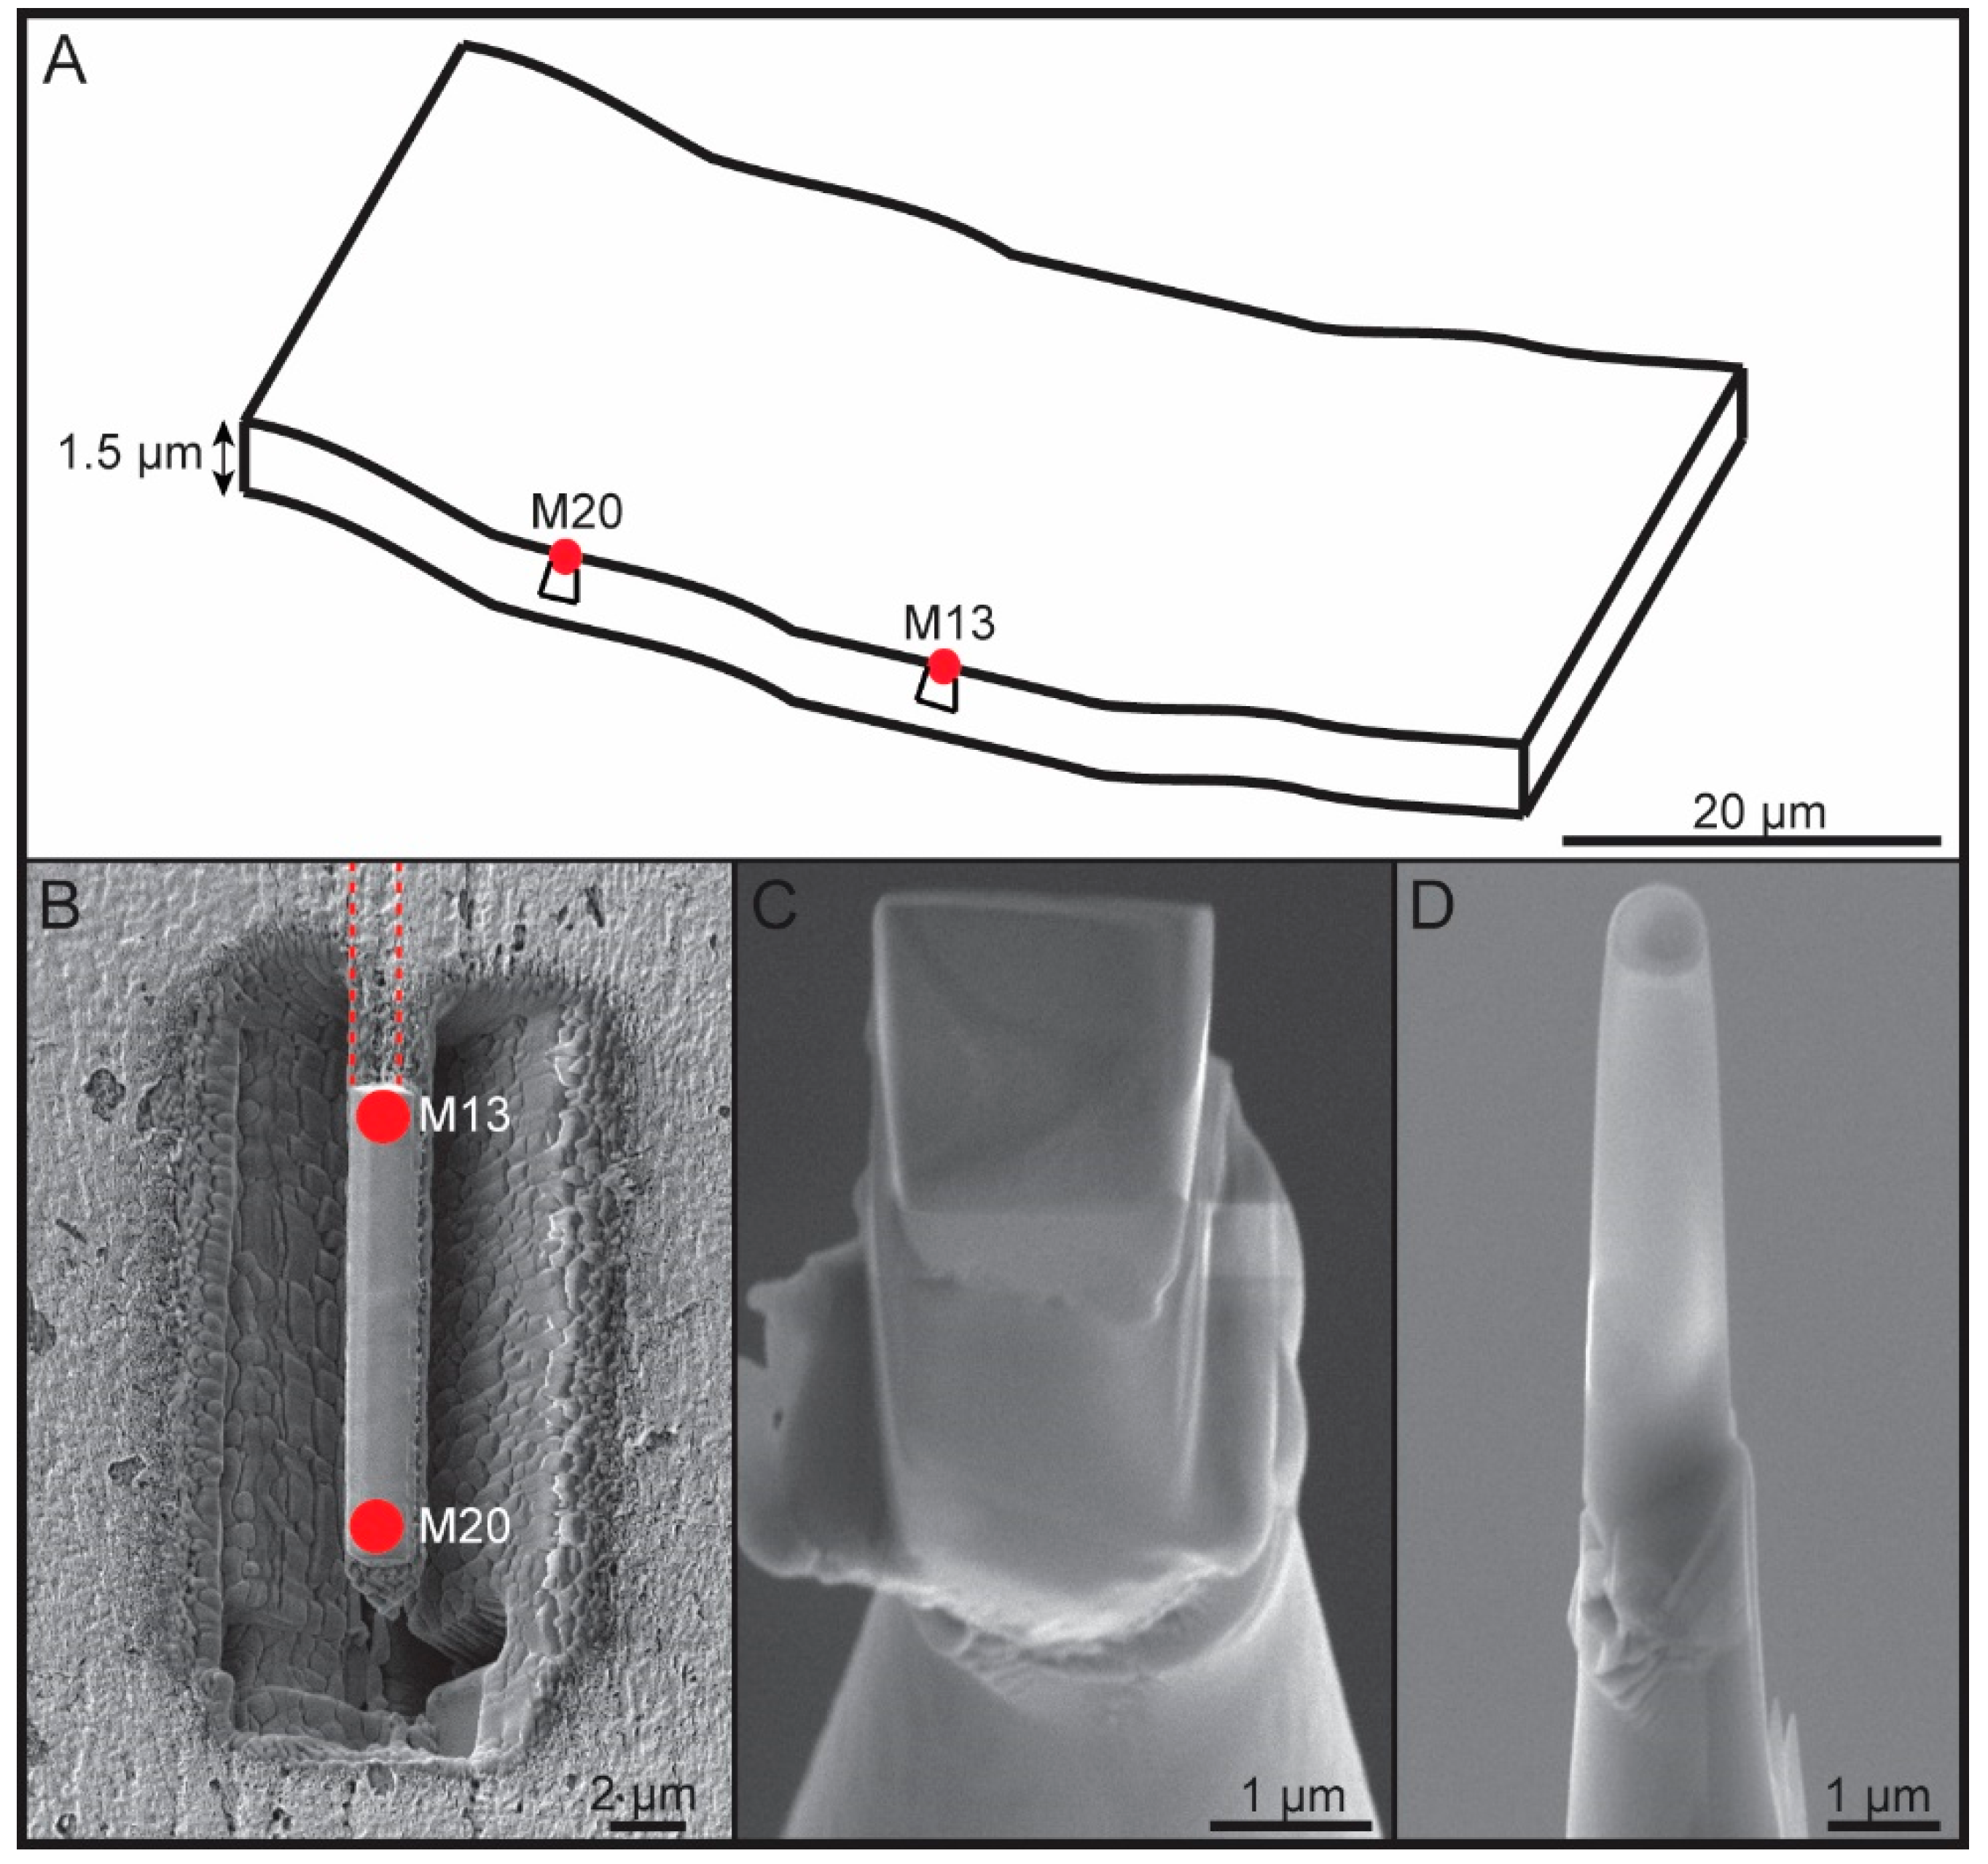
2.2.3. Focused Ion Beam (FIB) Work

Tip-shaped APT specimens were prepared by focused ion beam (FIB) [9] technique using two dual-beam scanning electron microscopes (TESCAN LYRA XMU, Brno, Czech Republic) and a FEI Quanta 3D dual-beam instrument, Hillsboro, USA, housed at the Alabama Analytical Research Center (AARC) of the University of Alabama. After the polished section was coated with gold for 2 min, a rectangle of platinum was deposited on top of the substriae lines (W7 and W8 in Figure 2) using a Ga+ ion beam at 30 kV and 30 pA. Although the substriae lines appear as linear features in a 2D shell section, they appear as planes in 3D imaging, and thus the wedges were placed on top of the line (Figure 3). The wedges of material were cut using the ion beam on three sides and then welded with Pt to an in situ nanomanipulator before the edges were cut free (Figure 2 and Figure 3). The two wedges were cut in segments of 2 µm in width and sequentially affixed with platinum to silicon posts of a microtip array coupon (CAMECA Scientific Instruments, Inc., Madison, USA). From each wedge, 7 tips were prepared, with tip radii ranging from 16 to 47 nm and shank angles ranging from 9° to 49° (Figure 3).

2.2.4. Local Electrode Atom Probe (LEAP) Work and Data Analysis
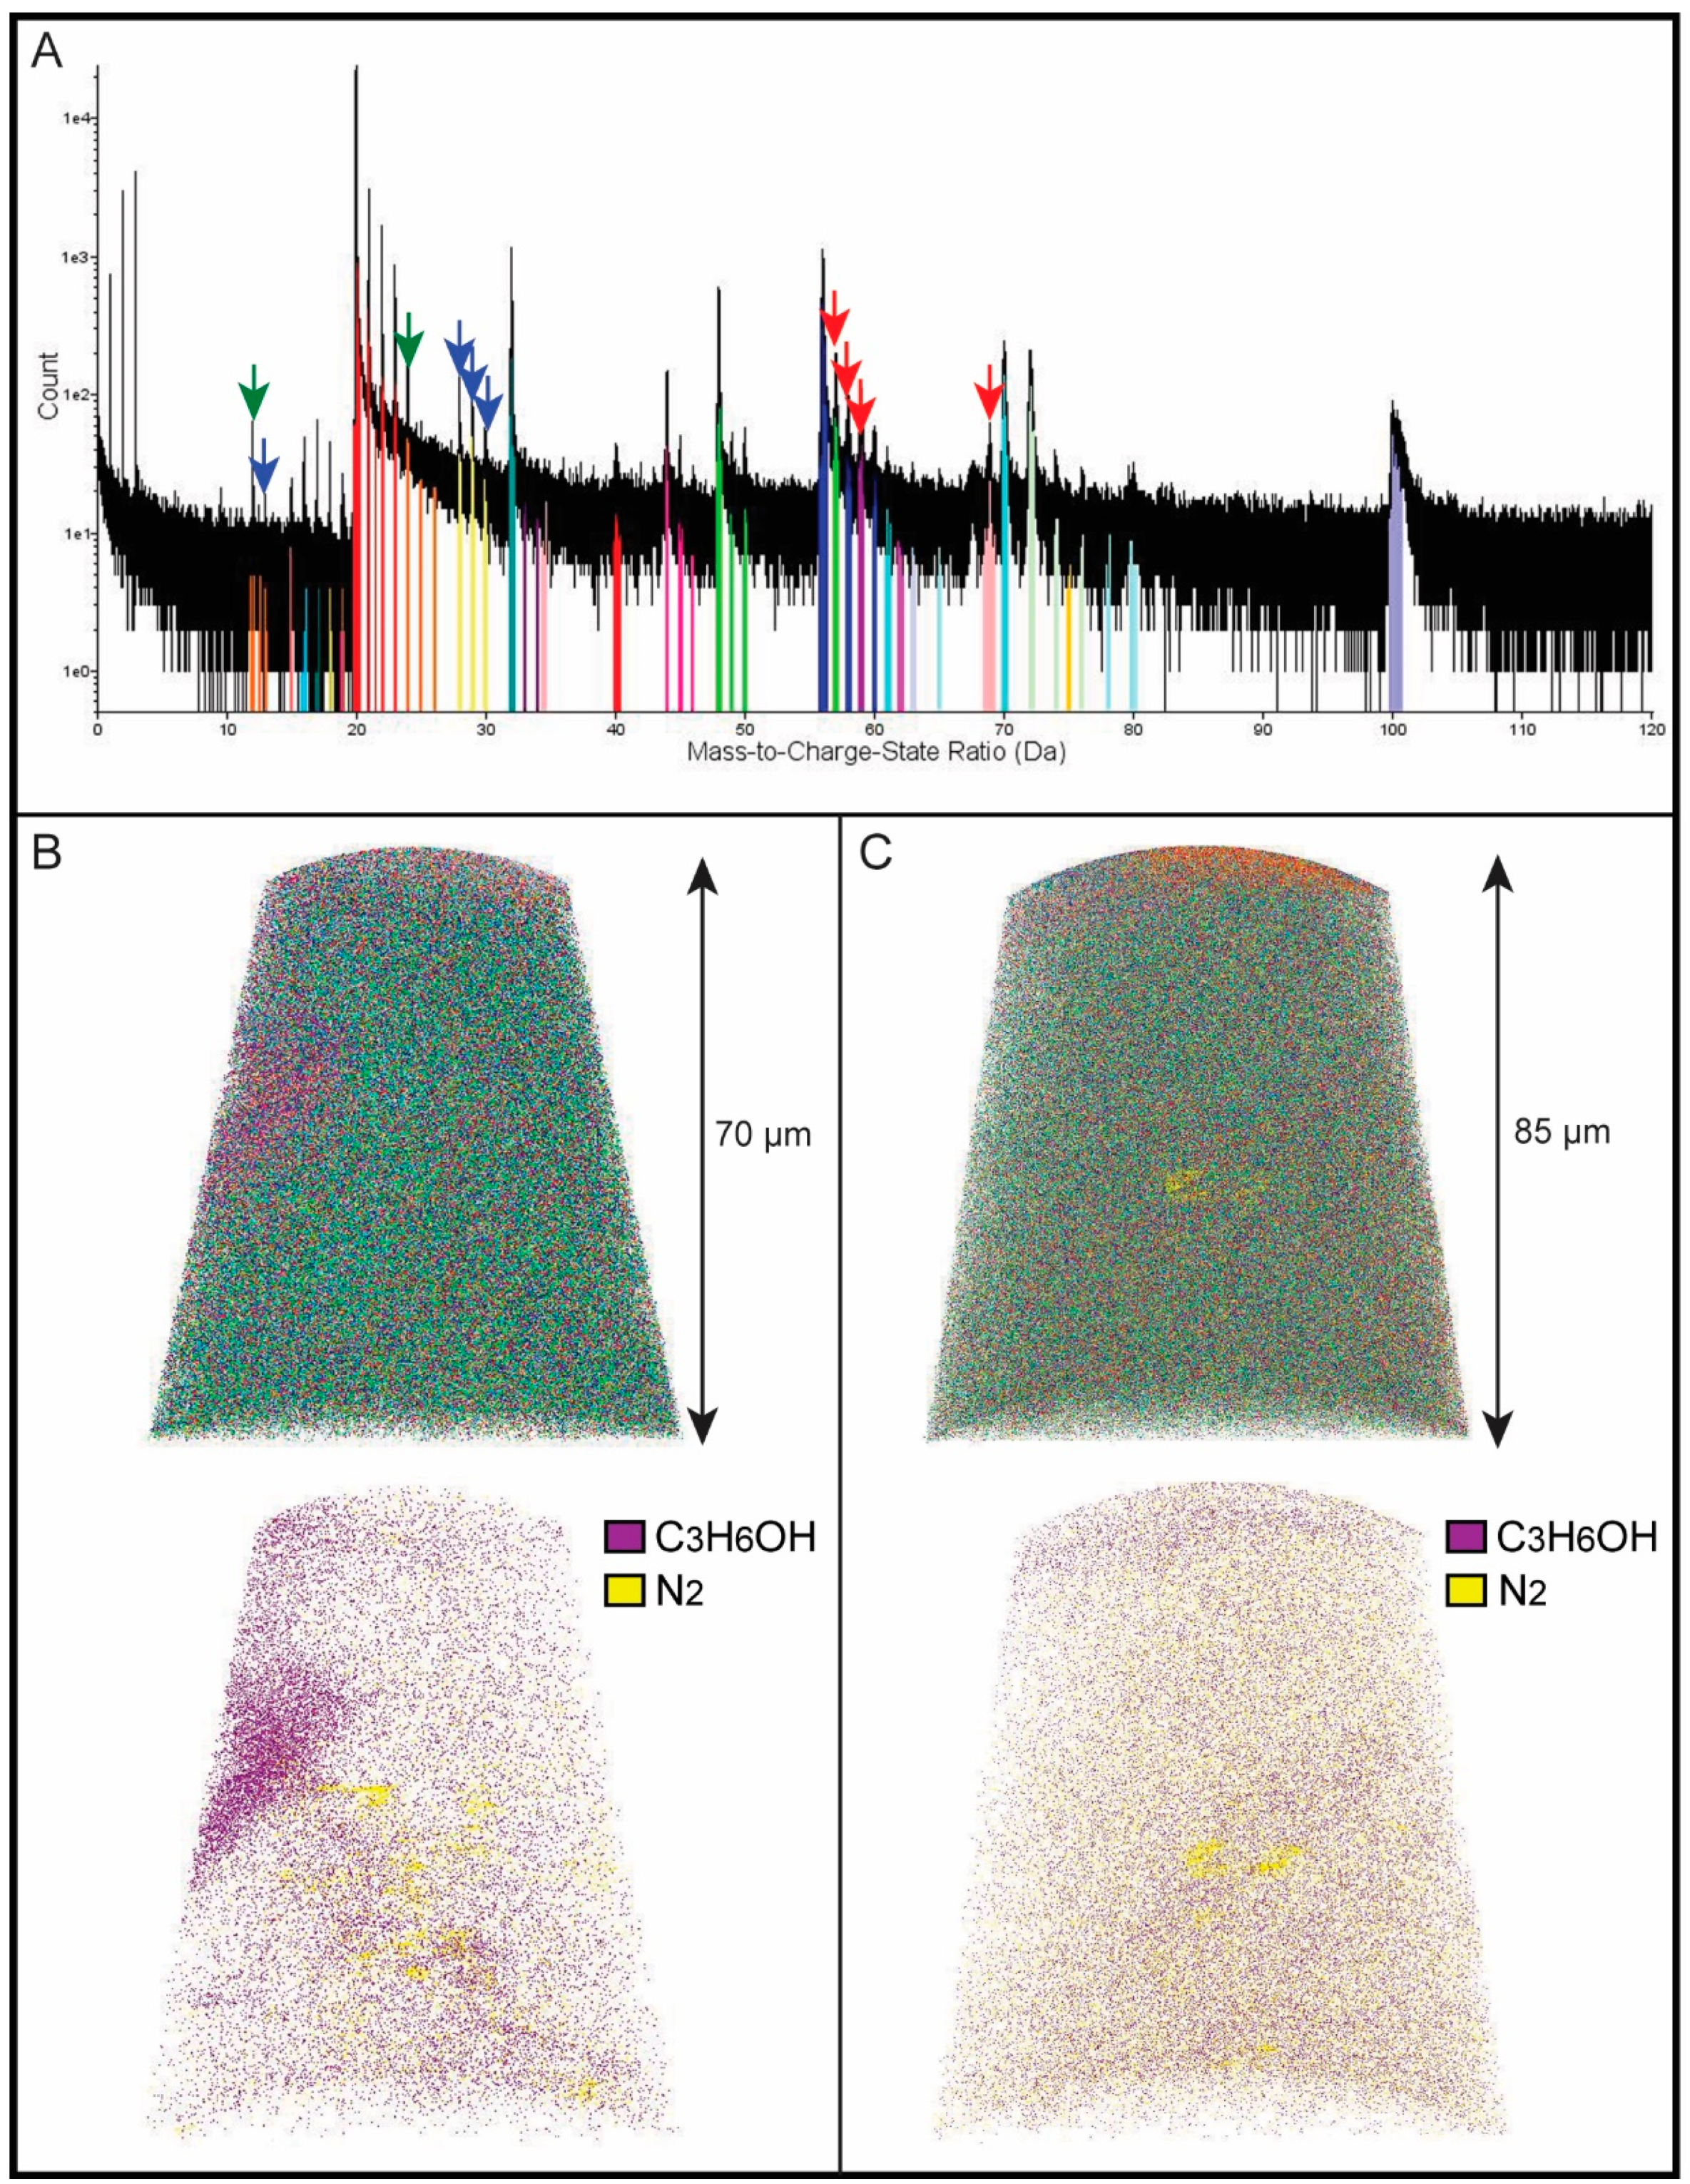
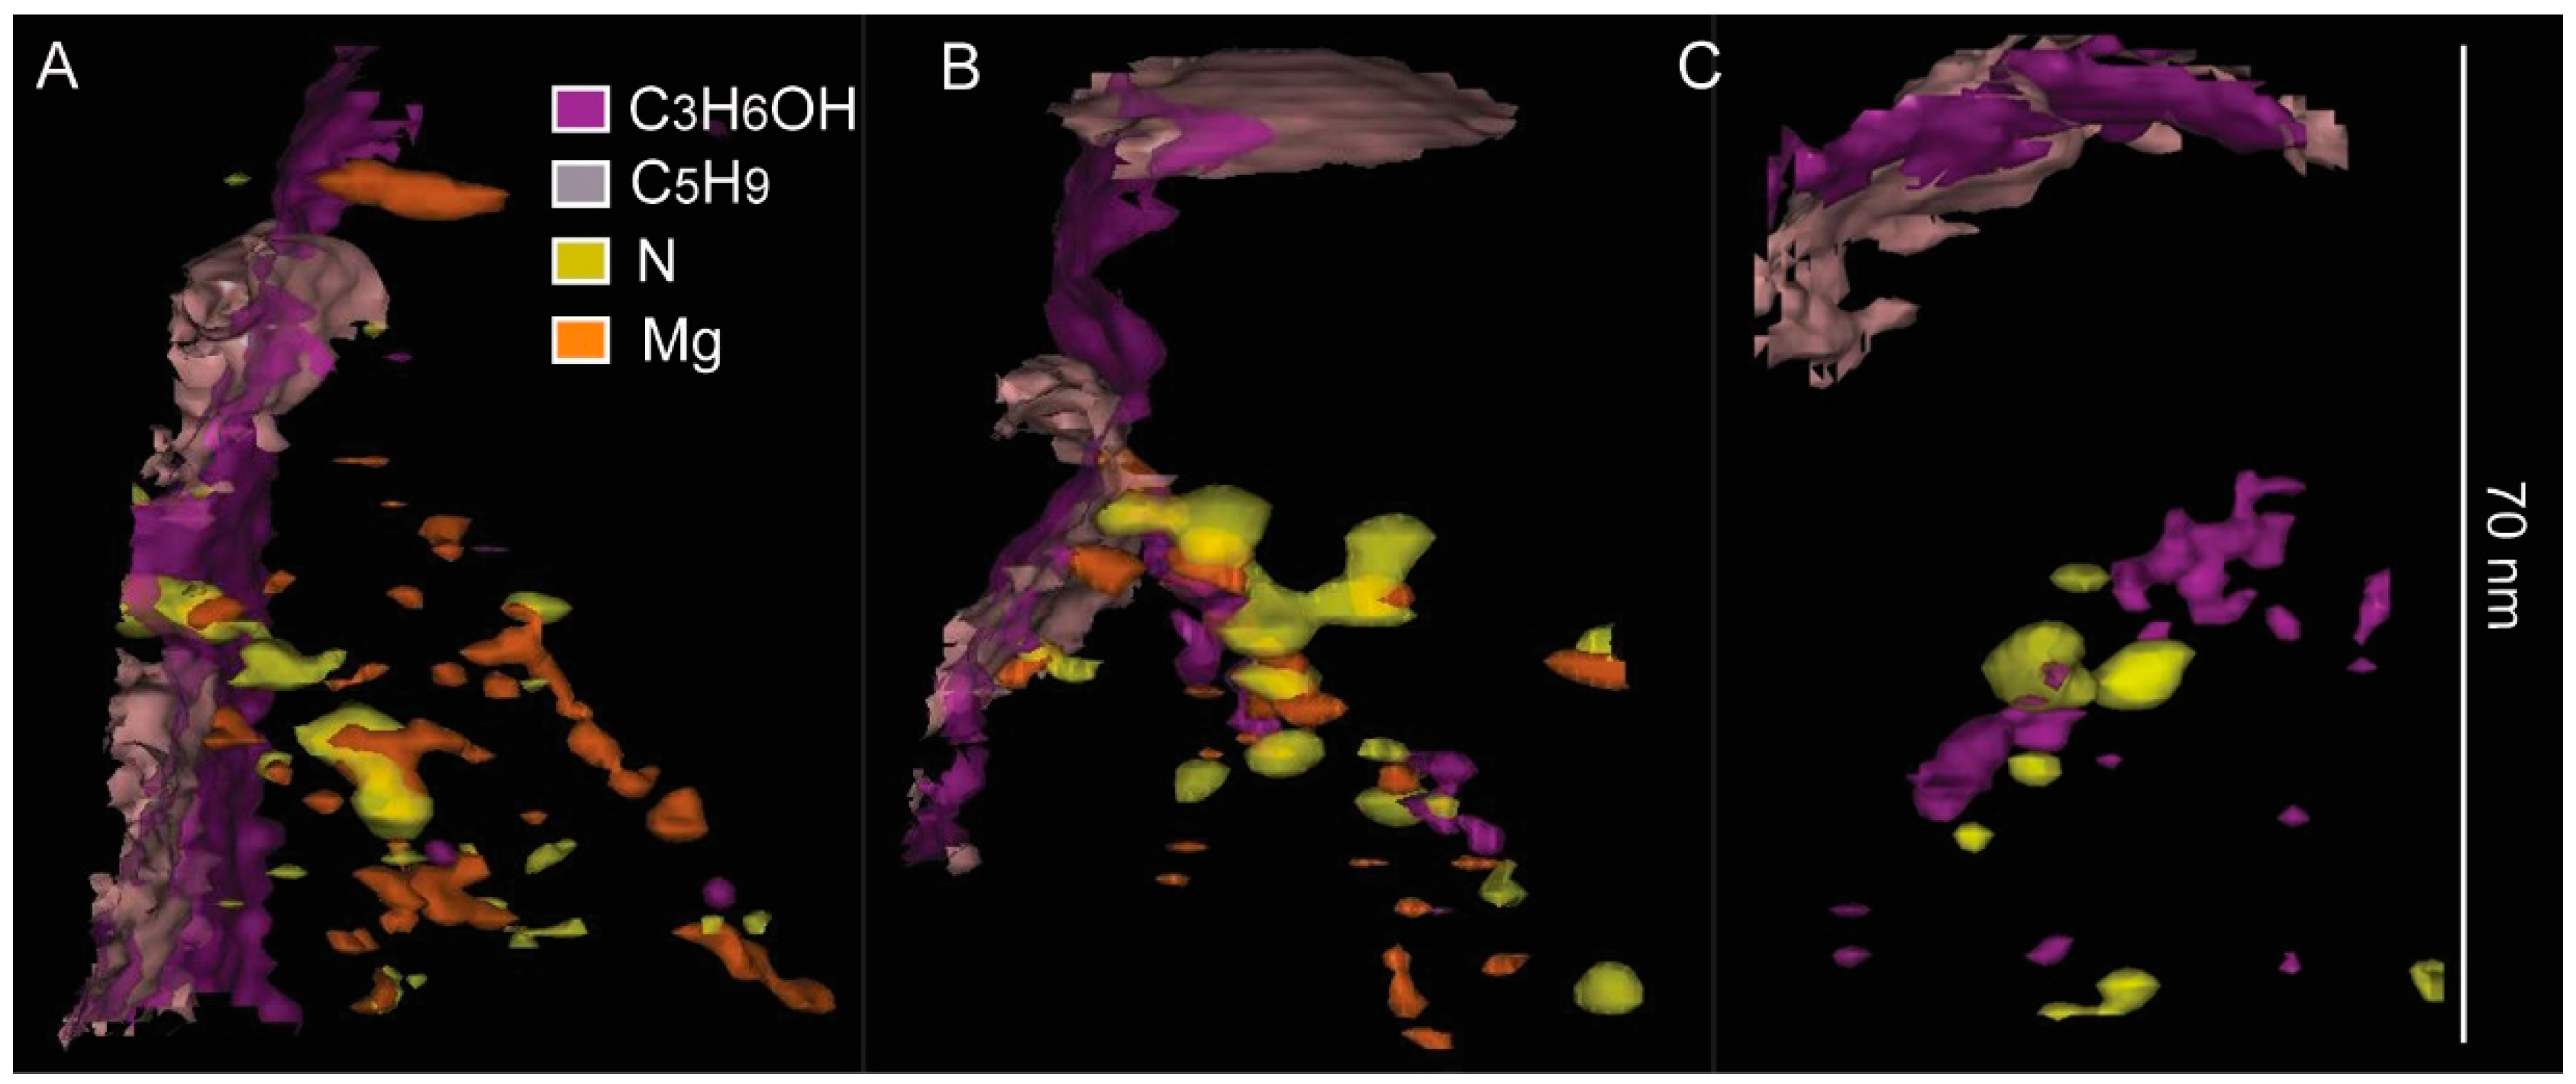
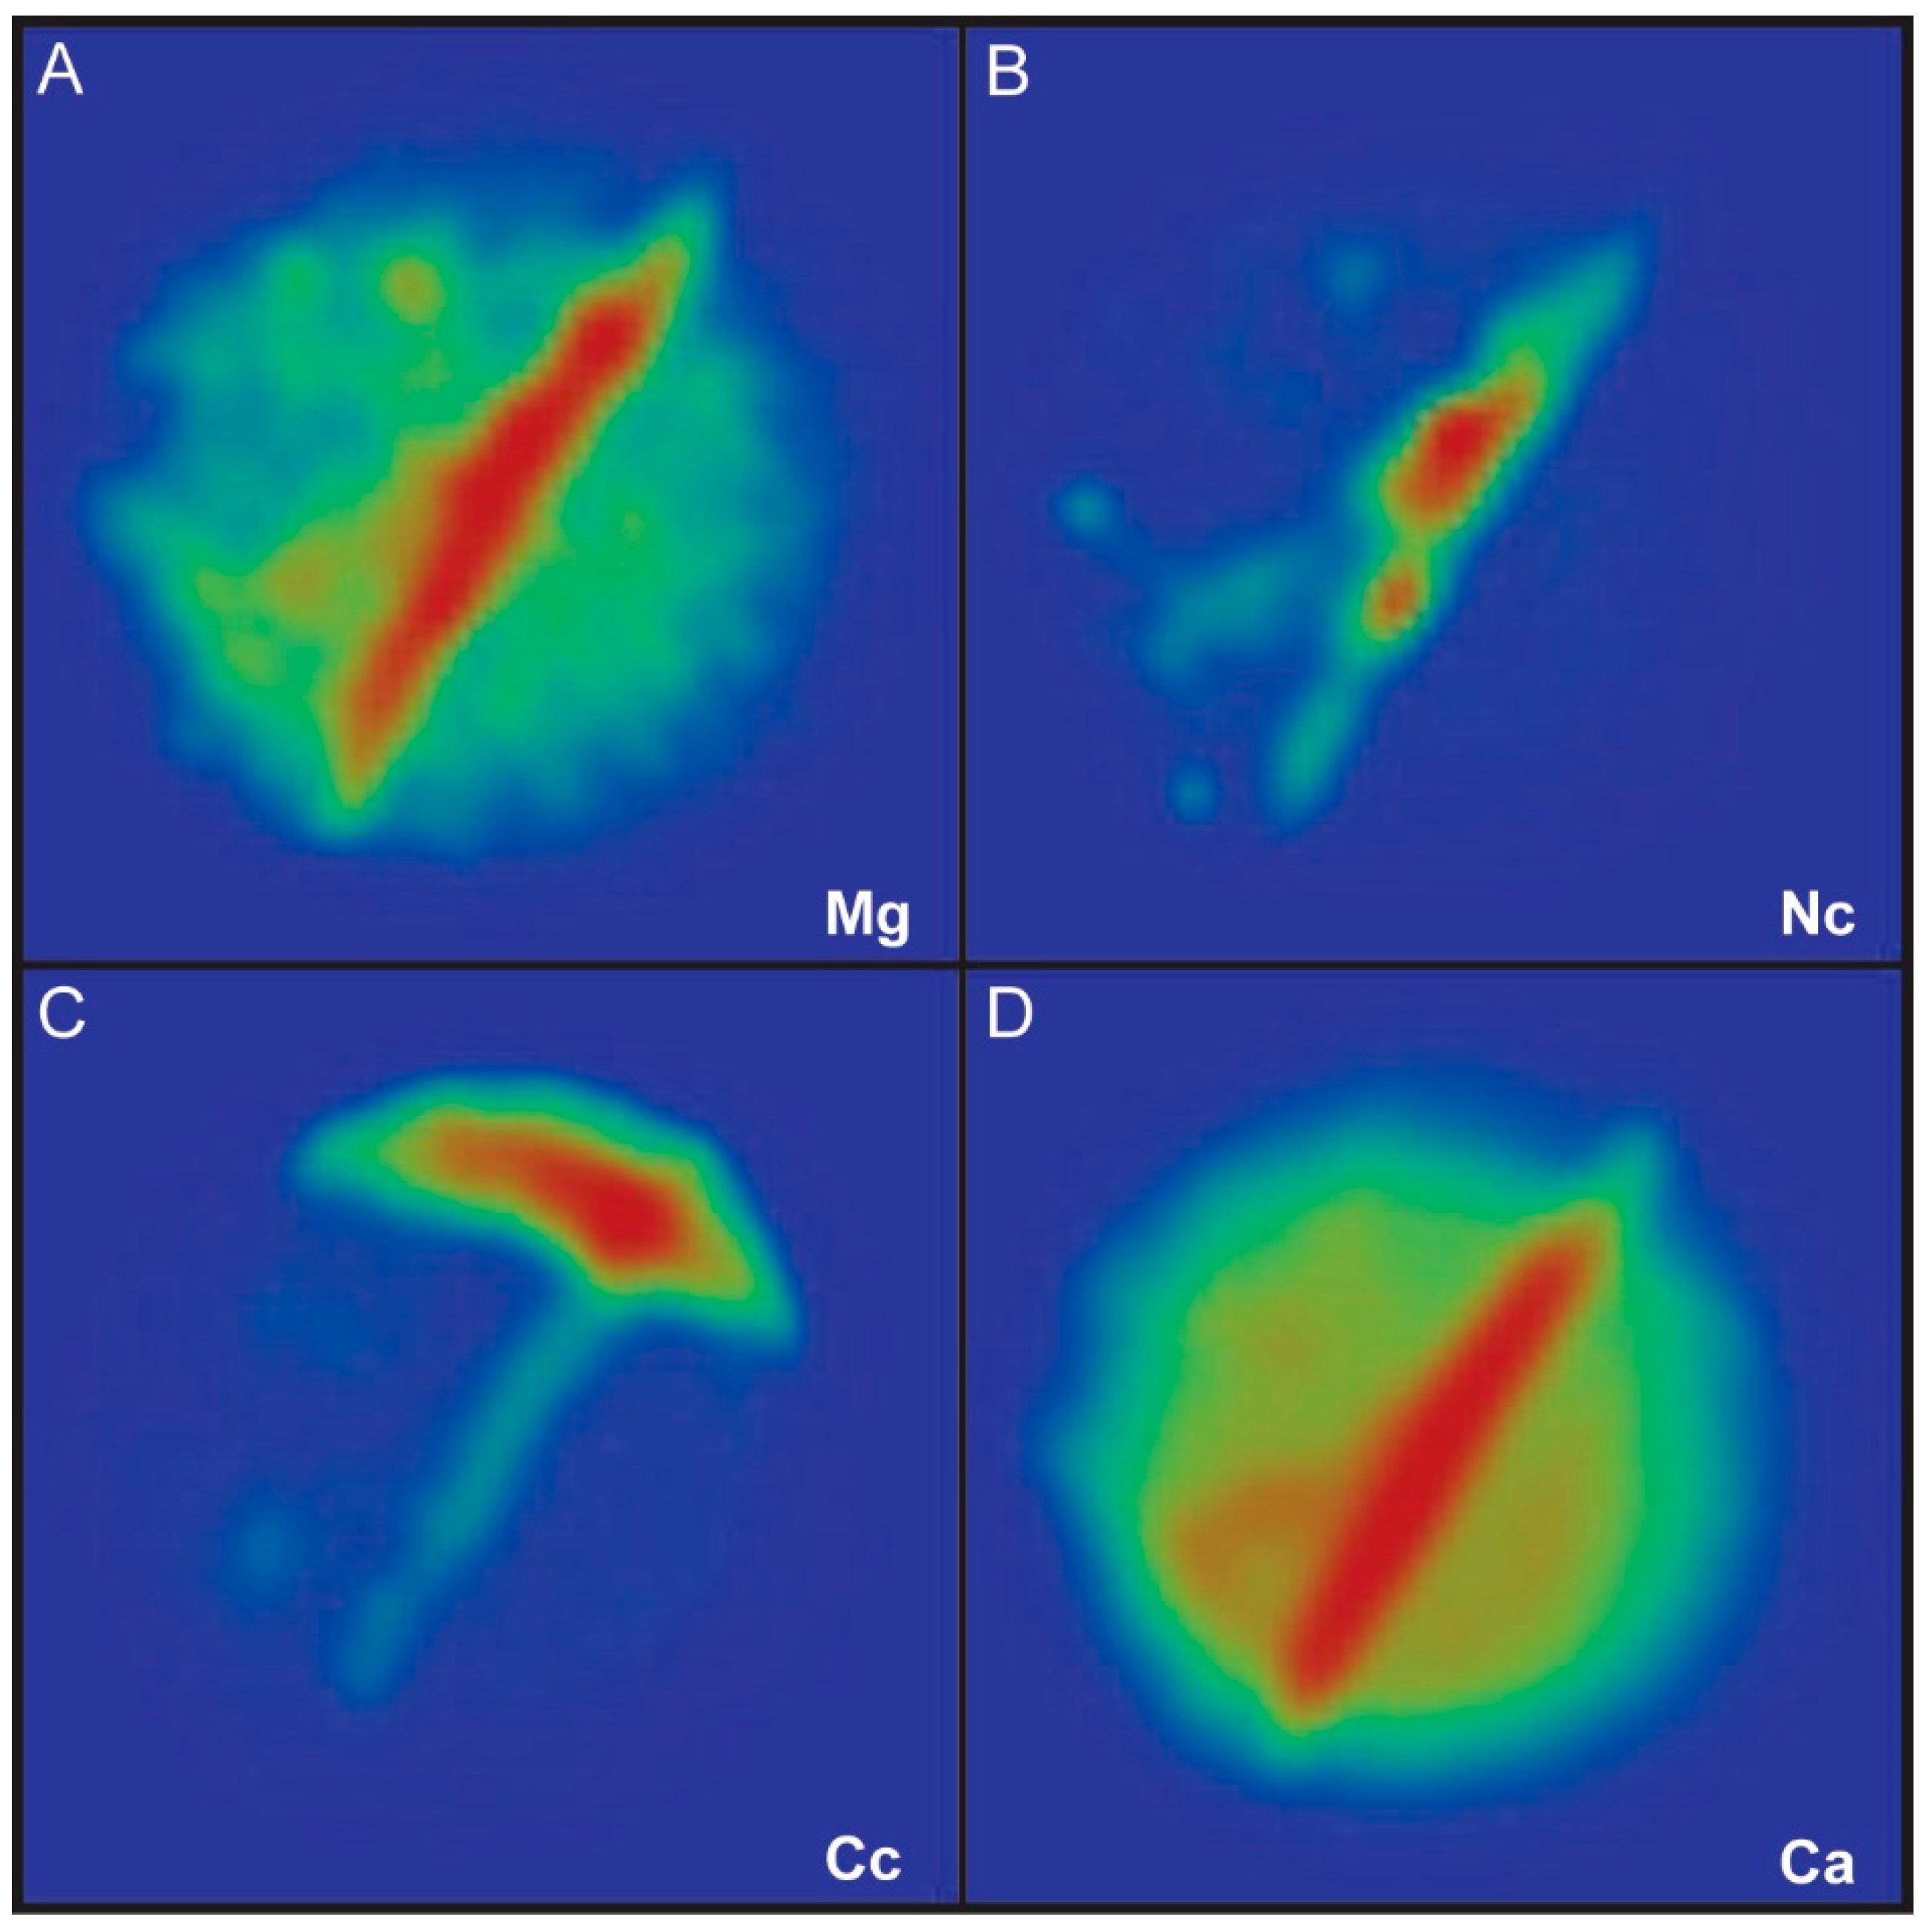
The atom probe tomography (APT) technique was used to characterize the chemical compositions of organics in growth lines. APT is the highest spatial resolution analytical technique in existence for the chemical characterization of minerals and biominerals (see Supplementary Text). Specimen tips (n = 14) were analyzed using a local electrode atom probe (LEAP 5000 XS, CAMECA Scientific Instruments, Inc., Madison, WI, USA) housed at the Alabama Analytical Research Center (AARC) of the University of Alabama. However, only 7 tips (4 from W7 and 3 from W8) produced quality data with sufficiently low background noise for further evaluation (see LEAP running conditions and details in Table 1). APT data were analyzed using the Integrated Visualization and Analysis Software (IVAS, version 3.8.2, from CAMECA Scientific Instruments, Inc., Madison, WI, USA). The 3D reconstruction parameters (field factor and image compression factor) (Table 1) were adjusted to avoid artefacts affecting the first tens of nm. Ions specific domains were depicted by 3D concentration isosurfaces and 2D density maps.

3. Results

The analyzed scallops shells were calcitic and the analyzed growth lines were located within the foliated calcite layer, which is the dominant microstructure. Each substrial line provided similar APT results. For all analyzed tips, the chemical mass spectra have similar peaks (Figure 4, Table 2 and Table 3, and Figures S2–S7). For peak identification, we compared the spectra to those previously obtained for calcite [10] and synthetic calcite with occluded organics [11]. In addition, we used knowledge of biomineralization macromolecules [1] to identify complex peaks corresponding to the fragmentation of such organic molecules. Ignoring the peaks corresponding to hydrogen, which can result from chamber contamination, we identified peaks from a mass-to-charge ratio of 12:100, except for two minor peaks at 67.5 and 80 Da (Figure 4 and Table 2). Peaks associated with macromolecules can be divided in two groups: those containing nitrogen (N compound, mainly N2+ (28 Da), N2H+ (29 Da), and N2H2+ (30 Da)) and those associated with organic compounds containing only carbon chains and carboxylic groups (C compounds; Table 2). Lastly, peaks associated with Mg+ and Mg++ are clearly distinguishable (Figure 4).
The 3D tip reconstruction resulted in z-lengths of between 65 and 85 nm, representing less than 10% of the estimated thickness of 1.5 µm of the growth line (Figure 3 and Figures S8–S12). The 3D plot of all ions shows a non-uniform distribution (Figure 4). Further refinement via plotting individual ions indicated that this distribution is related to localized organics, mainly those corresponding to peaks assigned to N2 and C3H6OH (Figure 4).

4. Discussion

4.1. Chemical Composition of Growth Lines

The recognition of different types of growth lines in bivalve shells is a topic of intense study and discussion in sclerochronology [3,12]. Etched samples for SEM imaging allow some growth lines to be distinguished, which we call substrial growth lines (or substriae; Figure 1), yet it is difficult to place them in the overall context of shell growth. However, polished surfaces prepared for APT sampling enhance the topography and the resolution of these substriae (Figure 2 and Figure S1). For this study, we targeted two coupled lines corresponding to a shell stria (see Figure S1). Striae are thought to be formed fortnightly [7], and until now their associated substriae have not been reported. Thus, we assume that we sampled the growth lines marking the termination of a complete strial increment from the prior shell stria (Figure S1).
Despite their importance in sclerochronology and biomineralization, the organic and chemical composition of bivalve growth lines is poorly understood. This is in contrast to our knowledge of intercrystalline organic components that bind individual mineral units in shells, such as calcite prisms [1,13]. It is known that growth lines contain insoluble organic matrix components of the shell and can be enriched in some cations, such as magnesium and strontium [5]. However, there is indirect information about the potential organic composition of growth lines from the application of Mutvei’s solution [3] to visualize growth lines. Mutvei’s solution contains Alcian Blue, which stains mucopolysaccharides and can bind to proteins, forming proteoglycans [12]. This suggests the presence of Gly-rich proteins with N-terminal domains in the insoluble organic matrix of mollusk shells [14,15].
The role of glycoproteins as “framework” proteins contributing to calcium binding and crystal nucleation [15] fits well with the general link between organic components and growth shell increments. Fragments of original organic compounds are registered as (post)ionized species in the APT mass spectra (Table 2). N-terminal domains related to the peaks of N2+ (28 Da), N2H+ (29 Da), and N2H2+ (30 Da) were identified. Additionally, the peaks at 57, 61, and 62Da, interpreted as CH3NO+, CH3NS+, and C4N+, respectively, can be reasonably linked to the fragmentation of proteoglycans [16]. The identification of CH3NS+ and other peaks associated with sulfur indicate the presence of sulphated polysaccharides that are linked to proteoglycans and important structural components of calcium carbonate-based biominerals [1,3,16]. Because of a peak overlap between S+ and O2+ at 32 Da, it is difficult to precisely estimate the amount of total sulfur in the tip specimens. Still, the sulfur content is significant, considering the contribution of S to 32 Da after peak decomposition, in comparison to that of Mg and N (Table 3). This reflects the importance of sulphated polysaccharides as main components of growth lines and explains the staining from Mutvei’s solution in bivalve shells [12].
In addition to the mass spectra peaks associated with the proteoglycans, there are other important organic peaks (termed here as C compounds; Table 2) that contribute to the majority of the registered carbon content (Table 3) or are associated with carbonate (at 70 Da and 100 Da). The most important peaks were at 59 Da, identified as C3H6OH+ (acid/ester), as well as the peak at 69 Da, identified as C5H9+ (alkene; Table 2). Both compounds were interpreted to be fragments of the carboxylic acid (CH2OC2H5), an organic compound with importance in biomineralization [17,18]. Carboxylic acid associated with proteins with amide groups promotes the strong binding of calcium for mineralization [17,18,19,20].
A powerful aspect of atom probe tomography is the possibility of reconstructing the 3D locations of detected ions. These reconstructions were carried out to visualize the spatial correlation of the detected organic components at the sub-nanometer scale (Figure 5). Figure 5 shows a clear connection of carboxylic acid components (C3H6OH+ and C5H9+) with the amide (i.e., N compounds) for two tips (M13 and M20) from wedge 7 (see Figure 3). This is in agreement with the possible role of amide NH+ linked to carboxylic acids in promoting calcite growth, as previously shown in vitro [17,18]. This discovery would suggest that the components of the organic matrix associated with growth lines may function as nucleation sites for calcite crystallization in these scallop shells, and potentially other bivalves. The spatial correlation of magnesium and amide components would confirm the above hypothesis (Figure 5). Indeed, carboxylate molecules with Ca binding capabilities promote the buildup of Mg-enriched amorphous calcium carbonate (ACC) [18]. The 2D ion density maps confirm the colocation of magnesium- and nitrogen-enriched compounds (Figure 6 and Figure S13). Additionally, the highest abundance zone of magnesium matches that of calcium (Figure 6 and Figure S13), which would suggest that magnesium is acting to stabilize ACC. In fact, the high abundance of Ca for an organic matrix (see Table 3) and the recognition of significant calcium carbonate peaks (at 70 Da and 100 Da; see Figure 4 and Table 1) are strong indicators of the presence of ACC within the growth lines.

4.2. APT Geochemical Data: Implications for Sclerochronology in the Context of Diagenesis

The amount of the insoluble organic matrix fraction varies in calcium carbonate biominerals between 0.01 and 5 wt% [15]. Within this matrix, the organics within growth lines would represent an even lower fraction of the shell components in bivalves. Although we could estimate with APT the concentration of C compounds, N compounds, and magnesium for the analyzed specimen volume (Table 4), it is difficult to extrapolate the total content in organic molecules within a growth line. Nevertheless, the organics, which are rich in protein and sugars and occluded within growth lines, would be the first part lost to microorganisms scavenging for nutrients during the first stages of burial and diagenesis. Therefore, we should evaluate the potential geochemical impact of the disappearance of these organics with the future analysis of fossil shells.
Prior work [5] showed that the insoluble organic matrix linked to growth lines could be enriched in magnesium and strontium, and potentially other cations, in aragonitic shells of bivalves. This could impact proxy calibrations, mainly Mg/Ca and Sr/Ca, for paleotemperature calculations, using in situ techniques such as LA-ICP-MS. Many of these techniques, either for minor and trace elements and isotopes (i.e., SIMS), are used in sclerochronology because of the high spatial resolution, but these chemical data could be altered because growth lines or nearby regions could be sampled during analysis [5]. For the Antarctic scallop, our APT data confirms that organics in growth lines are enriched in magnesium and have high calcium content. These elements that are bound to organics could impact Mg/Ca proxy calibrations. Even with these new data, it is difficult to calculate the potential loss of shell magnesium and calcium if such organics disappear with diagenetic alteration of shells. Overall, the Mg/Ca temperature proxy in fossil shells could be accurately based on calibrations using recent shells from these scallop species [7]. Further analyses are needed to assess the real impact on the Mg/Ca proxy for fossil shells.
Other elements, if organically bound, could also affect the outcome of proxy calibrations. For instance, this would be the case for sulfur isotopes [21] if the sulfur was associated with sulfated polysaccharides rather than carbonate. Using δ15N and total shell nitrogen content for paleoenvironmental reconstructions is different [4,21,22,23]. From a biomineralization perspective, it is clear that shell nitrogen is linked to the insoluble organic matrix rather than being carbonate-bound. APT indicates that a large fraction of this nitrogen is associated with the amide groups of proteoglycans in growth lines. Because biomineralization promotes lower energy processes, we can assume that these organics are enriched in the lighter isotopes. Thus, the disappearance of these organics during early diagenesis would result in underestimation of the overall nitrogen shell content and enrichment of shell 15N. As a result, this would compromise δ15N fossil shell records, even for archeological samples [21].

5. Conclusions

Our findings reinforce the extremely powerful capabilities of atom probe tomography for the in situ chemical characterization of biomineral structures. This is the case for organic components associated with growth lines in bivalve shells, which would be difficult to characterize geochemically using other techniques without a destructive approach. Our analysis of growth lines in the Antarctic Scallop, A. colbecki, reveals the presence carboxylate proteoglycans as main components and the possible roles of these organics in calcite nucleation and crystallization for shell growth. There are significant concentrations of calcium and magnesium associated with the amide groups. These concentrations could be linked to the presence of ACC. Confirmation this would help to understand the formation of growth lines in bivalve shells. Future work could aim to find the presence of ACC by using a combination of APT and X-ray photoemission electron spectromicroscopy (X-PEEM) mapping [24].
On the other hand, the removal of organics and associated elements in growth lines by diagenesis could have an impact on sclerochronology, compromising the application of proxy calibrations from recent to fossilized shells. This could be the case for Mg/Ca and δ15N applications for paleoenvironmental reconstructions, even in the interpretation of archeological records. Finally, the resolution of atom probe tomography is complementary to that of atom force microscopy (AFM), and the combination of both techniques could be powerful for detecting diagenetic processes at the nanoscale that impact geochemistry [1,2].

Supplementary Materials

The following are available online at https://www.mdpi.com/2075-163X/10/6/529/s1: Supplementary Text, Figure S1. Sample preparation. (Top) Detailed SEM image of the polished surface showing the coupled growth lines corresponding to the striae; (Bottom) Location of multiple wedges, prepared with FIB, to accurately target the growth lines for APT analysis, Figure S2. Mass spectrum for tip M13 (run 4173) from wedge 7. Note: For the visualization of peaks and peak identification see Figure 4 and Table 2 respectively in the main text, Figure S3. Mass spectrum for tip M19 (run 4174) from wedge 7. Note: For the visualization of peaks and peak identification see Figure 4 and Table 2 respectively in the main text, Figure S4. Mass spectrum for tip M21 (run 4176) from wedge 7. Note: For the visualization of peaks and peak identification see Figure 4 and Table 2 respectively in the main text, Figure S5. Mass spectrum for tip M3 (run 4149) from wedge 8. Note: For the visualization of peaks and peak identification see Figure 4 and Table 2 respectively in the main text, Figure S6. Mass spectrum for tip M4 (run 4150) from wedge 8. Note: For the visualization of peaks and peak identification see Figure 4 and Table 2 respectively in the main text, Figure S7. Mass spectrum for tip M10 (run 4148) from wedge 8. Note: For the visualization of peaks and peak identification see Figure 4 and Table 2 respectively in the main text, Figure S8. 3D reconstruction of all ions for tip M13 (run 4173) from wedge 7, Figure S9. 3D reconstruction of all ions for tip M19 (run 4174) from wedge 7, Figure S10. 3D reconstruction of all ions for tip M21 (run 4176) from wedge 7, Figure S11. 3D reconstruction of all ions for tip M4 (run 4150) from wedge 8, Figure S12. 3D reconstruction of all ions for tip M10 (run 4198) from wedge 8, Figure S13. 2D density contour plots taken from the entire specimen through the z-axis of the reconstructed volume (red equals to the highest density) showing magnesium (A), nitrogen compounds (B), carbon compounds (C), and calcium (D) for tip M13 (W7).

Author Contributions

Conceptualization, A.P.-H.; methodology, A.P.-H. and C.C.; software, C.C.; validation, A.P.-H. and C.C.; formal analysis, A.P.-H. and C.C.; investigation, A.P.-H., C.C., and S.E.W.; resources, S.E.W. and A.P.-H.; writing—original draft preparation, A.P.-H.; writing—review and editing, A.P.-H., S.E.W., and C.C.; supervision, A.P.-H. and S.E.W.; funding acquisition, S.E.W. and A.P.-H. All authors have read and agreed to the published version of the manuscript.

Funding

This research was funded by the U.S. National Science Foundation (NSF)-EAR-Antarctic Sciences (#EAR-1745064) to S.E.W. and A.P.-H.; and partially funded by the U.S. National Science Foundation (NSF)- Instrumentation and Facilities Program (#EAR-1647012) to A.P.-H. and Polar Program (#ANT-0739512 and #OPP-1745057) to S.E.W.

Acknowledgments

Authors thank the useful comments of three anonymous reviewers and the academic editor (Yannicke Dauphin), which helped to produce an improved version of the manuscript, and the editorial assistance of Ray Liu. Additionally, we gratefully acknowledge the staff at McMurdo Station and the crew from Petroleum Helicopters Inc., namely Steve Clabuesch, Cecil Shin, Shawn Harper, Henry Kaiser, Doug Coons, and Karen Sterling, for logistical support, field assistance, and diving expertise, as well as Samuel S. Bowser, whose support in the field was unwavering and inspirational.

Conflicts of Interest

The authors declare no conflict of interest. Additionally, the funders had no role in the design of the study; in the collection, analyses, or interpretation of data; in the writing of the manuscript, or in the decision to publish the results.

References

  1. Cuif, J.-P.; Dauphin, Y.; Sorauf, J.E. Biominerals and Fossils through Time, 1st ed.; Cambridge University Press: Cambridge, UK, 2010; p. 503. [Google Scholar]
  2. Pérez-Huerta, A.; Coronado, I.; Hegna, T. Understanding biomineralization in the fossil record. Earth-Sci. Rev. 2018, 179, 95–122. [Google Scholar]
  3. Schöne, B.R.; Surge, D. Bivalve sclerochronology and geochemistry. Part N, Bivalvia, revised, Chapter 14. In Treatise Online; Seldon, P., Hardesty, J., Carter, J.G., Eds.; University of Kansas Press: Lawrence, KS, USA, 2012; Volume 46, pp. 1–24. [Google Scholar]
  4. Steinhardt, J.; Butler, P.G.; Carroll, M.L.; Hartley, J. The application of long-lived bivalve sclerochronology in environmental baseline monitoring. Front. Mar. Sci. 2016, 3, 176. [Google Scholar] [CrossRef] [Green Version]
  5. Schöne, B.R.; Zhang, Z.; Jacob, D.; Gillikin, D.P.; Tutken, T.; Garbe-Schönberg, D.; McConnaughey, T.; Soldati, A. Effect of organic matrices on the determination of the trace element chemistry (Mg, Sr, Mg/Ca, Sr/Ca) of aragonitic bivalve shells (Artica islandica) – Comparison of ICP-OES and LA-ICP-MS data. Geochem. J. 2010, 44, 23–37. [Google Scholar]
  6. Hancock, L.G.; Walker, S.E.; Pérez-Huerta, A.; Bowser, S.S. Population dynamics and parasite load of a foraminifer and its Antarctic scallop host with their carbonate biomass contributions. PLoS ONE 2015, 10, e0132534. [Google Scholar] [CrossRef] [PubMed]
  7. Lartaud, F.; Chauvaud, L.; Richard, J.; Toulot, A.; Bollinger, C.; Testud, L.; Paulet, Y.-M. Experimental growth pattern calibration of Antarctic scallop shells (Adamussium colbecki, Smith 1902) to provide a biogenic archive of high-resolution records of environmental and climate changes. J. Exper. Mar. Biol. Ecol. 2010, 393, 158–167. [Google Scholar] [CrossRef]
  8. Trevisiol, A.; Bergamasco, A.; Montagna, P.; Sprovieri, M.; Taviani, M. Antarctic seawater temperature evaluation based on stable isotope measurement on Adamussium colbecki shells: Kinetic vs. isotopic equilibrium. J. Mar. Syst. 2013, 126, 43–55. [Google Scholar] [CrossRef]
  9. Pérez-Huerta, A.; Laiginhas, F. Preliminary data on the nanoscale characterization of the inter-crystalline organic matrix of a calcium carbonate biomineral. Minerals 2018, 8, 223. [Google Scholar] [CrossRef] [Green Version]
  10. Pérez-Huerta, A.; Laiginhas, F.; Reinhard, D.A.; Prosa, T.J.; Martens, R.L. Atom probe tomography (APT) of carbonate minerals. Micron 2016, 80, 83–89. [Google Scholar] [CrossRef] [PubMed]
  11. Pérez-Huerta, A.; Suzuki, M.; Cappelli, C.; Laiginhas, F.; Kintsu, H. Atom probe tomography (APT) characterization of organics occluded in single calcite crystals: Implications for biomineralization studies. J. Carbon Res. 2019, 5, 50. [Google Scholar] [CrossRef] [Green Version]
  12. Karney, G.B.; Butler, P.G.; Scourse, J.D.; Richardson, C.A.; Lau, K.H.; Czernuszka, J.T.; Grovernor, C.R.M. Identification of growth increments in the shell of the bivalve mollusk Artica islandica using backscattered electron imaging. J. Microsc. 2011, 241, 29–36. [Google Scholar] [CrossRef] [PubMed] [Green Version]
  13. Dauphin, Y.; Cuif, J.-P.; Doucet, J.; Salomé, M.; Susini, J.; Williams, C.T. In situ mapping of growth lines in the calcitic prismatic layers of mollusc shells using X-ray absorption near-edge structure (XANES) spectroscopy at the sulphur K-edge. Mar. Biol. 2003, 142, 299–304. [Google Scholar] [CrossRef]
  14. Marin, F.; Luquet, G. Molluscan shell proteins. C. R. Palevol 2004, 3, 469–492. [Google Scholar] [CrossRef]
  15. Marin, F.; Luquet, G.; Marie, B.; Medakovic, D. Molluscan shell proteins: Primary structure, origin, and evolution. Curr. Top. Develop. Biol. 2008, 80, 209–276. [Google Scholar]
  16. Arias, J.L.; Fernández, M.S. Polysaccharides and proteoglycans in calcium carbonate-based biomineralization. Chem. Rev. 2008, 108, 4475–4482. [Google Scholar] [CrossRef] [PubMed]
  17. Ueyama, N.; Takahashi, K.; Onoda, A.; Okamura, T.; Yamamoto, H. Inorganic-organic calcium carbonate composite of synthetic polymer ligands with an intramolecular NH…O hydrogen bond. Top. Curr. Chem. 2007, 271, 155–193. [Google Scholar]
  18. Wang, D.; Wallace, A.F.; DeYoreo, J.J.; Dove, P.M. Carboxylated molecules regulate Mg content of ACC during calcification. Proc. Natl. Acad. Sci. USA 2009, 106, 21511–21516. [Google Scholar] [CrossRef] [PubMed] [Green Version]
  19. Marxen, J.C.; Becker, W. Calcium binding constituents of the organic shell matrix from the freshwater snail Biomphalaria glabrata. Comp. Biochem. Physiol. B Biochem. Mol. Biol. 2000, 127, 235–242. [Google Scholar] [CrossRef]
  20. Tao, J.; Zhou, D.; Zhang, Z.; Xu, X.; Tang, R. Magnseium-aspartate-based crystallization switch inspired from shell molt of crustacean. Proc. Natl. Acad. Sci. USA 2009, 106, 22096–22101. [Google Scholar] [CrossRef] [PubMed] [Green Version]
  21. Boullion, S.; Connolly, R.M.; Gillikin, D.P. Use of stable isotopes to understand food webs and ecosystems functioning in estuaries. In Treatise on Estuarine and Coastal Science; Wolanski, E., McLusky, D.S., Eds.; Waltham Academic Press: Waltham, MA, USA, 2011; Volume 7, pp. 143–173. [Google Scholar]
  22. Black, H.D.; Andrus, C.T.F.; Lambert, J.W.; Rick, T.C.; Gillikin, D.P. δ15N values in Crassostrea virginica shells provides early direct evidence for nitrogen loading to Chesapeake Bay. Sci. Rep. 2017, 7, 44241. [Google Scholar] [CrossRef] [PubMed] [Green Version]
  23. Gillikin, D.P.; Lorrain, A.; Jolivet, A.; Kelemen, Z.; Chavaud, L.; Boullion, S. High-resolution nitrogen stable isotope sclerochronology of bivalve shells carbonate-bound organics. Geochim. Cosmochim. Acta 2017, 1, 55–66. [Google Scholar] [CrossRef] [Green Version]
  24. Albéric, M.; Stifler, C.A.; Zou, Z.; Sun, C.-Y.; Killian, C.E.; Valencia, S.; Mawass, M.-A.; Bertinetti, L.; Gilbert, P.; Politi, Y. Growth and regrowth of adult sea urchin spines involve hydrated and anhydrous amorphous calcium carbonate precursors. J. Struct. Biol. X 2019, 1, 100004. [Google Scholar]
Figure 1. Antarctic scallop (Adamussium colbecki) shell. (A) Top view of a right valve used in this study. Note: the red line marks the section taken along the shell length from the umbo region (U) to the posterior region (P). (B) Image of the shell interior of the same valve. (C) Shell regions polished and prepared for SEM (Scanning Electron Microscopy) and APT analyses. Note: The red rectangle marks the location of the shell analyzed. (D) SEM image of the shell surface showing the locations of surficial striae (S) and substrial growth lines (white arrows). (E) Detailed view of some substrial growth lines (dashed lines) from the marked area (red square in (C)).
Minerals 10 00529 g001
Figure 2. Targeted areas for APT analyses. (A) Shell region image showing the location of the platinum (Pt) deposits for focused ion beam (FIB) milling of two wedges (wedge 7 (W7) and wedge 8 (W8)) on the coupled growth lines corresponding to one stria. (B) Detailed image of W7 on top of the substrial line (red dashed lines). (C) Detailed image of W8 on top of the substrial line (red dashed lines).
Minerals 10 00529 g002
Figure 3. Details of FIB work for APT sample preparation. (A) Schematic of the planar configuration of a substrial line indicating the individual locations of two tip-shaped specimens. Note1: The polished section is the top surface in the rectangle. (B) Image of wedge 7 on the substrial lines (dashed red lines), indicating the location of M13 and M20 tips in relation to the wedge and schematic in (A). (C) Example of a wedge fragment ready for sharpening. (D) Example of a tip specimen before low-Kv cleaning, ready for the local electrode atom probe (LEAP) analysis.
Minerals 10 00529 g003
Figure 4. Example of APT results. (A) Example of a typical mass spectrum for all of the tips analyzed from wedges 7 and 8, indicating the location of the peaks for magnesium (green arrows), N compounds (blue arrows), and C compounds (red arrows). Note: For complete identification of peaks, see Table 2. (B) Example of a 3D tip reconstruction of tip M20 (from W7) for all ions (top) and ions corresponding to the peaks identified as C3H6OH and N2 (bottom). (C) Example of a 3D tip reconstruction of tip M3 (from W8) for all ions (top) and ions corresponding to the peaks identified as C3H6OH and N2 (bottom).
Minerals 10 00529 g004
Figure 5. The 3D isosurface (surfaces of equal % at 1σ level) reconstructions of selected tip specimens. (A) Isosurface reconstructions for the distribution of C3H6OH (at 11.12%), C5H9 (at 25.93%), N compounds (at 2.44%), and Mg (0.47%) in tip M13 (W7). (B) Isosurface reconstructions for the distribution of C3H6OH (at 11.12%), C5H9. (at 16.35%), N compounds (at 2.44%), and Mg (0.47%) in tip M20 (W7). (C) Isosurface reconstructions for the distribution of C3H6OH (at 11.47%), C5H9 (at 13.05%), and N compounds (at 5.62%) in tip M3 (W8).
Minerals 10 00529 g005
Figure 6. The 2D density contour plots taken from the entire specimen through the z-axis of the reconstructed volume (red equals the highest density) showing magnesium (A), nitrogen compounds (B), carbon compounds (C), and calcium (D) for tip M20 (W7). Nitrogen compounds follow the pattern of the high Mg and Ca density areas and cross a zone of high-density carbon compounds.
Minerals 10 00529 g006
Table 1. Data acquisition settings for LEAP analyses and run summaries.
Specimen/Data SetScallop-W7Scallop-W8
Reference4173-M134174-M194175-M204176-M214149-M34150-M44198-M10
Instrument ModelLEAP 5000 XSLEAP 5000 XSLEAP 5000 XSLEAP 5000 XSLEAP 5000 XSLEAP 5000 XSLEAP 5000 XS
Instrument settings
Laser wavelength355355355355355355355
Laser pulse energy30303030303030
Pulse frequency (kHz)100100100100100100100
Evaporation controlDetection rateDetection rateDetection rateDetection rateDetection rateDetection rateDetection rate
Target detection rate (ions/pulse)%0.20.20.20.20.20.20.2
Nominal fligth path (mm)100100100100100100100
Set point temperature (K)30303030303030
Chamber pressure (torr)3.00E-114.00E-114.60E-115.60E-114.90E-114.10E-115.30E-11
Data summary
Analysis softwareIVAS 3.8.4IVAS 3.8.5IVAS 3.8.6IVAS 3.8.7IVAS 3.8.8IVAS 3.8.9IVAS 3.8.10
Total ions:12,070,4755,258,1769,251,6807,502,22416,213,82412,223,7344,878,030
Sigle (%)75.574.274.575.577.874.273.4
Multiple (%)23.424.324.523.221.224.225.5
Partial (%)1.11.411.311.11.1
Reconstructed ions:7,042,7753,170,2545,374,7114,496,25613,933,4589,839,0703,699,975
Ranged (%)50.94851.647353941.7
Unranged (%)49.15248.453656158.3
Mass calib. (peaks/interp.)Lin. MethodLin. MethodLin. MethodLin. MethodLin. MethodLin. MethodLin. Method
(M/∆M) for 40Ca++ 261149388282435208294
(M/∆M10)c1227717211219690109
Time indipendent background (ppm/ns)11514311097223742
Recontruction
Final speciment statefracturedfracturedfracturedfracturedunsurefracturedfractured
Pre-/post-analysis imagingSEM/n.a.SEM/n.a.SEM/n.a.SEM/n.a.SEM/n.a.SEM/n.a.SEM/n.a.
Radius evolution modelShankShankShankShankShankShankShank
Field factor (k)3.53.33.33.33.33.33.3
Image compression factor1.31.31.31.31.31.31.3
Assumed E-field (V/nm)18181818181818
Detector efficiency (%)80808080808080
Avg. atomic volume (nm3)0.04350.04350.04350.04350.04350.04350.0435
Vinitial; Vfinal (V)2500; 58001800; 35002400; 54002000; 47002200; 53003200; 39003400; 4900
Table 2. Identification of peaks for the APT mass spectra.
Peaks (Da) Peaks (Da)
Mg++12,12.5,13CO2+44,45,46
Mg+24,25,26Ca2O++48,49,50
NH+15CaO+56,58,60
O+16CH3NO+57
OH+17C3H6OH+59
H2O+18CH3NS+61
Fe+++18.6C4N+62
H3O+19HNO3+63
Ca++20,21,21.5,23unknown67.5
Ca+40,42,43C5H969
N2+28Ca2CO3++70
N2H+29CaO2+72,74,75,76
N2H2+30unknown80
O2+, S+32CaCO3+100
SH+, S+33,34
Table 3. Comparison of decomposed element composition for tips M20 (W7) and M3 (W8).
ReferenceW7-4175-M20W8-4149-M3
IonCountsAtomic %Atomic Error %CountsAtomic %Atomic Error %
S14,7590.360.08214,5310.250.154
H658,32415.900.002711,14812.080.010
Ca2,244,79354.210.0303,400,31557.780.030
C160,1303.870.008149,4732.540.005
N39,5040.950.00248,1730.820.001
O1,012,16324.440.0021,547,70626.300.002
Fe2980.010.002---
Mg10,8210.260.00813,2960.230.018
Table 4. Estimation of the concentrations of magnesium, nitrogen (N) compounds, and carbon (C) compounds.
Scallop W7Scallop W8
Reference4173-M134174-M194175-M204176-M214149-M34150-M44198-M10
Volume (nm3)116,37656,36886,30070,661
Mg0.37%0.31%0.44%0.17%0.36%0.51%0.25%
N compounds0.68%0.58%1.47%0.59%1.17%0.85%0.97%
C compounds0.72%0.33%0.74%0.46%0.14%0.27%6.23%

