Article

Probing the Dehydroxylation of Kaolinite and Halloysite by In Situ High Temperature X-ray Diffraction

by
Imane Daou
1,
Gisèle Laure Lecomte-Nana
1,*,
Nicolas Tessier-Doyen
1,
Claire Peyratout
1,
Maurice François Gonon
2 and
René Guinebretiere
1
1
IRCER (Institut de Recherche sur les Céramiques), Université de Limoges, 12 rue Atlantis, 87068 Limoges, France
2
Service de Science des Matériaux, Faculté Polytechnique, Université de Mons, Rue de l’Epargne 56, 7000 Mons, Belgium
*
Author to whom correspondence should be addressed.
Minerals 2020, 10(5), 480; https://doi.org/10.3390/min10050480
Submission received: 31 March 2020 / Revised: 14 May 2020 / Accepted: 18 May 2020 / Published: 25 May 2020

Abstract

:
Textured kaolinite and halloysite-based materials were shaped by tape casting in order to promote the alignment of clay particles along the tape casting direction and to investigate the structure evolution of these phyllosilicates during the dehydroxylation process. The crystallinity indexes HI and R2 of the starting kaolins (KRG and KCS) were determined and appeared close to values found for the well-ordered reference kaolin KGa-1b. The halloysite clay exhibited trimodal grain size distribution and tended to be less textured than KRG and KCS according to the (002) pole figures performed on green tapes. The constant heating rate derived kinetic parameters matched the expected range. We followed the dehydroxylation of kaolinite and halloysite through in situ high-temperature X-ray diffraction measurements at the ESRF synchrotron radiation source on the D2AM beamline. The dehydroxylation of these kaolinite and halloysite occurred between 425 °C and 675 °C for KRG and KCS and from 500 °C to 650 °C for halloysite. In addition, the evolution of the basal distance of kaolinite regarding the heat treatment temperature confirmed that the dehydroxylation process occurred in three steps: delamination, dehydroxylation, and formation of metakaolinite. The calculated coefficient of thermal expansion (CTE) along the c axe values were close to 17 × 10−6 °C−1 for kaolinite (KCS and KRG) and 14 × 10−6 °C−1 for halloysite.

Graphical Abstract

1. Introduction

Kaolins and halloysite are raw materials with a high amount of added value in comparison to other clay materials, mainly composed with kaolinite and halloysite, respectively, as major components and very few secondary phases (quartz, cristobalite, titanium dioxides, smectites and/or micaceous phases, even very small iron oxides content). The major application of these raw clays ranges from domestic uses to the biomedical and energy fields. Most recent developments arise through the mastering of the related formulation and shaping/sintering processes [1,2,3,4,5,6], in line with some pharmaceutical, catalytic, and ceramic issues.
Kaolinite (Al2Si2O5(OH)4) is a TO (O represents the octahedral layer and T represents the tetrahedral layer) dioctahedric phyllosilicate characterized by platelet-like particles. Halloysite is also a TO dioctahedric clay mineral, which has the same general chemical composition as kaolinite and can exhibit a higher water content. Depending on the amount of water, the two types of halloysite are usually considered with the general formula Al2Si2O5(OH)4 nH2O: halloysite-(7 Å) and halloysite-(10 Å), regarding the (001) d-spacing, where n = 0 and n = 2, respectively [7,8]. The particle morphology of halloysite were described as a tubular or cylindrical shape [9]. Conversely, the kaolinite particles were reported as platelet-like grains. The understanding of the behavior of the kaolinite and halloysite transformations during a heat treatment enables the control of the evolution of the microstructure during the processing of the related materials regarding their final characteristics and applications [10,11,12,13].
Indeed, the use of these clay minerals for the processing of silicate ceramics may involve a dehydroxylation step prior to the structural reorganization that include the crystallization of mullite, cristobalite or other high temperature phases. Many papers were interested by the process taking place during heat treatment of kaolinite [14,15,16,17,18,19,20,21]. An important part of this study concerned the mechanism of the dehydroxylation, which can be noted for kaolinite and halloysite as follows:
Al 2 Si 2 O 5 ( OH ) 4 400 ° C 700 ° C Al 2 Si 2 O 7 + 2 H 2 O
The basic knowledge of the dehydroxylation of kaolinite indicated that for poorly crystallized (KGa-2) and highly crystallized (KGa-1b) reference kaolins, the presence of defects enhanced the dehydroxylation. Brindley and Nakahira [22] had performed ex situ studies of the dehydroxylation of a kaolinite and concluded that, above 550 °C, only metakaolinite remained. Some papers investigated the dehydroxylation of kaolinite under mechanical stresses for long period of time [23,24,25]. Frost et al. [23] showed that the dehydroxylation started after 2 h under concentrically disk milling of kaolin at 25 °C. Indeed, the process was achieved after 10 h under these conditions. Frost et al. [26] proposed that the dehydroxylation of kaolinite occurred through a homogeneous process involving proton transfer according to the following reaction:
OH   H + + O 2   and   H + + OH H 2 O
Ptáček et al. [14,18,20] were focused on the study of the kinetics and mechanisms of the formation of metakaolinite. These authors described three main stages governing the dehydroxylation of kaolinite regardless of its crystallinity degree—(i) the dehydroxylation (loss of structural water); (ii) the delamination of kaolinite (the destruction of kaolinite sheet structure); and (iii) the formation of metakaolinite by a re-organization process of the local environment of the silicon and aluminum cations and variations of the Si–O and Al–O bond lengths [27]. The occurrence of each of these steps depended on the heating conditions (heating rate, maximum temperature and dwelling time). Only a few papers were interested by the study of the transformation of halloysite during heat treatment [28,29]. Prodanovic et al. [29] concluded that the kinetics of halloysite dehydroxylation was similar to the dehydroxylation process of kaolinite.
According to the existing literature on the thermal transformations of kaolinite and halloysite, the present paper aimed at investigating the in situ dehydroxylation of kaolinites and halloysite. Emphasis was led on the influence of the shape index (related to the morphology) of the clay particles on the dehydroxylation process within samples shaped by tape casting. Indeed, the tape casting process favored the alignment of clay particles along the casting surface and allowed the investigation of the (00l) crystallographic planes for kaolinite and halloysite. The main texture and the coefficient of thermal expansion were characterized and discussed accordingly.

2. Materials and Methods

2.1. Materials

The raw phyllosilicate materials used in this study were two kaolins and a halloysite (NZCC halloysite), labeled KRG, KCS, and H, respectively. Imerys (Limoges, France) supplied these raw materials. The kaolins KRG and KCS were constituted with kaolinite clay mineral (≈98 to 99 mass %) and very low amount of quartz as secondary phase (<1 mass %), while the halloysite mainly contained halloysite clay mineral (≈94 mass %) together with a small amount of secondary minerals (quartz and cristobalite, <5 mass %). The main characteristics of these raw materials, resulting from the technical data sheet, are reported in the Table 1.
The formulation of appropriate slurries for the tape casting process involved the use of Dolaflux B11® (CERADEL, Limoges, France) as dispersant, Polyvinyl alcohol 22000® (VWR, Fontenay-sous-Bois, France) as binder, and Polyethylene glycol 300® (SIGMA ALDRICH, St. Quentin Fallavier, France) as plasticizer.

2.2. Processing

The tape casting process was used in such a way that the alignment of clay particles along the tape casting direction was favored. The optimized slurries (62.5 mass % solid content) were prepared following these main steps, namely:
(i)
Kaolin and/or halloysite powders were mixed with deionized water and 0.2 g of dolaflux B11® (2 mL of a solution at 10 mass % of dolaflux) previously and kept to the overnight homogenization with roll-mixer;
(ii)
The so-obtained mixture was ground in a planetary mill (Fritsch) for 6 h at 180 rpm prior to the addition of the required amount of binder and plasticizer. Milling/mixing operation was performed for 16 h at 100 rpm in the planetary mill;
(iii)
The relevant slurry was gently set on the roll-mixer in order to remove the residual or entrapped bubbles. Before the tape casting operation, each slurry was sieved at 125 µm to eliminate the non-solubilized binder and plasticizer.
The tape casting was performed with a non-continuous equipment, whereby the casting rate (0.42 mm/min) and the casting gap that defined the thickness of the green tapes (ranging between 200 µm to 300 µm) could be precisely monitored. The green tapes were dried at room temperature for 24 h; afterward, the disk-like samples were cut with the use of round circular punches exhibiting inner diameter of 10 mm or 30 mm.

2.3. Methods

The specific surface area was determined by the BET method (Brunauer, Emmett and Teller method), using an ASAP 2020 device (Micromeritics Instrument, Norcross, GA, USA) and nitrogen gas for adsorption. The measurements were carried out after two degassing steps, first at 90 °C for 30 min, followed by a second at 250 °C for 4 h to reach a required pressure of 6.5 Pa.
The density of the clay powders was measured using an AccuPyc II 1340 Pycnometrer (Micromeritics Instrument, Norcross, GA, USA) with a sample chamber volume of 1 cm3. The samples were previously dried at 105 °C for 24 h before each measurement.
X-ray fluorescence analysis of the chemical composition of raw materials was measured with a Panalytical Zetium instrument (Malvern, Westborough, MA, USA) using a rhodium generator for X photon (60 kV, 50 mA). The measurements were performed for 40 min. The measurements were performed using transparent disk samples (glass samples). These disk-like samples were obtained by mixing 1 g of raw material (KCS, KRG or H) with 10 g of lithium tetraborate (Li2B4O7) and by heating this mixture at 1050 °C within a platinum crucible. The semi-quantitative analysis allowed us to detect chemical elements from oxygen to uranium, and the acquisition time was 40 min for each sample.
Setaram Labsys Evo (SETARAM, City, France) was used to perform the differential thermal (DTA) and thermogravimetric (TG) analyses. Prior to DTA-TG analysis, the samples were dried at 110 °C overnight. During the measurement, specimens were placed in a platinum crucible. Aliquots of 60 mg to 70 mg of powder were analyzed for each sample. The analyses were conducted under dried air, from 30 °C to 1400 °C with heating and cooling rate of 5 °C/min and 10 °C/min, respectively.
Scanning electron microscopy observations were performed using a FEI Quanta 450 FEG device (Thermo Fisher Scientific, Waltham, MA, USA). Powder samples were observed after a previous dispersion in ethanol: a drop of each prepared suspension was placed onto a sample holder and then dried. Bulk specimens were also characterized (surfaces and sections of tapes before and after heat treatment). Before observations, bulk samples were coated using a 10 nm gold-palladium layer in order to ensure sufficient electron conduction at external surface.
The nature of the crystalline phases within the manufactured samples and the crystallographic texture were determined through room temperature (RT) laboratory X-ray diffraction (XRD) experiments using a D8 Advance DaVinci diffractometer (Bruker, Madison, WI, USA), operating in Bragg–Brentano geometry with CuKα1 radiation (λ = 0.1540598 nm). The raw materials samples were deposited in a classical transparent resin sample holder and the shaped materials were glued on the same type of specimen holder. The nature of the crystalline phases present in the raw materials was determined on powdered samples through qualitative analysis of XRD patterns (DIFFRAC.SUITE EVA software, Bruker Company, Madison, WI, USA) collected in a range of 2° < 2θ < 60° with a step of 0.02°, integration time of 0.54 s/step, and width of the slits of 15 mm. The DIFFRAC.SUITE EVA software was granted with the ICDD (PDF2, PDF4 plus), PDF4 AXIOM, and COD reference databases. The crystallographic preferential orientation after shaping of the green tapes was determined through conventional texture measurements, using Soller slits to limit the divergence of the incident X-ray beam. The poles figures were collected using steps of 2.5° between 0° and 60° for the χ angles and 5° between 0° and 355° for the ϕ angles.

2.4. In Situ High-Temperature XRD

The dehydroxylation process of kaolinite and halloysite of the selected samples was studied through in situ high-temperature XRD measurement realized on the French Collaborating Research Group (F-CRG) D2AM beamline at the ESRF (European Synchrotron Radiation Facility) in Grenoble, France [30]. The set-up includes a very high temperature furnace developed in the frame of the QMAX research program, capable of heating samples under primary vacuum, air or controlled atmosphere up to 1700 °C. The experiments were performed in pseudo-symmetric mode, i.e., XRD patterns were recorded under the incidences angles corresponding to the Bragg angle of the main (00l) reflections of the kaolinite and halloysite and the diffracted beams were collected using an XPad 2D-pixel hybrid detector. The energy of the X-ray beam was fixed to 18 keV. This configuration allowed us to simultaneously collect five of the (00l) Debye–Scherer partial rings without any angular displacement of the detector. We used a highly parallelized primary beam exhibiting a cross section of few hundred microns and taking into account of the experimental configuration (in this case, the instrumental broadening is in Q-range under consideration close to 0.04°). Each XRD map was recorded in few seconds. The thermal evolution of the samples was followed with a heating rate of 20 °C/min, and the diffraction signal was recorded every 25 °C.

3. Results and Discussion
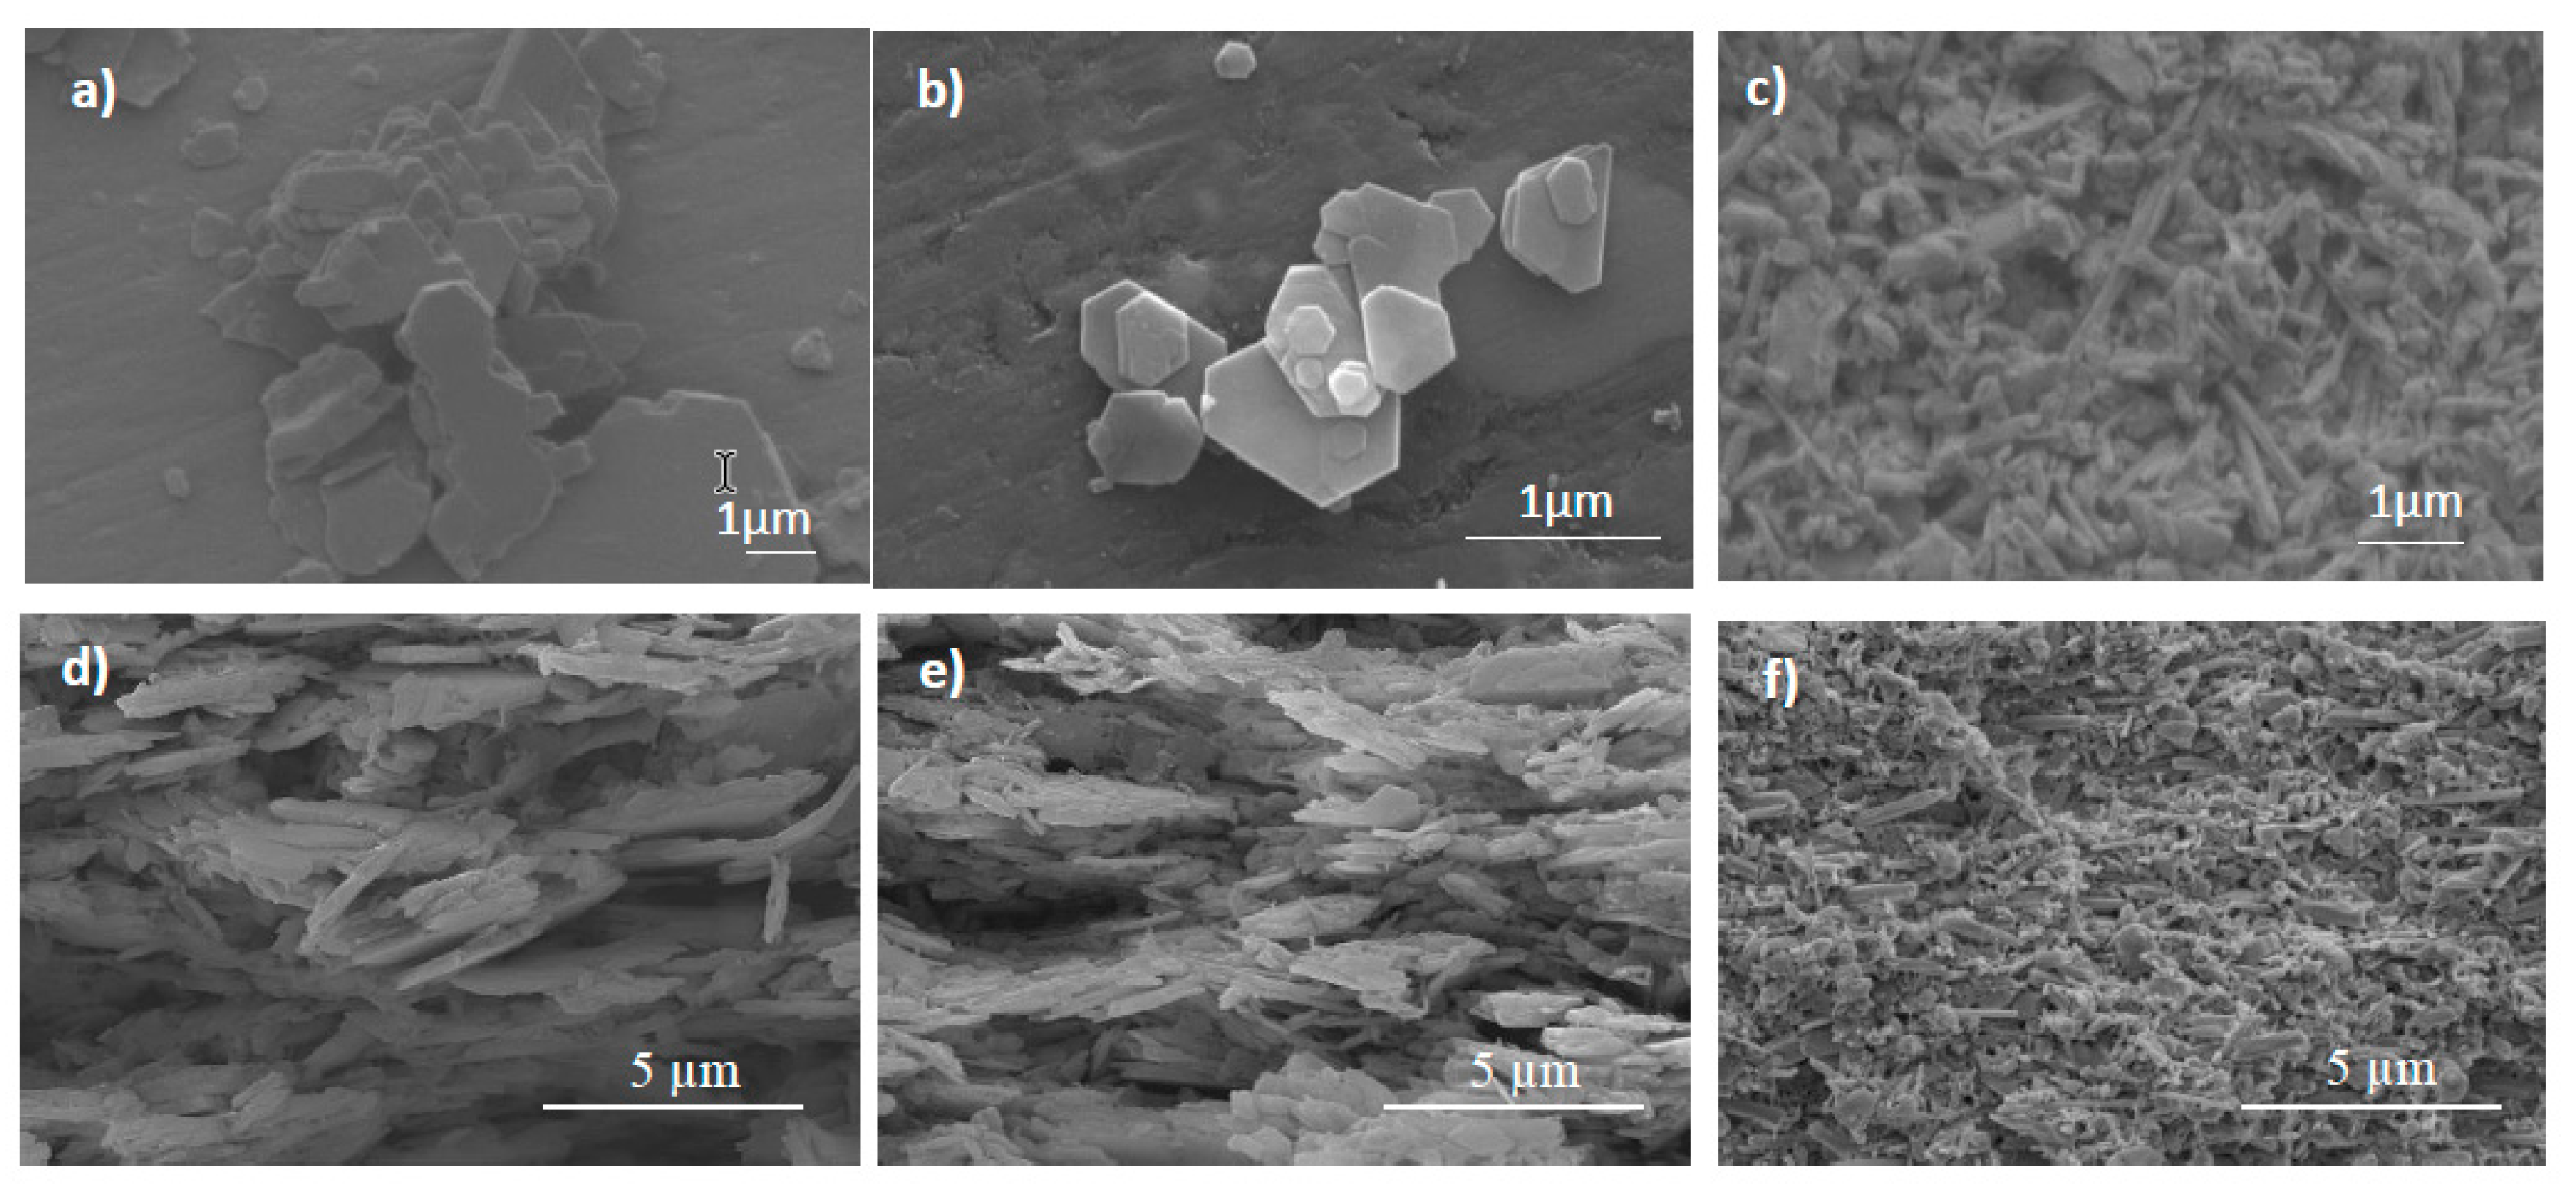
3.1. Raw Materials

The chemical composition of raw materials was determined using X-ray fluorescence analysis. The obtained values are reported in Table 1. The weight oxide proportions are in agreement with the data sheet of products given by the supplier. Silica/alumina mass ratio is very close to the theoretical value of 1.1 calculated for a pure kaolinite accordingly to the chemical formula (1.12 and 1.11 for KRG and KCS, respectively). Concerning halloysite (H), a value of 1.28 was obtained. Some complementary physical characteristics of these raw materials are given in Table 1.
According to the XRD patterns of raw materials (Figure 1a) using CuKα1 radiation (λ = 1.540598 Å), several peaks characterizing kaolinite were detected in KRG and KCS for 2θ angle values of 12.40°, 20.38°, 24.96°, and 35°. Moreover, small peaks assigned to α-quartz appeared around 26.27°, which confirmed the high purity of these kaolins. In addition, XRD patterns of halloysite showed the presence of secondary phases such as cristobalite (2θ angles values of 21.96°, 31.5°) and quartz α (peaks detected at 20.86° and 26.27°). The peaks of halloysite were located at 2θ angles values of 12.12°, 20.08°, 24.59°, and 35°. Therefore, the slight differences observed in the XRD patterns of both kaolin and halloysite were in agreement with the purity of kaolins KRG and KCS. Moreover, their degree of crystallinity was evaluated through specific indexes.
The index of HINCHLEY (HI) [31] is defined through Equation (1) considering the ratio of the intensities of the (1 1 ¯ 0) and ( 1 ¯ 1 ¯ 1) reflections for the kaolinite.
H I = A + B A t
where A and B are respectively the height of the background of the (1 1 ¯ 0) and ( 1 ¯ 1 ¯ 1) peaks, at the total height of the (1 1 ¯ 0) peaks above background.
The estimation of the index of LIETARD (R2) [31] was performed using Equation (2) with the (1 3 ¯ 1) and (131) peak intensities and the counts in the valley between them.
R 2 = 1 2 ( K 1 + K 2 ) K 1 3 ( K 1 + K 2 + K )
where K1 and K2 the intensities of (131) and (1 3 ¯ 1) peaks respectively, and K the counts in the valley between them.
The calculated values of HI and R2 for KCS and KRG are listed in Figure 1b, in comparison with those obtained in the literature [32,33] for the references kaolin KGa-1b and KGa-2. According to these values, KCS and KRG crystallinity indexes (HI and R2) were very close to the KGa-1b values. Therefore, the KRG and KCS appeared to likely be granted with high crystallinity kaolinites with a low amount of structure defects. In the literature, HI values appeared to vary from <0.5 (disordered) up to 1.5 (ordered) whereas reported R2 values range from <0.7 (disordered) up to 1.2 (ordered).
According to the SEM (scanning electron microscope) observations of raw materials powders shown in Figure 2a–c, KCS and KRG exhibited platelet-like particles whereas halloysite was as expected composed of particles with a tubular-like shape. The thickness of clay particles was estimated to be 120 nm for KCS, whereas it was around 40 nm for KRG. Considering the latter results, the basal surface of particles was greater for KRG (Figure 2a,b), in agreement with shape indexes provided by the supplier (close to 40 and 28 for KRG and KCS, respectively).
In order to clearly defining the in situ characterization temperature range, the kaolin and halloysite samples were previously analyzed by DTA/TGA. As shown in the Figure 3, the KRG, KCS, and H presented the same feature during heat treatment. First, a large endothermic peak between 400 °C and 700 °C was related to the transformation of kaolinite (13.7% of mass loss corresponds of 98 mass % of kaolinite) or halloysite (13% of mass loss corresponds of 93.5 mass % of halloysite) into metakaolinite according to the dehydroxylation reaction R.1. The dehydroxylation of halloysite proceeded over a small temperature range. This trend could be partially attributed to the presence of the smaller particles size. The exothermic peak at 980 °C corresponded to the structural reorganization (formation of a spinel-like or mullite phases). The exothermic shoulder located above 1200 °C for KRG, KCS, and H was related to the crystallization of secondary mullite.

3.2. Green Tapes

The different green samples prepared through tape casting were observed using SEM (Figure 2d–f) and the related images highlight the preferential alignment of clay platelets along the casting direction. XRD patterns were recorded using the laboratory diffractometer in Bragg–Brentano mode on flat plate samples of KCS100, KRG100, KCS50H50, and KRG50H50 (see Figure 4). In all the cases, only the (00l) peaks of kaolinite were observed. This observation was a clear indication of preferential orientation of the kaolinite crystals with respect to the tape casting direction. However, for sample H100, although the (00l) peaks exhibited a greater intensity than the others did, all the Bragg reflections of halloysite phase were detected. In the case of mixtures consisting of half to half kaolin and halloysite mass content, only the (00l) plans of kaolinite (even for halloysite) were detected. Therefore, it seemed obvious to consider that the kaolin particles promoted the alignment of the halloysite tubes due to mechanical interactions.
The crystallographic distributions of orientations were assessed through the construction of pole figures of the (002) reflection of these samples, previously heated at 400 °C in order to remove the organic compounds (binder and plasticizer). The obtained (002) pole figures are shown in Figure 4B. The KRG100 and KCS100 samples presented the highest multiple random density (MRD) values (close to 11) at χ = 0 (center of the circle). Note that the greater the MRD, the stronger the texture; MRD = 1 corresponded to a completely random texture [34]. The MRD values were very sensitive to the χ angle varation (the MRD value decrease with a small variation of χ angle). But in the halloysite sample, the MRD values appeared to be very low (close to 4) and its distribution within each circle was not constant. These observations attested that the KCS100, KRG100, KCS50H50, and KRG50H50 particles were preferentially oriented along (00l) plans (high texture), while the H100 (halloysite) particles were less oriented (moderate to low texture). No significant difference was noted between the MRD values of KRG100 and KCS100, indicating that the shape index of the starting kaolin (40 for KRG and 28 for KCS) did not significantly affect the initial texture when using the tape casting process.

3.3. Kinetic of the Non-Isothermal Dehydroxylation

The study of the kinetic of the dehydroxylation of kaolins and halloysite raw materials was done using the DTA results obtained at different heating rate (1, 5, 10, 15, 20 °C/min) up to the temperature of 1400 °C. The activation energy (Ea) was investigated by the Equation (3) of Johnson–Mehl–Avrami–Kolmogoroff (JMAK) [35,36,37,38,39], under non-isothermal conditions [40]:
( ln ( 1 X ( t , T ) ) 1 n = k ( T T 0 ) α
where X (T,t) is the fractional amount of the considered phase at the temperature T (K), n is the Avrami exponent, α the heating rate (°K/min), T0 is the temperature at t = 0, and k is the reaction rate constant. k is a function of the temperature according to am Arrhenius-type expression (Equation (4)).
k = k 0 ·   exp ( E a R T )
where k0 is the frequency factor, Ea (kJ/mol) is the apparent activation energy and R is the ideal gas constant. Based on the Kissinger kinetic method used to analyze the DTA data [41], the following equation (Equation (5)) was applied:
ln ( α T p 2 ) = E a R · T p + C o n s t a n t
where Tp is the temperature at the maximum of the transformation peak and α is the DTA heating rate. A plot of l n ( α T p 2 ) versus 1 T p leads to a linear evolution, the slope of which allows us to determine the apparent activation energy for the transformation (Ea).
According to the literature, the value of the activation energy of kaolinite dehydroxylation was reported to vary from 140 kJ/mol to 300 kJ/mol [42], depending on the degree of crystallinity, particle size, etc.
The mechanism of the dehydroxylation was estimated via the magnitude of the Avrami exponent noted n (see Equation (3)). This parameter was determined from the shape of DTA peak of the transformation and is related to Tp as [43,44] written in Equation (6):
n = 2.5 Δ T · R   T p 2 E a
Figure 5 shows the plots of l n ( α T p 2 ) versus 1 T p for H, KRG, KCS, and KRG50H50, according to the Kissinger approach. The apparent activation energies of dehydroxylation calculated from the slope of Kissinger plots are (Figure 5) 162 kJ/mol for KCS, 161 kJ/mol for KRG, 168 kJ/mol for H and 152 kJ/mol for KRG50H50 (175 kJ/mol for KGa-1b [45]). These data were in good agreement with the previously published results [20,46].
The Avrami exponent values for each material and at different heating rate are listed in Figure 5. These exponents decreased when the heating rate increased from 1 °C/min to 20 °C/min. The average values of Avrami exponent was around 1.17 for KCS, 1.28 for H, 1.02 for KRG50H50, and 0.84 for KRG. For the kaolins (platelet particles form), n < 1 for KRG and n > 1 for KCS, which suggested that the dehydroxylation of KCS was controlled by diffusion mechanism related to bulk nucleation with constant number of nuclei, while interface reaction in line with surface nucleation mechanism was predominant for the dehydroxylation of KRG (see Table 1). In the case of halloysite (needle shape of particles), the dehydroxylation seemed to be controlled by diffusion mechanism according to bulk nucleation with varying number of nuclei (see Table 2). Nevertheless, the Avrami exponent for halloysite could also agree with the occurrence of interfacial reactions in the case of bulk nucleation with constant number of nuclei and/or surface nucleation. The coexistence of different controlling mechanisms could arise due to the polydispersity of grain size distribution exhibited by the starting halloysite.
According to the literature, the dehydroxylation mechanisms may involve three main stages as described by Ptáček et al. [20]: (i) the dehydroxylation explained by the loss of structural water, (ii) the delamination of kaolinite, and (iii) the formation of metakaolinite. These authors showed that when increasing the heating rate from 0.1 °C/min to 20 °C/min, the separation between the three stages was improved, and delamination tended to occur before the dehydroxylation. Moreover, the dehydroxylation was achieved before the end of the delamination. Therefore, the metakaolinite (i.e., the Roentgen amorphous, dehydroxylated and delaminated phases) was detected when the delamination and dehydroxylation stages were achieved. The trends obtained during this study were in agreement with the influence of the heating rate on the dehydroxylation process. The further investigation using a heating rate of 20 °C/min for in situ X-ray diffraction measurements was expected to bring additional information on the dehydroxylation stages.

3.4. Study of the Dehydroxylation by In Situ XRD

Based on the DTA/TGA analyses presented in Figure 3, the in situ XRD characterization of the dehydroxylation of tape specimens containing these kaolins and halloysite was performed in the range 400 °C to 800 °C. The 2D maps recorded at room temperature (Figure 6a,b); Figure 7a,b showed that for KCS100, KRG100, and KRG50H50, only the (00l) reflections were detected, while in the H100 sample, the (00l) reflections of the halloysite phase and the peaks of secondary phases (cristobalite and α-quartz) were observed. These results were in agreement with the XRD analyses performed with the laboratory X-ray diffraction (XRD) operating in Bragg-Brentano geometry with CuKα1 radiation (λ = 1.540598 Å). Furthermore, it was noticeable that the presence of kaolinite particles promoted the alignment of halloysite tubular rollers along the plate in the casting direction as previously mentioned through the (002) pole figures analysis. Radial integration of the 2D maps allowed plotting 1D diffraction patterns. The evolution of the (002) peak as a function of the temperature between 400 °C and 800 °C is reported on Figure 6c,d and Figure 7c,d. For all the studied specimens, changes were observed concerning the intensity, the position and the shape of the (002) peak with increasing temperature. Indeed, this peak progressively vanished between 425 °C and 700 °C. This behavior may have strongly contributed in highlighting the effective dehydroxylation process for similar dioctahedral TO clay minerals. Conversely to our observations, some authors [22,48,49] assumed that during this dehydroxylation, the XRD peaks of kaolinite disappeared abruptly at 550 °C. In order to analyze quantitatively this process, the diffraction peaks were fitted using the split pseudo-Voigt function available using the peakoc software (version 1.0, IRCER, Limoges, France) [50]. We determined the evolution of both the integrated intensity and the full width at half maximum (FWHM) of the (002) peak at all the studied temperatures (see Figure 8). In all cases, the variation of the integrated intensity was report with respect to the (002) peak intensity before the kaolinite decomposition starting point.
The main difference between KRG and KCS kaolins appeared to be the shape index and the particle size distribution, but the trend observed for the beginning of the dehydroxylation appeared to follow the opposite expected behavior. When considering the endpoint of the kaolinite detection, we noted that it was 625 °C for KCS100 and 650 °C for KRG100. Therefore, the range for the dehydroxylation of KCS100 (500 °C to 625 °C) was narrower than that of KRG100 (425 °C to 650 °C). This final analysis seemed to be in line with the starting powders physical characteristics, i.e., KCS exhibited lower shape index (28) and lower mean particle size (around 5 micrometers) in comparison to KRG (see Table 1). The presence of defects could enhance the dehydroxylation of kaolinite as already pointed out in literature [51]. The FWHM changes observed in KRG100 and KCS100 (Figure 8a,b) seemed to assess the presence of significant defects within KRG100. The latter remarks may justify the earlier dehydroxylation observed in KRG100 compared to KCS100.
In the case of halloysite, the dehydroxylation started at 500 °C and is finished at 650 °C. The halloysite particles tubular shape and their polydisperse size distribution may contribute to favor a higher temperature to initiate the dehydroxylation. Nevertheless, the dehydroxylation range was close to that of KCS100. The dehydroxylation of halloysite could be considered as dependent on the roll out of the tubular particles (favored with high temperatures) [52] and the particle size distribution. Besides, the latter dehydroxylation of halloysite appeared to be in agreement with the occurrence of a diffusion-controlled mechanism (Avrami exponent) with bulk nucleation with varying number of nuclei followed by interfacial reaction while having open tubes. The corresponding FWHM exhibited a small decrease, indicating a significant occurrence of defects within the halloysite structure. The mixture of kaolin KRG and halloysite led to a shift of the dehydroxylation domain in the range of 450 °C to 625 °C with a quite stable FWHM according to the evolution of the (002) peak as shown on Figure 8d. Each TO mineral undergone decomposition without any interaction with other phases. The noticeable stability of the (002) FWHM in KRG50H50 sample was not in agreement with the behavior obtained when using KRG100 or H100. This difference could arise regarding the overlapping of the dehydroxylation mechanisms of kaolinite and halloysite regarding the occurrence of defects.
According to the dehydroxylation sequences described by Ptáček at al. [20], the as-obtained results were discussed. Considering the (002) peak evolution presented in Figure 8, the plateau that precedes the intensity decrease could be assigned to the delamination stage. Thereafter, the end of the delamination overlapped with the dehydoxylation up to the total disappearance of the (002) peak of kaolinite or halloysite. From the aforementioned assumptions, the inflexion point could be considered as the characteristic beginning of the superposition between the delamination and dehydroxylation stages. The critical temperature derived from the sigmoid fitting indicated a similar trend for both KCS100 and H100. Hence KRG100 exhibited the lowest critical temperature (Tc ≈ 525 °C). The mixture with halloysite did not significantly affect the initial Tc.
The evolution of the basal distance had been determined, and the behaviors in the range 150 °C to 650 °C are plotted on Figure 9. The corresponding coefficient of thermal expansion (CTE) along the c-axis of kaolinite, halloysite in pure and mixtures of kaolin and halloysite are reported in Figure 9. It was noted that a change in slope occurred in all samples between 475 °C and 525 °C. Therefore, the CTE was estimated in each region. Indeed, in the range temperature between 150–400 °C the CTE values for KRG100, KCS100 and H100 varied from 17.7 to 13.2 × 10⁻⁶ °C−1. A higher value of CTE, 23.2 × 10⁻⁶ °C−1, was obtained for the KRG50H50 sample. Such values were in accordance with the values provided in literature for the linear CTE in the z-direction (corresponding to the (00l) direction) which were close to 18 × 10−6 °C−1 [47,53]. Nonetheless, the volumetric CTE provided in literature for kaolinite is close to 61 × 10−6 °C−1. In the temperature range from 400 °C to 625 °C, the CTE values were decreased above 25 × 10−6 °C−1, for the sample containing KRG kaolin whereas with KCS sample, a stabilization of the CTE value close to 5 × 10⁻⁶ °C−1 was observed. The latter behavior tended to comfort the effect of the shape index and the lower particle size of this kaolin KCS compared to KRG, on the enhancement of the delamination stage while reducing its superposition with the dehydroxylation stage. Since the delamination included an expansion of the basal distance, it was likely that the higher shape index of KRG kaolin led to a wider delamination domain even above 550 °C and, therefore, a more important overlapping with the dehydroxylation stage. In the case of halloysite, the tubular shape may significantly increase the delamination range. However, thanks to its initial particle size distribution, the superposition of delamination and dehydroxylation appeared less important than for KRG100. These considerations could justify the lower CTE modification in the range 525–625 °C for H100 (12 × 10−6 °C−1).
As shown Figure 6 and Figure 7, the diffracted intensity was not uniform along each Debye–Scherer ring. This effect was a qualitative illustration of texture with respect to the χ tilt angle. The evolution of this texture as a function of the temperature is reported Figure 10 for a pure KRG sample. It seemed that the decomposition of the kaolinite occurs without significant evolution of the texture. The latter led to consider that the dehydroxylation mechanisms and the kaolinite and halloysite physical and mineralogical characteristics are controlling the in-situ dehydroxylation of the studied specimens. The suggested summarized dehydroxylation within the studied samples is presented on Figure 11.

4. Conclusions

The targets of this work were directed on the following three main points: (i) the characterization of the initial texture and the thermal transformations of kaolinite and halloysite samples shaped using the tape casting process; (ii) the analysis of the dehydroxylation mechanisms of halloysite and kaolinite samples using the Kissinger approach; and (iii) the study of the dehydroxylation of halloysite and kaolinite samples by in situ XRD during heat treatment.
The crystallinity indexes of the raw kaolins (KRG and KCS) were investigated using the index of HINCHLEY (HI) and the index of LIETARD (R2). Both kaolins appeared to contain high crystallinity kaolinites, higher crystallinity than the KGa-1b (reference kaolin), with a low amount of structure defects (stacking defects).
Besides, the XRD patterns at room temperature and the (002) poles figures for the green kaolin tapes showed that the clay particles were preferentially aligned along (00l) reflexions of kaolinite. However, the halloysite green tapes exhibited a more random orientation (less texture); this was correlated to the tubular morphology of halloysite particles. Nevertheless, the mixture of the halloysite with kaolin promoted the alignment of halloysite particles along the casting surface thanks to their physical interaction with platelet-like kaolinite particles.
The kinetic parameters of the dehydroxylation of kaolinite and halloysite samples assessed through the constant heating rate Kissinger method allowed determination of activation energy values. These values were close to 162 KJ/mol for KCS and KRG and X kJ/mol for H. Accordingly, the calculated values of Avrami exponent indicated that the dehydroxylation within KCS was controlled by “bulk nucleation with constant number of nuclei” mechanism. While for KRG, the dehydroxylation was controlled by “surface nucleation” mechanism; and in the case of halloysite, the dehydroxylation appeared controlled by “bulk nucleation with varying number of nuclei” mechanism. These differences in dehydroxylation mechanism were consistent with the reported chemical and physical characteristics of the starting materials—namely, the particle size distribution and the shape index.
In situ XRD investigation of the dehydroxylation of the studied kaolinite and halloysite samples had highlighted several behaviors
-
The increasing shape index and polydispersity in kaolinite or halloysite grain size tended to favor higher temperatures to initiate the dehydroxylation, 425 °C for the KRG (monodisperse) < 475 °C for KCS (bimodal) < 500 °C for the halloysite clay (trimodal).
-
The increase of the shape index tended to induce a wide dehydroxylation range due to the limiting diffusion of inner hydroxyl groups. Dehydroxylation occurred from 425 °C to 650 °C for KRG (shape index of 40) and from 450 °C to 625 °C for KCS (shape index of 28).
-
During the dehydroxylation of the kaolinite sample, the initial texture appeared unchanged regardless of the differences in particle size distribution and shape index.
-
The FWHM values of H100, KRG100, and KRG50H500 decrease during dehydroxylation, which means that the structure defects decrease during heat treatment.
-
The coefficient of the thermal of kaolinite and halloysite clay mineral were 17 × 10−6 and 14 × 10−6 °C−1 in agreement with the literature. Indeed, the change observed on the CTE during the dehydroxylation appeared to correlate with the overlapping of the delamination and the dehydroxylation stages described in the literature. These transition temperatures comfort the influence of the shape index and the polydispersity of grain size distribution for the studied kaolinite and halloysite-based specimens.

Author Contributions

Conceptualization, G.L.L.-N., I.D. and R.G.; Methodology, G.L.L.-N. and R.G. and I.D.; Software, M.F.G., R.G. and I.D.; Validation, G.L.L.-N. and R.G.; Formal Analysis, I.D., G.L.L.-N., R.G. and M.F.G.; Investigation, I.D., G.L.L.-N., R.G., M.F.G. and N.T.-D.; Resources, C.P., I.D., G.L.L.-N., R.G., M.F.G. and N.T.-D.; Data Curation, I.D., G.L.L.-N., R.G. and M.F.G.; Writing-Original Draft Preparation G.L.L.-N. and I.D.; Writing–Review & Editing, G.L.L.-N., I.D., R.G. and M.F.G.; Visualization, G.L.L.-N., I.D. and R.G.; Supervision, G.L.L.-N., N.T.-D., C.P. and R.G.; Project Administration, G.L.L.-N., N.T.-D., C.P. and R.G.; Funding Acquisition, G.L.L.-N., N.T.-D., C.P. and R.G.; All authors have read and agreed to the published version of the manuscript.

Funding

This research received no external funding.

Acknowledgments

We acknowledge the European Synchrotron Radiation Facility for provision of synchrotron radiation facilities and we would like to thank xyz for assistance in using beamline BM02 (D2AM, CRG, ESRF).

Conflicts of Interest

The authors declare no conflict of interest.

References

  1. Lecomte-Nana, G.; Mokrani, A.; Tessier-Doyen, N.; Boussois, K.; Goure-Doubi, H. Texturation of model clay materials using tape casting and freezing. Ceram. Int. 2013, 39, 9047–9053. [Google Scholar] [CrossRef]
  2. Castelein, O.; Guinebretière, R.; Bonnet, J.P.; Blanchart, P. Shape, size and composition of mullite nanocrystals from a rapidly sintered kaolin. J. Eur. Ceram. Soc. 2001, 21, 2369–2376. [Google Scholar] [CrossRef]
  3. Houta, N.; Lecomte-Nana, G.-L.; Tessier-Doyen, N.; Peyratout, C. Dispersion of phyllosilicates in aqueous suspensions: Role of the nature and amount of surfactant. J. Colloid Interface Sci. 2014, 425, 67–74. [Google Scholar] [CrossRef] [PubMed]
  4. Chartier, T.; Streicher, E.; Boch, P. Preparation and characterization of tape cast aluminum nitride substrates. J. Eur. Ceram. Soc. 1992, 9, 231–242. [Google Scholar] [CrossRef]
  5. Chartier, T.; Badev, A.; Abouliatim, Y.; Lebaudy, P.; Lecamp, L. Stereolithography process: Influence of the rheology of silica suspensions and of the medium on polymerization kinetics—Cured depth and width. J. Eur. Ceram. Soc. 2012, 32, 1625–1634. [Google Scholar] [CrossRef]
  6. Maqueda, C.; Partal, P.; Villaverde, J.; Perez-Rodriguez, J.L. Characterization of sepiolite-gel-based formulations for controlled release of pesticides. Appl. Clay Sci. 2009, 46, 289–295. [Google Scholar] [CrossRef]
  7. Bailey, S.W. Halloysite—A critical assessment. In Volume II: Surface Chemistry. Structure and Mixed Layering of Clays, Proceedings of the 9th international Clay Conference, Strasbourg, France, 28 August–2 September 1989; Institut de Géologie—Université Louis-Pasteur: Strasbourg, France, 1990; pp. 89–98. [Google Scholar]
  8. Johnson, S.L. Thermal Stability of Halloysite by High-Pressure Differential Thermal Analysis. Clays Clay Miner. 1990, 38, 477–484. [Google Scholar] [CrossRef]
  9. Mitra, G.B. Spiral Structure of 7 Å Halloysite: Mathematical Models. Clays Clay Miner. 2013, 61, 499–507. [Google Scholar] [CrossRef]
  10. Štubňa, I.; Trník, A.; Vozár, L. Thermomechanical and thermodilatometric analysis of green alumina porcelain. Ceram. Int. 2009, 35, 1181–1185. [Google Scholar] [CrossRef]
  11. Duran, C.; Kemal Tür, Y. Templated grain growth of textured mullite/zirconia composites. Mater. Lett. 2005, 59, 245–249. [Google Scholar] [CrossRef]
  12. Boussois, K.; Deniel, S.; Tessier-Doyen, N.; Chateigner, D.; Dublanche-Tixier, C.; Blanchart, P. Characterization of textured ceramics containing mullite from phyllosilicates. Ceram. Int. 2013, 39, 5327–5333. [Google Scholar] [CrossRef]
  13. Deniel, S.; Tessier-Doyen, N.; Dublanche-Tixier, C.; Chateigner, D.; Blanchart, P. Processing and characterization of textured mullite ceramics from phyllosilicates. J. Eur. Ceram. Soc. 2010, 30, 2427–2434. [Google Scholar] [CrossRef]
  14. Ptáček, P.; Kubátová, D.; Havlica, J.; Brandštetr, J.; Šoukal, F.; Opravil, T. Isothermal kinetic analysis of the thermal decomposition of kaolinite: The thermogravimetric study. Thermochim. Acta 2010, 501, 24–29. [Google Scholar] [CrossRef]
  15. Liu, Y.-F.; Liu, X.-Q.; Tao, S.-W.; Meng, G.-Y.; Sorensen, O.T. Kinetics of the reactive sintering of kaolinite-aluminum hydroxide extrudate. Ceram. Int. 2002, 28, 479–486. [Google Scholar] [CrossRef]
  16. Balek, V.; Murat, M. The emanation thermal analysis of kaolinite clay minerals. Thermochim. Acta 1996, 282–283, 385–397. [Google Scholar] [CrossRef]
  17. Castelein, O.; Soulestin, B.; Bonnet, J.P.; Blanchart, P. The infuence of heating rate on the thermal behaviour and mullite formation from a kaolin raw material. Ceram. Int. 2001, 27, 517–522. [Google Scholar] [CrossRef]
  18. Ptáček, P.; Kubátová, D.; Havlica, J.; Brandštetr, J.; Šoukal, F.; Opravil, T. The non-isothermal kinetic analysis of the thermal decomposition of kaolinite by thermogravimetric analysis. Powder Technol. 2010, 204, 222–227. [Google Scholar] [CrossRef]
  19. Gasparini, E.; Tarantino, S.C.; Ghigna, P.; Riccardi, M.P.; Cedillo-González, E.I.; Siligardi, C.; Zema, M. Thermal dehydroxylation of kaolinite under isothermal conditions. Appl. Clay Sci. 2013, 80–81, 417–425. [Google Scholar] [CrossRef]
  20. Ptáček, P.; Frajkorová, F.; Šoukal, F.; Opravil, T. Kinetics and mechanism of three stages of thermal transformation of kaolinite to metakaolinite. Powder Technol. 2014, 264, 439–445. [Google Scholar] [CrossRef]
  21. Chen, Y.-F.; Wang, M.-C.; Hon, M.-H. Phase transformation and growth of mullite in kaolin ceramics. J. Eur. Ceram. Soc. 2004, 24, 2389–2397. [Google Scholar] [CrossRef]
  22. Brindley, G.W.; Nakahira, M. The Kaolinite-Mullite Reaction Series: II, Metakaolin. J. Am. Ceram. Soc. 1959, 42, 314–318. [Google Scholar] [CrossRef]
  23. Frost, R.L.; Makó, É.; Kristóf, J.; Horváth, E.; Kloprogge, J.T. Mechanochemical Treatment of Kaolinite. J. Colloid Interface Sci. 2001, 239, 458–466. [Google Scholar] [CrossRef] [PubMed]
  24. Kristóf, É. The Effect of Mechanical Treatment on the Crystal Structure and Thermal Behavior of Kaolinite. Clays Clay Miner. 1993, 41, 608–612. [Google Scholar] [CrossRef]
  25. Ding, S.; Zhang, L.; Ren, X.; Xu, B.; Zhang, H.; Ma, F. The Characteristics of Mechanical Grinding on Kaolinite Structure and Thermal Behavior. Energy Proc. 2012, 16, 1237–1240. [Google Scholar] [CrossRef] [Green Version]
  26. Frost, R.L.; Horváth, E.; Makó, É.; Kristóf, J.; Rédey, Á. Slow transformation of mechanically dehydroxylated kaolinite to kaolinite—An aged mechanochemically activated formamide-intercalated kaolinite study. Thermochim. Acta 2003, 408, 103–113. [Google Scholar] [CrossRef] [Green Version]
  27. White, C.E.; Provis, J.L.; Proffen, T.; Riley, D.P.; van Deventer, J.S.J. Combining density functional theory (DFT) and pair distribution function (PDF) analysis to solve the structure of metastable materials: The case of metakaolin. Phys. Chem. Chem. Phys. 2010, 12, 3239. [Google Scholar] [CrossRef] [PubMed]
  28. Andrini, L.; Moreira Toja, R.; Conconi, M.S.; Requejo, F.G.; Rendtorff, N.M. Halloysite nanotube and its firing products: Structural characterization of halloysite, metahalloysite, spinel type silicoaluminate and mullite. J. Electron Spectrosc. Relat. Phenom. 2019, 234, 19–26. [Google Scholar] [CrossRef]
  29. Prodanović, D.; Živković, Ž.B.; Radosavljević, S. Kinetics of the dehydroxylation and mullitization processes of the halloysite from the Farbani Potok locality, Serbia. Appl. Clay Sci. 1997, 12, 267–274. [Google Scholar] [CrossRef]
  30. Chahine, G.A.; Blanc, N.; Arnaud, S.; De Geuser, F.; Guinebretière, R.; Boudet, N. Advanced Non-Destructive in Situ Characterization of Metals with the French Collaborating Research Group D2AM/BM02 Beamline at the European Synchrotron Radiation Facility. Metals 2019, 9, 352. [Google Scholar] [CrossRef] [Green Version]
  31. Aparicio, P. Mineralogical Interference on Kaolinite Crystallinity Index Measurements. Clays Clay Miner. 1999, 47, 12–27. [Google Scholar] [CrossRef]
  32. Joussein, E.; Petit, S.; Decarreau, A. Une nouvelle méthode de dosage des minéraux argileux en mélange par spectroscopie IR. C. R. L’académie Sci. Ser. Iia Earth Planet. Sci. 2001, 332, 83–89. [Google Scholar] [CrossRef]
  33. Soro, N.S. Influence des Ions fer sur les Transformations Thermiques de la Kaolinite; Université de Limoges: Limoges, France, 2003. [Google Scholar]
  34. Chateigner, D. Combined Analysis; ISTE; Wiley: London, UK; Hoboken, NJ, USA, 2010; ISBN 978-1-84821-198-8. [Google Scholar]
  35. Колмогоров, А.Н. K Статистическoй Теoрии Кристаллизации Металлoв. Известия Рoссийскoй академии наук. Серия математическая 1937, 1, 355–359. [Google Scholar]
  36. Avrami, M. Kinetics of Phase Change. I General Theory. J. Chem. Phys. 1939, 7, 1103–1112. [Google Scholar] [CrossRef]
  37. Avrami, M. Kinetics of Phase Change. II Transformation-Time Relations for Random Distribution of Nuclei. J. Chem. Phys. 1940, 8, 212–224. [Google Scholar] [CrossRef]
  38. Avrami, M. Granulation, Phase Change, and Microstructure Kinetics of Phase Change. III. J. Chem. Phys. 1941, 9, 177–184. [Google Scholar] [CrossRef]
  39. Johnson, W.A.; Mell, R.F. Reaction Kinetics in Processes of Nucleation and Growth. Trans. Am. Inst. Min. Metall. Pet. Eng. 1939, 135, 416–442. [Google Scholar]
  40. Ligero, R.A.; Vazquez, J.; Villares, P.; Jimenez-Garay, R. A study of the crystallization kinetics of some Cu-As-Te glasses. J. Mater. Sci. 1991, 26, 211–215. [Google Scholar] [CrossRef]
  41. Kissinger, H.E. Reaction Kinetics in Differential Thermal Analysis. Anal. Chem. 1957, 29, 1702–1706. [Google Scholar] [CrossRef]
  42. Killingley, J.S.; Day, S.J. Dehydroxylation kinetics of kaolinite and montmorillonite from Queensland Tertiary oil shale deposits. Fuel 1990, 69, 1145–1149. [Google Scholar] [CrossRef]
  43. Augis, J.A.; Bennett, J.E. Calculation of the Avrami parameters for heterogeneous solid-state reactions using a modification of the Kissinger method. J. Therm. Anal. 1978, 13, 283–292. [Google Scholar] [CrossRef]
  44. Ray, C.S.; Huang, W.; Day, D.E. Crystallization Kinetics of a Lithia-Silica Glass: Effect of Sample Characteristics and Thermal Analysis Measurement Techniques. J. Am. Ceram. Soc. 1991, 74, 60–66. [Google Scholar] [CrossRef]
  45. Lecomte-Nana, G.-L. Transformations Thermiques, Organisation Structurale et Frittage des Composés Kaolinite-Muscovite; Université de Limoges: Limoges, France, 2004. [Google Scholar]
  46. Saikia, N.; Sengupta, P.; Gogoi, P.K.; Borthakur, P.C. Kinetics of dehydroxylation of kaolin in presence of oil field effluent treatment plant sludge. Appl. Clay Sci. 2002, 22, 93–102. [Google Scholar] [CrossRef]
  47. McKinstry, H.A. Thermal expansion of clay minerals. Am. Mineral. 1965, 50, 212–222. [Google Scholar]
  48. Brindley, G.W.; Nakahira, M. The KaoIinite-Mullite Reaction Series: I, A Survey of Outstanding Problems. J. Am. Ceram. Soc. 1959, 42, 311–314. [Google Scholar] [CrossRef]
  49. Johns, W.D. High-Temperature phase changes in Kaolinites. Miner. Mag. 1953, 30, 1860198. [Google Scholar]
  50. Masson, O. Peakoc Profile Fitting Program. Available online: http://www.esrf.eu/computing/scientific/PEAKOC/MAIN.htm (accessed on 7 November 2018).
  51. Zhu, X.; Zhu, Z.; Lei, X.; Yan, C. Defects in structure as the sources of the surface charges of kaolinite. Appl. Clay Sci. 2016, 124–125, 127–136. [Google Scholar] [CrossRef]
  52. Joussein, E.; Petit, S.; Churchman, J.; Theng, B.; Righi, D.; Delvaux, B. Halloysite clay minerals—A review. Clay Miner. 2005, 40, 383–426. [Google Scholar] [CrossRef]
  53. Benazzouz, B.K.; Zaoui, A. Thermal behaviour and superheating temperature of Kaolinite from molecular dynamics. Appl. Clay Sci. 2012, 58, 44–51. [Google Scholar] [CrossRef]
Figure 1. (a) X-ray diffraction (XRD) patterns of the raw materials; K: Kaolinite (JCPDS 00-005-0143); Q: Quartz (JCPDS 00-046-1045); H: Halloysite (JCPDS 29-1487); C: Cristobalite (JCPDS 04-008-7642). (b) Index of crystallinity (±0.1) of kaolins.
Minerals 10 00480 g001
Figure 2. (ac) SEM observations of KRG, KCS, and H powders respectively; (df) SEM observations of KRG100, KCS100, and H100 green body respectively.
Minerals 10 00480 g002
Figure 3. DTA/TGA for raw materials.
Minerals 10 00480 g003
Figure 4. (A) XRD curves of green tapes samples. Kaolinite (JCPDS 00-005-0143), Halloysite (JCPDS 29-1487). (B) Pole figures of (002) reflexion peak of: (a) KRG100, (b) KRG50H50, (c) H100, (d) KCS50H50, and (e) KCS100 at 400 °C.
Minerals 10 00480 g004
Figure 5. Kissinger plot values and the Avrami exponent, n for H, KCS, KRG, and KRG50H50.
Minerals 10 00480 g005
Figure 6. (a,b) Debye–Scherrer diffraction rings recorded at room temperature under an incidence angle equal to the (002) planes Bragg angle, for H100 and KRG100 respectively. (c,d) One-dimensional XRD patterns of (002) of H100 and KRG100, respectively, during dehydroxylation.
Minerals 10 00480 g006
Figure 7. (a,b) Debye–Scherrer diffraction rings recorded at room temperature under an incidence angle equal to the (002) planes Bragg angle, for KCS100 and KRG50H50, respectively. (c,d) One-dimensional XRD patterns of (002) of KCS100 and KRG50H50, respectively, during dehydroxylation.
Minerals 10 00480 g007
Figure 8. The variation of the intensity and FWHW of (002) peak, versus the temperature for (a) KCS100, (b) KRG100, (c) H100, (d) KRG50H50, and (e) FIT parameters.
Minerals 10 00480 g008
Figure 9. The variation of the basal spacing (002) and calculated coefficient of the thermal expansion of KCS100, KRG100, H100, and KRG50H50 during dehydroxylation.
Minerals 10 00480 g009
Figure 10. The evolution of intensity as function of chi angle and temperature during the dehydroxylation of Krg100.
Minerals 10 00480 g010
Figure 11. Suggested summarized dehydroxylation for the studied kaolinites and halloysite.
Minerals 10 00480 g011
Table 1. Chemical and physical characteristics of raw materials (Tr.: < 0.2 mass %).
OxidesKCSKRGH
Technical Data Sheet (mass %)XRF Data (±0.01 mass %) Technical Data Sheet (mass %)XRF Data (±0.01 mass %)Technical Data Sheet (mass %)XRF Data (±0.01 mass %)
Al2O338.839.5 40.035.537.2
SiO245.844.1 44.849.547.5
P2O5 0.05 0.03 0.15
Fe2O30.570.63 0.620.390.39
ZrO2 0.02 0.03 0.02
K2OTr.0.04 0.050.01-
TiO20.550.58 0.410.09-
MgOTr. 0.29
Na2OTr.0.18 -0.04
CaOTr. 0.02
Loss on Ignition at 1050 °C (%) 14.8 1413.814.8
Shape index 28 40
KCSKRGH
BET specific area (m2/g)9.36.626.3
ρ (g/cm3)2.612.592.54
Grain size (µm)
d10260.3
d50592
d9081312
Particle size distributionPolydisperse
Modes
(0.4 and 5 µm)
Monodisperse
(10 µm)
Polydisperse
Modes
(0.5, 5 and 10 µm)
Natural pH value6.95.74.5
Table 2. Values of n for various transformations mechanisms [47].
Transformations MechanismsN
Two-Dimensional
(Plates)
One-Dimensional
(Needles)
Bulk nucleation with varying number of nuclei
Interface reaction
Diffusion
4
2.5
2
1.5
Bulk nucleation with constant number of nuclei
Interface reaction
Diffusion
3
1.5
1
0.5
Surface nucleation
Interface reaction
Diffusion
1
0.5
1
0.5

