Article

Gold Exploration in Two and Three Dimensions: Improved and Correlative Insights from Microscopy and X-Ray Computed Tomography

by
Joshua Chisambi
1,2,*,
Bjorn von der Heyden
1,
Muofhe Tshibalanganda
3 and
Stephan Le Roux
3
1
Department of Earth Sciences, Stellenbosch University, Private Bag X1, Matieland, Stellenbosch 7602, South Africa
2
Department of Mining Engineering, University of Malawi, the Polytechnic, Private Bag 303, Chichiri, Blantyre 3, Malawi
3
Central Analytical Facility, Stellenbosch University, Private Bag X1, Matieland, Stellenbosch 7602, South Africa
*
Author to whom correspondence should be addressed.
Minerals 2020, 10(5), 476; https://doi.org/10.3390/min10050476
Submission received: 3 April 2020 / Revised: 10 May 2020 / Accepted: 12 May 2020 / Published: 23 May 2020
(This article belongs to the Special Issue Novel Methods and Applications for Mineral Exploration, Volume II)

Abstract

:
In this contribution, we highlight a correlative approach in which three-dimensional structural/positional data are combined with two dimensional chemical and mineralogical data to understand a complex orogenic gold mineralization system; we use the Kirk Range (southern Malawi) as a case study. Three dimensional structures and semi-quantitative mineral distributions were evaluated using X-ray Computed Tomography (XCT) and this was augmented with textural, mineralogical and chemical imaging using Scanning Electron Microscopy (SEM) and optical microscopy as well as fire assay. Our results detail the utility of the correlative approach both for quantifying gold concentrations in core samples (which is often nuggety and may thus be misrepresented by quarter- or half-core assays), and for understanding the spatial distribution of gold and associated structures and microstructures in 3D space. This approach overlays complementary datasets from 2D and 3D analytical protocols, thereby allowing a better and more comprehensive understanding on the distribution and structures controlling gold mineralization. Combining 3D XCT analyses with conventional 2D microscopies derive the full value out of a given exploration drilling program and it provides an excellent tool for understanding gold mineralization. Understanding the spatial distribution of gold and associated structures and microstructures in 3D space holds vast potential for exploration practitioners, especially if the correlative approach can be automated and if the resultant spatially-constrained microstructural information can be fed directly into commercially available geological modelling software. The extra layers of information provided by using correlative 2D and 3D microscopies offer an exciting new tool to enhance and optimize mineral exploration workflows, given that modern exploration efforts are targeting increasingly complex and low-grade ore deposits.

1. Introduction

Gold exploration continues to attract a vast proportion of the global minerals exploration budget (e.g., ~50% of the $10.1 billion exploration budget for 2018 [1]). Much of this gold has been won from ‘orogenic’ classes of gold mineralization [2,3], which generally form in metamorphic terranes associated with accretionary or collisional orogenies [4]. These geological settings are typically characterized by a high level of structural complexity, in which gold mineralization may be multi-stage or may be overprinted or remobilized during progressive stages during the evolving orogenic cycle [5]. This high degree of geological complexity complicates modern day gold exploration efforts, which are already compromised by the fact that most easily-mined near-surface gold deposits have already been discovered and/or mined out [6,7].
To address this challenge, geoscientists are continually looking to develop and apply robust exploration techniques which can better constrain the spatial distribution of ore minerals within the host rocks and within mineralized structures [8]. Once ore bodies have been identified and drilled, the conventional approach towards understanding mineral textures and parageneses has predominantly been limited to two-dimensional analytical protocols (e.g., optical microscopy [9], scanning electron microscopy (including automated technologies, Quantitative Evaluation of Minerals by Scanning Electron Microscopy (QEMSCAN) technologies), electron microprobe micro-analysis [10], (synchrotron) X-ray Fluorescence Mapping [11], Laser induced breakdown spectroscopy, Raman spectroscopy and to a lesser extent, Laser Ablation Inductively Coupled Plasma Mass Spectroscopy (LA-ICP-MS) mapping [12]). Although these protocols provide detailed 2D textural, chemical and mineralogical information, they are inherently limited in that they fail to fully consider the mineralogical, textural, and structural heterogeneity extending into the third dimension. The advent and proliferation of bench-scale X-ray computed tomography (XCT) analytical protocols enables 3D information of ore samples to be able now to be routinely obtained [13,14]. This non-destructive XCT technology measures X-ray attenuation as an X-ray beam passes through a rotating ore sample (i.e., 360° measurement), where the X-ray attenuation varies as a function of mineral density and atomic number [15,16]. Because of their relatively high density, ore minerals (e.g., sulphides and gold) can easily be identified and distinguished from a matrix of less dense silicate (rock-forming) minerals [14]. Importantly for orogenic gold studies, gold is characterized by an exceedingly high density (19.3 g.cm−3) and thus, a high X-ray attenuation coefficient, which ensures that even very small grains can be distinguished and measured using XCT [17].
A growing body of scientific literature has realized the advantages of XCT based techniques for understanding the 3D internal structure of ore samples [17,18,19,20,21,22,23]. For example, [24] demonstrated the use of XCT as an analytical tool to quantify tungsten ore mineral content and ore grade. Similarly, [21] used lab-based XCT to characterize 3D textural settings of orogenic gold where they used combination of 3D visualization and mineral quantification methods to decipher spatial characteristics of ore-forming processes. Likewise, the authors in [25] investigated the distribution of sulphides using X-ray computed tomography to better understand how the base metal sulphides and gold formed in the Bushveld Igneous Complex, South Africa and Stillwater Complex, Montana, USA. Inasmuch as these examples serve to highlight the unique affordances of XCT in providing 3D textural (and to an extent mineralogical) data, the true power of XCT can only be fully realized if it is combined with the detailed chemical information supplied by more conventional 2D technologies (e.g., optical- and electron-microscopies, microprobes, etc.). In this contribution, we highlight a correlative approach, in which 3D XCT data are combined with 2D mineralogical and chemical data to understand a complex orogenic gold mineralization system in the Kirk Range (southern Malawi). Of special importance to orogenic gold deposits in which the siting of mineralization often has a strong structural control, we demonstrate the power of contextualizing observed 2D structural features in a 3D volume. We posit that export of this geometrically (XCT) contextualized structural data directly into geological databases and models will meaningfully contribute to the depth of data obtained during orogenic gold exploration programs, and foresee that correlative XCT-microscopic approaches will in future become a more prominent component of the gold exploration workflow.

2. Materials and Methods

Four drill core samples (extracted from borehole JJ-01: 100.20 to 100.50 m, 120.5 to 120.10 m depth, coordinates 15.31721° S, 34.83958° E and borehole JJ-02: 60.5 to 60.20 m, 80.1 to 80.8 m depth, coordinates 15.30666° S, 34.84301° E) were selected from the gold bearing mineralized quartz veins from the Manondo-Choma gold prospect for XCT and correlative microscopy analyses. Three dimensional structures and semi-quantitative mineral distributions were evaluated using XCT and this was augmented with textural, mineralogical and chemical imaging using Scanning Electron Microscopy (SEM) and optical microscopy. Gold grades within the core samples were quantified using standard fire assay protocols [26].

2.1. High Resolution X-Ray Computed Tomography (XCT)

In order to understand the distribution of gold mineralization in mineralized drill core samples, four segments of the core sample (45 mm diameter; lengths respectively: 15, 3, 5 and 7 cm) were scanned using the Electric Phoenix VTomeX L240 micro X-ray Computed Tomography scanner system at the Central Analytical Facility (CAF), Stellenbosch University (South Africa), manufactured by General Electric Sensing and Inspection Technologies/Phoenix X-ray (Wunstorff, Germany). The XCT facility is described in more detail in [27]. To optimize scanning of gold-sulphide ores, the scanning parameters were set to 100 kV and 100 μA and the X-ray beam was filtered using a 0.5 mm Cu filter. Images were acquired using a dwell time of 500 ms. Each scan took about 4 h and the resulting model had a voxel size of 35 μm. Furthermore, a small subsample (dimensions 5 mm in diameter) cut from the original core sample JJ01 was also scanned at a high resolution using phoenix Nanotom S nanoCT scanner, manufactured by Phoenix X-ray (Wunstorff, Germany), the scanning parameters were set to 150 kV and 200 μA and the X-ray beam was filtered using a 0.5 mm Cu filter. Images were acquired using a dwell time of 500 ms. The resulting model had a voxel size of 10 μm.
These models were reconstructed using a filtered back projection algorithm built into the GE Datos 2.1 reconstruction package [27]. Subsequent data evaluation and visualization was conducted using Volume Graphics VGStudio Max 3.3, Heidelberg, Germany [28].

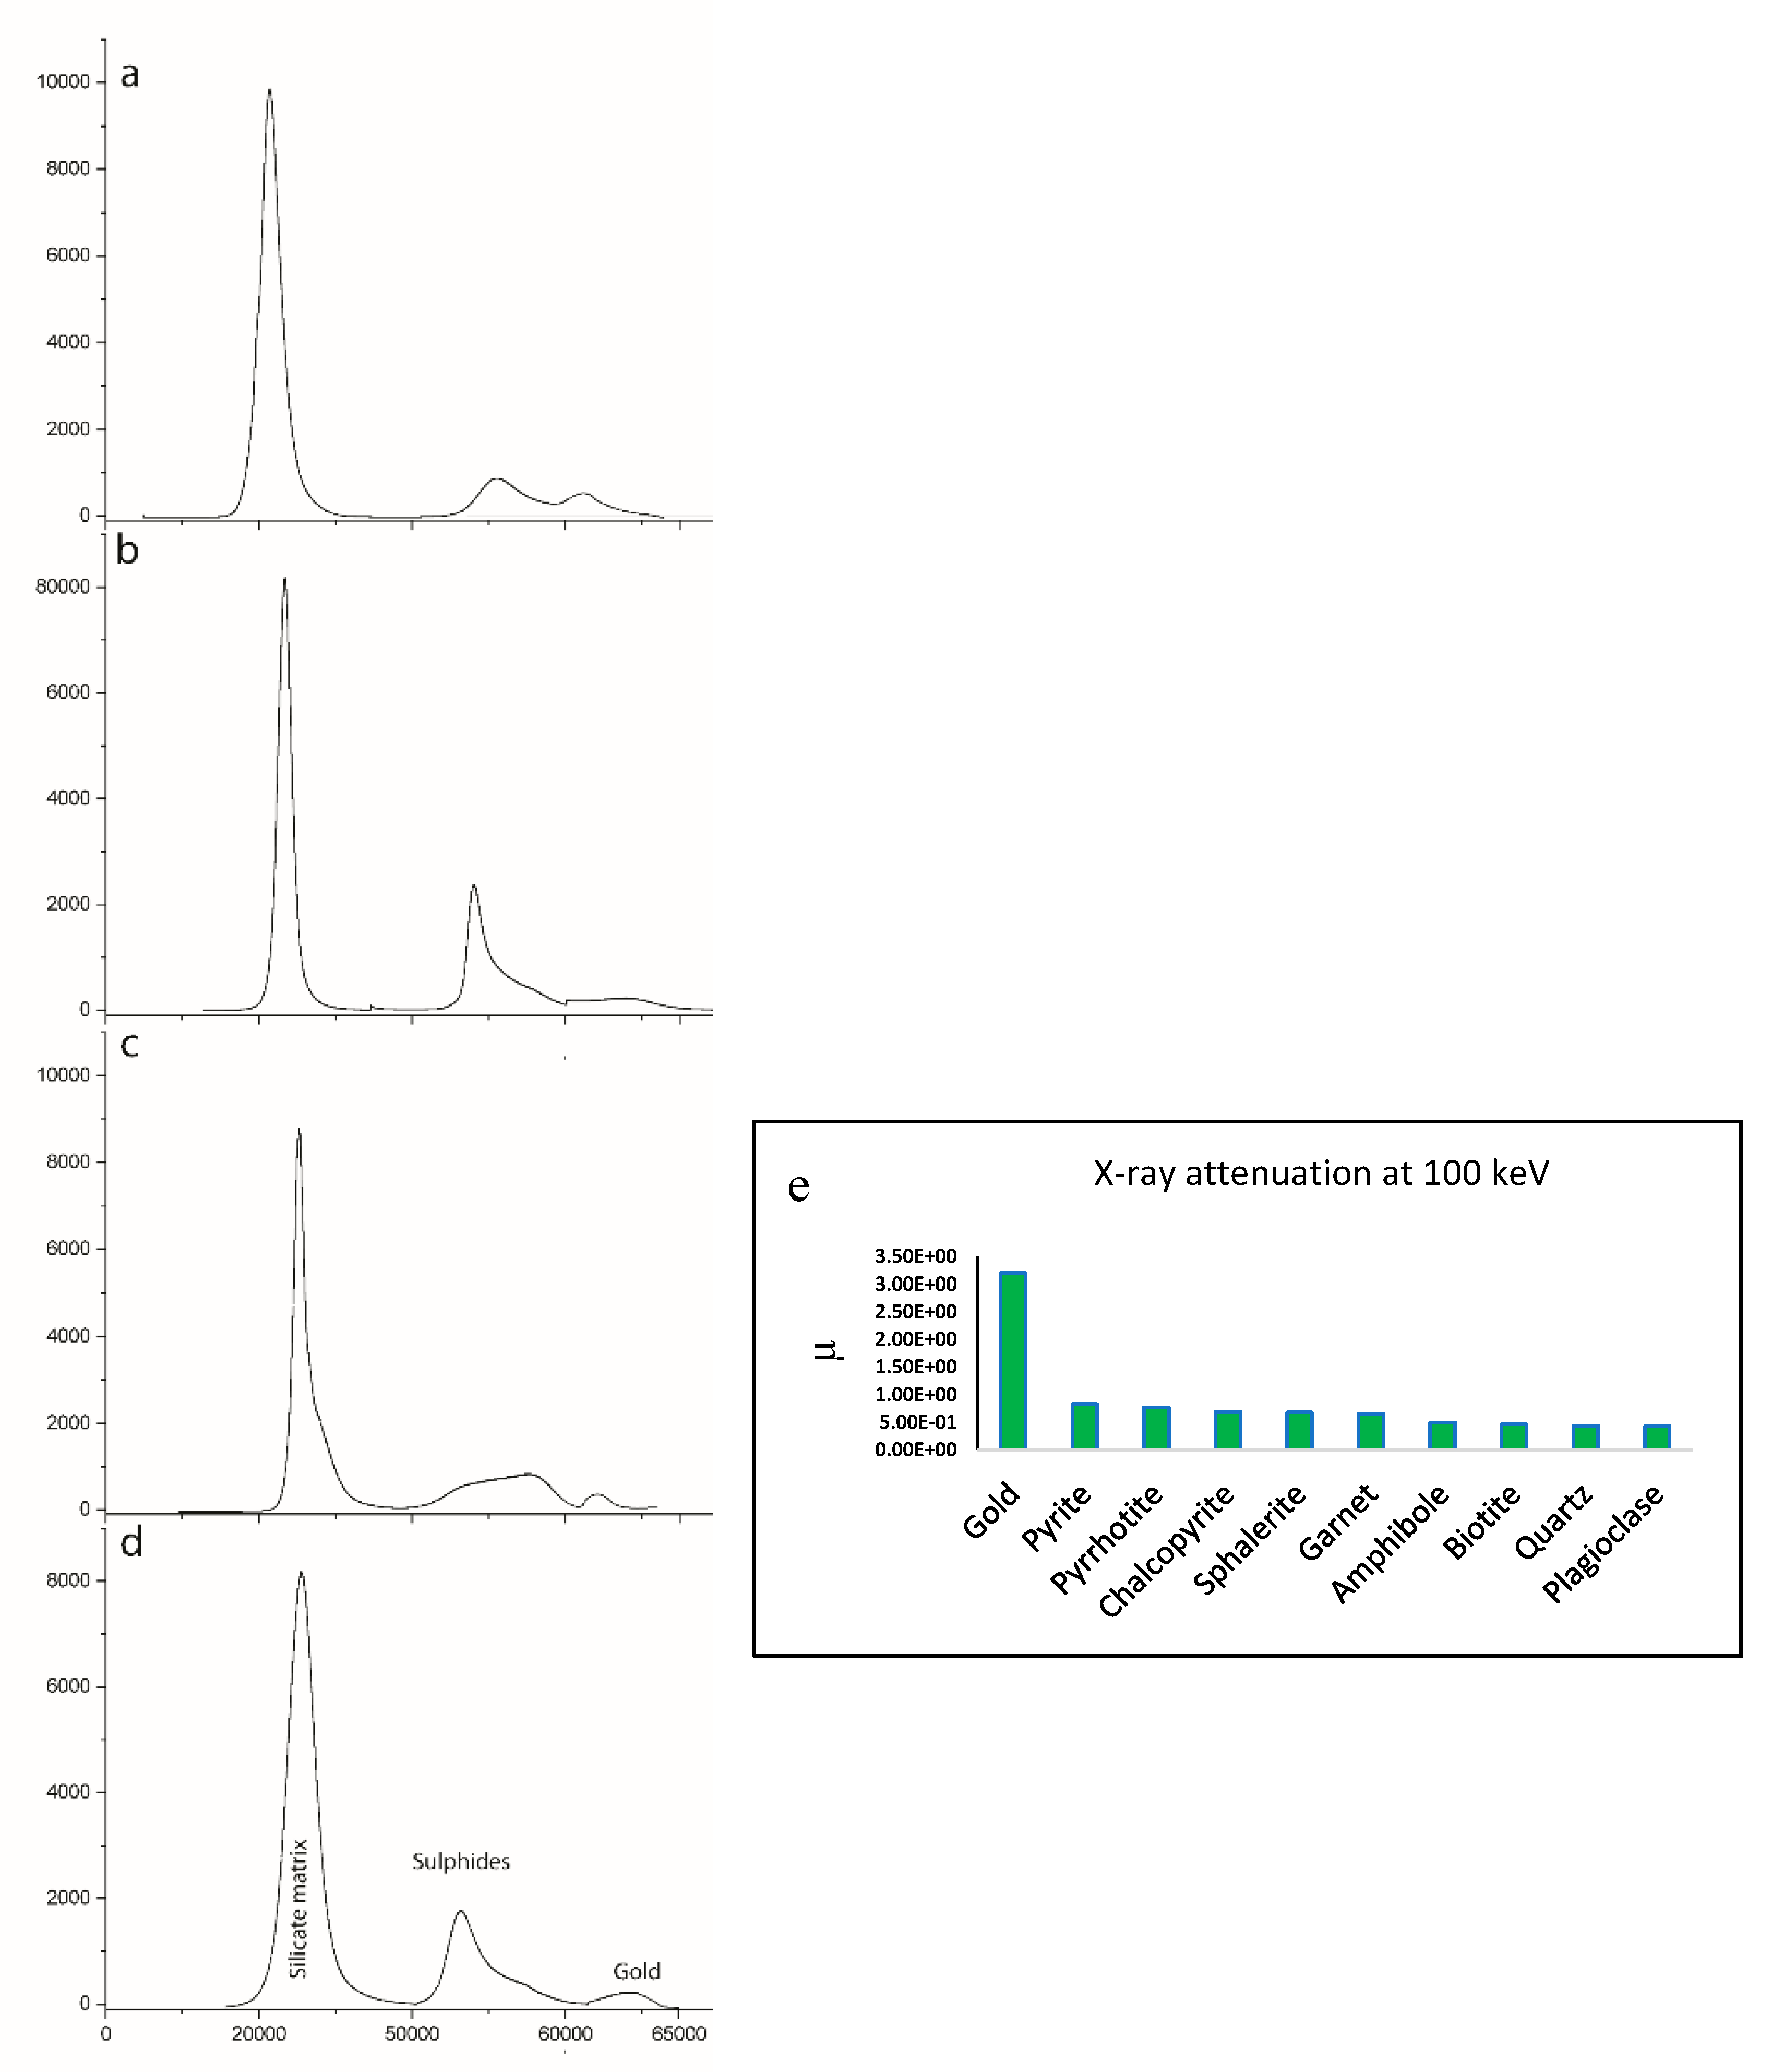
2.1.1. The XCT Thresholding Procedure for Gold in the Core Samples.

Thresholding is a process of material segmentation in X-ray computed tomography [16], in which materials or features of interest are mathematically separated from a background by distinguishing XCT model voxels according to threshold grey-scale values. To distinguish between voxels that represent gold, voxels that represent sulphides and voxels that represent matrix silicate minerals, we employed the global segmentation technique reported in [24]. Briefly, the global segmentation operation evaluates the grey-scale histogram of the entire core sample, identifies the main peaks in the histogram and defines the vertical segmentation line at the grey-scale value that marks the dip between the adjacent peaks. However, this method has a limitation of point spread function (PSF) [29]. Therefore, this threshold value is subsequently refined using a local threshold gradient search, in which the VGStudio Max 3.3 software identifies the sharpest change in grey value around the initial region of interest [24].
Figure 1 documents the grey value histograms for samples JJ01, JJ02, JJ04 and JJ05, wherein the automated global and local segmentation thresholding techniques have defined three main peaks. Based on the mineral densities and model mineral X-ray attenuation coefficients for the minerals that we have identified in our core samples (Table 1), we assume that the left peak denotes the less dense bulk silicate mineral matrix, the middle peak represents the sulphides, and the right peak denotes the much denser gold. Gold grains were defined using the minimum grey value threshold of 59,868. The peak of gold shifts a bit among the samples, but we still use the same threshold value for all the samples because the variation is not much. Sulphides were defined using the minimum threshold of CT number 49,774. These histogram-derived threshold values represent mathematical transformations of the original X-ray data, which were collected across 16 bit grey values. Because of the closeness between X-ray attenuation coefficients between the different sulphide minerals (Figure 1e), the XCT grey value alone could not distinguish between the different sulphide phases. The validity of these peak assignments was confirmed by comparing the grey value distributions in XCT image slices to correlated polished surfaces that were evaluated using optical microscopy and scanning electron microscopy (SEM). Notably, the SEM images revealed that many of the gold grains were much smaller than the 35 µm XCT scanning resolution. This partial volume effect is one reason for the broadness of the gold peaks (Figure 1), and although these partial volumes still allow identification of where gold is preferentially sited (by raising the voxel grey value), it does mean that the XCT-based approach should be acknowledged as being semi-quantitative. Using the thresholded data, we could visualize mineral grain size distribution and textures in 3D space. Furthermore, the thresholded data enabled us to generate volumes for each of the mineral phases (which were then used to calculate masses by considering known densities (Table 1)).

2.1.2. Calibration of the XCT Thresholding Procedure for Gold in the Core Samples

To empirically verify that the small peak is indeed gold and is not confused with other minerals, gold grains identified in XCT (brightest and most dense spots) were intersected and proved in reflected light microscopy. We cut the core at an appropriate location and made thick sections. Reflected light microscopy identifies ubiquitous gold grains within the core samples, which proves that the dense minerals identified in XCT are indeed gold (Figure 2). Furthermore, in Figure 2c, the gold grain identified in XCT is proved in the reflected light microscopy in Figure 2d. This empirically proves that the dense minerals found in our samples are gold. In addition, we extracted grey values representing 100% gold, grey values representing 100% sulphides and grey value representing 100% silicates. Extracted XCT grey values for gold brightest spot grains range in 61,586–65,000, falling within the small peak on the histogram; those for sulphides range in 50,000–59,000, falling within the sulphide peak; and those for silicates range in 1600 and 49,771, falling within the silicate peak. This shows that our segmentation method is correct. However, grey values obtained from different scanners may differ, which would make comparison of the data difficult. To standardize this, grey values need to be correlated with Hounsfield units. This can be achieved by plotting the linear attenuation coefficient of the minerals in the core samples against grey values to provide a linear fit and a regression equation. The linear attenuation coefficient for each mineral at 100 keV energy can be converted to CT numbers’ Hounsfield units (HU) using the equation HU = (μ material − μ water)/(μ water) × 1000, where μ material = linear attenuation coefficient of material and μ water = linear attenuation coefficient of water. This can make the data comparable and has been demonstrated by the authors in [33].

2.2. Thin and Polished Section Photo Montages

Based on the gold distribution information provided by XCT data, we physically cut the cores samples at appropriate positions to intersect the identified gold and made thin and thick sections. The appropriate surfaces were polished and subjected to reflected and transmitted light microscopy. Thin and thick sections were described using a Nikon Eclipse E 200 petrological microscope at Stellenbosch University; digital photomicrographs were captured and stitched to make image mosaic of the thin and thick sections using PT GUI software. The 2D optical microscopy image was compared with the 3D XCT image for a specific region of the samples. The XCT data and microscopy data were aligned manually by visually aligning prominent features using commercially available Volume Graphics software [28]. Correlative microscopies in other geoscience studies (e.g., fluorescence microscopy + SEM [34]) have proven to be more precise and can expose the physical and chemical character of ore minerals at a better spatial resolution and analytical precision [35].

2.3. SEM Mapping

Scanning Electron Microscopy combined with an Electron Dispersive Spectrometer (SEM-EDS) was utilized to provide further insights into the mineralogy, textures and distribution of gold in the evaluated samples. Polished blocks, previously evaluated using reflected light optical microscopy, were coated with carbon to prevent localized charging and any resultant distortions or reflections of the electron beam. The SEM/EDS analyses were conducted at the Electron Microscopy Unit of the Central Analytical Facility (Stellenbosch University, South Africa) using a Zeiss EVO MA15VP Scanning Electron Microscope. SEM/EDS analyses were carried out in a nitrogen atmosphere at pressures from 65 to 96 Pa, voltages from 20 to 30 kV, working distance for EDS analyses of 8.5 mm and magnifications ranging between 1000× and 5000×.

2.4. Fire Assay

Fire assay analyses were conducted on subsamples of each of the cores that were scanned using XCT. Each subsample sent for fire assay was sectioned both physically and in the corresponding XCT reconstructed model. This ensured that the assayed gold grades could be accurately compared to calculated gold grades, which were derived from the XCT gold volumes generated after the thresholding procedure described in Section 2.1.1. The remaining core sample was reserved for future analytical work. Fire assay analyses were conducted at the ALS mineral services laboratory (Johannesburg, South Africa). Gold was assayed using fusion process at temperatures of 1200 °C to obtain the lead button that was then subjected to cupellation. Full details for this analytical technique are reported in reference [26].

3. Results

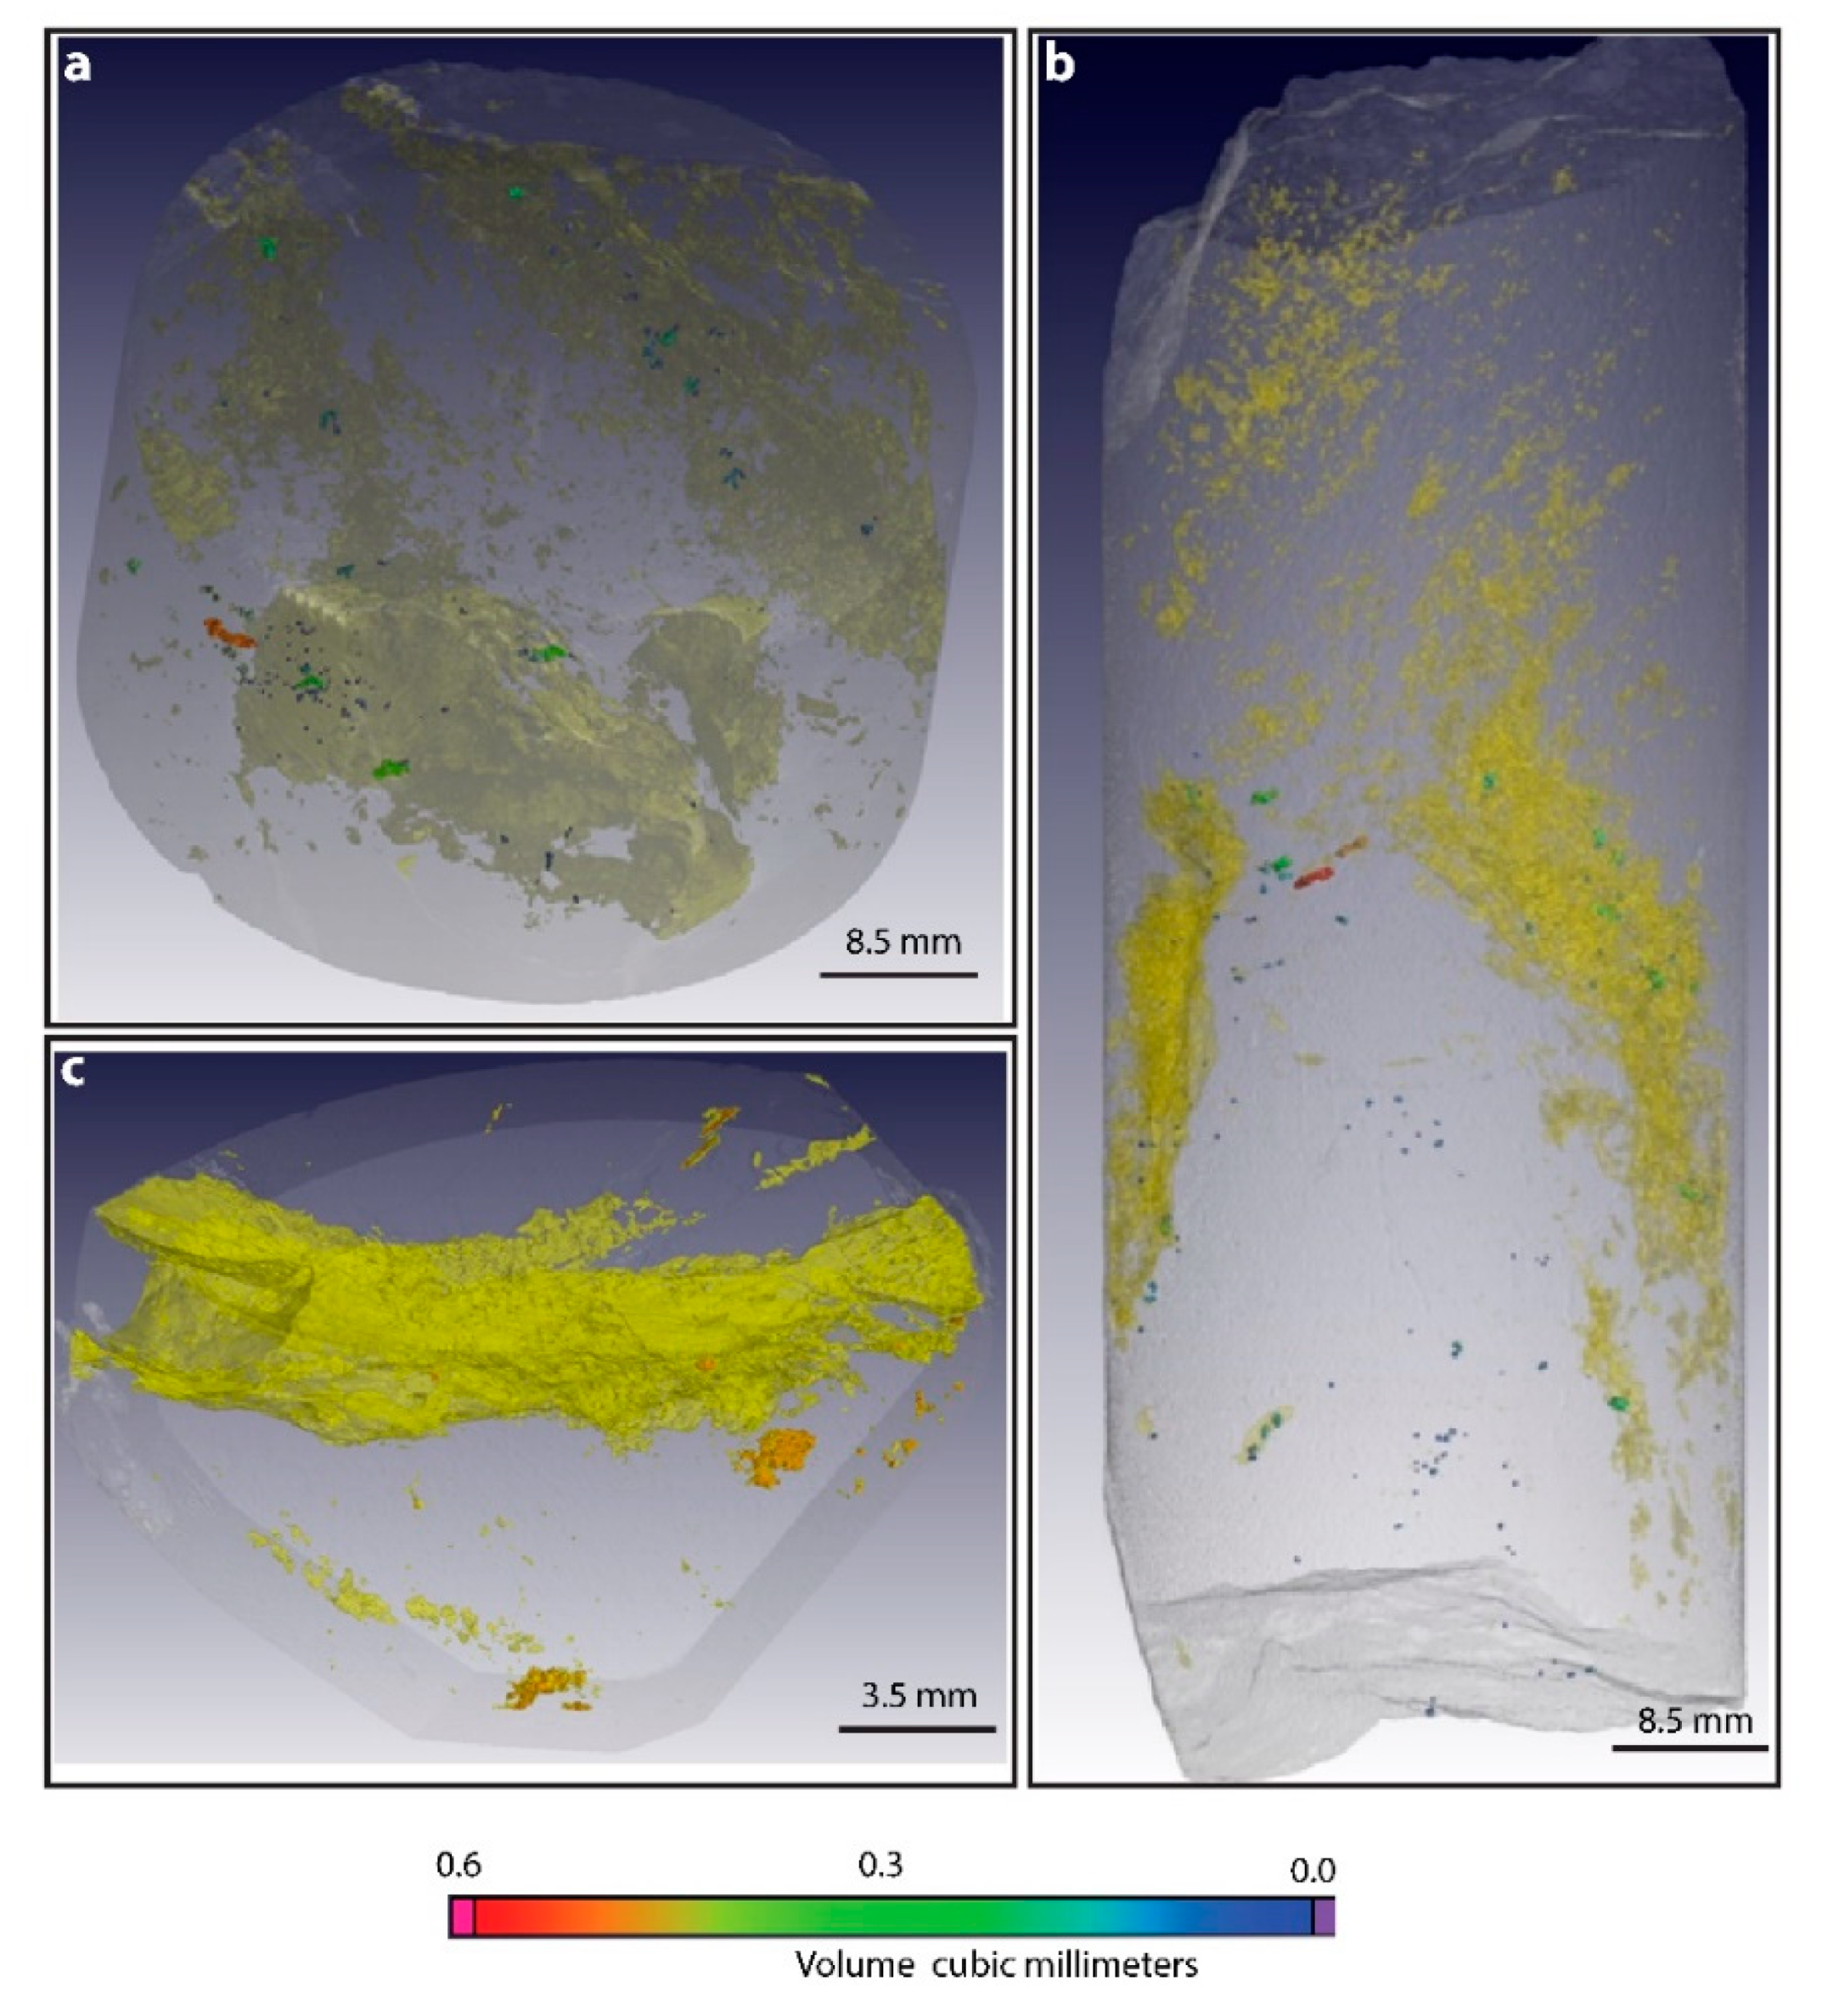
3.1. Thresholding and Quantification using XCT Data

The histogram of the measured grey values (Figure 1) provides a clear indication that the core sample contains mineral material from three markedly different density (or more correctly; X-ray attenuation coefficient) fractions viz. the silicate matrix, the sulphide paragenesis, and a distinctly high density material that we assume to largely represent gold. Other mineral phases that could be present with such high X-ray attenuation coefficients include galena, barite and native silver; however, none of these minerals were identified in the follow-up petrographic investigations.
The silicate mineralogy is quantitatively dominant throughout the core samples evaluated and have grey values ranging between 1600 and 49,771. Detailed interrogation of the XCT data revealed that we can see foliation within the silicates (Figure 3a) and pick out some garnet porphyroblasts (Figure 3b). Garnet porphyroblasts (density 3.93 gcm3) have relatively high grey values in the range 42,000 to 47,000, which are close to the grey value range expected for sulphides (Table 1). Thin sections made from the core prove the presence of garnet (Figure 3c). Due to the closeness of garnet grey values and those of sulphides, there could be a possible overlap of garnet with sulphides’ peak. Immediately adjacent to the bright sulphides vein, there is a change in grey values, which may be an indicator of hydrothermal alteration (Figure 3b), followed by a dark silicate matrix with grey values less than 20,000. From the silicate matrix, we can see three phases, garnets, hydrothermally alteration adjacent to the vein and the dark silicate minerals that cannot be differentiated due to close density ranges. From microscopy, these dark silicate minerals are quartz, feldspars, amphiboles and biotite (Table 1).
The sulphide mineral paragenesis is represented in the XCT data by grey values ranging between 49,774 and 59,868. From reflected light microscopy, this assemblage includes minor amounts of chalcopyrite, sphalerite and pyrrhotite, with pyrite as the dominant (>80% modal proportion among sulphide minerals) sulphide phase. The density for these sulphides range between 4.1 and 5.01 g/cm3 (Table 1), and it is thus, not possible to discern between the different sulphide minerals using XCT alone (highlighting the need for correlative microscopies in order to derive additional detailed mineralogical information (Section 4.2)). In the core samples evaluated, the grey values representing the sulphides are generally distributed along planar features which reflect the main vein network, and which in turn is structurally controlled in response to the regional stresses experienced by the geology during its deformational history. By considering the number of voxels ascribed to sulphide minerals through our thresholding approach and by deriving a weighted average density for the sulphide paragenesis, the mass of sulphide could be estimated for each of the core samples. These estimated masses ranged between 1.15 and 5.3 g (Table 2).
Gold in the core samples was identified by using a minimum grey value threshold value of 59,868. This represents the brightest pixels in the XCT images (Figure 4), since gold has the highest X-ray attenuation coefficient of all the minerals identified in the cores (Figure 1e). The presence of gold in our samples was confirmed using reflected light microscopy, Scanning Electron Microscopy (Figure 2 and Figure 3d), and traditional fire assay. Voxels representing gold were predominantly found in association with the sulphides in the vein network, although a small proportion of these voxels were also located in the silicate host rock, particularly in close proximity to the vein network (Figure 4a, b). The identified gold grains ranged in size between less than 0.14 to 0.7 mm in diameter, and a calculation based on the volume of the gold voxels and the known density of gold (19.32 g.cm−3) estimates that the mass of gold in each sample ranges between 0.095 and 0.25 g, corresponding to a calculated gold grade of between 0.03 and 0.14 ppm (Table 2).

3.1.1. Fire Assay to Calibrate XCT Threshold Values

Fire assay analyses were conducted to confirm the presence of gold in our samples and to calibrate the calculated gold grades derived from XCT data. The fire assay analyses were conducted on quarter cores derived from the original scanned cores, and these data compared to calculated gold grades for the corresponding quarter of the core, which was sectioned digitally from the 3D XCT model (Figure 5). Fire assay data reveal that the gold grades for the respective cores in ppm are 0.03 (JJ1), 0.02 (JJ2), 0.01(JJ4) and 0 (JJ5), (Table 3). The fire assay shows a strong and positive linear relationship with the gold grades calculated from our XCT thresholding protocol (Figure 6a: y = 0.5888x − 0.0011; r2 = 0.5). The linear best-fit line has a slope that is less than the 1:1 line, indicative that the XCT protocol generally overestimates the mass of gold present in the core samples.
The equation of the best-fit line does however provide a useful internal calibration for the XCT data. Figure 7 compares the distribution of gold from the XCT model data using the original threshold value derived from the global segmentation protocol 59,868, to a threshold value that has been selected to ensure that the XCT calculated gold grades fall on the 1:1 line with fire assay gold grades. This exercise reveals that calibrating XCT values based on fire assay to the threshold grey value in our case, of 63,000, other dense minerals disappear, and gold is only present in the vein and not necessarily in the wall rock (Figure 7b) and is ~1:1 with fire assay (Figure 6c, Table 3), disregarding the JJ05 sample in which the assayed gold grades were below the detection limit. If we take grey values below 63,000, we have more gold grains making XCT to generally overestimate the mass of gold present in the core sample (Figure 7a).
A final test was conducted on the calibrated XCT core models in order to comment on the in situ nugget effect that may be induced by only assaying a quarter core. Quarter cores have relatively high gold values than the whole core due to the nugget effect (Table 3), except sample JJ04. The nugget effect is attributed to the heterogeneous distribution of gold grains in the core samples. Some regions of the core are rich in gold and others are not. This is so because vein systems typically contain both barren and mineralized segments with gold grade varying laterally, vertically and across the core. Furthermore, finer grained gold mineralization usually has a high geological nugget effect [36]. Hence, some of the quarter cores have high gold values compared to the whole core (Table 3).

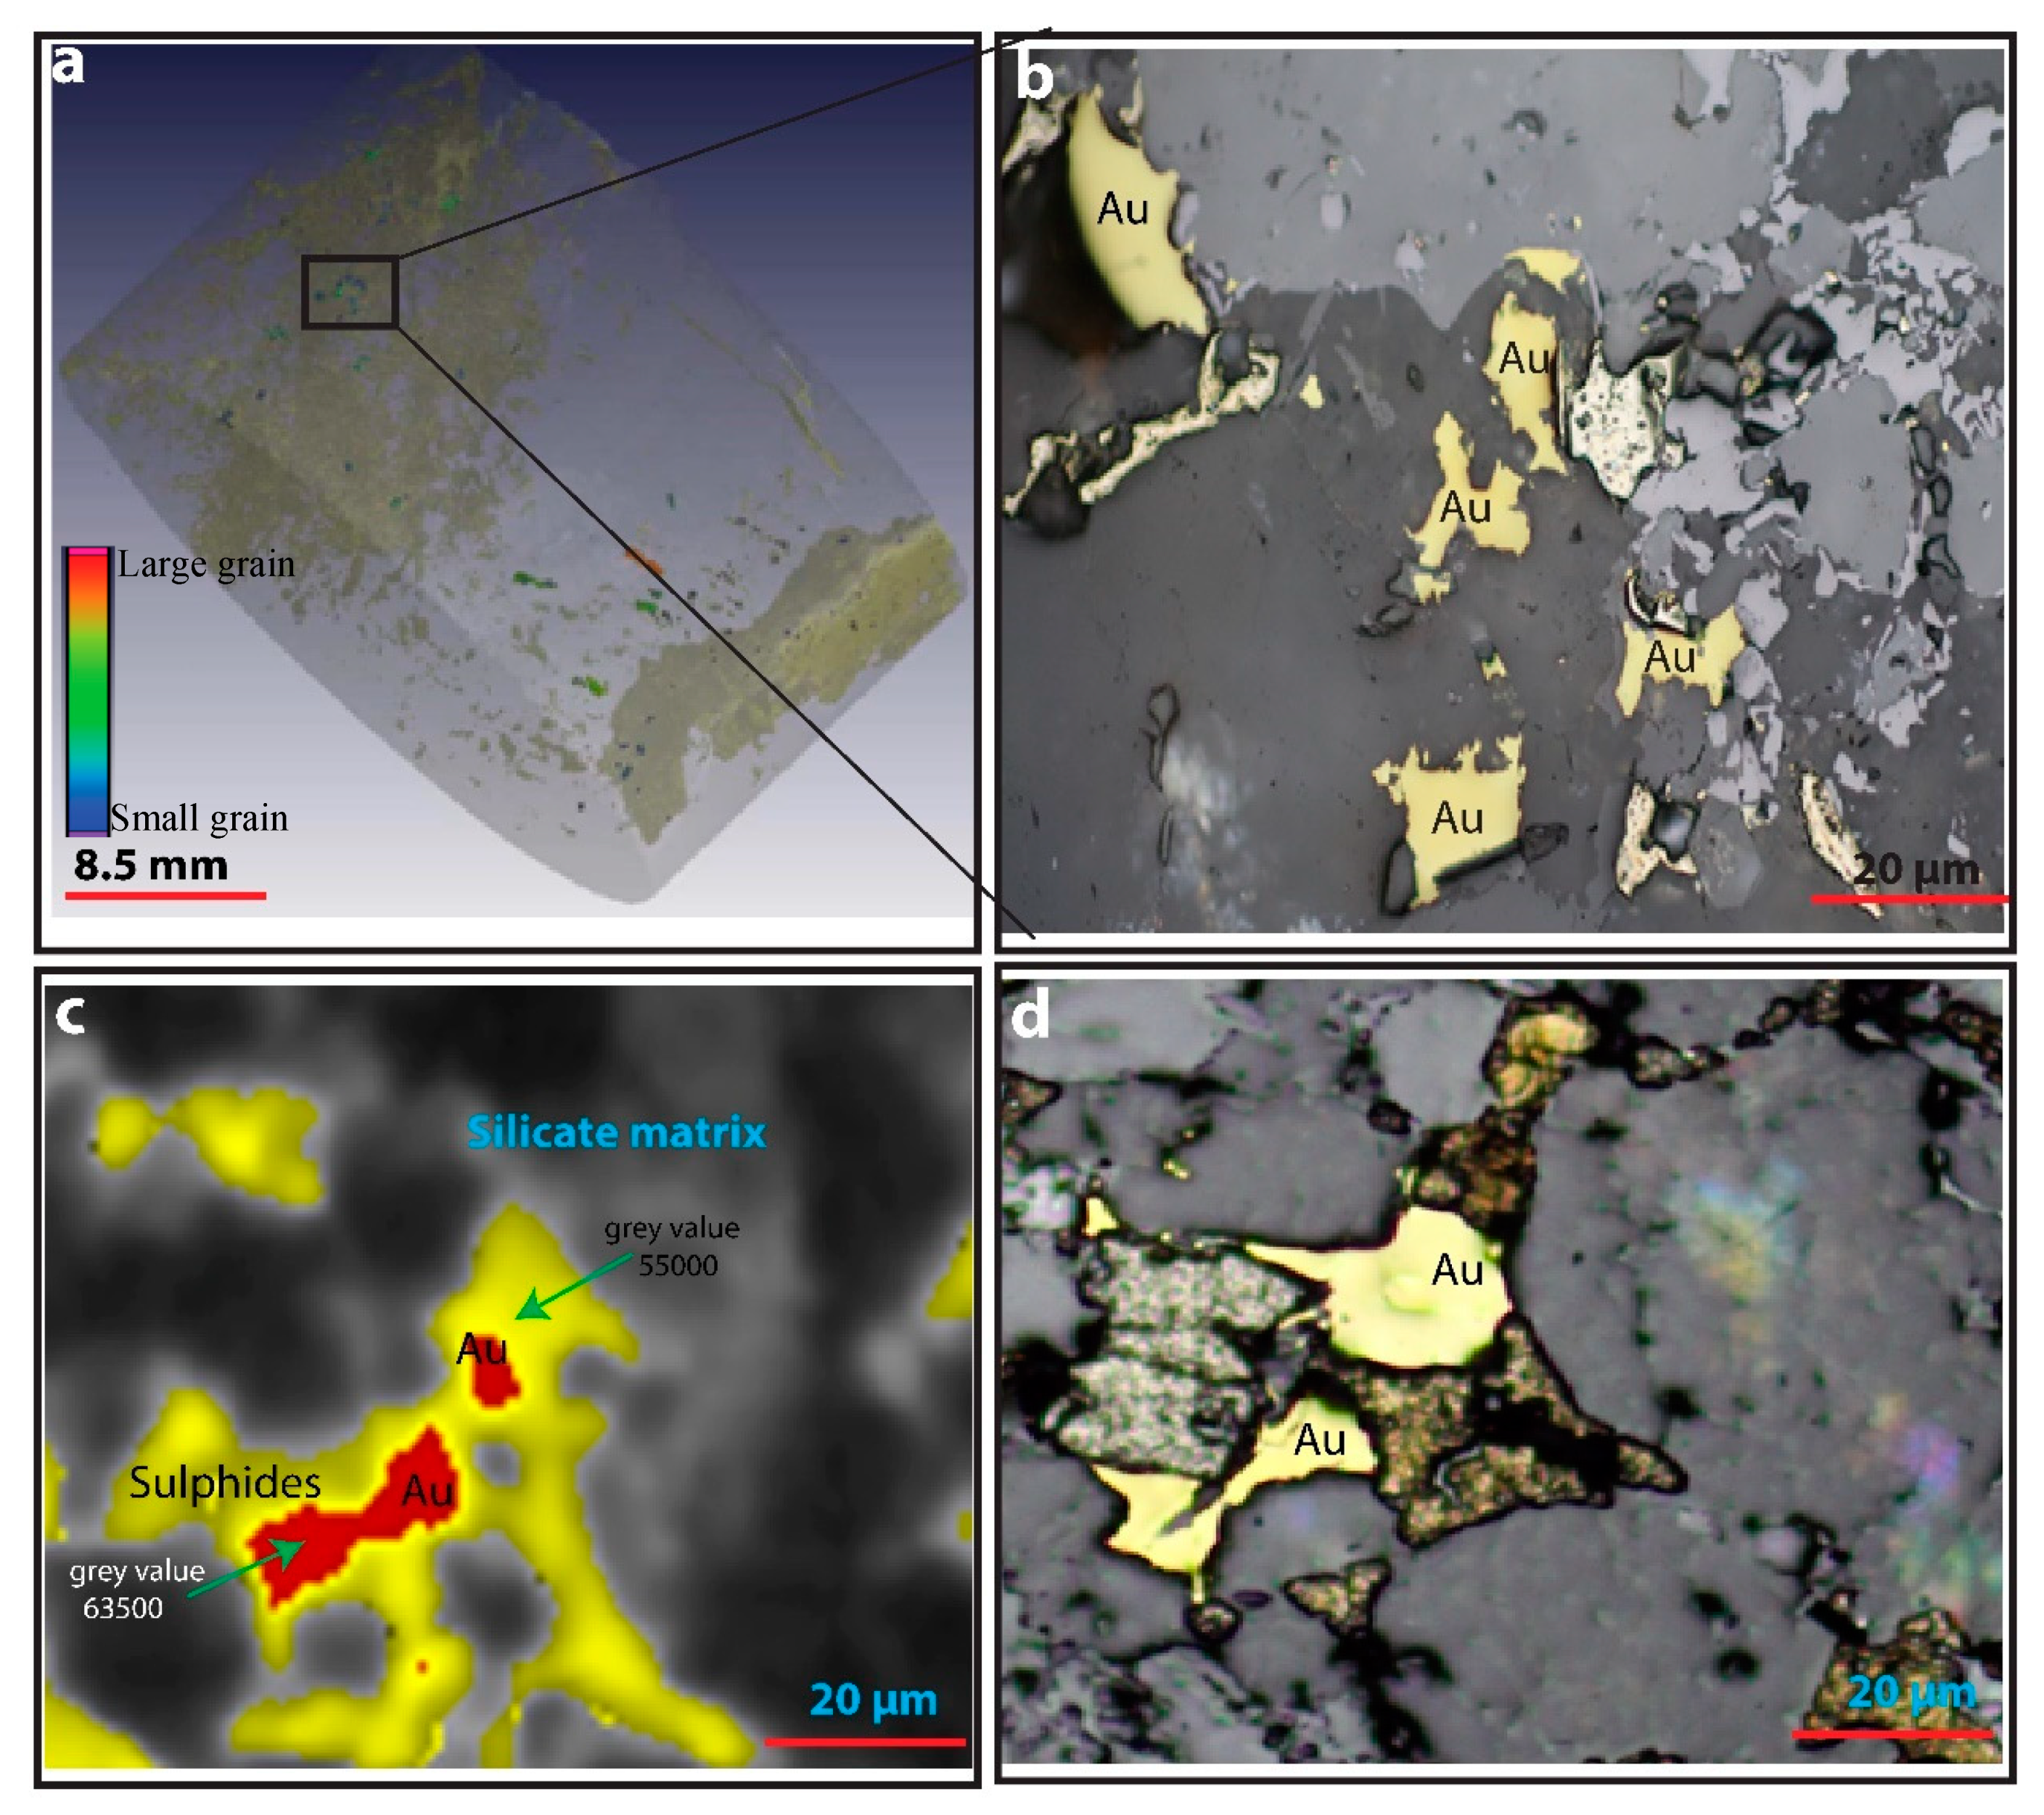
3.2. Textural and Mineralogical Correlations between 2D and 3D Study Approaches

The preceding section highlights the utility of XCT towards understanding and semi-quantitatively analysing gold distributions in three dimensional reconstructions of exploration borehole core samples. When used independently however, this approach fails to discern between different sulphide minerals in the assemblage and poorly resolves microstructural features that may have important implications for the exploration efforts. It is thus imperative to combine 3D XCT analyses with conventional 2D microscopies in order to derive the full value out of a given exploration drilling program. Figure 8 compares a montage of 2D optical (reflected light) microscopy images with the corresponding image slice extracted from an XCT model. The correlation was conducted manually by visually aligning prominent features using the commercially available Volume Graphic software. An artefact of this imperfect overlap is depicted in Figure 8a, in which a notable gold grain is intersected in the image slice but was either slightly below the polished surface or was above the polished surface and was subsequently cut and polished away. Indeed, when preparing polished sections of finely disseminated gold mineralization, intersection of discrete gold grains can only be fortuitous if cutting and polishing is not guided by prior XCT analysis.
Figure 8b further contrasts the level of mineralogical detail that is achieved in the XCT image slice versus the petrographic montage. The XCT model provides a three-dimensional overview of the sulphide spatial distribution, reveals low-level textural information (e.g., mineral stretching along the shear plane is clearly evident), and enables a truer representation of the mineral size distributions (2D approaches provide apparent mineral sizes). However, it clearly lacks in its ability to discern between different sulphide mineral phases. In comparison, the 2D reflected light petrographic montage enables that the individual sulphide mineral phases can be identified, their paragenetic relationships can be more deeply investigated, and additional microstructural details (e.g., mica fish, rotated porphyroblasts) can be used to augment and enrich the understanding of the structural controls on the mineralization. Some disadvantages of the 2D petrographic study approaches include that they are destructive to the original core sample, the samples require preparation (i.e., cutting and polishing may be time-consuming), selection of sub-samples for thin/thick sectioning may introduce unconscious bias into the ultimate dataset, true mineral sizes cannot be discerned, and the 3D kinematics associated with the structural controls cannot be fully studied. These results (summarized in Table 4) clearly highlight that there is extra information that can be obtained from microscopy that cannot be obtained from XCT, and vice versa. Hence, from an optimized exploration perspective, it is important that these techniques should be used correlatively.

4. Discussion

The use of XCT in combination with microscopy provides an excellent tool for understanding gold mineralization, which is often nuggety and difficult to study because of its ppm-level grades. Although the application of this combined approach is not yet widespread, this approach overlays complementary datasets from 2D and 3D analytical protocols, thereby allowing a better and more comprehensive understanding on the distribution and structures controlling gold mineralization. In order to investigate the feasibility of the combined approach and its practical utility, we consider an example from the Manondo-Choma gold prospect (southern Malawi).

4.1. Advantages of Correlative Approaches to Exploration: Case Study from the Manondo-Choma Mineralization (Malawi)

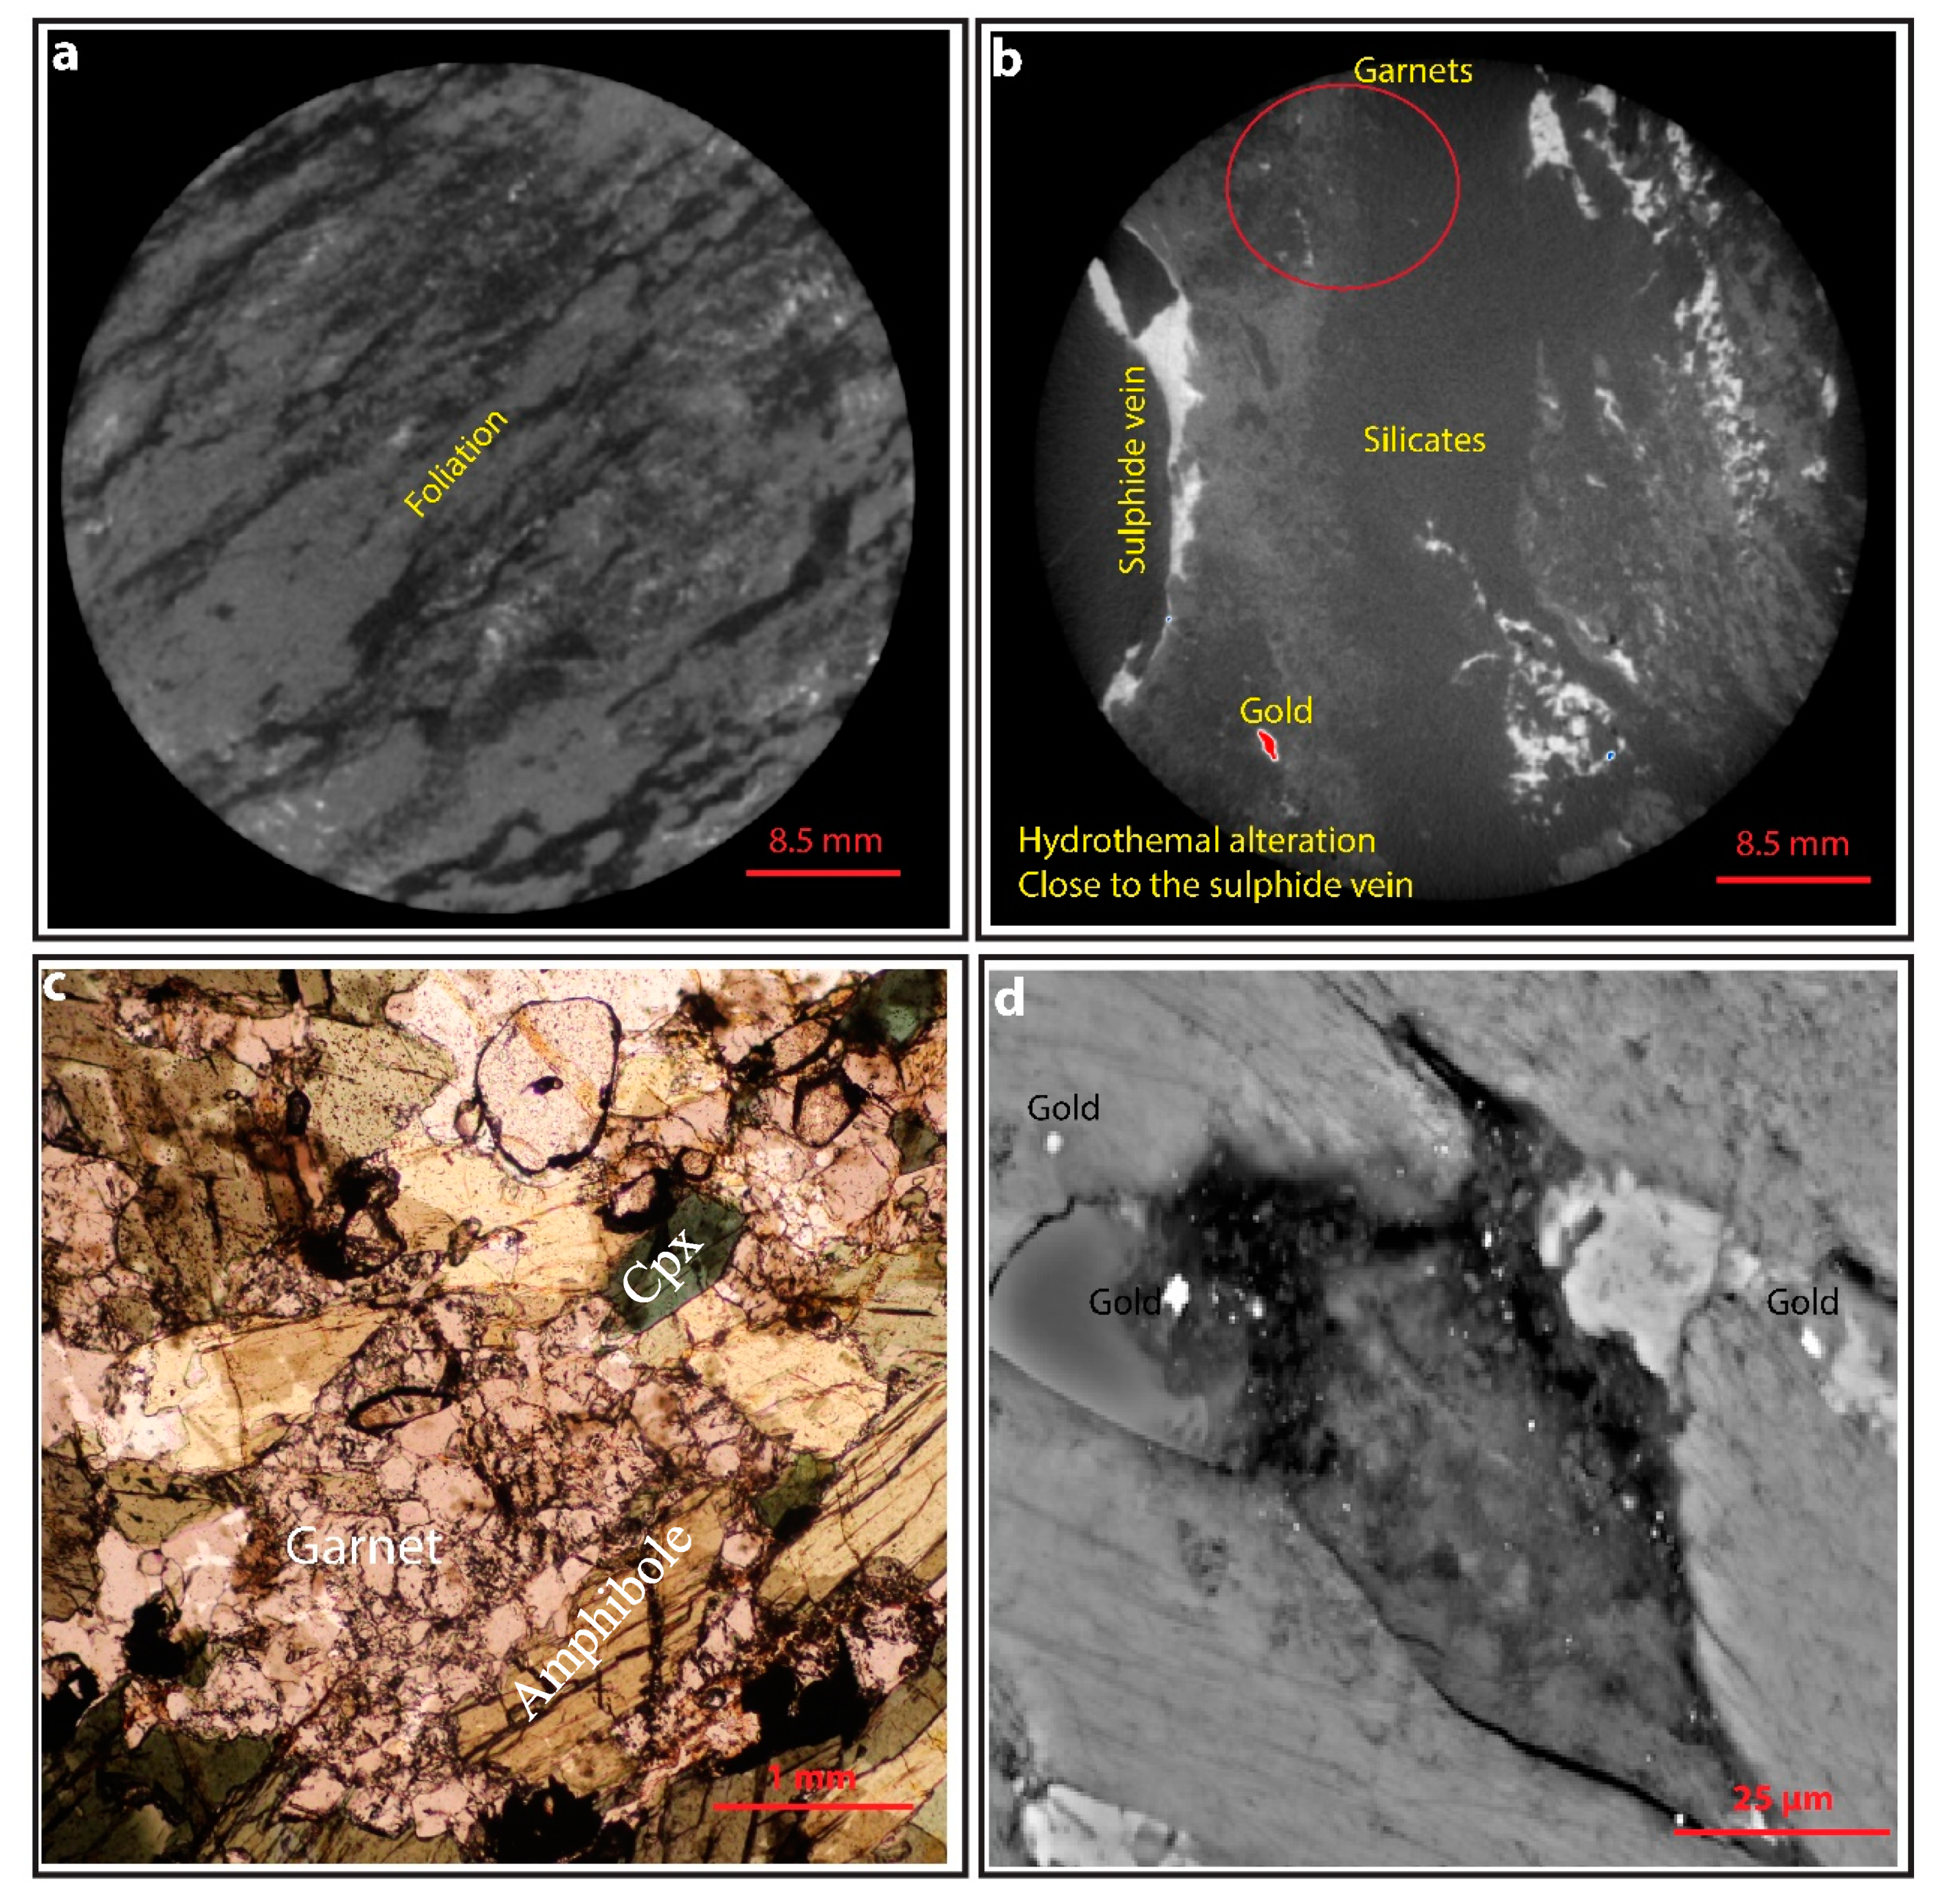
4.1.1. Geological Context

The Kirk Range is a medium- to high-metamorphic grade mobile belt which is related to the Southern Irumide orogeny and which is located in south-central Malawi [37]. It is situated approximately 40 km north-west of Blantyre and lies between latitudes 15.30° S to 15.31° S and the longitudes 34.82° E to 34.85° E, near to the western border between Malawi and Mozambique. The major lithologies in the area comprise a suite of NE trending gneissic rocks that underwent amphibolite-granulite facies metamorphism [38]. These lithological units are characterized by polyphase deformation showing evidence of reworking possibly by the pan-African orogeny (800–550 Ma) [39].
Gold mineralization at the Manondo-Choma prospect has recently been described by the authors in [38]. Briefly, the gold is hosted predominantly in biotite schists and gneisses and is associated with a sulphide mineral paragenesis. Regional structures as well as mineralized quartz-sulphide vein sets exhibit a NE–SW trend, which is consistent with the deformation fabrics associated with the southern Irumide orogeny [40,41,42]. Textural and microstructural observations reveal that the vein sets have experienced subsequent deformation and overprinting, which has likely led to transposition of the primary gold mineralization on a regional scale [38].

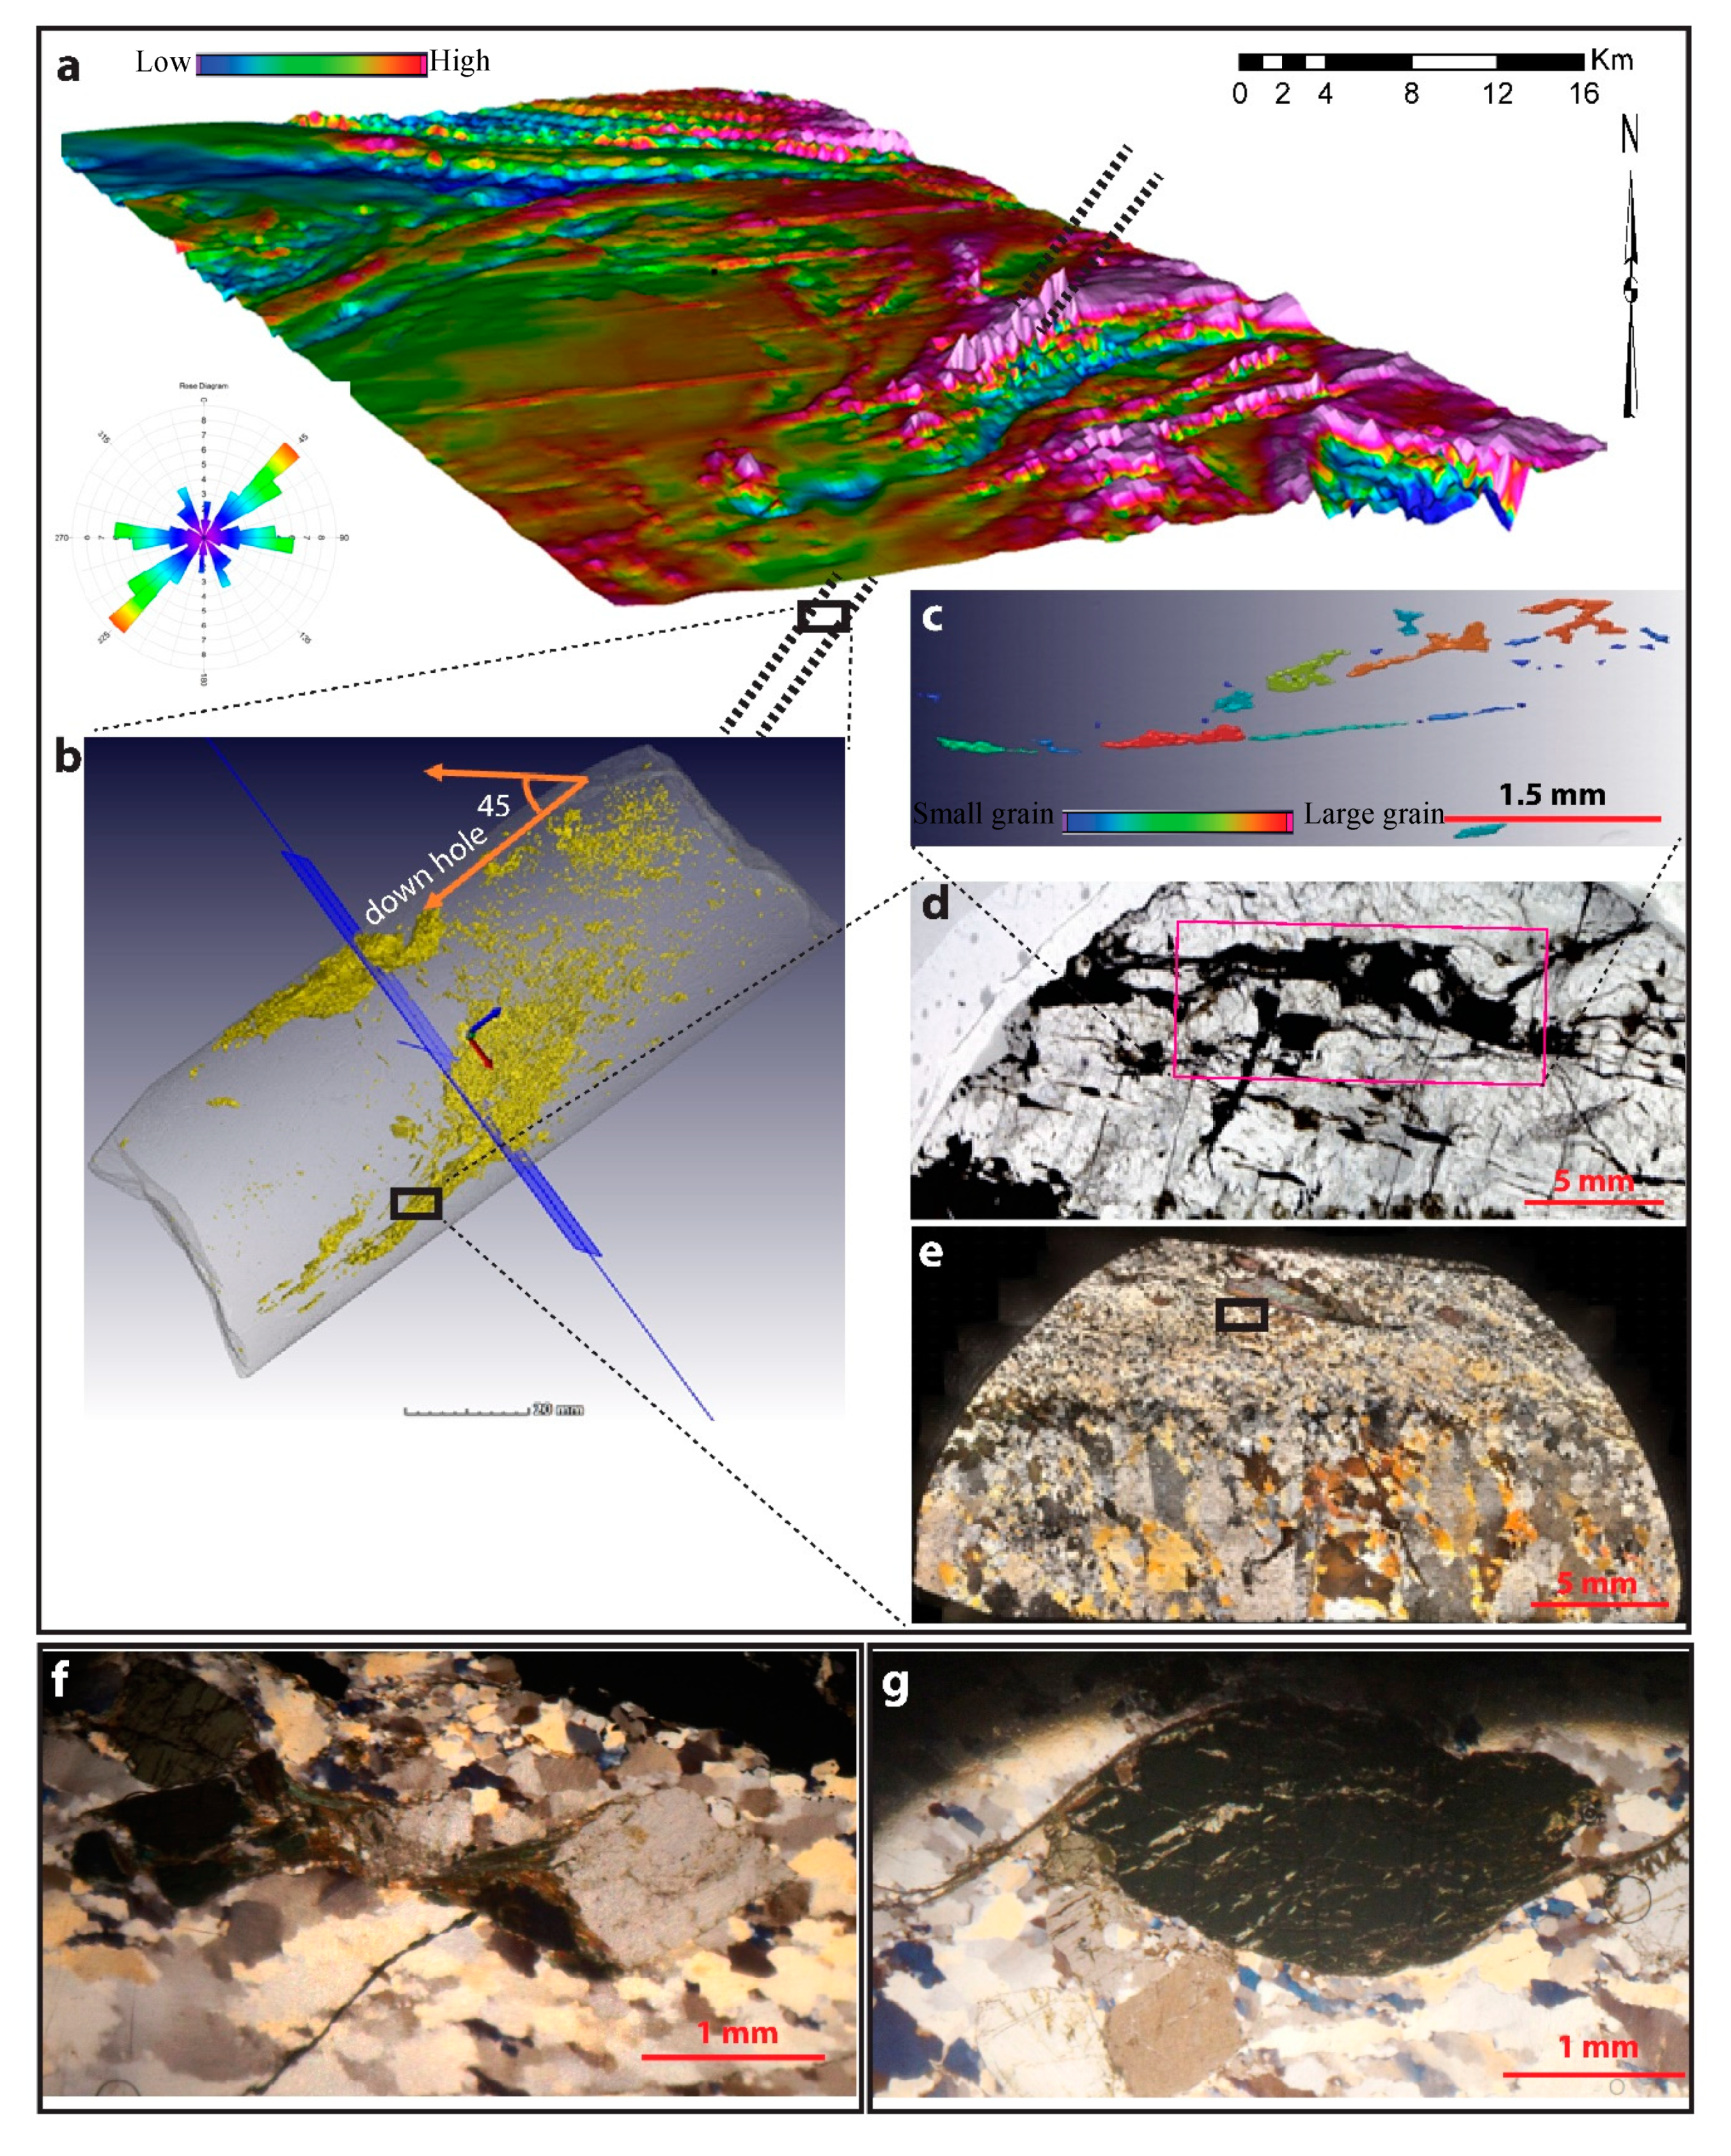
4.1.2. Correlated 2D and 3D Insights into Gold Mineralization at the Manondo-Choma Prospect

Four segments of drill core were selected for detailed scanning and modelling using XCT and correlative reflected and transmitted light microscopies. The XCT reconstructions reveal that the gold is hosted primarily in sub-vertical vein structures that strike in a NE–SW direction (Figure 9b). The fine-grained gold flakes are sub-rounded in texture, range in size between 0.01 and 0.04 mm, and are typically elongated parallel to the direction of the strike of the host vein (Figure 9c). Gold grades for the different core segments range between 0.01 and 0.03 ppm from fire assay and 0.01–0.031 ppm calculated from XCT (Table 3; after corrections to account for nugget effects inherent in gold mineralization (see Section 3.1.1.)) and show good agreement with the gold grades measured using fire assay analytical protocols. The gold is strongly associated with sulphide minerals which also orientate preferentially in the NE–SW strike direction. Minor gold is also associated with the wall rock, perhaps reflecting a second-order lithological or geochemical control on the siting of the mineralization [38]. Although the XCT image slices show subtle differences in the grey values among different sulphide minerals, these grey values could not be used to unequivocally determine sulphide speciation and did not allow detailed comment on the textural and temporal relationships within the ore paragenesis.
Thus, to augment the gold spatial, size and shape distribution data, correlative 2D petrographic analyses were conducted on selected sub-samples of the core segments. These sub-samples were best selected based on prior evaluation of the 3D XCT models, whereby gold-rich regions of the core segment were targeted for the further detailed petrographic work. Reflected light microscopy revealed that the sulphide mineral assemblage is dominated by pyrite (~80% modal proportion), with the remaining 20% of the sulphides represented by chalcopyrite, sphalerite and pyrrhotite. Early formed pyrrhotite showed the strongest mineral stretching, which was parallel to both the stretching identified in the gold flakes and to the orientation of the main vein structure. Transmitted light microscopy enabled that microtextures and shear sense indicators could be identified within the silicate mineralogy associated with the vein structure. For example, 2D microscopy indicates the presence of shear in the silicate mineralogy within the vein structure defined by grain size reduction (Figure 9e) and display flow structures that indicate ductile deformation of the core (Figure 9f,g). In standard 2D petrography, this information can give insights into whether the mineralized vein experienced a dextral or sinistral sense of shear (i.e., X–Y directionality). However, by considering this information in light of the known orientation of the vein from prior XCT work, the kinematics can further constrained with reference to the Z-direction. Furthermore, the correlative approach allows the microstructures observed in polished sections to be confidently positioned in X, Y, Z space (using the known depth of sub-sampling down an orientated drill string). To advance exploration efforts, these orientated and positioned microstructural data can be pulled directly into implicit modelling software as an additional layer of information which could be readily analysed and iterated to finalize geological or grade interpretations.
The outcomes from this correlative study conducted at the Manondo-Choma gold prospect thus highlight that the gold is intimately associated with sulphide mineralization in NE–SW trending SE-dipping quartz-sulphide vein structures that show a dextral sense of shear. These structures were identified by considering the complementary 2D and 3D datasets, and the orientations are found to match those of the regional NE–SW magnetic trends identified using geophysics [32] (Figure 9a), and which are tentatively related to the southern Irumide orogeny. In addition to the value that the correlative approach unlocks for exploration at the front end of the mine value chain, it also reveals vital information that can assist during later processing and beneficiation of the ore assemblage. For example, XCT scanning provides definitive information on the size, distribution and mineralogical association of the gold, all of which can control the liberation efficiencies during minerals processing. Similarly, the distribution and semi-quantitative evaluation of the sulphide minerals (Table 2), offers a unique methodology to predict acid mine drainage capacity associated with an ore prospect, especially given that sulphide concentrations are difficult to measure using standard XRF quantification approaches [43]. Related to this, the complementary petrographic information related to sulphide speciation further has important implications for the presence of metal ‘sweeteners’ (e.g., Cu, Zn) that may add additional economic value to an ore prospect, and for the presence of any deleterious elements (e.g., As) that may require special consideration to ensure that the environmental impacts of downstream mining are minimized.

4.2. Recommendations for Further Development

The use of correlative microscopies in minerals exploration has not yet reached its full maturity, yet the example from the Manondo-Choma gold prospect clearly indicates its high potential for incorporation in routine minerals exploration workflows. This is especially pertinent for gold exploration endeavours given the nuggety distribution of the ore within mineralized vein sets. As bench-scale XCT machines become increasingly commercially available, it is anticipated that the approach will be adopted more extensively among exploration practitioners. However, in order to optimize the approach, the following recommendations apply:
-
Need for automated alignment algorithms based on optical image analysis methodologies to match 2D montages to their positioning in XYZ space. This will help as it will require minimal initial user input. The manual approach can take 4 h.
-
Need to develop software interfaces that allow XYZ positioned and orientated microstructural and mineralogical data (mapped in 3D space in XCT software) directly into common implicit and explicit geological modelling software.
-
Need to optimize voxel sizes to match fine grained gold mineralization.
-
Need to optimize the scanning parameters, or resolution of the sensors to better discern between different sulphide moieties using XCT technologies (and between gold and other dense minerals with high X-ray attenuation coefficients such as barite, galena, etc.).
-
Opportunities to develop other computed tomography techniques to provide detailed mineralogical, chemical and valence distributions in 3D space (synchrotron XRD computed tomography [44], synchrotron XRF CT [45], and synchrotron XANES CT respectively [46]).

5. Conclusions

We have highlighted a correlative approach in which 3D XCT data are combined with 2D mineralogical and chemical data to understand a complex orogenic gold mineralization. The use of XCT in combination with microscopy provides an excellent tool for understanding gold mineralization. Contextualizing 2D structural features in a 3D volume enables a deeper understanding of the structures that control mineralization and characterize the distribution of gold. Given that modern exploration efforts are targeting increasingly complex and low-grade ore deposits, the extra layers of information provided by using correlative 2D and 3D microscopies offer an exciting new tool to enhance and optimize minerals exploration workflows. It is anticipated that the approach will be adopted more extensively among exploration practitioners. Although the approach is especially well suited to gold mineralization (nuggety textures, high density and X-ray absorption coefficients of Au), it can also be applied to a range of other mineralization styles (e.g., disseminated sulphide mineralization, tungstate mineralization in skarns, etc.).

Author Contributions

Formal analysis, S.L.R. and M.T.; Supervision, B.v.d.H.; Writing—original draft, J.C. All authors have read and agreed to the published version of the manuscript.

Funding

Funding for the project was supported in part through grants to J. Chisambi (World Bank, Skills Development Project), and to B. von der Heyden (National Research Foundation of South Africa: Grant #106006, and additional support from DST-NRF CIMERA).

Conflicts of Interest

The authors declare no conflict of interest.

References

  1. Ferguson, M. World Exploration Trends 2018; S&P Global Market Intelligence: New York, NY, USA, 2019. [Google Scholar]
  2. Phillips, G. Australian and global setting for gold in 2013. In Proceedings of the World Gold 2013, Brisbane, Australia, 26–29 September 2013. [Google Scholar]
  3. Gaboury, D. Parameters for the formation of orogenic gold deposits Parameters for the formation of orogenic gold deposits. Appl. Earth Sci. 2019, 128, 124–133. [Google Scholar] [CrossRef] [Green Version]
  4. Groves, D.I. Gold Deposits in Metamorphic Belts: Overview of Current Understanding, Outstanding Problems, Future Research, and Exploration Significance. Econ. Geol. 2003, 98, 1–29. [Google Scholar] [CrossRef]
  5. Augustin, J.; Gaboury, D. Multi-stage and multi-sourced fluid and gold in the formation of orogenic gold deposits in the world-class Mana district of Burkina Faso–Revealed by LA-ICP-MS analysis of pyrites and arsenopyrites. Ore Geol. Rev. 2019, 104, 495–521. [Google Scholar] [CrossRef]
  6. Goldfarb, R.; Groves, D.; Gardoll, S. Orogenic gold and geologic time: A global synthesis. Ore Geol. Rev. 2001, 18, 1–75. [Google Scholar] [CrossRef]
  7. Grooves, D. The crustal continuum model for late-Archaean lode-gold deposits of the Yilgarn Block, Western Australia. Miner. Depos. 1993, 374, 366–374. [Google Scholar] [CrossRef]
  8. Popov, O.; Talovina, I.; Lieberwirth, H.; Duryagina, A. Quantitative Microstructural Analysis and X-ray Computed Tomography of Ores and Rocks–Comparison of Results. Minerals 2020, 10, 129. [Google Scholar] [CrossRef] [Green Version]
  9. Asadi, H.H.; Voncken, J.H.L.; Kühnel, R.A.; Hale, M. Petrography, mineralogy and geochemistry of the Zarshuran Carlin-like gold deposit, northwest Iran. Miner. Deposita 2000, 35, 656–671. [Google Scholar] [CrossRef]
  10. Pašava, J.; Svojtka, M.; Jana, Ď.; Drábek, M.; Halodová, P.; Haluzová, E. Laser ablation ICPMS study of trace element chemistry in molybdenite coupled with scanning electron microscopy (SEM)—An important tool for identi fi cation of different types of mineralization. Ore Geol. Rev. 2016, 72, 874–895. [Google Scholar] [CrossRef]
  11. Stromberg, J.M.; Van Loon, L.L.; Gordon, R.; Woll, A.; Feng, R.; Schumann, D.; Banerjee, N.R. Applications of synchrotron X-ray techniques to orogenic gold studies; examples from the Timmins gold camp. Ore Geol. Rev. 2019, 104, 589–602. [Google Scholar] [CrossRef]
  12. Butler, I.B.Ł.; Nesbitt, R.W. Trace element distributions in the chalcopyrite wall of a black smoker chimney: Insights from laser ablation inductively coupled plasma mass spectrometry (LA–ICP–MS). Earth Planet Sci. 1999, 167, 335–345. [Google Scholar] [CrossRef]
  13. Godel, B. High-Resolution X-Ray Computed Tomography and Its Application to Ore Deposits: From Data Acquisition to Quantitative Three-Dimensional Measurements with Case Studies from Ni-Cu-PGE Deposits. Econ. Geol. 2013, 108, 2005–2019. [Google Scholar] [CrossRef]
  14. Kyle, J.R.; Ketcham, R.A. Application of high resolution X-ray computed tomography to mineral deposit origin, evaluation, and processing. Ore Geol. Rev. 2015, 65, 821–839. [Google Scholar] [CrossRef]
  15. Baker, D.; Mancini, L.; Polacci, M.; Higgins, M.; Gualda, G.A.R.; Hill, R.; Rivers, M. An introduction to the application of X-ray microtomography to the three-dimensional study of igneous rocks. Lithos 2012, 148, 262–276. [Google Scholar] [CrossRef]
  16. Fatima, A.; Venkatesh, A.S.; Mukherjee, R.; Agrawal, A.K.; Singh, B.; Sarkar, P.S.; Shripathi, T. 3D spatial distribution of ore mineral phases using high resolution synchrotron micro-computed tomography (μCT) combined with optical microscopy 3D spatial distribution of ore mineral phases using high resolution synchrotron micro-computed tomography (μCT) combined with optical microscopy. Appl. Radiat. Isot. 2019, 148, 49–59. [Google Scholar]
  17. Kyle, J.R.; Mote, A.S.; Ketcham, R.A. High resolution X-ray computed tomography studies of Grasberg porphyry Cu-Au ores, Papua, Indonesia. Miner. Deposita 2008, 43, 519–532. [Google Scholar] [CrossRef]
  18. Naudé, G.; Hoffman, J.; Theron, S.J.; Coetzer, G. The use of X-ray computed tomography in the characterisation of coal and associated char reductants. Miner. Eng. 2013, 52, 143–154. [Google Scholar] [CrossRef]
  19. Elangovan, P.; Hezel, D.C.; Howard, L.; Armstrong, R.; Abel, R.L. Computers & Geosciences PhaseQuant: A tool for quantifying tomographic data sets of geological specimens. Comput. Geosci. 2012, 48, 323–329. [Google Scholar]
  20. Díaz, D.; Hahn, D.W.; Molina, A. Quanti fi cation of gold and silver in minerals by laser-induced breakdown spectroscopy. Spectrochim. Acta Part B 2017, 136, 106–115. [Google Scholar] [CrossRef]
  21. Sayab, M.; Suuronen, J.-P.; Molnar, F.; Villanova, J.; Kallonen, A.; O’Brien, H.; Lahtinen, R.; Lehtonen, M. Three-dimensional textural and quantitative analyses of orogenic gold at the nanoscale. Geology 2016, 44, 739–742. [Google Scholar] [CrossRef]
  22. Maire, E.; Withers, P.J.; Maire, E.; Withers, P.J. Quantitative X-ray tomography. Int. Mater. Rev. 2013, 59, 1–43. [Google Scholar] [CrossRef] [Green Version]
  23. Zhang, P.; Lee, Y.; Zhang, J. A review of high-resolution X-ray computed tomography applied to petroleum geology and a case Study. Micron 2019, 124, 102702. [Google Scholar] [CrossRef] [PubMed]
  24. Le Roux, S.; Du Plessis, A.; Rozendaal, A. The quantitative analysis of tungsten ore using X-ray microCT: Case study. Comput. Geosci. 2015, 85, 75–80. [Google Scholar] [CrossRef]
  25. Godel, B.; Barnes, S.-J.; Maier, W.D. 3-D Distribution of Sulphide Minerals in the Merensky Reef (Bushveld Complex, South Africa) and the J-M Reef (Stillwater Complex, USA) and their Relationship to Microstructures Using X-Ray Computed Tomography. J. Pet. 2006, 47, 1853–1872. [Google Scholar] [CrossRef] [Green Version]
  26. ALS. ALS Geochemistry Service; ALS Laboratory: Johannesburg, South Africa, 2013. [Google Scholar]
  27. Du Plessis, A.; Le Roux, S.; Guelpa, A. The CT Scanner Facility at Stellenbosch University: An open access X-ray computed tomography laboratory. Nucl. Instrum. Methods Phys. Res. Sect. B 2016, 384, 42–49. [Google Scholar] [CrossRef] [Green Version]
  28. Volume Graphics GmbH. VG Studio Max 3.1 User’s Manual; Volume Graphics GmbH: Heidelberg, Germany, 2001. [Google Scholar]
  29. Ketcham, R.A. Resolution-invariant measurements of small objects in polychromatic CT data. In Proceedings of the Developments in X-Ray Tomography XII. International Society for Optics and Photonics, San Diego, CA, USA, 8–12 March 2019; Volume 11113, p. 111130B. [Google Scholar] [CrossRef]
  30. Berger, M. XCOM: Photon Cross Sections Database. In National Bureau of Standards; Center for Radiation Research: Washington, DC, USA, 1998. [Google Scholar]
  31. Density of Minerals. Available online: www.webminerals.com (accessed on 23 March 2020).
  32. Bam, L. Developing Protocols for XCT Scanning of Dense Mineral Ore Samples with Applications to Geology and Minerals Processing. Ph.D. Thesis, Stellenbosch University, Stellenbosch, South Africa, 2019. [Google Scholar]
  33. Reeves, T.; Mah, P.; McDavid, W. Deriving Hounsfield units using grey levels in cone beam CT: A clinical application. Dentomaxillofacial Radiol. 2012, 41, 500–508. [Google Scholar] [CrossRef] [Green Version]
  34. Gazley, M.F.; Duclaux, G.; A Fisher, L.; De Beer, S.; Smith, P.; Taylor, M.; Swanson, R.; Hough, R.M.; Cleverley, J.S. 3D visualisation of portable X-ray fluorescence data to improve geological understanding and predict metallurgical performance at Plutonic Gold Mine, Western Australia. Appl. Earth Sci. 2011, 120, 88–96. [Google Scholar] [CrossRef]
  35. Cook, N.J.; Cook, N.J.; Courtney-Davies, L.; Slattery, A.D.; Verdugo-Ihl, M.R.; Courtney-Davies, L.; Gao, W. Advances and Opportunities in Ore Mineralogy. Minerals 2017, 7, 233. [Google Scholar] [CrossRef] [Green Version]
  36. Dominy, S.C.; Edgar, W.B. Approaches to reporting grade uncertainty in high nugget gold veins. Appl. Earth Sci. 2012, 121, 29–42. [Google Scholar] [CrossRef]
  37. Bloomfield, K.; Garson, M.S. The Geology of the Kirk Range-Lisungwe Valley Area; Ministry of Natural Resources. Geological Survey Department. Bulletin No.17; Government Printer: Zomba, Malawi, 1965. [Google Scholar]
  38. Chisambi, J.; von der Heyden, B. Primary gold mineralization at Manondo–Choma area, Kirk range, Southern Malawi. S. Afr. J. Geol. 2019, 122, 505–518. [Google Scholar] [CrossRef]
  39. De Waele, B.; Fitzsimons, I.; Wingate, M.T.D.; Tembo, F.; Mapani, B.; Belousova, E. The geochronological framework of the Irumide Belt: A prolonged crustal history along the margin of the Bangweulu Craton. Am. J. Sci. 2009, 309, 132–187. [Google Scholar] [CrossRef]
  40. De Waele, B.; Kampunzu, A.; Mapani, B.; Tembo, F. The Mesoproterozoic Irumide belt of Zambia. J. Afr. Earth Sci. 2006, 46, 36–70. [Google Scholar] [CrossRef]
  41. Boyd, R.; Nordgulen, O.; Thomas, R.J.; Bingen, B.; Bjerkgård, T.; Grenne, T.; Henderson, I.H.C.; Melezhik, V.; Often, M.; Sandstad, J.S.; et al. The Geology And Geochemistry Of The East African Orogen In Northeastern Mozambique. S. Afr. J. Geol. 2010, 113, 87–129. [Google Scholar] [CrossRef] [Green Version]
  42. Bingen, B.; Jacobs, J.; Viola, G.; Henderson, I.H.C.; Skår, Ø.; Boyd, R.; Thomas, R.J.; Solli, A.; Key, R.; Daudi, E. Geochronology of the Precambrian crust in the Mozambique belt in NE Mozambique, and implications for Gondwana assembly. Precambrian Res. 2009, 170, 231–255. [Google Scholar] [CrossRef]
  43. Czerewko, M.A.; Cripps, J.C.; Reid, J.M.; Duffell, C.G. Sulfur species in geological materials–sources and quantification. Cem. Concr. Compos. 2002, 25, 657–671. [Google Scholar] [CrossRef]
  44. Leißner, T.; Diener, A.; Löwer, E.; Ditscherlein, R.; Krüger, K.; Kwade, A.; Peuker, U.A. 3D ex-situ and in-situ X-ray CT process studies in particle technology–A perspective. Adv. Powder Technol. 2020, 31, 78–86. [Google Scholar] [CrossRef]
  45. De Samber, B.; Silversmit, G.; Evens, R.; De Schamphelaere, K.; Janssen, C.; Masschaele, B.; Van Hoorebeke, L.; Balcaen, L.; Vanhaecke, F.; Falkenberg, G.; et al. Three-dimensional elemental imaging by means of synchrotron radiation micro-XRF: Developments and applications in environmental chemistry. Anal. Bioanal. Chem. 2007, 390, 267–271. [Google Scholar] [CrossRef] [Green Version]
  46. Meneses, C.T.; Macedo, M.A.; Vicentin, F.C. LixMn2O4 thin films characterization by X-ray, electrical conductivity and XANES. Microelectron. J. 2003, 34, 561–563. [Google Scholar] [CrossRef]
Figure 1. (a–d): Histograms of the core samples from grey value mapping used in thresholding. The histograms distinguish three dominant peaks. The left peak denotes the less dense bulk silicate mineral matrix, the middle peak the sulphides and the right peak denotes the much denser gold mineral. Samples JJ01, JJ02, JJ04 and JJ05, x axis denotes grey values and y axis frequency. (e): X-ray attenuation coefficient at 100 keV [30]. The graph indicates that at 100 KeV energy, gold will have the highest attenuation by a large margin. The XCT technique could not resolve different sulphides from one another as their density range is narrow, but clearly distinguishes gold as high atomic number phases distinct from the sulphides.
Minerals 10 00476 g001
Figure 2. X-ray computed tomography and reflected light images indicating gold grains identified in XCT and gold grains identified in reflected light microscopy. (a) The drill core was cut on the rectangle shown to make thick sections. Grey colour in the drill core is the silicate matrix, the yellow colour indicates sulphides and other colours represent gold, distributed according to gold grain volume (warm colours = large grains, cold colours = smaller grains). (b) Reflected light microscopy shows ubiquitous presence of gold, which proves that the dense minerals we see in XCT are indeed gold. (c,d) Gold grain in XCT, same grain in reflected light microscopy. In Figure 2c, the yellow colour indicates sulphides, dark colour indicates silicate matrix and red colour indicates gold. Figure 2c is coloured according to density (warm colours = most dense gold grains, yellow colours = medium density sulphides, dark/grey colour = less dense silicate matrix).
Minerals 10 00476 g002
Figure 3. (a) Foliation within the silicates in the XCT image slice; the foliation is attributed to minerals biotite, amphibole, garnet, muscovite, quartz and feldspar. (b) XCT image slice of silicate matrix minerals bright pixels in red circle depicts garnet porphyroblasts identified as small round white dots. (c) Thin section made from the core proving the presence of garnet. (d) Backscattered gold elemental map obtained from the SEM analysis of the 2D cut surface of the core. The bright spots represent the spots where gold was found. Gold grains are small in SEM due to partial volume effect. Sample JJ01 and JJ02.
Minerals 10 00476 g003
Figure 4. (a,b) XCT images showing 3D distribution of gold in mineralized drill core samples from gold-rich hydrothermal veins. The grey colour is the silicate matrix, the yellow colour indicates sulphides and the other colours represent gold, distributed according to gold grain volume (warm colours = large grains, cold colours = smaller grains). Samples JJ01 and JJ05 (c) is a thick section made from sample JJ04.
Minerals 10 00476 g004
Figure 5. (a,b) Quarter cores that were sent for fire assay analysis cut from the whole cores. The grey colour in the drill core is the silicate matrix and other colours represent gold, distributed according to gold grain volume (warm colours = large grains, cold colours = smaller grains). Samples JJ01 and JJ02.
Minerals 10 00476 g005
Figure 6. Correlation between XCT and Fire assay data. (a) Correlation between XCT and fire assay of quarter core before calibration. (b) 1:1 linear best fit line of XCT and fire assay. (c) Correlation between XCT and fire assay of quarter core after calibration. Error bar ± 0.001.
Minerals 10 00476 g006
Figure 7. (a,b): Distribution of gold grains in the core after segmenting using a threshold value of 59,868 and 63,000 grey values respectively, at 59,868 XCT generally overestimate the mass of gold present in the core sample. The grey colour is the silicate matrix and other colours represent gold, distributed according to gold grain volume (warm colours = large grains, cold colours = smaller grains). Sample JJ01.
Minerals 10 00476 g007
Figure 8. (a): Precise overlay of thin section and XCT scan images in 3D. The correlation was conducted manually by visually aligning prominent features using Volume Graphic software. A notable gold grain is intersected in the XCT image slice but was either slightly below the polished surface or was above the polished surface and was subsequently cut and polished away. The high-resolution X-ray computed tomography and microscopy analyses indicate that gold and accessory sulphides are not randomly distributed but rather follow specific orientation. They are distributed along shear fracture planes rather than disseminated throughout the cores. This suggests that gold was precipitated along the shear plane together with the sulphides during the ore-forming processes. The bright gold grain is not seen in reflected light microscopy, but it is easily seen in XCT image. (b) Zoomed in image of sulphides from XCT indicating that they cannot be differentiated due to a narrow density range. (c) The sulphide mineral assemblage comprises pyrite, pyrrhotite and chalcopyrite determined from detailed 2D examination of polished sections. Thick section cut from sample JJ04.
Minerals 10 00476 g008
Figure 9. Nature of gold mineralization. (a) Structures (faults, fractures, shear zones and dykes) that were derived from interpretation of airborne magnetic data. The magnetic data show prominent lineaments that represent faults and shear zones. The faults and fractures and shear zones are thought to have acted as conduits for mineralizing hydrothermal fluids. Rose diagram show the dominant trend of structures to be NE–SW. (b) Drill core drilled from the indicated hole show that the mineralized vein system and the sulphide distribution also show the same trend; the distribution of the sulphides show that the sulphide minerals occur as an interconnected subvertical network and have preferred orientation. The orientation of sulphides is consistent with dominant structures in the field. The grey colour is the silicate matrix and the yellow colour indicates sulphides. (c) XCT scanned image of the thin section made from indicated rectangle shows gold grains have been elongated/stretched in this dominant NE orientation along the shear plane, (warm colours = large gold grains, cold colours = smaller gold grains). (d,e) Milled grains and stretched minerals in thin section from the drill core cut along the rectangle indicated on the drill core indicating shearing. (f,g) Shear sense indicators observed from thin section e above on the shear plane using a 50× objective lens. Sample JJ05.
Minerals 10 00476 g009
Table 1. Density range and X-ray attenuation coefficients of minerals present in the core samples. Density data are collected from [31] and X-ray attenuation coefficients are calculated using an Excel sheet developed by [32].
MineralDensity g/cm3X−Ray Attenuation Coefficient
Gold19.33.20 E00
Pyrite5.018.32 E−01
Pyrrhotite4.657.72 E−01
Chalcopyrite4.196.96 E−01
Sphalerite4.16.81 E−01
Garnet3.936.52 E−01
Amphibole34.98 E−01
Biotite2.84.65 E−01
Quartz2.654.40 E−01
Plagioclase2.614.33 E−01
Table 2. Distribution of gold and sulphides in analysed drill core samples. Average density of sulphides was calculated by averaging the densities of individual sulphides identified in 2D microscopy.
SampleWeight of Core (g)Gold Volume (mm3)Density (g/cm3)Mass of Gold(g)Gold Grade XCT (ppm)
JJ 01136.174.9319.300.100.07
JJ 02384.707.1819.300.140.04
JJ 0489.566.7019.300.120.14
JJ 05919.0513.3219.300.260.03
SampleWeight of Core (g)Sulphide Volume (cm3)Avg. Density g/cm3Mass of Sulphides (g)Concentration of Sulphides %
JJ 01136.170.264.481.150.84
JJ 02384.71.174.485.261.37
JJ 0489.560.724.483.243.62
JJ 05919.050.344.481.520.17
Table 3. (Top) Gold grade of the scanned core samples calculated by XCT analysis and gold grade obtained by fire assay. (Middle) Calculated gold grade after calibrating using fire assay at threshold grey value of 63,000. (Bottom) comparison of gold grades before and after calibration.
SampleWeight of Core (g)Gold Volume (cm3)Mass Gold (g)Gold Grade XCT (ppm)Gold Grade Fire Assay (ppm)
JJ 0150.560.00130.0250.0500.03
JJ 0250.0850.00080.0150.0310.02
JJ 0460.1750.000250.0050.0080.01
JJ 0555.2050.00060.0120.0210
JJ 0150.560.00080.0150.0310.03
JJ 0250.0850.000540.0100.0210.02
JJ 0460.1750.00030.0060.0100.01
SampleGold Grade before Calibration (Quarter Core) XCT (ppm)Gold Grade after Calibration (Quarter Core) XCT (ppm)Gold Grade Fire Assay (Quarter Core) (ppm)Gold Grade Whole Core after Calibration XCT (ppm)% Difference between Calibrated Whole Core Gold XCT Data and Fire Assay
JJ 010.050.0310.030.02−0.04
JJ 020.0310.0210.020.004−0.04
JJ 040.0080.010.010.0430.03
JJ 050.0210.0100.010.01
Table 4. Summary on information that can be obtained from combined approach.
2D Petrography3D Computed TomographyCombined and 2D and 3D Correlative Approach
Apparent sizeTrue size and orientationTrue size
Relative sense of motion (e.g., sinistral vs. dextral) associated with structural featuresAbsolute 3D orientation of major structuresDeeper understanding of orientation of major structures
Resolution determined by lenses on microscope 35 µm voxel resolutionEnables that 2 µm resolution can be spatially constrained within a 35 µm voxel size theoretical XCT model
Observation of microstructural features e.g., mica fish, rotated porphyroblasts, mineral stretching, etc.Only major structures observed, possible identification of mineral stretching in dense gold samplesMicrostructural details can be positioned in 3D space given x, y, z coordinates
Identification of individual mineral phasesBroad categorization of mineral phases based on X-ray attenuation coefficientsA better and more comprehensive understanding of mineral phases. Identified mineral phases can be quantified and positioned in 3D space

