Article

Application of GETFLOWS Coupled with Chemical Reactions to Arsenic Removal through Ferrihydrite Coprecipitation in an Artificial Wetland of a Japanese Closed Mine

1
Graduate School of Creative Science and Engineering, Waseda University, 3-4-1 Okubo, Shinjuku-ku, Tokyo 169-8555, Japan
2
Geosphere Environmental Technology Corporation, 2-1 Kanda-Awaji-cho, Chiyoda-ku, Tokyo 101-0063, Japan
3
Ningyo-toge Environmental Engineering Center, Japan Atomic Energy Agency, 1550 Kamisaibara, Kagamino-cho, Tomata-gun, Okayama 708-0698, Japan
4
Faculty of Science and Engineering, Waseda University, 3-4-1 Okubo, Shinjuku-ku, Tokyo 169-8555, Japan
*
Author to whom correspondence should be addressed.
Minerals 2020, 10(5), 475; https://doi.org/10.3390/min10050475
Submission received: 5 April 2020 / Revised: 20 May 2020 / Accepted: 20 May 2020 / Published: 23 May 2020
(This article belongs to the Special Issue Pollutants in Acid Mine Drainage)

Abstract

:
Passive systems that utilize a natural power such as a pond, plant, or microorganisms, is expected to be a cost-effective method for acid mine drainage (AMD) treatment. The Ningyo-toge mine, a non-operational uranium mine located in Okayama Prefecture, Japan, generates AMD containing arsenic and iron. To quantitatively study arsenic and iron ion removal in an artificial wetland and pond, chemical reactions were modeled and incorporated into the GETFLOWS (general-purpose terrestrial fluid-flow simulator) software. The chemical reaction models consisted of arsenite and ferrous oxidation equations and arsenic adsorption on ferrihydrite. The X-ray diffraction analysis of sediment samples showed ferrihydrite patterns. These results were consistent with the model for arsenite/ferrous oxidation and arsenic adsorption on ferrihydrite. Geofluid simulation was conducted to simulate mass transfer with the utilized topographic model, inlet flow rate, precipitation, and evaporation. The measured arsenic and iron ions concentrations in solution samples from the wetland and pond, fitted well with the model. This indicated that the main removal mechanism was the oxidation of arsenite/ferrous ions and that arsenic was removed by adsorption rather than dilution.

1. Introduction

Acid mine drainage (AMD) from abandoned or closed mines is an environmental problem associated with mining [1,2,3]. AMD is produced when sulfide minerals (e.g., pyrite, sphalerite, and chalcopyrite) react with oxygen and groundwater. Thus, it often contains toxic ions, such as iron (Fe(II) and Fe(III)), zinc (Zn(II)), lead (Pb(II)), and arsenic (As(III) and As(V)). To avoid contamination around mines, AMD has mainly been treated by a neutralization process to add a neutralizer, such as calcite (CaCO3) and slaked lime (Ca(OH)2) [4]. This process can effectively remove toxic ions from AMD through precipitation as hydroxide or adsorption of hydroxides, such as ferrihydrite (Fe(OH)3) and aluminum hydroxide (Al(OH)3) [5,6,7].
In Japan, it is necessary to treat AMD in about 100 abandoned or closed mines. To this end, the Japanese government provides financial support for AMD treatment and spends billions of yen each year [8]. Since it was reported in our previous studies that an AMD treatment has been a necessity for a long time [9,10], it is predicted that large funds will be needed to address this. To achieve a sustainable AMD treatment for the future, cost reduction of the neutralization process is required.
Many research work on passive treatment has been attracting attention recently, in a bid to reduce the cost of AMD treatment. The passive treatment utilizes natural resources such as geographical features, microorganisms, and plants, for AMD treatment [11,12,13]. AMD treatment by passive methods incurs lower management costs for materials, power, and labor than an active treatment, which mainly consists of the neutralization process. AMD treatment using an artificial wetland and pond is one of the methods of passive treatment. In previous studies [14,15,16], many researchers reported that AMD treatment using an artificial wetland and pond was effective for removing toxic ions. According to previous studies, it was suggested that not only chemical but also biological reactions, such as sulfate reduction, iron, and manganese oxidation using bacteria, occurred in an artificial wetland and pond. However, quantitative modeling based on removal mechanisms has not been conducted, due to the complexity of the reaction. To achieve a more efficient AMD treatment using an artificial wetland and pond, it is important to develop quantitative modeling based on removal mechanisms.
The objective of this study was to elucidate the mechanism of toxic ion removal, especially arsenic, using an artificial wetland and pond, and to quantify it using geochemical modeling software. In this study, the target field was the Yotsugi mill tailings pond in the Ningyo-toge mine [17,18,19], which is partially an artificial wetland near the inlet. In an artificial wetland and pond, arsenic and iron were removed satisfactorily enough to meet the strict local additional standards, but it is currently unknown whether the mechanism was due to dilution or chemical reaction. To identify the removal mechanisms, we performed a water quality survey and field sampling. Furthermore, a surface model was constructed using a contour map and the flow field of the water in the mineral deposit field was modeled using GETFLOWS software [20,21,22]. GETFLOWS is a simulation software originally developed by one of the authors and used to calculate the mass transport processes [20,21,22,23,24,25,26,27]. In this study, the chemical reactions were originally coupled with it, according to the authors’ previous expertise on ferrous and arsenite ion oxidation, ferric ion precipitation, and coprecipitation of arsenite and arsenate to iron precipitates [5,6,7]. More specifically, based on our previous findings and the field survey results for concentration of coexisting ions in the pond, it was assumed that ferrihydrite should be the main iron precipitate, and surface complexation of arsenite and arsenate to ferrihydrite should be the dominant reaction in the coprecipitation process in the pond and the wetland, due to the ratio between iron and arsenic. A chemical reaction model was constructed based on these assumptions and we confirmed whether our assumptions were correct by comparing the results of the field survey and the analysis results. Through these procedures, we elucidated the removal mechanism of iron and arsenic ions in the artificial wetland and pond in an actual closed mining site in Japan, based on the consistency between the field survey results minimally required and the calculation results that aggregated the findings in previous mechanism investigations.

2. Materials and Methods

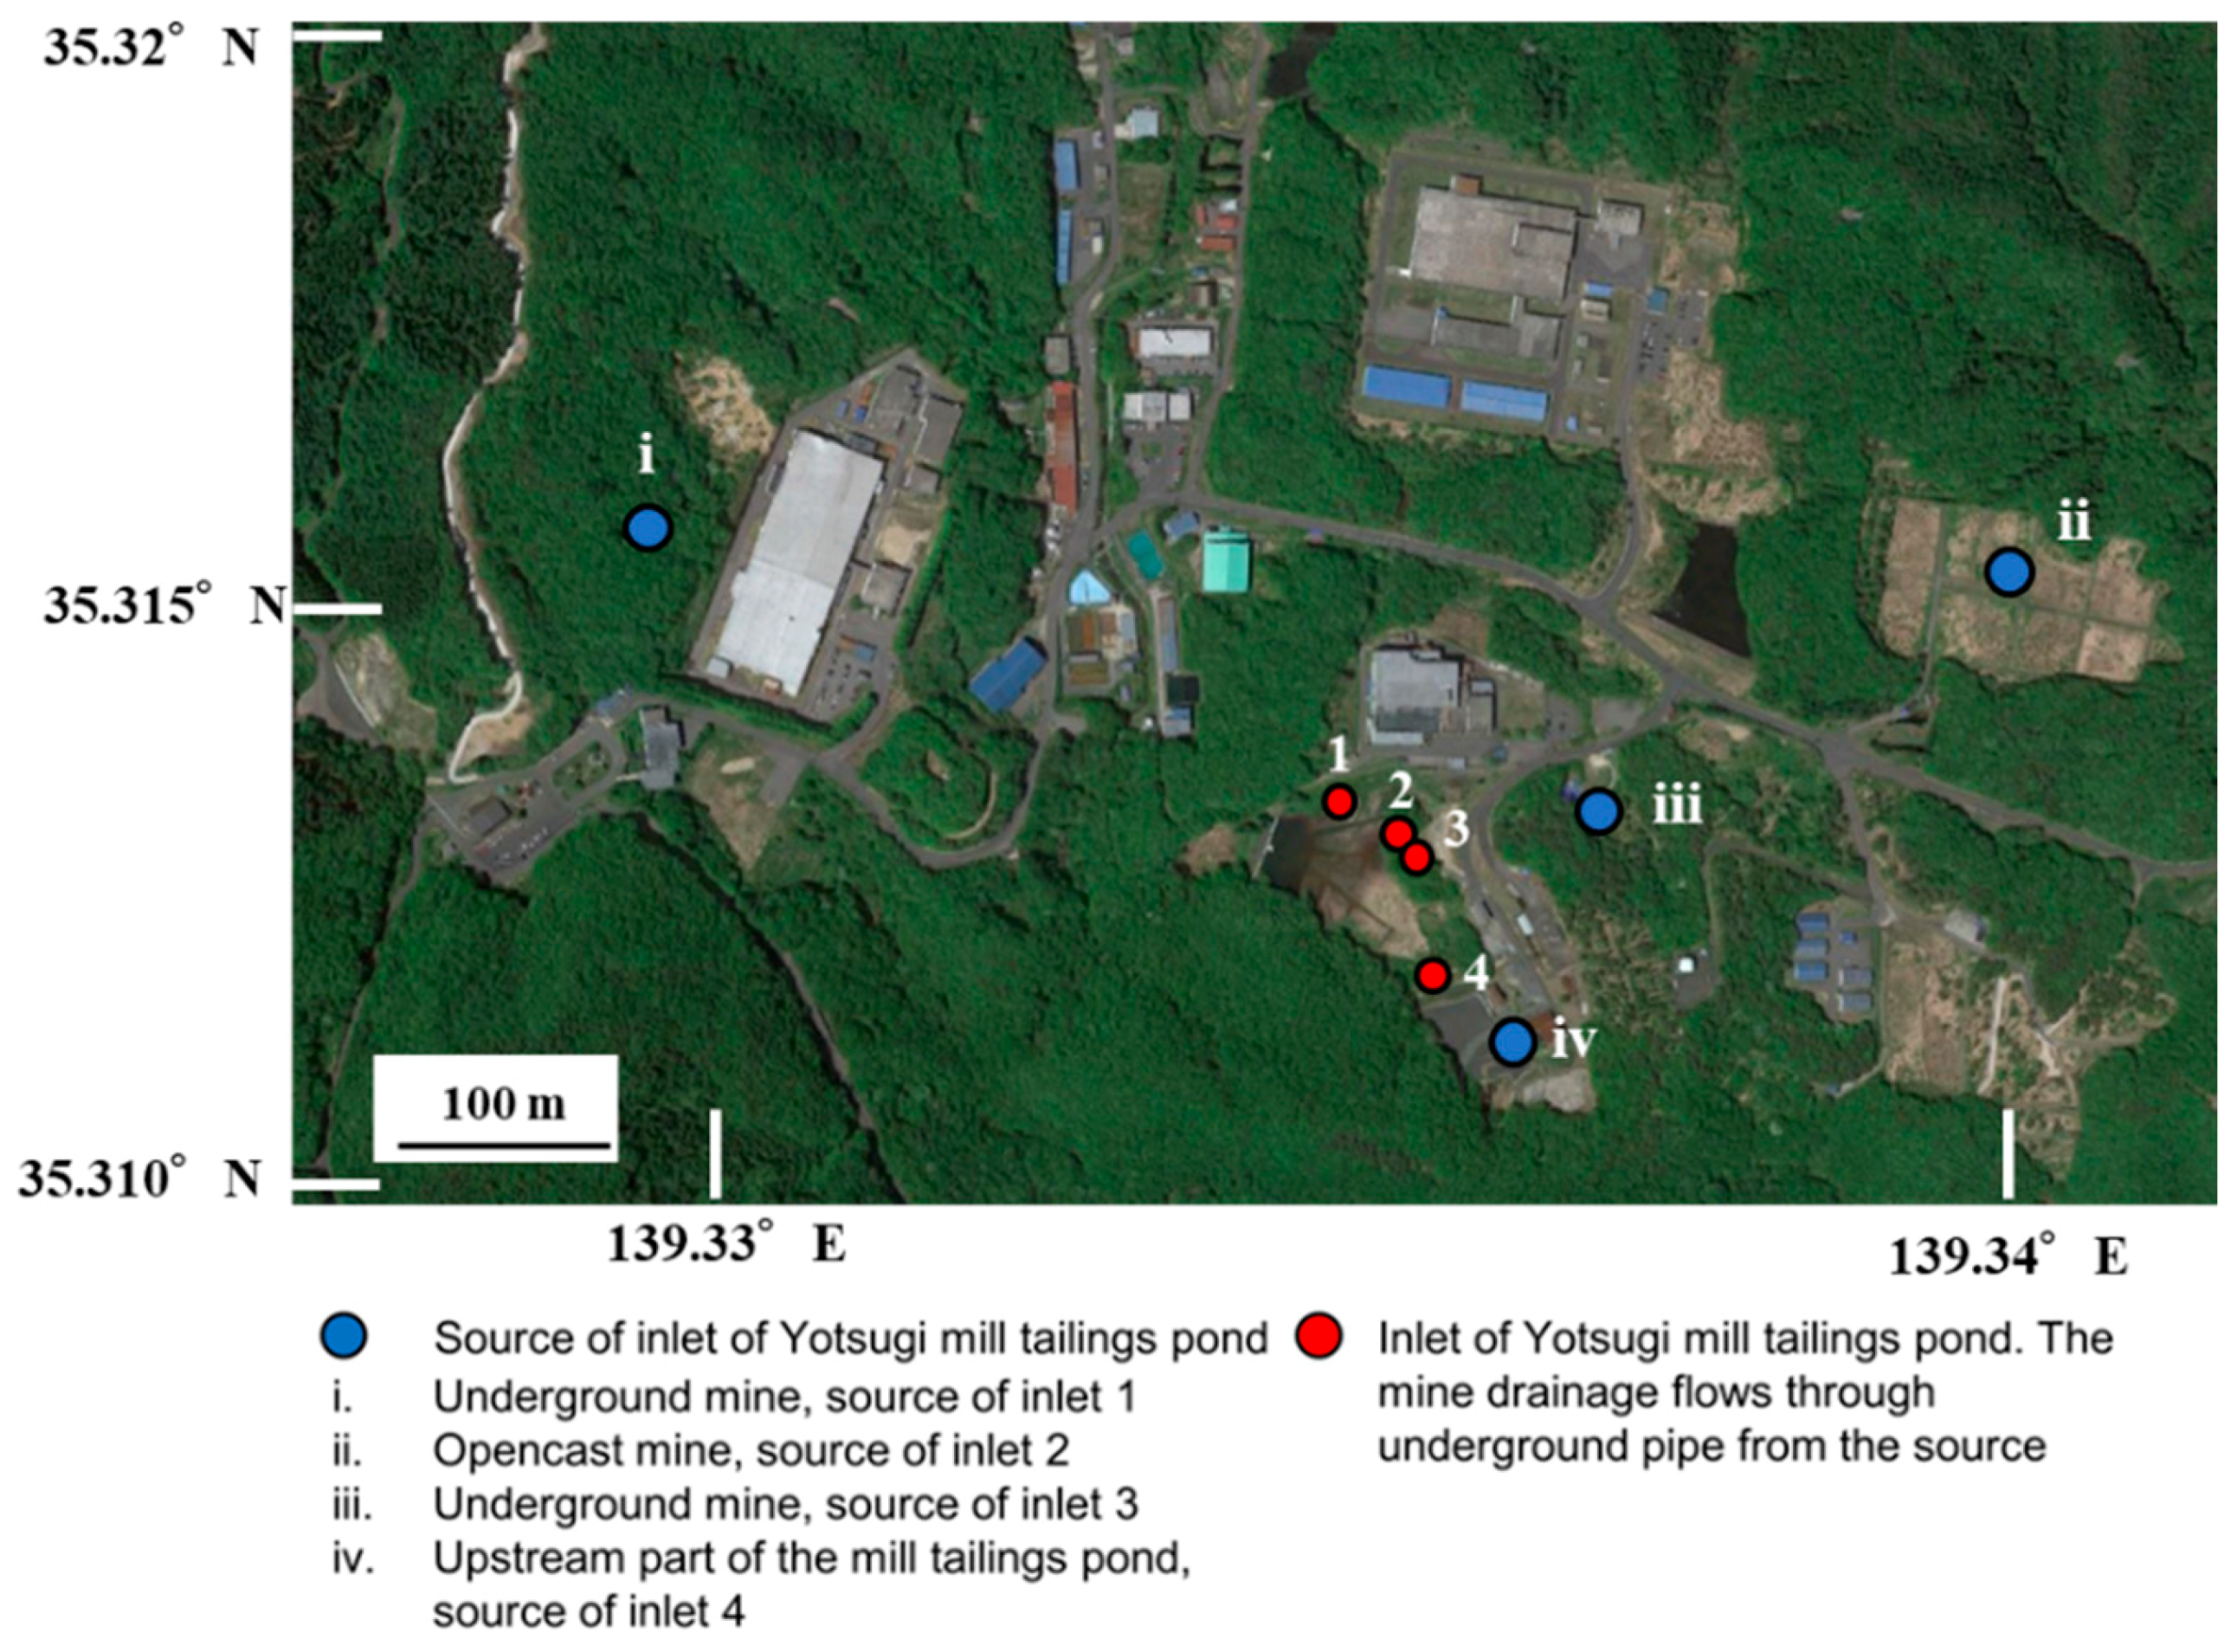
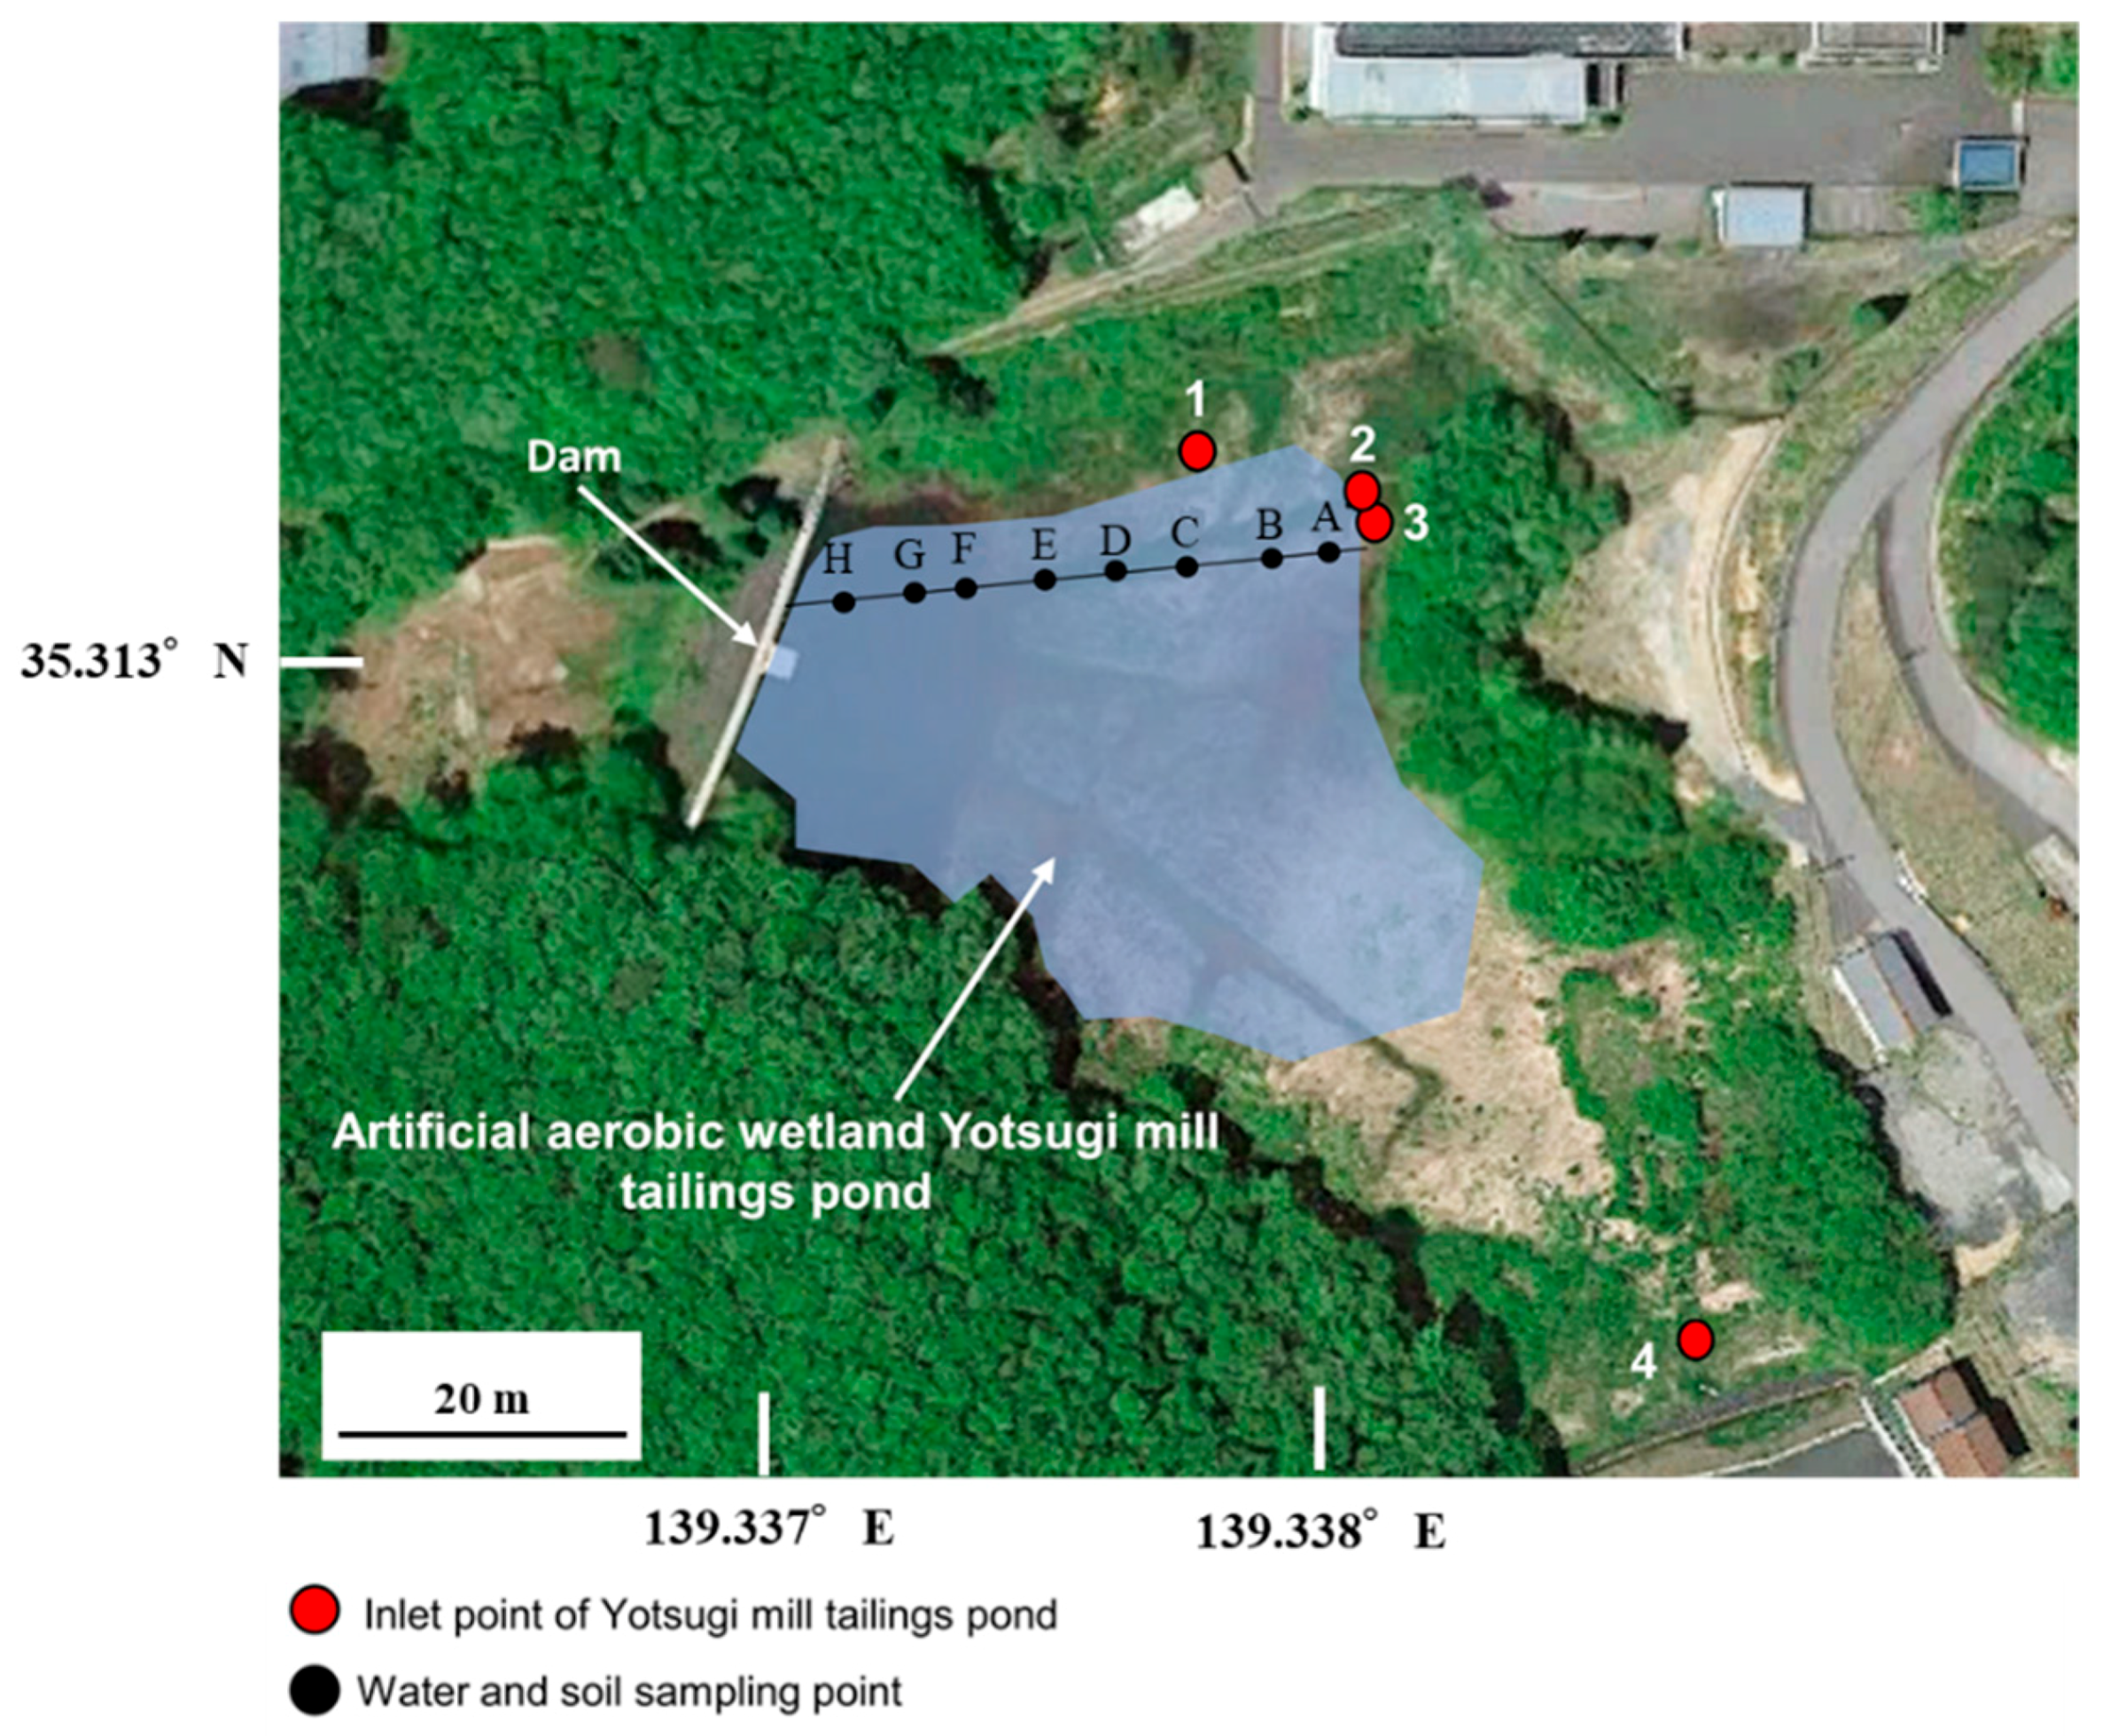
2.1. Field Survey and Analysis

The Ningyo-toge mine is a closed uranium mine located in the Okayama Prefecture, Japan (35°18′47.58″ N, 133°55′52.21″ E) [17,18,19]. The Yotsugi mill tailings pond, an artificial pond, was constructed to receive slag and other materials generated by the smelter during operation, and now has partially become an artificial wetland near the inlet. After the closure of the smelting facility in 1982, this tailing pond was utilized as a remediation pond [23]. The pond has four main inlets as sources of mine drainage from the surrounding area that flow through underground pipes towards the pond—one comes from an opencast mine, two are from underground mines, and one is from the upstream part of the mill tailings pond (Figure 1). The AMD from the four inlets flow towards a dam located at the western end of the pond. The depth of the Yotsugi mill tailings pond in summer and winter was 1.4 m and 1.2 m at point H, respectively. This decreased towards the upstream area of the Yotsugi mill tailing pond from point H to A. The depth at point A was 0.0 m.
Field surveys were conducted three times in the summer and winter of 2016, respectively. For each survey, three water samples were collected from the source of each of the four inlets (points i–iv, Figure 1). In addition, three water and sediment samples at each point of the surface were collected along the Yotsugi mill tailings pond in the direction of water flow (Figure 2 and Table 1). Using a thin tube with a diameter of 20 mm, a 100 mm thick sedimentary layer was collected from the bottom of the Yotsugi tailings mill pond.
The pH, temperature, oxidation–reduction potential (ORP), electric conductivity (EC), and concentration of dissolved oxygen (DO) of the water samples were measured on-site, using a pH/DO meter (OM-70, HORIBA, Kyoto, Japan). After the measurement of pH, temperature, ORP, EC, and DO concentration, the water samples were filtered using a 0.45-μm membrane filter. We also confirmed that no colloidal particles were present in the sample water after extra filtration. The concentration of all cations in the filtrates was analyzed by an inductively coupled plasma-mass spectrometer (ICP-MS, 7700X, Agilent, Santa Clara, CA, USA), using the mode of semi-quantitative analysis. The concentration of a ferrous ion in the inlet was measured beforehand by the phenanthroline absorption spectrophotometric method, and the total iron ion was almost the same as the concentration of the ferrous ion. The concentration of the arsenite ion in the inlet was measured beforehand through separation, using high selectivity inorganic separating bulk (MetaSEP AnaLig TE-01, GL Sciences, Tokyo, Japan) [24], and the total arsenic ion was almost the same as the concentration of the arsenite ion. Therefore, the valency of iron and arsenic ions in the inlet was treated as ferrous and arsenite ions, respectively. Each sample was measured three times, and it was confirmed that their error was within 5%. Other cation ions of iron and arsenic obtained from the ICP–MS analysis resulted in less than several mg/L of sodium, potassium, calcium, magnesium, and aluminum. Sulfate and chloride ions were also measured by ion chromatography (IC, IC850, Metrohm, Tokyo, Japan) and were below the 50 mg/L. From the chemical equilibrium calculation using PHREEQC [4], we neglected the effect of these ions for the removal reaction of iron and arsenic ions in this study.
The sediment samples were vacuum dried and the mineral phases were ascertained using X-ray diffraction analysis (XRD, RINT Ultima III, Rigaku, Tokyo, Japan), with Cu-Kα radiation at 40 kV and 30 mA. The scan range was from 2°–80°, with a scan rate of 2°/min. The XRD specimens on the plane glass holder were prepared using a front-loading technique. The objective of the XRD analysis in this study was to detect low crystalline materials of an iron hydroxide, such as 2-line ferrihydrite. Therefore, to observe the peak of the low crystalline materials, background subtraction was not conducted on the obtained XRD patterns.

2.2. Simulation Model Using GETFLOWS

The GETFLOWS simulation software was used to simulate the mass transport processes in the Yotsugi mill tailings pond. GETFLOWS is a fully distributed and integrated watershed modeling tool that treats the transport processes of water, air, various dissolved and volatilized materials, suspended sediments in water, and heat from the surface to the underground, on arbitrary temporal-spatial scales. The surface water flow and dissolved materials transport in surface water functions were applied in this study.
The governing equation of surface water was based on the mass conservation law, as described in Equation (1):
· M w + ρ w q w = ( ρ w S w ) t
where is the differential operator, M w is the mass flux of surface water (kg/m2/s), ρ w is the density of water (kg/m3), q w is the volumetric flux of the sink and source (m3/m3/s), S w is the saturation of water calculated from the surface water depth and the grid height (m3/m3), and t is the time (s).
The simulator solved the Manning’s law for estimating the surface water flow velocity, and it also solved the depth-averaged diffusion wave approximation of open channel shallow water Saint-Venant equations in two dimensions, for modeling the flows of water on land, in streams, and on slopes. Instead of solving the momentum conservation equations following Tosaka et al. [25], we embedded the velocity field in the flow term in Equation (1) (i.e., the first term on the left-hand side). The mass flux of surface water per unit area M w in flow terms for surface flow could be expressed by adapting Manning’s law as Equation (2):
M w = ρ w R 2 3 n l | h l + z l | s g n ( h l + z l ) ,   ( l = x ,   y )
where n l is Manning’s roughness coefficient (m−1/3 s), R is the hydraulic radius (m), h is the surface water depth (m), l is the distance of surface water flow direction (m), and z is the elevation from the datum level (m). The surface water depth h was computed from the water saturation S w and the height of the grid block in the surface environment.
The mass balance equation could be modified as Equation (3), when considering the behavior of the reactive substance i dissolved in water [26]:
· ( M w C w , i ) + · D w , i ( ρ w C w , i ) + ρ w q w C w , i i r = 1 i r i N C m w , i i r + i r = 1 i r i N C m w , i r i m w s , i = ( ρ w S w C w , i ) t
where C w , i is the mass fraction of dissolved material i in water (kg/kg), D w , i is the diffusion coefficient of dissolved material i (m2/s), m w , i 1 i 2 is the rate of generation/decomposition of a chemical reaction from dissolved material i 1 to i 2 in water (kg/m3/s), and m w s , i is the adsorption rate of the dissolved material i (kg/m3/s). The first term on the left-hand side of Equation (3) is the advection term, the second term is the diffusion term, and the third term is the sink/source term for drainage and precipitation. The fourth and fifth terms are the decomposition and generation terms for chemical reactions in water, respectively. The sixth term represents a transfer from the water phase to the solid phase by adsorption.
These governing equations were discretized spatially using the integral finite difference method and temporally by the fully implicit method. Due to their nonlinearity, the governing equations were iteratively converged using the Newton–Raphson method. Matrix factorization was performed using the conjugate residual method, with preconditioning by nested factorization, which targeted the nested structure of the structured mesh. To speed up the numerous calculations, we used the successive locking process [27] to remove the grids where sufficient convergence was achieved in the nonlinear iterative process. The governing equations, required data, and solution procedures were explained in detail in a previous paper [26]. To ensure its accuracy and applicability, the GETFLOWS simulator was applied to many verification test problems involving theoretical and analytical solutions. In addition, GETFLOWS was applied to more than 500 sets of field and laboratory data in Japan and overseas to validate its utility [20,21,22,26,28].
A three-dimensional topographic model of the Yotsugi mill tailings pond was developed using the Geographic Information System software MapInfo®, with field elevation data provided by the Japan Atomic Energy Agency [23]. The three-dimensional topographic model was used to perform geosphere fluid analysis. The model domain was set as the catchment area of the pond to consider all water flowing into the pond. The ridge surrounding the pond was set as the boundary of the analysis area (Figure 3). No flow boundary condition was applied except for a pond outlet. All water inflow from outside of the pond was considered as surface water.
Advection–diffusion analysis was performed using GETFLOWS. The topographic model, inlet flow rate, precipitation, evaporation, and water quality were utilized as input data in this simulation. Percolation and recharge in the ground did not need to be considered. The Manning’s roughness coefficient was set to 0.03 as a parameter related to the surface flow. Precipitation and evaporation data were measured and provided by the Japan Atomic Energy Agency and the inlet flow rates were provided by the Ningyo-toge Environmental Technology Center [23].

2.3. Kinetics Model

In geochemical modeling, the kinetics model of both ferrous and arsenite ions oxidation was considered in this study. For the oxidation reaction of ferrous, the kinetics model used in the quantitative model is considered in Equation (4), as proposed by Singer and Stumm [29]:
d [ Fe ( II ) ] dt = (   k 1 + k 2 [ OH ] 2 P O 2 ) [ Fe ( II ) ]
where [Fe(II)] is the activity of ferrous ion; [OH] is the activity of the hydroxide ion; PO2 is the oxygen partial pressure; and k1 and k2 are rate constants with reference values of 2.91 × 10⁻⁹ and 1.33 × 10¹², respectively. Equation (4) has been used by many researchers, including our group, to show that the kinetics of ferrous oxidation depend on pH and DO. Although the kinetic constants of k1 and k2 should be affected by several chemical and biogeochemical conditions, the usefulness of these values was confirmed under the atmosphere and without any biogeochemical influence.
For the oxidation reaction of arsenite, the kinetics model used in the quantitative model is reported in Equation (5):
d [ A s ( I I I ) ] d t = k 3 [ A s ( I I I ) ]
where [As(III)] is the activity of arsenite; k3 is a rate constant with a reference value of 3.0 × 10⁻³ [30].
The ORP in the Yotsugi mill tailings pond was almost stable at around 0.2 V. According to the Eh-pH diagram reported by Bednar et al. [31], the dominant species of arsenic was HAsO4 as an arsenate ion. Bednar et al. [31] reported that arsenite was oxidized according to Equation (6) in the acidic pH area, when iron and arsenic ions co-existed.
H2AsO30 + H2O + 2Fe3+ → H2AsO4 + 3H+ + 2Fe2+
However, it was considered that the oxidation reaction of arsenite did not proceed according to Equation (6) because our target pH area was a neutral pH area and iron ion was precipitated. Thus, we did not consider the oxidation reaction of arsenite, according to Equation (6) in this study.
Bednar et al. [31] also reported that the ratio of arsenate/total-arsenic in the acidic pH area was larger than that in the neutral pH area. The reason for this was the arsenite/arsenate adsorption reaction for iron (hydr)oxide (e.g., ferrihydrite and magnetite) in the neutral pH area [31,32,33,34]. Since iron (hydr)oxide adsorbed more arsenate than arsenite in the neutral pH area, the ratio of arsenate was small. It was considered that this arsenite/arsenate adsorption reaction occurred in our target system.
Based on the above discussion, we introduced Equation (5) to show the kinetics of the oxidation reaction of arsenite. Since the ORP was almost stable in the Yotsugi mill tailings pond, it was treated as a constant value and unified into the kinetics constant of k3 in Equation (5).

2.4. Surface Complexation Model

A previous comparison between coprecipitation and adsorption experiments for arsenate adsorption on ferrihydrite with various As/Fe molar ratios confirmed that arsenate was predominantly adsorbed as surface precipitation when the As/Fe molar ratio was over 0.4, whereas it was predominantly adsorbed by surface complexation when the As/Fe ratio was below 0.4 [5,35]. In our previous study, we used the Dzombak and Morel model to model the adsorption of arsenate on ferrihydrite and found that the adsorption experimental results were successfully represented to the model when we combined the diffusion layer model with the Dzombak and Morel parameter. In this study, the As/Fe molar ratio in the Yotsugi mill tailings pond was less than 0.4 at all points, and surface complexation was considered to be the dominant process in the adsorption of arsenic onto ferrihydrite. Therefore, the Langmuir model with the coefficient from Dzombak and Morel model was used in this study. The Langmuir adsorption isotherm equation used in this study is shown in Equation (7):
W s = W s   m a x a C 1 + a C
where W s is the amount adsorbed (mol/mol-Fe), W s   m a x is the saturation adsorption (mol/mol-Fe), a is the adsorption equilibrium constant, and C is the concentration (mg/L). The Langmuir constants are shown in Table 2.

3. Results and Discussion
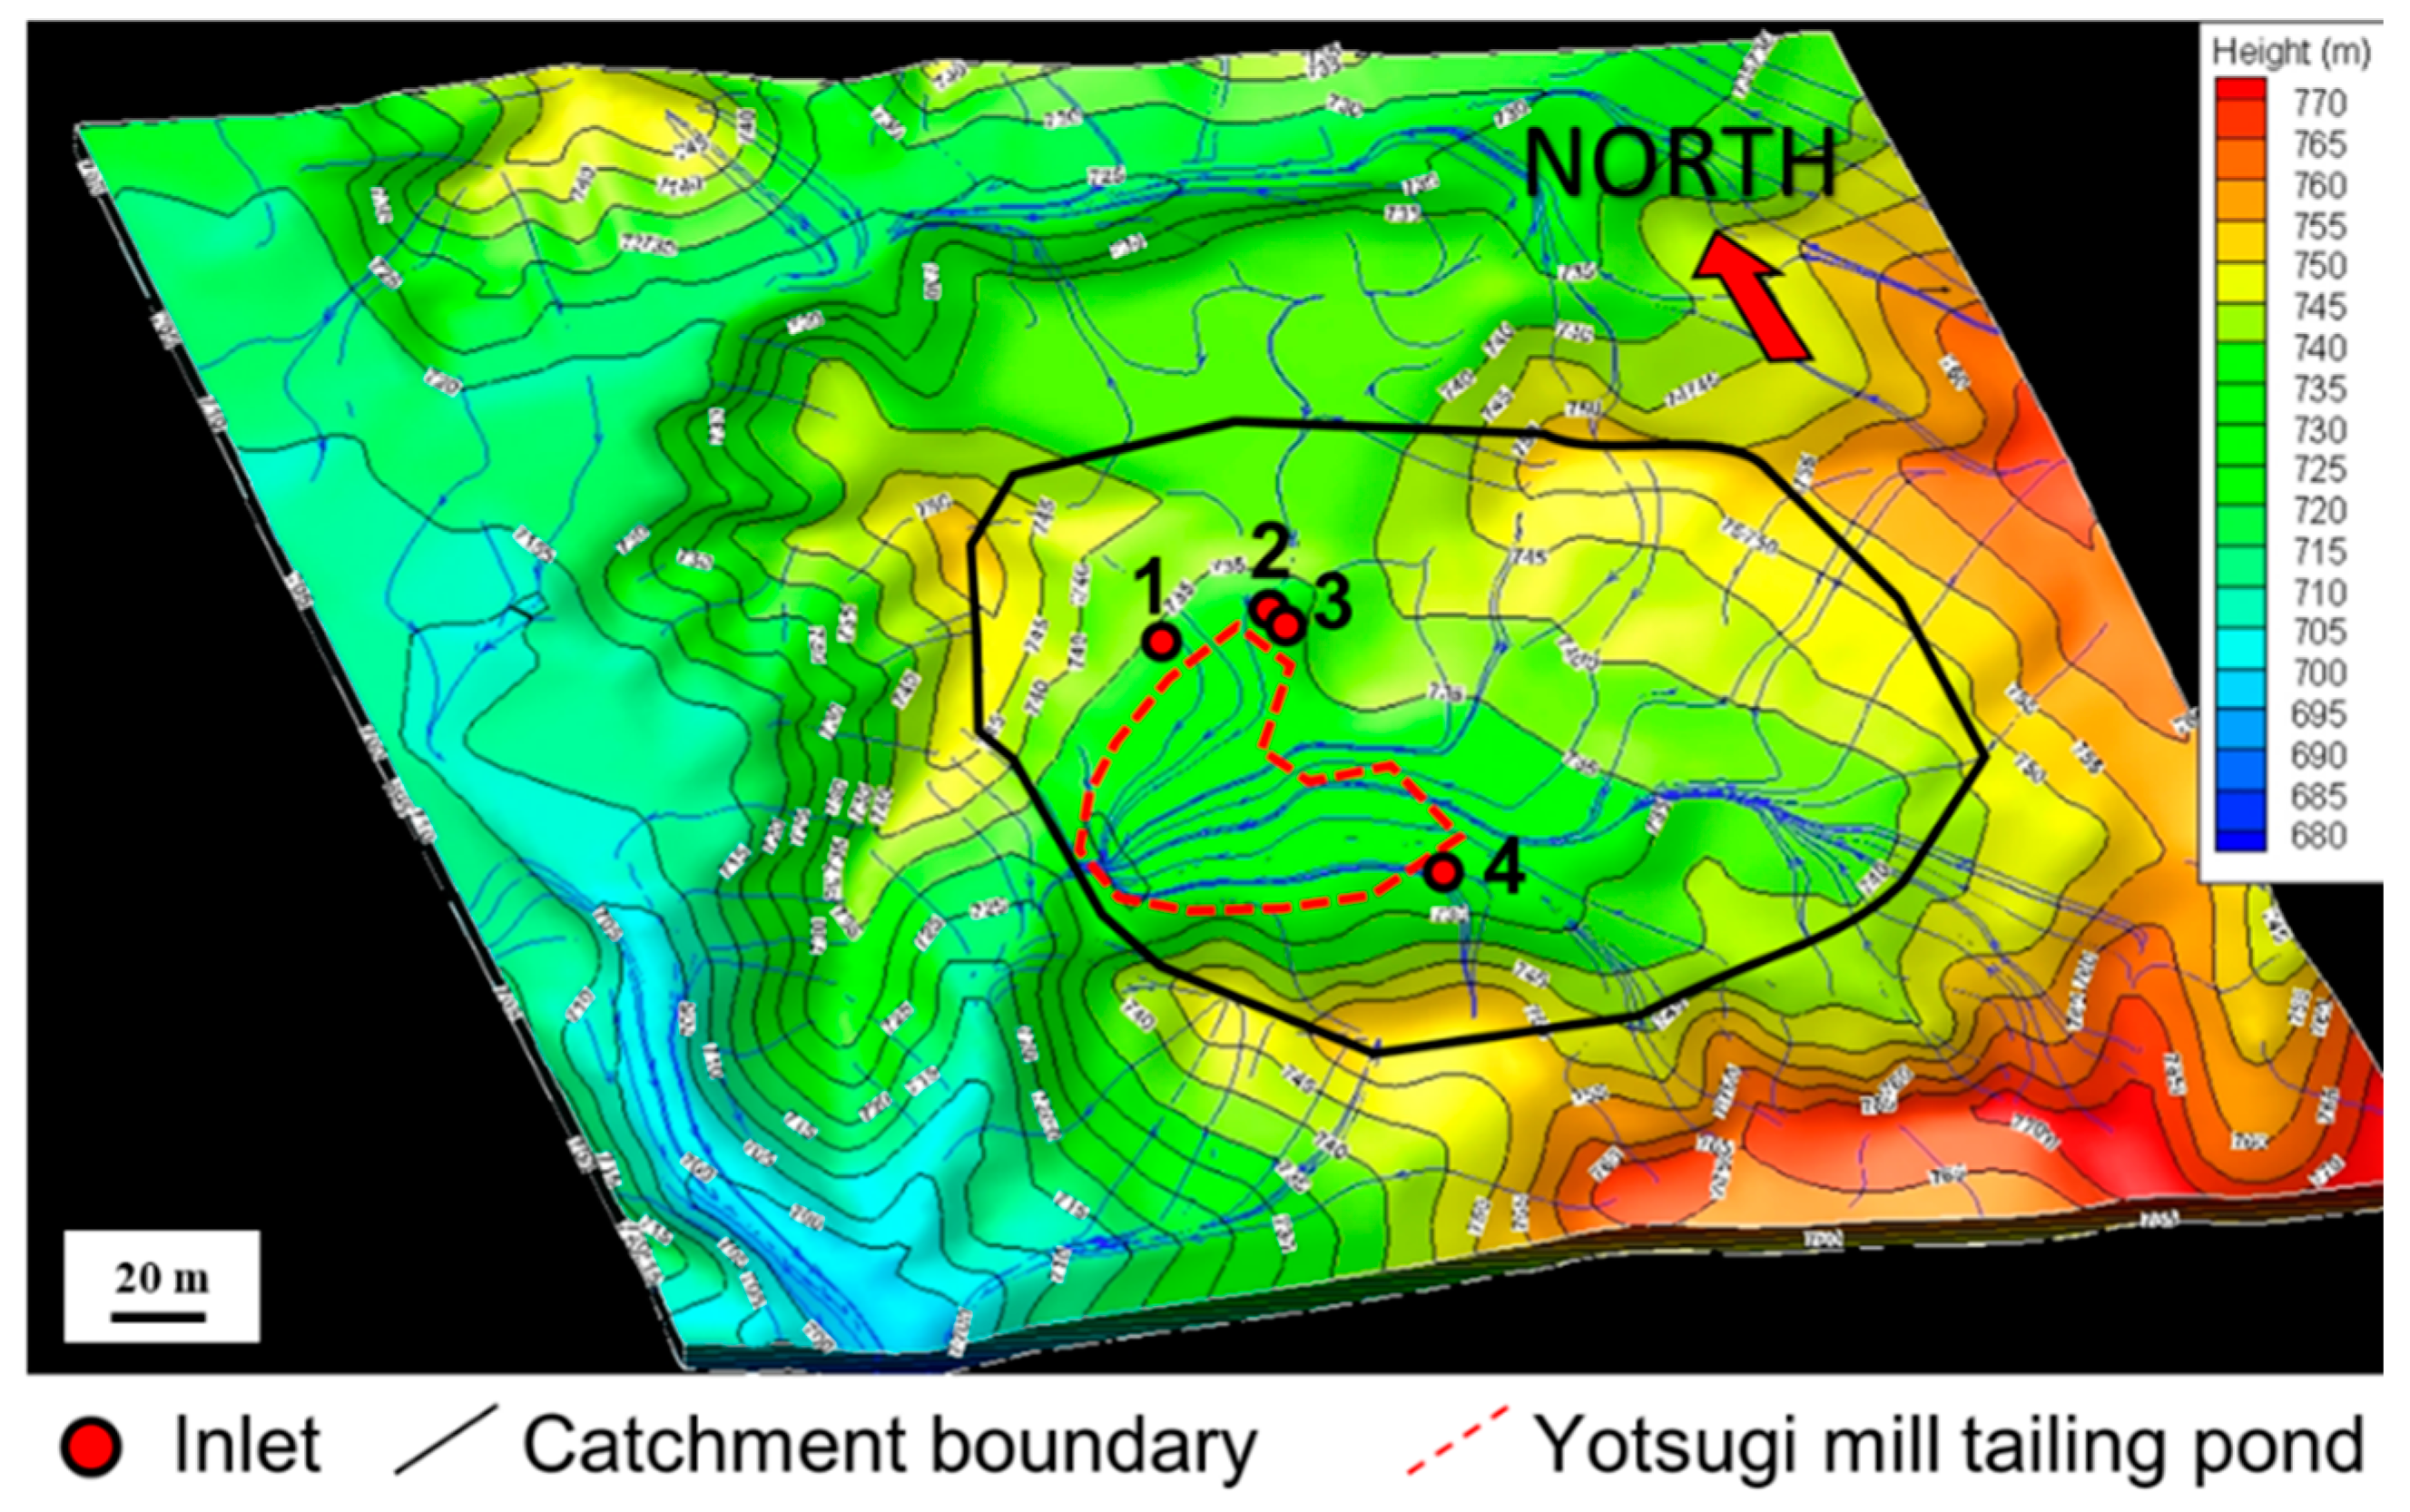
3.1. Field Survey

The quality of each water sample obtained from the field surveys in summer and winter are shown in Table 3 and Table 4. The average pH throughout the Yotsugi mill tailings pond and at each inlet was almost pH 7. The temperature of the water sample was almost stable at around 13 °C in winter, whereas it was 15 °C at point A, and gradually increased downstream up to 30 °C at point H in summer. Since point A was near the inlet and the surrounding area was an artificial wetland, it was directly affected by the raw water in the mine, which had a stable temperature of around 15 °C regardless of the season. On the other hand, since point H had a long residence time and the surrounding area was a pond, it was easily affected by the outside temperature. The EC was around 30 mS/cm in summer and around 0.2 mS/cm in winter.
The concentrations of arsenic and iron ions in summer and winter were mostly affected by inlets 2 and 3, which were located close to each other. These decreased towards the downstream area of the pond from point A to H.
From the concentrations silicon, iron, and arsenic ions are shown in Table 3 and Table 4, we confirmed that ferrihydrite (pK= –3.191; Fe(OH)3 + 3H+ = Fe3+ + 3H2O for Fe(OH)3) was saturated in the pond and ferric arsenate (pK= –0.4; FeAsO4:2H2O + 3H+ = Fe3+ + H3AsO40 + 2H2O for FeAsO4:2H2O) and amorphous silica (pK= 2.71; SiO2 + 2H2O = H4SiO40 for SiO2) were unsaturated [36]. Based on our previous study [4] and pre-investigation by chemical equilibrium calculation, including surface complexation model, it was confirmed that silicate precipitates were not formed and the effect of silicon for arsenic removal by ferrihydrite was very small and could be ignored at neutral pH, due to the low concentration of silicon ion in the pond. Thus, silicon could be used as a tracer to understand the mass transfer behavior in the Yotsugi mill tailings pond.

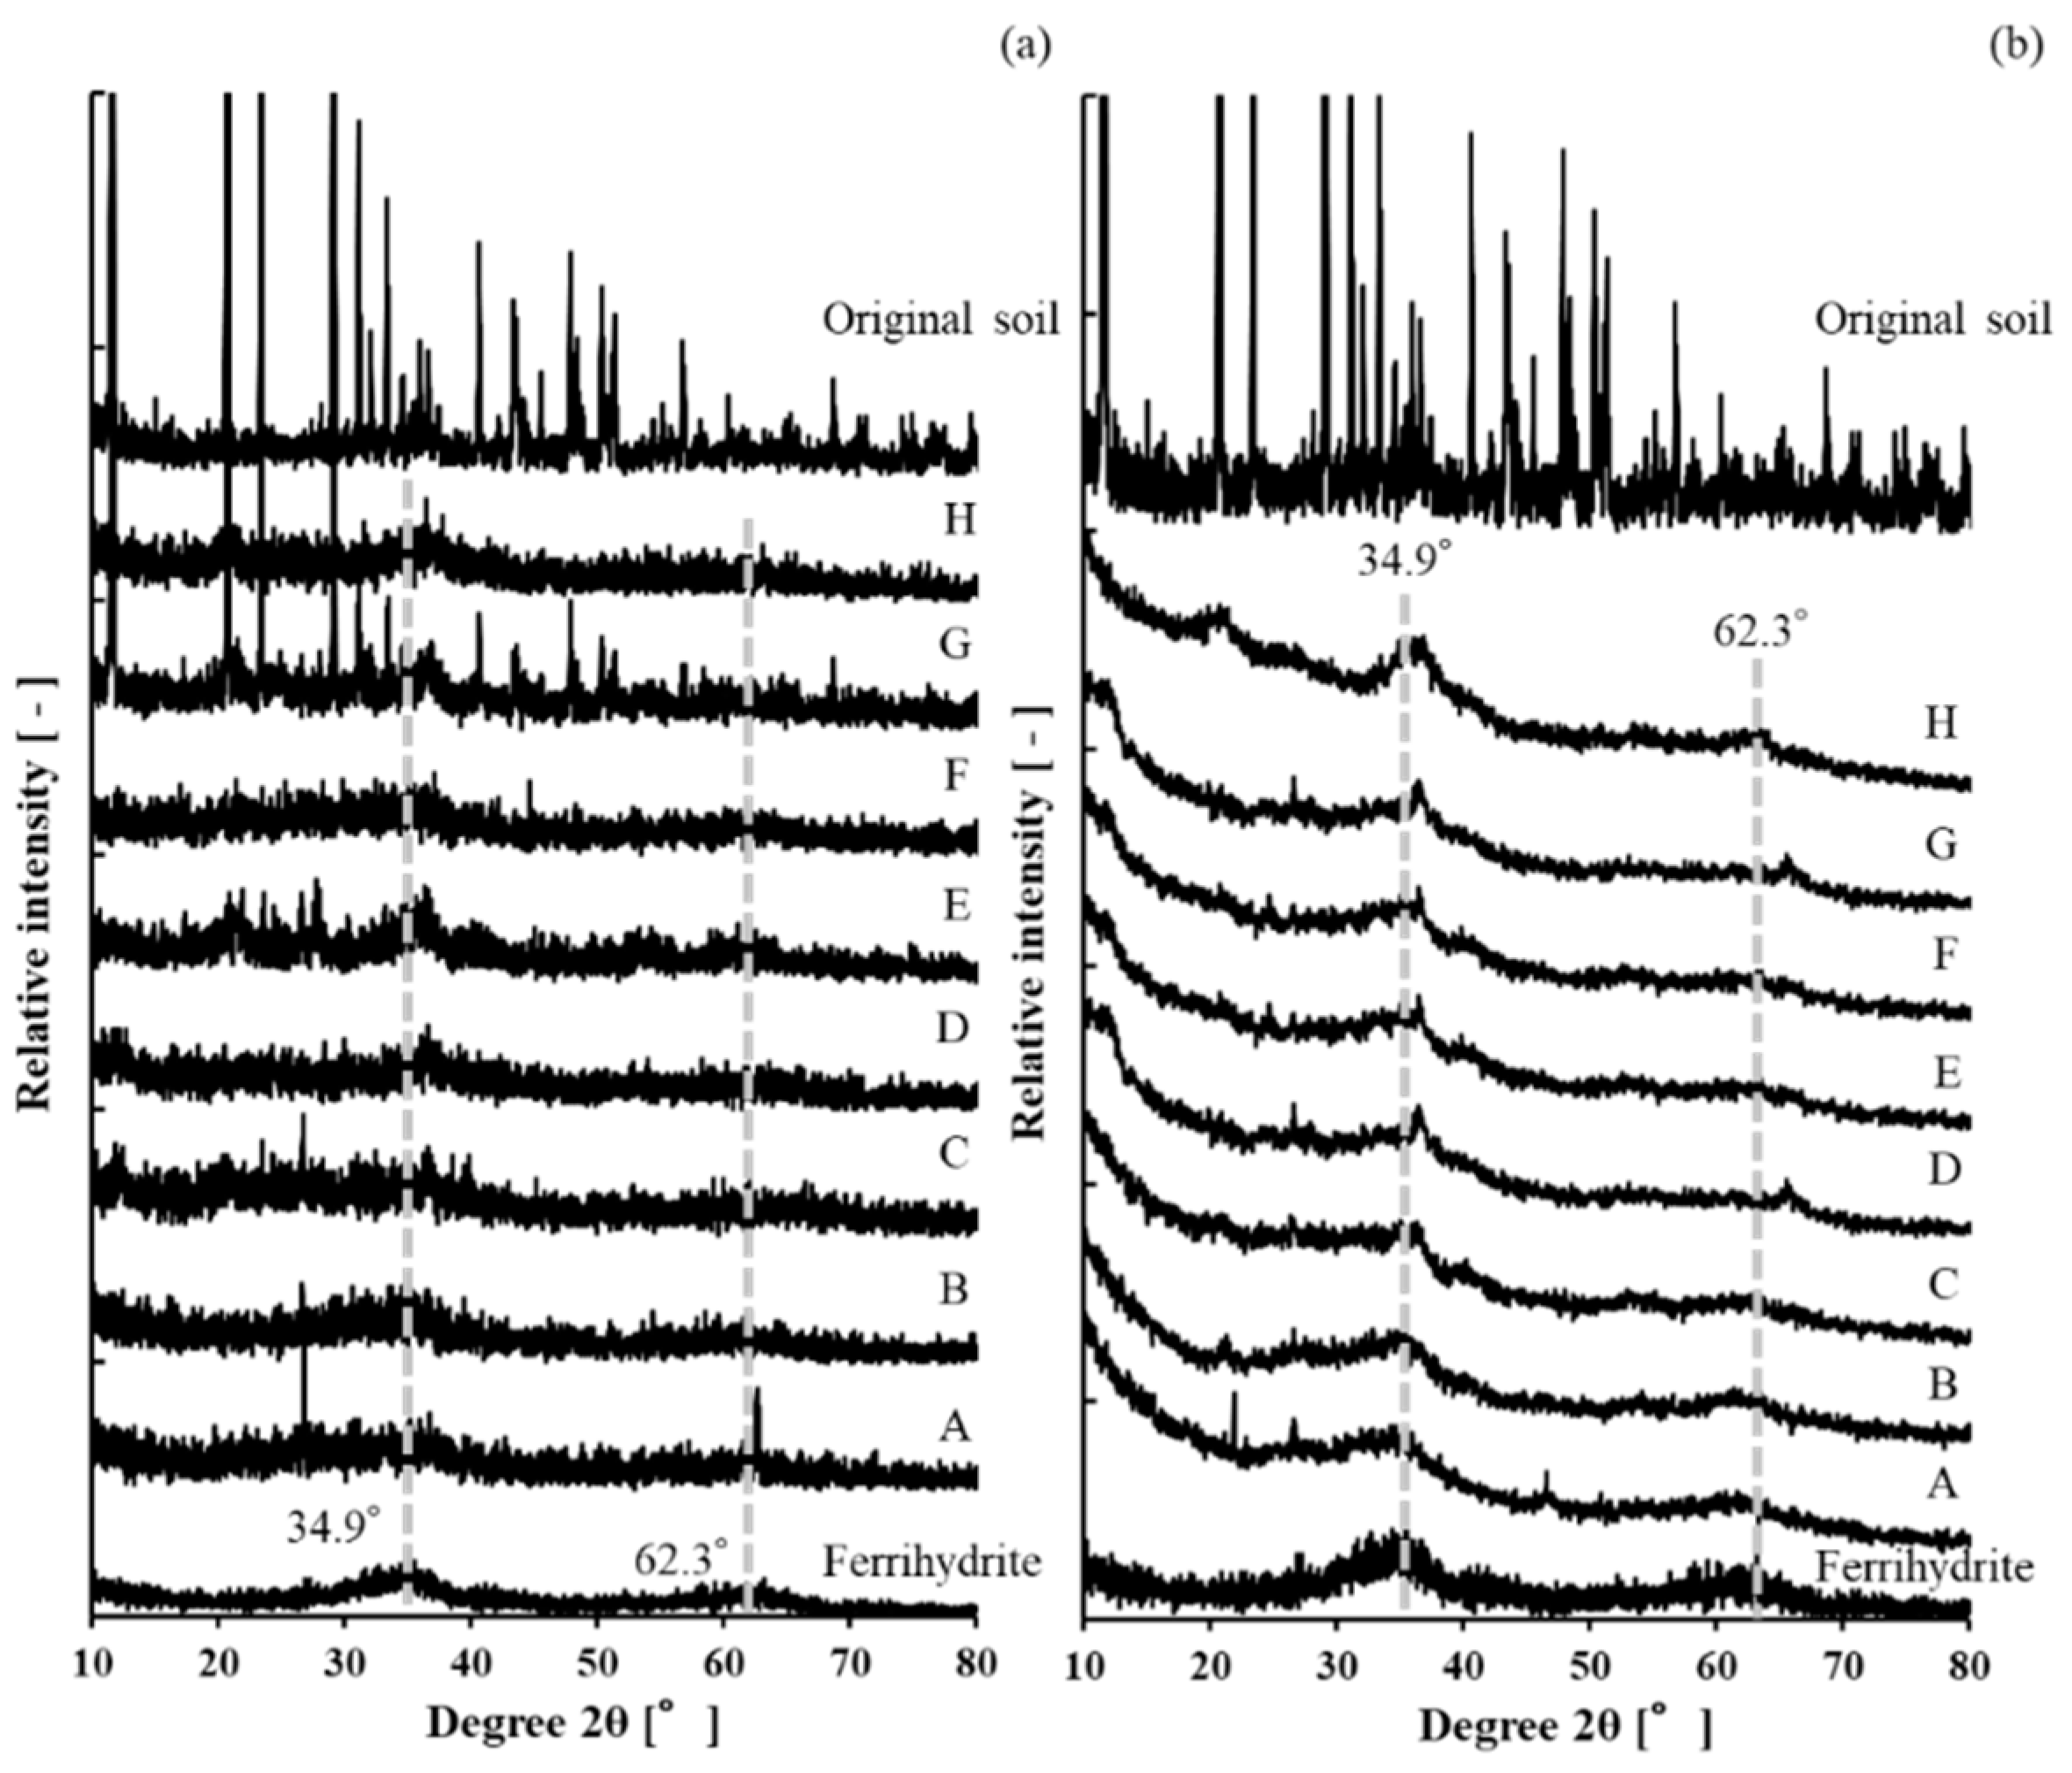
3.2. X-ray Diffraction Analysis

Figure 4 shows the XRD patterns of the sediment samples, ferrihydrite, and the original soil sample of the Yotsugi mill tailings pond in summer and winter 2016. From a previous paper [37], all XRD peaks of the original soil was that of gypsum (CaSO4∙2H2O). Comparing the peak of sediment samples and the original soil, the peak position of sediment samples was the same as that of the original sample. Additionally, the XRD patterns of sediment samples showed the broad peaks at 2θ 34.9° and 62.3°, which corresponded to the 2-line ferrihydrite (Fe(OH)3) [38,39].
The iron ion is known to be precipitated as several species (e.g., ferrihydrite, schwertmannite, and green rust). In our previous study, it was also confirmed that 2-line ferrihydrite is the most dominant as a fresh iron (hydr)oxide in AMD at neutral pH area, using XRD analysis [34]. The XRD pattern of sediment samples (Figure 4) was the same as that of the 2-line ferrihydrite reported in our previous paper [35]. Schwertmannite has been known as a good adsorbent of arsenic ion in AMD [40], but it was stable at acidic pH area and the chemical equilibrium calculation showed that ferrihydrite formation should be more dominant than schwertmannite due to the neutral pH area in the pond [41]. Schwertmannite has a specific peak around 2θ 36°, which was sharper than the 2-line ferrihydrite, but Figure 4 shows no clear evidence of the existence of schwertmannite [42]. Green rust is also known to remove many different kinds of anions from AMD; however, a more reducing atmosphere is necessary for green rust formation [43,44,45]. Therefore, it is suggested that all iron in Yotsugi mill tailings pond was precipitated as 2-line ferrihydrite. Several researchers have conducted a more detailed investigation of iron (hydr)oxide during ferrous-mediated autotrophic denitrification with some crystalline phases, such as goethite, hematite, akaganeite, and maghemite. In this study, denitrification was not dominant and Figure 4 provides no clear evidence of the existence of such crystalline phases; however, detailed detection of minor iron phases using Fourier transform Raman Spectroscopy infrared spectroscopy and a discussion of their effect on arsenic removal will be part of our future work [46,47].
The broad peak position of 2-line ferrihydrite did not change when the arsenic was removed by surface complexation for 2-line ferrihydrite in our previous study [35]. On the other hand, it changed from 34° to 28° when arsenic was removed by surface precipitation [5,35]. Thus, since there was no obvious peak shift around 28° in XRD patterns, it was confirmed that the arsenic removal mechanism in Yotsugi mill tailings pond was a simple surface complexation on the 2-line ferrihydrite.

3.3. Geofluid Analysis

The geofluid analysis simulation was performed using the precipitation given in the surface model based on elevation data. The inlet flow rates, precipitation, and evaporation measured during summer and winter are presented in Table 5. The precipitation and evaporation values were averaged for the whole simulation area (i.e., the pond and catchment area). The simulation results are presented in Figure 5. The simulation suggested that the influent from the catchment area flowed into the Yotsugi mill tailings pond in the lower part of the simulation area. The flow lines of the Yotsugi mill tailings pond on the northern and southern sides did not converge downstream, which indicated that these flows were separate.

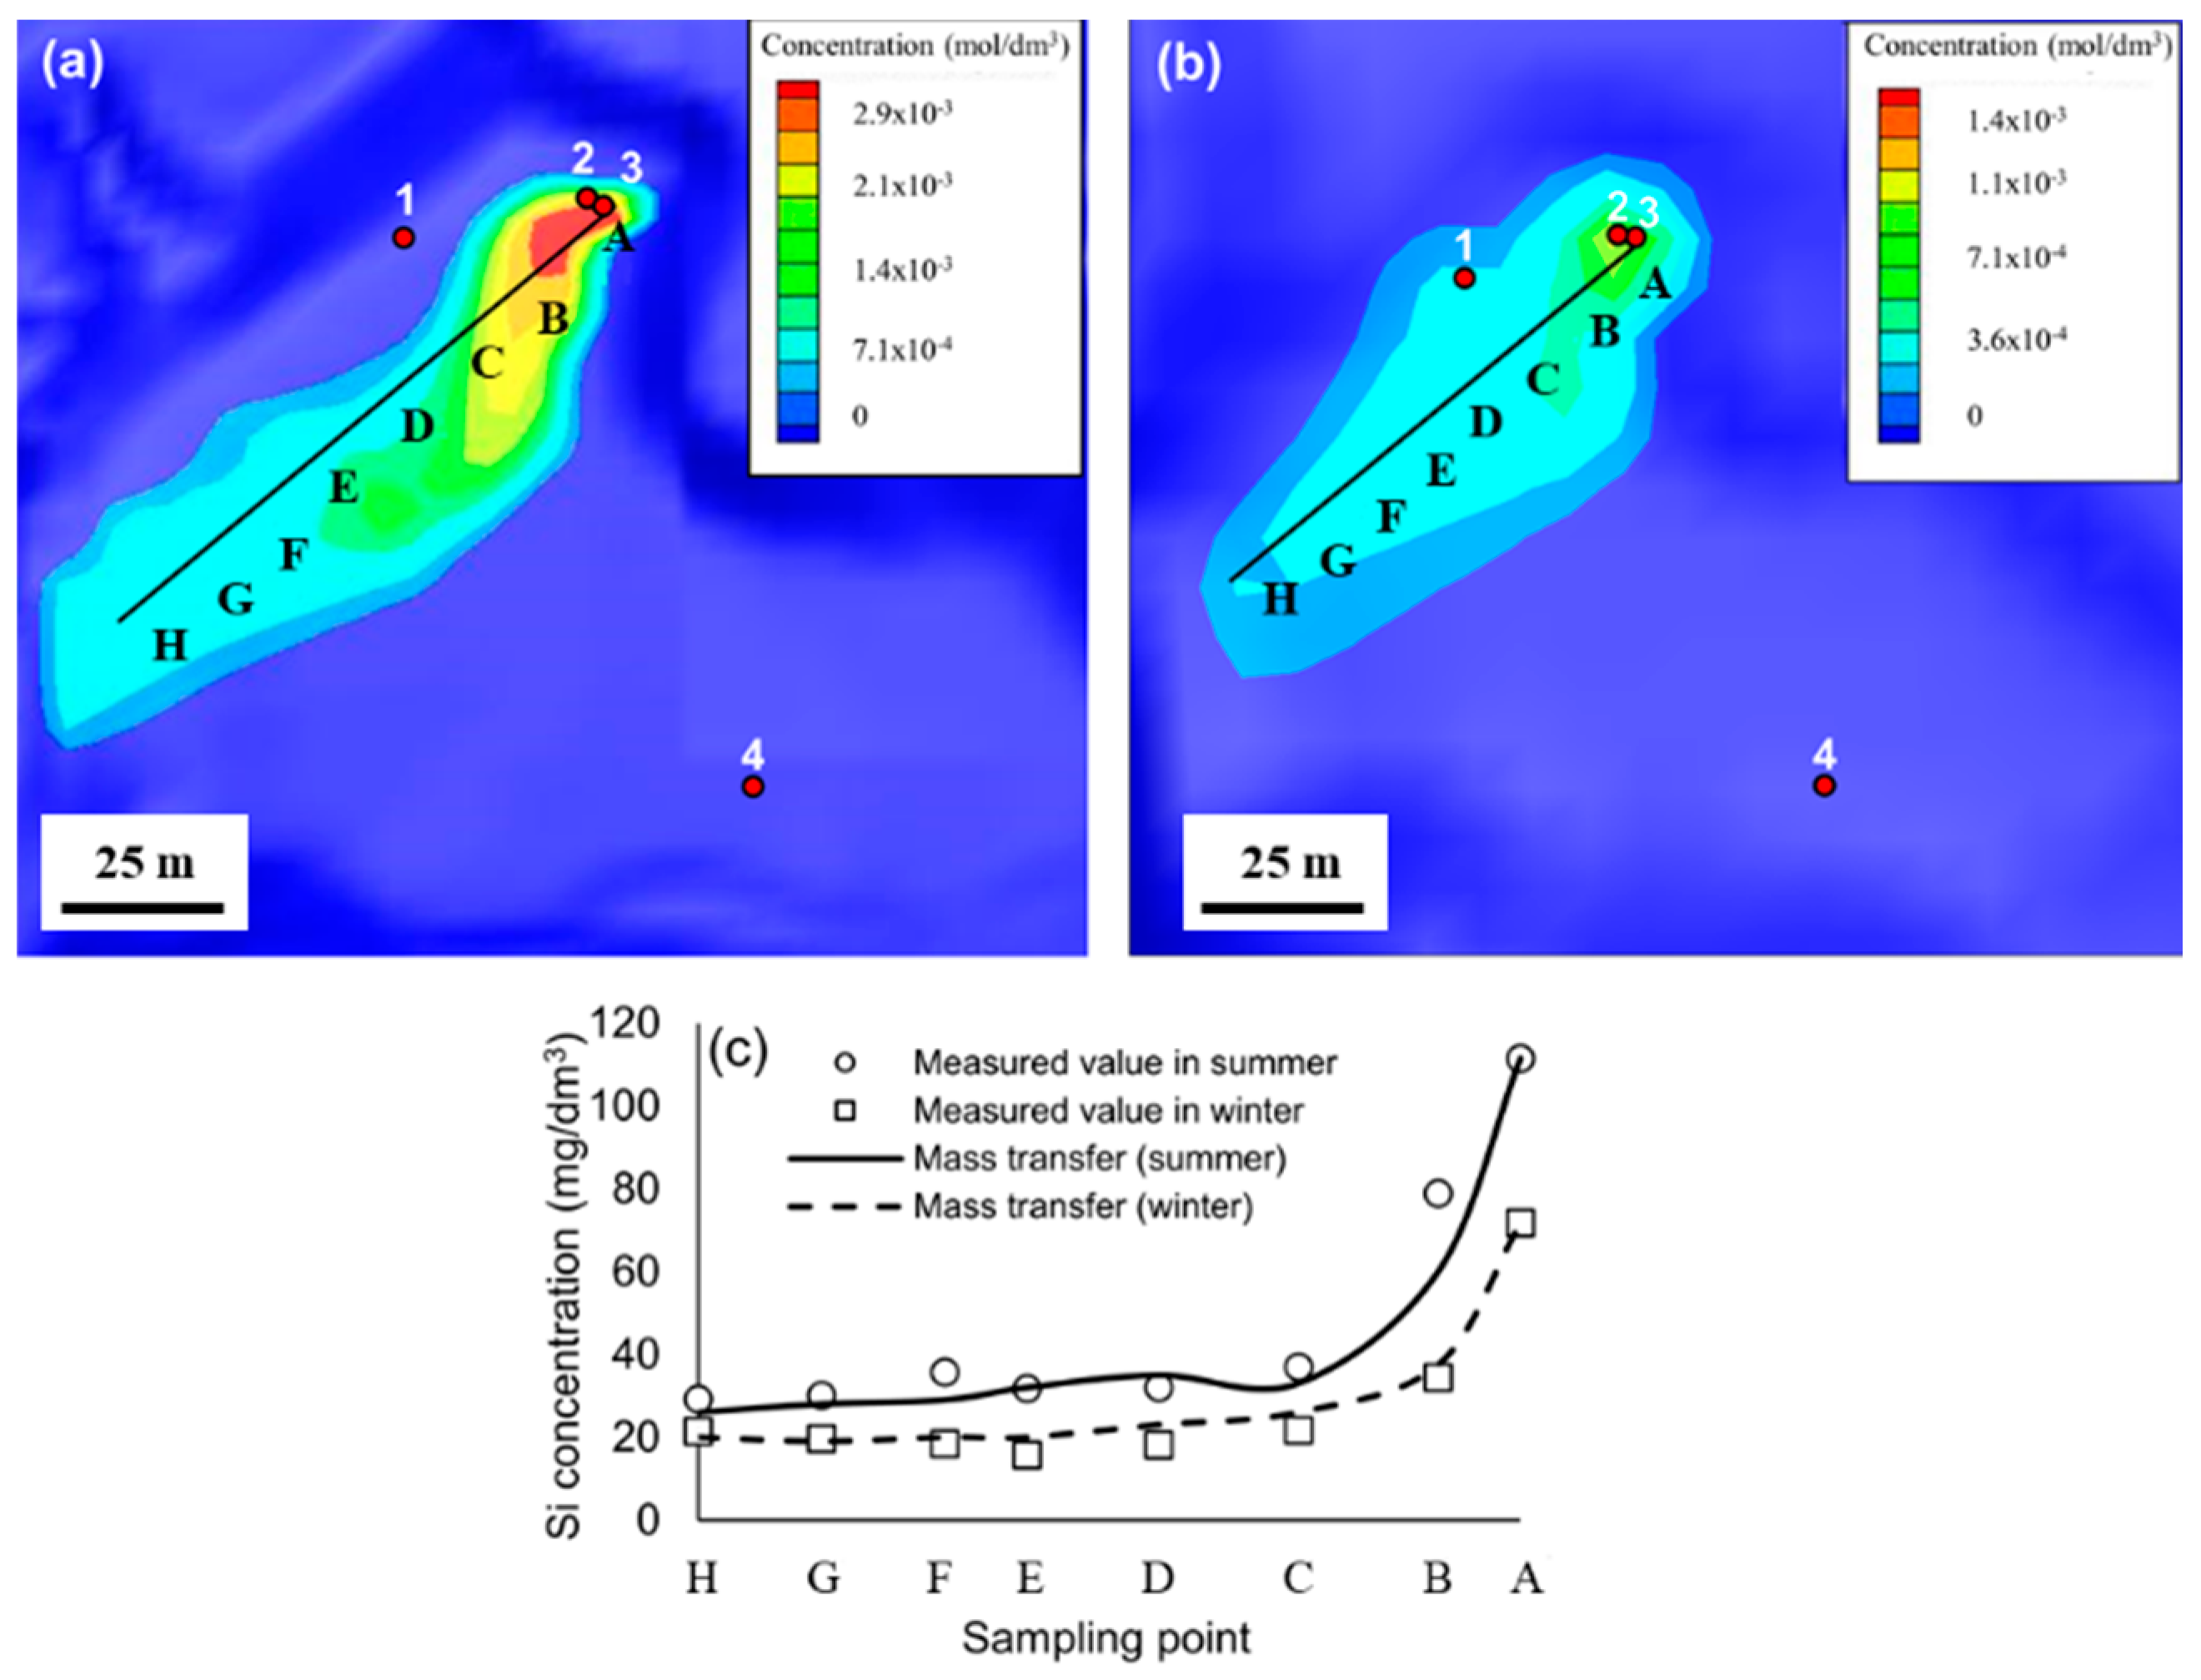
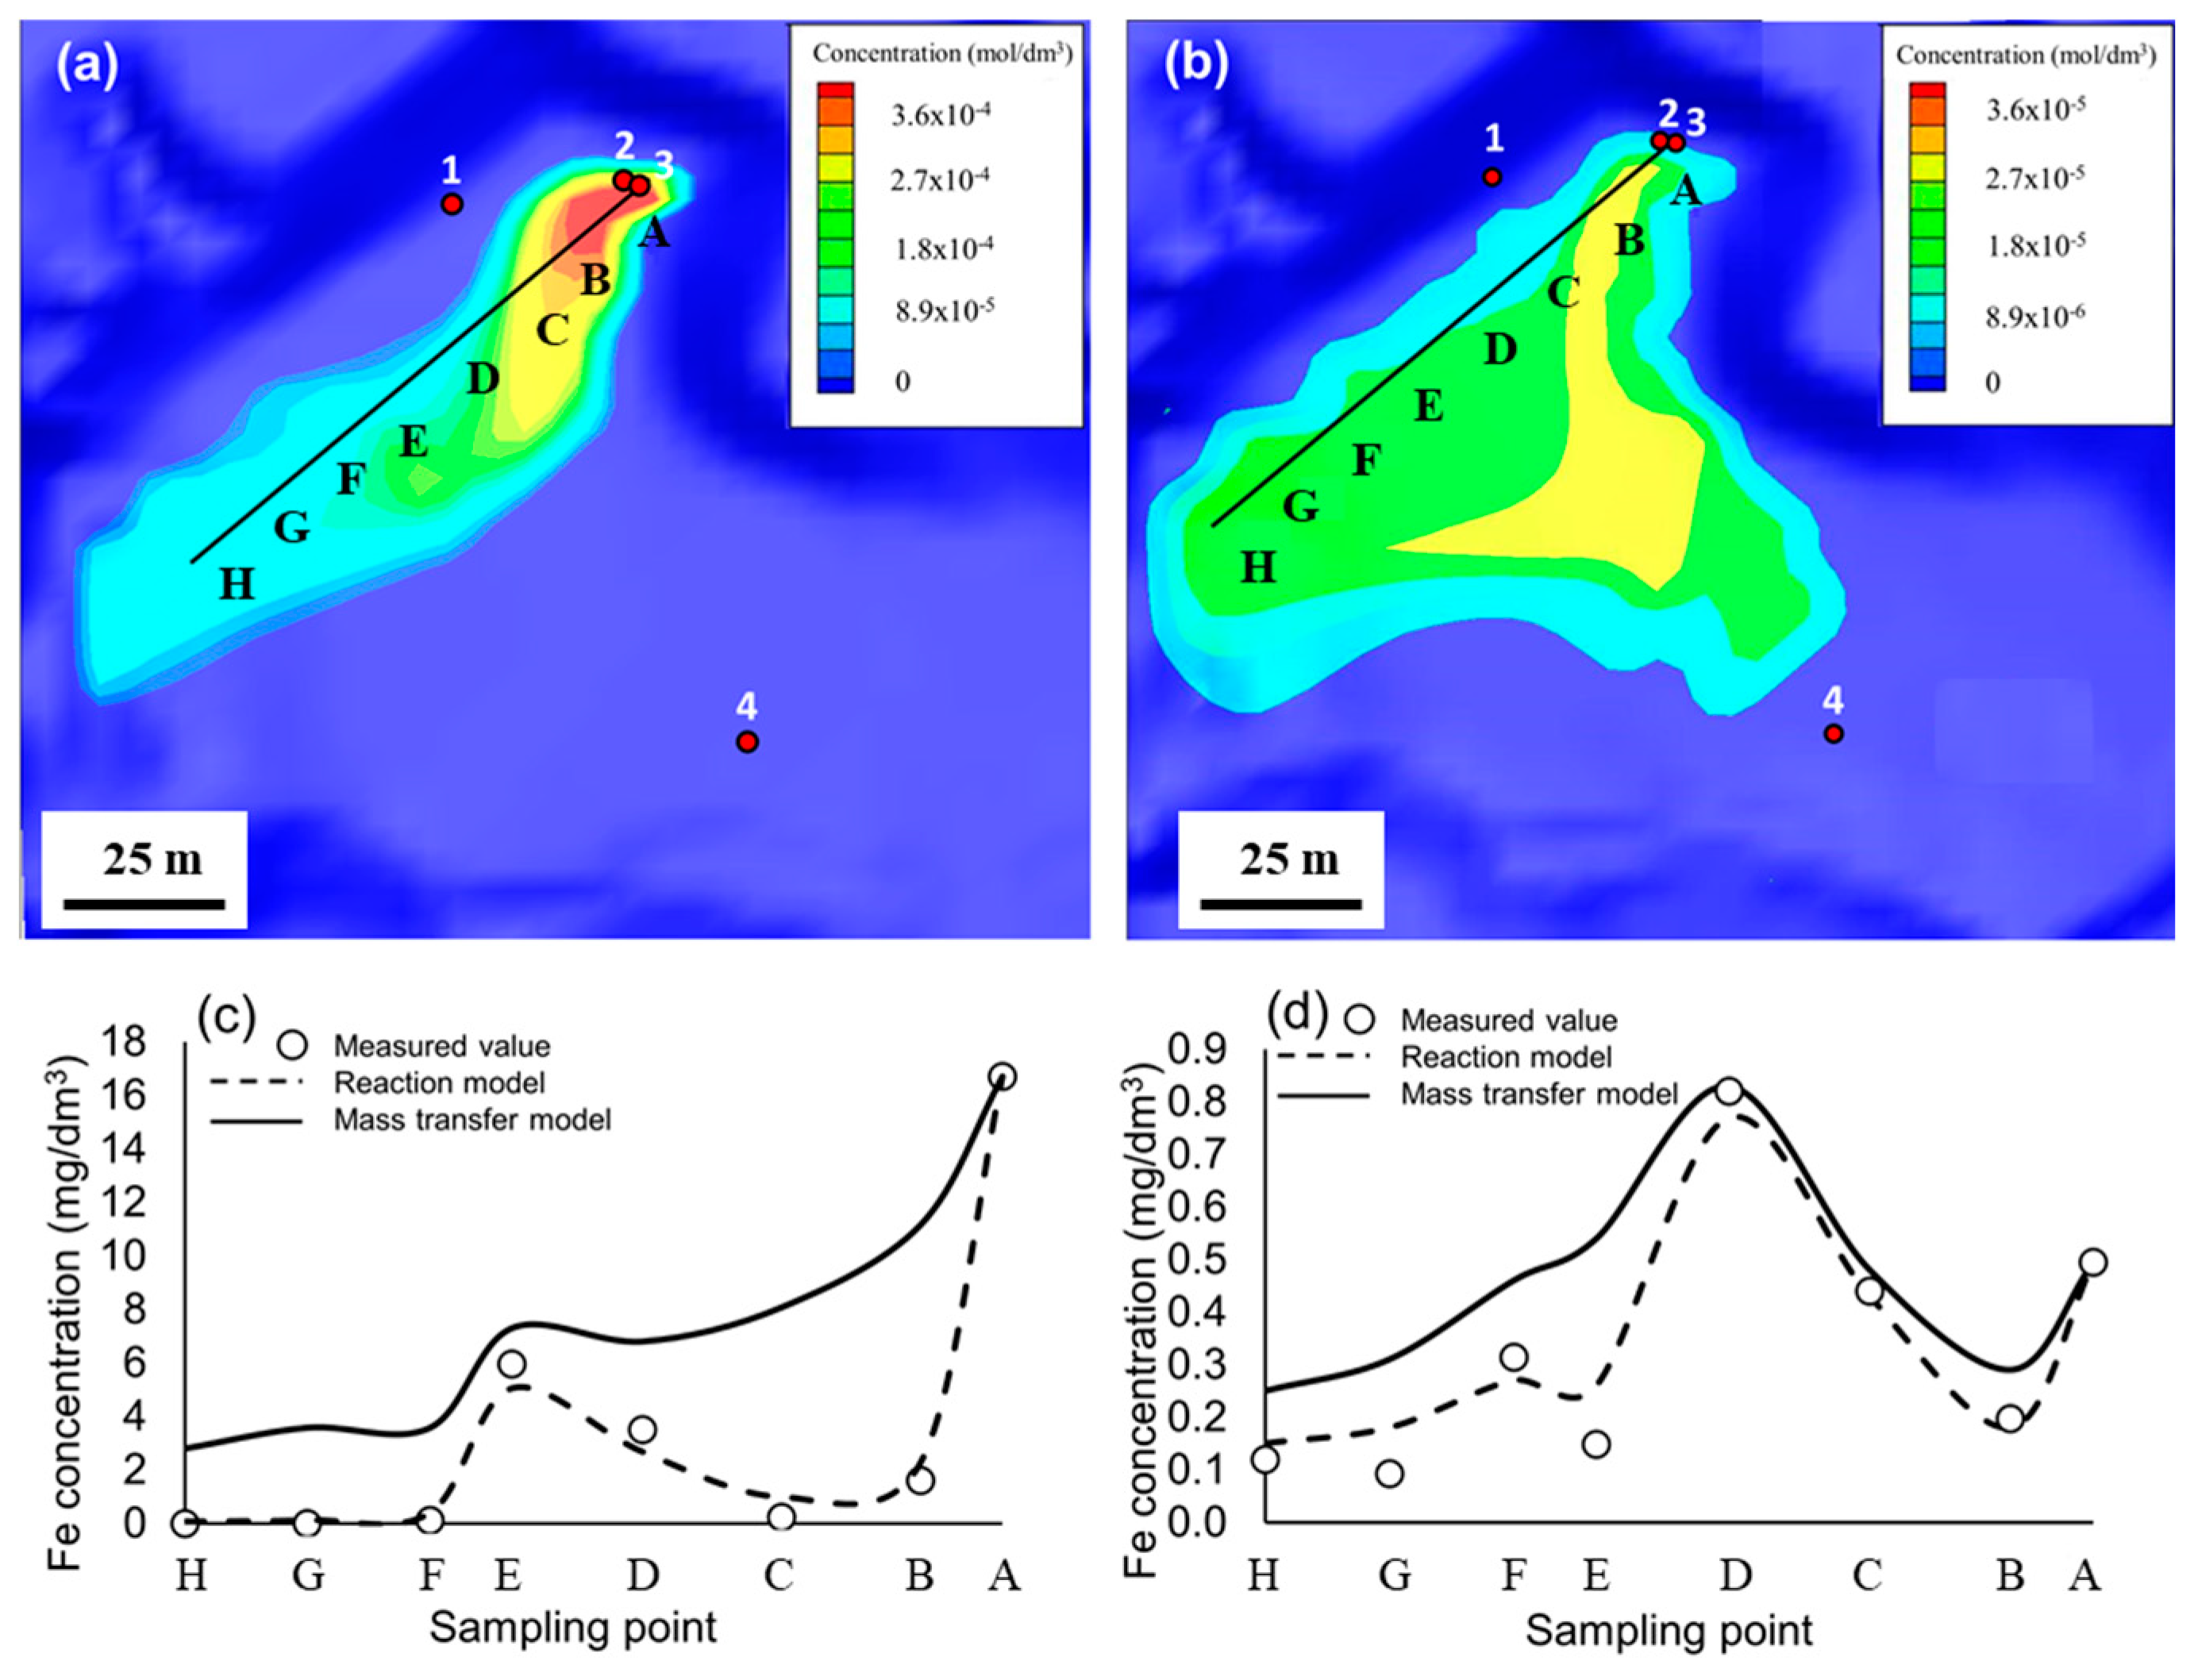
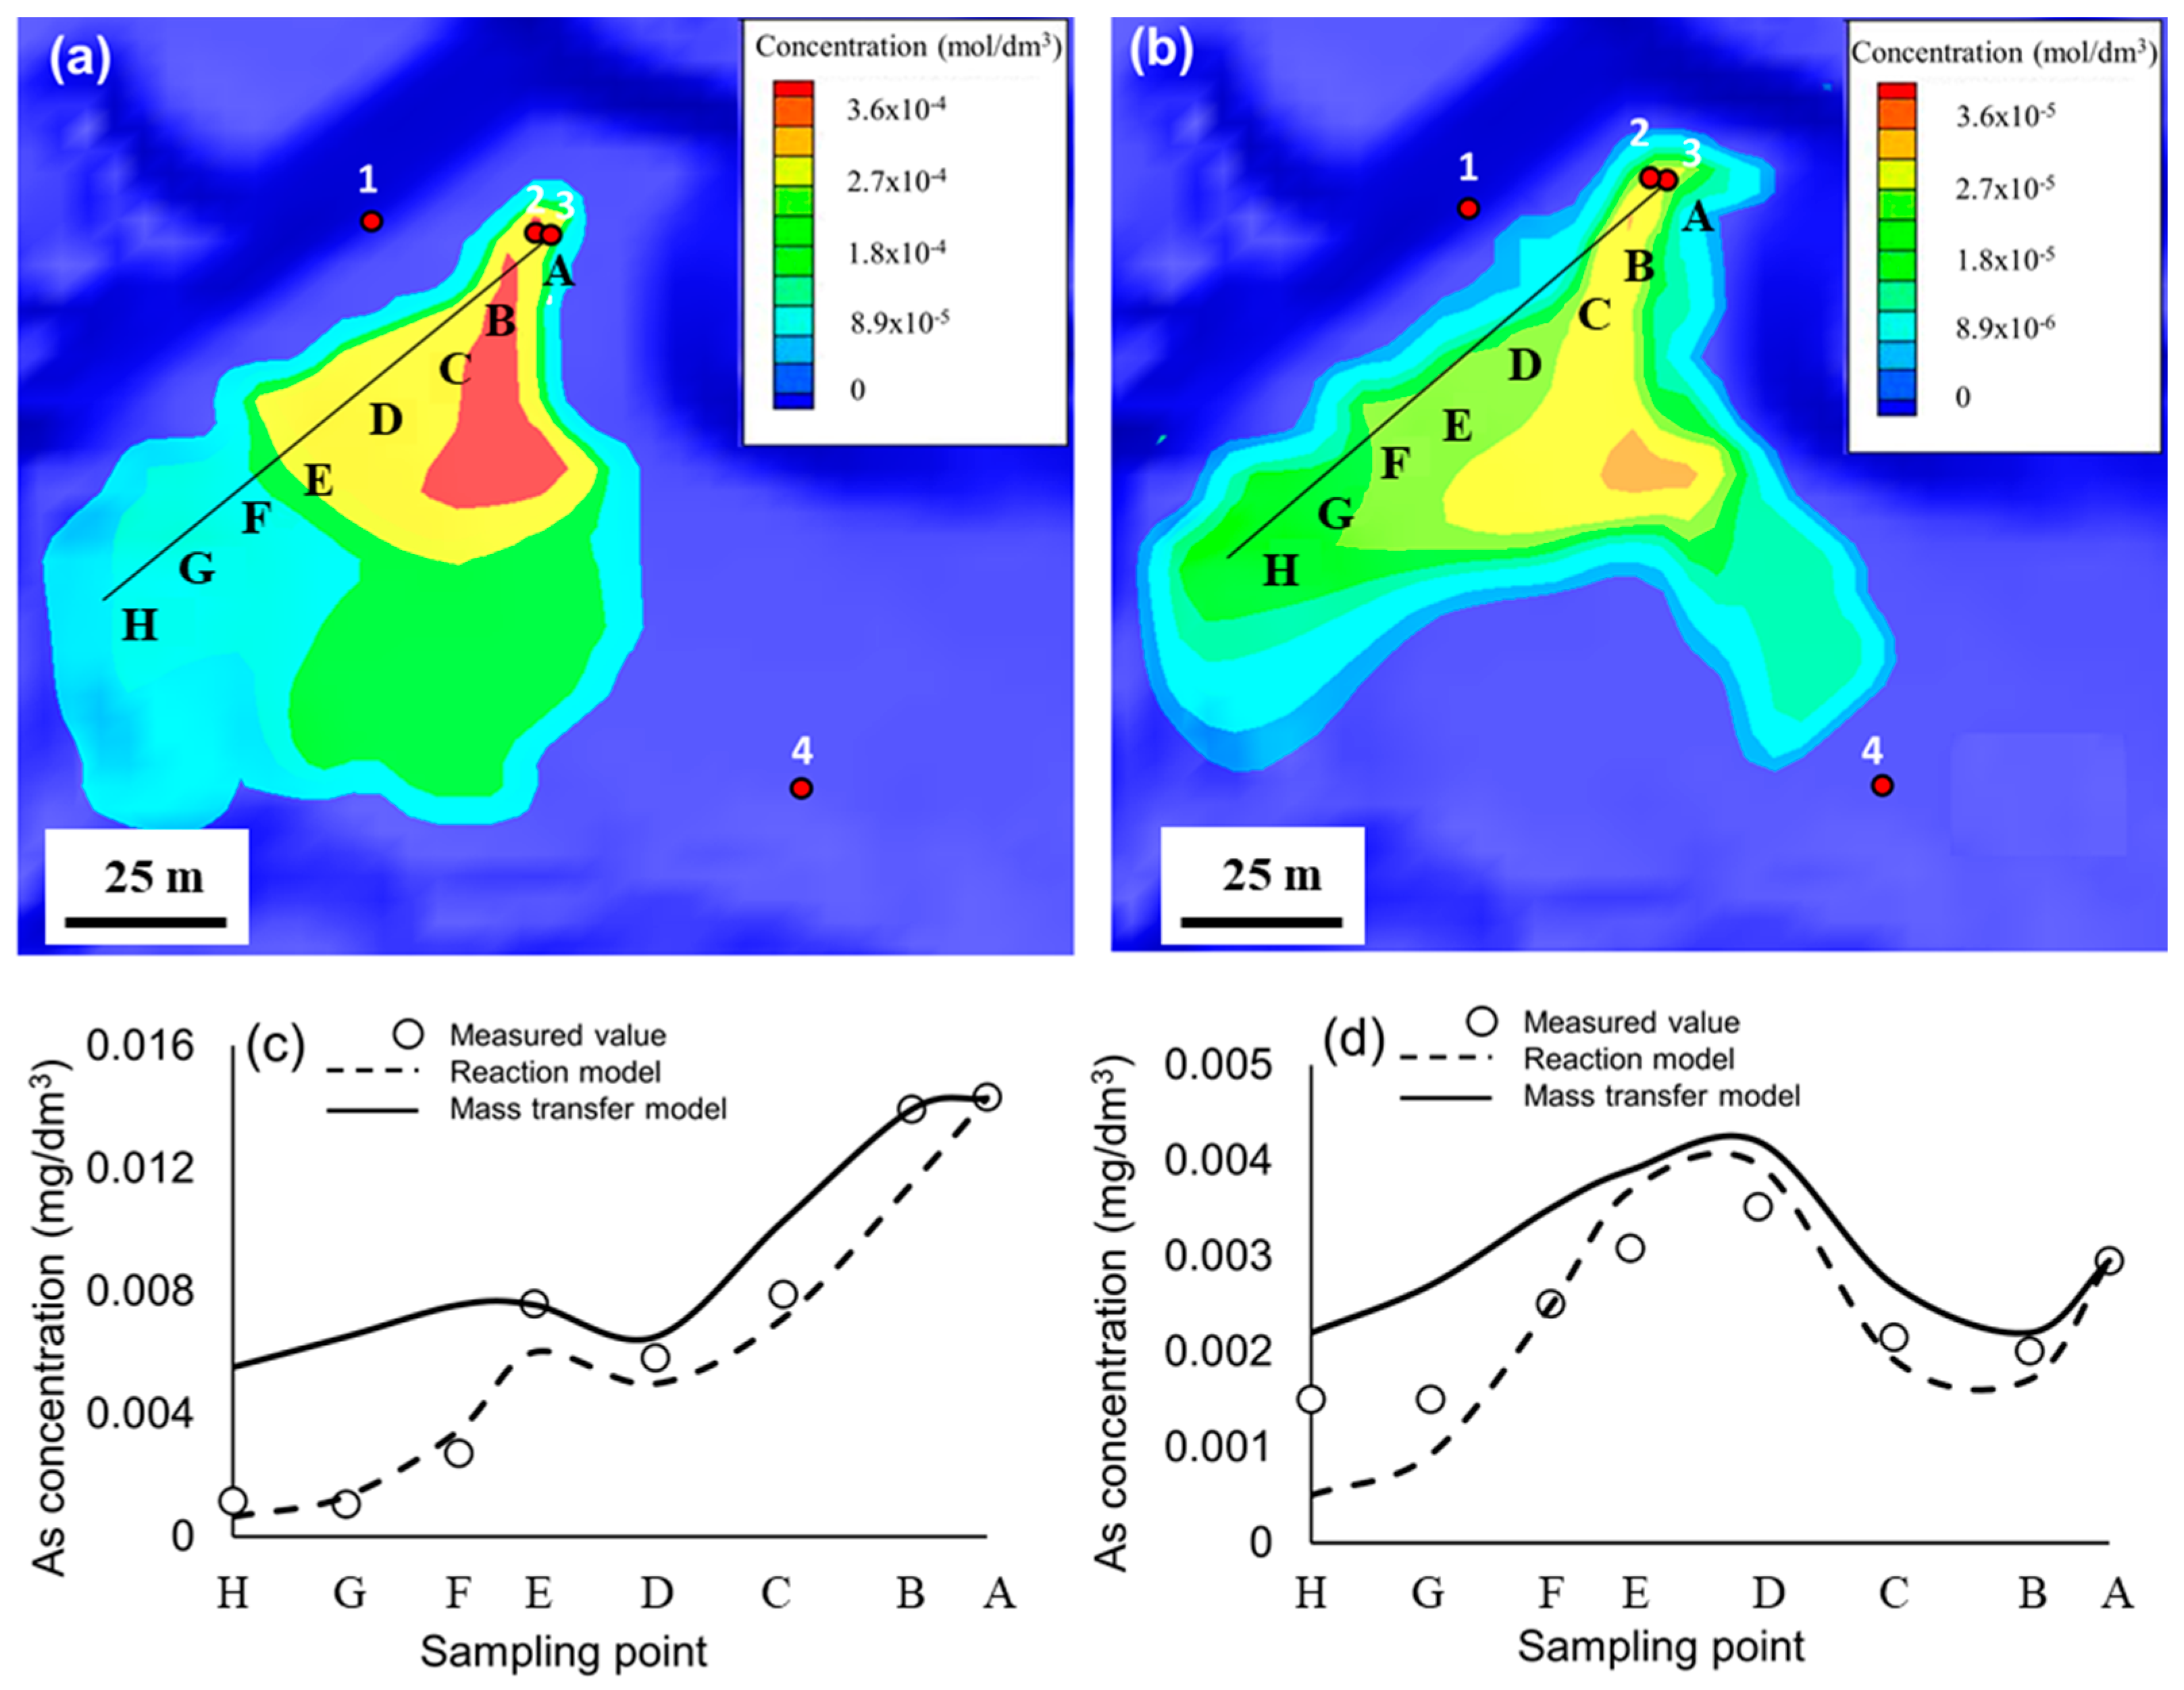
3.4. Quantitative Modeling

The distribution map of the concentration of silicon ion in the summer and winter and the relationship between measured values and simulation results are shown in Figure 6. The concentration of silicon ion was greatly affected by the inflow from inlet 2, which was the discharge from the opencast mine (point ii). The simulation results matched well with the measured values (Figure 6c), indicating that the transport of silicon ion followed a mass transfer model without any reaction. These results also suggested that they were treated as flow field data and the dilution of silicon ion between points C and A occurred because of flow from the other inlets, which had lower concentrations and rainfall. The simulation results in summer showed that dilution contributed 74.6% to the concentration of silicon ion. Similarly, in winter, the contribution of dilution was 70.8%. The difference in percentages between summer and winter was assumed to be caused by differences in the inflow volumes of AMD to the Yotsugi mill tailings pond.
In the Yotsugi mill tailings pond, iron (hydr)oxides occurred because the pH was around 7. As the ferric (which was produced by the oxidation of ferrous) immediately precipitated as the 2-line ferrihydrite, it was considered that ferric ion was not included in the water. Thus, the ferric ion was not included in our model. The iron distribution was simulated by advection–diffusion using the oxidation reaction. Distribution maps of an iron in summer and winter were simulated using GETFLOWS (Figure 7). The concentration of an iron ion in the Yotsugi mill tailings pond in summer was mostly affected by AMD from inlet 2, which had the highest influent concentration among the inlets and a high flow rate. The concentration of the iron ion decreased in the flow direction and reached the lowest concentration at downstream point A. The concentration of iron ion was low in winter because the average concentration of iron ion from all of the inlets was low. The models for the mass transfers and reactions with measured values are depicted in Figure 7c,d. The concentration of iron ion dropped suddenly at point B, which indicated that the ferrous ion was oxidized to ferric ion and immediately precipitated. At several points, such as points D and E in summer and points C and D in winter, there were concentration increases. At these points, the concentration of iron ion was affected by the adjacent inflow from inlet 1. Overall, the measured values in summer and winter were successfully represented with the reaction model, which suggested that the kinetics model of oxidation of ferrous derived from the laboratory could be applied to the field. This result indicated that oxidation of ferrous was caused by the activity of the hydroxide ion and the oxygen partial pressure. In previous studies, it was reported that the oxidation of ferrous should be affected by not only chemistry but also biogeochemistry [32]. These factors should directly change ferrous speciation and concentration, DO, pH, and the kinetic constant, which should be affected by both the situation of dispersion of oxygen and the interface of precipitates in Equation (4). In our system, it was confirmed that the effect of biogeochemistry was small enough to be ignored, because the simple kinetics model of oxidation of ferrous with the kinetic constants but without any biogeochemistry influence (previously proposed by Singer and Stumn [29]) was quantitatively consistent with iron and arsenic ions distribution.
To model the flow field, the concentration distribution of the arsenic ion was simulated by advection–diffusion using the reactions. The simulation results for that in summer and winter are presented in Figure 8a,b. Generally, the concentration distribution of arsenic ion in summer and winter was consistent with that of the iron ion. As the water flowed further from the main inlet, the concentration gradually decreased. This pattern suggests that arsenite/arsenate adsorption occurred during coprecipitation with the 2-line ferrihydrite. Similar to iron ion, there was an increase in the concentration arsenic ion at certain points, which was caused by the inflow from inlet 1. This increase occurred at point E in summer and point D in winter. In Figure 8c,d, the simulation results using the reaction model successfully represented the concentration of arsenic, obtained from field survey, at each point, while that using the mass transfer model did not represent these. These results highlight that the decrease in concentration of the arsenic ion was caused by adsorption on the 2-line ferrihydrite. In addition, they showed that the Langmuir model using the constants, derived from the Dzombak and Morel model for arsenite/arsenate adsorption on the 2-line ferrihydrite and the oxidation reaction of arsenite using k3 were applicable in the field. Thus, the main mechanism of arsenic removal was surface complexation for the 2-line ferrihydrite, as a chemical reaction in the Yotsugi mill tailings pond.
From the above results, it could be seen that this model was effective to represent the trend of each element in the Yotsugi mill tailings pond. Thus, we could estimate the distribution of concentration of each element in the Yotsugi mill tailings pond using this model when several parameters, such as flow rate and evaporation, are modified due to climate change, in the future.

4. Conclusions

In the Ningyo-toge mine, AMD and several toxic element, such as iron and arsenic were observed. These flow into the Yotsugi mill tailings pond, which is an artificial wetland with a partial pond. In the artificial wetland and pond, ferrous ion is naturally oxidized and precipitates as a 2-line ferrihydrite. In this study, arsenic removal in the artificial wetland and pond through coprecipitation with the 2-line ferrihydrite was simulated and there was good agreement between the measured values and the simulation results. Field sediment sampling and analysis provided further confirmation of the 2-line ferrihydrite precipitation and arsenic retention. The XRD patterns for sediment samples from the artificial wetland and pond showed that 2-line ferrihydrite was present with broad peaks at 2θ 34.9° and 62.3°. The lack of a shift in the 2-line ferrihydrite peak at 34.9° to a lower 2θ degree suggested that the arsenic removal mechanism was surface complexation. This research showed that reaction models from laboratory experiments, such as oxidation of ferrous and arsenite ions and surface complexation, are applicable in the field. Our constructed model based on the removal mechanism successfully represented the concentration and distribution of each element in the Yotsugi mill tailings pond. These results suggest that the main removal mechanism of iron and arsenic ions in the Yotsugi mill tailings pond are inorganic oxidation, precipitation, and surface complexation, while the biogeochemical effect was negligible.

Author Contributions

Conceptualization, C.T., Y.T., and Y.O.; formal analysis, T.K., Y.K., K.S., and M.K.; investigation, T.K., Y.K., K.S., and M.K.; resources, C.T. and Y.O.; writing—original draft preparation, T.K. and Y.T.; writing—review and editing, C.T.; supervision, C.T.; project administration, C.T.; funding acquisition, C.T. All authors have read and agreed to the published version of the manuscript.

Funding

This research received no external funding.

Acknowledgments

We acknowledge the Japan Atomic Energy Agency (JAEA) for providing assistance during this research. Part of this work was performed as the activities of the Waseda Research Institute for Science and Engineering and Research Organization for Open Innovation Strategy, Waseda University.

Conflicts of Interest

The authors declare no conflict of interest.

References

  1. Dold, B. Evolution of Acid Mine Drainage Formation in Sulphidic Mine Tailings. Minerals 2014, 4, 621–641. [Google Scholar] [CrossRef] [Green Version]
  2. Johnson, D.B.; Hallberg, K.B. Acid mine drainage remediation options: A review. Sci. Total. Environ. 2005, 338, 3–14. [Google Scholar] [CrossRef]
  3. Akcil, A.; Koldas, S. Acid Mine Drainage (AMD): Causes, treatment and case studies. J. Clean. Prod. 2006, 14, 1139–1145. [Google Scholar] [CrossRef]
  4. Kato, T.; Yagisawa, M.; Matsuoka, M.; Tokoro, C.; Sakakibara, T.; Hayashi, K. Quantitative Modeling Incorporating Surface Complexation for the Treatment of Acid Mine Drainage. Kagaku Kogaku Ronbunshu 2017, 43, 207–212. [Google Scholar] [CrossRef] [Green Version]
  5. Tokoro, C.; Kadokura, M.; Kato, T. Mechanism of arsenate coprecipitation at the solid/liquid interface of ferrihydrite: A perspective review. Adv. Powder Technol. 2020, 31, 859–866. [Google Scholar] [CrossRef]
  6. Al Mamun, A.; Morita, M.; Matsuoka, M.; Tokoro, C. Sorption mechanisms of chromate with coprecipitated ferrihydrite in aqueous solution. J. Hazard. Mater. 2017, 334, 142–149. [Google Scholar] [CrossRef]
  7. Tokoro, C.; Sakakibara, T.; Suzuki, S. Mechanism investigation and surface complexation modeling of zinc sorption on aluminum hydroxide in adsorption/coprecipitation processes. Chem. Eng. J. 2015, 279, 86–92. [Google Scholar] [CrossRef]
  8. Ueda, H.; Masuda, N. An Analysis on Mine Drainage Treatment Cost and the Technical Development to Prevent Mine Pollution. Shigen-to-Sozai 2005, 121, 323–329. [Google Scholar] [CrossRef] [Green Version]
  9. Otsuka, H.; Murakami, S.; Yamatomi, J.; Koide, R.; Tokoro, C. A predictive model for the future treatment of acid mine drainage with regression analysis and geochemical modeling. J. MMIJ 2014, 130, 488–493. [Google Scholar] [CrossRef] [Green Version]
  10. Koide, R.; Tokoro, C.; Murakami, S.; Adachi, T.; Takahashi, A. A Model for Prediction of Neutralizer Usage and Sludge Generation in the Treatment of Acid Mine Drainage from Abandoned Mines: Case Studies in Japan. Mine Water Environ. 2012, 31, 287. [Google Scholar] [CrossRef]
  11. Kato, T.; Fukushima, R.; Giuseppe, G.; Sato, K.; Yamagata, S.; Tokoro, C. Quantitative Modeling Incorporating Surface Complexation for Zinc Removal Using Leaf Mold. J. Soc. Powder Technol. Jpn. 2019, 56, 136–141. [Google Scholar] [CrossRef]
  12. Gazea, B.; Adam, K.; Kontopoulos, A. A review of passive systems for the treatment of acid mine drainage. Miner. Eng. 1996, 9, 23–42. [Google Scholar] [CrossRef]
  13. Tiruta-Barna, L.; Schiopu, N. Modelling inorganic biocide emission from treated wood in water. J. Hazard. Mater. 2011, 192, 1476–1483. [Google Scholar] [CrossRef] [PubMed]
  14. Fagervold, S.K.; Chai, Y.; Davis, J.W.; Wilken, M.; Cornelissen, G.; Ghosh, U. Bioaccumulation of Polychlorinated Dibenzo-p-Dioxins/Dibenzofurans inE. fetidafrom Floodplain Soils and the Effect of Activated Carbon Amendment. Environ. Sci. Technol. 2010, 44, 5546–5552. [Google Scholar] [CrossRef]
  15. Johnson, B.T.; Petty, J.D.; Huckins, J.N.; Lee, K.; Gauthier, J. Hazard assessment of a simulated oil spill on intertidal areas of the St. Lawrence River with SPMD-TOX. Environ. Toxicol. 2004, 19, 329–335. [Google Scholar] [CrossRef]
  16. Valente, T.M.; Antunes, M.; Braga, A.S.; Prudêncio, M.I.; Marques, R.; Pamplona, J. Mineralogical attenuation for metallic remediation in a passive system for mine water treatment. Environ. Earth Sci. 2011, 66, 39–54. [Google Scholar] [CrossRef] [Green Version]
  17. Furuta, S.; Ito, K.; Ishimori, Y. Measurements of radon around closed uranium mines. J. Environ. Radioact. 2002, 62, 97–114. [Google Scholar] [CrossRef]
  18. Ishimori, Y. Time-integrated monitoring of radon progeny around a closed uranium mine in Japan. J. Environ. Radioact. 2007, 93, 51–61. [Google Scholar] [CrossRef]
  19. Watanabe, K. Geochemical behavior of iron and manganese ions in the Ningyo-toge uranium deposit district, southwest Japan. Chem. Geol. 1987, 60, 299–307. [Google Scholar] [CrossRef]
  20. Kitamura, A.; Kurikami, H.; Sakuma, K.; Malins, A.; Okumura, M.; Machida, M.; Mori, K.; Tada, K.; Tawara, Y.; Kobayashi, T.; et al. Redistribution and export of contaminated sediment within eastern Fukushima Prefecture due to typhoon flooding. Earth Surf. Process. Landforms 2016, 41, 1708–1726. [Google Scholar] [CrossRef]
  21. Sakuma, K.; Kitamura, A.; Malins, A.; Kurikami, H.; Machida, M.; Mori, K.; Tada, K.; Kobayashi, T.; Tawara, Y.; Tosaka, H. Characteristics of radio-cesium transport and discharge between different basins near to the Fukushima Dai-ichi Nuclear Power Plant after heavy rainfall events. J. Environ. Radioact. 2017, 169, 137–150. [Google Scholar] [CrossRef] [PubMed]
  22. Sakuma, K.; Malins, A.; Funaki, H.; Kurikami, H.; Niizato, T.; Nakanishi, T.; Mori, K.; Tada, K.; Kobayashi, T.; Kitamura, A.; et al. Evaluation of sediment and 137Cs redistribution in the Oginosawa River catchment near the Fukushima Dai-ichi Nuclear Power Plant using integrated watershed modeling. J. Environ. Radioact. 2017, 182, 44–51. [Google Scholar] [CrossRef] [PubMed]
  23. Nagayasu, T.; Taki, T.; Fukushima, S. History and current situation of mine water treatment in Nigyo-toge uranium mine. JAEA Technol. 2017, 31, 1–74. [Google Scholar]
  24. Furusho, Y.; Ono, M.; Yamada, M.; Ohashi, K.; Kitade, T.; Kuriyama, K.; Ohta, S.; Inoue, Y.; Motomizu, S. Advanced Solid Phase Extraction for Inorganic Analysis and Its Applications. Bunseki Kagaku 2008, 57, 969–989. [Google Scholar] [CrossRef] [Green Version]
  25. Tosaka, H.; Ito, K.; Furuno, T. Fully coupled formulation of surface flow with 2-phase subsurface flow for hydrological simulation. Hydrol. Process. 2000, 14, 449–464. [Google Scholar] [CrossRef]
  26. Mori, K.; Tada, K.; Tawara, Y.; Ohno, K.; Asami, M.; Kosaka, K.; Tosaka, H. Integrated watershed modeling for simulation of spatiotemporal redistribution of post-fallout radionuclides: Application in radiocesium fate and transport processes derived from the Fukushima accidents. Environ. Model. Softw. 2015, 72, 126–146. [Google Scholar] [CrossRef]
  27. Tosaka, H.; Matsumoto, Y. An efficient reservoir simulation by the successive explicitization process. J. Jpn. Assoc. Pet. Technol. 1987, 52, 307–313. [Google Scholar] [CrossRef]
  28. Tawara, Y.; Hazart, A.; Mori, K.; Tada, K.; Shimura, T.; Sato, S.; Yamamoto, S.; Asano, H.; Namiki, K. Extended two-phase flow model with mechanical capability to simulate gas migration in bentonite. Geol. Soc. Lond. Spéc. Publ. 2014, 400, 545–562. [Google Scholar] [CrossRef]
  29. Singer, P.C.; Stumm, W. Acidic Mine Drainage: The Rate-Determining Step. Science 1970, 167, 1121–1123. [Google Scholar] [CrossRef]
  30. Oscarson, D.W.; Huang, P.M.; Hammer, U.T.; Liaw, W.K. Oxidation and sorption of arsenite by manganese dioxide as influenced by surface coatings of iron and aluminum oxides and calcium carbonate. Water Air Soil Pollut. 1983, 20, 233–244. [Google Scholar] [CrossRef]
  31. Bednar, A.; Garbarino, J.; Ranville, J.; Wildeman, T. Effects of iron on arsenic speciation and redox chemistry in acid mine water. J. Geochem. Explor. 2005, 85, 55–62. [Google Scholar] [CrossRef]
  32. Kiskira, K.; Papirio, S.; Van Hullebusch, E.D.; Esposito, G. Fe(II)-mediated autotrophic denitrification: A new bioprocess for iron bioprecipitation/biorecovery and simultaneous treatment of nitrate-containing wastewaters. Int. Biodeterior. Biodegrad. 2017, 119, 631–648. [Google Scholar] [CrossRef]
  33. Parga, J.R.; Cocke, D.L.; Valenzuela-Garcia, J.L.; Gomes, J.A.; Kesmez, M.; Irwin, G.; Moreno, H.; Weir, M. Arsenic removal via electrocoagulation from heavy metal contaminated groundwater in La Comarca Lagunera México. J. Hazard. Mater. 2005, 124, 247–254. [Google Scholar] [CrossRef] [PubMed]
  34. Ahoranta, S.H.; Kokko, M.; Papirio, S.; Ozkaya, B.; Puhakka, J.A. Arsenic removal from acidic solutions with biogenic ferric precipitates. J. Hazard. Mater. 2016, 306, 124–132. [Google Scholar] [CrossRef]
  35. Tokoro, C.; Yatsugi, Y.; Koga, H.; Owada, S. Sorption Mechanisms of Arsenate during Coprecipitation with Ferrihydrite in Aqueous Solution. Environ. Sci. Technol. 2010, 44, 638–643. [Google Scholar] [CrossRef]
  36. Allison, J.D.; Brown, D.S.; Novo-Gradac, K.J. Minteqa2/prodefa2—A geochemical assessment model for environmental systems: User manual supplement for version 4.0. Environ. Res. Lab. 1998, 4, 43–74. [Google Scholar]
  37. Cole, W.F.; Lancucki, C.J. A refinement of the crystal structure of gypsum CaSO4∙2H2O. Acta Cryst. 1974, B30, 921–929. [Google Scholar] [CrossRef] [Green Version]
  38. Jia, Y.; Xu, L.; Fang, Z.; Demopoulos, G.P. Observation of Surface Precipitation of Arsenate on Ferrihydrite. Environ. Sci. Technol. 2006, 40, 3248–3253. [Google Scholar] [CrossRef]
  39. Jia, Y.; Xu, L.; Wang, X.; Demopoulos, G.P. Infrared spectroscopic and X-ray diffraction characterization of the nature of adsorbed arsenate on ferrihydrite. Geochim. Cosmochim. Acta 2007, 71, 1643–1654. [Google Scholar] [CrossRef]
  40. Fukushi, K.; Sasaki, M.; Sato, T.; Yanase, N.; Amano, H.; Ikeda, H. A natural attenuation of arsenic in drainage from an abandoned arsenic mine dump. Appl. Geochem. 2003, 18, 1267–1278. [Google Scholar] [CrossRef]
  41. Bigham, J.; Schwertmann, U.; Traina, S.; Winland, R.; Wolf, M. Schwertmannite and the chemical modeling of iron in acid sulfate waters. Geochim. Cosmochim. Acta 1996, 60, 2111–2121. [Google Scholar] [CrossRef]
  42. Cornell, R.M.; Schwertmann, H.C.U. The Iron Oxides: Structure, Properties, Reactions, Occurences and Uses, 2nd ed.; John Wiley & Sons: Hoboken, NJ, USA, 2003; pp. 345–364. ISBN 9783527302741. [Google Scholar]
  43. Perez, J.P.H.; Freeman, H.; Schuessler, J.A.; Benning, L.G. The interfacial reactivity of arsenic species with green rust sulfate (GRSO4). Sci. Total. Environ. 2019, 648, 1161–1170. [Google Scholar] [CrossRef] [PubMed]
  44. Al Mamun, A.; Onoguchi, A.; Granata, G.; Tokoro, C. Role of pH in green rust preparation and chromate removal from water. Appl. Clay Sci. 2018, 165, 205–213. [Google Scholar] [CrossRef]
  45. Onoguchi, A.; Granata, G.; Haraguchi, D.; Hayashi, H.; Tokoro, C. Kinetics and mechanism of selenate and selenite removal in solution by green rust-sulfate. R. Soc. Open Sci. 2019, 6, 182147. [Google Scholar] [CrossRef] [PubMed] [Green Version]
  46. Kiskira, K.; Papirio, S.; Mascolo, M.C.; Fourdrin, C.; Pechaud, Y.; Van Hullebusch, E.D.; Esposito, G. Mineral characterization of the biogenic Fe(III)(hydr)oxides produced during Fe(II)-driven denitrification with Cu, Ni and Zn. Sci. Total. Environ. 2019, 687, 401–412. [Google Scholar] [CrossRef]
  47. Senko, J.M.; Dewers, T.A.; Krumholz, L.R. Effect of Oxidation Rate and Fe(II) State on Microbial Nitrate-Dependent Fe(III) Mineral Formation. Appl. Environ. Microbiol. 2005, 71, 7172–7177. [Google Scholar] [CrossRef] [Green Version]
Figure 1. Inlet points of acid mine drainage in the Yotsugi mill tailings pond.
Minerals 10 00475 g001
Figure 2. Sampling points along the Yotsugi mill tailings pond.
Minerals 10 00475 g002
Figure 3. The boundary of the simulation area (the red line), which was set on the ridges surrounding the Yotsugi mill tailings pond.
Minerals 10 00475 g003
Figure 4. X-ray diffraction patterns of sediment samples (a) in summer and (b) winter.
Minerals 10 00475 g004
Figure 5. Simulation result along the flow line. The red dashed line is the Yotsugi mill tailings pond and the black line is the boundary of the catchment area.
Minerals 10 00475 g005
Figure 6. Simulation result: Distribution map of Si concentrations (a) in summer and (b) in winter, and (c) measured Si concentrations on lines A–H and the fitting results.
Minerals 10 00475 g006
Figure 7. Simulation result: Distribution map of Fe concentrations (a) in summer, (b) in winter, and (c,d) measured Si concentrations on the lines A–H and the fitting results.
Minerals 10 00475 g007
Figure 8. Simulation result: Distribution map of As concentrations (a) in summer, (b) in winter, and (c,d) measured Si concentrations on lines A–H and the fitting results.
Minerals 10 00475 g008
Table 1. The distance of the sampling points from A in the Yotsugi mill tailings pond (m).
PointABCDEFGH
Distance0102744607085100
Table 2. The Langmuir constants of arsenite and arsenate adsorption on ferrihydrite.
Langmuir ConstantAmount of Saturated Adsorption [mol/mol-Fe]
Arsenate (As(V))2.27 × 1062.70 × 10−1
Arsenite (As(III))1.13 × 1068.82 × 10−2
Table 3. Properties of the water sample obtained during field survey in summer 2016.
PointTEMPpH
(–)
DOECORPConcentration (mg/L)
SiFe2+AsNaKCaMgAlSO4Cl
I15.66.58.7170.1244.16.1 × 10−3172.3186.32.8 × 10−31435
Ii11.96.58.8310.031.1 × 102161.4 × 10−2553.221105.8 × 10−31.3 × 10232
Iii12.96.64.97.70.2400.61.3 × 10−3111.46.93.56.6 × 10−38.831
Iv18.36.52.50.10.3130.49.9 × 10−3141.1131.61.5 × 10−22529
A14.87.04.2280.21.1 × 102171.4 × 10−3542.5189.84.0 × 10−31.4 × 10218
B17.16.82.0230.2791.61.4 × 10−2455.7147.97.2 × 10−31.1 × 10221
C18.66.63.6170.3370.27.9 × 10−3173.1235.83.7 × 10−34616
D19.17.10.5210.03323.55.8 × 10−3171.0255.66.1 × 10−34716
E22.06.50.4420.02326.07.6 × 10−3180.7687.63.8 × 10−32.3 × 10220
F26.77.03.10.50.1310.12.7 × 10−3170.6544.74.9 × 10−31.8 × 10220
G32.17.26.20.30.2292.2× 10−31.1 × 10−3160.3534.42.3 × 10−31.6 × 10219
H32.47.33.10.30.3282.2× 10−31.2 × 10−3150.4494.52.7 × 10−31.5 × 10239
TEMP: temperature (°C]; DO: dissolved oxygen (mg/L); EC: electric conductivity (mS/cm); and ORP: oxidation-reduction potential (V).
Table 4. Properties of the water sample obtained during field survey in winter 2016.
PointTEMPpH
(–)
DOECORPConcentration (mg/L)
SiFe2+AsNaKCaMgAlSO4Cl
I12.86.47.80.20.1242.01.2 × 10−29.91.3133.50.2 × 10−4120.0
Ii10.26.58.70.30.03728.2 × 10−28.2 × 10−3362.0146.50.1 × 10−4980.0
Iii10.86.64.70.10.3350.45.6 × 10−36.20.96.12.50.07.70.0
Iv11.16.73.10.20.06143.75.3 × 10−2111.5161.60.3 × 10−4450.0
A11.66.64.70.10.2720.53.0 × 10−3131.06.93.00.0480.0
B12.07.06.70.20.2350.22.0 × 10−3141.26.32.80.0157.2
C11.86.95.60.20.3220.42.2 × 10−3101.4143.10.01411
D12.36.61.00.20.2180.83.5 × 10−38.91.2153.10.0139.7
E11.46.90.80.30.2160.23.1 × 10−38.90.9242.80.0328.8
F12.26.70.80.70.01190.32.5 × 10−39.80.7804.10.01.5 × 1029.3
G11.87.06.20.30.2200.91.5 × 10−39.31.2213.40.00.027.7
H11.97.03.30.30.3220.11.5 × 10−3111.3303.50.1 × 10−4940.0
TEMP: temperature (°C); DO: dissolved oxygen (mg/L); EC: electric conductivity (mS/cm); and ORP: oxidation-reduction potential (V).
Table 5. Inlet flow rates and average precipitation and evaporation in the Yotsugi mill tailings pond in summer and winter 2016.
FlowSummerWinter
Precipitation (mm/day)6.65.8
Evaporation (mm/day)1.60.7
Inlet flowrate point 1 (m3/day)169.8254.1
Inlet flowrate point 2 (m3/day)34.929.4
Inlet flowrate point 3 (m3/day)11.616.2
Inlet flowrate point 4 (m3/day)7.525.45

