Article

In Situ Hyperspectral Raman Imaging of Ternesite Formation and Decomposition at High Temperatures

1
Institut für Geowissenschaften, Universität Bonn, 53115 Bonn, Germany
2
RWE Power AG, Research and Development, Kraftwerk Niederaußem, 50129 Bergheim, Germany
*
Author to whom correspondence should be addressed.
Minerals 2020, 10(3), 287; https://doi.org/10.3390/min10030287
Submission received: 8 February 2020 / Revised: 17 March 2020 / Accepted: 19 March 2020 / Published: 21 March 2020
(This article belongs to the Special Issue Modern Raman Spectroscopy of Minerals)

Abstract

:
Knowledge of the high-temperature properties of ternesite (Ca5(SiO4)2SO4) is becoming increasingly interesting for industry in different ways. On the one hand, the high-temperature product has recently been observed to have cementitious properties. Therefore, its formation and hydration characteristics have become an important field of research in the cement industry. On the other hand, it forms as sinter deposits in industrial kilns, where it can create serious problems during kiln operation. Here, we present two highlights of in situ Raman spectroscopic experiments that were designed to study the high-temperature stability of ternesite. First, the spectra of a natural ternesite crystal were recorded from 25 to 1230 °C, which revealed a phase transformation of ternesite to the high-temperature polymorph of dicalcium silicate (α’L-Ca2SiO4), while the sulfur is degassed. With a heating rate of 10 °C/h, the transformation started at about 730 °C and was completed at 1120 °C. Using in situ hyperspectral Raman imaging with a micrometer-scale spatial resolution, we were able to monitor the solid-state reactions and, in particular, the formation properties of ternesite in the model system CaO-SiO2-CaSO4. In these multi-phase experiments, ternesite was found to be stable between 930 to 1020–1100 °C. Both ternesite and α’L-Ca2SiO4 were found to co-exist at high temperatures. Furthermore, the results of the experiments indicate that whether or not ternesite or dicalcium silicate crystallizes during quenching to room temperature depends on the reaction progress and possibly on the gas fugacity and composition in the furnace.

1. Introduction

Ternesite (Ca5(SiO4)2SO4) has only been described so far from three localities worldwide (Mayen, Germany [1]; Negev Desert, Israel; and Judean Mts, Palestine [2]). It is isotypic to silicocarnotite (Ca5(PO4)2SiO4) [2] and a number of other compounds, where Cd and Ge substituted Ca and Si, respectively [1]. Thus, the ternesite structure is able to accommodate various chemical partners and may be stable under a wide range of thermal conditions [3]. The high-temperature (HT) behavior of ternesite has gained increasing interest in industry over the last few years. Ternesite has been identified as deposits in cement rotary kilns [4,5] as well as on heat transfer surfaces in brown coal power plants within the transition zone from the silicate slagging zone of the combustion chamber to the sulfate sintering zone of the bundle heating surfaces [6]. Here, the formation temperatures seem to correspond to those estimated for natural ternesite that occurs in metamorphosed volcanic rocks, with estimated formation temperatures between 1000 to 1300 °C [1,7]. In natural and synthetic occurrences, ternesite is commonly associated with dicalcium silicate (larnite or belite, respectively).
In recent work, a new innovative low-carbon-emission clinker technology has been described in which ternesite plays a key role [3,8,9,10,11,12]. The so-called belite calciumsulfoaluminate ternesite (BCT) technology combines the early age strength of calcium sulfoaluminate cements with the durability of belite-bearing cements. In this system, ternesite bridges the reactivity gap between the rapid aluminate reaction and the late strength development of belite. Due to its lower firing temperature, the CO2 emissions of the BCT clinker can be reduced compared to those of conventional clinker production. Yet, another environmental aspect during the combustion of brown coal is that ternesite fixes sulfur oxides during coal combustion process that is released, for instance, by the decomposition of anhydrite (~1200 °C [13]), which occurs already at temperatures as low as about 920 °C if other mineral phases are present [14,15].
It follows that a detailed understanding of the thermodynamics and kinetics of HT solid-state and melting reactions within the CaO-SiO2-CaSO4 system is essential in order to fully exploit the technical advantages of ternesite. In particular, ternesite can serve as a temperature indicator once its thermal stability field is known, which can help kiln operators to optimize the combustion temperatures. In the present study, samples of calcium oxide, quartz, and anhydrite were fired to about 1100 °C and the reactions were monitored in situ by confocal hyperspectral Raman imaging, which allowed monitoring of the HT solid–solid reactions at the micrometer scale without the need to quench the sample to room temperature (RT) before analyzing it [15,16,17]. However, before performing the multiphase sinter experiments, we studied the thermal behavior of a natural ternesite crystal between RT and 1230 °C in 10 °C-steps by Raman spectroscopy. The results of this experiment are also used to provide HT reference Raman spectra that are necessary for hyperspectral Raman image generation.

2. Materials and Methods

2.1. Characterization of the Starting Materials and Sample Preparation

To study the temperature behavior of ternesite by Raman spectroscopy, a natural blue crystal aggregate from Mayen, Germany, was used. The sample was prepared to a cylinder with a diameter of 3 mm and a height of <1 mm to minimize the temperature gradient between sample surface and thermocouple. The chemical composition of the sample was determined by electron microprobe on a polished section using a JEOL 8200 Superprobe (JEOL, Ltd., Tokyo, Japan) at the Institute of Geosciences of the University of Bonn, Bonn, Germany. The acceleration voltage and beam current were set to 15 keV and 15 nA, respectively. The Kα-lines of Ca, Si, and S were measured along with the background at both sides of the peaks for 10 s. Wavelength- and energy-dispersive X-ray scans revealed that the ternesite does not contain any other elements in significant amounts (>100 ppm). The average composition of 88 individual spot analyses (Table 1) agrees very well with results from previous work [1].
The sinter experiments were carried out with small green bodies that were produced by compacting 40 mg of powdered precursor material into cylinders (3 mm × 2.7 mm) at a pressure of 10 kPa to produce a flat surface. The cylinders were prepared from natural crystals of anhydrite (Tirol, Austria), quartz (origin unknown), and CaO powder (©Merck, Darmstadt, Germany). Before firing, all cylinders were checked for the occurrence of initial calcium silicates/sulfates and potential contaminations by ultra-fast Raman imaging (see Section 2.2) and XRD measurements using a Bruker D4 powder diffractometer (Bruker, Madison, WI, USA) at the RWE Power AG, Niederaußem, Germany. Although the CaO was stored in a furnace at 100 °C before usage, a few calcite grains could be detected, which, however, decomposed to CaO during the experiments.

2.2. Experimental Details

To study the formation temperature of ternesite in the CaO-SiO2-CaSO4 system, an isochronal single crystal heating and three sintering experiments were carried out to temperatures of up to 1104 ± 5 °C (Table 2). A LINKAM TS 1500 heating stage (volume size ~20 mm2) was used for the experiments that was mounted onto the automated x-y-z stage below the microscope objective of the Raman microscope. Due to the height and the volume of the sample cylinder, a strong temperature gradient unavoidably occurs within the furnace. This gradient was empirically determined by a procedure that is described in detail by Stange and co-workers [17].
Two types of experiments were performed in air atmosphere (Table 2). During the first type of in situ experiments (AQC-1.1/2), the samples were fired to a high temperature with a heating rate of 10 °C/min. Immediately after reaching the respective temperature, two in situ hyperspectral Raman images were taken in succession. Thus, the second image was recorded after a dwell time of two hours. Then, the sample was fired and measured in 50 °C steps until the maximum temperature had been reached. After recording the last image at the maximum temperature, the sample was cooled down to RT with a cooling rate of 10 °C/min and a final Raman image was recorded at RT. In the second type of in situ experiments (AQC-2), the effect of quenching was studied. After recording a Raman image at the firing temperature, the sample was cooled to RT with a cooling rate of 10 °C/min. At RT, a Raman image was then recorded, before firing the sample to the next temperature step. We note that the images taken at RT form the basis for the interpretation of conventional sintering experiments, in which the sample has to be quenched before it can be analyzed.

2.3. Raman Spectroscopy

All Raman measurements were carried out using a Horiba Scientific HR800 Raman spectrometer (Horiba Scientific, Kyōto, Japan) at the Institute of Geosciences of the University of Bonn, Born, Germany. The instrument is equipped with a 2W Nd:YAG laser (λ = 532.09 nm), an electron-multiplier charge-coupled device (CCD) detector, and an Olympus BX41 microscope. A 50x long-working distance objective with a numerical aperture (NA) of 0.5, a grating with 600 grooves/mm, and a 100-µm spectrometer entrance slit were used for all measurements. The spectral resolution of all measurements was ~3.5 cm−1, as given by the width of the intense Ne line at 1707.06 cm−1. To correct for any spectrometer shift during long-time measurements, the intense Ne line was continuously monitored as ‘‘internal’’ frequency standard in all spectra [14,17,18]. An edge-filter was used to remove the Rayleigh signal. Single crystal spectra were acquired for 100 s. In situ hyperspectral Raman images were recorded from an area of 100 × 100 µm2 with a 1-µm step size (100 × 100 µm2 = 10,000 pixel per image) in x and y direction. At each step, a Raman spectrum was recorded for 0.5 s. Due to temperature- or reaction related shrinkage- or expansion effects, the sampling area can strongly shift during cooling. Therefore, at HT, 100 × 100-μm2-sized images were taken, and, at RT, larger 140 × 140-μm2-sized images were taken, so that the same area could be investigated at all temperature steps. The focus was reset before each image was taken in order to compensate for these effects using the autofocus function of the instrument. This procedure is based on the depth profiling of the intensity of a spectral range and determines the focus through the highest signal-to-noise ratio.
The best achievable the lateral and axial (depth) resolution of the Raman measurements with the focus at the sample surface is usually estimated from the theoretical diffraction limit given by dl ≈ 1.22λ/NA and da ≈ 4λ/NA2, yielding 1.3 and 8.5 µm in our case, respectively. However, the real lateral and axial resolution may rather be in the order of dl ≈ 2 µm and da ≈ 15 µm, respectively [16,17]. The confocal hole was set to 300 µm, which has to be empirically proven to provide the best compromise between depth resolution and the signal-to-noise ratio for our instrument [16]. It is important to note that the axial resolution at the surface also depends on the absorption properties of the material investigated. In previous work, a Raman intensity loss of 20% to 40% was observed within the first ten micrometers, whereas within the first 20 µm, which is a typical grain diameter, already about half of the intensity of the Raman bands is lost [16].

2.3.1. High-Temperature Raman Spectroscopy of Ternesite

The natural ternesite sample was fired from 30 to 1230 ± 5 °C in 10 °C-steps. At each temperature step, a spectrum was recorded from the same spot in the wavenumber range of 100–1730 cm−1 (Table 2). For quantitative analysis, the Raman spectra were least-squares fitted using an appropriate number of Gauss-Lorentz functions along with (i) a 5th order polynomial background function in the frequency range from 100 to 1230 cm−1 for the ternesite RT spectrum and (ii) a cubic function in the frequency range from 700 to 1200 cm−1 for spectra taken above RT. The wavenumber and temperature ranges were chosen, because they comprise the main Raman bands of ternesite that are of interest here. Again, the Ne emission band at 1707.06 cm−1 was fitted using a Gauss function to correct for any spectrometer shift that, if not corrected, would induce a systematic error and thus the accuracy of the results. The reported Raman frequencies are usually precise within ±0.2 to ±0.5 cm−1, but for weak and broad bands, particularly those measured at high temperatures, we estimated a precision in the order of ±1 to ±2 cm−1. Fitting was performed with the LabSpec 6.4.4.15 (Horiba Scientific, Kyōto, Japan) program that comes with the instrument.

2.3.2. Hyperspectral Raman Imaging

The data reduction and generation of hyperspectral false-color Raman images is based on the classic least-squares (CLS) fitting procedure, as described in detail elsewhere [15,16,17], and was performed with the LabSpec software. In general, mineral phases are identified by the characteristic positions and relative intensities of their fundamental Raman bands. With an increasing temperature, the Raman bands of mineral phases usually shift to lower wavenumbers and their linewidth (full width of half-maximum) increases [15]. Both are usually, though not always, a feature of every vibrational mode of a mineral phase. Additionally, the black body radiation of the samples increases with an increasing temperature and reduces the signal-to-noise ratio. The identification of minerals at high temperatures is further complicated by the fact that reference Raman spectral databases, such as, e.g., the RRUFF database [18], only contain RT spectra that usually differ significantly from their HT counterparts. Therefore, the HT Raman spectra of relevant mineral phases, including quartz, anhydrite, larnite, and ternesite, were collected to build an in-house data base for the identification of mineral phases in multi-component systems at high temperatures and as reference spectra to be used as input data for the CLS fit. The semi-quantitative mineral fractions of an imaged area were calculated by averaging the CLS fractions of all 10,000 spectra. We note that the accuracy of the absolute mineral fractions is influenced by (i) crystal orientation, (ii) grain size, (iii) the temperature dependence of band position and linewidth, and (iv) the relative Raman scattering cross-sections of the mineral phases. Moreover, it has to be noted that we analyzed a relatively small area at the surface that is not necessarily representative for the whole green body. However, hyperspectral Raman imaging delivers in situ information about the formation and decomposition of distinct phases and their textural relationship without the necessity of quenching the sample to RT. Moreover, Raman images can be taken during heating and cooling with a high-temperature, time, and spatial resolution [16].

3. Results

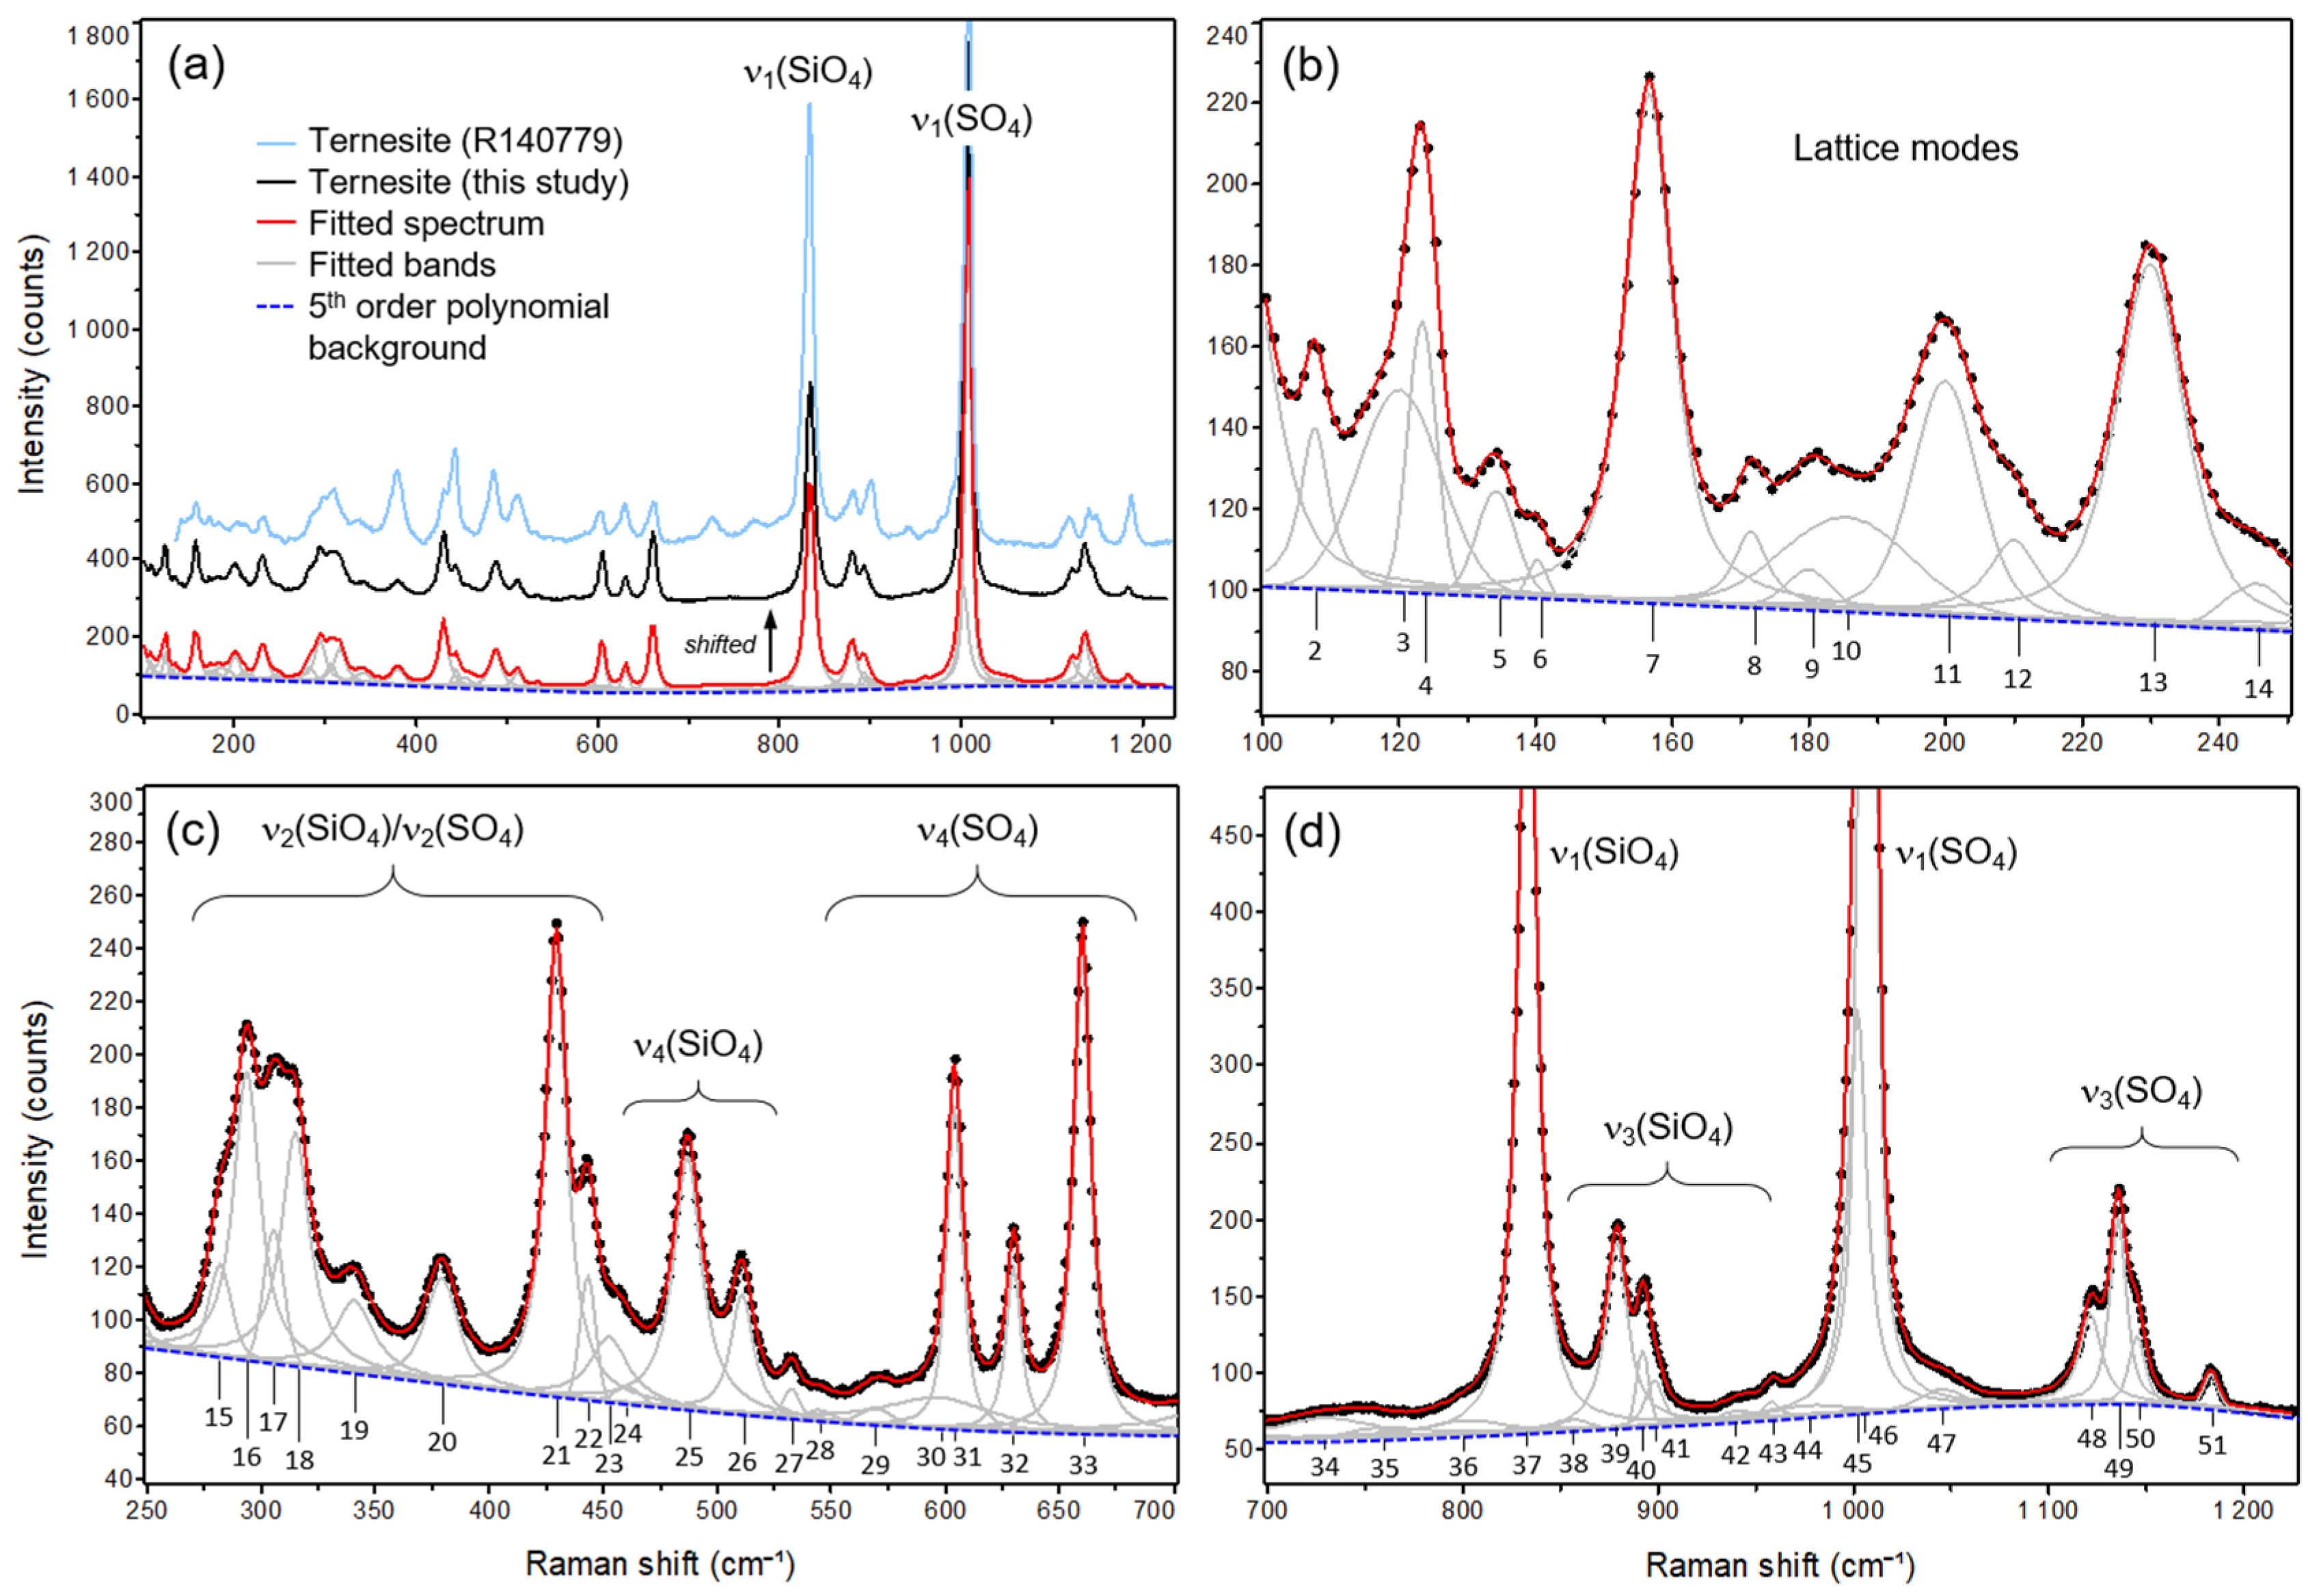
3.1. Room Temperature (RT) Raman Spectrum

Ternesite crystallizes in the space group Pnma (D162h), i.e., no. 62 [1]. A group theoretical analysis yields the following irreducible representation for optical modes in the ternesite structure:
Γoptic = 32Ag + 28Au + 28B1g + 31B1u + 32B2g + 27B2u + 28B3g + 31B3u
From these, the Ag, B1g, B2g, und B3g modes are Raman active, i.e., 120 Raman bands are expected. The two equivalent SiO4 and SO4 tetrahedra have C1 and Cs symmetry in the unit cell of the ternesite structure, which has four formula units [1]. We therefore expect 20 internal bending and 16 internal stretching bands, so that 48 lattice vibrations remain. Figure 1a shows the Raman spectrum of the natural ternesite sample recorded at RT before firing from 100 to 1230 cm−1. In addition, we included the fitted functions in the diagram as well as an RT Raman reference spectrum of ternesite from the same location as our sample, which is published in the RRUFFTM mineral database [18]. We note that both spectra match very well. The only obvious differences are different relative band intensities. This, however, merely reflects a different crystal orientation with respect to the laser polarization, particularly affecting highly polarized bands, such as the v3(SO4) band at 1182 cm−1. A least-squares fit of 51 Raman bands and a 5th order polynomial background to the data in the frequency range of 100 to 1230 cm−1 yielded a satisfactory agreement between the measured and fitted sum spectrum (reduced X2 = 0.065), leaving at least 69 Raman bands undetected (Figure 1). These may either be hidden as part of broader bands due to limitations in the spectral resolution or too weak to be detected with the chosen analytical parameters. All bands are numbered for ease of reference and their frequencies and widths are listed in Table 3.
Within the frequency range 100–250 cm−1, 13 of the expected 48 lattice modes can be identified (Figure 1b). These modes are assigned to rotational and translational lattice modes, which involve the vibration of the Ca ions against the rigid, i.e., strongly covalently bound SiO4 and SO4 units and which are therefore well-split in energy from the internal vibrations of the SiO4 and SO4 tetrahedra. Their internal bending modes are located in the frequency range between 250 and 700 cm−1 (Figure 1c). The group of bands in the 250–460 cm−1 range may be attributed to the v2 bending modes of the SO4 and SiO4 tetrahedra [19,20]. The bands near 428 (no. 21) and 442 cm−1 (no. 22) can be assigned to the internal v2(SO4) vibration because they clearly disappear at temperatures of >730 °C when the decomposition of ternesite starts (Figure 2). The band at 531 cm−1 (no. 27) and possibly the band at 510 cm−1 (no. 26) can be assigned to the anti-symmetric v4(SiO4) bending modes due to the fact that bending modes of the SiO4 groups are expected near these frequencies [20]. The three bands between 600 and 660 cm−1 (no. 31–33) are certainly due to internal v4(SO4) bending vibrations, because this is the typical frequency range of these vibrations in sulfate crystals [21] and they also clearly disappear at temperatures of >730 °C (Figure 2). The bands at frequencies higher than 700 cm−1 are assigned to the internal symmetric and anti-symmetric stretching vibrations of both tetrahedral units (Figure 1d). The three bands are located at 878, 891, and 897 cm−1 (no. 39–41) and those at frequencies larger than 1100 cm−1 (no. 48–51) can be assigned to the v3 stretching modes of the SiO4 and SO4 tetrahedra, respectively. The most intense Raman bands are located at 1006 cm−1 (no. 45 + 46) and the second most intense band near 832 cm−1 (no. 37), which can be unequivocally assigned to the symmetric v1(SO4) and v1(SiO4) modes, respectively (Figure 1c). Note that the v1(SO4) is slightly asymmetric towards the lower frequency side which is reflected by the fact that we needed a second function, centered at 1001 cm−1, to satisfactorily fit the band profile in this frequency range (Figure 1d).

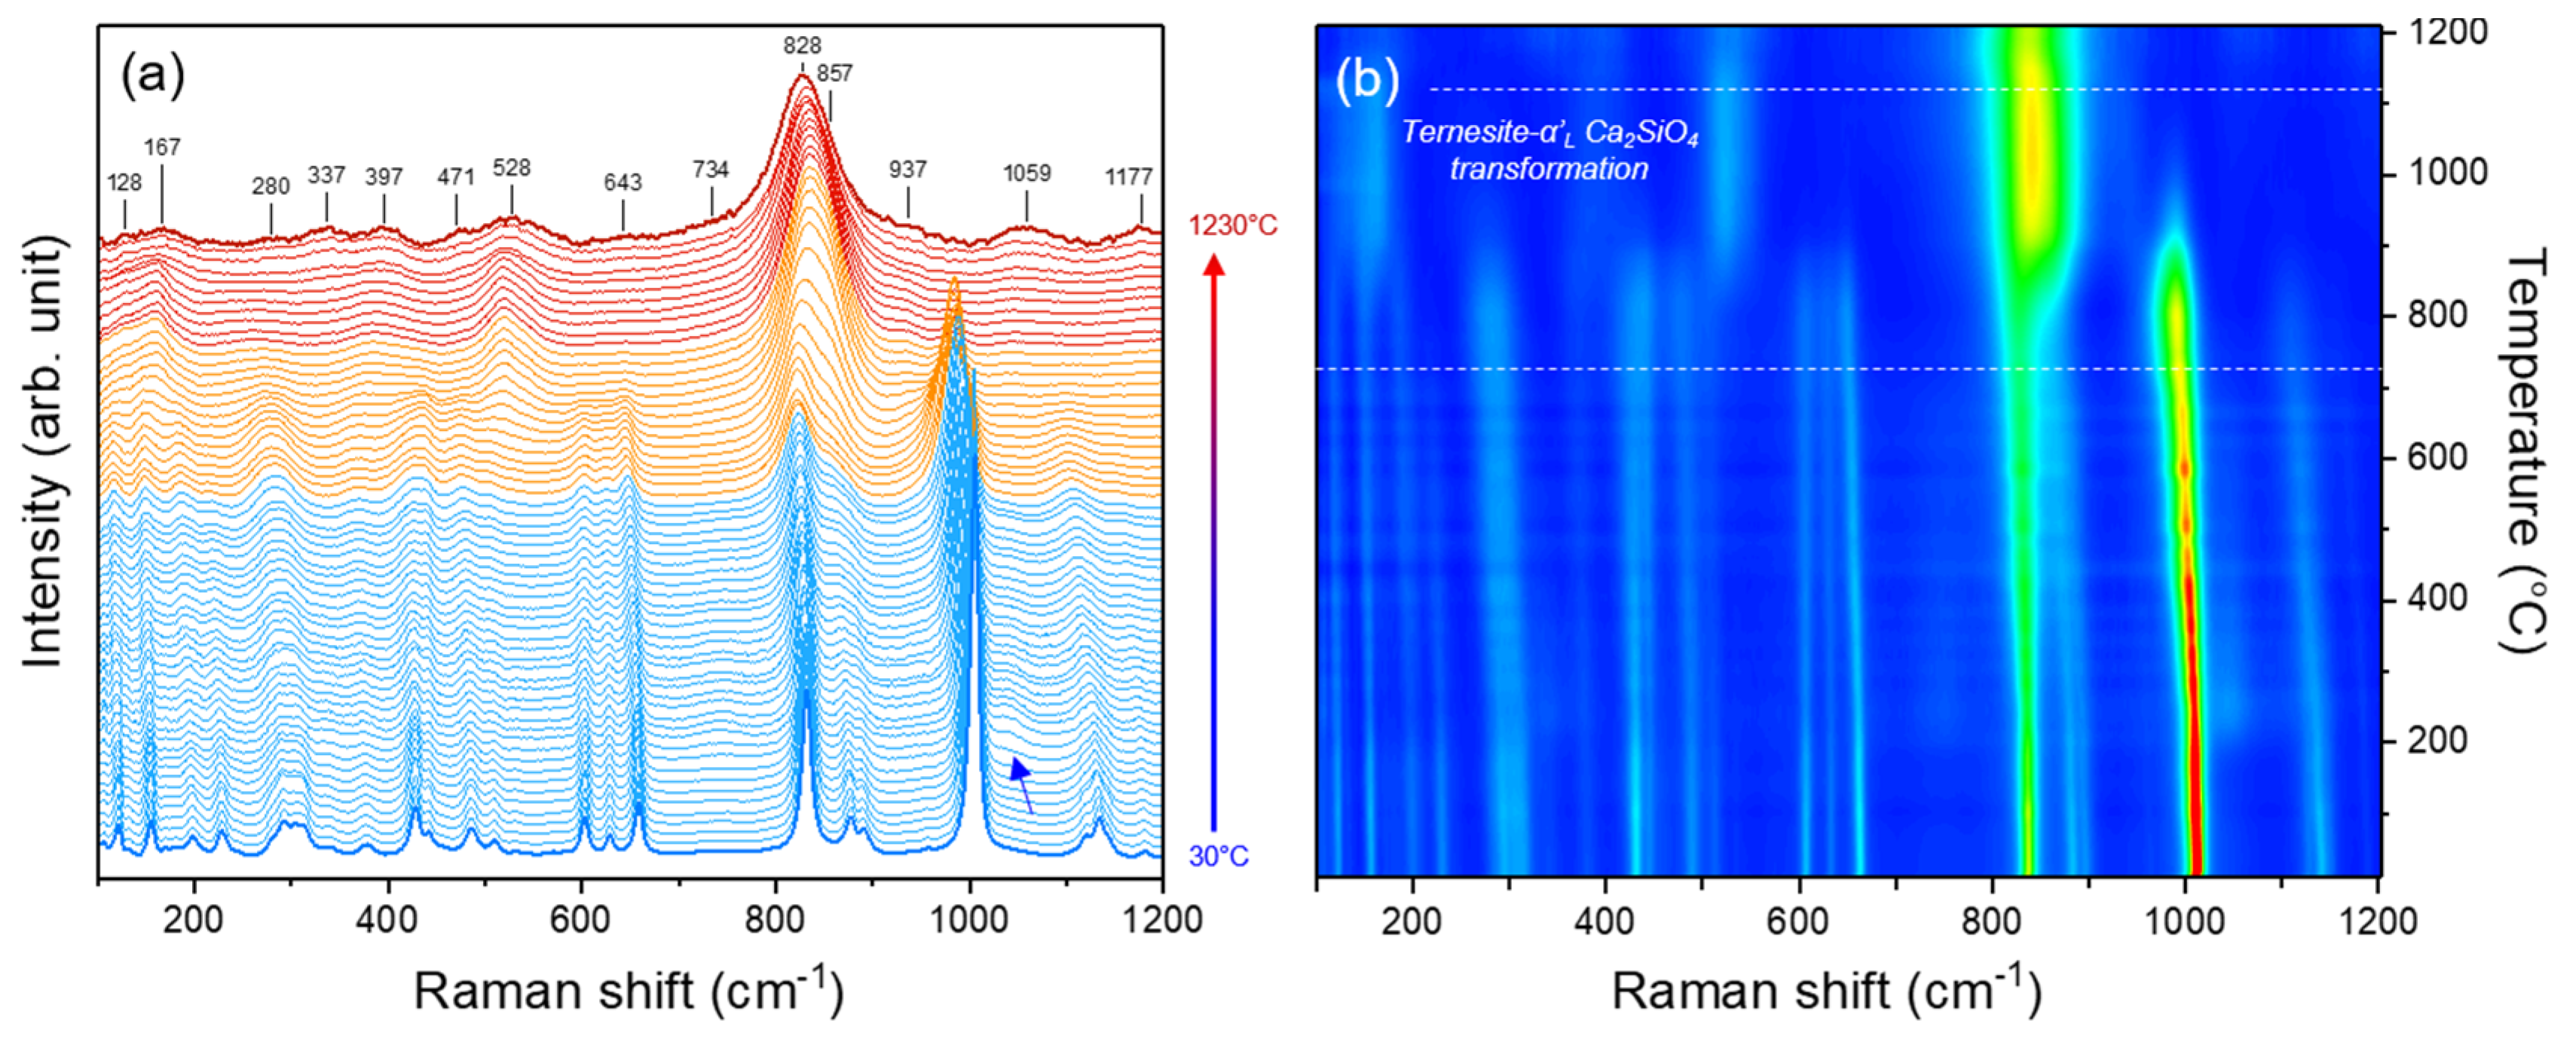
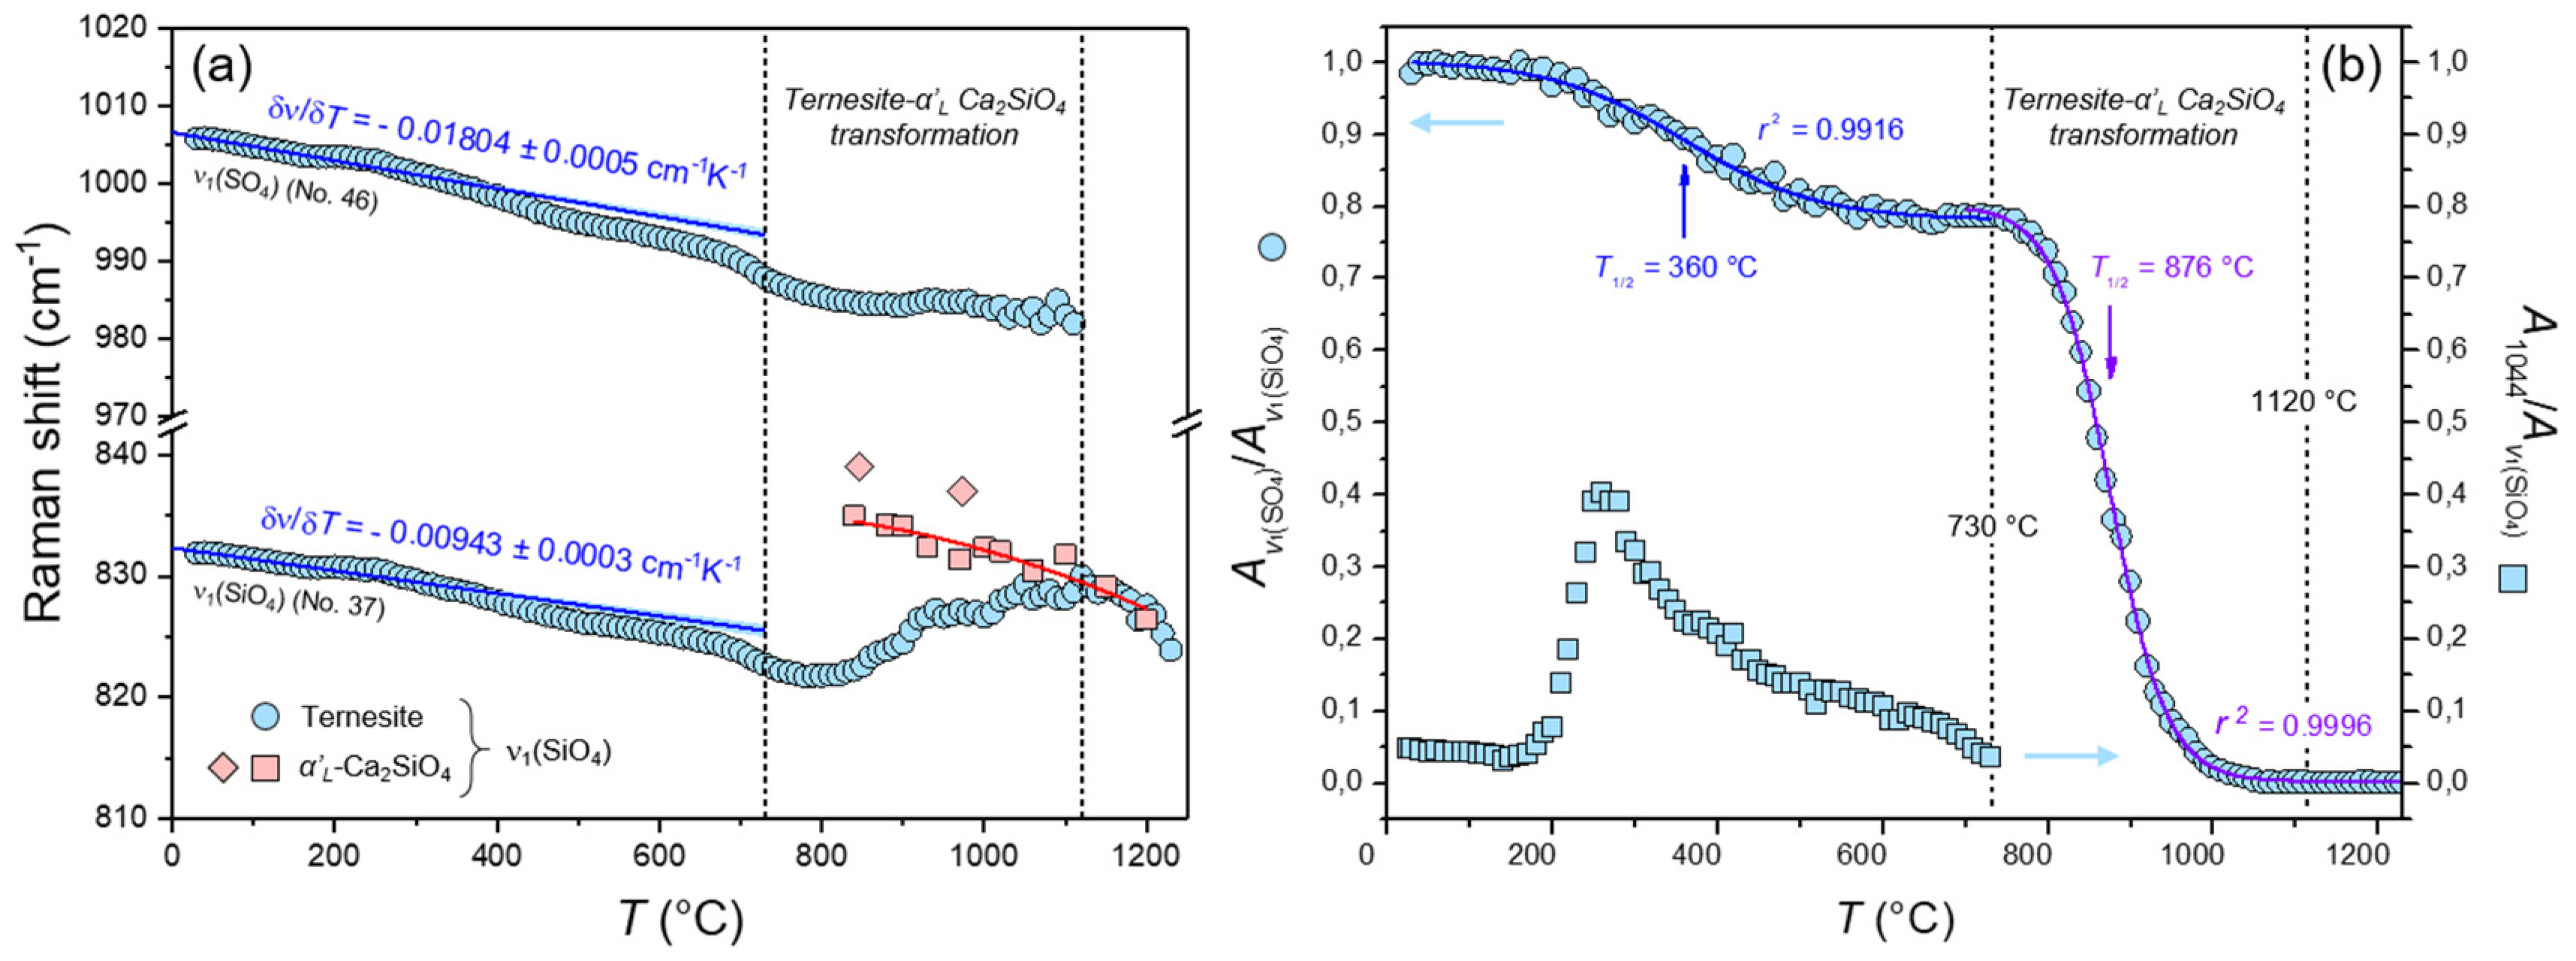
3.2. High-Temperature (HT) Raman Spectra of Ternesite

In the following, we will focus our analysis on the temperature behavior of the most intense v1 bands of the SiO4 and SO4 units. These Raman bands are of particular importance, as they act as fingerprint bands for the identification of ternesite and can be used to quantitatively follow the decomposition of ternesite to dicalcium silicate and sulfur at high temperatures by Raman spectroscopy. When heated to temperatures below about 800 °C, all observable bands become broader and generally shift to lower frequencies (Figure 2). By plotting the fitted frequencies of the v1 bands as a function of temperature, it is evident that the v1(SO4) band exhibits a stronger shift with an increasing temperature, δν/δT, than the v1(SiO4) band, reflecting a different temperature dependence of both modes (Figure 3a). However, the most pronounced feature of the temperature dependence of the frequency of both modes is that it is wavy over the entire temperature interval, whereby the amplitudes of the fluctuations significantly exceed the experimental errors (Figure 3a). However, at low temperatures, i.e., between RT and 160 °C, the data can in both cases be very well described by a linear function (r2 > 0.9995). At about 160 °C, however, both modes ceased to shift to lower frequencies until about 250 °C. At about 890 °C, the v1(SO4) frequency shows another local minimum before the frequencies shift to a higher value until 930 °C. However, at this stage, the error in the v1(SO4) frequency strongly increases, which is reflected by a high scatter, because the band becomes very weak. The temperature dependence of the v1(SiO4) frequency is characterized by a local minimum close to 780 °C, from which the frequency rose continuously with slight fluctuations until 1120 °C. At higher temperatures, the frequency decreases again until the maximum sintering temperature is finally reached.
From Figure 2, it is further evident that the sulfate-related vibrational modes disappear between about 750 and 1000 °C (orange spectra in Figure 2a), even the very strong v1(SO4) band (Figure 2b). In this temperature interval, the overall number of observable Raman bands is largely reduced from 51 to 14 (red spectra in Figure 2a), reflecting a change in the crystal symmetry and, in particular, of the chemistry (loss of sulfur). A group theoretical analysis based on an orthorhombic structure of the HT polymorph of dicalcium silicate (α’L-Ca2SiO4) revealed 48 Raman active modes [20]. Note, however, that due to the low intensity and large broadening of the bands at HT, the number and positions of the bands were difficult to define. In any case, ternesite evidently decomposed to α’L-Ca2SiO4, CaO, and SO3↑. The formation of α’L-Ca2SiO4 is evidenced by the observation that the frequency of the v1(SiO4) band of ternesite merges at about 1120 °C with the HT frequencies observed for pure α’L-Ca2SiO4. Our values for the v1(SO4) band of the α’L-Ca2SiO4 plot are at lower wave numbers at a given temperature than two values from the literature [20] (Figure 3a). The literature data represent the maximum of the overall v1(SO4) band profile that, however, is composed of at least two bands, i.e., the v1(SO4) and a v3(SO4) band, which both were considered in the fitting procedure.
The formation of lime could not be observed, because lime has no first-order Raman spectrum and its weak second-order spectrum, used for the CLS fitting method (see Section 2.3.2), is strongly overlaid by the much more intense Raman signals of ternesite and dicalcium silicate. In any case, it is safe to state that, at 730 °C, the SO4 tetrahedra started to detach from the ternesite structure, and, at 1120 °C, the transformation from ternesite to dicalcium silicate and sulfur is essentially completed, as the v1(SO4) band could not be detected in the spectra anymore.
It is noteworthy that at a temperature of about 170 °C, the intensity of the weak SO4-related stretching band near 1044 cm−1 (no. 47) begun to significantly increase (blue arrow in Figure 2a) until about 260 °C from where it almost exponentially decreased until ternesite started to decompose at 730 °C (Figure 3b). In Figure 3b, we have also plotted the integrated intensity ratio between both v1 bands, Rv1 = Av1(SO4)/Av1(SiO4), normalized between 0 and 1, as a function of temperature. This plot is intriguing because it is clearly characterized by two sigmoidal segments that each can be well fitted (r2 > 0.991) with a sigmoidal Boltzmann function of the form Rv1 = R2 + (R1R2)/(1 + exp((TT1/2)/α)), where R1 and R2 are the equilibrium values of the ratio before and after the transition, respectively, T1/2 is the inflection point of the curve, i.e., the temperature at which Rv1 has changed by 50%, and α is a coefficient that describes the behavior of the slope of the process during the transition. From the fit, we obtain the characteristic half-life temperatures at which 50% of the ternesite is transformed into α’L-Ca2SiO4 of T1/2 = 360 ± 4 °C and 876 ± 2 °C for the first stage below 730 °C and the second stage, respectively. The wavy temperature dependence of the v1 frequencies is in agreement with the occurrence of major structural changes even at temperatures far below the actual ternesite decomposition temperature, as such, a behavior cannot be explained by thermally induced mode anharmonicity alone.

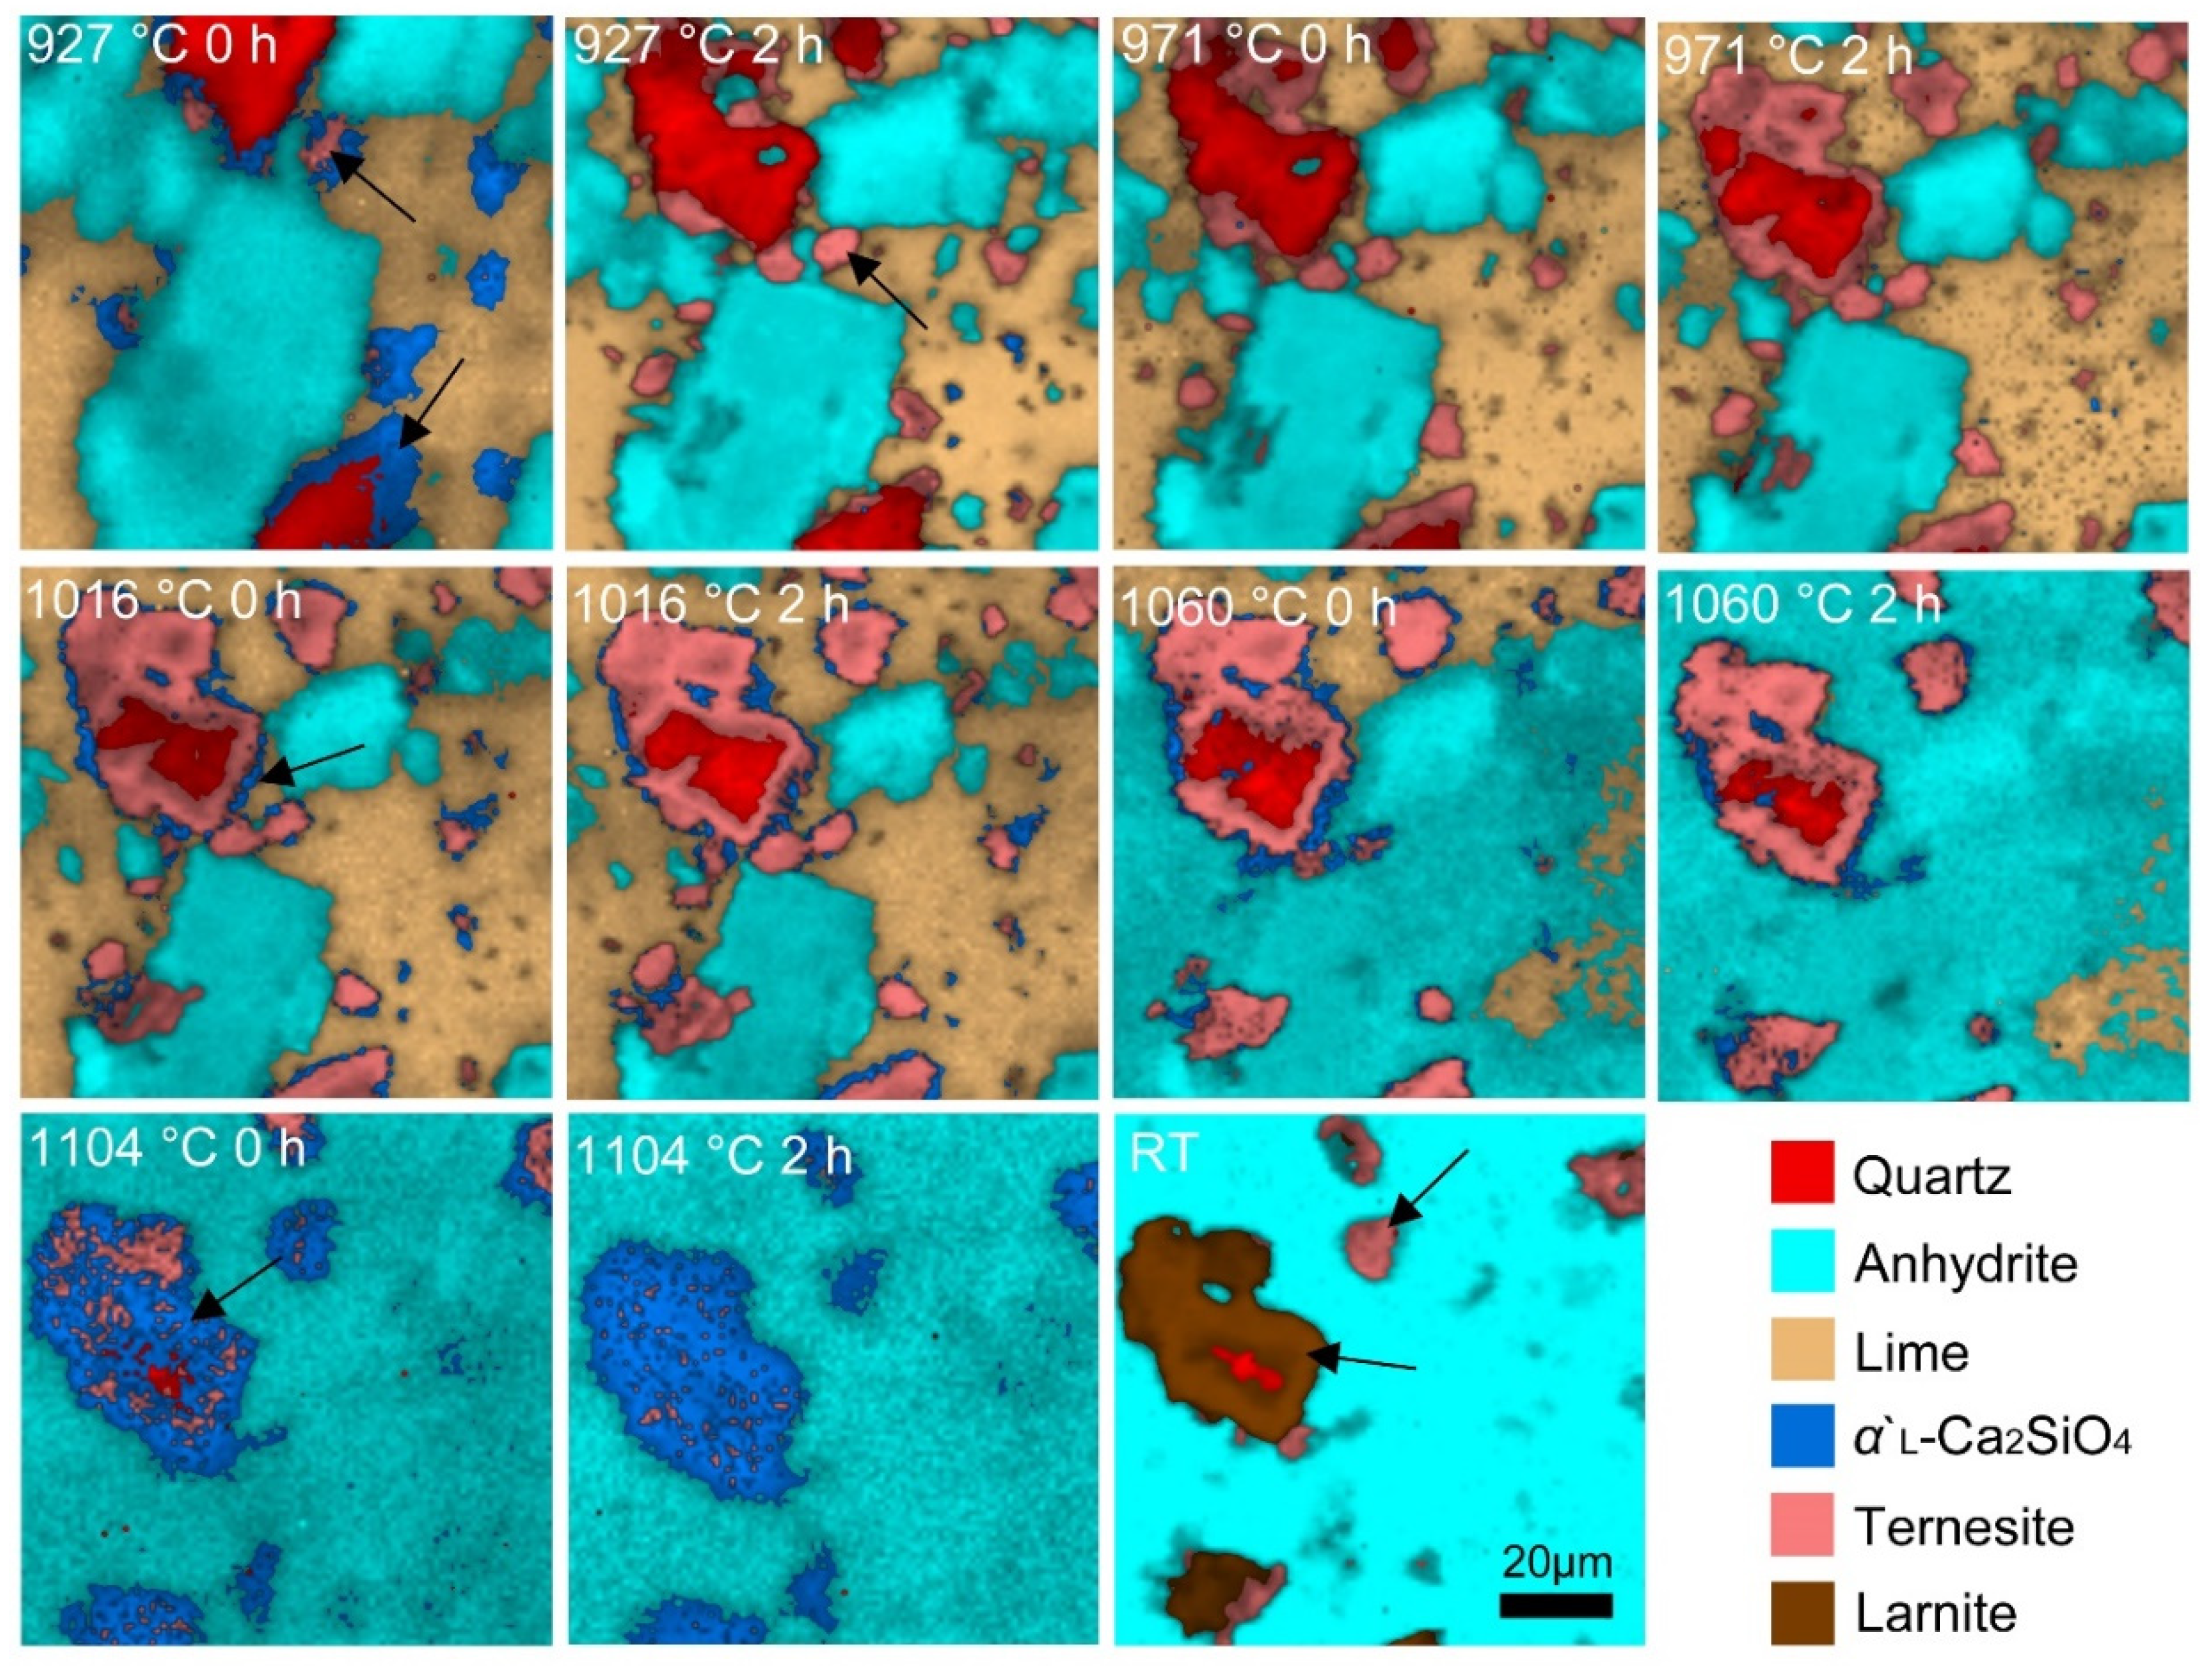
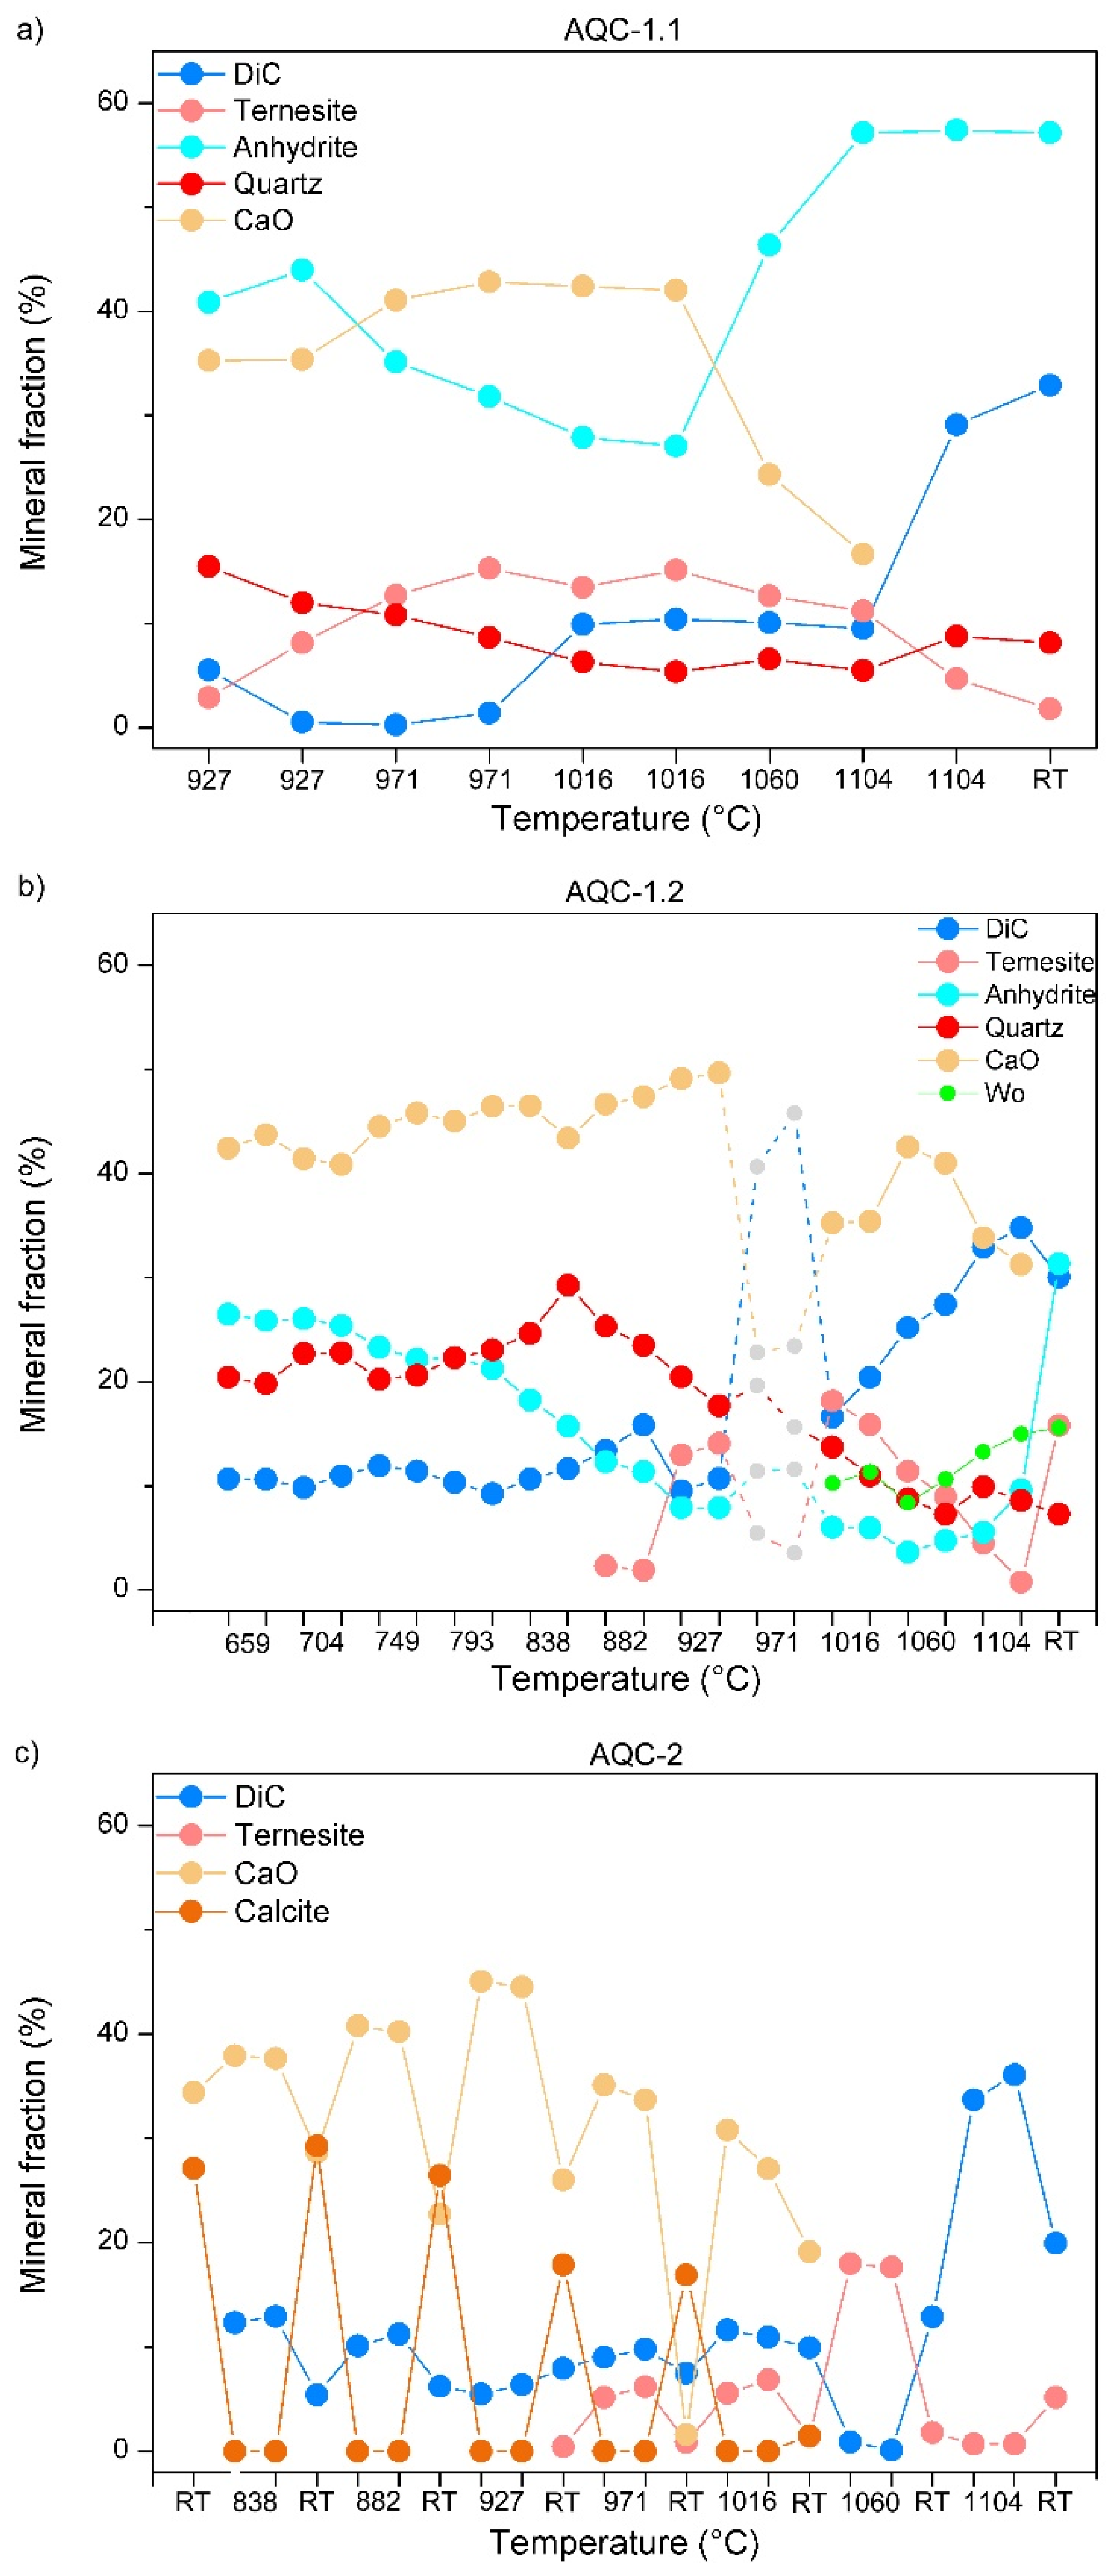
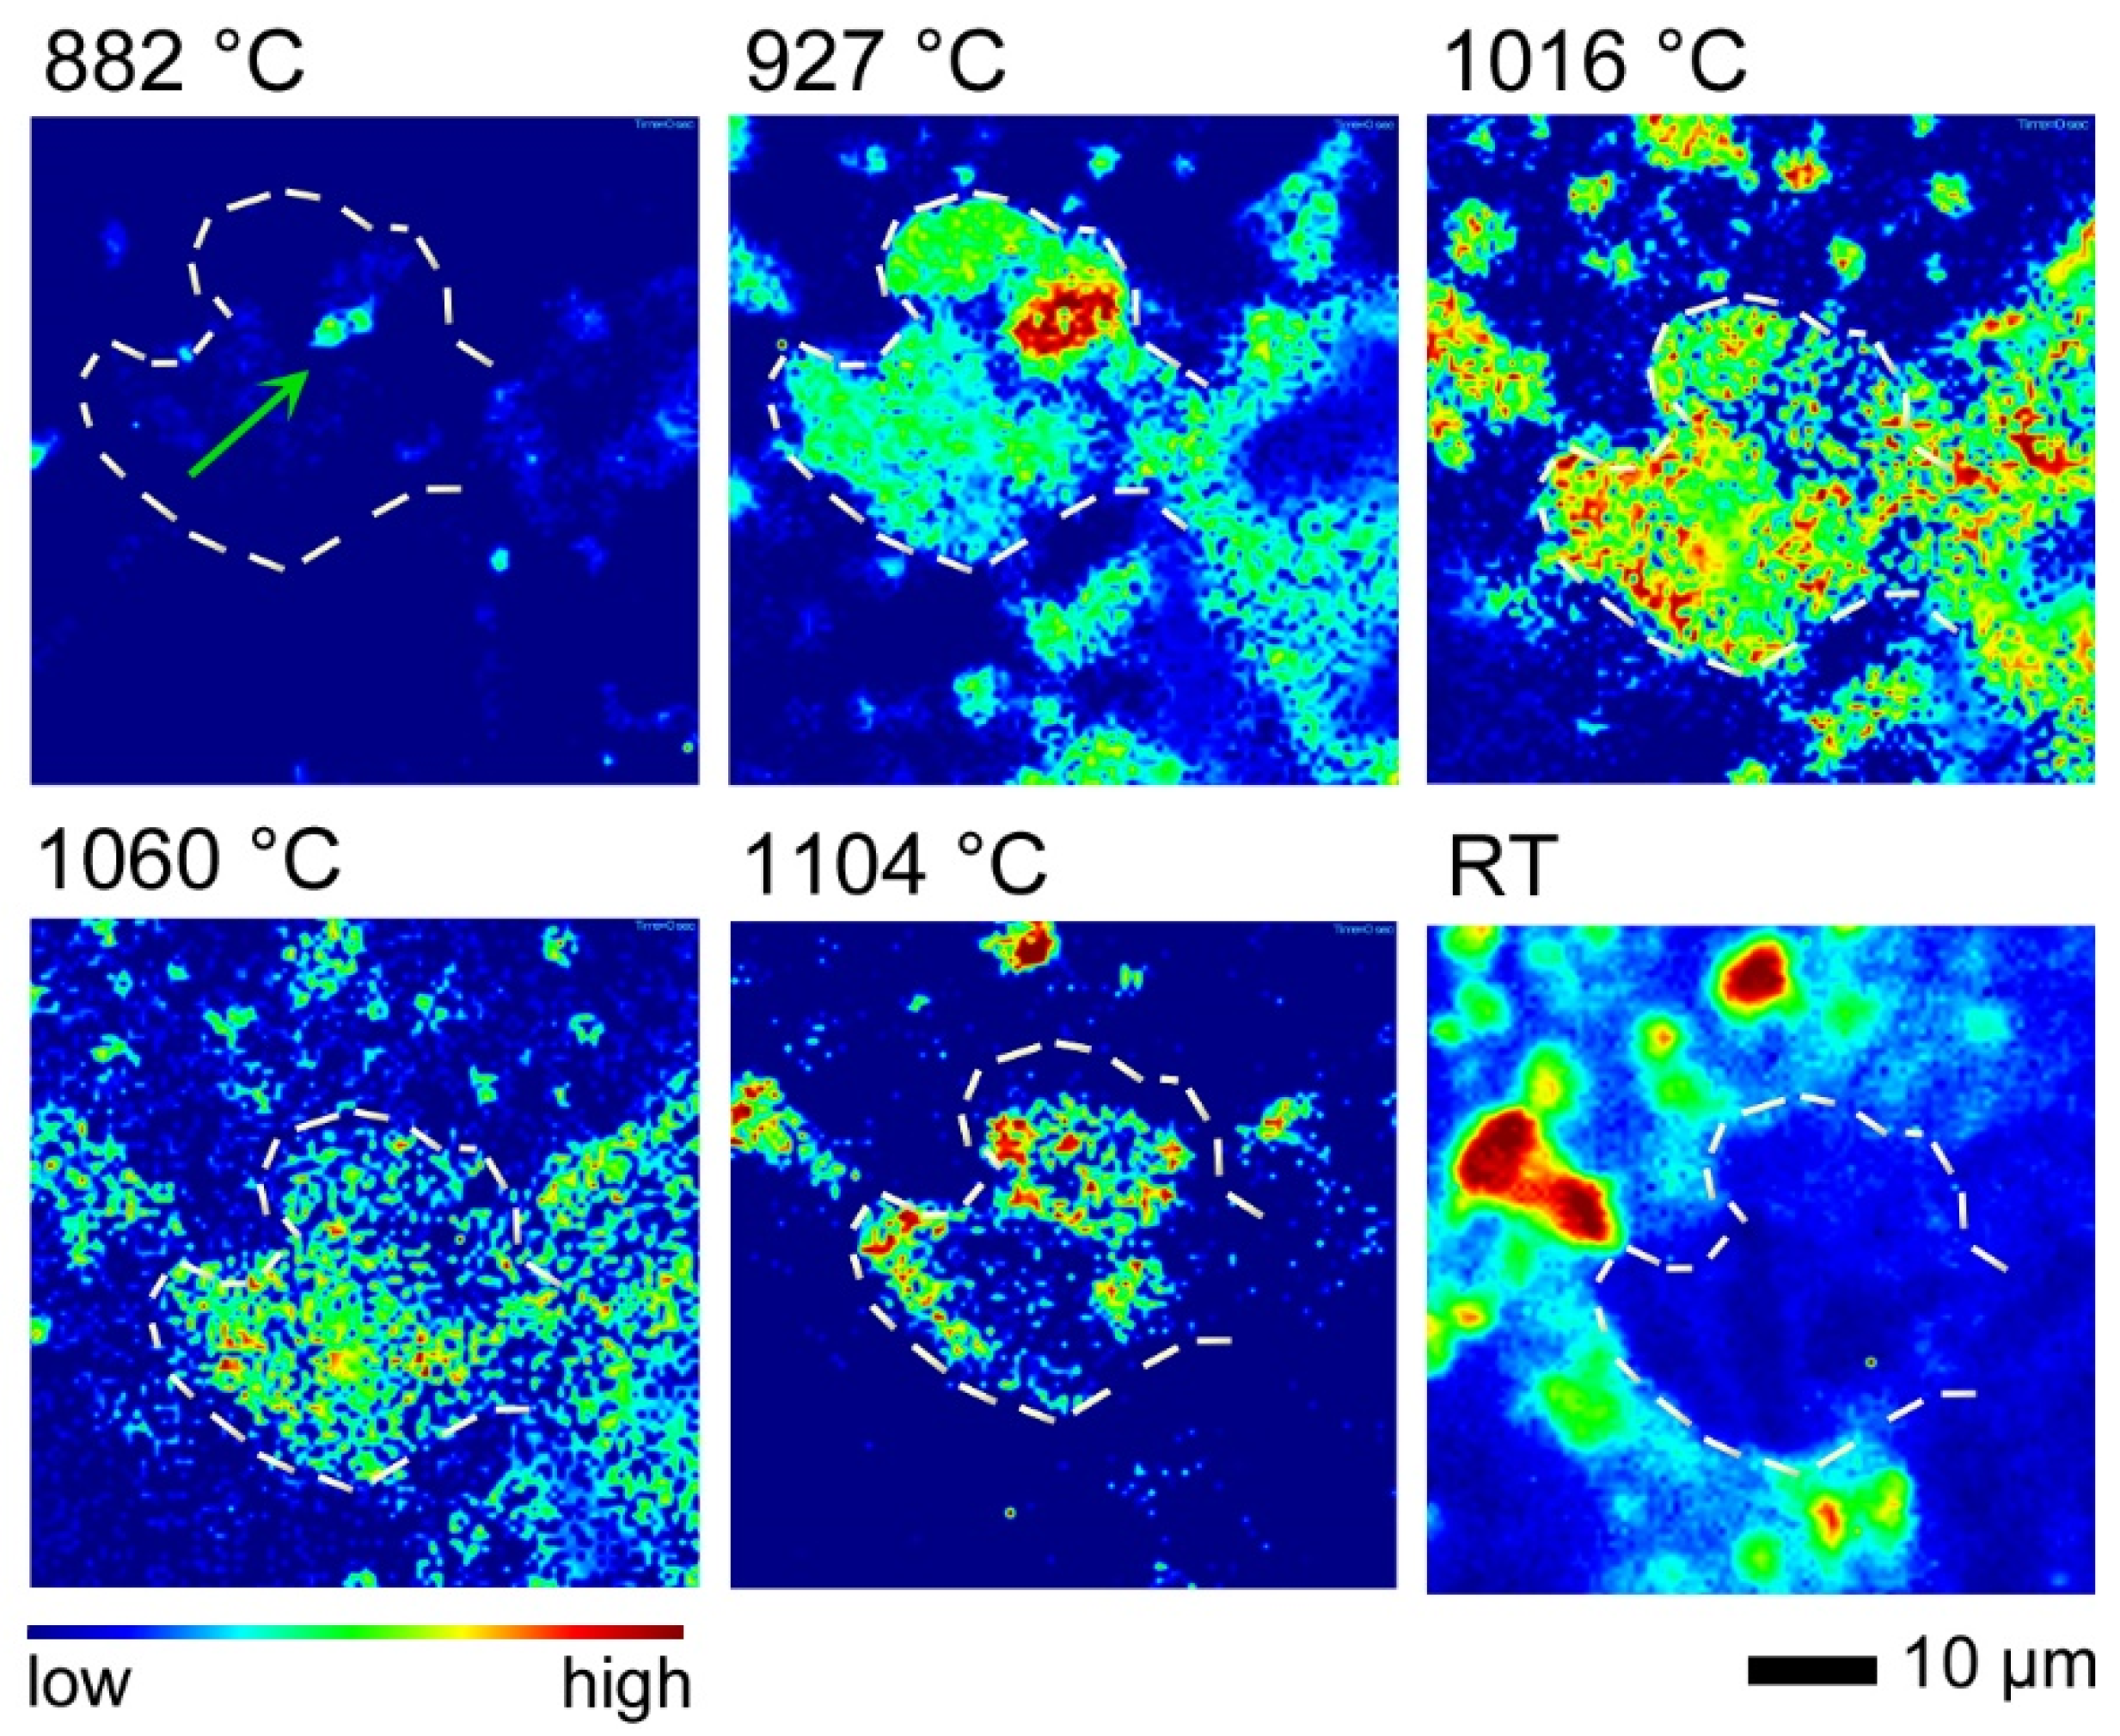
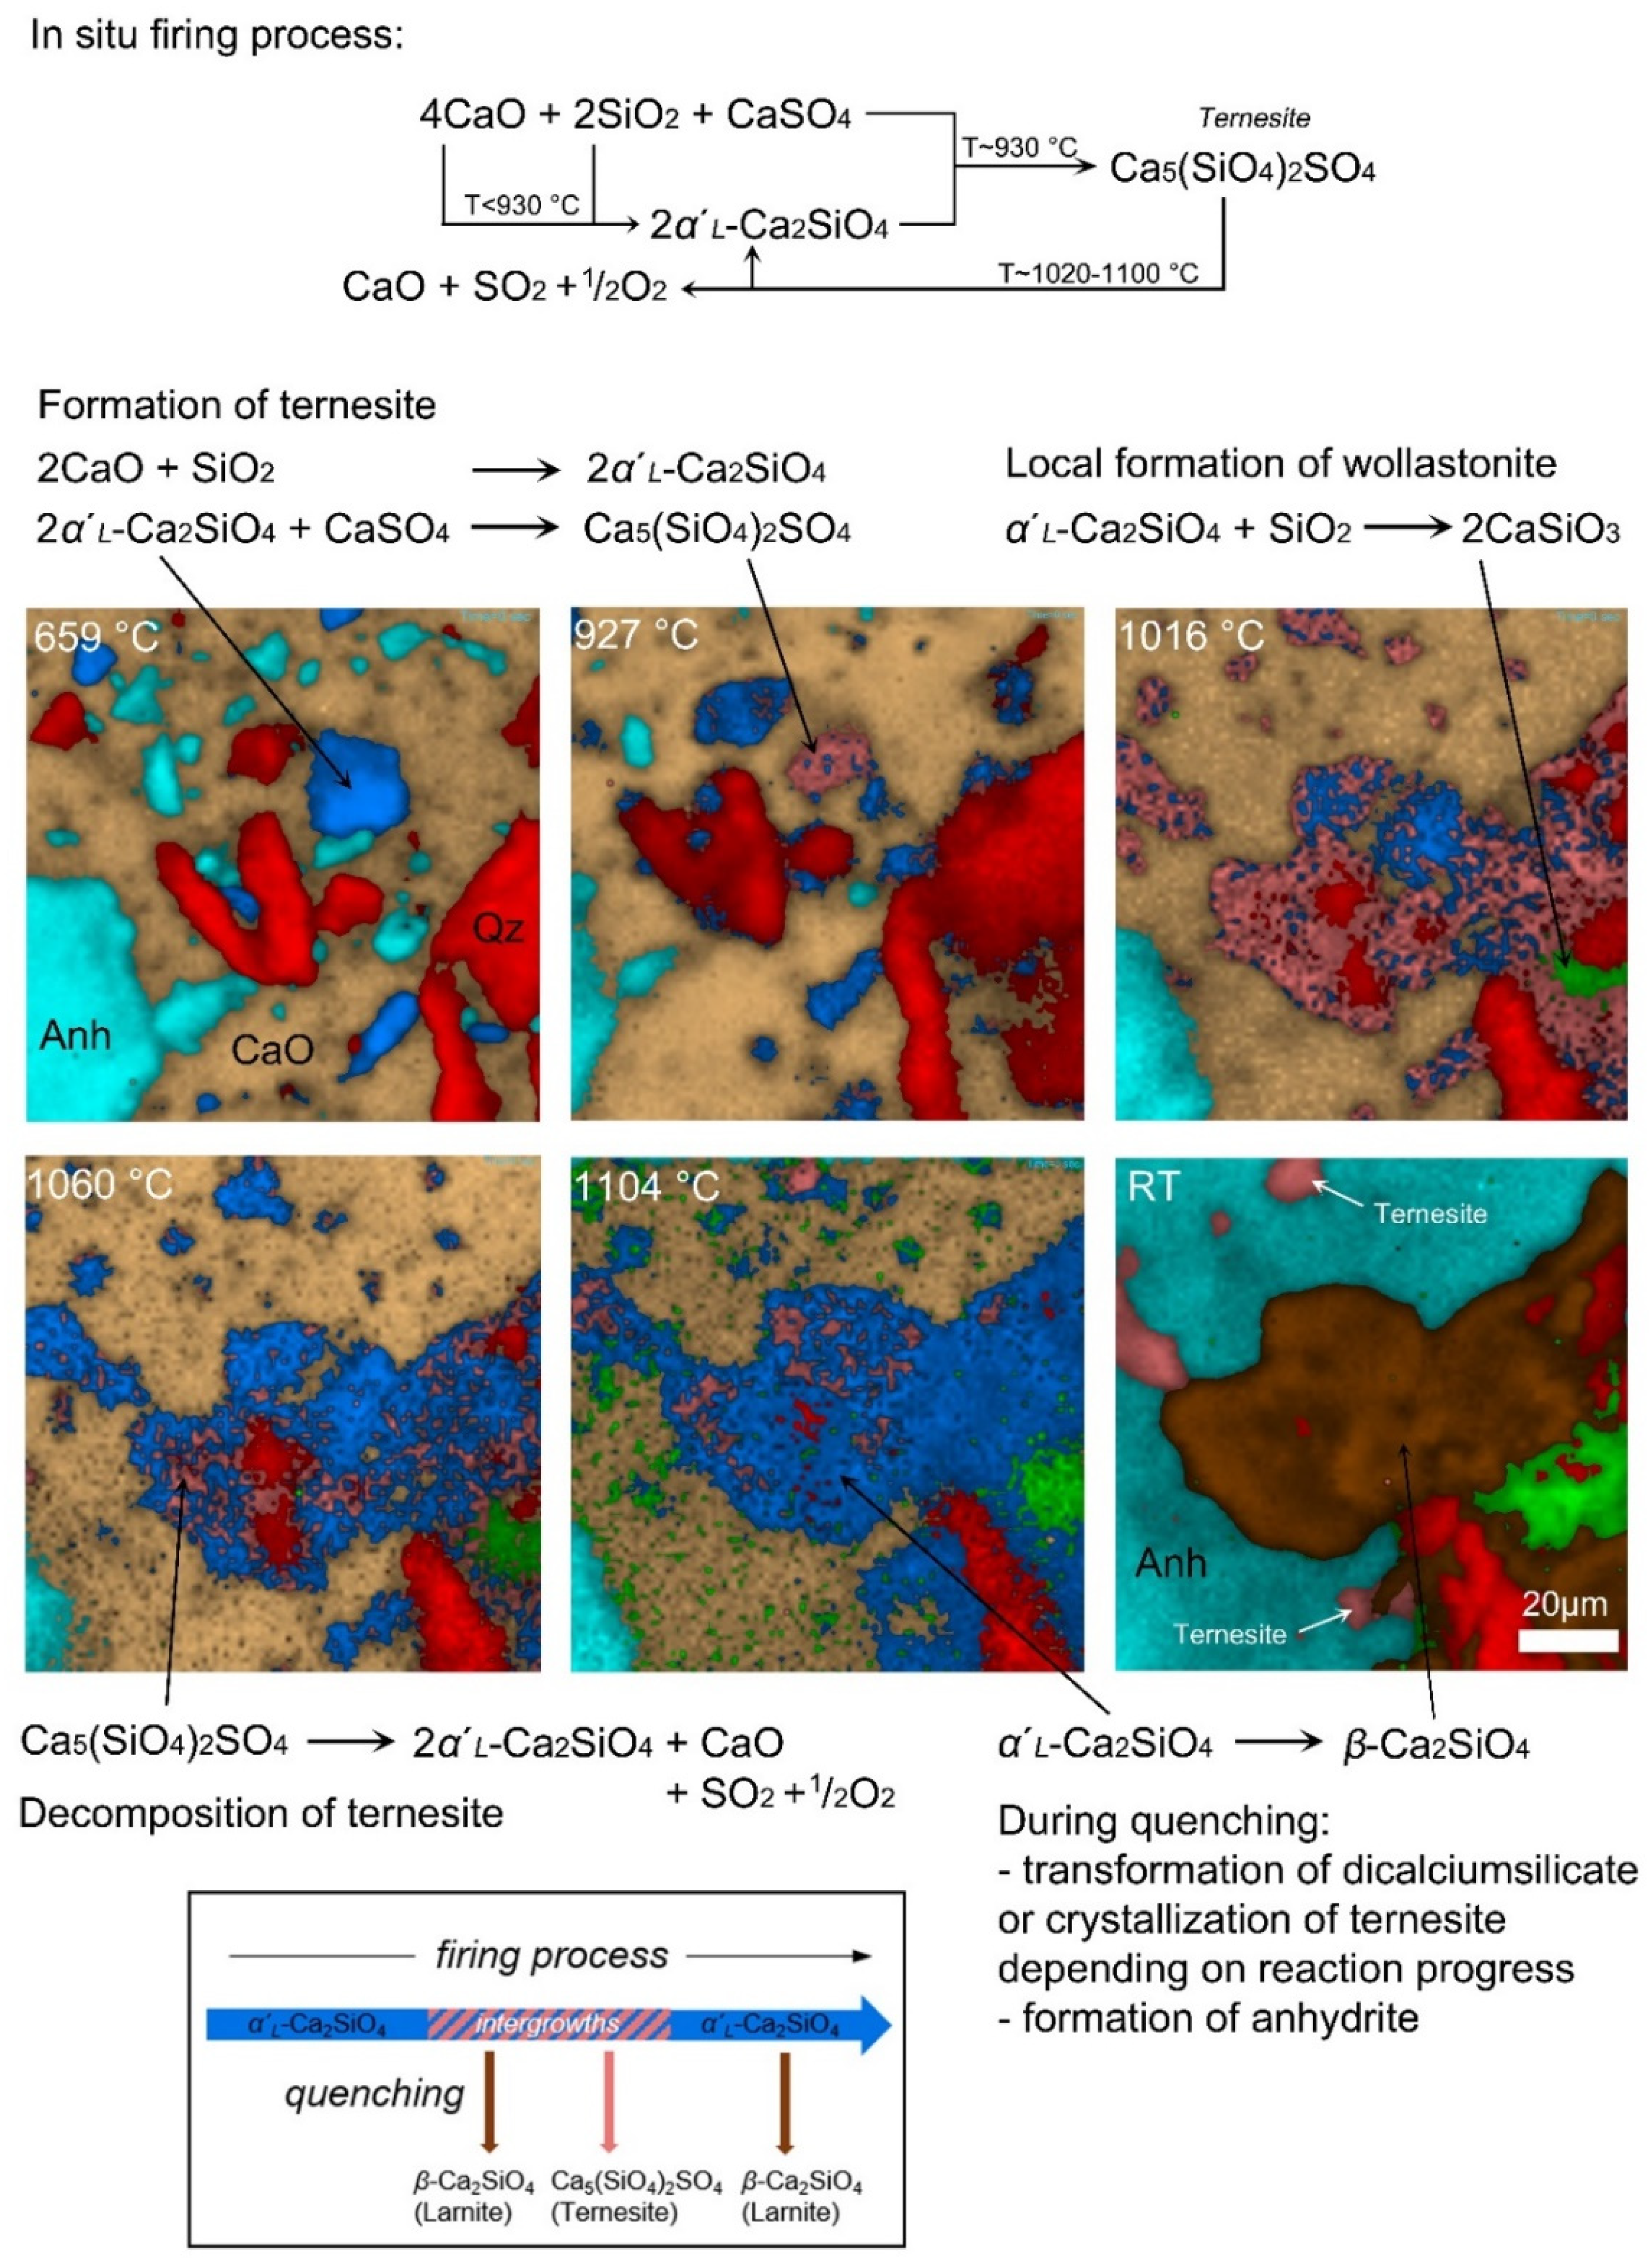
3.3. In Situ Experiments AQC-1.1 and AQC-1.2

In the experiment AQC-1.1, the green body was first fired to 927 ± 5 °C with a heating rate of 10 °C/min. Afterwards, the sample was fired stepwise (~50 °C-steps) to 1104 ± 5 °C. At 927 ± 5 °C, the HT polymorph of dicalcium silicate, i.e., α’L-Ca2SiO4, already formed at interfaces between lime, anhydrite, and quartz (Figure 4). However, from Figure 4 it is also evident that α’L-Ca2SiO4 did not only crystallize at the interfaces between these three phases, but also as small grains within the CaO matrix. In this case, SiO2 was likely supplied by small quartz particles below the image plane. At this temperature, ternesite was also identified by its dominant Raman band at 983 cm−1. It initially replaced isolated α’L-Ca2SiO4 grains (Figure 4), but with increasing time also started to replace the large quartz grain in the upper left of the imaged area. As the temperature increased, this large quartz grain was replaced more and more by ternesite, whereby either reaction rims were formed around larger quartz grains or smaller quartz grains were completely replaced pseudomorphically. In particular, the time series images at 971 ± 5 °C show the time-dependent replacement of this quartz grain by ternesite, in which only a quartz relic remained in the middle of the grain until the end of the experiment. Noticeably, at 1016 ± 5 °C, dicalcium silicate (α’L-Ca2SiO4) formed new reaction rims around ternesite, producing a layered texture with quartz in the center, ternesite in the middle, and α’L-Ca2SiO4 in the outer layer. At a temperature of 1060 ± 5 °C, the quartz-ternesite replacement proceeded, while new anhydrite had formed (Figure 4 and Figure 5a). This indicates that there must have been a high sulfur fugacity in the furnace. At the maximum firing temperature of 1104 ± 5 °C, the Raman images show a heterogeneous transformation of the large grain of ternesite, still comprising a quartz relic in its center, into dicalcium silicate, which leads to a spotty appearance (Figure 4). On cooling to RT, this α’L-Ca2SiO4 grain completely transformed to β-Ca2SiO4 (larnite), unambiguously identified by its main fundamental Raman band near 858 cm−1 [15,20,22], while smaller dicalcium silicate grains recrystallized to ternesite.
Before starting the AQC-1.2 experiment, a SiO2-CaCO3 sample was fired for five hours at 1200 ± 5 °C to remove sulfur contamination from the furnace by the formation of ternesite during the experiment. Hyperspectral Raman images collected during experiment AQC-1.2 between 659 and 882 ± 5 °C (not shown here) did not reveal the formation of ternesite within the imaged area, but dicalcium silicate could already be observed at 695 ± 5 °C. Its fraction within the imaged area (or better volume) increased steadily with temperature and time over the entire temperature range of this experiment, while, simultaneously, the fractions of CaO supplying minerals and quartz decreased (Figure 5b). Wollastonite was detected locally in contact with a quartz grain from 1016 ± 5 °C.
Within the imaged area, ternesite was first identified at 882 ± 5 °C (Figure 6) as a replacement product of α’L-Ca2SiO4 that reacted with anhydrite, as observed in experiment AQC-1.1. During heating to 1016 ± 5 °C, more dicalcium silicate crystals were transformed to ternesite and grew together, forming a larger aggregate that is outlined by a stippled white line in Figure 6. During further heating, this grain and other smaller grains re-transformed to α’L-Ca2SiO4 and sulfur. The transition temperature for the reverse reaction is between 1016 and 1060 ± 5 °C (Figure 5b). After heating to 1060 ± 5 °C, the recrystallization was already well advanced compared to the reaction progress observed in experiment AQC-1.1 (cf. Figure 4). Again, the recrystallization process produced a spotty intergrowth texture. At the maximum temperature of 1104 ± 5 °C, only some relics of ternesite remained inside the outlined area. Interestingly, during quenching to RT, ternesite recrystallized at the edge of the large dicalcium silicate grains, now transformed to its β-polymorph larnite, or within the newly formed anhydrite matrix, but not within the outlined area that now is a large larnite aggregate.

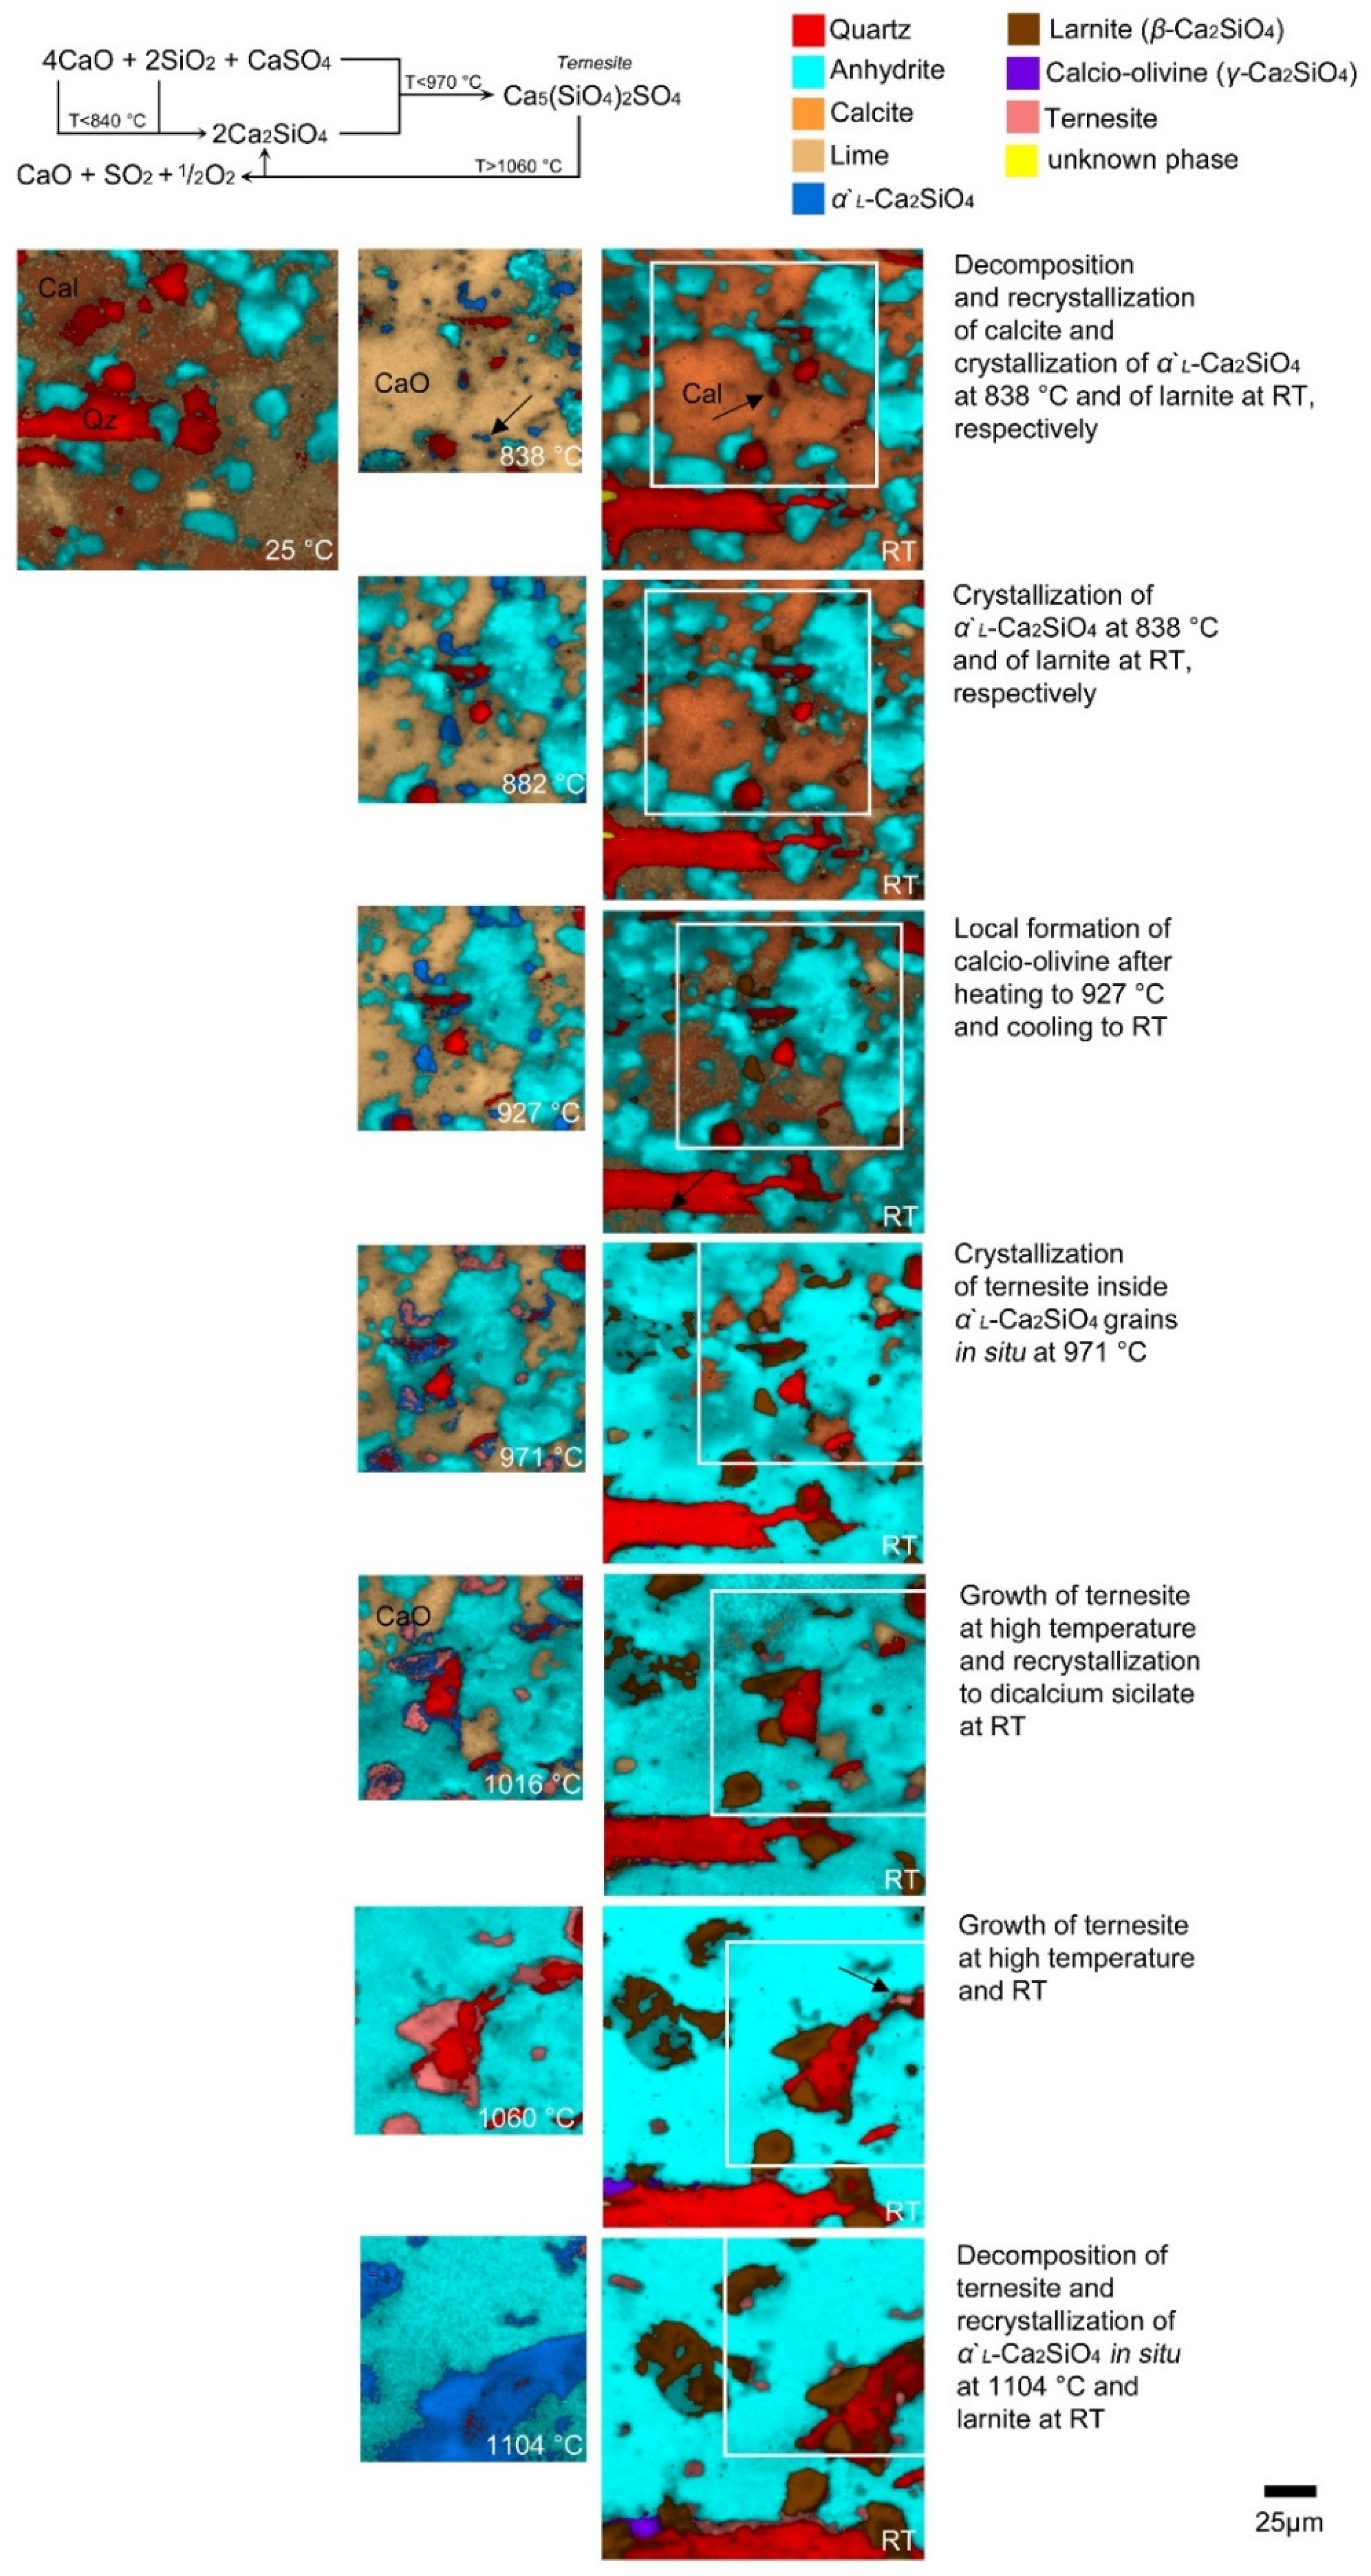
3.4. In Situ/Quench Experiment AQC-2

The experiment AQC-2 was carried out using the same precursor materials as in experiments AQC-1.1 and AQC-1.2. In Figure 7, we show the hyperspectral false-color Raman images that were taken during firing at any high temperature and quenching step, as well as notes to the predominant reactions that can be derived from each in situ image. During firing to the first temperature step of 838 ± 5 °C, calcite decomposed to CaO and CO2 but recrystallized during the following quenching steps. This demonstrated that, in addition to a high sulfur fugacity, there also must have been a high CO2 fugacity in the furnace. However, in the course of the sintering experiment, less and less CaO was formed at high temperatures and therefore less and less calcite could be identified at RT (Figure 5c). At 838 ± 5 °C, dicalcium silicate (α’L-Ca2SiO4) was detected, which transformed to larnite during cooling. Moreover, some isolated calcio-olivine (γ-Ca2SiO4) crystals were identified by their Raman band near 813 cm−1 [20], which were located near a large quartz grain (Figure 7).
From 927 ± 5 °C, ternesite could be identified in various spectra throughout the imaged area. However, the nucleation and growth of ternesite inside dicalcium silicate grains became first visible within the hyperspectral Raman images at 971 ± 5 °C. After stepwise heating/quenching of the green body to/from higher temperatures, ternesite continuously grew at the expense of α’L-Ca2SiO4 until 1060 ± 5 °C (Figure 5c). Interestingly, during each quenching step, many ternesite grains that were present at high temperatures appeared to be transformed into larnite. During heating to 1104 ± 5 °C and quenching to RT, dicalcium silicate crystallized at the expense of ternesite, although some small grains of ternesite remained at RT (Figure 8). From Figure 5c, it can be deduced that, in our experiments, ternesite was stable within an in situ temperature range between 927 and 1060 ± 5 °C. On the other hand, if only the results of the quenched sample (ex situ) are considered, it could be concluded that the upper stability limit for ternesite was 1104 ± 5 °C.

4. Discussion

4.1. The Formation of Calcium Silicates

Within the ternary system CaSO4-SiO2-CaO, dicalcium silicate has previously been observed at temperatures even below about 660 °C. It mainly forms by a reaction between quartz and lime [22,23,24]:
2 CaO + SiO 2   T   <   670   ° C   Ca 2 SiO 4
The formation temperature is much lower than in other experiments, which were performed with anhydrite as a CaO source only [15]. The addition of free CaO (lime) enables the dicalcium silicate formation at lower temperatures because calcium is directly available. However, in this study, the first image was taken at about 660 °C (experiment AQC-1.2). The time- and temperature-series Raman images reveal that α’L-Ca2SiO4 crystallized at the interface between quartz and lime or anhydrite and was formed as a rim around large quartz grains in some cases (exp. AQC 1.1, Figure 4). Hauke and co-workers [16] observed in a sintering experiment with quartz and lime that such rims of dicalcium silicate represent a barrier between the reactants. The further crystallization of α’L-Ca2SiO4 thus had to proceed by diffusion of Ca2+ ions through this barrier layer [16,25]. The observed nucleation of small α’L-Ca2SiO4 grains within the CaO matrix can be explained by small quartz particles embedded in the matrix, which are more reactive than the larger ones due to their larger surface area [16]. Such grain size effects are also important with regard to technical applications. Depending on the homogeneity or inhomogeneity of the starting materials, more or less precursor material is converted to the target substance or leads to fouling in kilns [26,27]. At temperatures >700 °C, dicalcium silicate occurs as α’L-Ca2SiO4, which reversibly transforms to β-Ca2SiO4 during quenching [20].
In experiment AQC 1.2, wollastonite could be identified at about 1020 °C near to a quartz grain. On the one hand, it is well known that wollastonite can be formed by a reaction between quartz and lime [28]. In sinter experiments with anhydrite and quartz, wollastonite already crystallized at temperatures of about 920 °C [15]. The thermal decomposition of anhydrite to CaO and SO3 was found to be significantly influenced by the quartz content of the sample. In those experiments, where more quartz was available, anhydrite decomposed at lower temperatures than in experiments with lesser quartz content. With an increasing temperature and reaction time, α’L-Ca2SiO4 could be identified in the expense of wollastonite [15]. On the other hand, the hyperspectral Raman images of experiment AQC-1.2 reveal that wollastonite could also be a breakdown product of dicalcium silicate and free SiO2 [15,17,29]:
Ca 2 SiO 4 + SiO 2   T   ~   1020 1050   ° C   2 CaSiO 3
The previous formation of dicalcium silicate is bound to a high CaO content [30] that is supplied by the decomposition of anhydrite. Which of the reactions proceeds seems to strongly depend on the local chemistry.

4.2. The Formation and Decomposition of Ternesite

In all experiments, ternesite could be identified at temperatures of about 930 °C. From the time- and temperature-resolved images (Figure 4, Figure 6 and Figure 7), it is apparent that the formation of Ca5(SiO4)2SO4 is related to the reaction between dicalcium silicate and anhydrite:
2 Ca 2 SiO 4 + CaSO 4 T   ~   930   ° C   Ca 5 ( SiO 4 ) 2 SO 4
Gutt and Smith [7] were the first to produce ternesite by heating samples consisting of calcite, quartz, and anhydrite. Other authors who synthesized ternesite, firstly produced dicalcium silicate or belite, respectively [3,31]. These authors proposed that ternesite is formed in a two-step reaction process with dicalcium silicate as an intermediate state, even if quartz, lime, and anhydrite are present. The formation of ternesite by wollastonite as Si and Ca source is also possible, but requires a higher activation energy [32]. Whereas α’L-Ca2SiO4 was observed to replace quartz grains, producing reaction rims, ternesite started to nucleate in the interior of dicalcium silicate grains and from here it continued to grow outwards. The CaSO4 required for the formation of ternesite likely originates from small anhydrite grains that, although invisible in the image, were detected in the respective Raman spectra.
In previous work, the stability temperature of ternesite was estimated to be in the range between 1000 and 1300 °C [1,3,7,32]. The highest ternesite content was reached at temperatures between 1100 and 1200 °C due to the residence time at a high temperature [32]. Depending on whether the system was open or closed, ternesite decomposed at 1150 or 1300 °C, respectively [3,7]. Note that within this temperature regime, the decomposition of a single, isolated ternesite crystal was already completed (Figure 2 and Figure 3). The upper limit also depends on the gas fugacity. At a low oxygen partial pressure, like in kilns, the stabilization of ternesite at higher temperatures could be achieved by an increased SO2 partial pressure. In air, a low SO2 pressure is required at high temperatures [3]. Other experiments show an improved thermal stability of ternesite with increased oxygen concentration [32]. However, all samples were analyzed after they were quenched to RT. The Raman images collected during the in situ/quench experiment (AQC-2), however, clearly reveal that important information can be lost if samples are only analyzed after quenching to RT. For instance, the in situ Raman images show the ternesite formation at 927 ± 5 °C, but at RT no ternesite could be identified (Figure 7). At the next temperature step (971 ± 5 °C) and after quenching again ternesite was detected. After the last firing step, ternesite was found separately located near to larnite. Obviously, ternesite also crystallized during cooling to RT, because at about 1100 °C α’L-Ca2SiO4 was identified in situ at the same place. During the in situ experiments, dicalcium silicate was observed already at a sintering temperature of about 1000 °C, indicating that quenching stabilizes ternesite or a long sintering period is needed for the breakdown of ternesite according to:
Ca 5 ( SiO 4 ) 2 SO 4 T   ~   1020   ° C   2 Ca 2 SiO 4 + CaO + SO 2 +   1 / 2 O 2

4.3. The Ternesite–Dicalcium Silicate Co-Existence

Ternesite and the Ca2SiO4 polymorphs could be clearly identified in all experiments. It appears that both ternesite and α’L-Ca2SiO4 can co-exist at HT over a broad temperature range and that it depends on reaction progress and likely the sulfur fugacity in the furnace whether ternesite or β-Ca2SiO4 crystallizes during cooling. The HT study of a single ternesite crystal reveals significant spectral changes. The position, width, and intensity of the main Raman bands changed significantly with increasing temperature (Figure 2 and Figure 3). As expected, the most dramatic changes occurred in the temperature regime between 730 and 1120 °C, where the ternesite structure broke down (Equation (4)). Due to collapsed tetrahedra, the SiO4 groups move closer to the Ca2+ ions and the bond spacing is shortened. The spotty appearance of partly transformed ternesite crystals observed in the multi-component sintering experiments suggests that the transformation process started by the formation of α’L-Ca2SiO4 nuclei within ternesite that grew further until the entire ternesite host is replaced by dicalcium silicate. The observation of a clear sigmoidal change in the Rν1 intensity ratio as a function of temperature (Figure 3b) supports such a process, where the initial slow rate can be attributed to the time required for forming a significant number of α’L-Ca2SiO4 nuclei. During the intermediate period, the transformation is rapid, since the nuclei grow into particles and consume the ternesite phase while α’L-Ca2SiO4 nuclei continue to form in the remaining ternesite phase. Once the transformation comes near to completion, there is little untransformed ternesite for the nuclei to form in and to grow so the formation of new α’L-Ca2SiO4 domains becomes slow. Furthermore, the already existing α’L-Ca2SiO4 domains begin to touch each other, forming a boundary where growth may stop or the reaction becomes diffusion-controlled. By performing a series of isothermal or isochronal ternesite heating experiments with different heating rates, the activation energy of the process and the nature of the transformation can potentially be determined [33], which is a challenge for the future. The most intriguing observation from our single crystal heating study, however, is that significant spectral changes were observed already at temperatures as low as 170 °C, which cannot be explained by thermally induced anharmonicity and thus must reflect structural rearrangements that precede the decomposition of ternesite to α’L-Ca2SiO4.

5. Summary and Conclusion

The main results and conclusions are summarized in a graphical summary in Figure 8. During the firing of CaO-SiO2-CaSO4 green bodies, α’L-Ca2SiO4 was found to crystallize first and then to transform to ternesite at about 930 °C. A longer dwell time led to an earlier formation of ternesite (c.f. Figure 7, 882 ± 5 °C). In the multi-phase experiments, ternesite decomposed to dicalcium silicate, lime, and sulfur oxide within the temperature range between 1020 and 1100 °C. During quenching to RT, α’L-Ca2SiO4 transformed to β-Ca2SiO4 (larnite) or recrystallized to ternesite, whereby it evidently depends on the reaction progress whether ternesite or larnite was identified after quenching to RT.
In addition, a natural ternesite crystal was heated to 1230 °C in 10 °C-steps and analyzed by HT Raman spectroscopy. This experiment already revealed structural changes in ternesite during firing at temperatures as low as 170 °C and a phase transformation to α’L-Ca2SiO4 between 730 and 1120 °C. Within this temperature range, both the ternesite and dicalcium silicate domains co-exist. These results basically confirm the upper stability limit of ternesite determined by the multi-phase sintering experiments and remarkably demonstrate the power of in situ Raman imaging to study high-temperature solid-state reactions in multi-component systems.

Author Contributions

Conceptualization, N.B. and T.G.; Methodology, N.B., K.H. and T.G.; Software, N.B.; Validation, N.B, K.H. and T.G.; Formal Analysis, N.B. and K.H.; Investigation, N.B.; Resources, N.B.; Data Curation, N.B.; Writing–Original Draft Preparation, N.B. and K.H.; Writing–Review & Editing, T.G.; Visualization, N.B.; Supervision, T.G.; Project Administration, T.G. and M.N.; Funding Acquisition, T.G. All authors have read and agreed to the published version of the manuscript.

Funding

This research was financially supported by the RWE Power AG, Kraftwerk Niederaußem, Bergheim, Germany. K.H. is funded by the Deutsche Forschungsgemeinschaft (DFG, grant number GE1094/22-1).

Acknowledgments

Many thanks go to B. Ternes for providing the natural ternesite sample.

Conflicts of Interest

The authors declare no conflict of interest.

References

  1. Irran, E.; Tillmanns, E.; Hentschel, G. Ternesite, Ca5(SiO4)2SO4, a new mineral from the Ettringer Bellerberg/Eifel, Germany. Miner. Pet. 1997, 60, 121–132. [Google Scholar] [CrossRef]
  2. Galuskin, E.; Galuskina, I.; Gfeller, F.; Krüger, B.; Kusz, J.; Vapnik, Y.; Dulski, M.; Dzierżanowski, P. Silicocarnotite, Ca5[(SiO4)(PO4)](PO4), a new old mineral from the Negev Desert, Israel, and the ternesite–silicocarnotite solid solution: Indicators of high-temperature alteration of pyrometamorphic rocks of the Hatrurim Complex, Southern Levant. Eur. J. Miner. 2016, 28, 105–123. [Google Scholar] [CrossRef]
  3. Hanein, T.; Galan, I.; Glasser, F.P.; Skalamprinos, S.; Elhoweris, A.; Imbabi, M.S.; Bannerman, M.N. Stability of ternesite and the production at scale of ternesite-based clinkers. Cem. Concr. Res. 2017, 98, 91–100. [Google Scholar] [CrossRef]
  4. Brotherton, P.D.; Epstein, J.M.; Pryce, M.W.; White, A.H. Crystal Structure of “Calcium Sulphosilicate”, Ca5(SiO4)2SO4. Aust. J. Chem. 1974, 27, 657–660. [Google Scholar] [CrossRef]
  5. Pryce, M.W. Calcium sulphosilicate in lime-kiln wall coating. Miner. Mag. 1972, 38, 968–971. [Google Scholar] [CrossRef]
  6. Neuroth, M. Internal Report of RWE, KW Neurath, Unpublished work. 2017.
  7. Gutt, W.; Smith, M.A. A new calcium silicosulphate. Nature 1966, 210, 408–409. [Google Scholar] [CrossRef]
  8. Dienemann, W.; Schmitt, D.; Bullerjahn, F.; Haha, M. Ben Belite-Calciumsulfoaluminate-Ternesite (BCT)—A new low-carbon clinker technology. Cem. Int. 2013, 11, 100–109. [Google Scholar]
  9. Bullerjahn, F.; Schmitt, D.; Haha, M. Ben Cement and Concrete Research Effect of raw mix design and of clinkering process on the formation and mineralogical composition of (ternesite) belite calcium sulphoaluminate ferrite clinker. Cem. Concr. Res. 2014, 59, 87–95. [Google Scholar] [CrossRef]
  10. Shen, Y.; Qian, J.; Huang, Y.; Yang, D. Synthesis of belite sulfoaluminate-ternesite cements with phosphogypsum. Cem. Concr. Compos. 2015, 63, 67–75. [Google Scholar] [CrossRef]
  11. Galan, I.; Elhoweris, A.; Hanein, T.; Bannerman, M.N.; Glasser, F.P. Advances in clinkering technology of calcium sulfoaluminate cement. Adv. Cem. Res. 2017, 1–13. [Google Scholar] [CrossRef]
  12. Hanein, T.; Elhoweris, A.; Khare, S.; Skalamprinos, S.; Jen, G.; Whittaker, M.; Imbabi, M.S.; Glasser, F.P.; Galan, I.; Bannerman, M.N. Production of belite calcium sulfoaluminate cement using sulfur as a fuel and as a source of clinker sulfur trioxide: Pilot kiln trial. Adv. Cem. Res. 2016, 28, 643–653. [Google Scholar] [CrossRef] [Green Version]
  13. Hofman, H.; Mostowitsch, W. The behavior of calcium sulfate at elevated temperatures with some fluxes. Trans. Am. Inst. Min. Metall. Eng. 1909, 32, 628–653. [Google Scholar]
  14. Mihara, N.; Kuchar, D.; Kojima, Y.; Matsuda, H. Reductive decomposition of waste gypsum with SiO2, Al2O3, and Fe2O3 additives. J. Mater. Cycles Waste Manag. 2007, 9, 21–26. [Google Scholar] [CrossRef]
  15. Böhme, N.; Hauke, K.; Neuroth, M.; Geisler, T. In situ Raman imaging of high-temperature solid-state reactions in the CaSO4–SiO2 system. Int. J. Coal Sci. Technol. 2019, 6, 247–259. [Google Scholar] [CrossRef] [Green Version]
  16. Hauke, K.; Kehren, J.; Böhme, N.; Zimmer, S.; Geisler, T. In situ Hyperspectral Raman Imaging: A new Method to investigate Sintering Processes of Ceramic Material at High Temperature. Appl. Sci. 2019, 9, 1310. [Google Scholar] [CrossRef] [Green Version]
  17. Stange, K.; Lenting, C.; Geisler, T. Insights into the evolution of carbonate-bearing kaolin during sintering revealed by in situ hyperspectral Raman imaging. J. Am. Ceram. Soc. 2018, 101, 897–910. [Google Scholar] [CrossRef]
  18. Lafuente, B.; Downs, R.T.; Yang, H.; Stone, N. The power of databases: The RRUFF project. In Highlights in Mineralogical Crystallography; Armbruster, T., Danisi, R.M., Eds.; De Gruyter: Berlin, Germany, 2015; pp. 1–30. [Google Scholar]
  19. Yuan, X.; Mayanovic, R.A.; Zheng, H. Determination of pressure from measured Raman frequency shifts of anhydrite and its application in fluid inclusions and HDAC experiments. Geochim. Cosmochim. Acta 2016, 194, 253–265. [Google Scholar] [CrossRef]
  20. Remy, C.; Reynard, B.; Madon, M. Raman Spectroscopic Investigations of Dicalcium Silicate: Polymorphs and High-Temperature Phase Transformations. J. Am. Ceram. Soc. 1997, 80, 413–423. [Google Scholar] [CrossRef]
  21. Ben Mabrouk, K.; Kauffmann, T.H.; Aroui, H.; Raman, M.D.F. Raman study of cation effect on sulfate vibration modes in solid state and in aqueous solutions. J. Raman Spectrosc. 2018, 44, 1603–1608. [Google Scholar] [CrossRef]
  22. Reynard, B.; Remy, C.; Takir, F. High-pressure Raman spectroscopic study of Mn2GeO4, Ca2GeO4, Ca2SiO4, and CaMgGeO4 olivines. Phys. Chem. Miner. 1997, 24, 77–84. [Google Scholar] [CrossRef]
  23. Mitsuda, T.; Asami, J.; Matsubara, Y.; Toraya, H. Hydrothermal formation of γ-dicalcium silicate from lime-silica mixt.pdf. Cem. Concr. Res. 1985, 15, 613–621. [Google Scholar] [CrossRef]
  24. Singh, N.B. Hydrothermal synthesis of β-dicalcium silicate (β-Ca2SiO4). Prog. Cryst. Growth Charact. Mater. 2006, 52, 77–83. [Google Scholar] [CrossRef]
  25. Fierens, P.; Picquet, P. Kinetic Studies of the Thermal Synthesis of Calcium Silicates above 1400 °C: I, Dynamic Thermal Synthesis of Ca2SiO4. J. Am. Ceram. Soc. 1975, 58, 50–51. [Google Scholar] [CrossRef]
  26. Kostakis, G. Mineralogical composition of boiler fouling and slagging deposits and their relation to fly ashes: The case of Kardia power plant. J. Hazard. Mater. 2011, 185, 1012–1018. [Google Scholar] [CrossRef]
  27. Li, J.; Zhu, M.; Zhang, Z.; Zhang, K.; Shen, G.; Zhang, D. The mineralogy, morphology and sintering characteristics of ash deposits on a probe at different temperatures during combustion of blends of Zhundong lignite and a bituminous coal in a drop tube furnace. Fuel Process. Technol. 2016, 149, 176–186. [Google Scholar] [CrossRef]
  28. Tschegg, C.; Ntaflos, T.; Hein, I. Thermally triggered two-stage reaction of carbonates and clay during ceramic firing-A case study on Bronze Age Cypriot ceramics. Appl. Clay Sci. 2009, 43, 69–78. [Google Scholar] [CrossRef]
  29. Ptáček, P.; Opravil, T.; Šoukal, F.; Havlica, J.; Holešinský, R. Kinetics and mechanism of formation of gehlenite, Al-Si spinel and anorthite from the mixture of kaolinite and calcite. Solid State Sci. 2013, 26, 53–58. [Google Scholar] [CrossRef]
  30. Rashid, A.R.; Shamsudin, R.; Abdul Hamid, M.A.; Jalar, A. Low temperature production of wollastonite from limestone and silica sand through solid-state reaction. J. Asian Ceram. Soc. 2014, 2, 77–81. [Google Scholar] [CrossRef] [Green Version]
  31. Choi, G.; Glasser, F.P.; Skalny, C.J. The sulphur cycle in cement kilns: Vapour pressures and solid-phase stability of the sulphate phases. Cem. Concr. Res. 1988, 18, 367–374. [Google Scholar] [CrossRef]
  32. Scholten, T. Reaktionskinetik von sulfatischen Klinkerphasen in Zementen mit verminderter CO2-Last. Ph.D. Dissertation, Technische Universität Clausthal, Clausthal-Zellerfeld, Germany, 2017. [Google Scholar]
  33. Rheingans, B.F. Analysis of the kinetics of phase transformations. J. Mater. Sci. 1992, 27, 3977–3987. [Google Scholar]
Figure 1. (a) Room-temperature (RT) Raman spectrum of the natural ternesite sample in the frequency range between 100 and 1230 cm−1 in comparison with a ternesite reference RT spectrum from the RRUFFTM spectral data base [18]. The fitted spectrum, the deconvoluted bands, and the simultaneously fitted 5th order polynomial background are also shown but shifted from the measured spectrum along the y axis for clarity. (bd) Cutouts from the spectrum shown in (a) in the frequency ranges of (b) the lattice vibrations between 100 and 250 cm−1, (c) the internal bending modes of SO4/SiO4 groups between 250 and 700 cm−1, and (d) the internal stretching modes between 700 and 1230 cm−1, respectively. The bands are labelled with ascending numbers, which are used in Table 3 for easy assignment.
Minerals 10 00287 g001
Figure 2. (a) Stacked Raman spectra (20 °C-steps) of the ternesite recorded between 25 and 1230 ± 5 °C. From 730 ± 5 °C, the ternesite transformed to α’L-Ca2SiO4 and sulfur (orange spectra). Above 1120 ± 5 °C, only bands of α’L-Ca2SiO4 can be identified (red spectra). At 1230 °C, only 14 Raman modes can be identified between 100 and 1230 cm−1 and their frequencies are indicated. Note that the spectra are shown after background correction. The blue arrow points to a sudden intensity increase in the weak band at 1044 cm−1 (no. 47) at 170 °C. (b) The color-coded Raman intensity as a function of the Raman shift and temperature (red and blue colors represent high and low intensities, respectively). Dashed lines mark the temperature range in which ternesite transformed to α’L-Ca2SiO4 in our experiment.
Minerals 10 00287 g002
Figure 3. (a) The frequency of the v1(SO4) and v1(SiO4) bands of ternesite as a function of temperature. Stippled lines mark the onset and end of the ternesite-to-dicalcium silicate phase transition between about 730 to 1120 °C, respectively. The published high-temperature (HT) Raman frequencies of α’L-Ca2SiO4 [20] and own preliminary and unpublished HT data along with a quadratic fit (red curve) are also shown. Blue lines represent linear least-squares fits to the data below 160 °C (n = 14). (b) The temperature dependence of the integrated intensity ratios Av1(SO4)/Av1(SiO4) (blue circles, left axis) and A1044/Av1(SiO4) (blue squares, right axis) between both v1 bands, normalized between 0 and 1, and between the weak band near 1044 cm−1 and the v1(SO4) band, respectively. The blue and purple curve represent least-squares fit of a sigmoidal Boltzmann function to the data between RT and 730 °C and between 700 and 1230 °C, respectively. See text for more details.
Minerals 10 00287 g003
Figure 4. False-colored hyperspectral Raman images of the mineral distribution of a 100 × 100-µm2 surface area of a green body made of CaO, anhydrite, and quartz at different temperatures and two dwell times (experiment AQC−1.1). The specified dwell time indicates the time that has elapsed after reaching the reaction temperature. The black arrows hint to new formed mineral phases. Note that the decomposition of ternesite started at 1016 ± 5 °C and continued to 1104 ± 5 °C (see arrows). During the cooling process, the α’L-phase transformed to the β-phase (larnite) and also partially remained metastable at RT (see arrows).
Minerals 10 00287 g004
Figure 5. The evolution of the mineral fractions (DiC = dicalcium silicate, ternesite, quartz, anhydrite, CaO, calcite, and Wo = wollastonite) within the imaged volume as a function of temperature and time. (a) Experiment AQC-1.1, (b) experiment AQC-1.2 (light grey circles correspond to a failed measurement, where the focus was lost), and (c) experiment AQC-2 (contents of anhydrite and quartz are not shown here).
Minerals 10 00287 g005
Figure 6. Normalized false-color Raman images of the ternesite fraction from the in situ experiment AQC-1.2, each recorded at the beginning of each temperature step. At 882 ± 5 °C, ternesite could already be identified (green arrow). With increasing temperature, more and more ternesite replaced dicalcium silicate and after exceeding 1060 ± 5 °C recrystallized to dicalcium silicate.
Minerals 10 00287 g006
Figure 7. False-colored hyperspectral Raman images of the mineral distribution of a 100 × 100-µm2 surface area of a green body made of CaO, anhydrite, and quartz at different sintering temperatures (in situ/quench experiment AQC-2) with information on the predominant reactions that can be derived from the images. Note that a larger area was measured at RT. The white frame marks the corresponding area at HT. The imaged area varies slightly due to the shrinkage and expansion of the sample. The black arrows in the image taken at 838 °C and at RT (upper right) point to small crystals of larnite or its high-temperature polymorph, respectively.
Minerals 10 00287 g007
Figure 8. Graphical summary of the main results of the sintering experiments.
Minerals 10 00287 g008
Table 1. Summary of 88 electron microprobe analyses of the ternesite sample used in this study compared with results of Irran et al. [1].
OxidesRange [1] (wt.%)Average [1] (wt.%)Range [This Study] (wt.%)Average [This Study] (wt.%)
CaO57.32–60.3558.90 ± 0.8357.69–59.2158.50 ± 0.28
SiO223.05–27.2325.22 ± 1.2824.57–25.7925.13 ± 0.28
SO313.80–18.0416.34 ± 1.2515.21–17.0216.27 ± 0.34
Table 2. Experimental conditions.
Exp.Anh:Qtz:CaO (mol ratio)Type of ExperimentTrangeTsteps TrateAcquisitionRecording
(°C)(°C)(°C/min)Time (s)Time (h)
Ternesite in situ 30–12301010 ↗↘100 s
AQC-1.11:2:4 in situ 927–1104~5010 ↗↘0.52 × 2 (4) *
AQC-1.21:2:4 in situ 659–1104~5010 ↗↘0.52 × 2 (4) *
AQC-21:2:4in situ/quench 838–1104~5010 ↗↘0.52 × 2 (4) *
* During a dwell time of 4 h, two Raman images with a recording time of about 2 h were recorded.
Table 3. Frequencies (Raman shift), widths, given as the full width at half maximum (FWHM), and the relative intensities of 51 observed Raman bands of ternesite at room temperature and the proposed mode assignment.
No.Raman ShiftFWHMRelative Intensity *RemarksHerzberg NumberingApproximate Type of Mode
(cm−1)(cm−1)
195.411.1vwoutside measured frequency range, but used in the fitting process Lattice vibrations
2106.65.0vw
3119.014.3vw
4122.34.9w
5133.16.6vw
6139.23.2vw
7155.58.2s
8170.55.8vw
9179.07.7vw
10184.421.9vw
11198.911.4w
12209.09.2vw
13229.012.0s
14244.511.1vw
15280.911.6w v2(SO4) or v2(SiO4)O–S–O or O–Si–O symmetric bending
16292.613.8s
17304.410.4w
18313.914.8s
19339.820.1vw
20378.117.1w
21428.211.4s v2(SO4)O–S–O symmetric bending
22442.18.0w
23451.520.1w v2(SO4) or v2(SiO4)O–S–O or O–Si–O symmetric bending
24459.613.6vw
25485.814.7s
26509.711.9w v4(SiO4)O–Si–O anti-symmetric bending
27531.48.2w
28543.615.1vw ?
29568.515.6vw
30595.862.5vwvery broad
31602.88.3s v4(SO4)O–S–O anti-symmetric bending
32628.78.0w
33658.88.8s
34728.462.2vwvery broad?
35752.729.1vw772 cm−1 in RRUFF spectrum
36799.847.0w
37832.010.9vs v1(SiO4)Si–O symmetric stretching
38855.317.0vw
39877.813.3s v3(SiO4)Si–O anti-symmetric stretching
40891.07.2w
41896.910.8w
42940.117.5w ?
43956.98.7w
44975.542.7vwbroad
451000.911.6shiddenv1(SO4)S–O symmetric stretching
461006.07.7vs
471043.925.0w ?
481120.213.3s v3(SO4)S–O anti-symmetric stretching
491134.310.1s
50 1144.010.0w
511181.88.8w
Based on intensity maximum: vs: very strong; s: strong, w: weak; vw: very weak.

