Article

Vibrational Investigation of Pressure-Induced Phase Transitions of Hydroxycarbonate Malachite Cu2(CO3)(OH)2

1
State Key Laboratory of Lithospheric Evolution, and Institutions of Earth Science, Institute of Geology and Geophysics, Chinese Academy of Sciences, Beijing 100029, China
2
MNR Key Laboratory of Metallogeny and Mineral Assessment, Institute of Mineral Resources, Chinese Academy of Geological Sciences, Beijing 100037, China
*
Authors to whom correspondence should be addressed.
Minerals 2020, 10(3), 277; https://doi.org/10.3390/min10030277
Submission received: 11 February 2020 / Revised: 16 March 2020 / Accepted: 17 March 2020 / Published: 19 March 2020
(This article belongs to the Special Issue Vibrational (Infrared and Raman) Spectroscopy of Minerals)

Abstract

:
Malachite Cu2(CO3)(OH)2 is a common hydroxycarbonate that contains about 15.3 wt % H2O. Its structural chemistry sheds light on other hydroxyl minerals that play a role in the water recycling of our planet. Here using Raman and infrared spectroscopy measurements, we studied the vibrational characteristics and structural evolution of malachite in a diamond anvil cell at room temperature (25 °C) up to ~29 GPa. Three types of vibrations were analyzed including Cu–O vibrations (300–600 cm−1), [CO3]2− vibrations (700–1600 cm−1), and O–H stretches (3200–3500 cm−1). We present novel observations of mode discontinuities at pressures of ~7, ~15, and ~23 GPa, suggesting three phase transitions, respectively. First, pressure has a great effect on the degree of deformation of the [CuO6] octahedron, as is manifested by the various shifting slopes of the Cu–O modes. [CuO6] deformation results in a rotation of the structural unit and accordingly a phase transition at ~7 GPa. Upon compression to ~15 GPa, the O–H bands redshift progressively with significant broadness, indicative of an enhancement of the hydrogen bonding, a shortening of the O···O distance, and possibly somewhat of a desymmetrization of the O–H···O bond. O–H mode hardening is identified above ~15 GPa coupled with a growth in the amplitude of the lower-energy bands. These observations can be interpreted as some reorientation or reordering of the hydrogen bonding. A further increment of pressure leads to a change in the overall compression mechanism of the structure at ~23 GPa, which is characterized by the blueshift of the O–H stretches and the softening of the O–C–O in-plane bending bands. The hydrogen bonding weakens due to a substantial enhancement of the Cu–H repulsion effect, and the O···O bond length shows no further shortening. In addition, the change in the local geometry of hydrogen is also induced by the softening of the [CO3]2− units. In this regard we may expect malachite and other analogous hydroxyl minerals as capable of transporting water downward towards the Earth’s transition zone (~23 GPa). Our results furnish our knowledge on the chemistry of hydrogen bonding at mantle conditions and open a new window in understanding the synergistic relations of water and carbon recycling in the deep Earth.

Graphical Abstract

1. Introduction

The circulation of water plays an important role in geological processes in the evolution of our planet. In descending slabs, the crustal water is recycled into the Earth’s mantle through hydrogen-bearing phases (e.g., serpentine Mg3(Si4O10)(OH)2) and nominally anhydrous minerals (e.g., olivine (Mg,Fe)2(SiO4)) [1]. At various depths in subduction regions, the presence of water is probably the origin of the observed seismic anomalies such as low velocities and high shear wave splitting [2]. Meanwhile, slabs dehydrating progressively with depth and releasing water provide a potential mechanism for rehydration of the overlaying mantle, exerting profound influence on mantle convection and the resulting volatile recycling and heterogeneity [1,3]. Thus, for insights into water recycling into the Earth’s interior, as well as its effects on the physicochemical conditions and dynamics of the mantle, a primary method is to study the thermodynamic stabilities of hydrogen-bearing minerals under high pressure conditions.
A succession of dense hydrous magnesium silicates (e.g., phase B: Mg10Si3O14(OH)4, phase D: MgSi2O4(OH)2, phase E: Mg2SiO2(OH)4, phase H: MgSiO2(OH)2 and super-hydrous phase B) has been demonstrated as stable within the subducting lithosphere to lower mantle pressures [4,5,6,7]. Yet these Mg end-members decompose at temperatures lower than those of the mantle geotherms, and thus they cannot be long-term water reservoirs in the deep Earth. Substitution of Mg with Al stabilizes the hydrous phases to higher temperatures [8,9,10], but their occurrences have been scarcely reported in nature. A pressing issue emerges regarding whether other hydrogen-bearing phases exist that could account for the estimated water content inside the Earth [11,12,13].
Here we focus on a hydroxycarbonate malachite Cu2(CO3)(OH)2 which contains about 15.3 wt % H2O. Malachite is an important index mineral for hydrous environments enriched with carbonate ions [14], which provide crucial clues for sequestration and circulation of water on the Earth. Malachite has a relatively simple chemistry whose high-pressure behavior will increase our understanding of the hydrogen-carriers in the deep Earth. Malachite also merits our preferential considerations because of its superior bonding of hydrogen with [CuO6] octahedron due to the strong and partially covalent effect of Cu2+ [15,16]. At atmospheric pressure, the thermodynamic properties of malachite have been studied in terms of heat capacity and enthalpy change in the temperature range of 20–500 °C [17]. Above 380 °C malachite breaks down releasing water and CO2 simultaneously [18]. The application of pressure, however, counteracts the thermal decomposition effect, shifts the thermodynamic stability toward higher temperatures, and even realizes an over-hydrated state for some hydrous minerals (e.g., zeolites; [19]); but the effect of pressure on the properties of malachite is confused considerably. Measurements on the behaviors of malachite under pressure have been confined to an X-ray diffraction study under 10 GPa [20] and a density functional theory research to a maximum pressure of 5.72 GPa [21]. It has been reported that a phase transition of malachite occurs at 6–7 GPa driven by a deformation effect of [CuO6] octahedron. The higher-pressure phase, rosasite, is much higher in density and atomic interactions are dramatically enhanced. The behavior of hydrogen during structural change is more crucial in water preservation, yet it is the least understood. Therefore, the present study takes advantage of in-situ Raman and infrared spectroscopy to examine the vibrational characteristics of malachite with contributions from all types of modes. With the aim of revealing the physical processes involving the response of hydrogen to pressure, the synergistic relations of hydrogen and the coordinated [CuO6] octahedron and [CO3]2− units are discussed in detail at the molecular level. Our results will add to our knowledge of the structural chemistry of hydrogen agents in the deep Earth.

2. Samples and Experiments

The malachite sample used for the high-pressure experiments was picked out from botryoidal aggregates collected at Yangchun copper mine in Yangchun, Guangdong, China. Its composition formula has been determined as (Cu1.92Fe0.06Mn0.02)(CO3)(OH)2 (for simplicity written as Cu2(CO3)(OH)2 in the following text) by an inductively coupled plasma optical emission spectrometer at the Institute of Tibetan Plateau Research, Chinese Academy of Sciences (ITPCAS), Beijing, China. The crystal structure, identified by X-ray diffraction (Cu k radiation) at the ITPCAS, possesses a monoclinic symmetry (space group: P21/a, Z = 4). The values of the lattice constants are derived as a0 = 9.488(2) Å, b0 = 11.955(2) Å, c0 = 3.247(2) Å, β = 98.62(2)°, and V = 364.6 Å3, in agreement with a0 = 9.502 Å, b0 = 11.974 Å, c0 = 3.24 Å, β = 98.75°, and V = 364.35 Å3 in [16].
A symmetrical-type diamond anvil cell [22] with type-II diamond anvils (culet size 300 μm) was utilized for generating pressure. A rhenium gasket with an initial thickness of 250 μm, was pre-indented to 50 μm. A hole of 150 μm in diameter was drilled in the center of the indentation by electro-spark erosion, used as a sample chamber. A malachite chip was loaded into the chamber filled with silicone oil as a pressure transmitting medium in Raman spectroscopic measurements. For infrared spectroscopy, a thin malachite chip 10 μm in thickness was sandwiched between dried KBr layers that served as an infrared window and pressure medium. Pressures were measured according to the shifts of ruby fluorescence lines [23]. Both vibrational measurements were conducted at the Institute of Geology and Geophysics, Chinese Academy of Sciences (IGGCAS), Beijing, China.
In Raman spectroscopy experiments, a 488 nm solid-state continuous-wave laser equipped with WITec alpha 300R was employed as an excitation source. A piece of single-crystal silicon was used to calibrate the wave numbers of the Raman shifts. The spectra of malachite were recorded through a 10× magnification objective lens with a 0.55 numerical aperture in backscattering geometry to the sample. After scattered Raman light passed through a pinhole of 20 µm, the light was dispersed on a grating of 300 g/mm, resulting in a spectral resolution of 1.105 cm−1 in the spectral region of 0–4500 cm−1. The laser power was 20 mW and the acquisition time for each spectrum was 10 s with an accumulation of two times.
Infrared spectroscopy is particularly sensitive to rearrangements of hydrogen atoms in structures. High-pressure Fourier transform infrared spectroscopy (FTIR) measurements were carried out on a Bruker VERTEX 70V instrument (Bruker Optik GmbH, Ettlingen, Germany). A Bruker Hyperion 2000 microscope (Bruker Optics, Billerica, MA, USA) was used to record spectra in a 20 × 20 μm2 aperture in a region of 650–5000 cm−1, encompassing the vibrational characteristics of both O–H stretches and [CO3]2− modes. A KBr beam-splitter (Interspectrum, Tartumaa, Estonia) and a liquid-nitrogen cooled MCT-A (mercury-cadmium-telluride) detector (Block Engineering Technology, Southborough, MA, USA) were applied. A total of 640 scans were accumulated in each spectrum, and the acquisition time for each spectrum was 520 s, to improve the signal-to-noise ratio at a 4 cm−1 resolution. For individual pressure increments, we recorded a background spectrum and automatically subtracted it from the pattern of the sample.
When collecting a spectrum with new features under pressure, we check the spectra of different positions to verify if the anomalies are general characteristics that are indicative of structural changes or just due to local stress or defects. After competition of the experiments, the spectral manipulation and analyses were undertaken by Jandel Peakfit software package (v4.12, Systat Software, San Jose, CA, USA). A Voight function was used for peak fitting with the minimum components used. The fitting was performed until reproducible results were obtained with squared correlations R2 ≥ 0.995.

3. Results

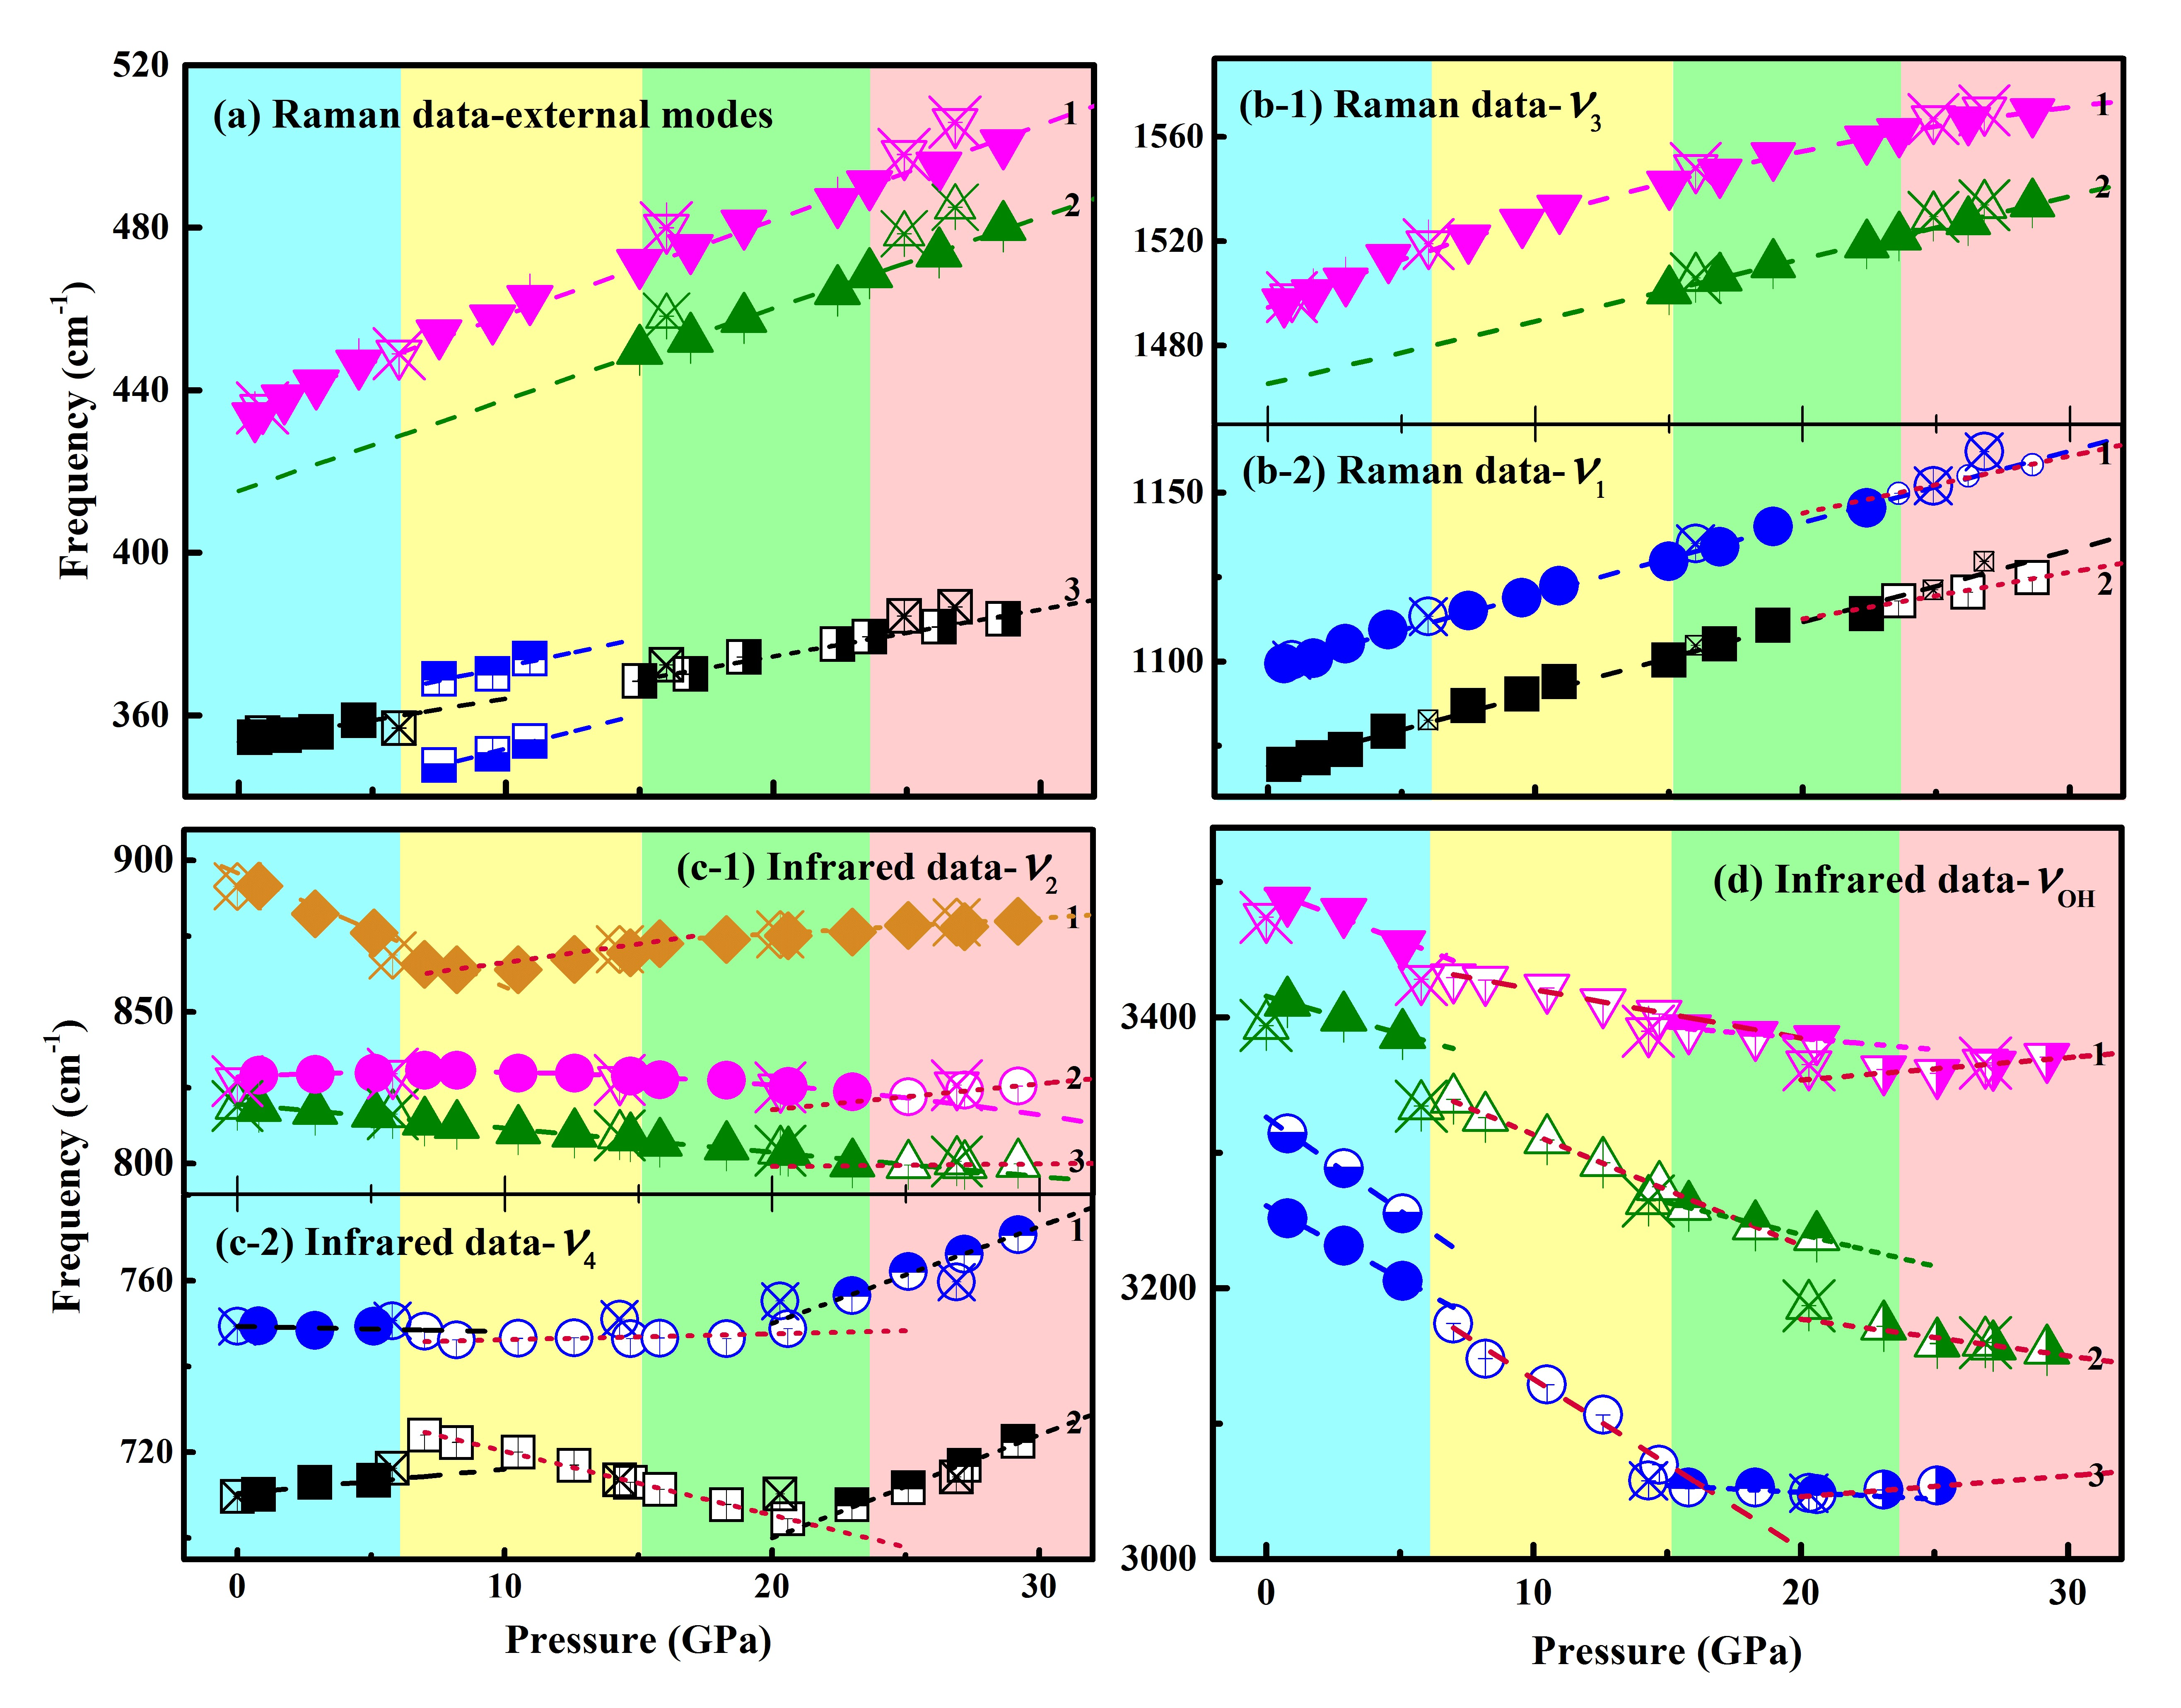
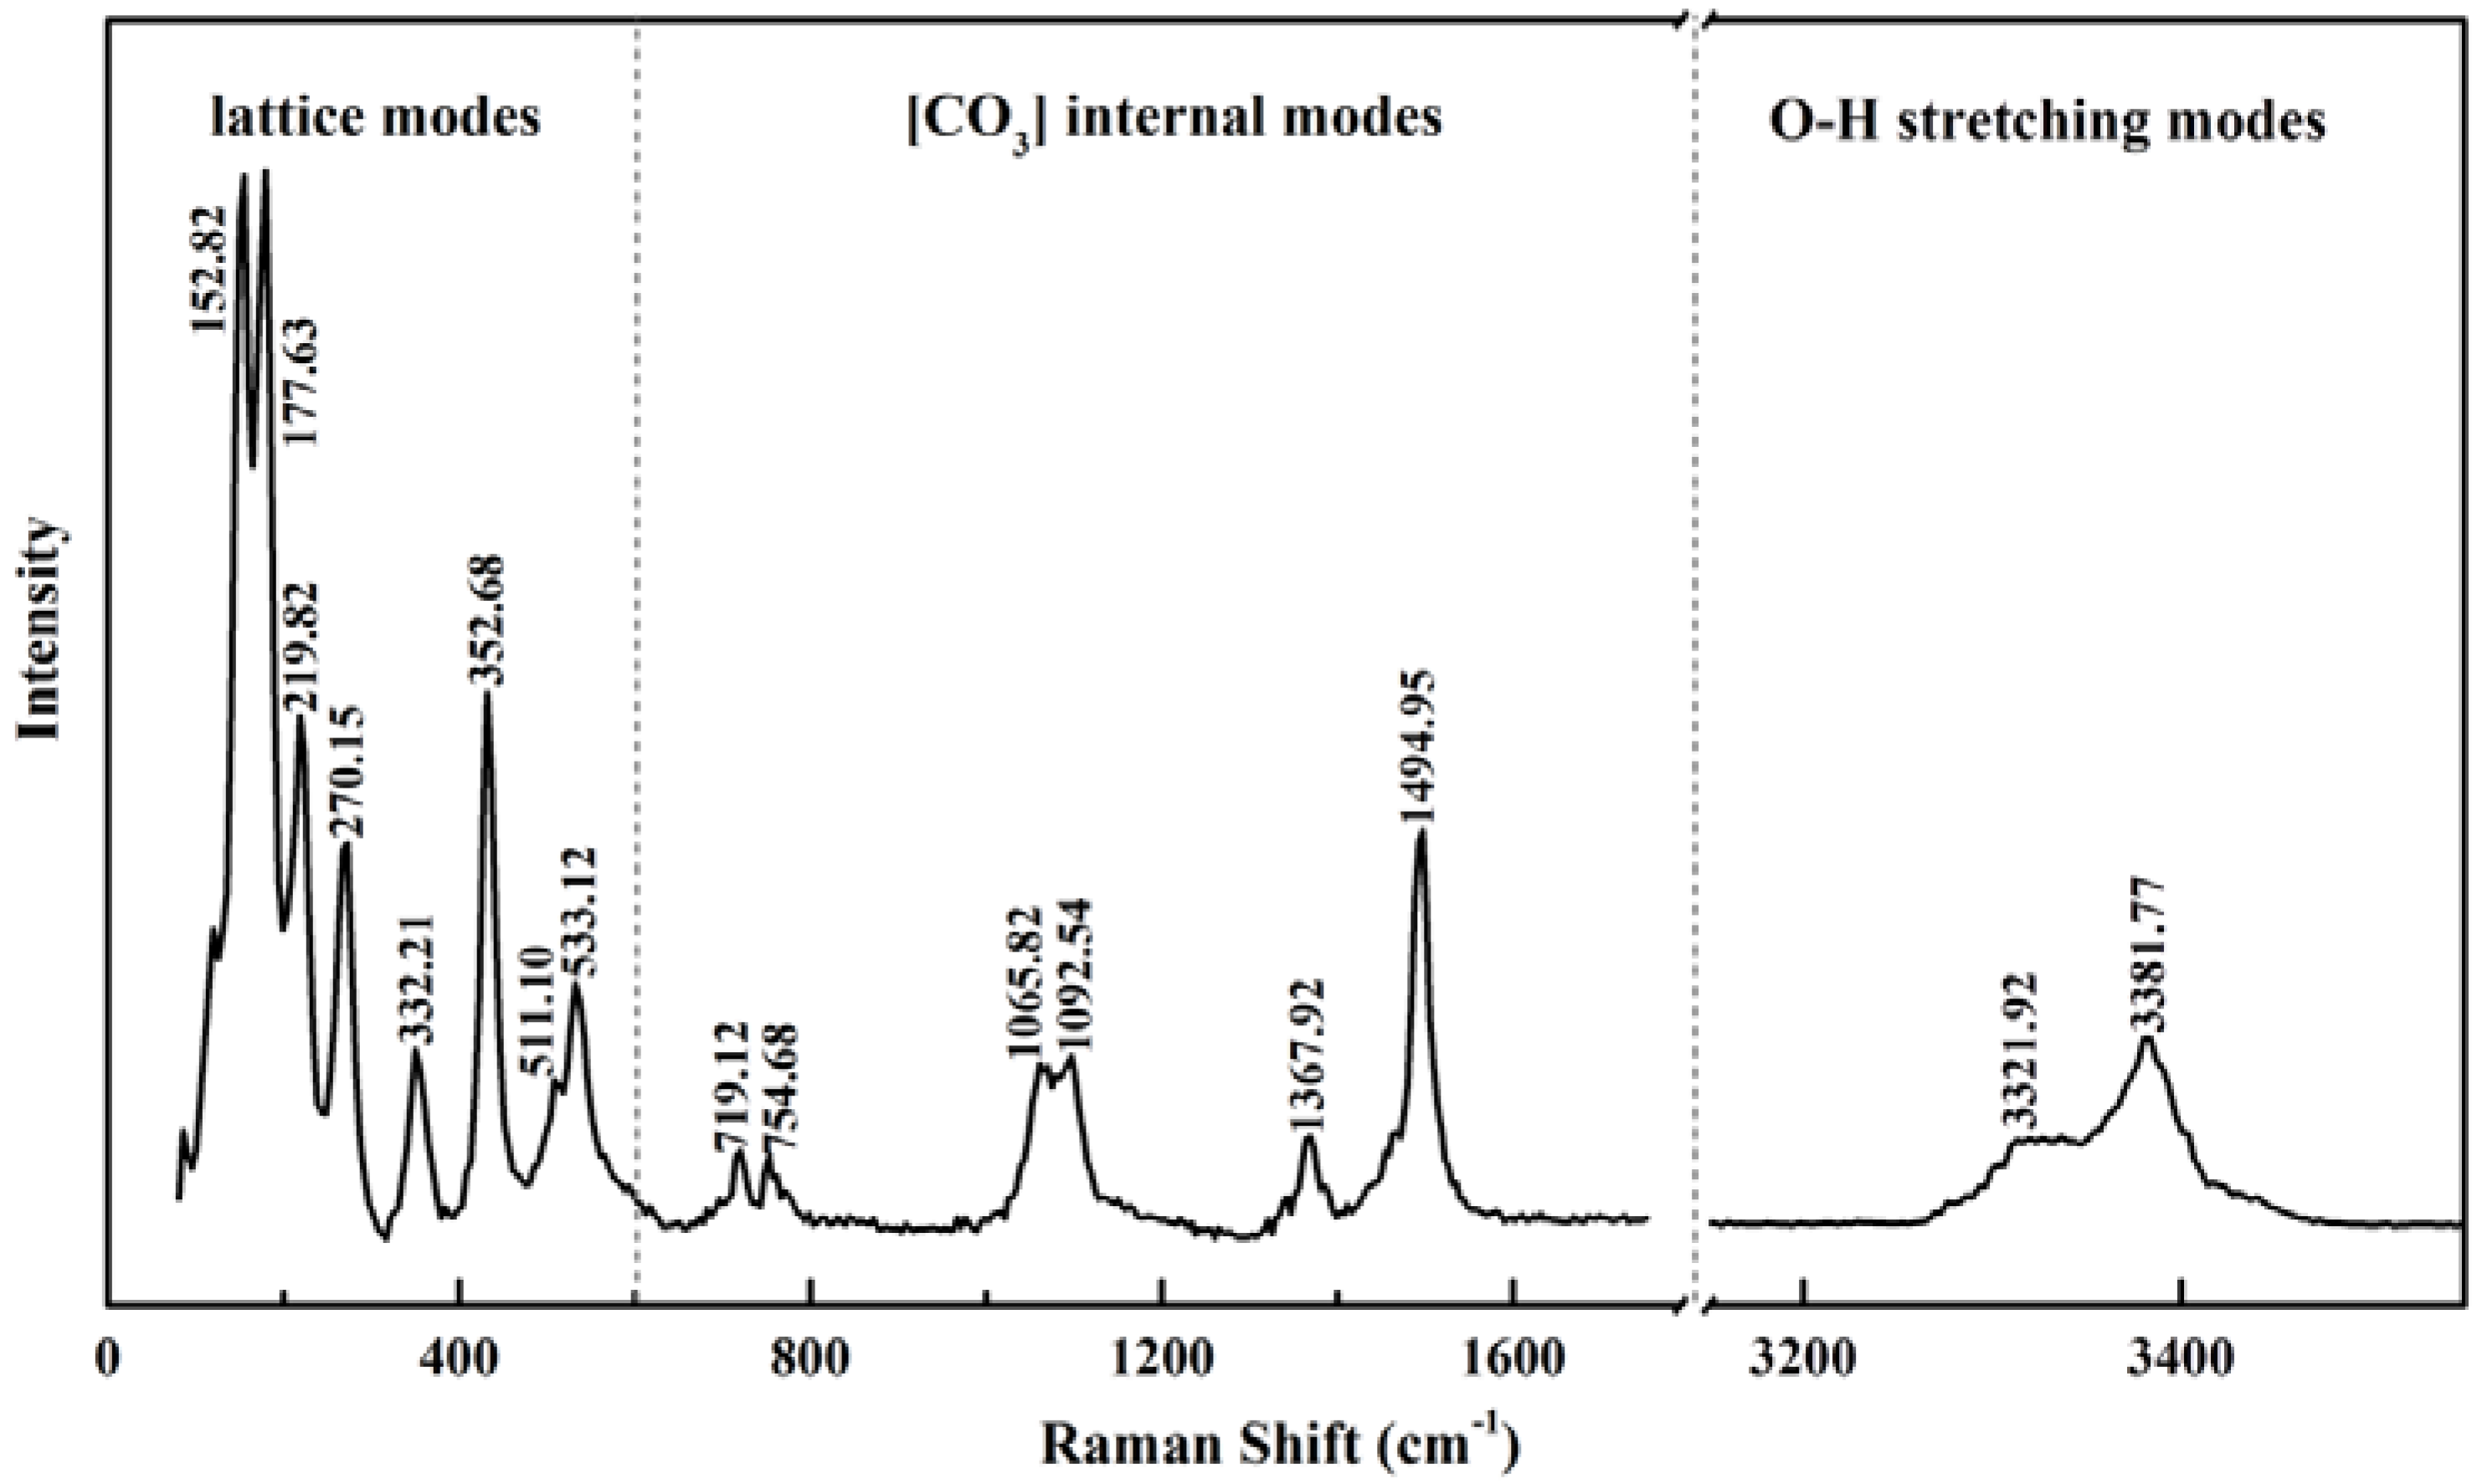
3.1. Vibrational Characteristics of Malachite at Atmospheric Pressure and Room Temperature

A representative Raman spectrum of malachite at atmospheric pressure and room temperature (25 °C) is presented in Figure 1. The spectrum is divided into three sections depending on the type of vibration. In the spectral region of 100–600 cm−1, there is a set of sharp modes, with most intensity at 152.82, 177.63, 219.82, 270.15, 332.21, 352.68, 511.10, and 533.12 cm−1. These bands are predicted to be produced by external vibrations between Cu2+ and the connected [CO3]2−/[OH] units (essentially at ~300–600 cm−1) and the librational bands of the [CO3]2− units (below ~300 cm−1) [15]. Raman modes occurring in the frequency range of 700–1600 cm−1 are due to the [CO3]2 internal modes. The two bands, 1065.82 and 1092.54 cm−1, correspond to the symmetrical stretching vibrations (ν1). The in-plane bending (ν4) splits into two components at 719.12 and 754.68 cm−1 because of the lowered site group symmetry surrounding the [CO3]2 units. Another splitting mode is the asymmetrical stretches (ν3) which show two separated bands at 1367.92 and 1494.95 cm−1. The Raman spectrum for the O–H stretching region is dominated by two broad peaks centered at 3321.92 and 3381.77 cm−1, indicating that the hydrogen sites are not equivalent. These assignments are referred to from previous studies [15,24,25,26,27].
The infrared spectrum of malachite encompasses the [CO3]2− internal modes and O–H stretches (Figure 2). In common with the Raman spectrum, the O–C–O symmetrical vibration is resolved by two peaks, a progressive one at 1097.22 and a weak companion at 1117.96 cm−1; the in-plane mode splits at 711.54 and 747.58 cm−1, but the asymmetrical stretches are characterized with two broad bands over 1250–1600 cm−1 spectral range which is best deconvoluted as five components. Infrared modes at 815.92, 828.10, and 876.28 cm−1 are derived from the out-of-plane bending (ν2, Raman spectra suffer a lack of signal). There is a mixed band at ~1043.4 cm−1 related to the in-plane and out-of-plane Cu–OH bending. The two O–H stretching peaks are observed with the most absorbance at 3334.72 and 3408.95 cm−1. Despite the intensity of hydrogen bonding, it is not expected to affect the vibrations of the [CO3]2− units significantly as the O–C–O bands remain sharp and do not shift much with respect to those in carbonates. Infrared weak modes located in the frequency range of 2850–3000 cm−1 are due to the C–H stretching vibrations from the silicone oil (pressure medium). The above assignments and interpretations are in agreement with those in previous studies [28,29].

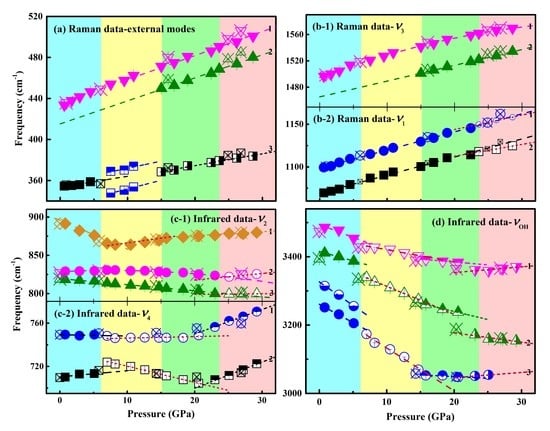
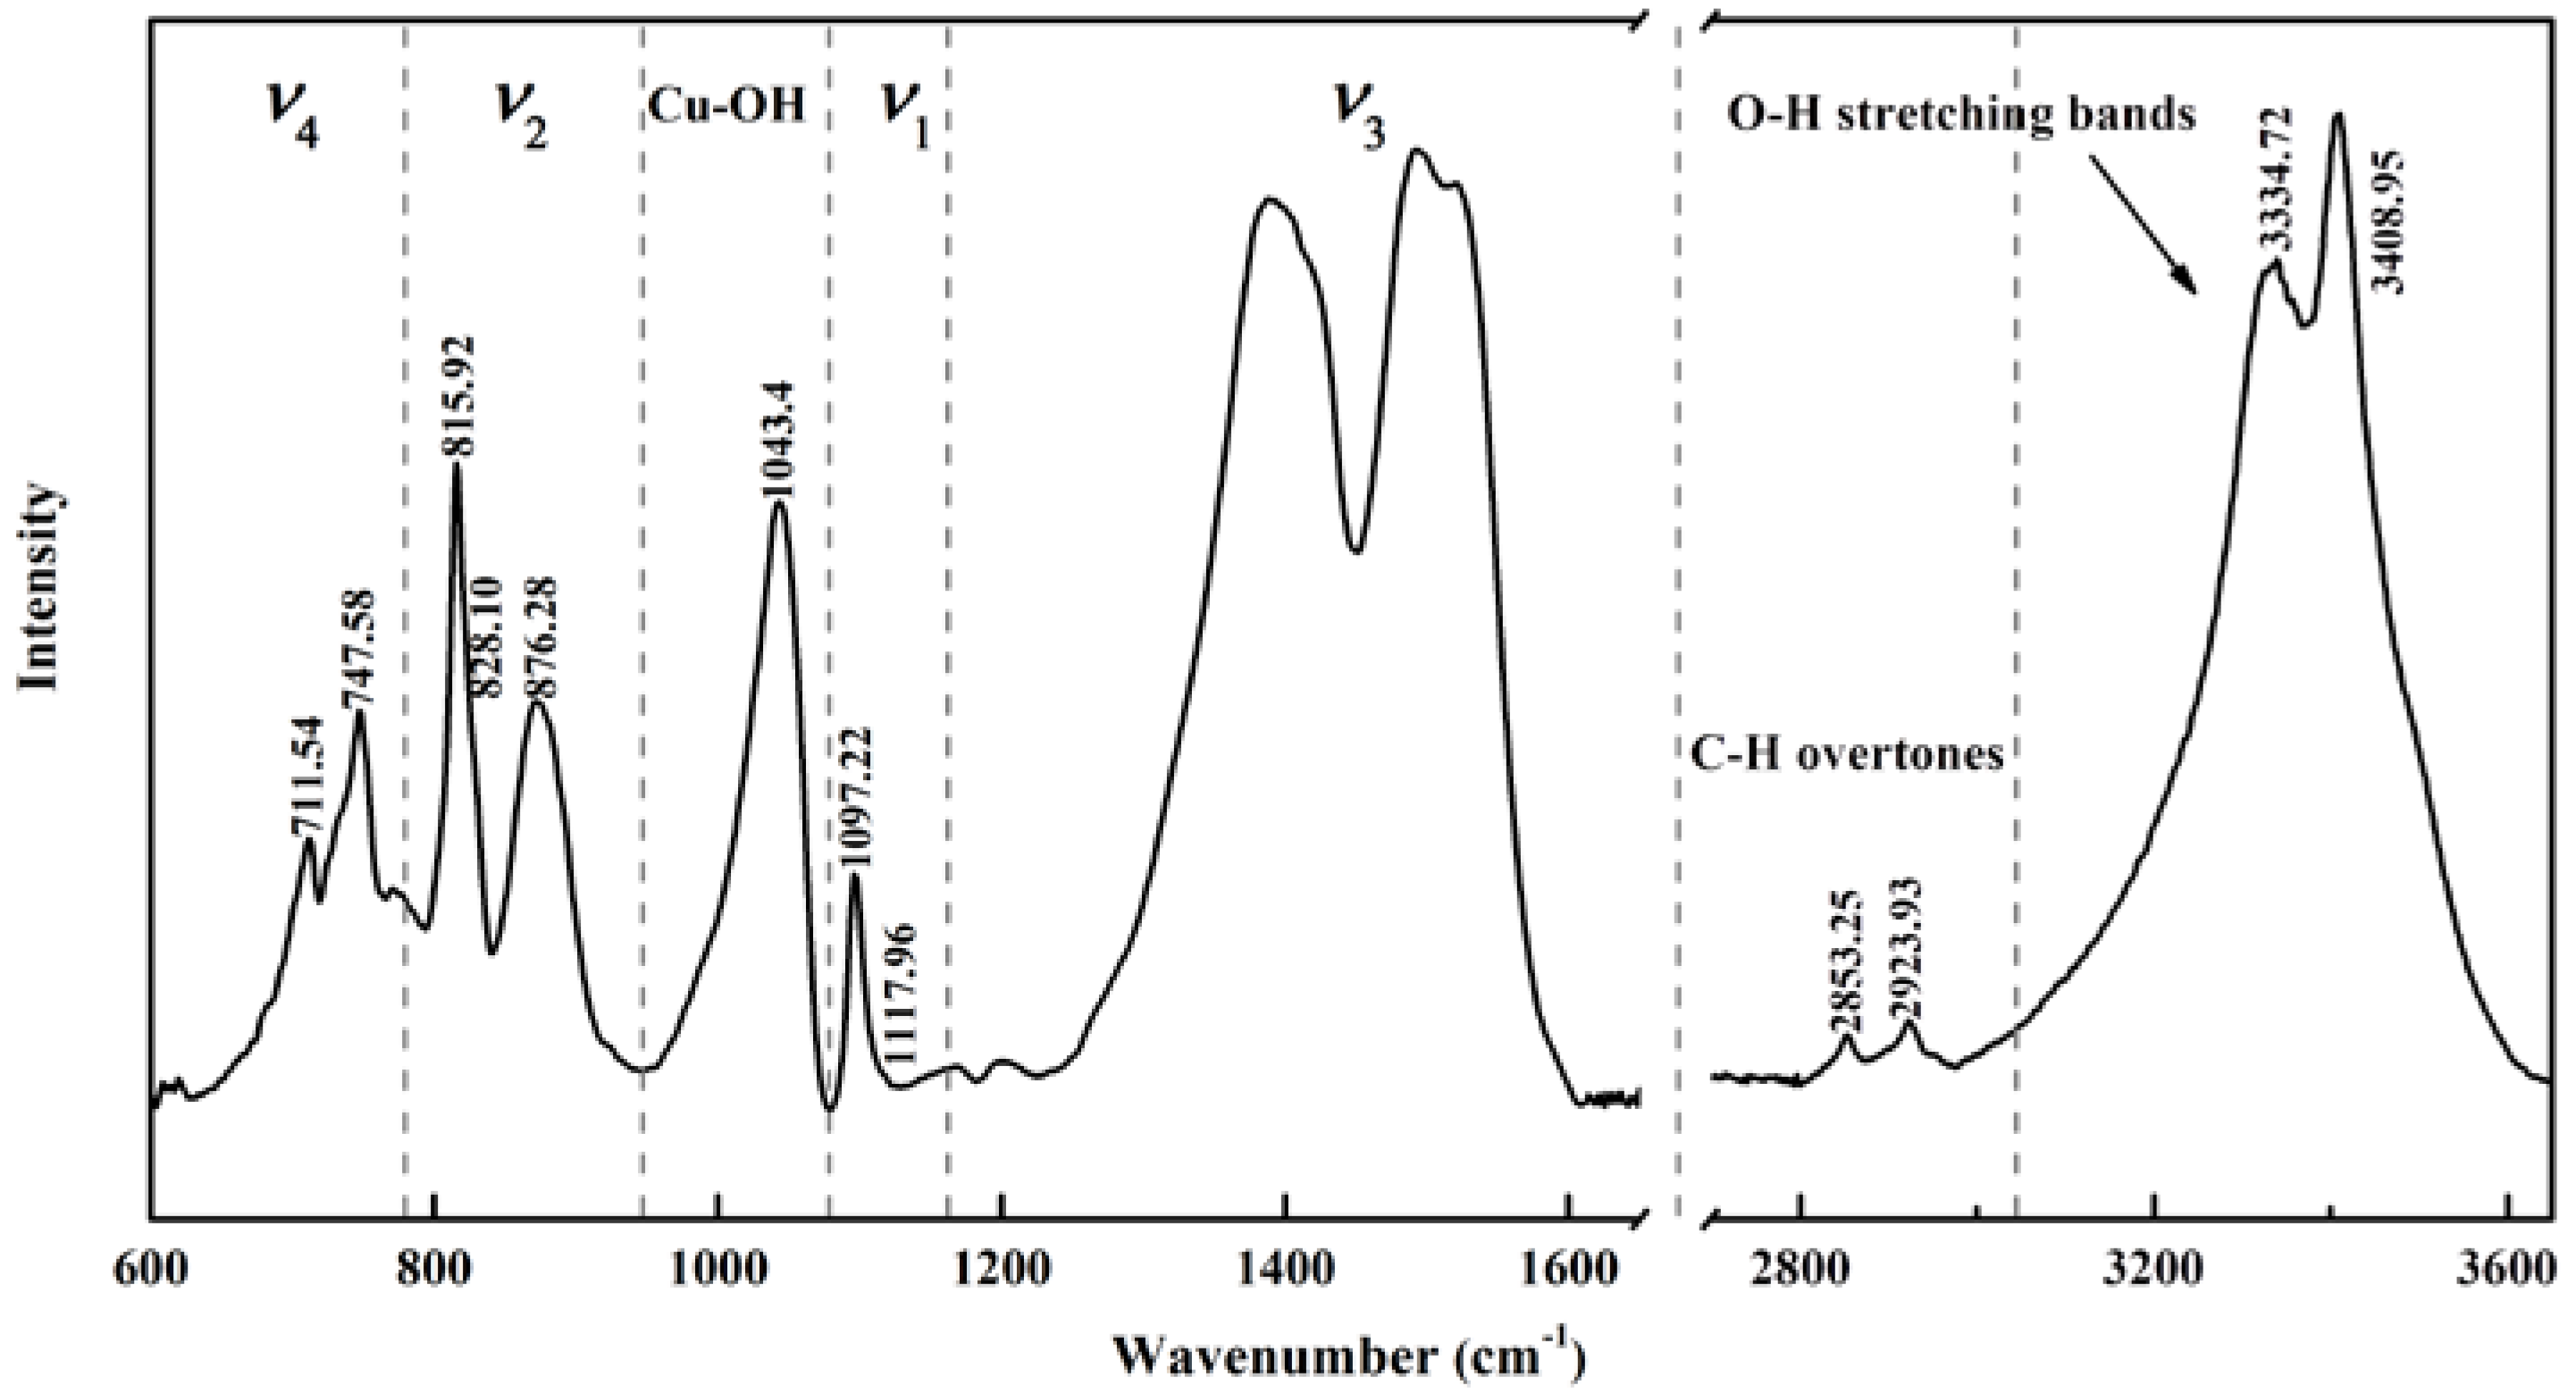
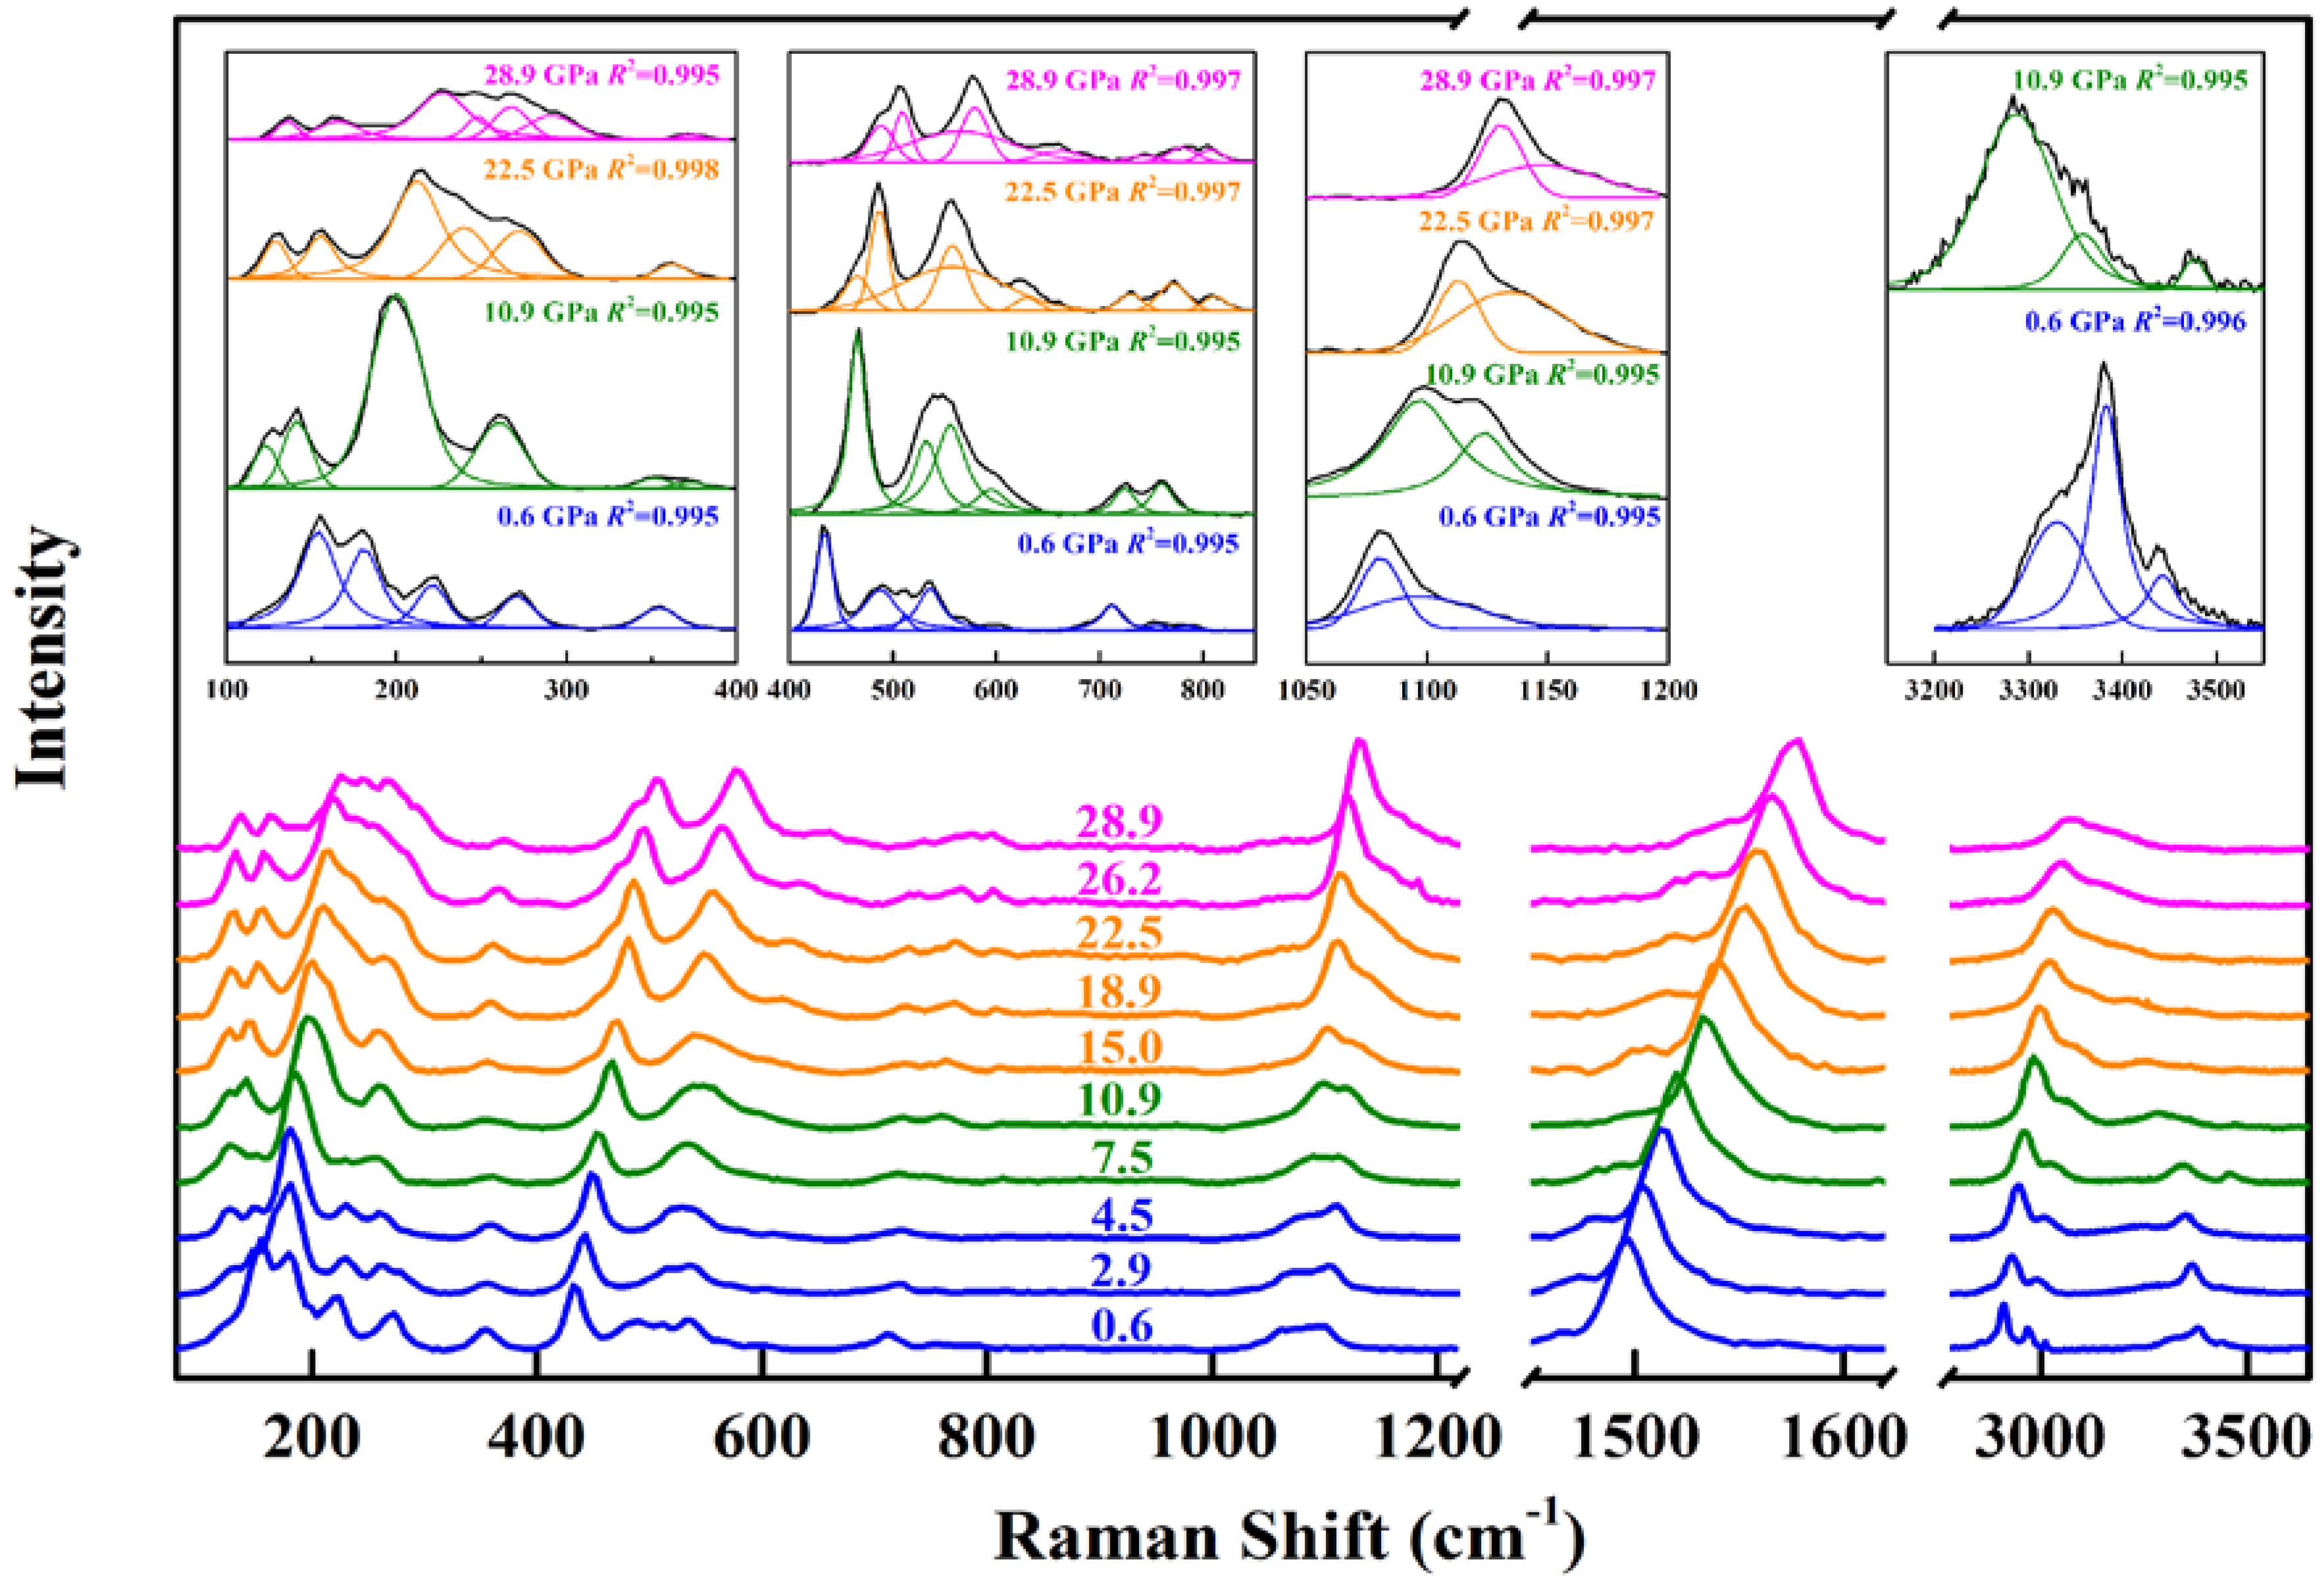
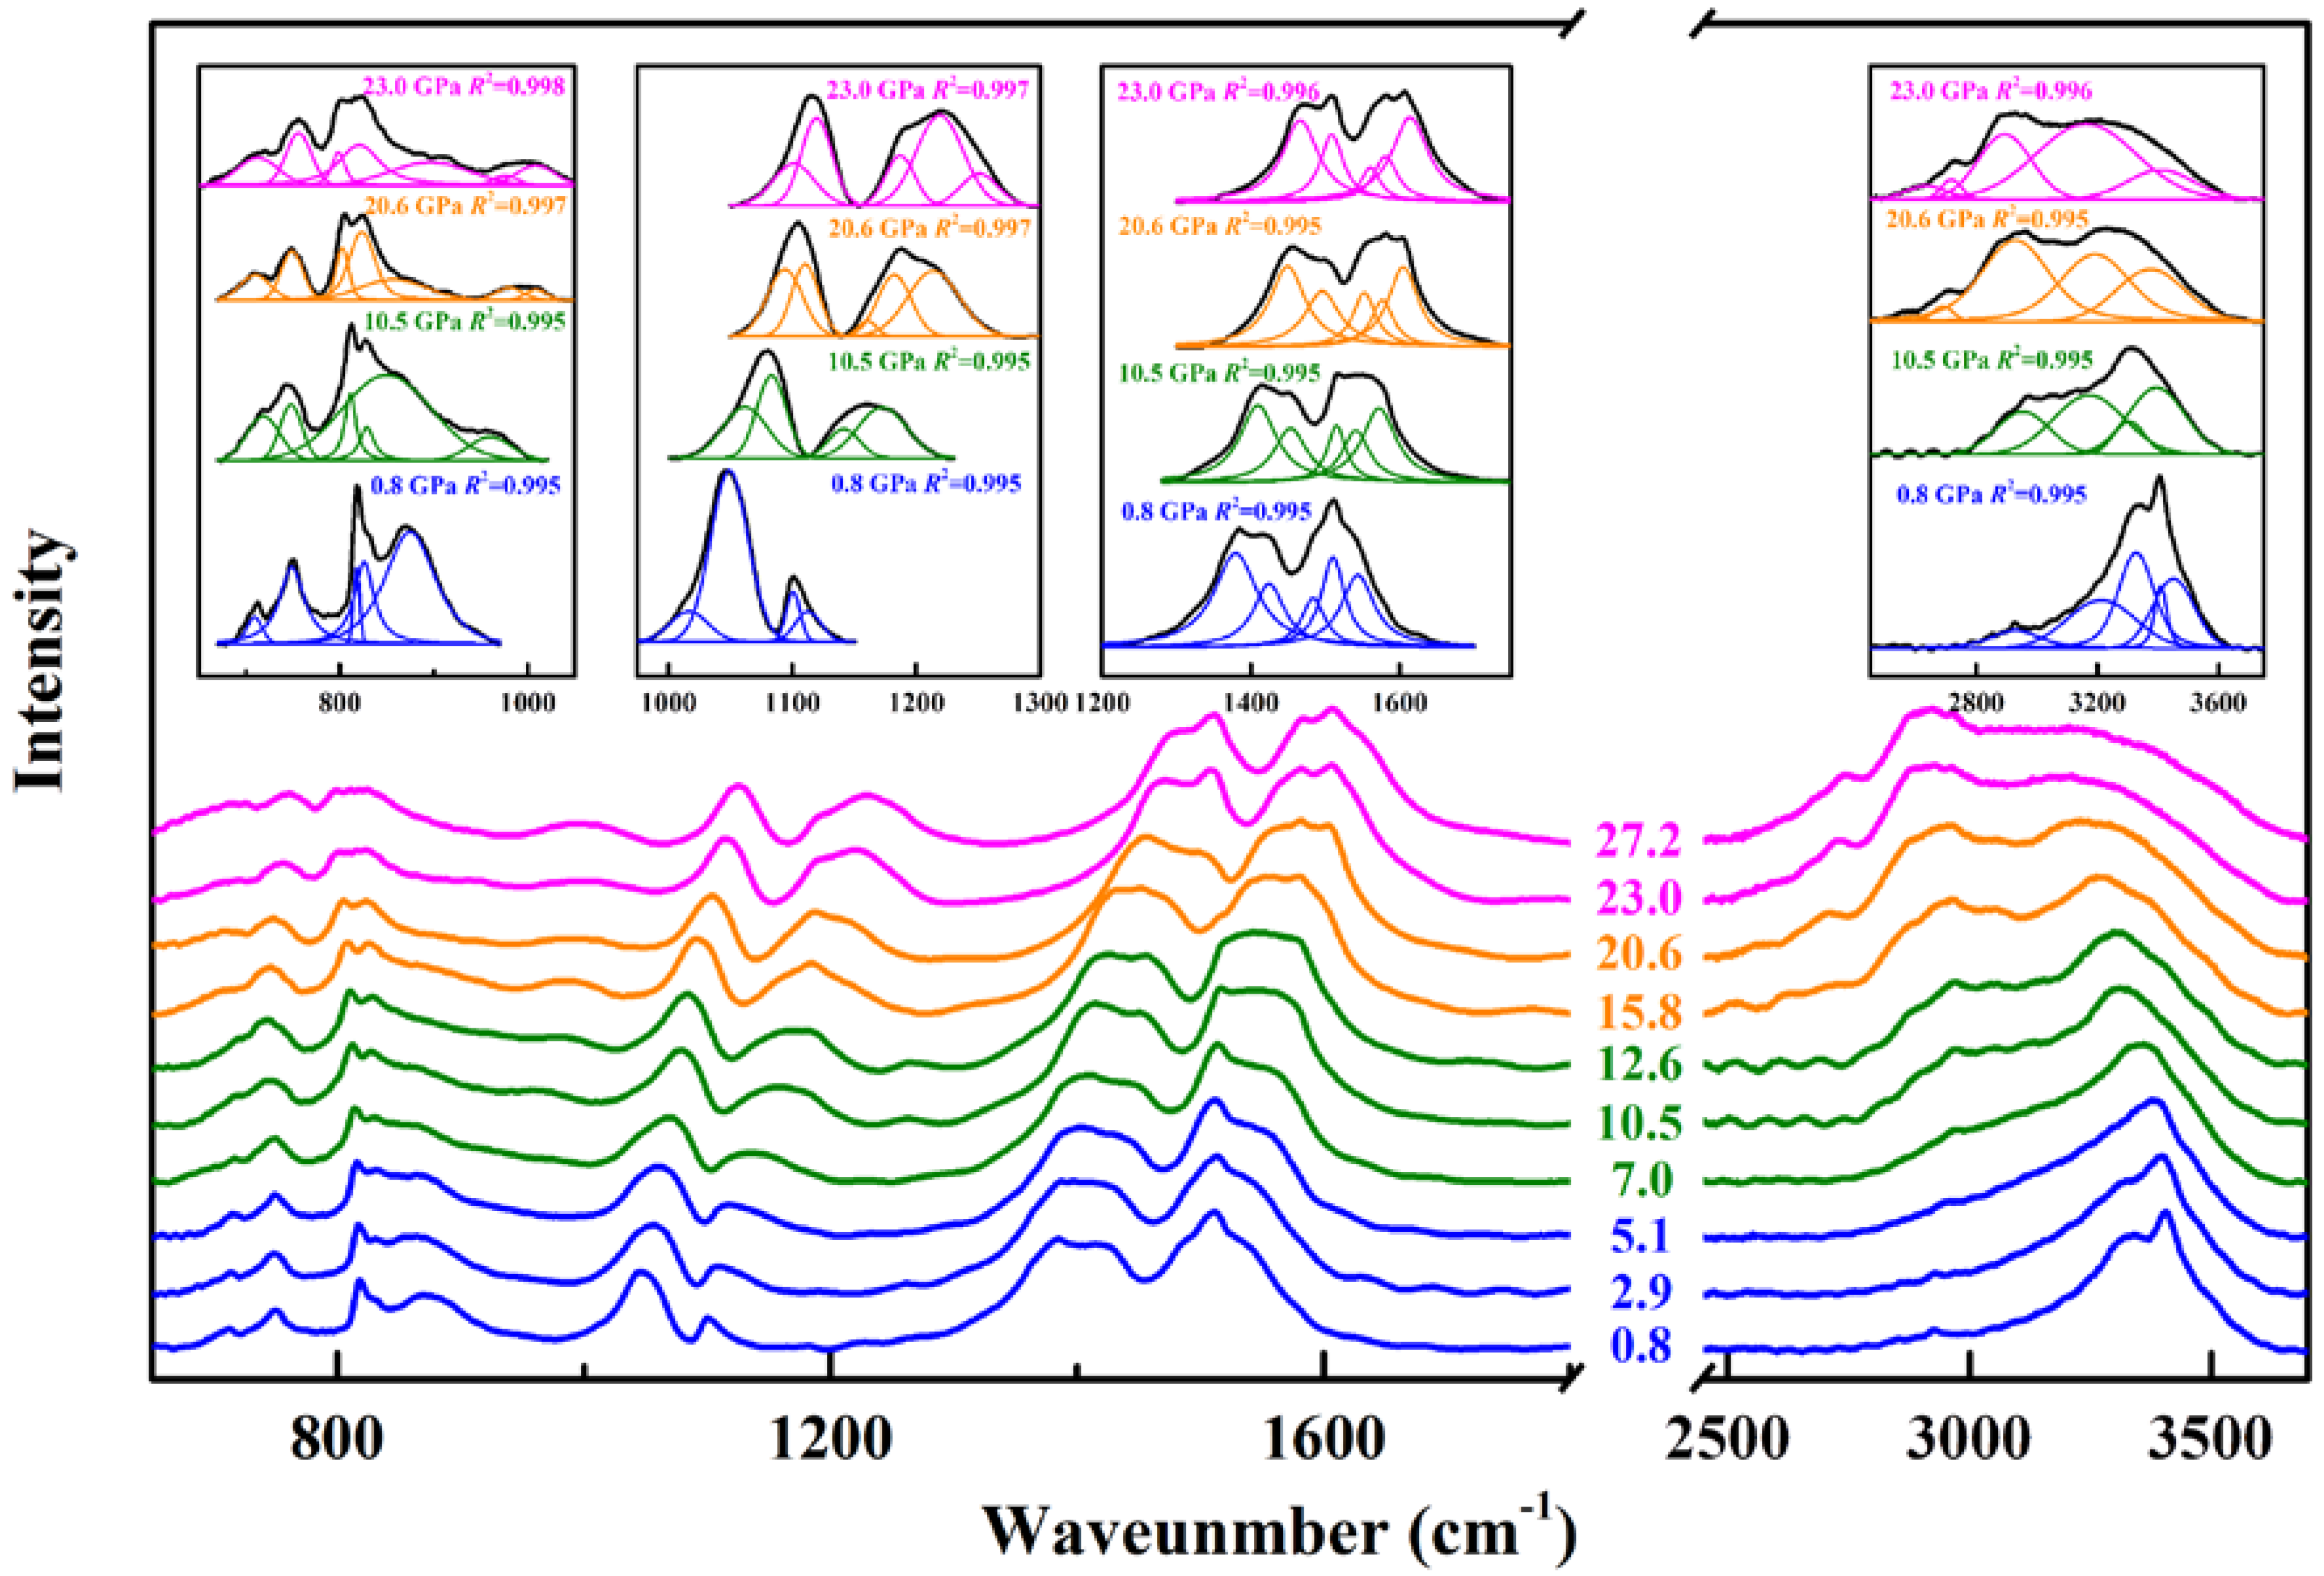
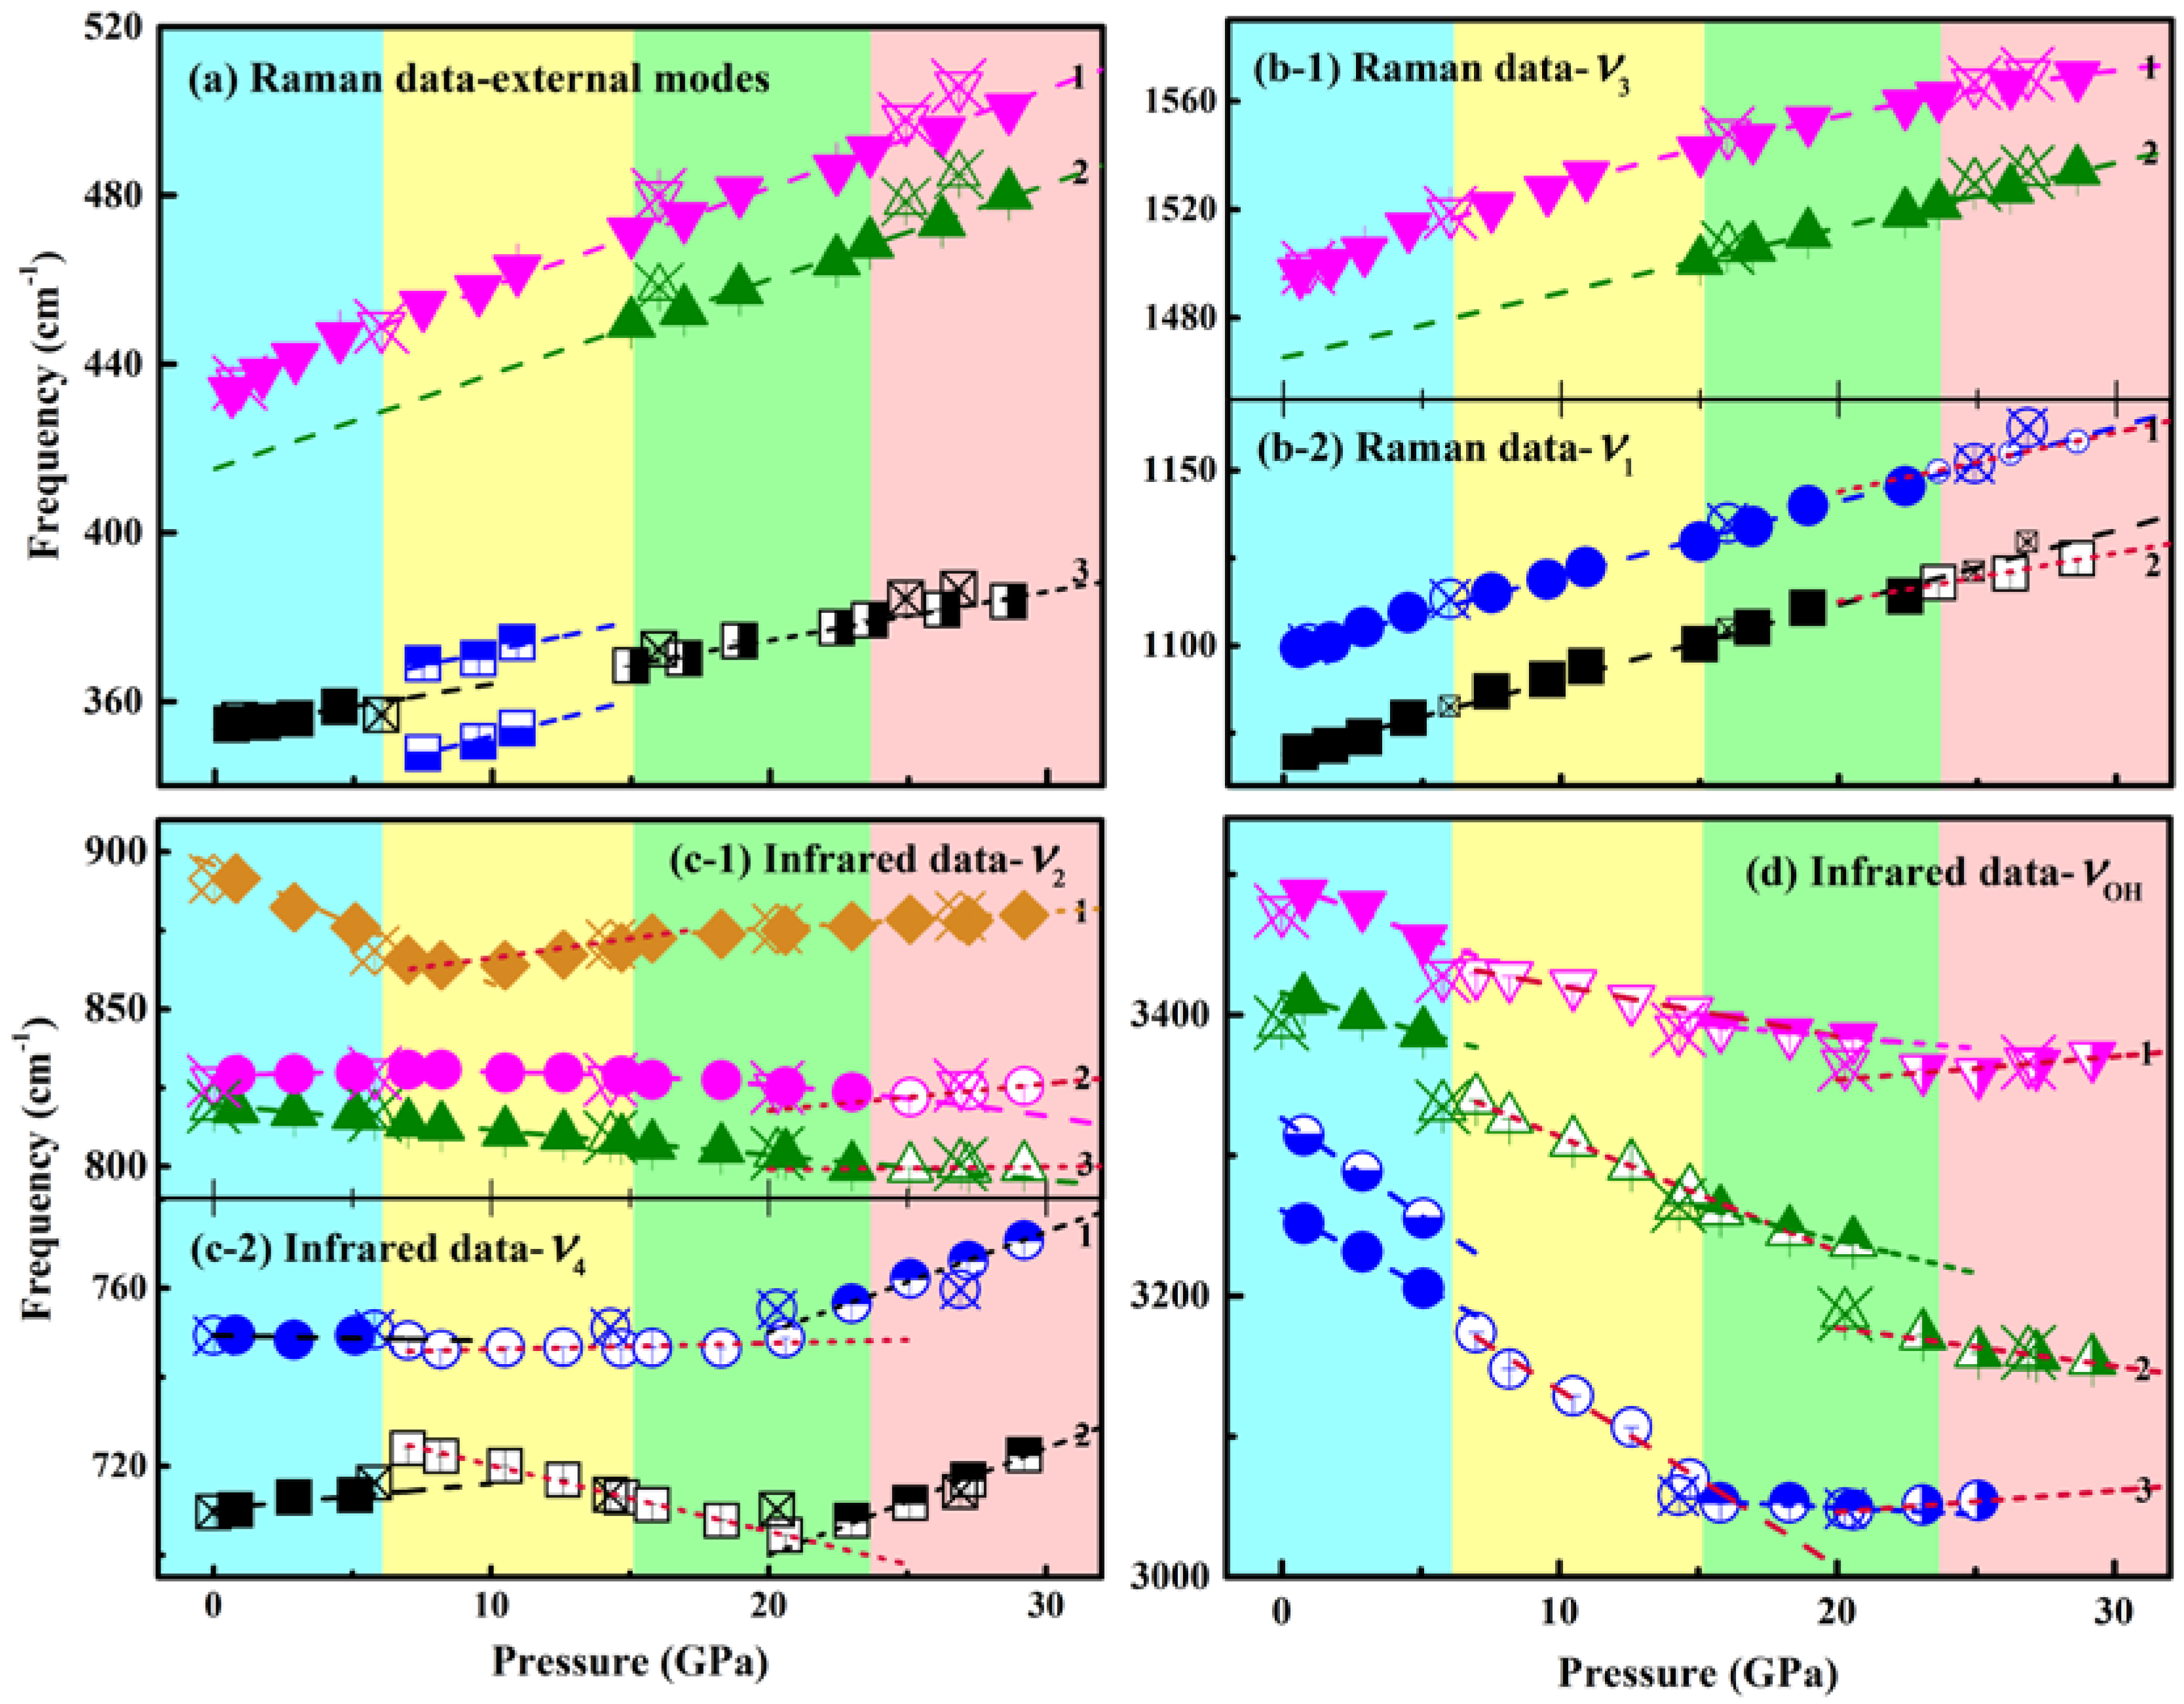
3.2. Vibrational Changes of Malachite under Pressure

Malachite was compressed at room temperature up to 28.9 and 29.2 GPa, respectively, in Raman and infrared spectroscopic measurements, and monitored on both compression and decompression processes. Selected spectra at elevated pressures are displayed in Figure 3 and Figure 4. In addition to the modes observed at atmospheric pressure, two more bands appear in the Raman spectra in the range of 2850–3000 cm−1 which are assignable to the C–H stretches of the pressure medium. In additin, more O–H stretching bands are resolved in the infrared spectra due to the high sensitivity of hydrogen bonding to pressure. Mode frequencies derived from the high-pressure Raman and infrared data are listed in Table 1 and Table 2. We selected Cu–O bands and O–C–O stretches from the Raman data for pressure effect analyses, while the modes representative of O–C–O bending and O–H stretches are measured from the infrared spectra. The change in frequency for the selected modes as a function of pressure are plotted in Figure 5 with the fitting results are listed in Table 3.
Three dramatic changes in the vibrational spectra of malachite are evident as pressure grows to ~7, ~15, and ~23 GPa. First, upon compression to ~7 GPa, the Cu–O modes in the lower-energy range of 300–400 cm−1 redshift whereas the higher-energy (400–600 cm−1) blueshift with a more pronounced pressure dependence (dυi/dP)T (υi is the frequency of a mode under a certain pressure and P is pressure; (dυi/dP)T means the slope of mode shifting with pressure at room temperature). This observation suggests an increasing degree of the deformation of the [CuO6] octahedron. It is noted that the pressure-induced redshift of the lower-energy modes provides a clue to the instability of malachite under higher pressure. Thus, at ~7 GPa, the band initially at 354.56 cm−1 (0.6 GPa) splits into 347.80 and 358.99 cm−1 (Figure 5a). In addition, a sharp increase of ∆ν = 10.5 cm−1 occurs in the frequency of an O–C–O in-plane band 710.17 cm−1 (0.8 GPa) at ~7 GPa coupled with a change in the pressure dependence from 0.56(8) cm−1·GPa−1 to −1.48(4) cm−1·GPa−1. An out-of-bending band 891.52 cm−1 first redshifts at a slope of −3.60(4) cm−1·GPa−1, but across ~7 GPa it turns to blueshift with pressure at 0.92(8) cm−1·GPa−1 (Figure 5c). These anomalies are indicative of the onset of a phase transition. The transition pressure determined here is consistent with the results in previous studies [20,21]. As pressure grows to ~7 GPa, the [CO3]2− stretches shift to higher frequencies at a constant slope of 2.12(3) cm−1·GPa−1 for the symmetrical modes and ~3.5 cm−1·GPa−1 for the asymmetrical (Figure 5b); the pressure slopes of the O–C–O stretches in malachite are comparable to those in carbonates [30,31,32,33]. The rest of the bending bands 829.03, 818.26, and 749.42 cm−1 display negligible pressure dependence. Our observation of the marginal pressure shifts for the O–C–O bending in malachite is a characteristic in carbonates (MCO3, M = Ca, Cd, Mn, Fe, Zn, Mg, etc.) [30,31,32,33,34]. This bending (and the force constant) involves O2− deviation at an oblique angle to the M–O bond, thus their frequencies are anticipated to be insensitive to the changes in the M–O bond strength. We also note that the band 891.52 cm−1 exhibits sizeable broadening with respect to the rest bending under pressure.
More marked mode shifting is observed in the O–H stretching region where all the vibrations redshift (Figure 5d), the pressure dependence varying from −10.72(6) cm−1·GPa−1 to −5.54(1) cm−1·GPa−1. Our results on the O–H stretches shifting in malachite coincide with those in other hydrogen-bearing minerals [35]. At ~7 GPa, discontinuities are monitored in the pressure-frequency slopes; the pressure dependence of the band 3485.88 cm−1 (0.8 GPa) decreases from −7.52(9) cm−1·GPa−1 to −3.51(3) cm−1·GPa−1, whereas the other two 3410.79 and 3251.55 cm−1 increase from −5.54(1) cm−1·GPa−1 to −8.13(2) cm−1·GPa−1 and −10.72(6) cm−1·GPa−1 to −12.58(4) cm−1·GPa−1, respectively. Simultaneously, a steep decrease of ∆ν = ~48 cm−1 occurs in the frequency of the band 3410.79 cm−1 over the 5.1–7 GPa pressure span and a new band around 950 cm−1 develops which is assignable to the O–H out-of-bending [25,36]. In this process significant broadness is observed for all O–H stretches.
At ~15 GPa, we notice a merging of double peaks at ~370 cm−1, a mode split at ~1000 cm−1, and dramatic changes in the mode intensities of all types. These changes are along with the development of bands at ~250, ~450, ~800, ~1150, ~1480, and ~2800 cm−1. Further compression enhances the bands ~450 and ~1150 cm−1, which is suggestive of an increase in the additional Cu–O interactions. The systematical redshifting of the lower-energy Cu–O modes slow down and display zero pressure slope above ~15 GPa, yet the higher-energy modes blueshift as usual (Figure 5a). The two bands correspond to the [CO3]2− internal modes, one at ~800 cm−1 increases in amplitude and the other at ~1480 cm−1 remains at a similar amplitude under pressure. The most striking change is the mode hardening of the O–H stretches; for example, the band 3251.55 cm−1 redshifts sharply from −12.58(4) cm−1·GPa−1 to −1.03(2) cm−1·GPa−1 (Figure 5d). The comparatively weaker pressure slope is also observed in the shift of the band appearing at ~950 cm−1 at ~7 GPa, which confirms that this band contains a contribution from the O–H vibrations. As pressure increases, the two higher-energy bands 3485.88 and 3410.79 cm−1 give rise to a lower-energy band 3251.55 cm−1, the latter becoming prominent above ~15 GPa. A new band emerges at ~2800 cm−1.
As pressure further increases to ~23 GPa, the O–C–O stretching modes go on blueshift but with smaller pressure slopes (Figure 5b). The slope reduces from 2.12(3) cm−1·GPa−1 to 1.69(6) cm−1·GPa−1 and 1.38(8) cm−1·GPa−1 for the two symmetrical modes, respectively, and from ~2.2 cm−1·GPa−1 to ~1.6 cm−1·GPa−1 for the asymmetrical band 1484.29 cm−1 (0.8 GPa); the other asymmetrical band emerging at ~15 GPa at ~1480 cm−1 preserves a constant slope of 2.39(3) cm−1·GPa−1. The out-of-bending bands maintain a negligible pressure dependence as before, but the in-plane bands speed up dramatically. Specifically, the band 749.42 cm−1 accelerates from 0.13(2) cm−1·GPa−1 to 2.25(7) cm−1·GPa−1 and the other 749.42 cm−1 turns around from −1.48(4) cm−1·GPa−1 to 2.40(5) cm−1·GPa−1 (Figure 5c). In addition, a further decrease of ∆ν = ~66 cm−1 is observed in the frequency of the O–H band 3410.79 cm−1 over the 20.6–23 GPa span, followed by a rapid reduction in the amplitude (Figure 5d). The other two bands 3485.88 and 3251.55 cm−1, contrary to the redshift nature, begin blueshift trends at ~23 GPa. In this process, no appreciable broadness of the O–H modes is observed.
The vibrational data upon decompression show negligible hysteresis. As seen in Figure 5a,b, the external Cu–O modes and O–C–O stretching modes, shifting to higher frequencies under pressure, are located at a little higher frequencies under similar pressures upon decompression. The redshift O–H stretching modes shift back to higher frequencies during decompression but with lower frequencies under comparable pressures (Figure 5d). When pressure is released completely, the spectra characteristics of the pure malachite are recovered. This indicates that the malachite structure experienced elastic deformations under compression. During the following decompression process, the modes show a slightly delayed response to pressure, which should be accounted for by the hysteresis. The hysteresis is due likely to the polycrystalline sample used here that develops microscopic or local stress at grain boundaries, leading to a slightly delayed relaxation.

4. Discussion

4.1. Structural Transitions of Malachite under Pressure

We observed three phase transitions of malachite at pressures of ~7, ~15, and ~23 GPa, respectively. A progressive degree of [CuO6] deformation can be identified by the various pressure dependencies of the Cu–O modes. In light of the transition of malachite described in previous studies [20,21], the present results provide vibrational evidence for the notion that the pressurized deformation of the [CuO6] octahedron is responsible for the rotation of the cell unit, resulting in a different orientation of the crystal cell in the higher-pressure phase.
A further increase in pressure (above ~15 GPa) leads to the appearance of more modes, which implies that at least the number of formula units in the unit cell changed. Considering the vibrations of [CO3]2− in carbonates under high pressure conditions [30,31,32,33,34], we attribute the development of the [CO3]2− internal modes to a decreased symmetry of the local geometry. It is also noted that upon compression from ~7 to ~23 GPa, the separation between the two O–C–O in-plane bands increases from ~25 to ~50 cm−1. Likewise, the pressure-enhanced splitting of the asymmetrical stretches are also notable. The increased splitting originates from an increased asymmetry of the local geometry of [CO3]2− or more likely, the distortion of [CO3]2− itself [37]. One can expect a structural rearrangement gradually occurring in this pressure range, involving a tilt effect of the [CO3]2− units or a conversion from a [CO3]2− triangle to [CO4] tetrahedron. We suggest that a possible trigger for this change should be that the approach of the triangle O2− towards the central C4+ under pressure gets to its limit and the [CO3]2− approaches as non-planar. As a consequence, the overall compression mechanism of the structure changes. Above ~23 GPa, the two principle O–C–O stretching bands slow down in their blueshift process, resulting in lower frequencies of the stretching modes under higher pressures in comparison with the values extrapolated from the lower-pressure data. Since the frequency of the symmetric stretch is predominantly determined by the O–C–O bond stretching force constant, it is a very sensitive probe of the C–O bond strength [37]. The lowered frequencies of the stretches under higher pressures suggest that the C–O bonds become a little bit weaker than those at lower pressures. Such a decreased bond strength may stem from a lengthening of the C–O bond, a shift in the effective charges of C4+/O2− and/or a strengthening of the Cu–O bonds [34]. Here we propose that the combination effect of an elongated C–O bond and a reinforced Cu–O bond is responsible for the weakening of the C–O bonds. The idea that the C–O bond grows longer under pressure has been reported in carbonates magnesite MgCO3 at 30 GPa, which is probably induced by a progressive rotation of the [MgO6] octahedron [38,39]. Likewise, in malachite the lengthening of the C–O bond may likely be the result of a continuous rotation of the [CuO6] octahedron (as discussed above). Giving rise to the three phase transitions, a growth of pressure has a negligible effect on the intensity of most bands. This implies that the main character of the C–O bonds remains unchanged. The rigidness of the [CO3]2− units to pressure is very common in [CO3]2−-bearing minerals. For comparison, a series of [SiO4]-phases tend to amorphize under comparable pressure-temperature conditions [40,41]. Thus, the stability of [CO3]2− is superior from a crystal chemical standpoint. In addition, the observed phase transitions seem to not involve the broken Cu–O, C–O, or H–O bonds as the transitions are readily reversible.
The chemistry of hydrogen bonding in malachite during compression is complex: it shows a mode disappearance (3232.14 cm−1, 0.8 GPa) and mode emerging (~950 cm−1) at ~7 GPa, coupled with a decrease in the frequency of ∆ν = ~48 cm−1 (3410.79 cm−1, 0.8 GPa) over 5.1–7 GPa pressure span. At ~15 GPa it exhibits a systematical mode hardening, and over the 20.6–23 GPa interval, there is a further decrease in the frequency of ∆ν = ~66 cm−1 (3410.79 cm−1). These changes hint at the presence of O–H bonds in many types, with the evolution of each type of bond showing its own trend. The phenomenon that the O–H modes generally shift to lower frequencies reflects an enhancement in the strength of the hydrogen bonding involving the shortening of the O–H bond. The observation of a pressurized significant broadness in the band width indicates that the O–H∙∙∙O bonds may become more asymmetric [42] or there may be unresolved band splitting. According to the correlation function between O–H stretching frequencies and O···O bond length [43], we calculated the distance of O···O as 2.72, 2.80, and 2.87 Å, respectively, for 3251.55, 3410.79, and 3485.88 cm−1 bands at 0.8 GPa. When pressure increased to 15.8 GPa, the O···O length decreased successively as 2.66, 2.73, and 2.79 Å; but above 15.8 GPa, the O···O length corresponding to the 3251.55 cm−1 band remains almost unchanged, whereas the other two shorten to 2.69 and 2.77 Å at 23.0 GPa, respectively. Above ~23 GPa, a blueshift upon pressure is noted which, to the best of our knowledge, is not common in the case of O–H stretches. It has been suggested that due to H–H repulsion and O–H bond elongation, the O–H stretches will blueshift with pressure increasing [44,45,46,47]. In consideration of the sites and coordination mode of hydrogen in malachite, we propose that the blueshift of the O–H stretches may possibly result from some re-organization of the hydrogen due to the compression of the coordinated [CuO6] octahedron and a substantially increasing repulsion effect from Cu2+. Further, the O···O distance connected to the hydrogen shows no further shortening in the pressure range of 23.0–29.2 GPa. As the pressure dependence of the O–H stretches changes at ~23 GPa, matching closely the pressure at which the O–C–O bending starts to soften, we speculate that the evolution of the [CO3]2− units which connect with [CuO6], exerts a significant impact on the anisotropic compression of the [CuO6] octahedron, and further on the local geometry of hydrogen. In the entire compression process, the main change in the O–H spectra is the evolution of the complex contour, involving two mixed bands dominantly at 3410.79 and 3485.88 cm−1 in a somewhat blurred contour at 0.8 GPa, which varies to a more blurred contour involving three components over a frequency span of 3000–3400 cm−1 prominently at 3391.76 cm−1 above ~15 GPa, grows in amplitude at 3051.26 cm−1 above ~23 GPa, and preserves this shape until ~29 GPa. This evolution confirms a gradual reorientation or reordering of hydrogen under pressure. In spite of a little blueshift of several modes (including Cu–O, O–C–O, and O–H), no considerable redshift was noted for the majority of the vibrations. This eliminates the possibility of an overhydrated state of malachite at the present experiment’s conditions, but malachite has an easily pressurized deformable structure with rather large interspaces between the adjacent [CuO6] layers, which is anticipated to be capable of accommodating additional amounts of water. This hypothesis calls for further verification by high-pressure and temperature experiments using a water medium.

4.2. Expectations on Hydroxycarbonates in the Earth’s Mantle

At the molecular level, the site and stability of hydrogen in hydroxycarbonates are dependent on bond strength and local geometry; both are constrained directly by the coordinated polyhedron. In addition, the existence of the [CO3]2− units has an indirect, but important influence on the geometry of hydrogen. For example, in malachite the mode softening of O–C–O bending at ~23 GPa is related to the weakening of the strength of the hydrogen bonding. In fact, as the hydrogen bond acceptor, the strength of the C–O bond is also greatly modified [15,16]. Their synergistic relations have already been documented by the experimental observation that the water and CO2 will be released simultaneously above 380 °C at atmospheric pressure [18]. We speculate that some interrelations in the stability of water and carbon within hydroxycarbonate exist at high-pressure and temperature conditions. Our attempts to the high-pressure vibrations of malachite emphasize that the stability of the hydrogen bonding can be extended extensively by pressures up to ~23 GPa. In this regard, we may expect an increased capacity in the water storage of malachite, associated with carbon storage, approaching, at most, the bottom of the Earth’s transition zone. The stability of hydrogen in malachite may hold true for other hydroxycarbonates. In nature, more and more hydrogen-bearing and hydrous minerals (e.g., a phase Egg [48]; a water-bearing ringwoodite [13]; or ferropericlase [49]) have been discovered as inclusions in diamonds originated from the transition zone and the topmost of the lower mantle. These findings strongly support the view that not only is the mantle at least locally hydrated, but also the water recycling in the hydrous mantle associates closely with the carbon circulation.
The properties of water under mantle conditions have been the subject of petrologic and geophysical interest for decades. The water storage capacity of malachite, relative to dense hydrous magnesium silicates, following a relatively cold temperature path, is expected to be at analogous levels but with superior stabilities. The present spectroscopic data provide a manifestation and pressure range of the stability of hydrogen in malachite, which could have relevance for the high-pressure behaviors of other hydroxycarbonates (M–CO2–H2O systems, M = Cu, Zn, Mg, etc.). The stability field of hydroxycarbonate should be further characterized by careful inspection using X-ray diffraction and vibrational measurements at simultaneously high-pressure and temperature conditions.

5. Conclusions

The present study explored the high-pressure vibrations of a hydroxycarbonate, malachite Cu2(CO3)(OH)2, by in-situ Raman and infrared spectroscopic measurements at room temperature up to ~29 GPa. Substantial changes in the mode intensities and discontinuities disclose three phase transitions at pressures of ~7, ~15, and ~23 GPa. Upon compression, the Cu–O bands shift variously with pressure, suggesting an increasing degree of deformation of the [CuO6] octahedron. The O–H stretching modes redshift with considerable pressure slopes up to ~15 GPa, above which a mode hardening occurs which reflects some reorientation or reordering of the hydrogen bonding or a transition of the hydrogen sites. These changes indicate the occurrence of a new phase which is characterized with additional modes pointing to a different number of formula units in the unit cell. At further increments in pressure above ~23 GPa, the O–C–O in-plane modes soften and the O–H stretches start to shift to higher frequencies. These anomalies imply a weakening of the hydrogen bonding due at least partly to the evolution of the [CO3]2− units. Our results thus suggest an increasing capacity of water storage of malachite up to ~23 GPa. The evolution of hydrogen bonding in malachite varying with pressure may hold true for other analogous hydroxyl minerals. Moreover, we highlight that in hydroxycarbonates the stability of hydrogen seems to be associated with that of carbon.

Author Contributions

Conceptualization, methodology, formal analysis, resources, data curation, project administration, funding acquisition, supervision, writing—original draft: J.G.; investigation, software, validation, visualization, writing—review and editing: J.G. and X.Y. All authors have read and agreed to the published version of the manuscript.

Funding

This work was supported by the China Postdoctoral Science Foundation (Grant No. 2018M640179 and 2019T120132) and a grant fund for research from the State Key Laboratory of Lithospheric Evolution, Institute of Geology and Geophysics, Chinese Academy of Sciences, China.

Acknowledgments

We gratefully acknowledge the assistance from Xiaoming Xu for the sample composition analyses.

Conflicts of Interest

The authors declare no conflicts of interest.

References

  1. Ardia, P.; Hirschmann, M.M.; Withers, A.C.; Tenner, T.J. H2O storage capacity of olivine at 5–8 GPa and consequences for dehydration partial melting of the upper mantle. Earth Planet Sci. Lett. 2012, 345, 104–116. [Google Scholar] [CrossRef]
  2. Revenaugh, J.; Sipkin, S.A. Seismic evidence for silicate melt atop the 410-km mantle discontinuity. Nature 1994, 369, 474–476. [Google Scholar] [CrossRef]
  3. Lawrence, J.F.; Wysession, M.E. Seismic evidence for subduction-transported water in the lower mantle. Earth’s Deep Water Cycle. AGU 2013, 168, 251–261. [Google Scholar]
  4. Frost, D.J. The stability of dense hydrous magnesium silicates in Earth’s transition zone and lower mantle. Mantle Petrology: Field observations and high pressure experimentation: A tribute to francis R.(Joe) Boyd. Geochem. Soc. 1999, 6, 283–296. [Google Scholar]
  5. Nishi, M.; Irifune, T.; Tsuchiya, J.; Tange, Y.; Nishihara, Y.; Fujino, K.; Higo, Y. Stability of hydrous silicate at high pressures and water transport to the deep lower mantle. Nat. Geosci. 2014, 7, 224–227. [Google Scholar] [CrossRef]
  6. Ohtani, E.; Livasov, A.K.; Haosoya, T.; Kubo, T.; Kondo, T. Water transport into the deep mantle and formation of a hydrous transition zone. Phys. Earth Planet. Int. 2004, 143, 255–269. [Google Scholar] [CrossRef]
  7. Ringwood, A.E.; Major, A. High-pressure reconnaissance investigations in the system Mg2SiO4–MgO–H2O. Earth Planet. Sci. Lett. 1967, 2, 130–133. [Google Scholar] [CrossRef]
  8. Ghosh, S.; Schmidt, M.W. Melting of phase D in the lower mantle and implications for recycling and storage of H2O in the deep mantle. Geochim. Cosmochim. Acta 2014, 145, 72–88. [Google Scholar] [CrossRef]
  9. Ohtani, E.; Litasov, K.; Suzuki, A.; Kondo, T. Stability field of new hydrous phase, δ-AlOOH, with implications for water transport into the deep mantle. Geophys. Res. Lett. 2001, 28, 3991–3993. [Google Scholar] [CrossRef]
  10. Ohira, I.; Ohtani, E.; Sakai, T.; Miyahara, M.; Hirao, N.; Ohishi, Y.; Nishijima, M. Stability of a hydrous δ-phase, AlOOH-MgSiO2(OH)2, and a mechanism for water transport into the base of lower mantle. Earth Planet. Sci. Lett. 2014, 401, 12–17. [Google Scholar] [CrossRef]
  11. Huang, X.G.; Xu, Y.S.; Karato, S.I. Water content in the transition zone from electrical conductivity of wadsleyite and ringwoodite. Nature 2005, 434, 746–749. [Google Scholar] [CrossRef] [PubMed]
  12. Karato, S. Water distribution across the mantle transition zone and its implications for global material circulation. Earth Planet. Sci. Lett. 2011, 301, 413–423. [Google Scholar] [CrossRef]
  13. Pearson, D.G.; Brenker, F.E.; Nestola, F.; McNeill, J.; Nasdala, L.; Hutchison, M.T.; Matveev, S.; Mather, K.; Silversmit, G.; Schmitz, S.; et al. Hydrous mantle transition zone indicated by ring-woodite included within diamond. Nature 2014, 507, 221–224. [Google Scholar] [CrossRef] [PubMed]
  14. Williams, P.A. Oxide Zone Geochemistry; Ellis Horwood Ltd.: Chichester, UK, 1990. [Google Scholar]
  15. Schmidt, M.; Lutz, H.D. Hydrogen bonding in basic copper salts: A spectroscopic study of malachite, Cu2(OH)2CO3, and brochantite, Cu4(OH)6SO4. Phys. Chem. Miner. 1993, 20, 27–32. [Google Scholar] [CrossRef]
  16. Zigan, F.; Joswig, W.; Schuster, H.U.; Mason, S.A. Verfeinerung der Struktur von Malachit, Cu2(OH)2CO3, durch Neutronenbeugung. Z. Kristallogr. 1977, 145, 412–426. [Google Scholar] [CrossRef]
  17. Kiseleva, I.A.; Ogorodova, L.P.; Melchakova, L.V.; Bisengalieva, M.R.; Becturganov, N.S. Thermodynamic properties of copper carbonates-malachite Cu2(CO3)(OH)2 and azurite Cu3(CO3)2(OH)2. Phys. Chem. Miner. 1992, 19, 322–333. [Google Scholar] [CrossRef]
  18. Brown, I.W.M.; Mackenzie, K.J.D.; Gainsford, G.J. Thermal decomposition of the basic copper carbonates malachite and azurite. Thermochim. Acta 1984, 74, 23–32. [Google Scholar] [CrossRef]
  19. Lee, Y.; Vogt, T.; Hriljac, J.A.; Parise, J.B.; Hanson, J.C.; Kimk, S.J. Non-framework cation migration and irreversible pressure-induced hydration in a zeolite. Nature 2002, 420, 485–489. [Google Scholar] [CrossRef]
  20. Merlini, M.; Perchiazzi, N.; Hanfland, M.; Bossak, A. Phase transition at high pressure in Cu2CO3(OH)2 related to the reduction of the Jahn-Teller effect. Acta Crystallogr. B 2012, 68, 266–274. [Google Scholar] [CrossRef]
  21. Lebernegg, S.; Tsirlin, A.A.; Janson, O.; Rosner, H. The spin gap in malachite Cu2(OH)2CO3 and its evolution under pressure. Phys. Rev. B 2013, 256070369. [Google Scholar]
  22. Mao, H.K.; Shen, G.; Hemley, G.J.; Duffy, T.S. X-ray diffraction with a double hot-plate laser-heated diamond cell. In Properties of the Earth and Planetary Materials at High Pressure and Temperature, American Geophysical Union; Manghnani, M.H., Yagi, T., Eds.; American Geophysical Union: Washington, DC, USA, 1998; pp. 27–34. [Google Scholar]
  23. Mao, H.K.; Xu, J.A.; Bell, P.M. Calibration of the ruby pressure gauge to 800 kbar. J. Geophys. Res. 1986, 91, 4673–4676. [Google Scholar] [CrossRef]
  24. Bouchard, M.; Smith, D.C. Catalogue of 45 reference Raman spectra of minerals concerning research in art history or archaeology, especially on corroded metals and coloured glass. Spectrochim. Acta A 2003, 59, 2247–2266. [Google Scholar] [CrossRef]
  25. Frost, R.L.; Martens, W.N.; Rintoul, L.; Mahmutagic, E.; Kloprogge, J.T. Raman spectroscopic study of azurite and malachite at 298 and 77 K. J. Raman Spectrosc. 2002, 33, 252–259. [Google Scholar] [CrossRef] [Green Version]
  26. Buzgar, N.; Apopei, A.I. The Raman study of certain carbonates. Analele Stiintifice Ale Universitatii AL I Cuza Iasi. Geologie 2009, 55, 97–112. [Google Scholar]
  27. Yu, B.S.; Fang, J.N.; Huang, E.P. Characteristics of the Raman spectra of archaeological Malachites. J. Raman Spectrosc. 2013, 44, 630–636. [Google Scholar] [CrossRef]
  28. Goldsmith, J.A.; Ross, S.D. The infra-red spectra of azurite and malachite. Spectrochim. Acta A 1968, 24, 2131–2137. [Google Scholar] [CrossRef]
  29. Stoilova, D.; Koleva, V.; Vassileva, V. Infrared study of some synthetic phases of malachite (Cu2(OH)2CO3)-hydrozincite (Zn5(OH)6(CO3)2) series. Spectrochim. Acta A 2002, 58, 2051–2059. [Google Scholar] [CrossRef]
  30. Efthimiopoulos, I.; Jahn, S.; Kuras, A.; Schade, U.; Koch-Müller, M. Combined high-pressure and high-temperature vibrational studies of dolomite: Phase diagram and evidence of a new distorted modification. Phys. Chem. Miner. 2017, 44, 465–476. [Google Scholar] [CrossRef]
  31. Gao, J.; Wu, X.; Qin, S.; Li, Y.C. Pressure-induced phase transformations of PbCO3 by x-ray diffraction and Raman spectroscopy. High Pressure Res. 2016, 1, 1–15. [Google Scholar] [CrossRef]
  32. Gillet, P.; Biellmann, C.; Reynard, B.; McMillan, P. Raman spectroscopic studies of carbonates; part I, high-pressure and high-temperature behavior of calcite, magnesite, dolomite and aragonite. Phys. Chem. Miner. 1993, 20, 1–18. [Google Scholar] [CrossRef]
  33. Kraft, S.; Knittle, E.; Williams, Q. Carbonate stability in the Earth’s mantle: A vibrational spectroscopic study of aragonite and dolomite at high pressures and temperatures. J. Geophys. Res. 1991, 96, 17997–18009. [Google Scholar] [CrossRef]
  34. Catalli, K.; Williams, Q. A high-pressure phase transition of calcite-III. Am. Mineral. 2005, 90, 437–444. [Google Scholar] [CrossRef]
  35. Liu, Z.X.; Lager, G.A.; Hemley, R.J.; Ross, N.L. Synchrotron infrared spectroscopy of OH-chondrodite and OH-clinohumite at high pressure. Am. Mineral. 2003, 88, 1412–1415. [Google Scholar] [CrossRef]
  36. Mattei, E.; De Vivo, G.; De Santis, A.; Gaetani, C.; Pelosi, C.; Santamaria, U. Raman spectroscopic analysis of azurite blackening. J. Raman Spectrosc. 2008, 39, 302–306. [Google Scholar] [CrossRef]
  37. White, W.B. The carbonate minerals. In The Infrared Spectra of Minerals; Farmer, V.C., Ed.; Mineralogical Society Monograph: London, UK, 1974; pp. 227–279. [Google Scholar]
  38. Fiquet, G.; Guyot, F.; Kunz, M.; Matas, J.; Andrault, D.; Hanfland, M. Structural refinements of magnesite at very high pressure. Am. Mineral. 2002, 87, 1261–1265. [Google Scholar] [CrossRef]
  39. Santillan, J.; Catalli, K.; Williams, Q. An infrared study of carbon-oxygen bond distance in magnesite from 0 to 60 GPa. Am. Mineral. 2005, 90, 1669–1673. [Google Scholar] [CrossRef]
  40. Williams, Q.; Jeanloz, R. Static amorphization of anorthite at 300K and comparison with diaplectic glass. Nature 1989, 338, 413–415. [Google Scholar] [CrossRef]
  41. Williams, Q.; Iratittle, E.; Reichtin, R.; Martin, S.; Jeanloz, R. Structural and electronic properties of Fe2SiO4-fayalite at ultra-high pressures: Amorphization and gapclosure. J. Geophys. Res. 1990, 95, 21549–21563. [Google Scholar] [CrossRef]
  42. Rundle, R.E.; Parasol, M. O–H stretching frequencies in very short and possibly symmetrical hydrogen Bonds. J. Chem. Phys. 1952, 20, 1487–1488. [Google Scholar] [CrossRef]
  43. Libowitzky, E. Correlation of O–H stretching frequencies and O–H–O hydrogen bond lengths in minerals. Monatsh. Chem. 1999, 130, 1047–1059. [Google Scholar]
  44. Hofmeister, A.M.; Cynn, H.; Burnley, P.C.; Meade, C. Vibrational spectra of dense, hydrous magnesium silicates at high pressure: Importance of the hydrogen bond angle. Am. Mineral. 1999, 84, 454–464. [Google Scholar] [CrossRef]
  45. Kleppe, A.K.; Jephcoat, A.P.; Welch, M.D. The effect of pressure upon hydrogen bonding in chlorite: A Raman spectroscopic study of clinochlore to 26.5 GPa. Am. Mineral. 2003, 88, 567–573. [Google Scholar] [CrossRef]
  46. Liu, L.G.; Lin, C.C.; Mernagh, T.P. Raman spectra of norbergite at various pressures and temperatures. Eur. J. Mineral. 1999, 11, 1011–1021. [Google Scholar] [CrossRef] [Green Version]
  47. Lutz, H.D. Hydroxide ions in condensed materials-correlation of spectroscopic and structural data. Struct. Bond. 1995, 82, 86–103. [Google Scholar]
  48. Wirth, R.; Vollmer, C.; Brenker, F.; Matsyuk, S.; Kaminsky, F. Nanocrystalline hydrous aluminium silicate in superdeep diamonds from Juina (Mato Grosso State, Brazil). Earth Planet. Sci. Lett. 2007, 259, 384–399. [Google Scholar] [CrossRef]
  49. Palot, M.; Jacobsen, S.D.; Townsend, J.P.; Nestola, F.; Marquardt, K.; Miyajima, N.; Harris, J.W.; Stachel, T.; McCammon, C.A.; Pearson, D.G. Evidence for H2O-bearing fluids in the lower mantle from diamond inclusion. Lithos 2016, 265, 237–3243. [Google Scholar] [CrossRef] [Green Version]
Figure 1. Raman spectrum of malachite at atmospheric pressure; three sections depending on types of vibration are noted with the same scale. The standard deviation in the digit of the peak position is 0.01.
Minerals 10 00277 g001
Figure 2. Infrared spectrum of malachite at atmospheric pressure and room temperature with vibrations noted.
Minerals 10 00277 g002
Figure 3. Raman spectra of Cu2(CO3)(OH)2 at elevated pressures. The insertions are the zoom-in views of the peak fitting results, which are indicative of phase transitions.
Minerals 10 00277 g003
Figure 4. Infrared spectra of Cu2(CO3)(OH)2 with increasing pressure.
Minerals 10 00277 g004
Figure 5. Pressure-dependences of (a) Cu–O vibrations, (b,c) [CO3]2− modes, and (d) O–H stretches in Cu2(CO3)(OH)2. The characters ((a): solid triangles, solid squares and half solid squares; (b) solid triangles, solid and open circles, and solid and open squares; (c) solid diamonds, solid and open triangles, solid, half solid and open circles, and solid, half solid and open squares; (d): solid, half solid and open triangles, and solid, half solid and open circles) are representative of experiment data collected upon compression except for the ones with a × center symbolizing the decompressing data. Four discrete pressure regions with color contrast represent different relations. Linear regression is used for most data analysis except for an O–C–O asymmetrical band ν3-1 in (b-1) and an out-of-bending band ν2-2 in (c-1), both fitted by parabolic curves. The pressure slopes (dυi/dP)T derived from the fitting analyses are listed in Table 3.
Minerals 10 00277 g005
Table 1. Selected Raman mode frequencies (cm−1) of Cu2(CO3)(OH)2 at various pressures.
P (GPa)External ModesO−C−O ν1O−C−O ν3
0.6 354.56 433.561069.501099.281496.66
1.7 355.09 437.951071.381100.941500.27
2.9 355.91 441.621073.931105.191504.72
4.5 358.75 446.551079.331109.411513.64
7.5347.80358.99 453.901086.831115.001521.14
9.5350.52370.21 457.651090.271118.801527.12
10.9353.64373.91 462.451094.031122.411532.52
15.0368.41 449.79471.241100.351129.641541.751501.10
16.9370.14 452.75474.921105.211133.881546.341506.03
18.9374.39 457.62480.921110.691139.891552.741511.19
22.5377.48 464.41486.291114.101145.501559.071518.74
23.6379.38 468.64490.661117.881149.701561.931521.73
26.2381.76 473.72495.231120.471154.931566.391527.64
28.9383.71 480.19500.751124.821158.141569.501534.45
26.8 386.69485.05505.921129.561162.061570.151533.91
24.9 384.44478.48498.021121.131152.001566.881529.47
16.0 372.40458.21479.981104.701134.861548.081505.95
6.0 356.88 448.971082.561113.291519.00
0.9 355.65 435.621068.851100.421498.64
Note: The standard deviation in the digit is 0.01.
Table 2. Selected infrared mode frequencies (cm−1) of Cu2(CO3)(OH)2 at various pressures.
P (GPa)O−C−O ν4O−C−O ν2Cu−OH BendingO−C−O ν1
0.8710.17749.42818.26829.03891.521039.821056.971100.391111.28
2.9712.92748.41817.36829.29882.331046.211065.261107.361124.71
5.1713.42749.39816.44829.77875.991049.821070.011111.641131.22
7.0723.92748.22813.76830.70865.661054.371076.791124.791149.76
8.2722.26746.22812.63830.74863.871057.791079.181131.011160.99
10.5716.99746.54810.98829.79863.951062.251083.731142.731173.99
12.6717.95746.61809.86829.82867.351070.321090.081150.551182.68
14.7712.98746.47808.56828.74869.471076.351092.581153.961184.35
15.8711.33746.60806.78827.57872.521083.361098.381159.501183.221206.96
18.3707.77746.44805.66827.46873.881086.351102.451159.571183.531210.16
20.6704.43748.79803.84825.34875.021096.771111.821164.971183.631213.12
23.0707.69756.48800.00823.64876.261105.941121.931167.551186.861215.88
25.1711.64762.12799.51821.99878.551109.411125.731170.961188.741217.97
27.2716.95766.21799.43824.12878.151118.281131.591173.501190.951219.78
29.2722.55770.75799.87825.47879.811123.931135.841176.571193.681221.79
26.9714.22759.66800.69825.85879.561118.241131.291173.961192.741221.59
20.3710.25755.23804.23825.06875.561098.101115.321168.501185.951212.56
14.3713.56751.03809.32827.55870.621079.431094.951156.571179.80
5.8716.23750.66816.22829.56868.651056.381075.701124.971146.75
0.0001709.66749.32818.92827.20891.361044.121058.731100.551110.08
P(GPa)O–C–O ν3O–H Stretches
0.81384.521423.331484.291510.791544.453251.553410.793485.88
2.91391.701427.241492.211514.551550.643231.313399.943477.70
5.11407.781440.581509.611535.221564.793205.453387.133453.68
7.01413.731447.891512.541538.381570.043173.993339.443429.39
8.21415.831448.941512.941541.261571.823148.033325.983427.53
10.51425.181456.821516.061543.601574.573128.783309.453421.65
12.61428.831460.451519.621547.711579.843106.583292.623411.01
14.71426.931460.861520.141550.951581.953069.743274.803402.42
15.81442.911468.961526.701554.421587.963062.833260.333391.76
18.31449.751473.621543.341579.111602.903042.733245.983386.89
20.61454.141480.851547.901582.651605.903047.873237.833383.73
23.01461.731499.701552.971587.071611.393051.263171.743361.45
25.11483.701510.381572.761609.051636.173054.363159.193358.61
27.21492.881511.711579.781609.451639.02 3157.103364.77
29.21504.241536.991582.261610.191643.81 3154.023370.67
26.91495.701515.071582.391610.051638.81 3159.923366.19
20.31458.881484.031552.761585.451620.503048.753187.103364.96
14.31444.241468.231526.671555.191590.313057.873264.413389.67
5.81416.651445.091511.611539.601569.15 3334.453428.01
0.00011382.231421.921484.971512.941542.54 3393.863473.88
Table 3. Pressure-dependences of modes (dυi/dP)T (cm−1∙GPa−1) of three types in Cu2(CO3)(OH)2 in different pressure regions.
AssignmentsModes0–7 GPa7–15 GPa15–23 GPa>~23 GPa
Cu–O vibrationsνCu-O12.34(3)2.34(3)2.34(3)2.34(3)
νCu-O2--2.24(5)2.24(5)
νCu-O31.06(3)1.38(5)/1.69(4)1.15(6)1.15(6)
O–C–O vibrationsν3-1~3.5~2.9~2.2~1.6
ν3-2--2.39(3)2.39(3)
ν1-12.12(3)2.12(3)2.12(3)1.69(6)
ν1-22.12(4)2.12(4)2.12(4)1.38(8)
ν2-1−3.60(4)0.92(8)0.50(2)0.50(2)
ν2-2~0.2~−0.2−0.60(1)0.85(4)
ν2-3−0.79(2)−0.79(2)−0.79(2)0.08(1)
ν4-1−0.12(7)0.13(2)0.13(2)2.25(7)
ν4-20.56(8)−1.48(4)−1.48(4)2.40(5)
O–H stretchesνOH-1−7.52(9)−3.51(3)−1.58(1)1.61(4)
νOH-2−5.54(1)−8.13(2)−4.71(4)−2.78(6)
νOH-3−10.72(6)−12.58(4)−1.03(2)1.54(1)

