Article

Adsorption of Salmonella in Clay Minerals and Clay-Based Materials

by
Laura Pardo
1,
Marta Domínguez-Maqueda
2,
Juan Antonio Cecilia
1,
Manuel Pozo Rodríguez
3,
Josy Osajima
4,
Miguel Ángel Moriñigo
2 and
Francisco Franco
1,*
1
Departamento de Química Inorgánica, Cristalografía y Mineralogía, Facultad de Ciencias, Campus de Teatinos s/n, Universidad de Málaga, 29071 Málaga, Spain
2
Departamento de Microbiología, Facultad de Ciencias, Campus de Teatinos s/n, Universidad de Málaga, 29071 Málaga, Spain
3
Departamento de Geología y Geoquímica, Facultad de Ciencias, Universidad Autónoma de Madrid, Campus de Cantoblanco, 28049 Madrid, Spain
4
Laboratório Interdisciplinar de Materiais Avançados (LIMAV), UFPI, Teresina, Piauí CEP 64049-550, Brazil
*
Author to whom correspondence should be addressed.
Minerals 2020, 10(2), 130; https://doi.org/10.3390/min10020130
Submission received: 17 December 2019 / Revised: 22 January 2020 / Accepted: 28 January 2020 / Published: 31 January 2020
(This article belongs to the Special Issue The Universal Application of Clay Minerals)

Abstract

:
A series of clay minerals and clay-based materials have been tested to eliminate one of the most dangerous bacteria we can find in the water: Salmonella. It has been proven that the use of clays and their PCH materials can be a suitable method for removing Salmonella from water. The results of this initial study show that all the materials analyzed have great salmonella adsorption capacities ranging from the lowest value observed in the mont-PCH sample (0.29 × 10¹⁰ CFU g−1) to the highest value observed in the natural palygorskite sample (1.52 × 10¹⁰ CFU g−1). Macroporosity, accessible external surface area, and the presence of silanol groups in the external surface of the particles appears to be the controlling factors for Salmonella adsorption capacity while it seems that the structural characteristics of the clay minerals and their respective PCH does not affect the adsorption capacity.

1. Introduction

Currently, the disinfection and purification of water takes place through several purification techniques such as the chemical purification (chlorination or ozonation), biological treatment (activated sludge), membrane systems (ultra-filtration, reverse osmosis) or physicochemical treatment (flocculation, coagulation). However, each technique displays its shortcomings [1]. Water disinfection is an issue that has attracted governments and the scientific community since most of outbreaks of diseases come as a result of water and food-borne enteric bacteria. Among them, we can highlight typhoid and food poisoning (Salmonella typhi), dysentery and diarrhea (Escherichia coli) or cholera (Vibrio cholera). The virulence of these pathogens is so high that it is one of the main sources of death in the developing world. Thus, it has been reported that 1.3 million deaths of children are attributed to diarrheal illness each year [2].
Actually, chlorine is the most used chemical agent for water disinfection due to its low cost, effectiveness and their extra protection against re-growth of pathogens and bacteria [3]. Nevertheless, chlorine has received negative publicity, mainly due to the discovery that chlorination of water containing organic compounds could lead to the formation of trihalomethanes (THMs), which are suspected of having detrimental health effects [4,5]. On the other hand, some microorganisms have developed a special chlorine-induced antibiotic resistance in such a way that high dosage of the disinfectant in the water treatment is required [6]. Ozone and the use of membranes filters [7,8] area alternative methods.
The adsorption technique is the most sustainable alternative to the chemical agents to remove pathogens from potable water and wastewater due to its high simplicity, low-cost operation, high efficiency, as well as ease of regeneration. Among the adsorbents developed in recent years, hydrotalcites [9], metallic nanoparticles [10] or graphene [11] have emerged as potential alternatives to chlorine for the removal of pathogenic organisms from water.
Clay minerals are considered as another adsorbent medium that can act as a natural antipathogenic agent. Clay minerals can be employed by themselves in medical applications since they are considered as a remedy for ailments such as diarrhea, tapeworm, wounds, dysentery, abscesses and hookworm [12]. In addition, clay minerals have been used for the environmental bioremediation [13] and wastewater treatment [14]. The main advantage of clay minerals in comparison to other adsorbents is related to their high availability low-cost and environmental friendliness. In addition, these clay minerals display interesting physicochemical properties such as high porosity, high surface area, as well as high surface charge and the possibility of modifying its structure by the insertion of small molecules or the anchoring of functional groups [15] in such a way that these materials have a great potential to the treatment and purification of water. Among the pollutants that clay minerals can selectively extract, we can highlight the adsorption of heavy metals, surfactants or aromatics and even biologically active compounds, which are so resistant that they cannot be removed by other methods [16]. Between the wide variety of clay minerals, the phyllosilicates have received much attention due to their chemical composition as well as their different morphologies that they can naturally acquire [17,18]. In some cases, the use of these fibrous phyllosilicates has generated controversy due to the carcinogenic activity of these minerals seems to be mostly dependent on their physico-chemical properties (silanol groups), crystallinity and fiber length, which are occasionally related to their genetic environment. However, their potentially hazardous effects should be assessed individually for each deposit and factory on the basis of epidemiological data and the results of sensitive animal tests. They have a structure with sheets or channels and high available surface area, so they can be used as a carrier to better promote the adhesion of microbes [19].
The physicochemical properties some phyllosilicates have can be modified to obtain new materials or nanocomposites with better physicochemical properties [20]. Porous clay heterostructures (PCHs) are formed by the insertion of a bulky cation in the interlayer spacing and a subsequent addition of silicon alkoxide, which polymerize along the cation, interconnecting two adjacent sheets. These materials have been used in adsorption processes [21,22,23,24,25,26] as well as in the catalysis field [27,28,29,30,31,32,33] with interesting applications in all cases due to their better applications in the fields of adsorption a catalysis in comparison to their respective starting clay minerals.
In the water disinfection field, several studies have emphasized the use of clay minerals due to a great number of advantages as compared to synthetic and ion exchange materials, such as high ion exchange capacity, resistance to high temperature, intense radiation and oxidative environment [34]. In the same way, modified-clay materials have also been employed to remove harmful pathogens from water sustainably and more efficiently [35].
The aim of this work is to assess the ability of some clay minerals (montmorillonite, saponite, sepiolite and palygorskite) and their respective PCHs to remove from water a bacterium very harmful to humans such as Salmonella.

2. Materials and Methods

2.1. Clay Minerals

The starting clay minerals used for the adsorption of Salmonella were two minerals coming from the smectite group with different crystallochemical characteristics, i.e., an Mg-rich smectite (trioctahedral) like saponite from the Madrid basin (Spain) and an Al-rich smectite (dioctahedral) like montmorillonite from Wyoming deposits (USA). In addition, two fibrous phyllosilicates as sepiolite and palygorskite were also taken from the Madrid basin (Spain).
PCHs were synthesized following the procedure described by Cecilia et al. [36]. As a preliminary step, the four phyllosilicates previously indicated were treated with NaCl solutions (1 N) to obtain the homoionic clays. Then, the samples were centrifuged and dried. In the next step, 2.5 g of the homoionic clay were treated with 9 g of cetyltrimethylammonium bromide (CTMABr) (Aldrich) in 100 mL of pure 1-propanol (anhydrous, 99.9% VWR) for 3 days. Along this time, Na+ was changed by a bulkier cation such ah CTMA+. Then, the obtained solid was filtered and washed in distilled water until neutral pH was obtained. In the following step, the solid was re-dissolved with 250 mL of H2O for 24 h. After this time, a solution of 0.88 g of hexadecylamine (Aldrich), used as a co-surfactant, in 25 mL of the 1-propanol solution was added and stirred for 24 h. Finally, the PCHs were prepared by the addition of a silicon source tetraethylorthosilicate (TEOS) diluted in 1-propanol (50/50 v/v), adding 13.4 mL of TEOS. After that, the suspension was stirred at room temperature for 3 days. Finally, the obtained gel was filtered, washed with H2O and dried at 80 °C overnight. In order to remove the organic matter, PCHs were calcined at 550 °C for 6 h, using a rate of 1 °C min−1.

2.2. Characterization of the Adsorbents

Powder XRD patterns were obtained by using a PANalytical X’Pert PRO diffractometer (PANalytical, Herremberg, Germany), over a 2θ range with Bragg–Brentano geometry using the Cu Kα (1.5406 Å) radiation and a germanium monochromator. The overall measurement time was 33 min per pattern over the 2θ range of 2–65° with 0.017° step size.
The shape and size of particles from the starting samples and the materials obtained were examined by scanning electron microscope (SEM) (JEOL, Tokyo, Japan) using a JEOL SM-6490 LV combined with X-ray energy dispersive spectroscopy (EDX). The samples for SEM observation were previously gold-sputtered (10 nm thick) in order to avoid charging of the surface.
Infrared spectroscopy of samples was performed using a standard Bruker IFS 60 V Fourier transform infrared (FTIR) spectrometer (Bruker, Billerica, MA, USA). Samples were milled with KBr and compressed into thin pellets. The spectrum was recorded with a spectral resolution of 2 cm−1 in transmission mode in the region of 550–4000 cm−1.
N2 adsorption–desorption isotherms at −196 °C were obtained by using an ASAP 2020 model of gas adsorption analyzer supplied by Micromeritics Inc. (Micromeritics, Norcross, GA, USA). Before to N2 adsorption, the sample was outgassed at 200 °C (heating rate 10 °C min−1) overnight. Surface areas were determined by using the Brunauer–Emmett–Teller (BET) equation [37], assuming a cross-section of 16.2 Å2 for the nitrogen molecule [38] while the pore size distribution was estimated from the density functional theory (DFT) method [39]. This methodology was selected since to the wide pore-size distribution range of the samples. These data were also provided by ASAP 2020 equipment.

2.3. Bacterial Strain and Inoculum Preparation

Salmonella spp. belongs to the family of Enterobacteriaceae. They are gram negative bacilli and facultative anaerobes that mainly have mobility. Generally, Salmonella grows in a temperature range between 5 and 47 °C.
Salmonella spp. cells were cultured on tryptone soya agar (TSA), (Oxoid Ltd., Basingstoke, UK) at 37 °C for 24 h. Bacterial suspensions of alive cells were prepared by scraping cells from the plates and resuspending in 10 mL of sterile tryptone soya broth (TSB) until adjusting it to optical density of 0.5 to the spectrophotometer at 600 nm absorbance. Then, 100 µL of this inoculum were added to 200 mL of TSB for growing Salmonella spp. on shaking at 37 °C for 24 h.
Growth curves were monitored by changes in the optical density at 600 nm every hour. At the same time, 10-fold dilutions (101–109) were carried out to obtain an approximation of viable cells (colony forming units) by microliter (CFU mL−1). In this way, absorbance was related to cells number, and it allowed us to obtain a growth curve of reference based on absorbance.

2.4. Preparation of Treatment Solutions and Sorption Experiments

All solutions were freshly prepared before each adsorption experiment. One phosphate buffered saline tablet with a pH of 7.4 (Sigma Aldrich, San Louis, MO, USA) was dissolved in 1 L distilled water. A known aliquot of Salmonella (107 CFU mL−1) was added to 50 mL of PBS solution. Then, 4 mg of autoclaved sterile sorbent (montmorillonite, saponite, sepiolite, palygoskite and their respective synthetized PCHs) were also added. The bacterial removal by the sorbent followed using a spectrophotometer model: Boeco S-22UV/Vis (Boeco, Hamburg, Germany). Simultaneously, an experiment of control without sorbent was performed. Furthermore, 3 replicas for the treatment were analyzed.
The salmonella adsorption capacity, measured in colony forming units per gram of clay (CFU g−1), was calculated by means the difference of Salmonella concentrations between the control and the sorbents-treated solutions, taking into account that 4 mg of sorbents were added to 50 mL of solution.

3. Results and Discussion

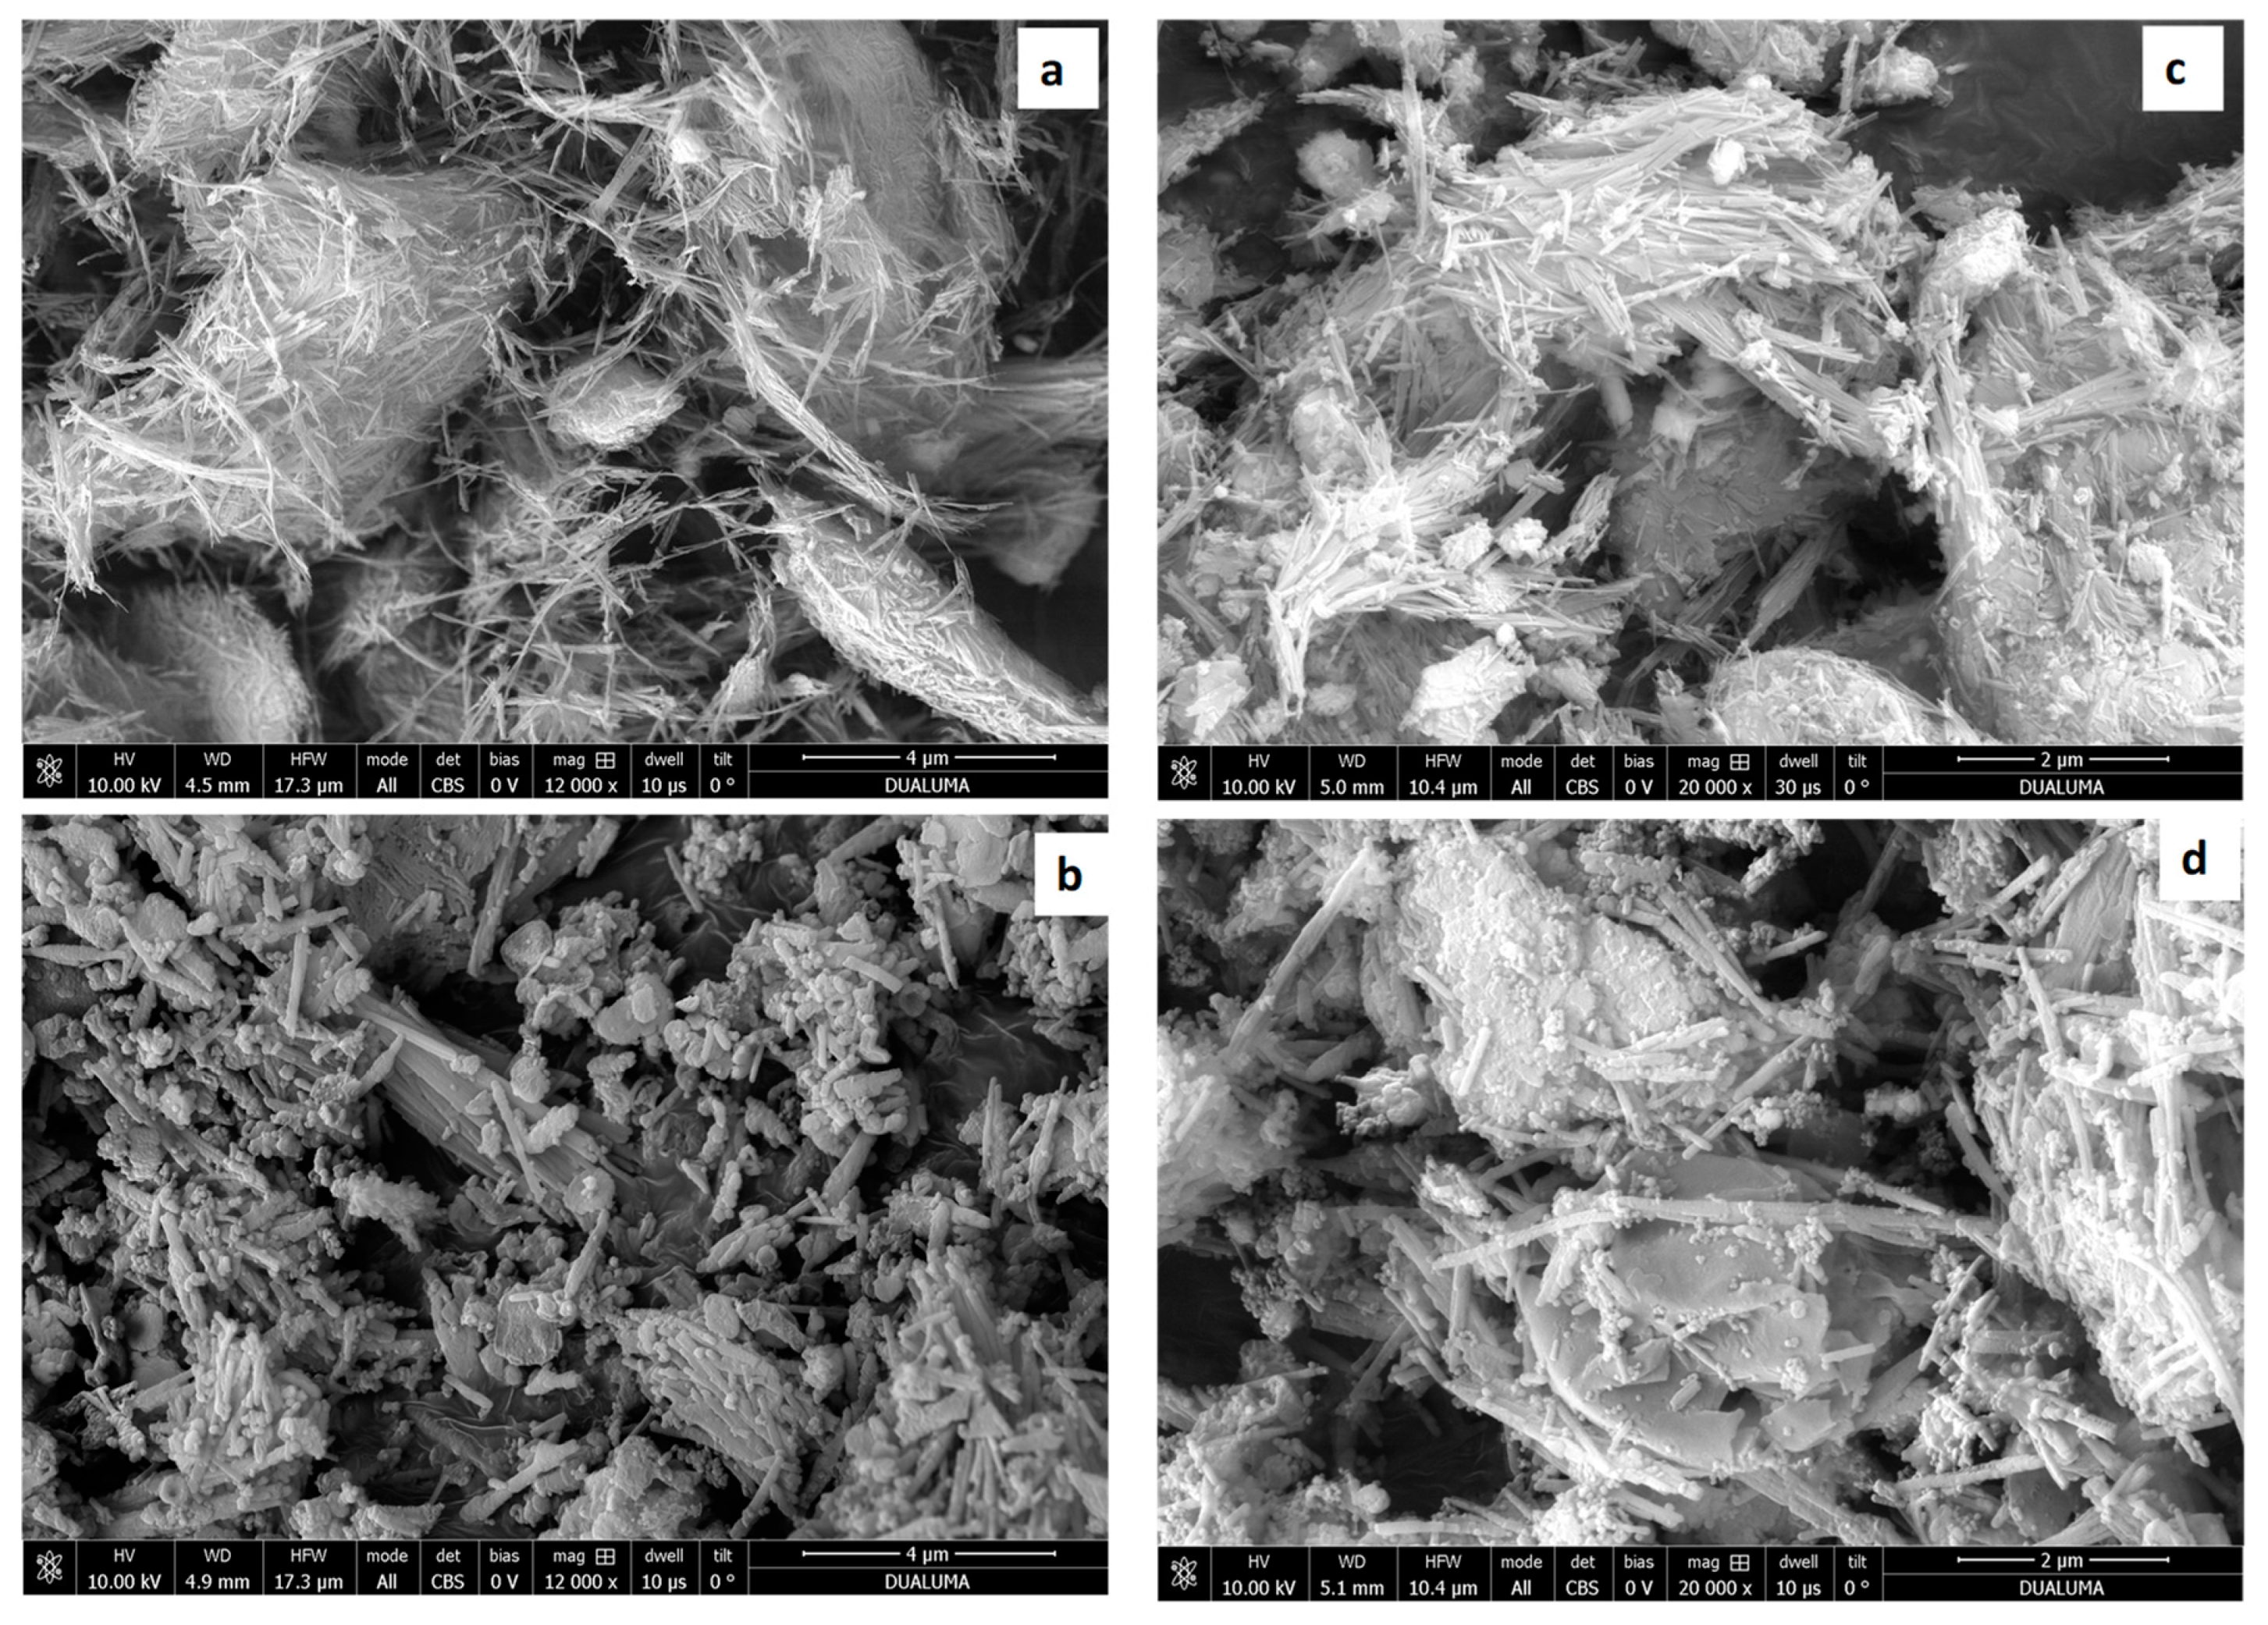
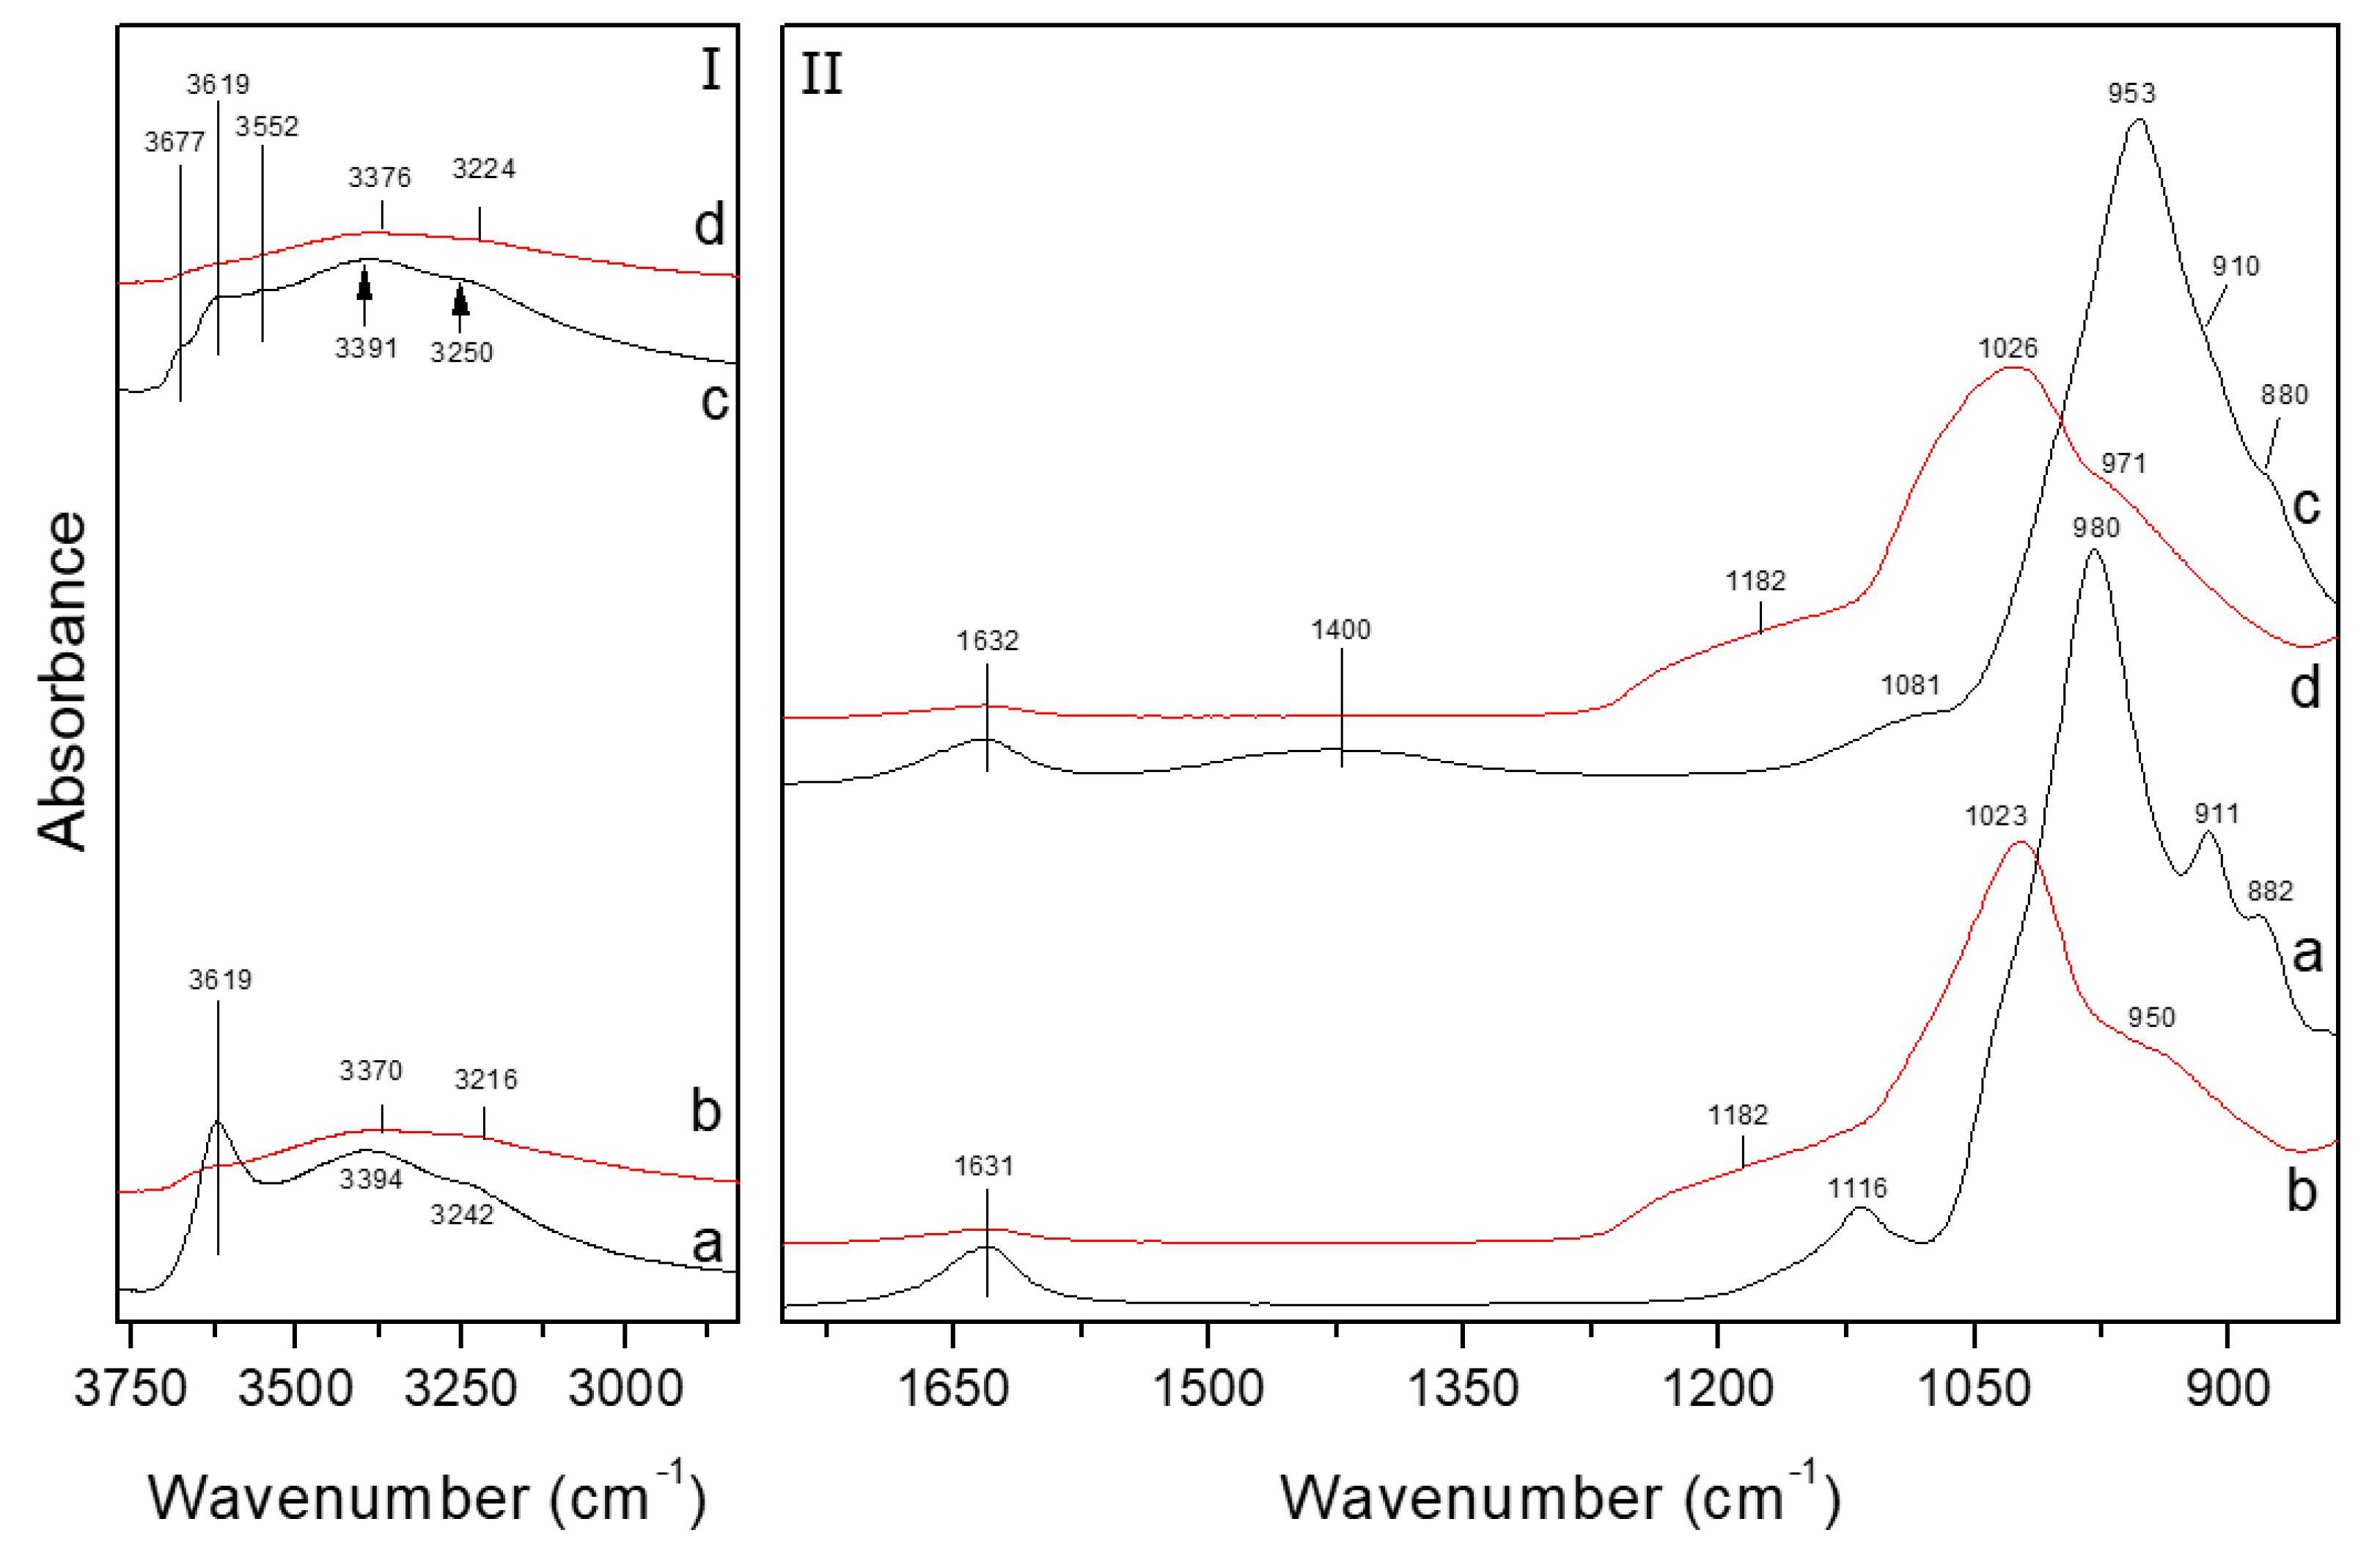
3.1. Characterization of the Starting Clay Minerals and the Clay-Based Materials

Figure 1 and Figure 2 shows the X-ray diffraction patterns of the starting clay minerals: montmorillonite, saponite, sepiolite and palygorskite. Differences in crystallinity and mineralogical content of the starting clay minerals can be detected between them. In the case of montmorillonite, a broad and intense peak at 12.5 Å, corresponding to the 001 reflection of the 2:1 type structure, is the main characteristic of the XRD profile. The 060 reflection appears at 1.50 Å, indicating the dioctahedral character of this type of smectite. Moreover, reflections of gypsum, quartz and feldspars can be detected.
The X-ray diffraction profile of saponite sample (Figure 1) is similar to that of montmorillonite. Nevertheless, the 001 band is notably broader, suggesting a higher disorder along the c axis or a higher hydration variability in the interlayer spacing. Moreover, the position of the 060 reflection at 1.52–1.53 Å indicates the trioctahedral character of this smectite. The XRD pattern of the starting saponite shows the presence of minor amounts of quartz, feldspar and dolomite.
On the other hand, the X-ray diffraction profile of sepiolite (Figure 2) shows more intense peaks than those observed in the case of the studied montmorillonite and saponite. This suggests that the “crystallinity” of sepiolite is higher than smectites. The diffraction profile of sepiolite is dominated by a very intense peak corresponding to the reflection 110 of the sepiolite, the absence of reflections of other minerals indicates that this mineral is extremely pure. On the contrary, it can be observed in the diffraction profile of the palygorskite (Figure 2) that accompanying the characteristic reflections of the palygorskite, the reflections of the sepiolite, smectite and quartz also appear. Likewise, it can also be observed that the degree of crystallinity of the palygorskite is significantly lower in comparison to the sepiolite previously studied. In addition, it can be verified that the reflection 110 is less intense in the case of the palygorskite and it also has a width in the middle of the slightly higher height. These two characteristics suggest that palygorskite has a remarkably lower ordering than the initial sepiolite.
Figure 1 also shows the X-ray diffraction patterns of the PCH materials obtained from montmorillonite and saponite. A comparison of the diffraction profile of the natural montmorillonite and of mont-PCH shows that the synthesis of this new material causes a strong broadening and a decrease in intensity of the 001 reflection (12.5 Å) together with the disappearance of the gypsum peak. The intensity of the quartz and feldspar peaks appears to be decreased in respect to the intensity of the 020 reflection of montmorillonite. Nevertheless, this modification can be related to the homogeneity of the sample. Moreover, an intense alteration in the 060 reflection can be detected. It must be considered that when the PCH is synthesized, silica columns are being inserted between the tetrahedral-octahedral-tetrahedral (TOT) sheets of the montmorillonite [36], and this insertion produces an increase in the basal spacing of the laminar structures and a strong delamination accompanied by an increase in the disorder degree. This structural modification explains the practical disappearance of reflection 001 of the montmorillonite and the increase in the background signal overlapping with the reflections peaks between 20° and 30° 2θ. Likewise, the decrease in the intensity of reflection 060 suggests that the treatment to obtain the mont-PCH also produces a strong reduction in particle size along the b axis.
Similar observations could be made by comparing the diffraction profile of natural saponite and sap-PCH. In this case, the almost disappearance of the 001 reflection of saponite suggests, as observed in montmorillonite, a strong delamination of the saponite layers, whereas a small peak remained at 10 Å, indicating that a small amount of illite was present in the saponite sample. In this case, apparently, the synthesis of PCH in the saponite also produced an increase in the degree of disorder as could be seen in the increase of the background signal in the reflections located between 20° and 30° 2θ. A small decrease in the intensity of the 060 reflection also suggests a reduction in particle size along the b axis. Nevertheless, this decrease was lower than the observed in the case of montmorillonite.
Figure 2 shows the X-ray diffraction diagrams of the corresponding materials obtained after subjecting the samples to the same synthetic conditions with which the PCH were obtained with the minerals of the smectite group. These materials were named sap-PCH and pal-PCH respectively. By comparison of the X-ray diffraction profile of sepiolite and sep-PCH a slight overall decrease of the signal of the diffraction profile and an increase of the Full Width at Half Maximum (FWHM) of the 110 reflection were observed. This suggests that the synthesis conditions did not modify the original crystal structure of sepiolite. Nevertheless, some slight alteration located exclusively in the external surface of the fibers could explain the observed modifications.
On the contrary, the comparison between the X-ray diffraction profiles of starting palygorskite and pal-PCH show that synthesis of the PCH modified strongly the diffraction profile of the starting palygorskite. The reflection 110 of the palygorskite almost completely disappeared and the diffraction peaks between 20° and 25° 2θ were replaced by a broad band between 10° and 20° 2θ.
Figure 3 compiles the SEM images of montmorillonite and the PCH synthesized from this clay mineral. From Figure 3a, it could be observed how the starting montmorillonite displayed particles with lamellar structure, which appeared generally associated in packages with a size between 20 and 30 µm approximately. The isolated laminar particles displayed a length of about 10 µm along the b axis, although they were extremely thin along the c axis. Figure 3b shows a SEM image of PCH obtained from montmorillonite. The synthesis of this material caused a strong decrease of the particle size along the b axis, diminishing to an average length of 2 µm approximately. These small particles also appeared associated in aggregates where the laminar particles were distributed randomly, forming extremely aggregates.
In the case of saponite (Figure 3c), this sample also shows a laminar morphology formed by small particles whose length along the b axis was smaller than 4 µm. These particles formed agglomerates, which could have dimensions greater than 10 µm, and were arranged in parallel in such a way that the interparticle voids was relatively low. In addition, the SEM image also displayed that the laminar particles appeared flattened and had a low proportion of small fibers, which were related to the presence of a low proportion of sepiolite. PCH formed from the saponite (Figure 3d) presented a high delamination while the sheets were extremely thin. These effects favor the rolling in themselves, especially in the edge of the sheets. In the upper right corner of the PCH obtained from saponite, a strong reduction in particle size could also be observed, obtaining particles with a size much smaller than 0.2 µm in some cases.
Figure 4a shows the SEM image of the raw sepiolite. This image reveals that sepiolite shows its characteristic fibrous forms formed by associations of fibers that are longer than 4 µm, but extremely thin sections. In the case of the PCH obtained from sepiolite, Figure 4b revealed a separation of these fibers together with a notable thickening due to the crystallization of silica around these fibers. In addition, a shortening of the starting fibers could be observed as a consequence of the fracture of the fibers after the synthesis of its respective PCH.
In the case of palygorskite, Figure 4c presents similar fibers to those observed in the case of sepiolite. In the case of PCH obtained with sepiolite, shown in Figure 4d, the synthesis of the PCH also produced a thickening of the fibers and a fracture of them, as observed in the sepiolite. Likewise, small spherical particles were detected. These particles could ascribe to an excess of silica formed in the synthesis of the PCH.
Figure 5 shows the infrared spectra of the starting montmorillonite and saponite, and the corresponding obtained PCH materials. Some differences in the number and the positions of the OH stretching bands in the FTIR spectra of montmorillonite and saponite could be observed in Figure 5Ia and Figure 6Ic. In the case of montmorillonite (Figure 5Ia), the spectrum was dominated by a broad band centered at 3619 cm−1 related with Al(OH)Al-stretching vibrations [40]. In this spectrum we could also observe broad bands between 3500 and 3000 cm−1 assigned to the tension vibrations of the OH groups of the water molecules located between the 2:1 layers [41]. Figure 5IIa shows the Si–O stretching region of the montmorillonite FTIR spectrum (1700–850 cm−1). In this region there is a small band at 1631 cm−1 classically assigned to the deformation vibrations of water molecules [42], and bands at 1116 cm−1 and 980 in 911cm−1, which are assigned to the tension vibrations of the silicon-oxygen groups located in the tetrahedral layers of the 2:1 type montmorillonite sheets [41]. The band located at 882 cm−1 can be ascribed to OH bending band of Al(OH)Mg [41].
In the case of saponite, the OH-stretching region of the FTIR spectrum is characterized by the presence of a band at 3619 cm−1 accompanied by a shoulder at 3677 cm−1, and a broad band centered at 3552 cm−1. The band centered at 3619 cm−1 is related to the OH stretching mode of structural Mg(OH)2 groups in the octahedral sheet of saponite structure [43,44]. The band at 3677 cm−1 is assigned to the νOH of isolated Si–OH groups located on the external surface of laminar particles [45], whereas the band at 3552 cm−1 is related to the OH stretching modes of Al(OH)Si groups formed by isomorphous substitutions of Si(IV) by Al(III) in the tetrahedral sheet of trioctahedral smectite [46,47]. In the 1700–850 cm−1 region of the saponite FTIR spectrum (Figure 5IIc) the band at 1632 cm−1 is attributed to the water bending vibrations [42]. In this region, it is also possible to identify a band at 1400 cm−1 attributed to the (CO3)2− antisymmetric and symmetric stretching modes, which confirms the presence of dolomite impurity as shown by XRD [48]. In this case, the Si–O stretching bands (1081 and 953 cm−1) appears at lower wavenumbers compared to those of montmorillonite [42], showing the trioctahedral character.
The OH stretching region of the PCH materials obtained with montmorillonite and saponite are shown in Figure 5Ib,Id, respectively. In both cases, the synthesis of the PCH caused strong decreases in the OH stretching bands suggesting that the insertion of the SiO columns affects notably the stretching modes of the octahedral sheets. Moreover, the profile of the 1700–850 cm−1 region of the FTIR of montmorillonite and saponite were also strongly modified by the PCH synthesis. Figure 6IIb shows that the synthesis of the PCH in montmorillonite caused a strong shifting of the Si–O bands of the starting materials to 1182, 1023 and 950 cm−1. The band at 1182 cm−1 could be assigned to the presence of a certain amount of amorphous silica [48], whereas the shift of the band at 980–1023 cm−1 suggests that the delamination processes, observed by XRD, favor the vibrations perpendicular to the 001 plane of the Si–O bonds [36].
In the case of saponite, Figure 5IId shows that the insertion of the silica columns in the interlayer space causes the same modification observed in the Si–O stretching bands of montmorillonite. In this case, the loss of the broad band centered at 1400 cm−1 indicates the complete loss of the dolomite phase observed in the starting saponite.
The hydroxyl-stretching region of the FTIR spectra of the starting sepiolite and palygorskite are shown in Figure 6Ia,Ic. In this region sepiolite shows two bands at 3688, and 3617 cm−1, which were associated with the stretching vibration of the hydroxyls coordinated with magnesium; a band at 3560 cm−1 related with the stretching modes of molecular water coordinated with magnesium [49]. The bands at 3358 and 3240 cm−1 have been attributed to zeolitic and coordinated water [50]. On the other hand, palygorskite also shows bands at 3611 and 3542 cm−1. The band at 3611 cm−1 is assigned to the OH-stretching mode in Al2–OH groups [51], whereas the band at 3542 cm−1 represents the contribution of the OH-stretching mode in Al–Mg–OH, Fe–Mg–OH and Fe2–OH groups.
The synthesis of the PCH, in both sepiolite and palygorskite, caused a strong decrease in the OH stretching bands (Figure 5Ib,Id), suggesting that the fall of the silica also affected notably the stretching modes of the octahedral sheets.
Figure 6IIa,IIc shows the 1700–850 cm−1 region of the FTIR spectra of starting sepiolite and palygorskite, respectively. A doublet of nearly 1650 cm−1 was observed for both minerals with maxima at 1656 and 1629 cm−1 in the FTIR spectrum of sepiolite and at 1652 and 1631 cm−1 in the case palygorskite. As Farmer indicated [42], these bands can be attributed to the zeolitic and adsorbed water respectively. According to Frost et al. [49], bands at 1206, 1073 and 1000 cm−1, in the case of sepiolite (Figure 6IIa), and bands at 1190, 1083 and 1010 cm−1, in the case of palygorskite (Figure 6IIc), were assigned to Si–O stretching modes, whereas those between 1000 and 850 cm−1 in both FTIR spectra were attributed to M–OH deformation, where M was Mg or Al. In addition, a very small band centered at 1400 cm−1 was observed in the FTIR spectra of palygorskite that could be related to the presence of minor amount of carbonates, which could not be detected by XRD.
Figure 6 also shows that the PCH synthesis conditions cause strong modifications in the FTIR spectra of both sepiolite and palygorskite. These modifications affect both the vibrations of the OH groups and that of the Si–O bonds. In the 3750–3000 cm−1 region Figure 6Ib,Id show that the synthesis caused a dramatic decrease in the tension vibrations of the OH groups that disappeared almost completely and ended up being part of a small overlapping shoulder with the wider bands of the vibrations of the water molecules that apparently were not affected. However, the transformation of the doublet corresponding to the water bending vibrations [42] to a single band at 1634 cm−1 suggests a homogenization in the local environment surrounding the adsorbed water molecules.
Strong changes were also observed in the region between 1300 and 850 cm−1. In this case, bands corresponding to the Si–O vibrations broadened and shifted to higher wavenumbers. These modifications could occur due to two effects that occur simultaneously: first, the structural alteration observed with different degrees in both sepiolite and palygorskite influences the Si–O vibrational modes tetrahedral sheets, and second, the appearance of an amorphous silica phase, which can be generated together with the new PCH. Additionally, the synthetic conditions to obtain the PCH produced a decrease in the intensity of the bands below 1000 cm−1. This decrease was parallel to the decrease in the intensity of the OH stretching band observed in Figure 6I, suggesting that the octahedral layer was noticeably affected. On the other hand, as observed in saponite, the loss of the broad band centered at 1400 cm−1 indicates the complete loss of the small amount of carbonate phase.
Figure 7 presents N2 adsorption–desorption isotherms at −196 °C. According to the International Union of Pure and Applied Chemistry (IUPAC) classification, the adsorption isotherms of the raw clays (Figure 7A) can be considered as type-II [52]. The hysteresis loop can be adjusted to H3, which is given by non-rigid aggregates of plate-like particles as clay minerals [52]. This profile is typical both for non-porous and macroporous adsorbents. From the adsorption isotherms, it can be observed how the knee is sharper in the case of the Sep sample, which is directly related to the completion of monolayer coverage. This data was confirmed through the BET equation [37] since the Sep sample reaches the highest specific surface area (SBET = 182 m2 g−1). On the contrary, the sample with the less pronounced knee (Mont) results in a smaller surface area (50 m2 g−1).
The microporosity of the raw clays were also evaluated from the t-plot method (Table 1). This data revealed that the microporosity was relatively low, being slightly higher for saponite and sepiolite.
From the N2-adsorption isotherms, it could also be observed a clear growth of the N2-adsorbed at high relative pressures, mainly in the case of Sep and Pal, due to N2-filling between fibers. This growth was less pronounced in the case of the Mont and Sap due to the interparticle voids being lower than those shown for fibrous materials.
The pore volume followed the same trend to that observed in the SBET and t-plot data since those samples with higher surface area also displayed bigger porosity.
As the raw clays display a wide range of porosity, the pore size distribution was studied with the DFT method (Figure 8) [39,53]. From these data, it could be inferred that all raw clays had a high microporosity (<2 nm) due to the voids present in the interlayer spacing for Mont and Sap and the nanochannels formed by the inversion of the tetrahedral sheet in the case of Sep and Pal. In the case of Mont and Sap, the mesoporosity (2–50 nm) was relatively low. However, both Sep and Pal displayed a high proportion of meso- and macroporosity (>50 nm) as indicates the growing of the N2-adsorbed at high relative pressure due to the voids between fibers.
The N2-adsorption isotherms of their respective PCH are compiled in Figure 7B. Despite the modification of the structure, the isotherms continue to be classified as type-II; however, the hysteresis loop can be considered as H4 [52]. This loop is often found with aggregated crystals of zeolites, some mesoporous zeolites and micro-mesoporous carbons, so the PCHs contain high micro-mesoporosity. The high N2-adsorbed at low relative pressure is in agreement with the t-plot values where an increase of the microporosity was observed after the synthesis of the PCHs. With regards to the mesoporosity, the SBET values also indicate a clear rise in the surface area attaining values between 612 m2 g−1 for pal-PCH and 768 m2 g−1 for sap-PCH. The analysis of the higher relative pressure revealed an increase in N2-adsorbed less pronounced than that observed for their respective raw clays, so the presence of lower proportion of interparticle voids was expected.
The pore size distribution, estimated by DFT (Figure 8B) [54], shows a clear increase of the micro- and mesoporosity of all samples with a maximum at 1.27 nm and 2.75 nm. This fact confirms the formation of a porous structure by the growth of silica, incorporated as silicon alkoxide, around the cationic template. On the other hand, it was also noticeable that the macroporosity could be considered negligible in comparison to the starting clays, mainly sep-PCH and pal-PCH.

3.2. Adsorption of Salmonella Tests

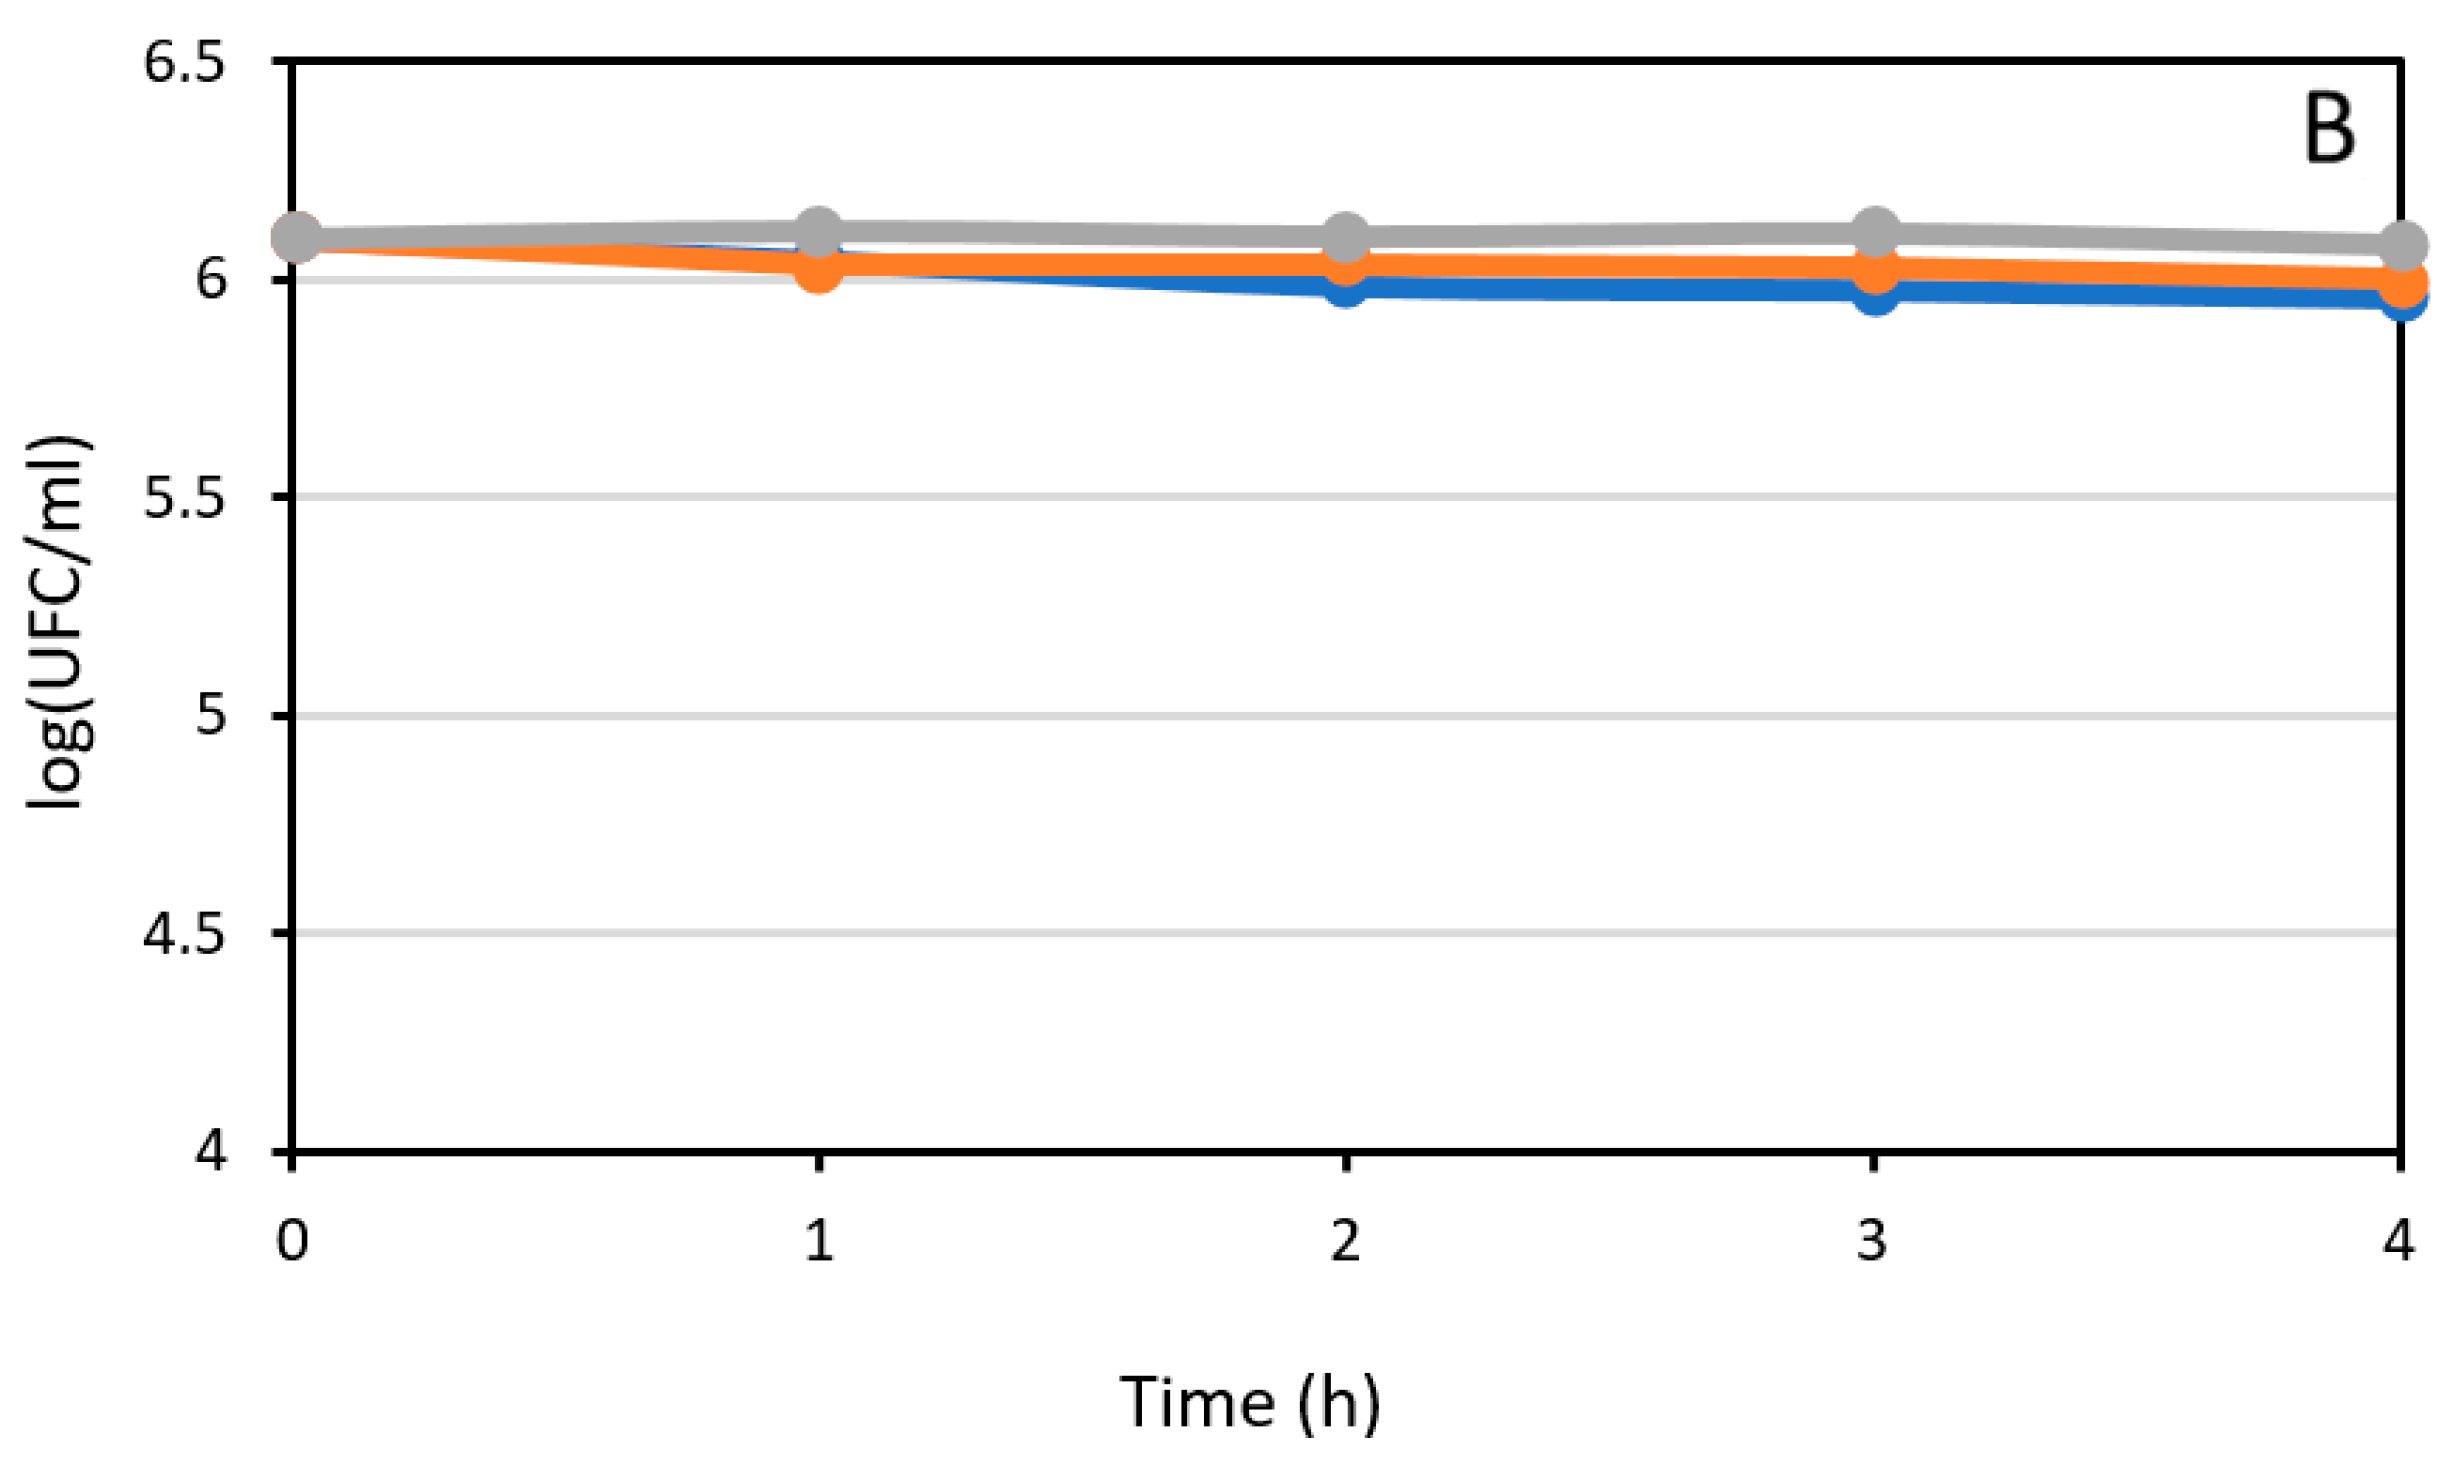
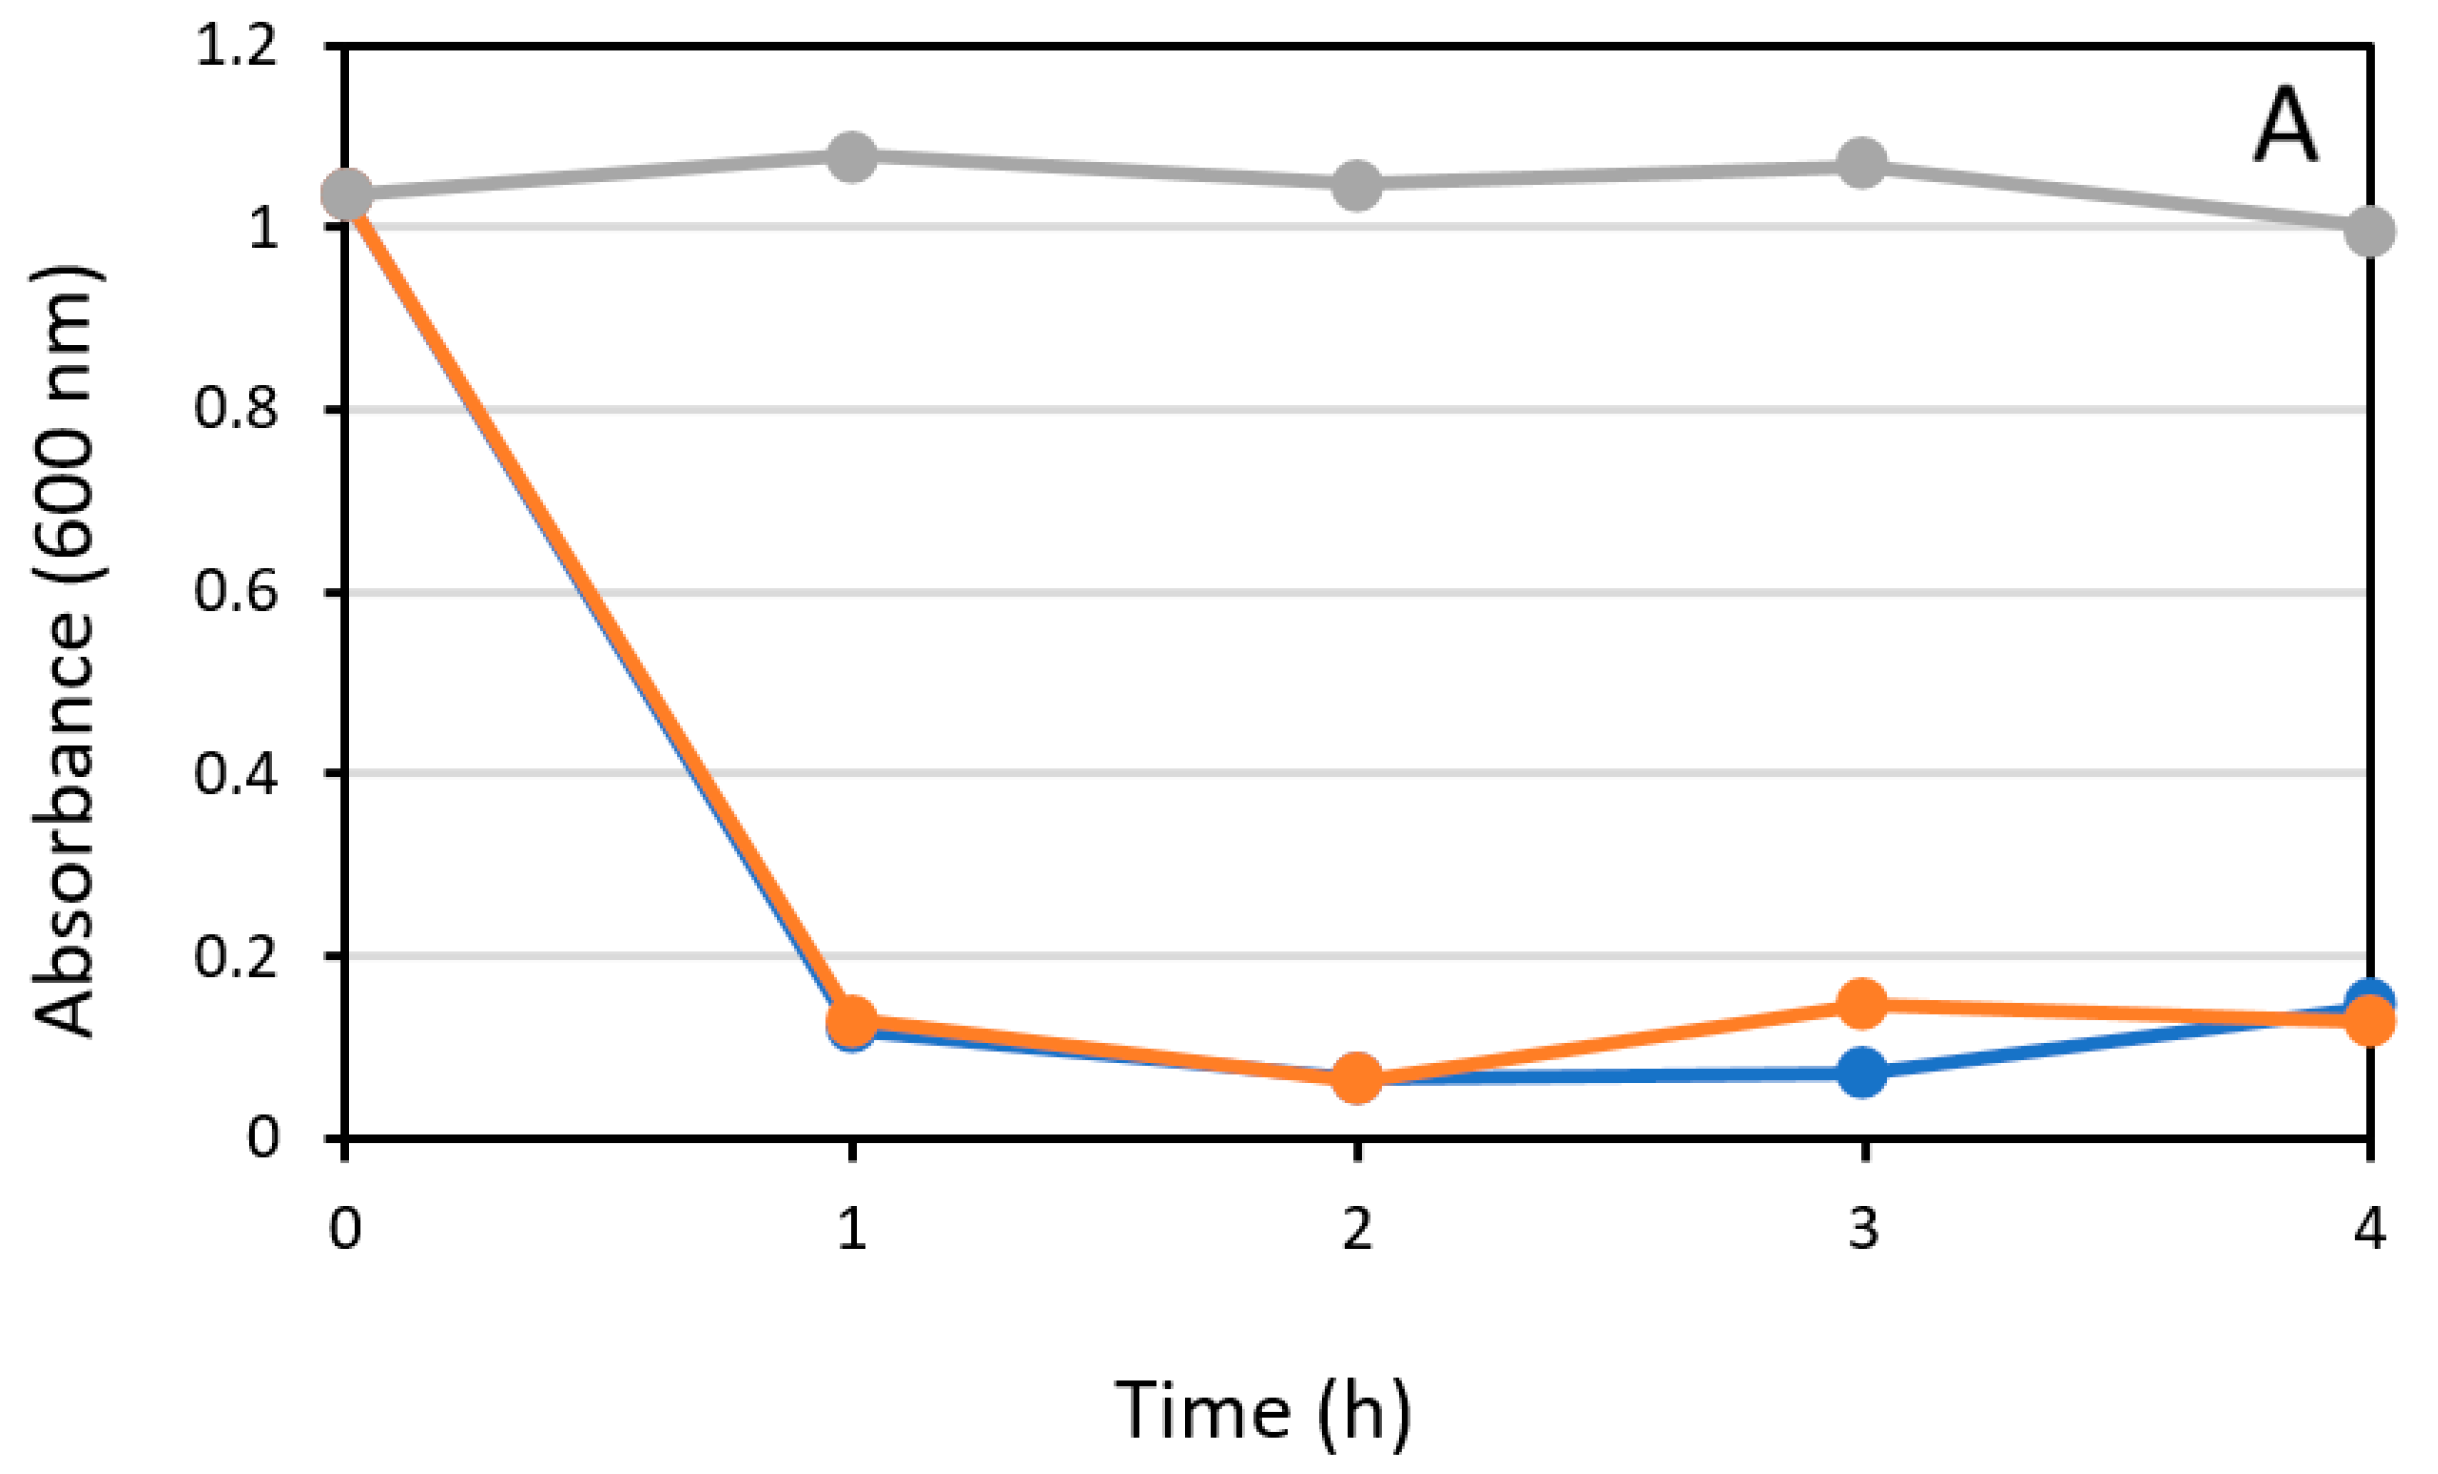
3.2.1. Adsorption of Salmonella on Montmorillonite and Mont-PCH

Table 2 shows the evolution of the absorbance values and the corresponding Salmonella concentrations (CFU mL−1) along the adsorption experiment using the different clay minerals and the PCH obtained materials. The absorbance values were directly related to the concentration of Salmonella present in the solutions [54]. Figure 9A,B (grey line) show that Salmonella concentration remained approximately constant nearly to 106 CFU mL−1 if no sorbent was added, suggesting that Salmonella was in the stationary phase during the adsorption test. This experiment was used as a control. Figure 9A,B (blue line) show that the addition of montmorillonite caused a decrease of the absorbance from 1.034 to 0.925 after 1 h of contact and, after 2 h, a new decrease of the absorbance to 0.812. According to Purdy et al. [54], this decrease indicates that the concentration of Salmonella decreased from 106.09 to 105.99 CFU mL−1. This result suggests that montmorillonite removes the 21% of Salmonella in the first 2 h of the sorption experiment. After this time, the absorbance values remained almost constant. Nevertheless, a slight decrease between 2 and 4 h of contact suggests 5% additional adsorption of Salmonella in montmorillonite in this time. Figure 9 (orange line) also shows the decrease of Salmonella concentration using mont-PCH as a sorbent. In this case, the decrease in absorbance—from 1.034 to 0.901—occurred in the first hour keeping constant from this time. The concentration of Salmonella decreased slightly from 106.09 to 106.03 CFU mL−1 in 1 h. In this time, the amount of Salmonella decreased by 13%. Above this time, the amount of free Salmonella in the solution remained almost constant, suggesting that the sorption of Salmonella in mont-PCH occurred exclusively in the first hour of contact.
The Salmonella capacity on montmorillonite, measured in colony forming units per gram of clay (CFU g−1) decreased with the synthesis of the PCH:
montmorillonite (0.40 × 10¹⁰ CFU g−1) > mont-PCH (0.29 × 10¹⁰ CFU g−1)

3.2.2. Adsorption of Salmonella on Saponite and Sap-PCH

Table 2 shows the variation of the Salmonella concentration during the test without sorbents (control) and the variation of the Salmonella concentration after the addition of saponite (blue line) and the sap-PCH (orange line). In this case we could verify that after 1 h of contact with these adsorbents the absorbance of Salmonella in aqueous solutions dramatically decreased from 1.034 to 0.120 in saponite (Figure 10A), which translated to the concentration of Salmonella, it resulted into a decrease from 106.09 to 105.16 CFU mL−1 (Figure 10B). This supposes the removal of 88% of Salmonella. In addition, the absorbance continued decreasing in the next hour, with both saponite and saponite-PCH sorbents, at a noticeably lower rate to values of around 0.06 in both cases, increasing the withdrawal of Salmonella to a total of 91%. However, after 4 h of contact, a slight increase of absorbance was introduced in the remaining values of concentration, similar to those of the first two hours. These results suggest that there was a strong adsorption of Salmonella in the first hour of contact, especially in the most accessible surfaces such as the external surface and in the pores of greater size, which is followed by a small additional adsorption after two hours of contact in which Salmonella could occupy some more inaccessible sites located on the edge of the sheets. The insertion in the porous structure or within interlayer sheet must be discarded. At contact times above 3 h, the increase in absorbance suggests desorption of a small amount of Salmonella units equivalent to a percentage around 2%.
The Salmonella capacity on saponite remained almost unchanged after the synthesis of the PCH. In both cases the capacity was 1.44 × 10¹⁰ CFU g−1.

3.2.3. Adsorption of Salmonella on Sepiolite and Sep-PCH

Table 2 also shows the kinetics of adsorption of Salmonella in the natural sepiolite and in sepiolite-PCH in terms of absorbance and concentration (CFU mL−1). In both cases, the major adsorption of Salmonella occurred within the first hour of contact and it occurred in the external surface since the size of Salmonella units (2 µm in length and 0.5 µm in diameter) was higher than the structural channels of sepiolite. In natural sepiolite (blue line), these values went from 1.034 to approximately 0.7 (Figure 11A). This decrease in absorbance means a decrease in concentration from 106.09 to 105.94 (Figure 11B). In this contact time sepiolite adsorbed 62% of Salmonella present in water. On the other hand, at this contact time, the amount of Salmonella absorbed in the sepiolite-PCH was noticeably higher. In this case, with sepiolite-PCH as a sorbent, the absorbance of Salmonella decreased from 1.034 to 0.395, indicating a decrease in the concentration from 106.09 to 105.67 CFU mL−1 after the first hour. Sep-PCH removes 87% of Salmonella units in the first hour of adsorption. After that, no additional adsorption of Salmonella was observed in both cases. Nevertheless, there was a negligible increase in the units of this bacteria, in the second and third hour of contact, suggesting desorption of a small amount of them from the external surfaces of sepiolite and sep-PCH. In any case, values remained practically constant after the first hour. These results indicate that the amount of adsorbed Salmonella in sepiolite was higher than that adsorbed in montmorillonite but smaller than that observed in saponite.
The difference in the sorption capacity of sepiolite-PCH compared with natural sepiolite may be due to the textural changes occurring during PCH synthesis. Natural sepiolite is characterized by the presence of structural cavities (ribbons and channels) with silanol groups on the external surface and different types of water molecules associated to these fibrous silicates [55]. During this synthesis, the fibers bundles were dismantled to form individual fibers increasing the specific surface area and pore volume, as indicates Table 1, and exposing new available surface to the Salmonella sorption, which may have a higher affinity because these new surfaces may have reactive silanol groups or broken bonds [55] capable of retaining the negative charge of Salmonella. This agrees with previous studies related to the effect of sepiolite on microbial in acid red soil [56].
The Salmonella adsorption capacity of sepiolite increased with the synthesis of the PCH:
sepiolite (0.46 × 10¹⁰ CFU g−1) < sep-PCH (1.06 × 10¹⁰ CFU g−1)

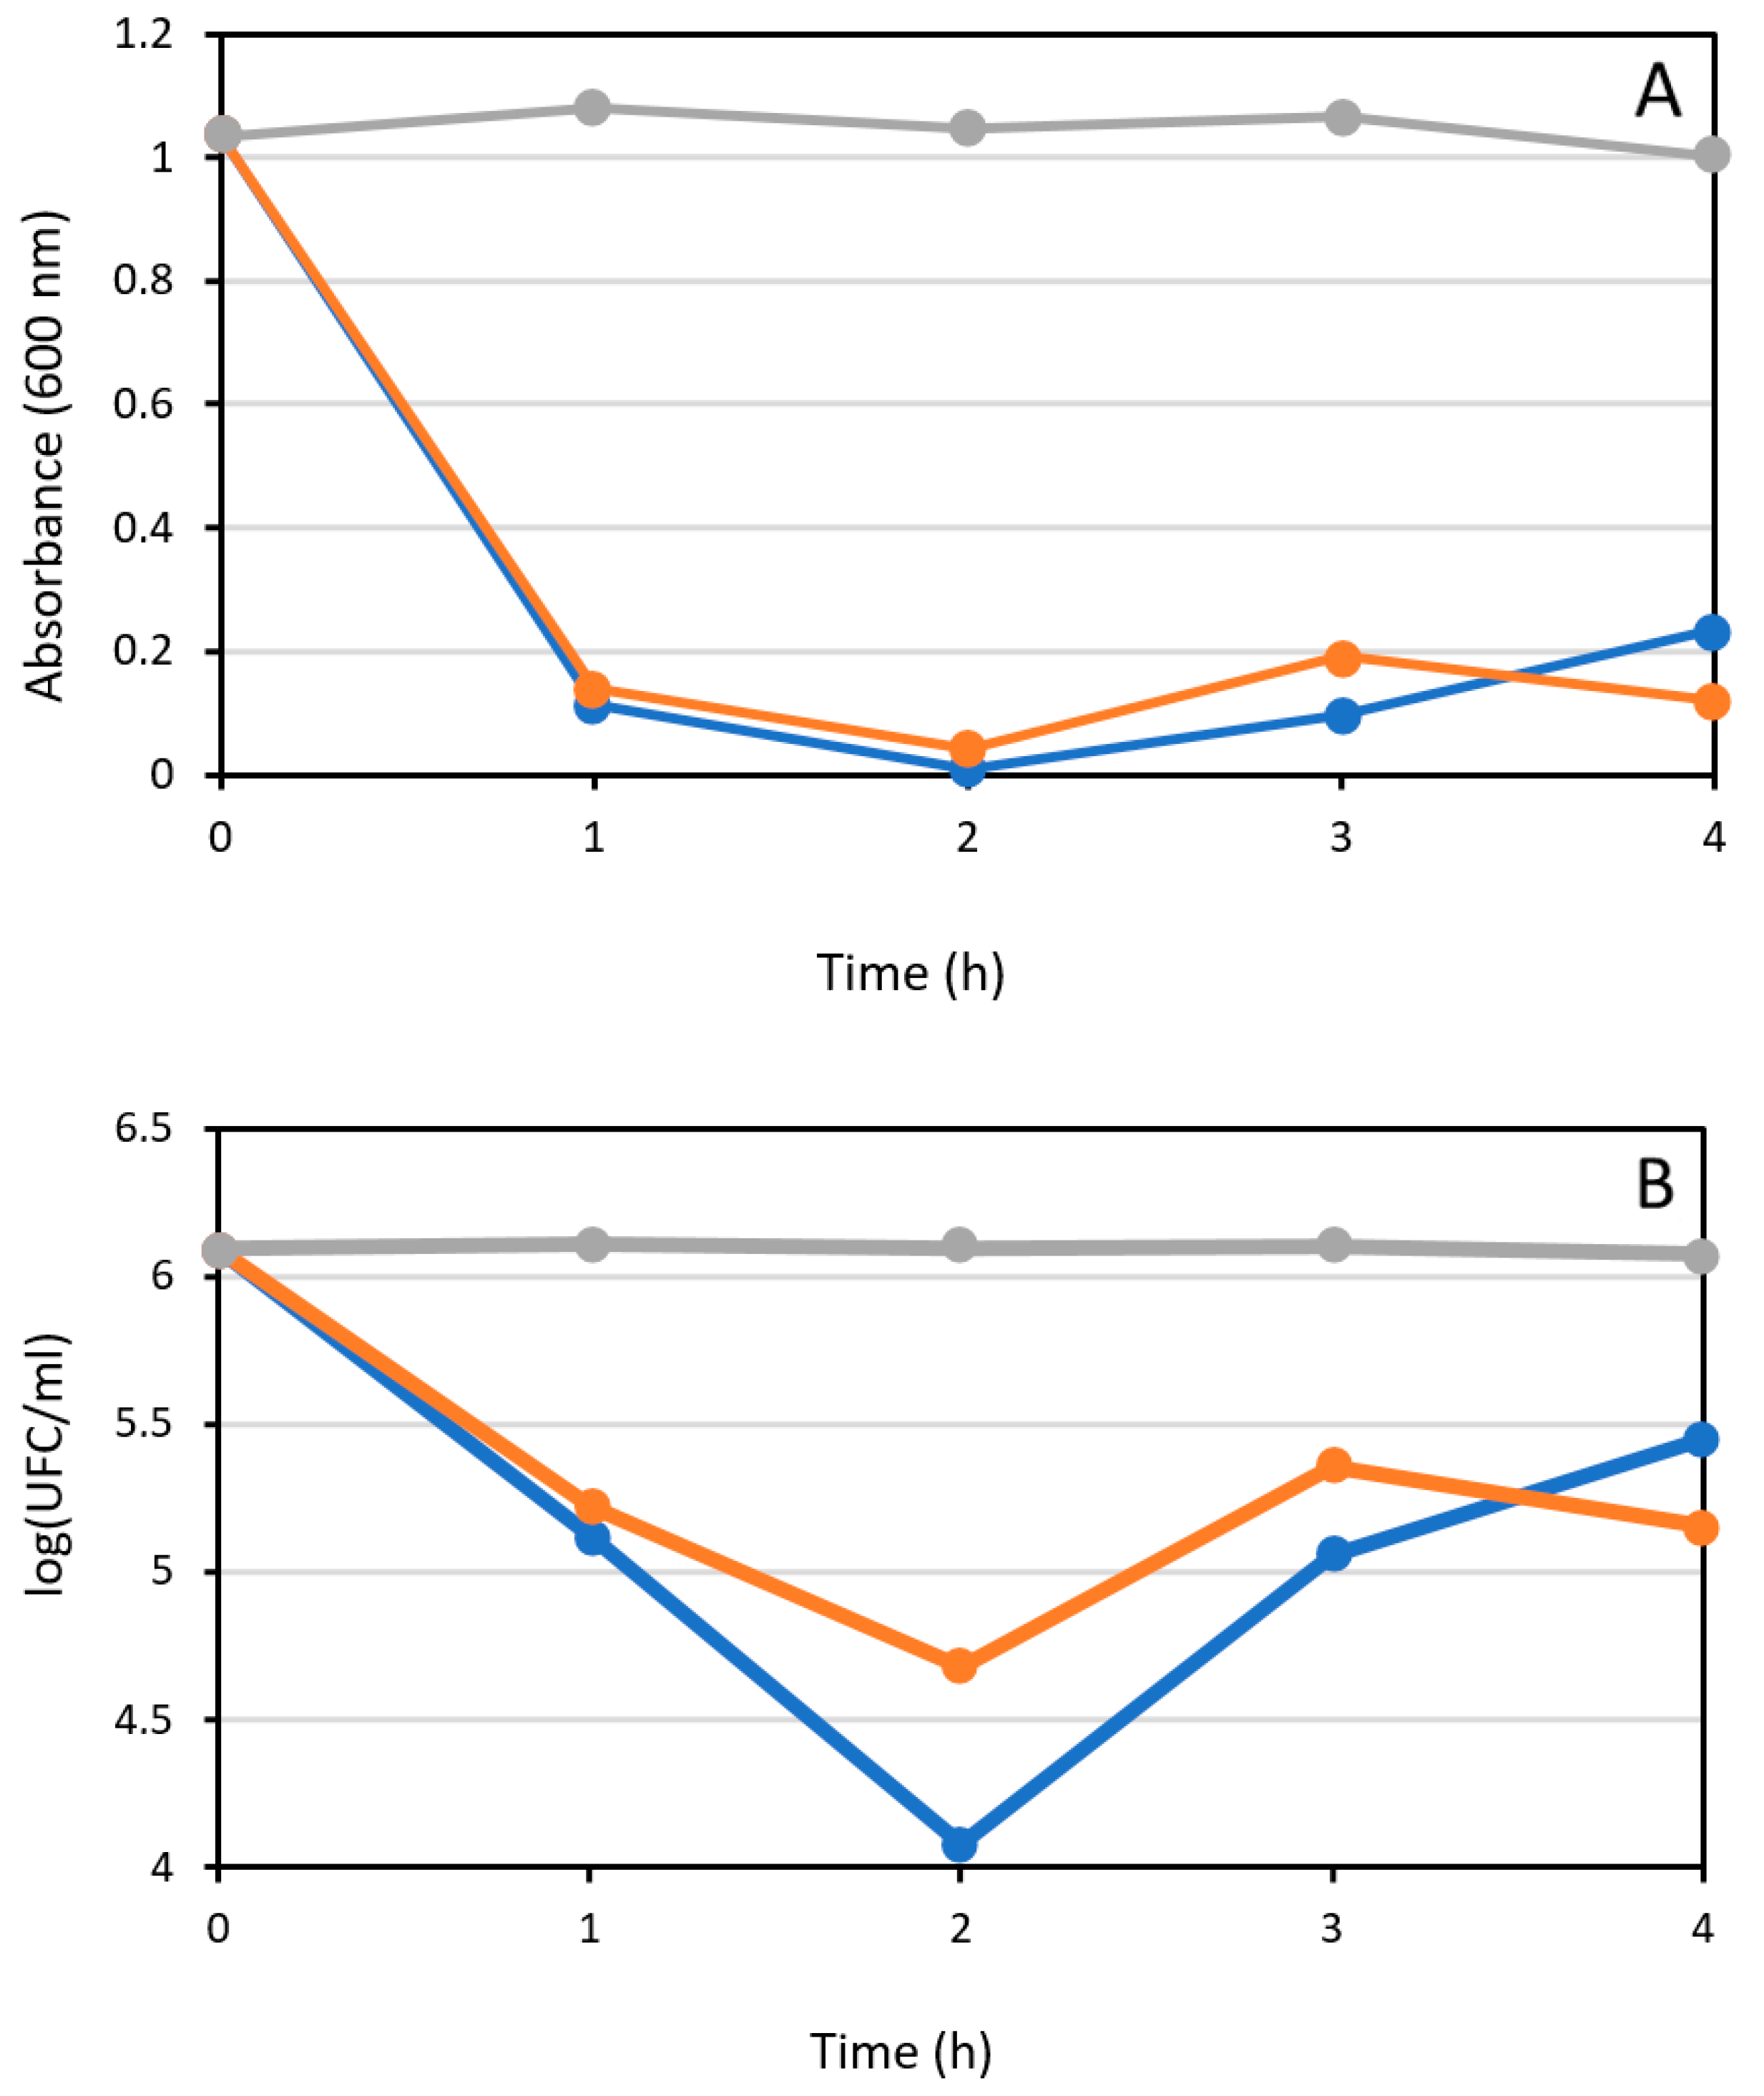
3.2.4. Adsorption Kinetics of Salmonella on Palygorskite and Pal-PCH

The case of Salmonella adsorption with palygorskite and its PCH is shown in Table 2. In this case, natural palygorskite (blue line) and pal-PCH (orange line) show similar kinetics of adsorption. In both cases, Salmonella was almost completely adsorbed during the first 2 h of contact showing the best selective Salmonella adsorption capacities of all the materials studied in this work, above all in the case of the natural mineral. In any case, the greatest adsorption occurred in the first hour, when absorbance values (Figure 12A) decreased from 1.034 to 0.112 or in concentration values from 106.09 to 105.13 (Figure 12B) with a removal close to 90%. At this time, Salmonella occupies the most accessible adsorption centers located in the external surface of both natural palygorskite and pal-PCH fibers (Figure 13) [56]. In the second hour, both sorbents adsorbed the remaining Salmonella units in the solution until values of absorbance reach close to 0. The greater time that these Salmonella units need to be adsorbed on the surface suggests that they are retained in more accessible places. Nevertheless, the size of the units of Salmonella prevents the adsorption in smaller pores.
Differences in the capacity of Salmonella adsorption may be due to the presence of a greater number of broken bonds or silanol groups on the external surface of the natural palygorskite, which can favor the electrostatic interaction with the surface of the Salmonella.
The Salmonella adsorption capacity of palygorskite decreased with the synthesis of the PCH:
palygorskite (1.52 × 10¹⁰ CFU g−1) > pal-PCH (1.48 × 10¹⁰ CFU g−1)
The results of this initial study show that all the materials analyzed had great salmonella adsorption capacities ranging from the lowest value observed in the mont-PCH sample (0.29 × 10¹⁰ CFU g−1) to the highest value observed in the natural palygorskite sample (1.52 × 10¹⁰ CFU g−1). However, the variations of this capacity between the starting materials and their derived seemed to be difficult to explain because these erratic variations do not show clearly defined trends (Figure 14).
An overview of the results suggests that the structural characteristics of the starting clays do not appear to be the controlling factor for the salmonella adsorption capacity. Thus, for example, smectite group minerals having very similar layered structures with an expandable interlayer space show very different adsorption capacities. However, given the large size of the Salmonella cells, in many cases larger than the size of the individual montmorillonite or saponite particles, it is unable to enter inside the interlayer space. Therefore, the adsorption of salmonella must occur mostly on the available external surface of aggregates of laminar particles of saponite or montmorillonite. For this reason, in the case of the smectite group minerals studied, the Salmonella adsorption capacity increased with the available external surface. Nevertheless, the availability of adsorption centers present on this external surface was strongly influenced by the volume of the pores. The adsorption centers located inside the micropores and nanopores were inaccessible due to the large size of the salmonella cell. For this reason, other things being equal, the Salmonella adsorption capacity seemed to depend on the external surface exposed in macropores of adequate size or on the outermost external surface of the aggregates of laminar particles. The smallest particle size of the natural saponite sample, observed by SEM (Figure 3), and its less compact distribution were the factors that lead to a greater adsorption capacity compared with that of montmorillonite.
On the other hand, we also find notable differences in the adsorption capacities of fibrous phyllosilicates: sepiolite and palygorskite. In this case, although the sepiolite had an external surface area (135 m2 g−1) significantly greater than that of the palygorskite (78 m2 g−1), the SEM study showed that the fibers morphologies of both minerals were similar. Since the cross-section of the structural channels of sepiolite and palygorskite were significantly smaller than the size of the Salmonella cells, it must only be adsorbed on the external surface of the fibers. For this reason, it would be expected that sepiolite, with a larger external surface than palygorskite, had a greater capacity for adsorption of Salmonella. Nevertheless, the opposite effect was observed. The Salmonella adsorption capacity of natural palygorskite was greater than that of sepiolite. In this case, in addition to the availability of the adsorption centers of the external surface of both minerals, we must take into account other characteristics such as the chemical nature of this external surface. Most of the adsorption mechanisms of these clay minerals are usually based on ion exchange reactions that preferentially adsorb cations. However, the Salmonella cells, like most gram-negative organisms, have a net negative charge [57]. This suggests that the interaction of salmonella with the external surface of the clay particles can occur through other types of active centers, such as silanol groups or structural defects in the grain edges generating charge deficits. The palygorskite usually has a large number of silanol groups on its external surface compared to the sepiolite [58], and this chemical characteristic controls the greater capacity of the palygorskite to retain salmonella.
The synthesis of PCH with the different clay minerals has a very diverse influence on the Salmonella adsorption capacities. In general, the textural modifications caused by the synthesis lead to the formation of new external surface (ranging between 134 and 235 m2 g−1) and to the formation of a large number of micropores whose small sizes makes them inaccessible to Salmonella cells. Much of the generated external surface is inside of those micropores so it is unable to adsorb Salmonella. Thus, for example, in the samples with greater increases in external surface, (saponite ΔSext = 165 m2 g−1 or palygorskite ΔSext = 168 m2 g−1), the synthesis of PCH did not produce an increase in the adsorption capacity. This result suggests that the new generated surface did not have appropriate adsorption centers to retain Salmonella cells. On the other hand, in the montmorillonite sample, the synthesis of PCH caused a decrease in Salmonella adsorption capacity from 0.50 × 10¹⁰ to 0.29 × 10¹⁰ CFU g−1 although there was an increase in the external surface area of 109 m2 g−1. This result suggests that some adsorption centers of the starting montmorillonite were possibly inactivated by an excess of the reagent that crystallizes on the montmorillonite-PCH particles. However, a different behavior shows the sepiolite-PCH sample. In this case, the synthesis of PCH produced an increase in the capacity of adsorption of salmonella from 0.46 × 10¹⁰ to 1.06 × 10¹⁰. This increase seemed to be related to the separation of fiber bundles that occurred during the synthesis of PCH observed in SEM micrographs (Figure 4). This separation made accessible new adsorption centers that were previously located inside the packages.

4. Conclusions

The results shown above suggest that the use of clays and their clay-based materials could be a suitable method to remove Salmonella from water. The ability of natural clays to adsorb increased in the following order:
montmorillonite (0.40 × 10¹⁰ CFU g−1) < sepiolite (0.46 × 10¹⁰ CFU g−1) < saponite (1.44 × 10¹⁰ CFU g−1) < palygorskite (1.52 × 10¹⁰ CFU g−1).
Whereas the capacity of the tested clay-based materials increased as follows:
mont-PCH (0.29 × 10¹⁰ CFU g−1) < sep-PCH (1.06 × 10¹⁰ CFU g−1) < sap-PCH (1.44 × 10¹⁰ CFU g−1) < pal-PCH (1.48 × 10¹⁰ CFU g−1)
Given the size of the Salmonella units, their adsorption in the clay particles occurred exclusively on the external surface of these natural and synthetic materials. Thus, it would expect a direct correlation between the external surface area and the amount of adsorbed Salmonella. This is true in the case of natural smectites (montmorillonite and saponite). However, the clays with a fibrous habit (sepiolite and palygorskite) did not show a correlation between the adsorption capacity and the external surface area. In addition, the spectacular surface increases obtained with the tested clay-based materials (PCH) did not carry similar increases in the adsorption of Salmonella because most of the new surface generated was not available for adsorption, since it was included in channels of sizes significantly smaller than those of Salmonella units.

Author Contributions

M.P.R. provided the samples for this work. F.F., M.Á.M. and J.A.C. conceived and designed the experimental research and reviewed background research. F.F. and J.A.C. supervised data acquisition and compilation. J.O., L.P. and M.D.-M. carried out the experiments, data reduction, and calculations. All authors contributed to the interpretation of the results as well as to the writing and editing of the paper. The authors have approved the submitted version and agree to be personally accountable for the authors’ own contributions and for ensuring that questions related to the accuracy or integrity of any part of the work, even ones in which the authors were not personally involved, are appropriately investigated, resolved, and documented in the literature. All authors have read and agreed to the published version of the manuscript.

Funding

The authors wish to thank the project BIA2017-82391-R for the financial support.

Acknowledgments

The authors are very grateful for the inestimable help of the reviewers who have significantly improved the article. The preparation of this paper is included within the activities of the RNM-199 and RNM-295 (Universidad de Málaga) and GPG-418 (Universidad Autónoma de Madrid, Geomaterials and Geological Processes) Research Groups.

Conflicts of Interest

The authors declare no conflicts of interest. The funding sponsors had no role in the design of the study; in the collection, analyses, or interpretation of data; in the writing of the manuscript, and in the decision to publish the results.

References

  1. Pichel, N.; Vivar, M.; Fuentes, M. The problem of drinking water access: A review of disinfection technologies with an emphasis on solar treatment methods. Chemosphere 2019, 218, 1014–1030. [Google Scholar] [CrossRef] [PubMed]
  2. Ma, X.; Zhou, W.; Fu, Z.; Cheng, Y.; Min, M.; Liu, Y.; Zhang, Y.; Chen, P.; Ruan, R. Effect of wastewater-borne bacteria on algal growth and nutrients removal in wastewater-based algae cultivation system. Bioresour. Technol. 2014, 167, 8–13. [Google Scholar] [CrossRef] [PubMed]
  3. Amin, M.T.; Alazba, A.A.; Manzoor, U. A review of removal of pollutants from water/wastewater using different types of nanomaterials. Adv. Mat. Sci. Eng. 2014. [Google Scholar] [CrossRef] [Green Version]
  4. Nieuwenhuijsen, M.J.; Grellier, J.; Smith, R.; Iszatt, N.; Bennett, J.; Best, N.; Toledano, M. The epidemiology and possible mechanisms of disinfection by-products in drinking water. Phil. Trans. R. Soc. 2009, 367, 4043–4067. [Google Scholar] [CrossRef]
  5. Villanueva, C.M.; Cantor, K.P.; Grimalt, J.O.; Malats, N.; Silverman, D.; Tardon, A.; Garcia-Closas, R.; Serra, C.; Carrato, A.; Castaño-Vinyals, G.; et al. Bladder cancer and exposure to water disinfection by-products through ingestion, bathing, showering, and swimming in pools. Am. J. Epidemiol. 2007, 165, 148–156. [Google Scholar] [CrossRef]
  6. Yuan, Q.B.; Guo, M.T.; Yang, J. Fate of antibiotic resistant bacteria and genes during wastewater chlorination: Implication for antibiotic resistance control. PLoS ONE 2015, 10, e0119403. [Google Scholar] [CrossRef]
  7. Wang, W.; Huang, G.; Jimmy, C.Y.; Wong, P.K. Advances in photocatalytic disinfection of bacteria: Development of photocatalysts and mechanisms. J. Environ. Sci. 2015, 34, 232–247. [Google Scholar] [CrossRef]
  8. Nassar, R.A.; Browne, E.P.; Chen, J.; Klibanov, A.M. Removing human immunodeficiency virus (HIV) from human blood using immobilized heparin. Biotechnol. Lett. 2012, 34, 853–856. [Google Scholar] [CrossRef] [Green Version]
  9. Jin, S.; Fallgren, P.H.; Morris, J.M.; Chen, Q. Removal of bacteria and viruses from waters using layered double hydroxide nanocomposites. Sci. Technol. Adv. Mater. 2007, 8, 67–70. [Google Scholar] [CrossRef] [Green Version]
  10. Deng, C.H.; Gong, J.L.; Zeng, G.M.; Niu, C.G.; Niu, Q.Y.; Zhang, W.; Liu, H.Y. Inactivation performance and mechanism of Escherichia coli in aqueous system exposed to iron oxide loaded grahene nanocomposites. J. Hazard. Mater. 2014, 276, 66–76. [Google Scholar] [CrossRef]
  11. Sharma, V.K.; McDonald, T.J.; Kim, H.; Grag, V.K. Magnetic graphene-carbon nanotube iron nanocomposite as adsorbents and antibacterial agents for water purification. Adv. Colloid Interf. Sci. 2015, 225, 229–240. [Google Scholar] [CrossRef] [PubMed]
  12. Otto, C.; Haydel, S. Microbicidal clays: Composition, activity, mechanism of action, and therapeutic applications. In Microbial Pathogens and Strategies for Combating Them: Science, Technology and Education; Méndez-Vilas, A., Ed.; Formatex Research Center: Badajoz, Spain, 2013; Volume 2, pp. 1169–1180. [Google Scholar]
  13. Muter, O.; Potapova, K.; Nikolajeva, V.; Petrina, Z.; Griba, T.; Patmalnieks, A.; Svinka, R.; Svinka, V. Comparative study on bacteria colonization onto ceramic beads originated from two Devonian clay deposits in Latvia. Mater. Sci. Appl. Chem. 2012, 26, 134–139. [Google Scholar]
  14. Hrenovic, J.; Ivankovic, T.; Tibljas, D. The effect of mineral carrier composition on phosphate-accumulating bacteria immobilization. J. Hazard. Mater. 2009, 166, 1377–1382. [Google Scholar] [CrossRef] [PubMed]
  15. Yuan, G.D.; Theng, B.K.G.; Churchman, G.J.; Gates, W.P. Clays and clay minerals for pollution control in handbook of clay science. In Handbook of Clay Science, 1st ed.; Bergaya, F., Theng, B.K.G., Lagaly, G., Eds.; Elsevier Science: Amsterdam, The Netherlands, 2006; Volume 1, pp. 625–675. [Google Scholar]
  16. Nieuwenhuijsen, M.J.; Toledano, M.B.; Eaton, N.; Fawell, J.; Elliott, P. Chlorination disinfection byproducts in water and their association with adverse reproductive outcomes: A review. Occup. Environ. Med. 2000, 57, 73–85. [Google Scholar] [CrossRef] [Green Version]
  17. Yang, H.; Zheng, Q. Structure stability of organic montmorillonite used for preparing polyethylene/montmorillonite nanocomposite. J. Mat. Sci. Lett. 2013, 22, 1431–1433. [Google Scholar] [CrossRef]
  18. Brigatti, M.F.; Galan, E.; Theng, B.K.G. Structures and Mineralogy of Clay Minerals. In Handbook of Clay Science, 1st ed.; Bergaya, F., Theng, B.K.G., Lagaly, G., Eds.; Elsevier Science: Amsterdam, The Netherlands, 2006; Volume 1, pp. 19–86. [Google Scholar]
  19. Su, C.; Li, W.; Chen, M.; Huang, Z.; Wu, L. Effect of iron-manganese-sepiolite as heterogeneous Fenton-like catalyst on the performance and microbial community of anaerobic granular sludge treatment system. Bioresour. Technol. 2016, 200, 1065–1072. [Google Scholar] [CrossRef] [PubMed]
  20. Cecilia, J.A.; García-Sancho, C.; Vilarrasa-García, E.; Jiménez-Jiménez, J.; Rodriguez-Castellón, E. Synthesis, characterization, uses and applications of porous clays heterostructures: A review. Chem. Rec. 2018, 18, 1–21. [Google Scholar] [CrossRef]
  21. Pires, J.; Bestilleiro, M.; Pinto, M.L.; Gil, A. Selective adsorption of carbon dioxide, methane and ethane by porous clays heterostructures. Sep. Purif. Technol. 2008, 61, 161–167. [Google Scholar] [CrossRef]
  22. Pinto, M.L.; Magra, L.; Guil, J.M.; Pires, J.; Rocha, J. Adsorption and activation of CO2 by amine-modified nanoporous materials studied by solid-state NMR and 13CO2 adsorption. Chem. Mater. 2011, 23, 1387–1395. [Google Scholar] [CrossRef]
  23. Pinto, M.L.; Pires, J. Porous and hybrid clay based materials for separation of hydrocarbons. Micropor. Mesopor. Mater. 2012, 151, 403–410. [Google Scholar] [CrossRef]
  24. Garea, S.A.; Mihai, A.I.; Ghebaur, A.; Nistor, C.; Sarbu, A. Porous clay heterostructures: A new inorganic host for 5-fluorouracil encapsulation. Int. J. Pharm. 2015, 491, 299–309. [Google Scholar] [CrossRef] [PubMed]
  25. Vilarrasa-García, E.; Cecilia, J.A.; Azevedo, D.C.S.; Cavalcante, C.L., Jr.; Rodríguez-Castellón, E. Evaluation of porous clay heterostructures modified with amine species as adsorbent for the CO2 capture. Micropor. Mesopor. Mater. 2017, 249, 25–33. [Google Scholar] [CrossRef]
  26. Aguiar, J.E.; Cecilia, J.A.; Tavares, P.A.S.; Azevedo, D.C.S.; Rodríguez Castellón, E.; Lucena, S.M.P.; Silva, I.J., Jr. Adsorption study of reactive dyes onto porous clay heterostructures. Appl. Clay Sci. 2017, 135, 35–44. [Google Scholar] [CrossRef]
  27. Chmielarz, L.; Piwowarska, Z.; Kustrowski, P.; Wegrzyn, A.; Gil, B.; Kowalczyk, A.; Dudek, B.; Dziembaj, R.; Michalik, M. Comparison study of titania pillared interlayered clays and porous clay heterostructures modified with copper and iron as catalysts of the DeNOx process. Appl. Clay Sci. 2011, 53, 164–173. [Google Scholar] [CrossRef]
  28. Soriano, M.D.; Cecilia, J.A.; Natoli, A.; Jiménez-Jiménez, J.; López-Nieto, J.M.; Rodríguez-Castellón, E. Vanadium oxide supported on porous clay heterostructure for the partial oxidation of hydrogen sulphide to sulfur. Catal. Today 2015, 254, 36–42. [Google Scholar] [CrossRef]
  29. Cecilia, J.A.; Arango-Díaz, A.; Franco, F.; Jiménez-Jiménez, J.; Storaro, L.; Moretti, E.; Rodríguez-Castellón, E. CuO-CeO2 supported on montmorillonite-derived porous clay heterostructures (PCH) for preferential CO oxidation in H2-rich stream. Catal. Today 2015, 253, 126–136. [Google Scholar] [CrossRef]
  30. Saboya, R.M.A.; Cecilia, J.A.; García-Sancho, C.; Luna, F.M.T.; Rodríguez-Castellón, E.; Cavalcante, C.L., Jr. WO3-based catalysts supported on porous clay heterostructures (PCH) with Si–Zr pillars for synthetic esters production. Appl. Clay Sci. 2016, 124, 69–78. [Google Scholar] [CrossRef]
  31. Solsona, B.; Concepción, P.; López Nieto, J.M.; Dejoz, A.; Cecilia, J.A.; Agouram, S.; Soriano, M.D.; Torres, V.; Jiménez-Jiménez, J.; Rodríguez Castellón, E. Nickel oxide supported on porous clay heterostructures as selective catalysts for the oxidative dehydrogenation of ethane. Catal. Sci. Technol. 2016, 6, 3419–3429. [Google Scholar] [CrossRef]
  32. Sanchís, R.; Cecilia, J.A.; Soriano, M.D.; Vázquez, M.I.; Dejoz, A.; López Nieto, J.M.; Rodríguez Castellón, E.; Solsona, B. Porous clays heterostructures as supports of iron oxide for environmental catalysis. Chem. Eng. J. 2018, 334, 1159–1168. [Google Scholar] [CrossRef]
  33. Cecilia, J.A.; Soriano, M.D.; Natoli, A.; Rodríguez-Castellón, E.; López Nieto, J.M. Selective oxidation of hydrogen sulfide to sulfur using vanadium oxide supported on porous clay heterostructures (PCHs) formed by pillars silica, silica-zirconia or silica-titania. Materials 2018, 11, 1562. [Google Scholar] [CrossRef] [Green Version]
  34. Cloos, P.; Bafot, C.; Herbillon, A. Interlayer formation of humin in smectites. Nature 1981, 289, 391–393. [Google Scholar] [CrossRef]
  35. Unuabonaha, E.I.; Ugwujaa, C.G.; Omorogiea, M.O.; Adewuyia, A.; Oladojab, N.A. Clays for Efficient Disinfection of Bacteria in Water. Appl. Clay Sci. 2018, 151, 211–223. [Google Scholar] [CrossRef]
  36. Cecilia, J.A.; García-Sancho, C.; Franco, F. Montmorillonite based porous clay heterostructures: Influence of Zr in the structure and acidic properties. Micropor. Mesopor. Mater. 2013, 176, 95–102. [Google Scholar] [CrossRef]
  37. Brunauer, S.; Emmett, P.H.; Teller, E. Adsorption of gases in multimolecular layers. J. Am. Ceram. Soc. 1938, 60, 309–319. [Google Scholar] [CrossRef]
  38. Lippens, B.C.; De Boer, J.H. Studies on pore systems in catalysis: V. The t method. J. Catal. 1965, 4, 319–323. [Google Scholar] [CrossRef]
  39. Park, S.H.; Sposito, G.; Sutton, R.; Greathouse, J.A. Density Functional Theory (DFT) Calculations on the Structures of 2:1 Clay Minerals; Lawrence Berkeley National Lab (LBNL): Berkeley, CA, USA, 2001. [Google Scholar]
  40. Zviagina, B.B.; McCarty, D.K.; Srodon, J.; Drits, V.A. Interpretation of infrared spectra of dioctahedral smectites in the region of OH-stretching vibrations. Clays Clay Miner. 2004, 52, 399–410. [Google Scholar] [CrossRef]
  41. Madejova, J. FTIR techniques in clay mineral studies. Vib. Spectrosc. 2003, 31, 1–10. [Google Scholar] [CrossRef]
  42. Farmer, V.C. The Infrared Spectra of Minerals; Mineralogal Society: London, UK, 1974; Volume 4, p. 539. [Google Scholar]
  43. Kloprogge, J.T.; Frost, R.L. Study of the thermal behavior of rectorite by in-situ infrared emission spectroscopy. Neues Jahrb. Mineral. Mon. 2000, 4, 145–157. [Google Scholar]
  44. van der Marel, H.W.; Beutelspacher, H. Atlas of Infrared Spectroscopy of Clay Minerals and their Admixtures; Elsevier Science: Amsterdam, The Netherlands, 1976; 396p. [Google Scholar]
  45. Bisio, C.; Gatti, G.; Boccaleri, E.; Marchese, L.; Superti, G.B.; Pastore, H.O.; Thommes, M. Understanding physico–chemical properties of saponite synthetic clays. Micropor. Mesopor. Mater. 2008, 107, 90–101. [Google Scholar] [CrossRef]
  46. Janin, A.; Maache, M.; Lavalley, J.C.; Joly, J.F.; Raatz, F.; Szydlowski, N. FT i.r. study of the silanol groups in dealuminated HY zeolites: Nature of the extraframework debris. Zeolites 1991, 11, 391–396. [Google Scholar] [CrossRef]
  47. Weitkamp, J. Zeolites and catalysis. Solid State Ion. 2000, 131, 175–188. [Google Scholar] [CrossRef]
  48. Franco, F.; Pozo, M.; Cecilia, J.A.; Benítez-Guerrero, M.; Lorente, M. Effectiveness of microwave assisted acid treatment on dioctahedral and trioctahedral smectites. The influence of octahedral composition. Appl. Clay Sci. 2016, 120, 70–80. [Google Scholar] [CrossRef]
  49. Frost, R.L.; Locos, O.B.; Ruan, H.; Kloprogge, J.T. Near-infrared and mid-infrared spectroscopic study of sepiolites and palygorskites. Vib. Spectrosc. 2001, 27, 1–13. [Google Scholar] [CrossRef]
  50. Frost, R.L.; Cash, G.A.; Kloprogge, J.T. “Rocky Mountain leather”, sepiolite and attapulgite-an infrared emission spectroscopic study. Vib. Spectrosc. 1998, 16, 173–184. [Google Scholar] [CrossRef]
  51. Suárez, M.; García-Romero, E. FTIR spectroscopic study of palygorskite: Influence of the composition of the octahedral sheet. Appl. Clay Sci. 2006, 31, 154–163. [Google Scholar] [CrossRef] [Green Version]
  52. Thommes, M.; Kaneko, K.; Neimark, A.V.; Olivier, J.P.; Rodriguez-Reinoso, F.; Rouquerol, J.; Sing, K.S.W. Physisorption of gases, with special reference to the evaluation of surface area and pore size distribution (IUPAC Technical Report. Pure Appl. Chem. 2015, 87, 1051–1069. [Google Scholar] [CrossRef] [Green Version]
  53. Landers, J.; Gor, G.; Neimark, A. Density functional theory methods for characterization of porous materials. Colloids Surf. A Physicochem. Eng. Asp. 2013, 437, 3–32. [Google Scholar] [CrossRef]
  54. Purdy, M.A.; Tenovuo, J.; Pruitt, K.M.; White, W.E., Jr. Effect of growth phase and cell envelope structure on susceptibility of Salmonella typhimurium to the lactoperoxidase-thiocyanate-hydrogen peroxide system. Infect. Inmun. 1983, 39, 1187–1195. [Google Scholar] [CrossRef] [Green Version]
  55. Ruiz-Hitzky, E.; Aranda, P.; Álvarez, A.; Santarén, J.; Esteban-Cubillo, A. Advanced materials and new applications of sepiolite and palygorskite. Develop. Clay Sci. 2011, 3, 393–452. [Google Scholar]
  56. Qin, X.; Huang, Q.; Liu, Y.; Zhao, L.; Xu, Y.; Liu, Y. Effects of sepiolite and biochar on microbial diversity in acid red soil from southern China. Chem. Ecol. 2019, 35, 846–860. [Google Scholar] [CrossRef]
  57. Dickson, J.S.; Koohmaraie, M. Cell Surface Charge Characteristics and Their Relationship to Bacterial Attachment to Meat Surfaces. Appl. Enviromental Microbiol. 1989, 832–836. [Google Scholar] [CrossRef] [Green Version]
  58. Galán, E. Properties and applications of palygorskite-sepiolite clays. Clay Miner. 1996, 31, 443–453. [Google Scholar] [CrossRef]
Figure 1. X-ray diffraction patterns of the raw montmorillonite, mont-porous clay heterostructure (PCH), raw saponite and sap-PCH. Acronyms: (Qtz: quartz, Fd: feldspar, Dol: dolomite, Gyp: gypsum).
Minerals 10 00130 g001
Figure 2. X-ray diffraction patterns of the raw sepiolite, sep-PCH, raw palygorskite and pal-PCH. Acronyms: (Qtz: quartz, Sm: smectite, Sep: sepiolite, Pal: palygorskite).
Minerals 10 00130 g002
Figure 3. SEM micrographs of the starting montmorillonite (a), mont-PCH (b), starting saponite (c) and sap-PCH (d).
Minerals 10 00130 g003
Figure 4. SEM micrographs of the starting sepiolite (a), sep-PCH (b), starting palygorskite (c) and pal-PCH (d).
Minerals 10 00130 g004
Figure 5. FT-IR spectra of the starting montmorillonite (a), mont-PCH (b), starting saponite (c) and sap-PCH (d).
Minerals 10 00130 g005
Figure 6. FT-IR spectra of the sepiolite (a), sep-PCH (b), palygorskite (c) and pal-PCH (d).
Minerals 10 00130 g006
Figure 7. N2 adsorption–desorption isotherms at −196 °C of the montmorillonite, saponite, sepiolite and palygorskite (A) and their respective PCHs (B).
Minerals 10 00130 g007
Figure 8. Pore size distribution, estimated by the Density functional theory (DFT) method of the raw montmorillonite, saponite, sepiolite and palygorskite (A) and their respective PCHs (B).
Minerals 10 00130 g008aMinerals 10 00130 g008b
Figure 9. Adsorption kinetics of Salmonella on montmorillonite and mont-PCH measured in absorbance (A) and concentration (B). The three treatments are: control (grey line), montmorillonite (blue line) and montmorillonite-PCH (orange line).
Minerals 10 00130 g009aMinerals 10 00130 g009b
Figure 10. Adsorption kinetics of Salmonella on saponite and sap-PCH measured in absorbance (A) and concentration (B). The three treatments are: control (grey line), saponite (blue line) and saponite-PCH (orange line).
Minerals 10 00130 g010aMinerals 10 00130 g010b
Figure 11. Adsorption kinetics of Salmonella on sepiolite and sep-PCH measured in absorbance (A) and concentration (B). The three treatments are: control (grey line), sepiolite (blue line) and sepiolite-PCH (orange line).
Minerals 10 00130 g011aMinerals 10 00130 g011b
Figure 12. Adsorption kinetics of Salmonella on palygorskite and pal-PCH measured in absorbance (A) and concentration (B). The three treatments are control (grey line), palygorskite (blue line) and pal-PCH (orange line).
Minerals 10 00130 g012
Figure 13. SEM images of Salmonella units adsorbed on the external surface of palygorskite (a) and pal-PCH (b).
Minerals 10 00130 g013
Figure 14. Salmonella adsorption capacity variations vs. external surface of the sorbent.
Minerals 10 00130 g014
Table 1. Textural properties of the raw clays and their respective PCHs.
SampleSBET
(m2 g−1)
t-Plot
(m2 g−1)
Sext
(m2 g−1)
Vp
(cm3 g−1)
Vmicrop.
(cm3 g−1)
Montmorillonite5025250.05390.0116
Saponite12474510.11510.0341
Sepiolite182471350.34580.0215
Palygorskite9214780.20030.0060
mont-PCH6835481340.57540.2572
sap-PCH6834682160.58310.2539
sep-PCH7685332350.57480.2837
pal-PCH6123662460.55010.1992
Table 2. Values of absorbance and corresponding Salmonella concentration (CFU mL−1) after the addition of the different clay minerals and PCH-materials.
Time (h)Absorbance (600 nm)Log (CFU mL−1)
ControlMontmorilloniteMont-PCHControlMontmorilloniteMont-PCH
01.0341.0341.0346.0906.0906.090
11.0800.9250.9016.1106.0406.030
21.0470.8120.9126.1005.9906.040
31.0660.7950.8926.1005.9806.030
41.0000.7640.8416.0805.9606.000
Time (h)Absorbance (600 nm)Log (CFU mL−1)
ControlSaponiteSap-PCHControlSaponiteSap-PCH
01.0341.0341.0346.0906.0906.090
11.0800.1200.1316.1095.1555.193
21.0470.0660.0636.0964.8954.875
31.0660.0730.1466.1044.9395.240
41.0000.1440.1286.0765.2345.183
Time (h)Absorbance (600 nm)Log (CFU mL−1)
ControlSepioliteSep-PCHControlSepioliteSep-PCH
01.0341.0341.0346.0916.096.090
11.0800.7260.3956.1095.9375.672
21.0470.7930.4516.0965.9755.730
31.0660.7910.4116.1045.9745.690
41.0000.7610.3256.0765.9575.588
Time (h)Absorbance (600 nm)Log (CFU mL−1)
ControlPalygorskitePal-PCHControlPalygorskitePal-PCH
01.0341.0341.0346.0916.0916.091
11.0800.1120.1396.1095.1255.219
21.0470.0100.0406.0964.0764.678
31.0660.0960.1916.1045.0585.357
41.0000.2340.1206.0765.4455.155

