Article

Molecular Modeling of Ammonia Gas Adsorption onto the Kaolinite Surface with DFT Study

1
College of Earth and Planetary Science, University of Chinese Academy of Science, Beijing 100049, China
2
Key Laboratory of Computational Geodynamics, Chinese Academy of Sciences, University of Chinese Academy of Sciences, Beijing 100049, China
3
College of Engineering, City University of Hong Kong, Hong Kong 999077, China
4
School of Earth Sciences and Engineering, Sun Yat-sen University, Guangzhou 510275, China
*
Authors to whom correspondence should be addressed.
Minerals 2020, 10(1), 46; https://doi.org/10.3390/min10010046
Submission received: 25 November 2019 / Revised: 23 December 2019 / Accepted: 28 December 2019 / Published: 2 January 2020
(This article belongs to the Special Issue The Universal Application of Clay Minerals)

Abstract

:
With high porosity and being one of the most abundant clay minerals, dried kaolinite may be an excellent adsorbent to remove ammonia gas (NH3). Here, the plane wave pseudopotential method based on density functional theory (DFT) was used to explore the mechanism of ammonia gas adsorption on the dried kaolinite, the Mulliken electric charge, and the partial density of states of atoms of the NH3/kaolinite (001) system. NH3 adsorption on kaolinite can happen in three different type adsorption positions: “top”, “bridge” and “hollow”. The “hollow” position is enclosed by two "upright" hydroxyl groups perpendicular to the (001) surface of kaolinite and a "lying" hydroxyl group parallel to the surface. At this position, the adsorption is the most stable and has the highest adsorption energy. The nitrogen atom of the NH3 molecule bonds with the hydrogen atom in the "upright" hydroxyl group on the (001) surface and its hydrogen atom forms HN…O hydrogen bond with oxygen atom in the "lying" hydroxyl group, which leads to the NH3 stably adsorbed on kaolinite (001) surface. A small part of electrons transfer between NH3 molecules and kaolinite creates weakly electrostatic adsorption between them.

1. Introduction

Sulfate, nitrate, and ammonium are the main chemical components of the increasing smog weather. Increasing atmospheric pollution caused by gases such as ammonia gas has been proven to be a global problem, and received widespread attention [1,2]. Due to the large amount of industrial exhaust emissions, domestic pollutants, and livestock farming, ammonia gas produced by these pollutants has increased dramatically, and the volatilization from decomposing livestock waste are the main sources of NH3 in the atmosphere [3,4]. As a colorless and irritating alkaline gas with low volatility, NH3 is the most abundant alkaline trace gas in the atmosphere and also the third most nitrogen-containing gas after N2 and NO2 [5]. The phenomena involved in the atmospheric circulation of NH3 are complex in nature. At normal temperatures, pressures, and alkaline conditions, the equilibrium gas phase concentration of ammonia in dilute solution of ammonia + ammonium obeys Henry’s law and agrees well with the NBS thermodynamic data, its concentration is about 0.002–0.10 M [6,7]. Ammonia gas can cause serious pollution to the environment and seriously damages human skin tissue and respiratory system. When ammonia gas concentration reaches 0.5–1.0 mg/m3, it can be felt by the human body and adheres to human skin tissue to absorb water from skin tissue and destroy the structure of proteins, thereby destroy cells [8], which make ammonia gas to be one of the common problems faced by all countries in the world.
As a means of treating gas emissions, adsorption is effective even at low contaminant levels and can recover contaminants by desorption [9]. For ammonia gas, even if the equipment is simple, it can be effectively removed by the adsorption method and the useful components can be recovered [10,11]. Previous studies have included clay minerals, activated carbon, zeolites, alumina and so on [12,13,14,15,16,17,18]. For kaolinite, one of the most abundant components in clay minerals [19,20], many previous researches have been conducted about its surface absorption of the CO2, methane, ammonia ions and heavy metals [21,22,23,24,25,26,27,28], but few studies have dealt with the adsorption mechanism of ammonia gas on kaolinite.
In this paper, the first-principles density functional theory (DFT) [29,30] was used to study the adsorption mechanism of ammonia gas on the surface of kaolinite. The electronic distribution difference of the mineral surface before and after adsorption, the adsorption amount of adsorbed ammonia on the surface of kaolinite and the interaction between atoms in the adsorption process were obtained in order to explore the microscopic mechanism during adsorption. This study may help to reveal the microscopic coupling mechanism between gas and solid.

2. Calculational Methods and Models

2.1. Computational Methods

The calculation is based on the density functional theory (DFT) [31,32], local density approximation (LDA) [33] and general gradient approximation (GGA) [34] are used to approximate the exchange-associated energy. The Perdew-Burke-Ernzerhof (PBE) functional has high accuracy in the hydrogen bond description [35] and is used to model the electron exchange and correlation interaction within the GGA.
The Cambridge Sequential Total Energy Package (CASTEP) module was used to optimize the initial unit cell of kaolinite [36,37], and different exchange correlation functions and plane wave cut off energy was selected to determine its simulation optimization data. Density Function Theory-Dispersion force correction (DFT-D) [38] is performed on the basis of exchanging associated functionals to balance the strong van der Waals forces in the system. The interaction between electrons and ions is described by UltraSoft Pseudo Potential (USPP) [39,40]. The valence electrons in the calculation of the pseudo-potentials involved in the calculation are H-1s; O-2s22p4; Al-3s23p1; Si-3s23p2. The atomic position optimization algorithm uses Broyden-Fletcher-Goldfarb-Shanno (BFGS) [41]. The Brillouin zone integral uses the Monkhorst-Pack [42] method. The positions of all the atoms in the calculation are relaxed according to Hartee-Fork [43] in the reciprocal space, and the k-point grid is set to (4 × 2 × 3). The whole process uses a cut off energy of 400 eV. The self-consistent field (SCF) [44] convergence accuracy is 2.0 × 10⁻⁶ eV/atom, and the optimal convergence criterion of the total energy change of the system is set to 1.0 × 10⁻⁵ eV/ Atom. The maximum force between atoms is 0.05 eV/Å, the maximum internal stress between atoms is 0.1 GPa, and the maximum displacement between atoms is 0.002 Å. The calculated lattice parameters and cell angles and Bish’s experimental results [45] are shown in Table 1, and the calculated data are consistent with the experimental data.

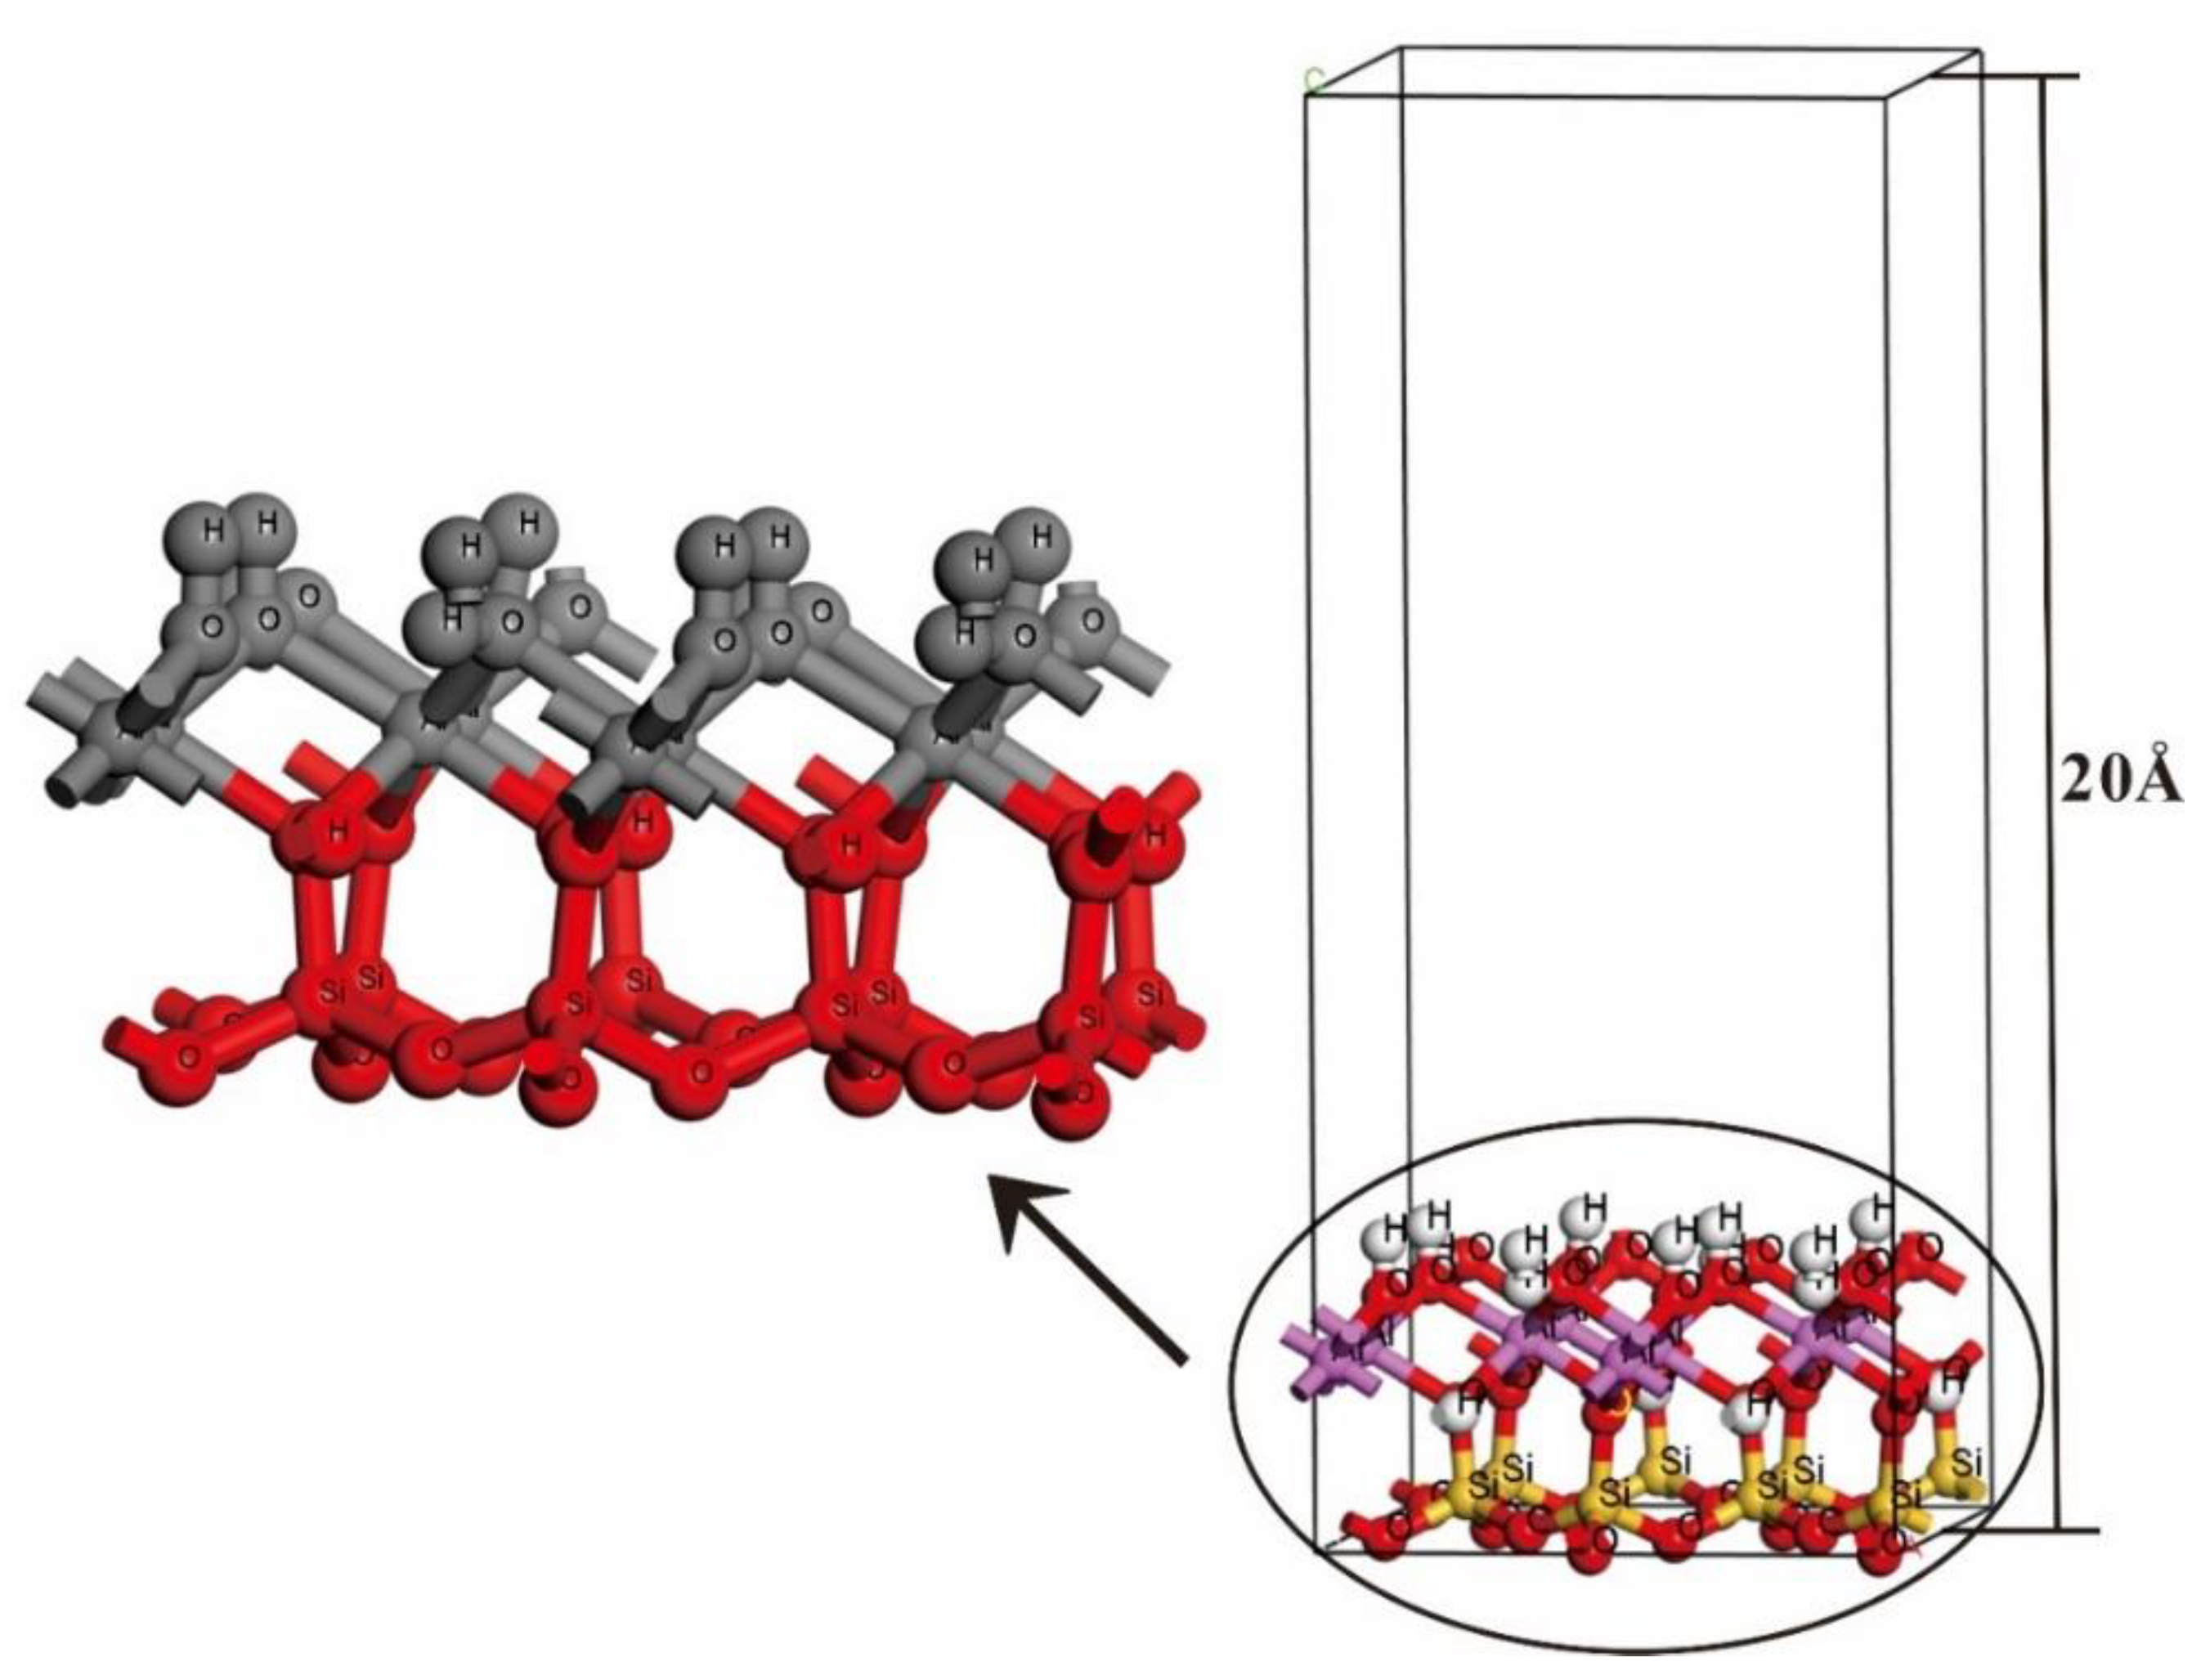
2.2. Computational Models

Kaolinite is a layered aqueous aluminosilicate mineral with a triclinic system and belongs to the 1:1 type dioctahedral clay mineral. Its crystal structure is Al4[Si4O10](OH)8. The basic unit of kaolinite consists of a SiO4 tetrahedral layer and an AlO2(OH)4 octahedral layer with its tetrahedron and octahedron interconnected by common oxygen ions, and its unit layers are connected to each other by a hydrogen bond with a van der Waals force between the molecules. A 2 × 1 × 1 kaolinite supercell model is established by expanding the well-optimized kaolinite bulk twice in the a-axis direction, which contains 68 atoms: 8Al, 8Si, 36O, 16H. The large monolayer of the kaolinite model consists of six atomic “sublayers”, which are H–O–Al–O–Si–O from top to bottom. The upper three layers constitute the “Alumina layer”, and the lower three layers constitute the “Silica layer” (Figure 1a). From the kaolinite (001) surface, the hydroxyl group on its inner surface could be two types: one third “lying” hydroxyl (OlH) oriented parallel to the kaolinite (001) surface and two thirds “upright” hydroxyls (OuH) oriented perpendicularly to the surface (Figure 1b).
The kaolinite crystal can be cleaved in three directions of (001), (010) and (110) planes [46,47], among which the layer (001) is the most cleavable and the surface of layer (001) should be the largest proportion of the total surface area of the kaolinite particles for adsorption [48], so the subsequent studies were focused on this surface. For calculating the NH3 adsorption on kaolinite surface, the lower part of the O–Si–O three sub-layers (silicon oxide layer) of this monolayer surface model is fixed, the upper part of the H–O–Al three sub-layers (aluminum oxide layer) is relaxed, and a 20 Å vacuum layer on the surface model (Figure 2) was built.
Similar to Hu [49] and Zhao [26], three categories of NH3 adsorption position of were established on the kaolinite surface (Figure 3) based on the configuration and symmetry of the relaxed (001) surface of kaolinite. They are “top” positions (the adsorbed atom N directly above the active atom O), “bridge” positions (the adsorbed atom N between the two active atoms O) and “hollow” positions (the adsorbed atom N is bounded by three or more active atoms O). Considering the adsorption properties of NH3, the “top”, “bridge” and “hollow” positons have three, three and four different adsorption positions respectively. Since NH3 has no periodicity, build a 15 × 15 × 15 Å3 periodic cell to optimize NH3 molecular which is placed in the center of the cell. The model parameters used in the optimization of the kaolinite surface model are from the optimized kaolinite unit cell of this study.

3. Results and Discussion

3.1. Adsorption Energy and Stable Adsorption Configuration

The adsorption energy can reveal the adsorption stability of NH3 on the surface of kaolinite quantitatively, and the adsorption energy can be calculated as Equation (1):
Eads = Eadsorbate/slabEadsorbateEslab
Among them, Eads is the adsorption energy of NH3 on the surface of kaolinite; Eadsorbate/slab is the total energy of NH3 on the surface of kaolinite; Eadsorbate is the total energy of NH3 before adsorption and Eslab is the total energy of the kaolinite surface. If the adsorption energy is negative, it means that adsorption can occur, and the larger the absolute value of negative value, the more stable the adsorption. Thus, the adsorption configuration optimization is to find the adsorption configuration where the adsorption energy is the lowest. In this process, unfixed atoms change their positions, which makes the distance between the atoms change, until the convergence criterion of the calculation setting is satisfied. The adsorption energies corresponding to different adsorption positions were listed in Table 2.
The calculated adsorption energies of three different adsorption positions show that the adsorption capacity of the “hollow” (the site of the adsorbed atom N among three active atoms O) is the largest, which indicates that the “hollow” positions of the three positions are the most stable adsorption positions for NH3 on the kaolinite surface. The adsorption of “top” position is relatively weak. For “hollow” positions, the best adsorption position in is “hollow1”, and its adsorption energy is 0.54 eV, which means that NH3 adsorption is the most stable here. The “Hollow1” is the middle position of a triangle, which surrounded by two “upright” hydroxyl groups perpendicular to the surface of kaolinite and a “lying” hydroxyl group parallel to the surface of kaolinite, and the “lying” direction of the H atom in the “lying” hydroxyl group is closest to the N atom in NH3. The lowest adsorption energy in the “hollow” position is “hollow4” where H atom in the “lying” hydroxyl group is the farthest from the N atom in NH3, and its adsorption energy is 0.27 eV. It seems that the distance between the H atom in the “lying” hydroxyl group and the N atom in NH3 has a decisive influence on the adsorption energy. The closer distance between the H atom in the “lying” hydroxyl group and the N atom in NH3, the greater adsorption energy of NH3 adsorbed on the surface. For “top” and “bridge” adsorption, the most stable adsorption positions are “Top2” and “Bridge3” respectively, and their corresponding adsorption energies are 0.45 eV and 0.52 eV.
Figure 4 is the atom positional changes of kaolinite and NH3 before and after their adsorption of the “hollow1” with the largest adsorption energy and the “top1” with the lowest adsorption energy. NH3, which originally located in “hollow1”, shifted to “bridge2” after adsorption, and the N atom of NH3 is closer to the kaolinite surface “vertically”. HN1, HN2 and HN3 are the H atoms of NH3 molecure, they are far from the surface. All the H atoms of the hydroxyl group on the surface of kaolinite are gathered in the direction of the middle N atom (Figure 4A,a). The position of NH3 adsorbed on “Top1” was nearly unchanged before and after adsorption, and the surface of kaolinite did not change greatly (Figure 4B,b). So, the larger the adsorption energy, the greater the NH3 positional shift, and the stronger the reaction with the adsorbent.

3.2. Bond and Mulliken Electric Charge

Kaolinite crystals are electrically neutral, but the surface electrical properties of the kaolinite crystal faces are not, thus the surface of the kaolinite crystal may be the ability to catch the NH3 molecules to balance their own electrical properties. Similarly, the atomic charge distribution inside the mineral crystal before and after adsorption may different and can be used to reveal the adsorption mechanism. Here, the most stable adsorption points of these three adsorption positions “top”, “bridge”, and “hollow” were selected to understand the change of atomic charge distribution and bond change after NH3 adsorption on kaolinite (001) surface. Table 3 lists the longest and shortest N–H bond lengths, the largest and smallest H–N–H angles of NH3 molecular adsorbed on “top2”, “bridge3”, and “hollow1” of the kaolinite surface. All the N–H bond lengths after adsorption are shorter than before (1.110 Å), and the longest N–H bond length is always the N–HN1 bond. The longest bond N–H lengths corresponding to the “top2”, “bridge3” and “hollow1” are 1.030 Å, 1.033 Å and 1.036 Å, respectively. With the increase of adsorption energy, lengths of the longest and the shortest N-H bond are all increases. It demonstrates that the strongest repelling by H atoms on the kaolinite (001) surface results in the largest change of N–HN1 bond. All H–N–H bond angles after adsorption are smaller than before (109.471°), and under the action of H atom of the kaolinite surface, H–N–H structure shift to the vacuum zone. The maximum H–N–H bond angles are all HN1–N–HN2, which are 107.885°, 108.112° and 108.550° respectively. The smallest bond angles were affected less by H atoms of the kaolinite surface, and decrease 2.203°, 3.249° and 2.965° after adsorption.
The Mulliken population can show the charge distribution of the overlapping regions between the bonding atoms (the relevant atomic orbitals), and the charge distribution of each atomic orbital, so the relative value of the atomic charge generated by the Mulliken population may provide useful information for the charge transfer and bond strength between different atoms [37]. The larger population between bonds is, the stronger bonding is. The N–H bonds became shorter and the population value between the N–H bonds became about 0.65 larger after adsorption, showing a significant covalent effect. Table 4 and Figure 5 show the change of Mulliken population between the atomic bonds of NH3 after adsorption on the kaolinite (001) surface of “Top2”, “Bridge3” and “Hollow1”. The population between the N–H atoms shows positive, negative and zero values. Usually, the bond between atoms contains a bond or an anti-bond orbit and the contribution of the bond orbit is positive, while the contribution of the anti-bond orbit is negative. If the bond orbit is mainly filled, the Mulliken population between the N–H bonds was positive and contributes to bonding between atoms, or else it is a negative value, and no bonding between atoms. The combination of the N atom of NH3 with the H atom of the surface of kaolinite has a big impact on the electron arrangement of orbits. For the “Top2” adsorption position, the Mulliken population between the N atom of NH3 and the H1 atom of the kaolinite just is 0.09, and they can form an N–H1 bond. For the “Bridge3” position, the N atom of NH3 interacted with two different H atoms of the kaolinite surface, H2 and H3, their population values are 0.06 and −0.01 respectively. It’s worth noting that only the N atom and the H2 atom can form an N–H2 bond. For the “hollow1” position, the N atom of NH3 interacted with three different H atoms of the kaolinite surface—H1, H2 and H3, their population values are 0.06, 0.02, and −0.02 respectively, so they can only form N–H1 and N–H2 bonds. In addition, the Mulliken population between HN1 and O3 is 0.03, and can then form hydrogen bond.
After adsorbing NH3 on the kaolinite (001) surface, the Mulliken populations between N atoms of NH3 and H atoms in the “upright” hydroxyl (OuH) perpendicular to the kaolinite surface are positive, but the population between N atoms and H atoms in the “lying” hydroxyl (OlH) parallel to the kaolinite surface is negative. This indicated that there is a tendency for the N atom to form an N–H bond with the H atom in the “upright” hydroxyl group (OuH). For the “lying” hydroxyl (OlH), the O atom exposed to the surface due to the “recumbent” of the H atom has a tendency to form hydrogen bonds with the H atoms closest to NH3. The N–H bond length after adsorption is significantly shorter.
The electron density difference between adjacent atoms can describes the electron rearrangement and the electron transfer before and after surface adsorption. The “Hollow1” site has the largest adsorption energy in NH3/kaolinite system and Figure 6 plots the electron density difference of “Hollow1” site before and after surface adsorption. In Figure 6, the yellow region between atoms represents the accumulation of electrons, and the blue region represents the depletion of electrons, and the color distribution showed a significant electron density depletion around the N atom and accumulates around H1 and H2, while the electron density around the HN1 atom accumulates and the electron density around the O3 atom is consumed.
Table 5 lists the charge of atoms’ Mulliken populations before and after NH3 adsorption on “Hollow1” of (001) surface of kaolinite, including the N and H atoms of NH3 and the H and O atoms of the kaolinite surface. H1 and H2 are the hydrogen atoms in “upright” hydroxyl group that bonded with N atom of NH3, and the exposed oxygen atom (O3) in the “lying” hydroxyl group forms a hydrogen bond with HN1 of NH3 (Figure 5). Before adsorption, the charges of N and H atoms in the initial adsorbent NH3 were respectively −1.23e and 0.41e, and the charges of H1, H2 and O3 on the surface of the initial adsorbent kaolinite were respectively 0.45e, 0.46e and −1.05e. After the adsorption reaction, the charge of each atom changes.
In Table 5, a positive value means that electrons are lost, while a negative value means that electrons are gain. In NH3, the N atom loses 0.05 electrons, in which the N 2s orbitals provide 0.02 electrons and the N 2p orbitals provide 0.03 electrons. The lost electrons of NH3 are transferred to H1 and H2 on the kaolinite surface, resulting in H1 charge changes from 0.45 to 0.43 and H2 from 0.46 to 0.45. The HN1 atom of NH3 obtains 0.02e form the 2p orbitals of O3 atom on the surface of kaolinite, which results in the charge change of O3 from −1.05e to −1.02e. A small part of the electron transference between ammonia molecules and kaolinite results in weakly electrostatic adsorption between them.

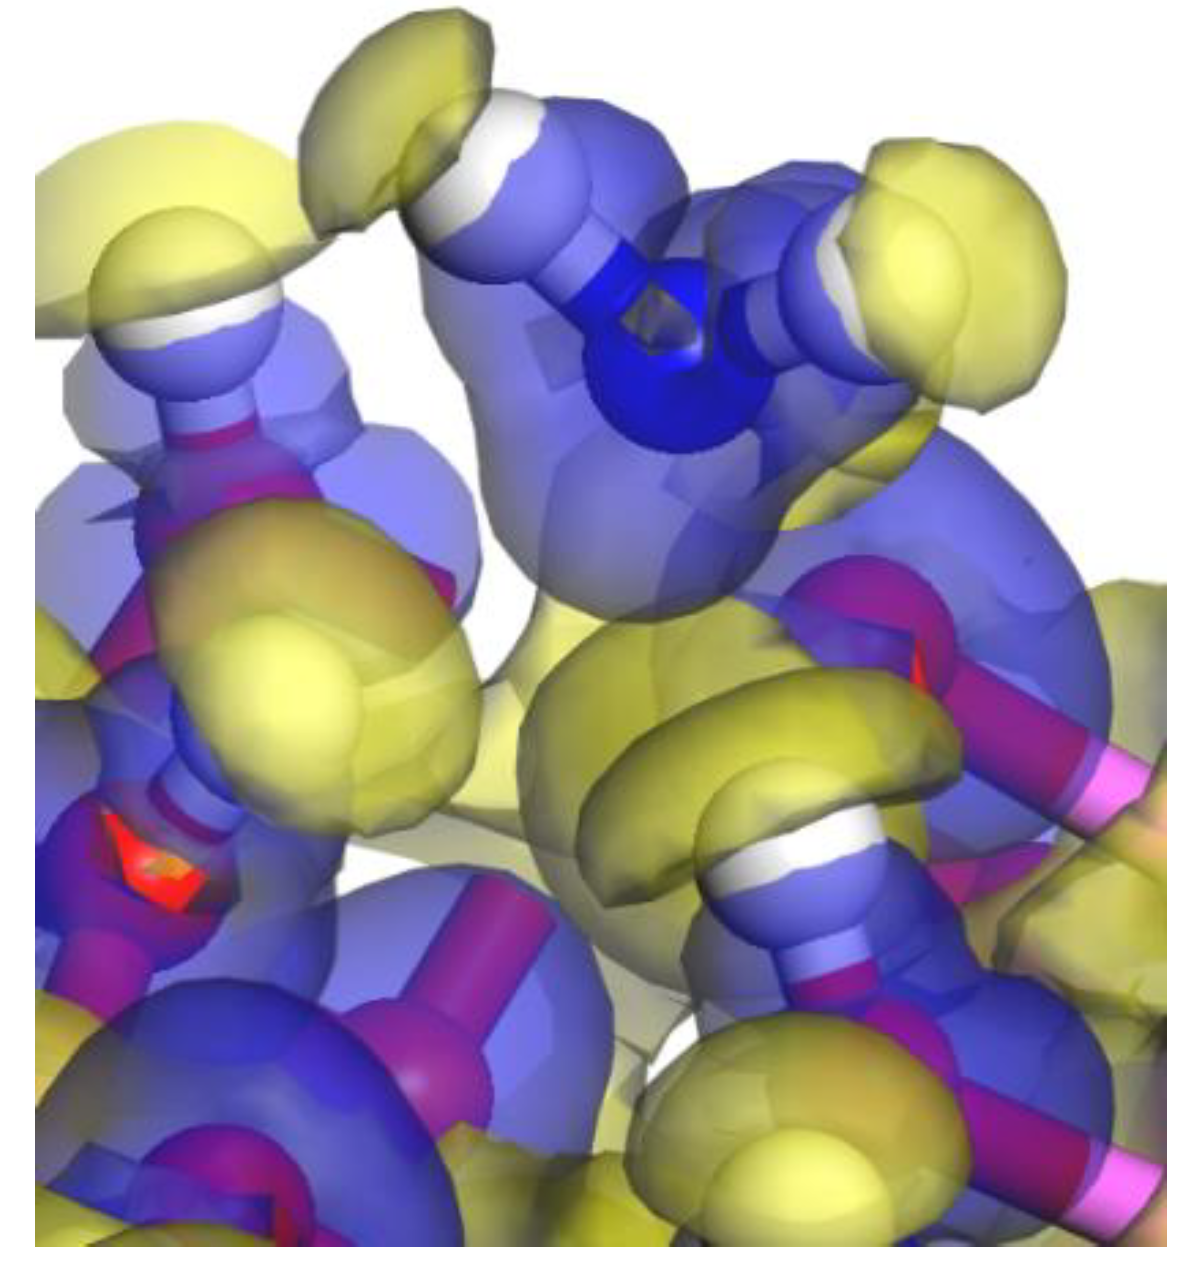
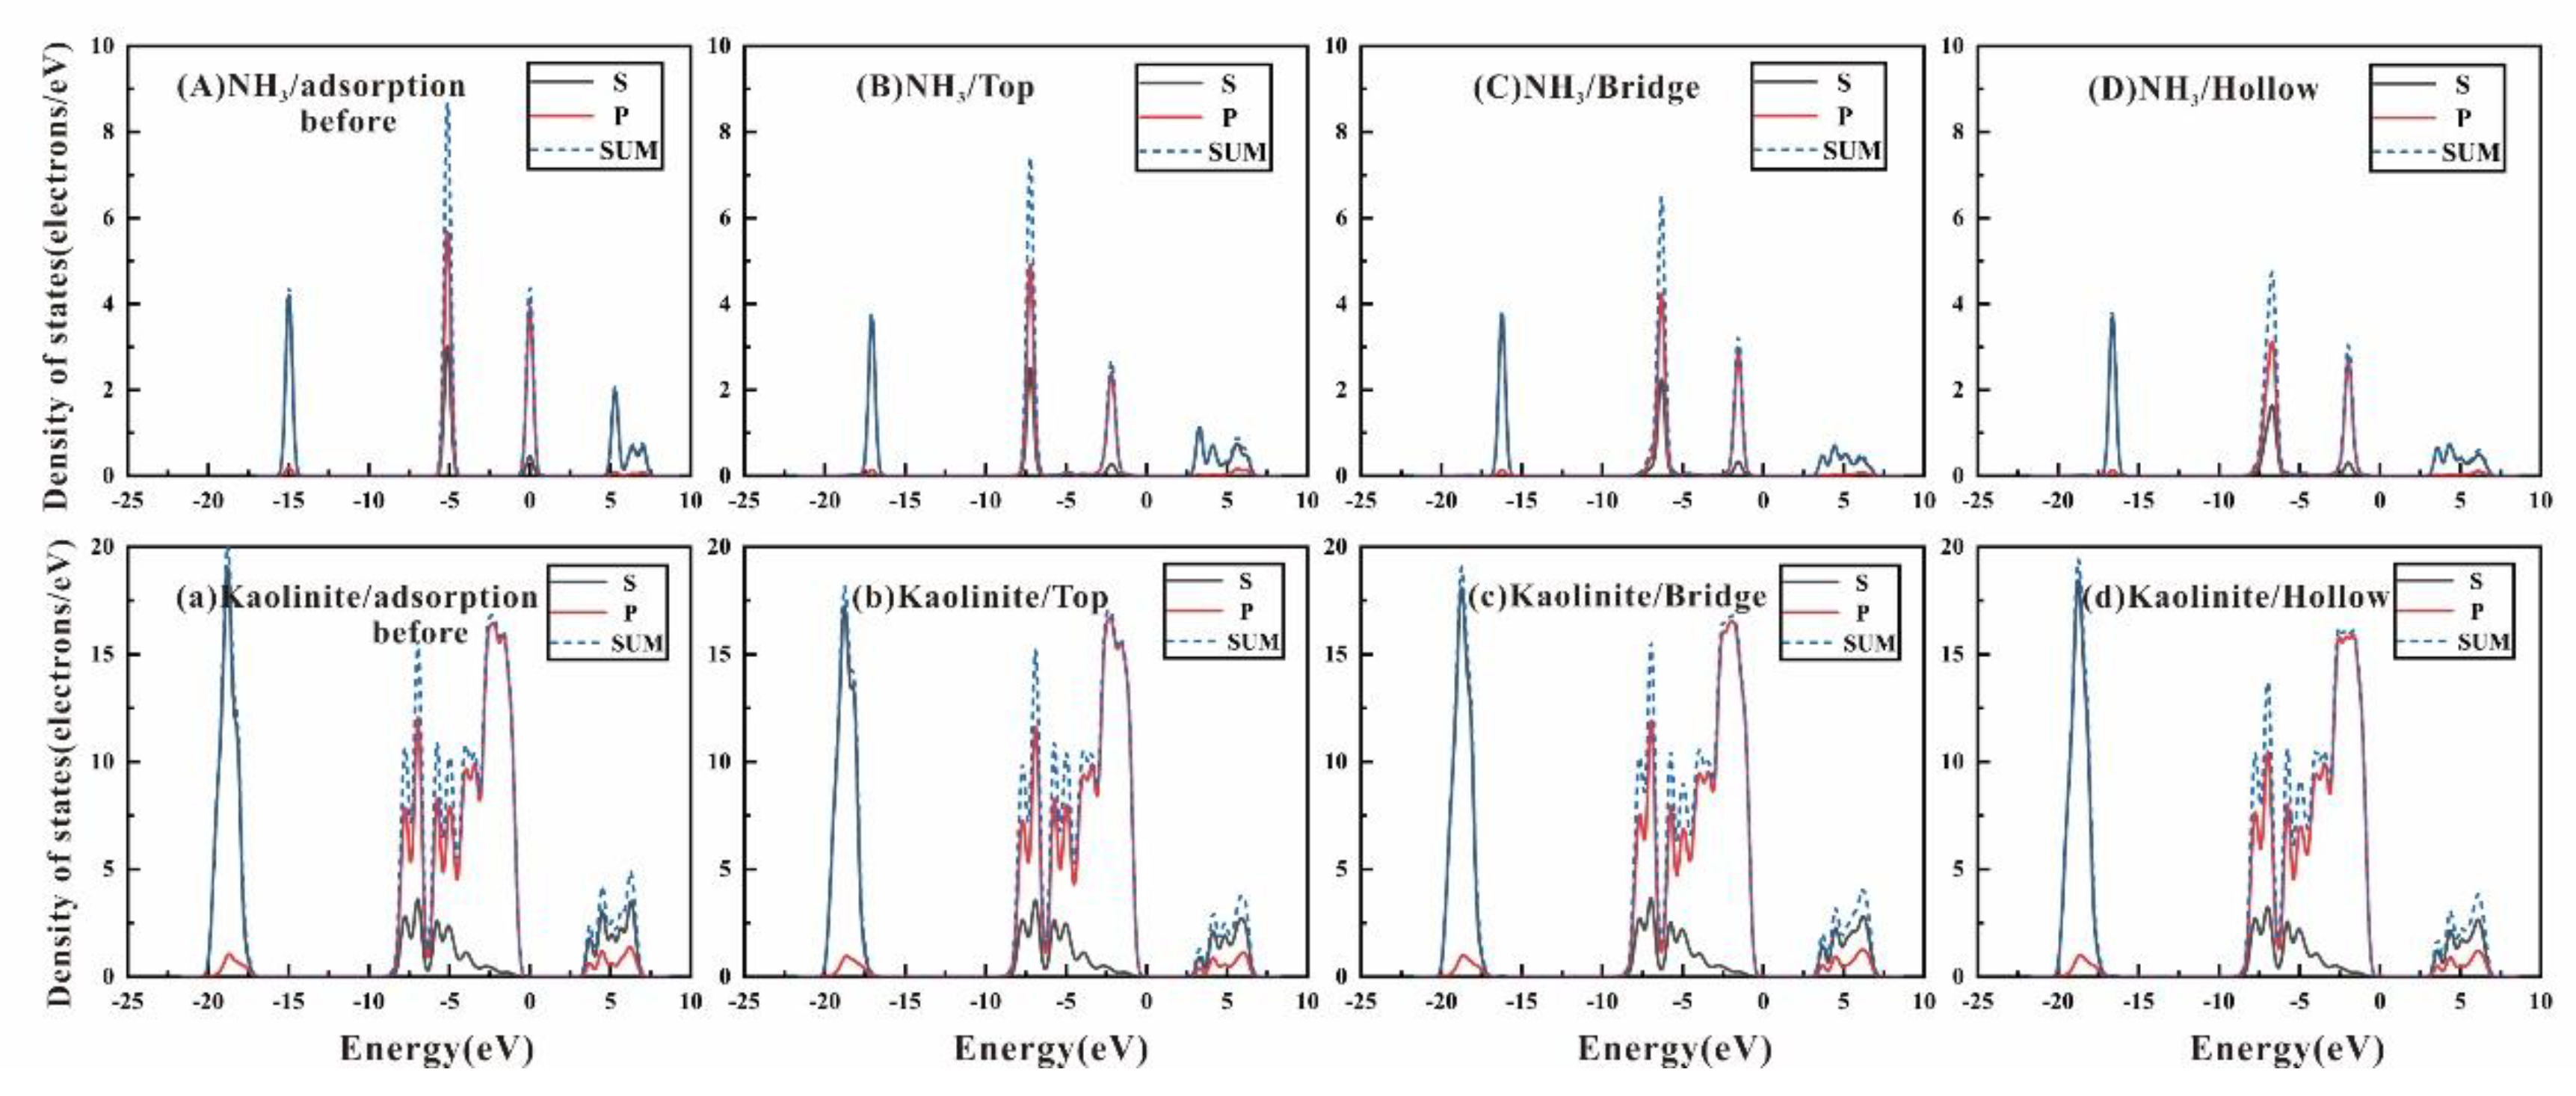
3.3. Density of State and Electron Transfer

Density of state (DOS) is one of the most important parameters for describing the state of motion of electrons in solid physics [50,51]. Figure 7 is a partial density of state (PDOS) image of NH3 before and after adsorption at different adsorption sites on the kaolinite (001) surface. Figure 7A–D represent the PDOS diagram of the s, p orbital energy levels and the sum of two orbital energy levels of the free NH3 molecules before adsorption and those of “top”, “bridge” and “hollow” (“Top2”, “bridge3” and “hollow1”) positions on the kaolinite surface after adsorption. For comparison, we also calculated the PDOS diagram of the H and O two-layer atoms involved in the adsorption of kaolinite (001) surface. Figure 7a is the image before adsorption and Figure 7b–d is the image after adsorption, including the s, p orbital energy levels and the sum of the two orbital energy levels.
The sum of PDOS (blue dotted line in the Figure 7) shows there are three peaks before NH3 adsorption on the kaolinite surface, which are −14.97 eV, −5.12 eV and −0.0055 eV, but −0.0055 eV is very close to the Fermi level (0 eV) and is not considered in this study. The left peak mainly represents the 2s-orbital level, while the right peak mainly represents the 2p-orbital level. When the NH3 molecule adsorbed to kaolinite surface on the “Top” positon, the energy of the two orbitals of NH3 reduced by 2.11 eV and 2.10 eV, and the wave crest reduced by 0.61 eV and 1.27 eV respectively. For the “bridge” position, the center of the peaks moved to the right by 1.26 eV and 1.21 eV, with wave crest decreasing by 0.54 eV and 2.21 eV. For the “hollow” position, the center of the peaks moved 1.65 eV and 1.58 eV to the right, and the wave crest reduced by 0.56 eV and 3.95 eV. The peaks of the three positions were all moved toward the low energy direction, and the distances which the center positions of the two peaks moved similar, that means the electron orbital energy decreases after adsorption and the adsorption system tends to be more stable. The wave crest change of 2s-orbital is small, but the wave crest of the 2p-orbital changes greatly, and as the adsorption energy increases, the wave crest of the 2p-orbital gradually decreases, which implies that during the adsorption process of NH3, the influence of the p-orbital level is greater than the s-orbital energy level. The corresponding orbital energy level change of the kaolinite surface is small, the s-orbital in kaolinite surface has a little change, and there is nearly little change in the p orbital.
Figure 8 illustrates the individual atom orbital energy level change of the most stable adsorption site (“Hollow1”) during the process of the adsorption. The zero point of energy is set at the Fermi level (EF), the H1 atoms is on the kaolinite surface (Figure 8a), and the HN1 atoms is in NH3 and the O3 atoms is on the kaolinite surface (Figure 8b).
The partial density of states plots in Figure 8a, shows that the nonlocality of 2p-orbitals of N atoms in NH3 increase after adsorption. The electron density of states disappears at Fermi level, and the whole density of states moves towards the direction of energy reduction after the interaction between N atom and H1 atom of kaolinite surface, indicating that the NH3/kaolinite (001) system is stable after adsorption. With Fermi level as the boundary, the bonding between 2p-orbital of N atom of NH3 and 1s-orbital of H atom of kaolinite surface on the left side of Fermi level is from −10~0 eV, and the anti-bonding between them on the right side of Fermi level is 2.5~7.5 eV. According to the wave crest height of density of states, bonding is much stronger than anti-bonding, so N–H1 bond. The density of states in Figure 8b shows that the anti-bonding between the 1s-orbital of HN1 atom of NH3 and the 2p-orbital of O3 atom on surface is very weak, and the bonding effect is relatively strong, so HN1–O3 can bond. As a result, NH3 can strongly adsorb on the (001) surface of kaolinite.

4. Conclusions

In order to clarify the adsorption of ammonia gas on kaolinite surface, a kaolinite 2 × 1 × 1 supercell is established, then the DFT is used to study the adsorption process of ammonia gas at different adsorption positions on kaolinite surface. The adsorption energies of the three different adsorption positions (“top”, “bridge” and “hollow”) show that the adsorption capacity of the “Hollow1” in “Hollow” position is the largest. So, the “hollow1” adsorption position is the most stable positions in NH3/kaolinite system, which surrounded by two “upright” hydroxyl groups perpendicular to the kaolinite surface and a “lying” hydroxyl group parallel to the kaolinite surface, and the adsorption energy is 0.54 eV. The weakest adsorption capacity is the “Top1”, which is directly above a single “upright” hydroxyl group. The distance between the H atom of the “lying” hydroxyl group and the N atom of the NH3 has a decisive influence on the adsorption, the closer distance between these two atoms, the greater adsorption energy of NH3 on the surface. The Mulliken electric charge and the PDOS distribution show that the adsorption of NH3 on the kaolinite surface is mainly by bond N atoms of NH3 to the H atoms of the “upright” hydroxyl groups on the surface of kaolinite. For the “lying” hydroxyl group (OlH), the H atom is “lying”, the O atom is exposed to the outermost surface and can forms a hydrogen bond with the HN atom of the NH3 which closest to it. Moreover, a small part of electron transfer between NH3 and kaolinite surface causes electrostatic adsorption between them. As a result, NH3 can stably be adsorbed on the kaolinite surface and kaolinite is a suitable adsorbent choice. The interaction of ammonia gas with water is more complicated, and the interaction of water, ammonia gas and kaolinite demands further study.

Author Contributions

Q.C. and Y.L. conceived the structure of manuscript and designed the calculation models; Y.J. and Y.S. provided feasible suggestions; Y.G. contributed the computation opinions; Y.Z. and Q.Z. collated relevant literatures; Q.C. performed all the calculations and preparated the original draft; Q.C., Y.L. and X.Q. wrote the manuscript. All authors have read and agreed to the published version of the manuscript.

Funding

This research was supported financially by the Key Project of National Natural Science Foundation of China (No. 41530315).

Conflicts of Interest

The authors declare no conflict of interest.

References

  1. Turpin, B.J.; Lim, H.-J. Species contributions to pm2.5 mass concentrations: Revisiting common assumptions for estimating organic mass. Aerosol Sci. Technol. 2001, 35, 602–610. [Google Scholar] [CrossRef]
  2. Bretschneider, B.; Kurfurst, J. Air Pollution Control Technology; Elsevier: Amsterdam, The Netherlands, 1987. [Google Scholar]
  3. Buijsman, E.; Maas, H.F.; Asman, W.A. Anthropogenic NH3 emissions in Europe. Atmos. Environ. (1967) 1987, 21, 1009–1022. [Google Scholar] [CrossRef]
  4. Bouwman, A.; Lee, D.; Asman, W.; Dentener, F.; Van Der Hoek, K.; Olivier, J. A global high-resolution emission inventory for ammonia. Glob. Biogeochem. Cycles 1997, 11, 561–587. [Google Scholar] [CrossRef]
  5. Seinfeld, J.H.; Pandis, S.N. Atmospheric Chemistry and Physics: From Air Pollution to Climate Change; John Wiley & Sons: Hoboken, NJ, USA, 2016. [Google Scholar]
  6. Dasgupta, P.K.; Dong, S. Solubility of ammonia in liquid water and generation of trace levels of standard gaseous ammonia. Atmos. Environ. (1967) 1986, 20, 565–570. [Google Scholar] [CrossRef]
  7. Behera, S.N.; Sharma, M.; Aneja, V.P.; Balasubramanian, R. Ammonia in the atmosphere: A review on emission sources, atmospheric chemistry and deposition on terrestrial bodies. Environ. Sci. Pollut. Res. 2013, 20, 8092–8131. [Google Scholar] [CrossRef]
  8. Søgaard, H.T.; Sommer, S.G.; Hutchings, N.; Huijsmans, J.; Bussink, D.; Nicholson, F. Ammonia volatilization from field-applied animal slurry—The alfam model. Atmos. Environ. 2002, 36, 3309–3319. [Google Scholar] [CrossRef]
  9. Heumann, W.L. Industrial Air Pollution Control Systems; Mc Graw-Hill: New York, NY, USA, 1997; Volume 620. [Google Scholar]
  10. Travlou, N.A.; Bandosz, T.J. N-doped polymeric resin-derived porous carbons as efficient ammonia removal and detection media. Carbon 2017, 117, 228–239. [Google Scholar] [CrossRef]
  11. Forzatti, P. Present status and perspectives in de-nox scr catalysis. Appl. Catal. A Gen. 2001, 222, 221–236. [Google Scholar] [CrossRef]
  12. Sharonov, V.E.; Aristov, Y.I. Ammonia adsorption by MgCl2, CaCl2 and BaCl2 confined to porous alumina: The fixed bed adsorber. React. Kinet. Catal. Lett. 2005, 85, 183–188. [Google Scholar] [CrossRef]
  13. Petit, C.; Karwacki, C.; Peterson, G.; Bandosz, T.J. Interactions of ammonia with the surface of microporous carbon impregnated with transition metal chlorides. J. Phys. Chem. C 2007, 111, 12705–12714. [Google Scholar] [CrossRef]
  14. Thang, H.V.; Grajciar, L.; Nachtigall, P.; Bludský, O.; Areán, C.O.; Frýdová, E.; Bulanek, R. Adsorption of CO2 in fau zeolites: Effect of zeolite composition. Catal. Today 2014, 227, 50–56. [Google Scholar] [CrossRef]
  15. Rodeghero, E.; Pasti, L.; Nunziante, G.; Chenet, T.; Gigli, L.; Plaisier, J.R.; Martucci, A. Highlighting the capability of zeolites for agro-chemicals contaminants removal from aqueous matrix: Evidence of 2-ethyl-6-methylaniline adsorption on zsm-12. Am. Miner. 2019, 104, 317–324. [Google Scholar] [CrossRef]
  16. Eberly, P.E., Jr. Adsorption properties of naturally occurring erionite and its cationic-exchanged forms. Am. Miner. 1964, 49, 30–40. [Google Scholar]
  17. Peng, C.; Min, F.; Liu, L.; Chen, J. A periodic dft study of adsorption of water on sodium-montmorillonite (001) basal and (010) edge surface. Appl. Surf. Sci. 2016, 387, 308–316. [Google Scholar] [CrossRef]
  18. Wungu, T.D.K.; Agusta, M.K.; Saputro, A.G.; Dipojono, H.K.; Kasai, H. First principles calculation on the adsorption of water on lithium–montmorillonite (Li-MMT). J. Phys. Condens. Matter Inst. Phys. J. 2012, 24, 475506. [Google Scholar] [CrossRef] [PubMed]
  19. Bergaya, F.; Lagaly, G. General introduction: Clays, clay minerals, and clay science. Dev. Clay Sci. 2006, 1, 1–18. [Google Scholar]
  20. Brigatti, M.F.; Galan, E.; Theng, B. Structures and mineralogy of clay minerals. Dev. Clay Sci. 2006, 1, 19–86. [Google Scholar]
  21. Kremleva, A.; Krüger, S.; Rösch, N. Density functional model studies of uranyl adsorption on (001) surfaces of kaolinite. Langmuir 2008, 24, 9515–9524. [Google Scholar] [CrossRef]
  22. Schoonheydt, R.; Johnston, C. Surface and interface chemistry of clay minerals. Dev. Clay Sci. 2006, 1, 87–113. [Google Scholar]
  23. Chen, J.; Min, F.F.; Liu, L.; Liu, C.; Lu, F. Experimental investigation and DFT calculation of different amine/ammonium salts adsorption on kaolinite. Appl. Surf. Sci. 2017, 419, 241–251. [Google Scholar] [CrossRef]
  24. Sato, H.; Ono, K.; Johnston, C.T.; Yamagishi, A. First-principle study of polytype structures of 1: 1 dioctahedral phyllosilicates. Am. Miner. 2004, 89, 1581–1585. [Google Scholar] [CrossRef]
  25. Schaef, H.T.; Glezakou, V.-A.; Owen, A.T.; Ramprasad, S.; Martin, P.F.; McGrail, B.P. Surface condensation of CO2 onto kaolinite. Environ. Sci. Technol. Lett. 2013, 1, 142–145. [Google Scholar] [CrossRef]
  26. Zhao, J.; He, M.C. Theoretical study of heavy metal Cd, Cu, Hg, and Ni(II) adsorption on the kaolinite (001) surface. Appl. Surf. Sci. 2014, 317, 718–723. [Google Scholar] [CrossRef]
  27. Zhang, B.; Kang, J.; Kang, T. Effect of water on methane adsorption on the kaolinite (001) surface based on molecular simulations. Appl. Surf. Sci. 2018, 439, 792–800. [Google Scholar] [CrossRef]
  28. Jun, C.; Fan-fei, M.; Ling-yun, L.; Chen-liang, P. DFT calculations of different amine/ammonium cations adsorption on kaolinite (001) surface. J. China Coal Soc. 2016, 41, 3115–3121. [Google Scholar]
  29. Segall, M.; Shah, R.; Pickard, C.; Payne, M. Population analysis of plane-wave electronic structure calculations of bulk materials. Phys. Rev. B 1996, 54, 16317. [Google Scholar] [CrossRef] [Green Version]
  30. Segall, M.; Pickard, C.; Shah, R.; Payne, M. Population analysis in plane wave electronic structure calculations. Mol. Phys. 1996, 89, 571–577. [Google Scholar] [CrossRef]
  31. Hohenberg, P.; Kohn, W. Inhomogeneous electron gas. Phys. Rev. 1964, 136, B864. [Google Scholar] [CrossRef] [Green Version]
  32. Kohn, W.; Sham, L.J. Self-consistent equations including exchange and correlation effects. Phys. Rev. 1965, 140, A1133. [Google Scholar] [CrossRef] [Green Version]
  33. Ceperley, D.M.; Alder, B. Ground state of the electron gas by a stochastic method. Phys. Rev. Lett. 1980, 45, 566. [Google Scholar] [CrossRef] [Green Version]
  34. Perdew, J.P.; Burke, K.; Ernzerhof, M. Generalized gradient approximation made simple. Phys. Rev. Lett. 1996, 77, 3865. [Google Scholar] [CrossRef] [Green Version]
  35. Ireta, J.; Neugebauer, J.; Scheffler, M. On the accuracy of DFT for describing hydrogen bonds: Dependence on the bond directionality. J. Phys. Chem. A 2004, 108, 5692–5698. [Google Scholar] [CrossRef] [Green Version]
  36. Clark, S.J.; Segall, M.D.; Pickard, C.J.; Hasnip, P.J.; Probert, M.I.; Refson, K.; Payne, M.C. First principles methods using castep. Zeitschrift für Kristallographie-Crystalline Materials 2005, 220, 567–570. [Google Scholar] [CrossRef] [Green Version]
  37. Segall, M.D.; Lindan, P.J.; Probert, M.a.; Pickard, C.J.; Hasnip, P.J.; Clark, S.; Payne, M. First-principles simulation: Ideas, illustrations and the castep code. J. Phys. Condens. Matter 2002, 14, 2717. [Google Scholar] [CrossRef]
  38. Tkatchenko, A.; Scheffler, M. Accurate molecular van der waals interactions from ground-state electron density and free-atom reference data. Phys. Rev. Lett. 2009, 102, 073005. [Google Scholar] [CrossRef] [Green Version]
  39. Vanderbilt, D. Soft self-consistent pseudopotentials in a generalized eigenvalue formalism. Phys. Rev. B 1990, 41, 7892. [Google Scholar] [CrossRef]
  40. Payne, M.C.; Teter, M.P.; Allan, D.C.; Arias, T.; Joannopoulos, A.J. Iterative minimization techniques for ab initio total-energy calculations: Molecular dynamics and conjugate gradients. Rev. Mod. Phys. 1992, 64, 1045. [Google Scholar] [CrossRef] [Green Version]
  41. Pfrommer, B.G.; Côté, M.; Louie, S.G.; Cohen, M.L. Relaxation of crystals with the quasi-newton method. J. Comput. Phys. 1997, 131, 233–240. [Google Scholar] [CrossRef] [Green Version]
  42. Monkhorst, H.J.; Pack, J.D. Special points for brillouin-zone integrations. Phys. Rev. B 1976, 13, 5188–5192. [Google Scholar] [CrossRef]
  43. Kresse, G.; Furthmüller, J. Efficient iterative schemes for ab initio total-energy calculations using a plane-wave basis set. Phys. Rev. B 1996, 54, 11169. [Google Scholar] [CrossRef]
  44. McLachlan, A. Self-consistent field theory of the electron spin distribution in π-electron radicals. Mol. Phys. 1960, 3, 233–252. [Google Scholar] [CrossRef]
  45. Bish, D.L. Rietveld refinement of the kaolinite structure at 1.5 k. Clays Clay Miner. 1993, 41, 738–744. [Google Scholar] [CrossRef]
  46. Xia, L.-Y.; Zhong, H.; Liu, G.-Y.; Li, X.-G. Electron bandstructure of kaolinite and its mechanism of flotation using dodecylamine as collector. J. Cent. South Univ. Technol. 2009, 16, 73–79. [Google Scholar] [CrossRef]
  47. Bickmore, B.R.; Bosbach, D.; Hochella, M.F.; Charlet, L.; Rufe, E. In situ atomic force microscopy study of hectorite and nontronite dissolution: Implications for phyllosilicate edge surface structures and dissolution mechanisms. Am. Miner. 2001, 86, 411–423. [Google Scholar] [CrossRef]
  48. Hu, Y.; Wei, S.; Hao, J.; Miller, J.; Fa, K. The anomalous behavior of kaolinite flotation with dodecyl amine collector as explained from crystal structure considerations. Int. J. Miner. Process. 2005, 76, 163–172. [Google Scholar] [CrossRef]
  49. Xiao, L.H.; Michaelides, A.; Xiao, L.H.; Michaelides, A. Water on the hydroxylated (001) surface of kaolinite: From monomer adsorption to a flat 2D wetting layer. Surf. Sci. 2008, 602, 960–974. [Google Scholar]
  50. Gray, P.V.; Brown, D.M. Density of SiO2–Si interface states. Appl. Phys. Lett. 1966, 8, 31–33. [Google Scholar] [CrossRef]
  51. Shirley, D.A. High-resolution X-ray photoemission spectrum of the valence bands of gold. Phys. Rev. B 1972, 5, 4709. [Google Scholar] [CrossRef] [Green Version]
Figure 1. (a) the main view of kaolinite single layer model. Each kaolinite single layer contains six atomic “sublayers” which are H–O–Al–O–Si–O from top to bottom, the upper three layers constitute the “Alumina layer” and the lower three layers constitute the “Silica layer”; (b) the hydroxyl which parallel to the surface of kaolinite-“lying” hydroxyl (OlH), the hydroxyl which perpendicular to the surface of kaolinite-“upright” hydroxyl (OuH).
Minerals 10 00046 g001
Figure 2. A vacuum layer of 20 Å was created on the surface of kaolinite (001). The left part is an enlarged kaolinite, in which red is a fixed three sub-layers and gray is a relaxed three sub-layers.
Minerals 10 00046 g002
Figure 3. Top view of the kaolinite (001) surface. (A) three “Top” adsorption positions (T1-T3); (B) three “Bridge” adsorption positions (B1-B3); (C) four “Hollow” adsorption positions (H1-H4) (the white ball: H; the red ball: O; the purple ball: Al).
Minerals 10 00046 g003
Figure 4. Top view of the positional change of NH3 molecules before and after adsorption. (A,a) the positional change of NH3 before and after adsorption at the “Hollow1” of the kaolinite (001) surface; (B,b) the positional change before and after adsorption at the “Top1” (the white ball: H; the red ball: O; the purple ball: Al).
Minerals 10 00046 g004
Figure 5. Bond formation and bond length of NH3 adsorbed at the position of “Top2”, “Bridge3” and “Hollow1” (the white ball: H; the red ball: O; the blue ball: N; the purple ball: Al). (A) is the “Top2” position, (B) is the “Bridge 3” position, (C) is the “Hollow 3” position.
Minerals 10 00046 g005
Figure 6. The electron density difference for the NH3 molecule adsorption on the Kaolinite surface at the “Hollow1” adsorption site. The yellow region represents the accumulation of electrons, and the blue region represents the depletion of electrons (the white ball: H; the red ball: O; the blue ball: N; the purple ball: Al).
Minerals 10 00046 g006
Figure 7. The PDOS plots for the NH3 molecule and the Kaolinite surface atoms at the “Top”, “Bridge” and “Hollow” adsorption sites: (A) for NH3 before adsorption; (a) for Kaolinite before adsorption; (BD) for NH3 adsorption on “Top”, “Bridge” and “Hollow” sites; (bd) for kaolinite (001) surface after NH3 adsorbed on “Top”, “Bridge” and “Hollow” positions.
Minerals 10 00046 g007
Figure 8. The PDOS plots of atoms before and after NH3 adsorption on kaolinite (001) surface: (a) is the partial density of states plot of the H1 atoms on kaolinite (001) surface and N atoms in NH3; (b) is the partial density of states plot of the HN1 in NH3 and O1 on kaolinite (001) surface.
Minerals 10 00046 g008
Table 1. Optimized results of the bulk of kaolinite.
Exchange-Correlation Functions/eVLattice Parameter (Å)Cell Angles (°)Total Energy/eV
abcαβγ
LDA + CA-PZ/4005.0828.8207.15591.734105.07889.839−8689.188
LDA + CA-PZ (DFT-D)/4005.0458.7527.09991.966105.38989.885−8689.142
GGA + PBE/4005.2099.0687.48591.675104.83689.726−8682.448
GGA + PBE (DFT-D)/4005.1768.9777.33991.724105.03789.962−8682.408
GGA + PW915.1768.9847.37191.757105.44589.813−8693.178
GGA + WC5.1839.0247.34791.652105.07789.740−8667.929
GGA-PBESOL5.1829.0307.33591.634104.92889.743−8656.095
Experimental results [45]5.1548.9427.39191.926105.04689.797
Table 2. Summary of NH3 adsorption energy corresponding to different adsorption positions on kaolinite surface.
SurfaceAdsorption PositionNH3 on Kaolinite Final Enthalpy (eV)Adsorption Energy (eV)
(001)Top1−17,689.03−0.19
Top2−17,689.29−0.45
Top3−17,689.12−0.27
Bridge1−17,689.27−0.43
Bridge2−17,689.33−0.48
Bridge3−17,689.36−0.52
Hollow1−17,689.38−0.54
Hollow2−17,689.37−0.53
Hollow3−17,689.35−0.51
Hollow4−17,689.11−0.27
Table 3. The structural parameters for NH3 adsorbed on “Top2”, “Bridge3”, and “Hollow1” of the kaolinite (001) surface.
Bond Length and Band AngleAdsorption BeforeTop2Bridge3Hollow1
Longest N–H bond length (Å)1.1101.0301.0331.036
Shortest N–H bond length (Å)1.0281.0291.030
Largest H–N–H angle (°)109.471107.885108.112108.550
Smallest H–N–H angle (°)107.268106.222106.506
Adsorption energy (eV)-0.450.520.54
Table 4. Mulliken bond population of atoms before and after NH3 adsorption on kaolinite (001) surface (Top2, Bridge3 and Hollow1).
Adsorption SiteBondPopulation (bulk/after)Bond Length (bulk/after)/Å
adsorption beforeN–HN10.64/0.651.039/1.036
N–HN20.64/0.651.035/1.030
N–HN30.64/0.661.039/1.030
Top2N–H10.091.887
N–O1−0.102.869
Bridge3N–H10.002.960
N–H20.062.037
N–H3−0.012.599
N–O2−0.062.979
Hollow1N–H10.062.016
N–H20.022.326
N–H3−0.022.552
HN1–O30.032.094
Table 5. Mulliken charge populations of atoms before and after NH3 adsorption on “Hollow1” of kaolinite (001) surface.
Adsorption SiteAtomAdsorption StatespTotalCharge (e)
Hollow1HN1Before0.5900.590.41
After0.6100.610.39
∆(After-Before)0.0200.02−0.02
HN2Before0.5900.590.41
After0.5800.580.42
∆(After-Before)−0.010−0.010.01
HN3Before0.5900.590.41
After0.5900.590.41
∆(After-Before)0.0000.000.00
NBefore1.744.496.23−1.23
After1.724.466.18−1.18
∆(After-Before)−0.02−0.03−0.050.05
H1Before0.5500.550.45
After0.5700.570.43
∆(After-Before)0.0200.02−0.02
H2Before0.5400.540.46
After0.5500.550.45
∆(After-Before)0.0100.01−0.01
O3Before1.855.207.05−1.05
After1.865.167.02−1.02
∆(After-Before)0.01−0.04−0.030.03
∆ is the difference of Mulliken charge populations of atoms before and after NH3 adsorption on “Hollow1” of kaolinite (001) surface.

