Article

Reflectance Spectroscopy of Ammonium Salts: Implications for Planetary Surface Composition

by
Maximiliano Fastelli
1,*,
Paola Comodi
1,
Alessandro Maturilli
2 and
Azzurra Zucchini
1
1
Department of Physics and Geology, Perugia University, Piazza dell’ Università 1, 06123 Perugia, Italy
2
Institute of Planetary Research, DLR German Aerospace Centre, Rutherfordstrasse 2, D-12489 Berlin, Germany
*
Author to whom correspondence should be addressed.
Minerals 2020, 10(10), 902; https://doi.org/10.3390/min10100902
Submission received: 12 August 2020 / Revised: 3 October 2020 / Accepted: 9 October 2020 / Published: 11 October 2020

Abstract

:
Recent discoveries have demonstrated that the surfaces of Mars, Ceres and other celestial bodies, as well as asteroids and comets, are characterized by the presence of ammonium-bearing minerals. A careful study of remote data compared with the analyses of more accurate laboratory data might allow a better remote characterization of planetary bodies. In this paper, the reflectance spectra of some ammoniated hydrous and anhydrous salts, namely sal-ammoniac NH4Cl, larderellite (NH4)B5O7(OH)2·H2O, mascagnite (NH4)SO4, struvite (NH4)MgPO4·6H2O and tschermigite (NH4)Al(SO4)2·12H2O, were collected at 293 and at 193 K. The aim is to detect how the NH4 vibrational features are affected by the chemical and structural environment. All samples were recovered after cooling cycles and were characterized by X-ray powder diffraction. Reflectance spectra of the studied minerals show absorption features around 1.3, 1.6, 2.06, 2.14, 3.23, 5.8 and 7.27 μm, related to the ammonium group. Between them, the 2ν3 at ~1.56 μm and the ν3 + ν4 at ~2.13 μm are the most affected modes by crystal structure type, with their position being strictly related to both anionic group and the strength of the hydrogen bonds. The reflectance spectra of water-rich samples [struvite (NH4)MgPO4·6(H2O) and tschermigite (NH4)Al(SO4)2·12(H2O)] show only H2O fundamental absorption features in the area from 2 to 2.8 μm and a band from hygroscopic water at 3 μm. Thermal analyses (TA), thermal gravimetry (TG) and differential scanning calorimetry (DSC) allowed to evaluate the dehydration temperatures and the occurring phase transitions and decompositions in the analyzed samples. In almost all samples, endothermic peaks at distinct temperatures were registered associated to loss of water molecules, differently linked to the structures. Moreover, an endothermic peak at 465 K in sal-ammoniac was associated to the phase transition from CsCl to NaCl structure type.

1. Introduction

Nitrogen is an important element for life as a component of all proteins and it can be found in all living systems, even if the presence of NH4+ is not sufficiently indicative of biological activity, and it could be formed through hydrothermal process [1].
To understand early solar system processes, it should be important to detect ammonium inside primordial bodies as well as to differentiate the various NH4+-bearing components.
On the Ceres’s surface, ammoniated bearing minerals have been discovered by King et al. [2] from telescopic observation in the spectral range from 2.8 to 3.4 μm. Recently, studies [3] confirmed the presence of ammonium phyllosilicate materials using the visible and infrared (VIR)spectrometer on the Dawn mission [4]. De Sanctis et al. [5] reports that the bright spots on the Ceres surface (Occator Crater) are the best areas to find and identify ammonium minerals due to the strong bands at 2.2 μm. The most significant spectral absorption features at ~2.72 and 3.06 μm are respectively related to the presence of Mg-OH-bearing materials and NH4-bearing minerals [3].
Quinn et al. [6] report detection of ammonium in soil at the Phoenix landing site on Mars. Moreover, analyzing the spectra of interior layered deposits in Iani Chaos, Mars, the absorption features at ~1.07, 1.31 and 1.57 μm were related to ammonium-bearing minerals [7]. The presence of nitrogen compound has been proposed by Owen et al. [8] and Poch et al. [9] in comets and by Stoks and Schwartz. [10] in meteorites. Data collected by New Horizon LORRI and Ralph emphasized the presence of ammonia on Charon, one of Pluto’s satellites, and in particular, ammonium chloride, ammonium nitrate and ammonium carbonate have been claimed as the best candidates [11]. Recently, studies [12,13] modeled the surface composition of Nix, Hydra and Kerberos, Pluto’s other moons, using ammoniated salts as end members: NH4Cl, NH4NO3 and (NH4)2CO3. On Pluto’s surface, ammonia (NH3) was identified through the absorption bands at 1.65 and 2.2 μm [14].
Ammonia is a fundamental anti-freezing water element, lowering the crystallization temperature of water [15]. Several studies on Jovian’s moons [16,17] suggested the presence of oceans underneath the crust, and a composition such as water + ammonia could be corroborated with maintained the presence of liquid water in those conditions of pressure and temperature. Cryovolcanism activity on these bodies [18] can give rise to the interaction of water-ammonia with the surface. The interaction of ammonia-water with the non-ice elements on the planet’s surface, that can generate minerals similar to those found on Earth by cryovolcanism activity, was hypothesized in Triton, the largest of Neptune’s moons [19].
On Earth, ammonium minerals are found on fumarole areas [20] and in hydrothermal systems [1]. Elevated concentrations of nitrogen have been discovered in metamorphic, igneous and, especially, in sedimentary and metasedimentary rocks [21].
Ammonium-bearing minerals are of significant interest as hydrogen bonds can affect the NH4+ absorption features and the configuration of hydrogen bonds, N–H…X, in ammoniated-salts (e.g., NH4Cl, NH4Br) can be quite different [22]. The N–H frequencies are near 3300 cm−1 and the ν4(NH4+) vibrational mode is the best candidate to evaluate the strength of the hydrogen bonds [23]. The establishment of hydrogen bonds bring about two frequencies shifts: on one hand, the shift of stretching modes that are moved to lower frequencies, and on the other hand, the bending modes are shifted to higher frequencies [24]. Ammoniated salts begin to decompose at 373 K, related to the initial loss of structural water, and at approximately 573 K, the NH4+ in hydrated ammoniated salts is completely degraded. Ammoniated salts can undergo phase transitions at different pressures and temperatures [25,26].
In this study, the reflectance spectra of some NH4-bearing minerals were collected. The analyzed minerals were chosen in order to both improve the database with missing data and enlarge the investigated spectral range, with respect to the literature [27,28,29,30]. In particular, ammoniated sulfate, phosphate, aluminate and borate were chosen to determine the influence of different anionic groups and the amounts of water on the ammonium vibrational modes. In addition, the minor ammonium salts examined (larderellite and struvite) contain phosphorus and boron, which are key elements in biological activity. In fact, phosphorus is part of the biogenic elements and is essential for life as we know it. The presence of phosphates has been hypothesized on the surface of frozen bodies, e.g., Titan, in close relation to the presence of ammonia [31]. Borate anions (BO4) may also be necessary for the origin of life [32] and were detected on Mars’ surface [33]. Moreover, icy objects, subjected to cosmic radiation for a billion years, would contain boron and other cosmogenic elements, the detection of which seems to be the most hopeful way to restrict the age of superficial deposits on the frozen world [34].
The selected natural ammoniated bearing minerals were analyzed using reflectance spectroscopy in the long-wave ultraviolet (UV), visible, near-infrared (NIR) and mid-infrared (MIR) regions (~1–16 μm) at 298 and 198 K. In addition, thermogravimetric analysis (TG) and differential scanning calorimetry (DSC) were performed to evaluate the amount of water/ammonium loss and the potential phase transitions occurring in the investigated temperature range. X-ray diffraction analyses were performed on the samples before and after the thermal treatments to study the evolution of their crystal structure.
The collected accurate laboratory data, compared with the available remote sensing data, should allow to better evaluate the possible presence of ammoniated salts, and to define their composition, on the surface of planetary bodies.

1.1. NH4+ Vibrational Modes

The NH4+ group has four fundamental vibrational modes: ν1 symmetric stretch at ~3.3 μm (3030 cm−1), ν2 in-plane bend at ~5.8 μm (1724 cm−1), ν3 asymmetric stretch at ~3.2 μm (3125 cm−1) and ν4 out-of-plane bend at ~7.1 μm (1408 cm−1). The first two vibrational modes are Raman-active, the latter two are Raman- and infrared-active [25,35]. In the NIR region, as the combinations ν1 + ν4, ν1 + ν3 and ν2 + ν3 are infrared-active, the characteristic absorption features due to a combination of fundamental vibrational modes are present [36]. Absorption features near 2 μm (5000 cm−1) can be assigned to ν2 + ν3 and ν1 + ν4 vibrational modes; whereas, ν1 + ν3 absorption bands are found in the spectral range near 1.5 μm (6666 cm−1) [27]. Following Berg et al. [29], we assign the absorption bands between 3 and 4 μm to overtone and a combination of NH4 modes; in particular, bands at ~3.23–3.33 μm (3000–3095 cm−1) are assigned to the ν2 + ν4 mode, and at ~3.57 μm (2800 cm−1), to 2ν4 modes. In addition, overtone and combinations of fundamental vibrational NH4+ modes are located at ~1.05, 1.3, 1.56, 2.02 and 2.12 μm. NH4+-associated absorption bands in longer wavelengths are at ~4.2, 5.7 and 7.0 μm [28]. Busignhy et al. [37] show how the band intensity at ~7 μm (ν4) can be related to NH4 quantity content in transmittance spectra.

1.2. SO42−, PO43− and BO33−–BO45− Vibrational Modes

The SO42− group presents four vibrational modes: symmetric stretch (ν1), symmetric bend (ν2), asymmetric stretch (ν3) and asymmetric bend (ν4) [38]. These absorption modes generally occur in different sulfates at 9.6–10.4 μm ν1 (961–1041cm−1), at 19–24 μm ν2 (416–526 cm−1), at 7.8–10.4 μm ν3 (961–1282 cm−1) and at 13–18 μm ν4 (769–555 cm−1) [38]. Combinations and overtones of these modes are most prominent in the 4–5 μm (2000–2500 cm−1) region [39]. In the ν3 stretching region (7.8–10.4 μm), all the sulfate spectra exhibit at least two absorption bands. The ν3-SO4 overtone and combination bands are located between 4 and 5 μm. In this region, the absorption features are attributed to the first overtone in combination with the ν3 absorption in the 7.8–10.4 μm range.
PO43− has four fundamental vibrational modes: ν1 stretching modes at ~10 μm (980 cm−1), ν2 bending modes at ~27 μm (358 cm−1), ν3 stretching modes at ~9 μm (1113 cm−1) and ν4 bending modes at ~19 μm (518 cm−1). Only ν3 and ν4 modes are IR-active [40,41]. PO43− absorption bands occur in two main regions, the one between ~8.3 and 11.1 μm (1200–900 cm−1) and the other one in the range ~16.7–25 μm (400–598 cm−1). Overtone and absorption bands due to PO43− can be detected in the spectral range from 4 to 5 μm [29].
Trigonal BO33− and tetragonal BO45− groups have three fundamental vibrational modes: the ν2 out-of-plane band and the ν4 in-plane bend in the 7–14 μm (714–1428 cm−1) region, and the ν1 symmetric stretch and ν3 asymmetric stretch in the 12.5–22 μm (454–800 cm−1) region [38].

1.3. H2O and OH Vibrational Modes

The H2O-free molecule has three fundamental vibrational modes: at 3657 cm−11) symmetric stretching, at 1595 cm−12) symmetric bending and at 3756 cm−13) asymmetric stretching [42]. In liquid water, frequencies shift to 3.1 μm (3219 cm−1) (ν1), 2.9 μm (3445 cm−1) (ν3) and 6.07 μm (1645 cm−1) (ν2) [43]. In ice, the bending and stretching modes of H2O shift to higher frequencies, in particular, the three fundamental vibrational modes are expected at 3.09 μm (3225 cm−1) (ν1), 2.94 μm (3401 cm−1) (ν3) and 6.06 μm (1650 cm−1) (ν2) [44]. In vapor, the absorption features of the H2O-free molecule show numerous closely spaced bands with rotational fine structures, lacking in liquid and solid state [43].
The H2O-free molecule presents a symmetric H–O–H stretch at 2.73 μm (3663 cm−1), an asymmetric H–O–H stretch at 2.66 μm (3759 cm−1), H–O–H bending at 6.27 μm (1594 cm−1) [43] and a rotational fundamental band at 20 μm (500 cm−1) [45].
OH has only one stretching vibration, located near 2.8 μm (3571 cm−1). Overtones of this absorption are expected near 1.4 and 0.45 μm (7142 and 22,222 cm−1) [46]. OH, also has rotational vibration bands in the 9–25 μm (1111–400 cm−1) range and translational vibration bands in the 15–33 μm (666–303 cm−1) range [47]. Water combination bands occur around 1.9 μm (5263 cm−1), whereas the strongest OH overtones are located in the region 1.38–1.41 μm (7246–7092 cm−1) [48]. The 3 μm (3333 cm−1) region of all the spectra shows well-defined H2O stretching fundamental bands.

2. Materials and Methods

We selected the natural ammoniated minerals reported in Table 1.
Reflectance measurements were performed at the PSL (Planetary Spectroscopy Laboratory, DLR, Berlin, Germany).

2.1. Reflectance Measurements

For reflectance measurements, approximately a 1 mm thick uniform layer of samples is placed in either plastic or metal cups for measurements. Details on the PSL set-up and measurement procedures can be found in Maturilli et al. [49]. Bi-conical reflectance measurements are performed by means of a Bruker A513 accessory (Bruker, Billerica, MA, USA). It has a conical aperture of 17°, not small enough to define the measurements as bi-directional. Reflectance standard is a gold-coated sandpaper for measurements along the entire cup diameter (1 to 100 μm). The standard spectral resolution is 4 cm−1, and the spot size is 48 mm for emissivity measurements. The spectral range of our analysis is from 0.5 to 16 μm, namely the infrared spectrum (IR) from visible-near (VNIR) to thermal (TIR). The reflectance spectra of all samples are measured at room temperature (RT) and 193 K with 300 scans repetition, to increase the signal-to-noise ratio of the data, for a data collection time of 3 min per sample. The sample chamber is closed and slowly evacuated to avoid powder spreading around the chamber. The samples are kept at 293 K for 1 h under vacuum to get rid of the air trapped in the sample, with pressure stabilized at 0.7 mbar. We have also recorded reflectance spectra at 193 K for all the samples, frozen by means of a FRYKA cold box B 35-85 (FRYKA Kaltetechnik GmbH, Esslingen, Germany), with a 150 scans repetition cycle, and a data collection time of 2 min per sample.

2.2. X-ray Diffraction Measurements and Rietveld Analysis

X-ray powder diffraction (XRPD) measurements were performed by means of a Philips PW 1830 diffractometer (Koninklijke Philips N.V., Amsterdam, The Netherlands), with a graphite monochromator and CuKα radiation (λ = 1.54184 Å). Data were collected with a step scan of 0.02°/step and a step time of 100 s/step.
Quantitative analyses of the collected data were performed by means of Rietveld refinement method [50], as implemented in the GSAS EXPGUI software [51,52]. The starting crystal structure data where chosen from the American Mineralogist Crystal Structure Database (http://rruff.geo.arizona.edu). Scattering factors for neutral atoms were used. The refined parameters were background, fitted with 17- to 28-terms Chebyshev polynomial function, profile functions of pseudo-Voigt type, scale factor, instrument zero point and the crystal lattice constants. The March-Dollase formulation for preferred orientation [53] correction was applied when needed.

2.3. Thermal Analysis

Thermogravimetric (TG) analysis and differential scanning calorimetry (DSC) were performed at the University of Perugia, Department of Pharmaceutical Sciences. The Netzsch STA 490 instrument (NETZSCH-Gerätebau GmbH, Selb, Germany) was used for the TG analysis, where the samples were heated with a speed of 10 °C min−1 and an air flow of 50 mL/min using approximately 20 mg of sample. Instead, the METTLER TOLEDO instrument (Mettler Toledo, Columbus, OH, USA) was used for DSC analysis, with parameters of heating speed and air flow identical to those of the TG-DTA, using approximately 3 mg for each sample.

3. Results

Table 2 and Table 3 present the positions and assignations of the observed bands, determined in the reflectance spectra collected at 298 K. In the studied reflectance spectra, we observed general NH4+ features common for all the analyzed samples at ~1.60, 2.06, 2.15, 3, 6.8 and 7.27 μm. In particular, for hydrous samples, the H2O and OH fundamental and combination absorption bands were observed in agreement with literature data (e.g., Reference [29]). The spectra collected at low temperature of all samples show a common behavior characterized by an increase in the area and depth of the individual bands, with a consequent gain in spectrum resolution, with respect to the RT data. Additional peculiarities are listed below.
In the following, the spectroscopic behavior of each sample at different temperatures is reported. The Rietveld refinement of the X-ray powder diffraction collected data allowed to determine the quantitative mineralogical composition of the starting materials, and to check the purity of the samples, as well the occurrence of irreversible phase transformation after cooling treatment.
In the Figure 1b, Figures 3b, 5b, 7b and 9b the red crosses represent the step-by-step the XRD collected data, the green lines are the calculated diffraction patterns by Rietveld refinements [50], using GSAS EXPGUI software [51,52], and the lines under the diffractograms represent the 2θ positions of expected diffraction signals for each phase considered in the refinements. The pink lines indicate the difference profile, namely the difference between the calculated and measured diffraction patterns. In each graph, the quantitative mineralogical composition is reported in the upper right angle. Moreover, the quality of the samples, namely their crystallinity, were measured trough the average full-width half maximum (FWHM) parameters of the diffraction peaks using X’PERT HighScore software [54].

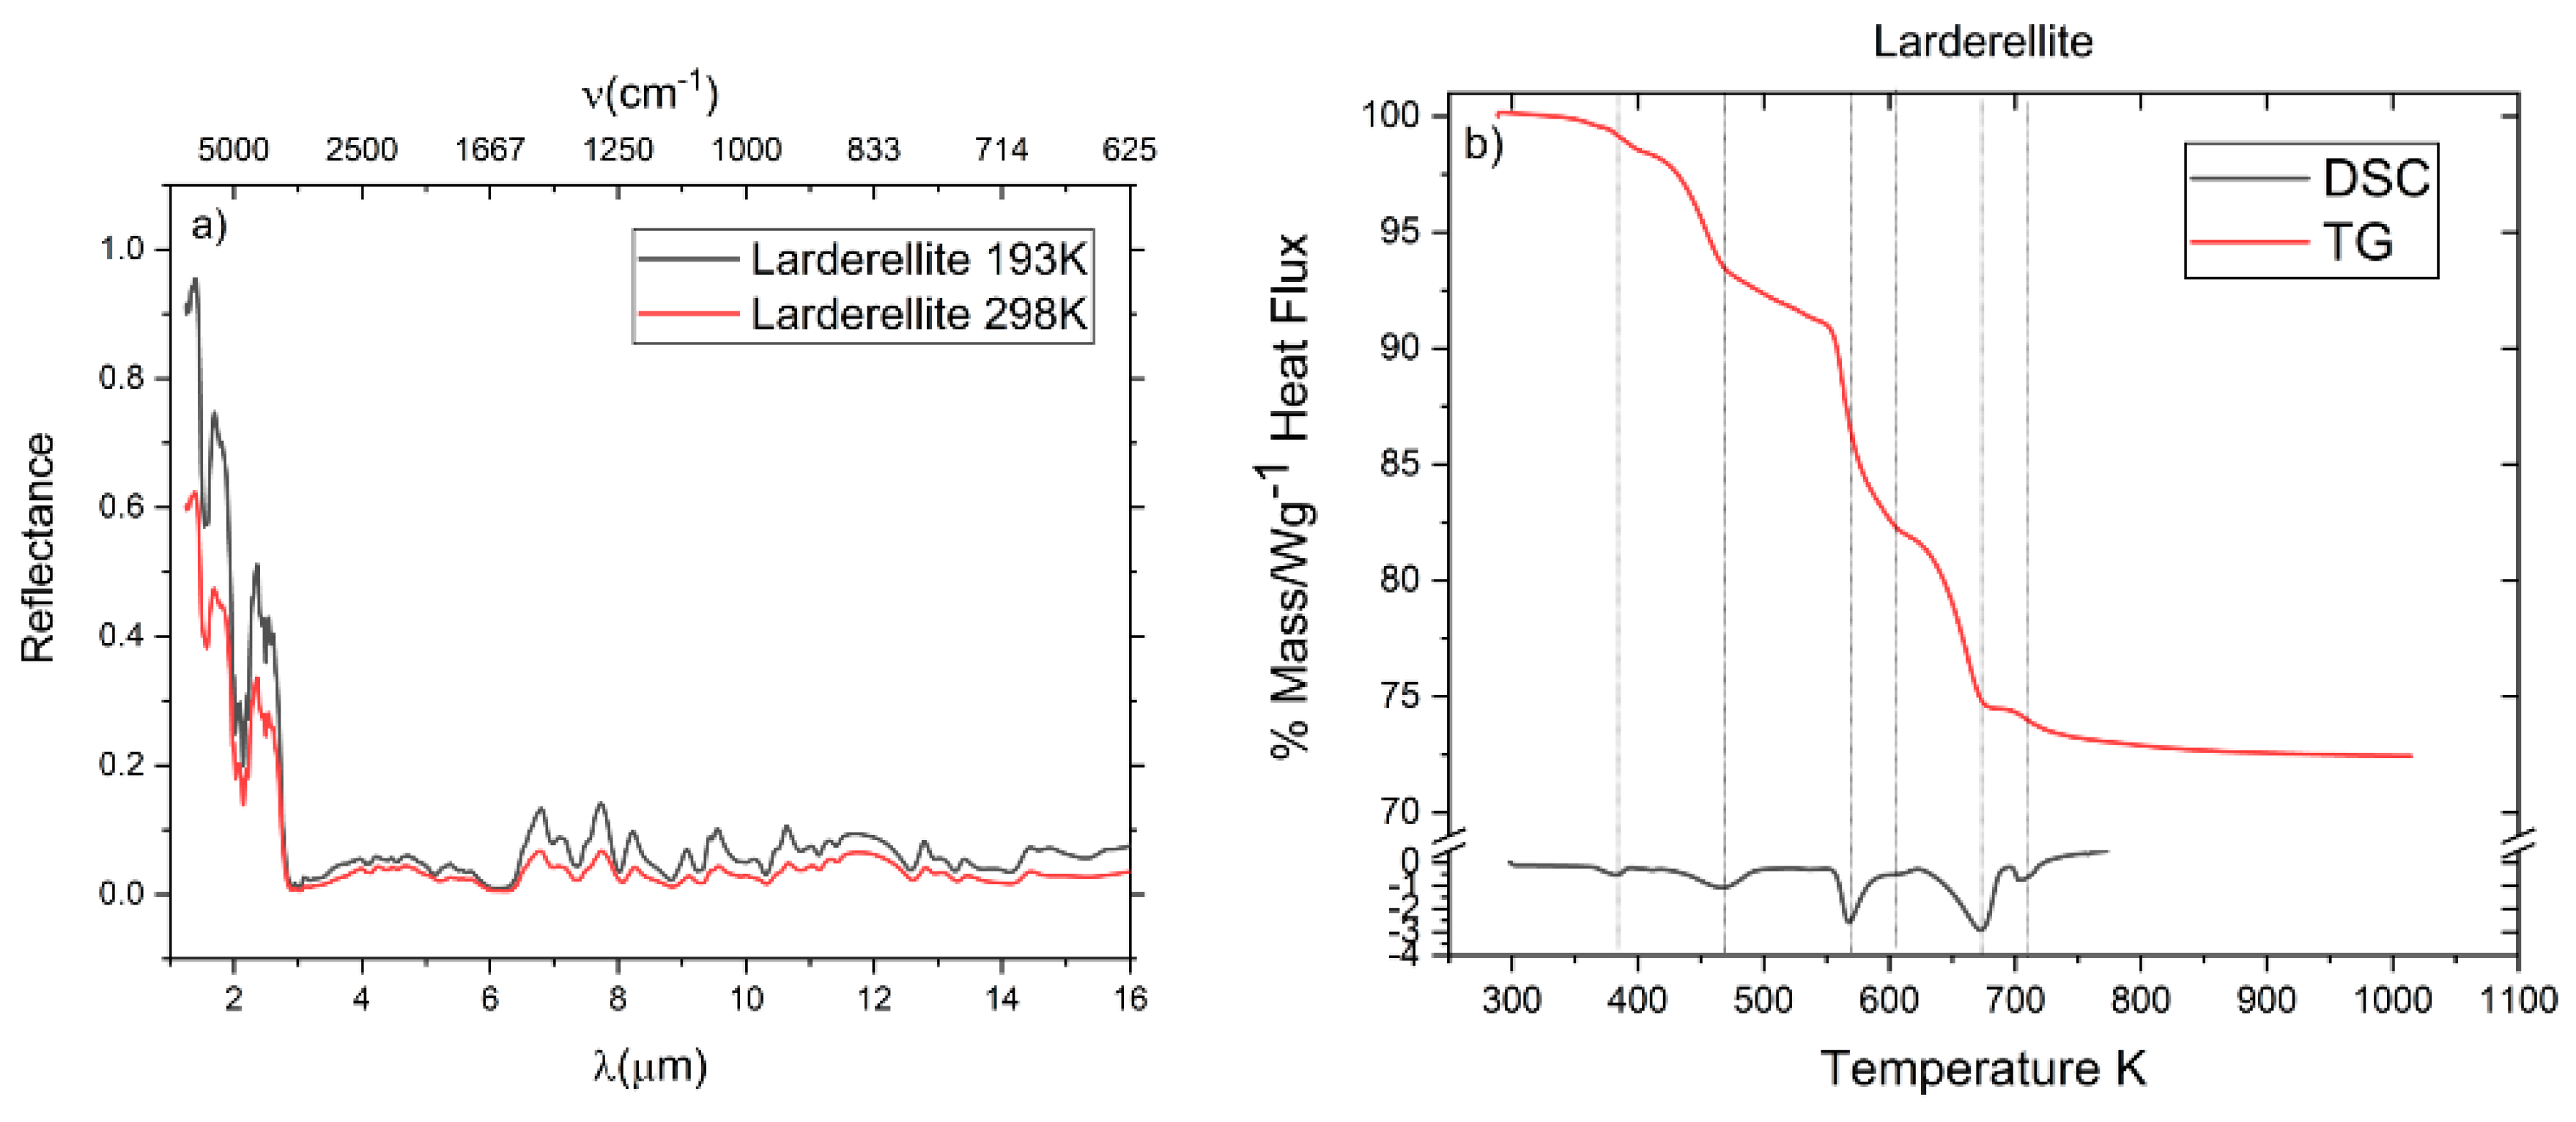
3.1. Larderellite NH4B5O7(OH)2 H2O

The crystal structure of larderellite is monoclinic with space group P21/c and density 1.90 g/cm3 [57]. The framework is composed of double rings made by one BO45− polyhedra and four triangular BO33−, connected to form infinite chains, that constitute the basic units of the larderellite crystal structure [57]. In this mineral (Figure 1a), boron has III and IV coordination. The results (in the right upper angle of Figure 1b), indicate that just a very few percent of bassanite and polyhalite are present in the sample and the average FWHM of larderellite is 0.18°.
At temperature of 573 K, all the structural water is removed, and in the temperature range 603–688 K, the oxidation of ammonium ions to ammonia occurs. At 723 K, the complete loss of water and ammonia is registered. At the temperature of 743 K, the crystal structure becomes amorphous and starts a gradual crystallization of BO3 in the amorphous matrix [58].
The reflectance spectra of larderellite (Figure 2a) present, in the first part (1–4 µm), deep and well-defined absorption bands that split and triple, due to the fundamental H2O/OH stretching vibration (ν1) modes and overtone of the NH4+ (2ν3 at 1.54 µm, ν3 + ν4 at 2.02, 2.10 and 2.23 µm, ν2 + ν4 at 3.23 µm). In the range from 4 to 16 µm, the absorption bands reduce depth and abundance, becoming shallow and wider than the previous ones, due to the fundamental modes of NH4+ and combination/overtone vibrational modes of water. This area presents some spectral features assigned to BO3−/BO45− groups. In the range from 13 to 16 µm, two peaks were related to bending modes of ν2[BO4]3− and ν2[BO4]5−; whereas, from 9 to 11 µm, there is the antisymmetric stretching mode of ν3[BO4]5−. The modes at 8.03 and 8.84 µm are ascribed as in-plane modes of B–O–H [56].
The results obtained from thermal analysis are shown in Figure 2b. Thermal analysis of the larderellite sample can be divided into six major steps of mass losses. The first two steps at 361 and 383 K are associated to the loss of approximately 10.5 wt% of the adsorption water. The steps at 463 and 483 K are due to the leakage of H2O and OH from the larderellite crystal structure. In the DSC curve, in the temperature range from 373 to 483 K, two endothermic effects are observed related to loss of water. At 563 K, a sudden weight loss (~10 wt%) due to water leakage, related to a well-defined and deep peak in DSC analysis, occurs. Three other steps are recorded in the last part of the TG curve at 573, 613 and 673 K associated to NH3 loss with a mass decrease of ~12%. The total loss of mass is ca. 32.5%.

3.2. Struvite NH4MgPO4·6H2O

The crystal structure of struvite is orthorhombic with space group Pmn21 and density 1.70 g/cm3 [59]. It is composed of PO4 tetrahedra, Mg·6H2O octahedra and NH4 tetrahedral groups connected by hydrogen bonds. Figure 3a shows the hydrogen bonds between O–O and N–O. The XRPD results (Figure 3b), indicate the purity of sample consisting of struvite and the average FWHM is 0.29°. Frost et al. [60] reports that struvite loses H2O and NH4 at ~358 K. The partial loss of volatile components implicates the transformation to dittmarite ((NH4)MgPO4 H2O, orthorhombic with space group Pmn21) and to newberyite (Mg(PO3OH)·3(H2O), orthorhombic with space group Pbca) [61].
Reflectance spectra of struvite (Figure 4a) has either poorly marked or absent bands due to the presence of six molecules of water and PO34− ions that decrease the symmetry of the crystal [40]. In the range between 1 and 3 µm, it is possible to observe small and slightly delineated peaks due to the vibrational modes of the NH4+ group and H2O. In the first part of the spectra, PO43− absorption features occur at 2.06 and 2.15 µm, then at 3.88 and 4.78 µm due to overtone and combination of this group, and in the last part, at 8.54 and 9.19 µm, probably related to ν3 stretching vibrational modes. These absorption bands are very weak. The absorption features of PO43− and NH4+ are not completely resolved and they can be overlapped by H2O vibrational modes.
Thermal analyses (Figure 4b) present a deep step at ~393 K due to water and OH leakage (~42.7 wt%). The second one is from 393 to 673 K related to the progressive loss of NH3 (11 wt%). In the DSC curve, a single endothermic peak at 393 K is detected. No phase transitions occurred in the investigated temperature range and the total mass decrease was of 53.7 wt%.

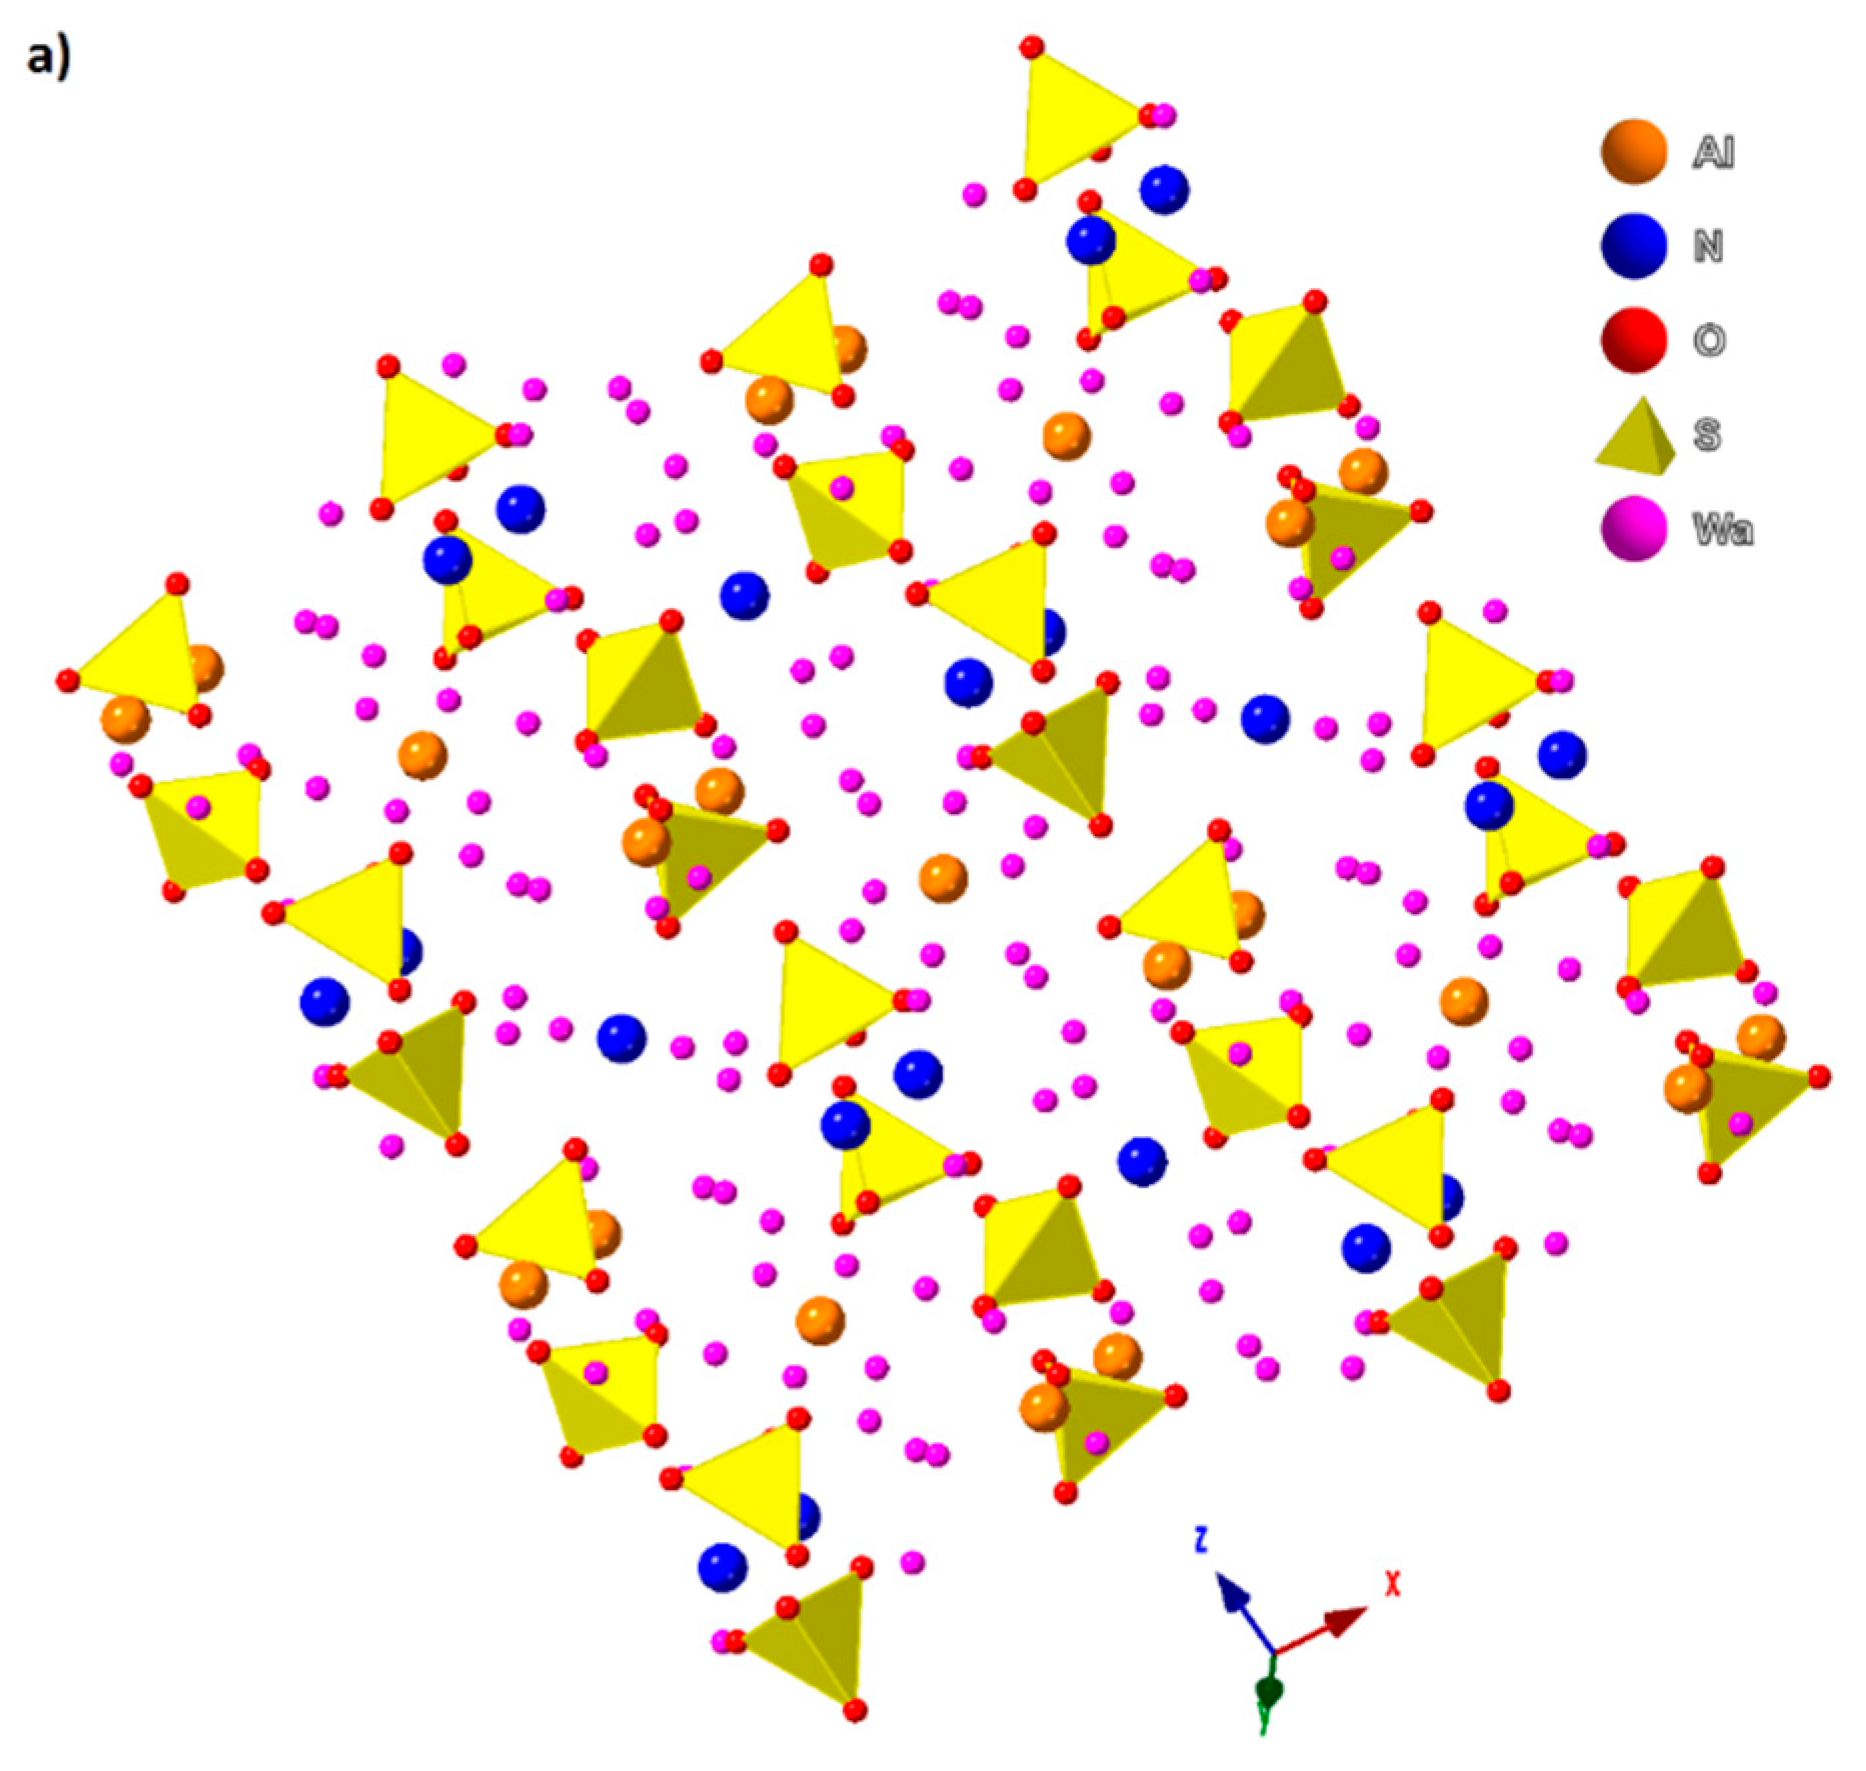
3.3. Tschermigite (NH4)Al(SO4)2·12H2O

The ammonium aluminum sulfate dodecahydrate is cubic with space group Pa3 and density 1.64 g/cm3 [62]. Its crystal structure is composed of tetrahedral and octahedral sulfates of Al(H2O)6 bound by groups of (NH4)(H2O)6 and water molecules, through hydrogen bonds (Figure 5a). The XRPD results (Figure 5b), indicate that the sample consists of tschermigite and the average FWHM is 0.15°. Low-temperature phase transitions occur at 33 and 76 K [26]: at the first transition temperature, a spontaneous polarization occurs, whereas, at the second one, the crystal becomes ferroelectric. Tschermigite mineral also has two phase transformations at high temperature: the one at 552 K, due to dehydration, when it becomes godovikovite (NH4)Al(SO4) (trigonal, space group P321) [62], and the other one in the T (temperature )range 658–893 K, due to NH3 loss, turning into millosevichite (Al)(SO4)3 (trigonal, space group R-3) [63].
Reflectance spectra of tschermigite (Figure 6a) are closely related to those of struvite, even if the high quantity of water molecules determine the decrease of both number and intensity of the absorption features. The reflectance spectra show four absorption bands related to the NH4+ group: at 1.57 and 2.99 µm due to 2ν3 and ν3 vibrational modes respectively, even if the second feature is of ambiguous assignment, and at 5.90 and 6.84 µm ascribed to ν4 fundamental vibrational modes.
H2O/OH absorption features are detected at 1.76, 2.07, 2.14, 10.79(OH-Al), 13.57(OH-Al) and 15.69(OH-Al) µm. SO42− vibrational modes are present only at 7.58 µm due to the fundamental vibrational modes of its group. In this area, the low-temperature reflectance spectrum of tschermigite shows a marked increase in the band at 9.03 µm caused by ν3(SO42−) vibrational modes intensified by the decrease in temperature.
Thermal gravimetry analysis (Figure 6b) presents three steps between 363 to 483 K caused by the progress dehydration of the sample until 573 K. The reduction in mass is of approximately 48% of the total weight. The step at ~853 K can probably be assigned to a complete dehydration of the sample and to a loss of NH3 (~18 wt%) [64]. As suggested by López-Beceiro et al. [65], the mass decrease observed in the TG curve at HT (high temperature) corresponds to the sulfates’ decomposition process. The total loss of mass is ca. 66%. The DSC curve shows an evident peak at ~368 K and a small weak band at 483 K, both endothermic.

3.4. Mascagnite (NH4)2SO4

The mascagnite structure is orthorhombic (Figure 7a) with space group Pnma and density 1.76 g/cm3 [25]. The XRPD results (Figure 7b), indicate that just a very few percent of mohrite ((NH4)2Fe(SO4)2 6H2O) is present in the sample and the average FWHM is 0.28°. As described by Schlemper [25], the transitions at 223 K involve a change of the space group from Pnma at room temperature to Pna21, with a change from para-electric to ferro-electric character. The transition involves a reorganization of hydrogen bond, which determines a mean distance of hydrogen bond decreased by 0.1 Å and less distorted ammonium ions in the ferroelectric phase.
In the ammoniated sulfate reflectance spectra (Figure 8a), the absorption features generated by the fundamental vibrational modes of NH4+ were detected at 3.01(ν3), 5.90(ν4), 6.72(ν4) and 7.22(ν4) µm. Overtone and combinations of these bands are located at 1.59(ν3), 2.13 (ν2 + ν4), 3.23(ν2 + ν4) and 4.86(ν2 + ν6) µm. The SO42− bands are present at 8.35, 8.46, 9.60 and 10.25 µm, the first three caused by ν3 asymmetric stretch and the last by ν1 symmetric stretch.
Unfortunately, the low resolution of the reflectance measurements at room and low temperature has not allowed to investigate the effect of the phase transition on the evolution of NH4+ modes.
Thermal analysis of the mascagnite sample (Figure 8b) pointed out four major steps of mass loss. The first step at 378 K, where a mass reduction of approximately 3% was recorded, is associated to the release of hygroscopic water. The other steps at 591, 624, 656 and 733 K correspond to the mass losses of 14%, 4%, 7% and 60% respectively, related to the progressive decomposition of NH4+ and SO42− as observed in larderellite and tschermigite. In the DSC curve at temperature conditions in the range from 353 to 773 K, two endothermic peaks were observed. The total loss of mass is ca. 85%.

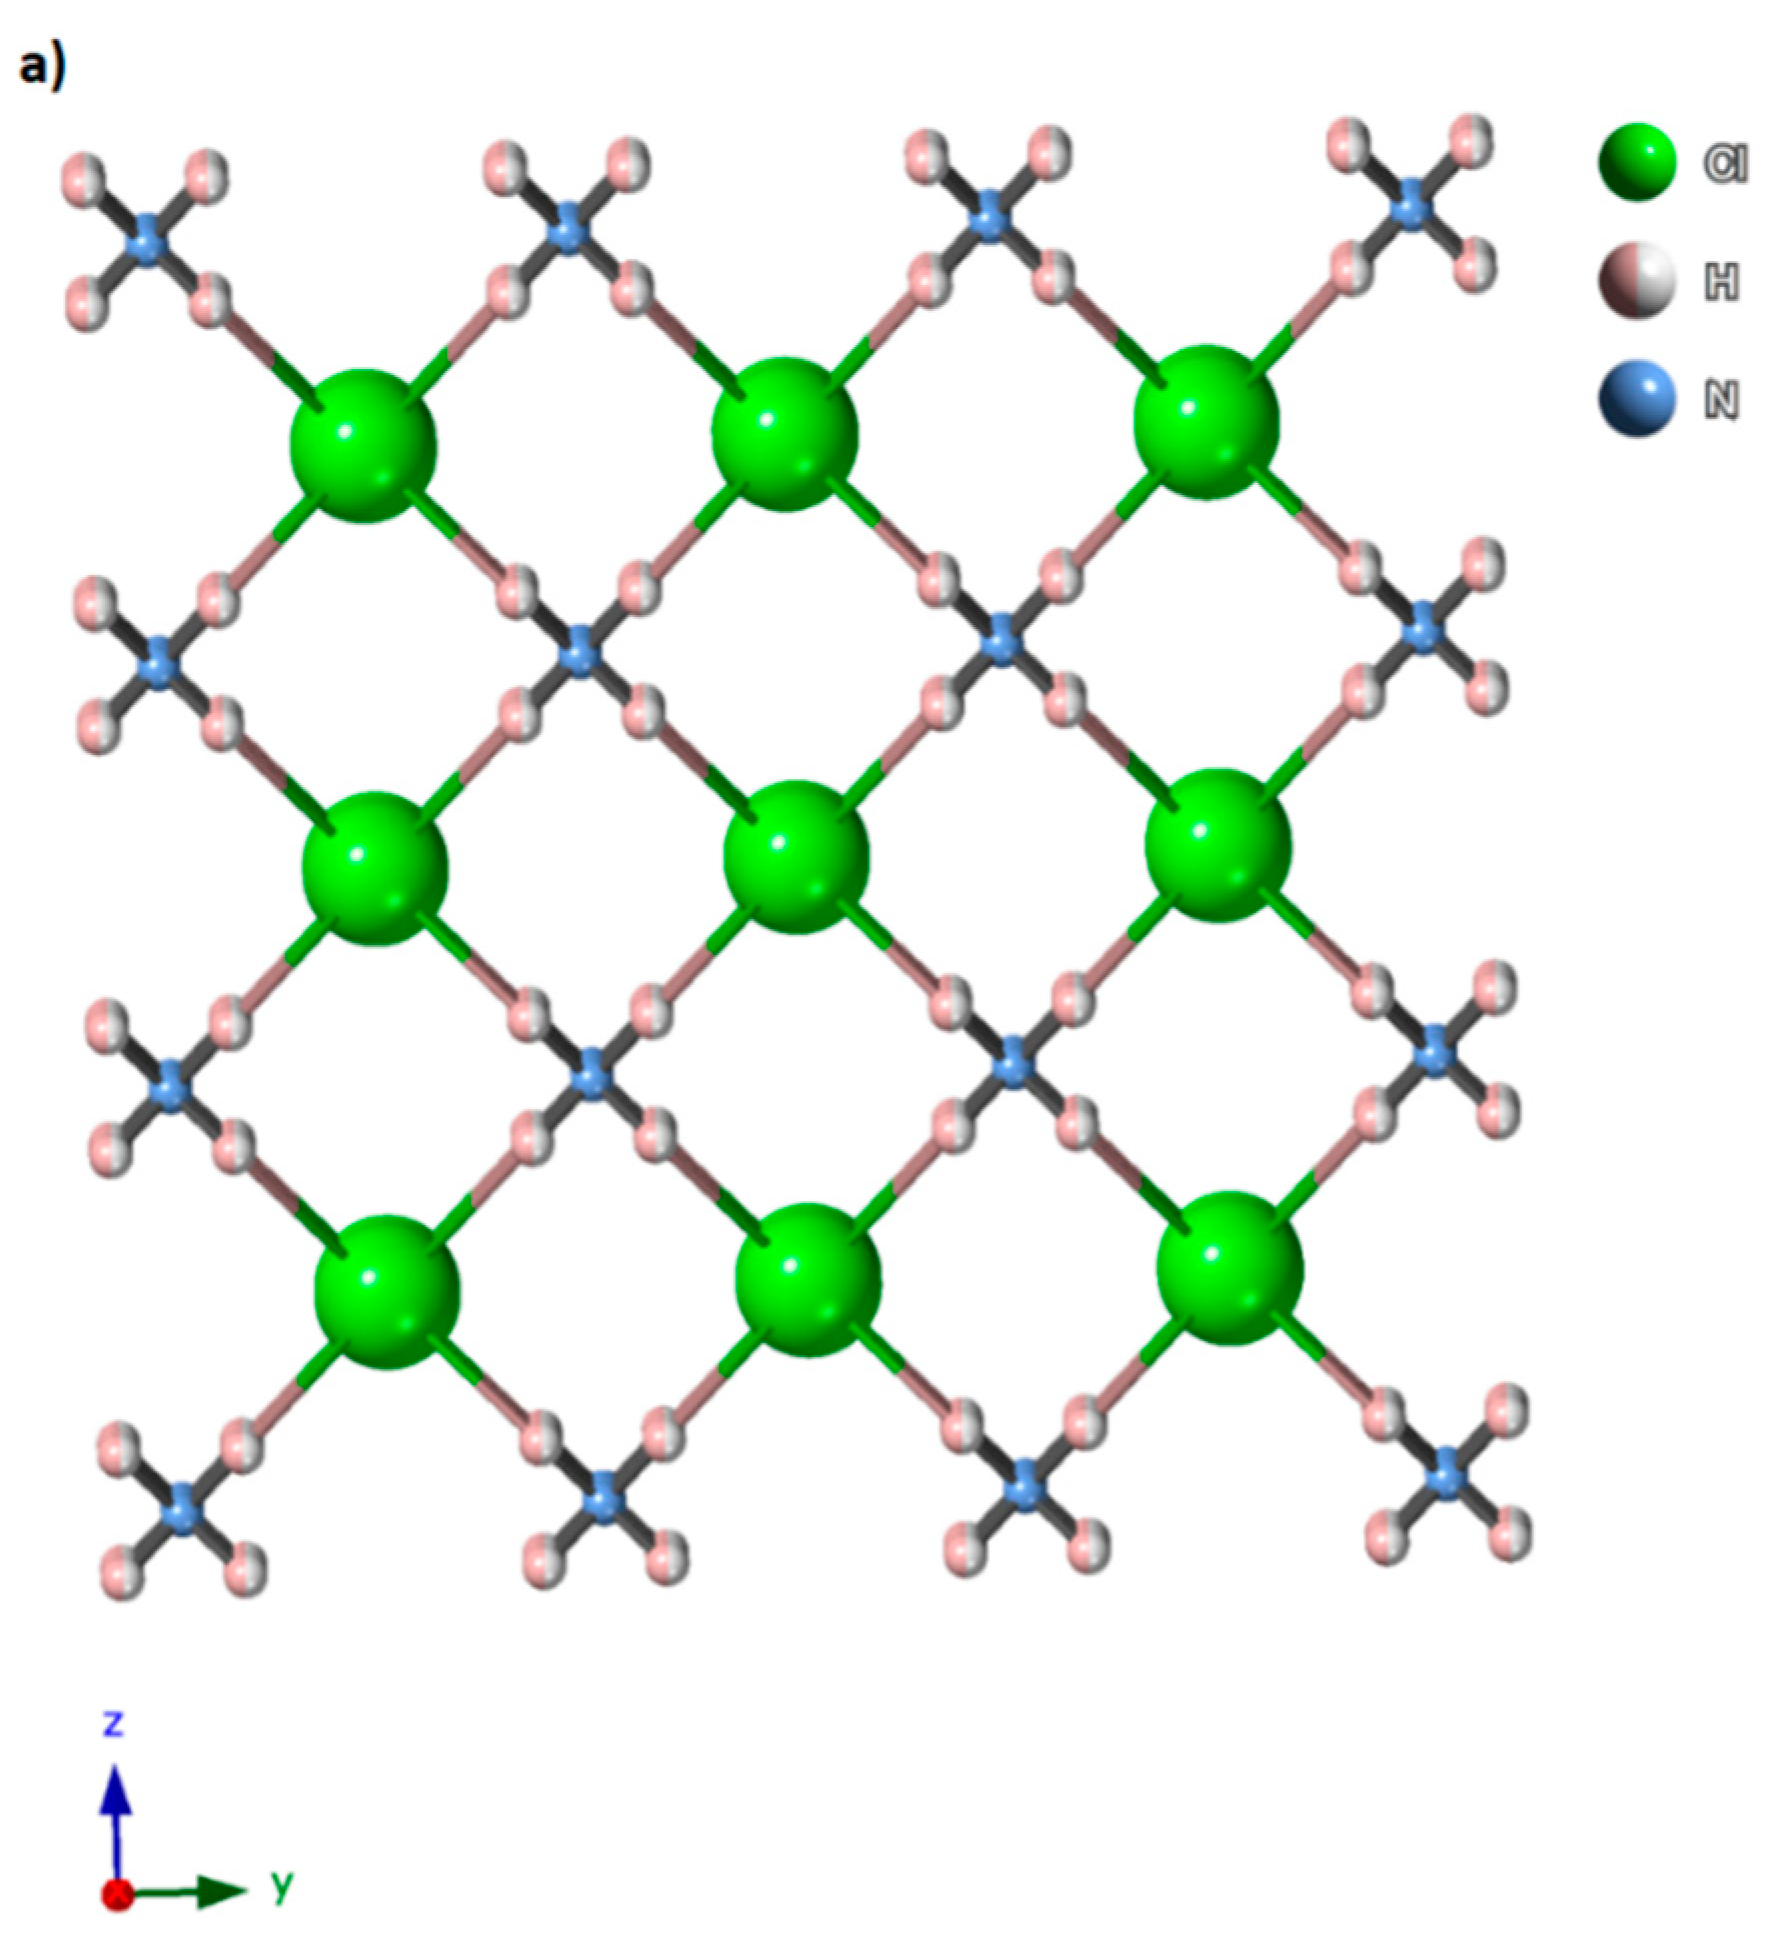
3.5. Sal-Ammoniac NH4Cl

The structure of ammonium chloride (sal-ammoniac) is cubic with space group Pm3m and density ~1.53 g/cm3 [66], with CsCl structure type. Its structure consists of an infinite chain of ions. The Cl ions sit at the eight corners of the cube and the NH4+ sit at the center of the cube (Figure 9a). The XRPD results (Figure 9b), indicate that the sample consists only of sal-ammoniac and the average FWHM is 0.11°. However, in NH4Cl, it is disordered among two positions and therefore assumes an IV + IV, namely VIII, coordination (Figure 9a) at room temperature [36,67]. At 242 K and 1 atmospheric pressure (atm), sal-ammoniac has a transition called “λ-transition”. It is an order-disorder type due to the dynamical behavior of the NH4+ ion. The phase transition temperature is related to the change in pressure, increasing from 242 K at 1 atm to 308 K at 10 Kbar [68].
At high temperature in the range 455–463 K on heating and 453–433 K on cooling, sal-ammoniac undergoes another phase transition from CsCl to NaCl structure type [69].
At room temperature, the sal-ammoniac reflectance spectrum (Figure 10a) shows, in the first part, five outlined, narrow and deep absorption bands connected to NH4+ overtone and combination (see Table 2 and Table 3). We found features related to NH4+ fundamental modes at 3.07 μm (ν3 asymmetric stretch), 6.88 and 7.30 μm (ν4 out-of-plane bend). Two unassigned modes are detected at 3.52 and 9.27 μm. Cl anions features are not visible within the spectra, as reported by Lane et al. [70].
In Figure 10b, the first peak at 465 K in the DSC curve is due to the phase transition related to the change in structure from CsCl to NaCl type [69]; whereas, the second one at 603 K, combined with a strong mass loss evident in the TG curve, is related to ammonia loss. The total loss of mass is ca. 98.5%.

4. Discussion

Some important issues can be underlined from the comparison of the collected data, as presented in the following paragraphs.

4.1. Sal-Ammoniac and Mascagnite Absorption Bands

NH4+-free molecules have four fundamental vibrational modes due to their Td symmetry. Overtone and combinations of these bands generate several absorption features in the region between 1.33 and 2.14 μm, as reported in Table 2. Anhydrous ammonium-bearing minerals, sal-ammoniac and mascagnite, clearly show these absorption bands with no overlapping with other absorption features, but for the ~3 and ~6 μm regions, the influence of either hygroscopic water or hydrogen bonds cannot be excluded. A comparison between the reflectance spectra of sal-ammoniac and mascagnite at room temperature (Figure 11) underlines that the 1.3 and 1.56 μm features are more defined in the ammonium chloride sample. This trend is also evident in the 2.2 μm area. Moreover, sal-ammoniac displays a splitting of the 1.56 μm peak.
In the area near 3 μm, both samples present a large and flat peak, probably caused by the overlap with the water absorption feature. SO42+ typical absorption features are not present in this first part of the mascagnite spectrum. The shift of the absorption bands from 1.56 and 2.2 μm sal-ammoniac spectrum towards shorter wavelengths in mascagnite can be due to the different strength of the hydrogen bonds in the two minerals.
The spectral range from 4 to 9 μm shows well-defined bands for the NH4Cl sample due to fundamental and combination modes of NH4+, whereas (NH4)2SO4 reflectance spectra present either coincidence or overlapping with SO42+ groups, which makes the band assignment more ambiguous than in sal-ammoniac. Thus, the four absorption bands detected in the (NH4)2SO4 reflectance spectra are likely ascribable, the first two, to the combination of ν2 + ν6(NH4+) and ν2 + ν5(NH4+), and the last two due to ν4(NH4+) fundamental vibrational modes.
The lower definition of the absorption features in the mascagnite spectrum can also be due to multiple absorption bands of NH4+ which overlap with eventual spectral features attributed to ambient water molecules adsorbed on the sample. In addition, the shallower depth of the absorption bands in the spectrum of ammonium sulfate is due to a lower concentration of NH4+ [29]. These causes give rise to wider and less resolved features in the latter spectrum.
Analyzing the bands at 6.88 and 7.30 μm of the sal-ammoniac sample and at 6.72 and 7.22 μm of mascagnite (Figure 11), assigned to fundamental vibrational bending modes ν4(NH4+), we can see an increase of the bending frequencies related to the strength of the hydrogen bonds. Thus, by the present work, we can suggest that the frequency range from ~6.5 to ~7.5 μm is the best candidate area to analyze the frequency shifts that are not influenced by overtone and combination and deeply understand the features related to the NH4+ group itself.

4.2. Larderellite, Struvite and Tschermigite Absorption Bands

Laderellite, struvite and tschermigite have respectively 1, 6 and 12 molecules of water. The increasing amount of water in the samples affects the position and shape of the absorption features, as reported in the literature (e.g., Cloutis et al. [46]). The weaker ammonium bands at ~1.57 (2ν3), 2.14 (ν3 + ν4) and 2.99 μm (ν3) (Figure 12) are of ambiguous assignment and connected to the presence of water and anions, e.g., PO43− (struvite sample). Analyzing the spectra in Figure 12, we notice a strong similarity between struvite and tschermigite; whereas, larderellite shows important differences mainly attributable to sharper and more defined features with respect to the former two. The broadening of the struvite and tschermigite absorption bands and the appearance of multiple overlapping can be explained, in compliance with the above-presented discussions, with a reduction of symmetry of these two minerals with respect to larderellite. In this case, the amount of water molecules and the presence of the PO43− anion play a fundamental role in reducing the symmetry in struvite and tschermigite [40]. Moreover, the progressive decrease in bands’ depth is correlated not only with the increase of the number of water molecules, but also with the reduction of NH4+ concentration (larderellite 7.63 g/mol, struvite 7.35 g/mol and tshermigite 3.98 g/mol) [71].

4.3. 1.58 μm Bands Complex

The comparison of the hydrogen bonds in the low hydrated and anhydrous ammonium-bearing minerals studied here shows intriguing differences among the different minerals, which depend on the structural configuration. The strength of the hydrogen bond affects the N–H…X bond lengths [19,24] and therefore, the frequencies of 2ν3(NH4+). If we compare the donor-acceptor average distances for larderellite (2.91 Å), mascagnite (2.41 Å) and sal-ammoniac (2.36 Å) with the corresponding frequencies of the 2ν3 (NH4+), we can see that a decrease of the hydrogen bond strength (strength with which a chemical bond holds two atoms together) is inversely related with the 2ν3(NH4+) frequency (Figure 13).

4.4. Low-Temperature Reflectance Spectra

The temperature dependence of H2O and NH4+ features can give some information about the behavior of each absorption band. For all the analyzed absorption features, the depth and area increase as T decreases. In Table 4, we report the value of bands centroid of the main absorption features in the region up to 3 μm. In analogy with other works (e.g., De Angelis et al. [72]), we notice the different trend of the band position with the T decrease, for H2O and NH4+ absorption features. In particular, in the first part of the spectra, bands related to NH4+ vibrational modes shift toward shorter wavelengths, whereas H2O shows the opposite trend, shifting toward longer wavelengths. The behavior of H2O bands is due to the increase of the hydrogen bond strength as temperature decreases. As overlapping absorption bands due to both H2O and NH4+ are considered, the behavior is mixed. Therefore, given the strong influence of temperature on the features of the collected spectra, we can suggest that in order to detect important spectral variations, a wide temperature range of data collection is necessary.

5. Conclusions

In this study, we have analyzed the reflectance spectral features and the dehydration behavior of five different ammoniated bearing minerals.
Absorption features due to anion groups (SO42−, PO43−, BO45−, BO33−) are mainly present in the spectral range over 3 µm. The absorption features at ~1.58 µm, related to 2ν3, are the most affected by the crystal structure variations related to the hydrogen bond lengths. These absorption features, together with those at ~6.88 (ν4) and ~7.3 (ν4) µm (for anhydrous samples), can be used to distinguish among different NH4+-bearing minerals. Moreover, the depth of these bands can be diagnostic as a function of the amount of ammonia inside the samples.
The remote space observations have so far covered a very narrow spectral range that is sometimes not diagnostic, so it is very important to collect data with a wider spectral range and consider the composition dependence of the various band features. Usually, ammonium minerals are ancillary components on the surface of celestial bodies. For this reason, a specific investigation of typical absorption bands can be useful for their identification in the remote sensing spectra.
The reflectance spectra collected in this work, mainly sal-ammoniac and mascagnite, can be useful for interpreting and resolving absorption bands at ~2.2 µm for Cere’s Occator crater spectrum [73]. Regarding the spectrum of Virgil Fossae on Pluto, the careful analysis of the features at ~1.6 microns can provide important evidence to establish which is the best candidate to represent the surface of the body [18].
In conclusion, the detailed analysis of reflectance spectra combined with thermal analysis provide new insights for the detection of NH4+ minerals within reflectance planetary spectra and their stability field. Future research with a wider temperature range is necessary for better assignations.

Author Contributions

Conceptualization, M.F., P.C. and A.Z.; Data curation, M.F., P.C., A.M. and A.Z.; Methodology, M.F., P.C., A.M. and A.Z.; Writing—original draft, M.F., P.C. and A.Z.; Writing—review and editing, M.F., P.C., A.M. and A.Z. All authors have read and agreed to the published version of the manuscript.

Funding

This work has been done in the frame of the Trans-National access program of Europlanet 2020-RI, which has received funding from the European Union’s Horizon 2020 research and innovation programme under grant agreement No 18-EPN4-040.

Acknowledgments

We would like to thank Anna Donnadio and Riccardo Vivani (University of Perugia) for helping with the collection of the thermal analyses. Tonci Balic Zunic (Copenaghen University) is acknowledged for suppling some of the analyzed samples.

Conflicts of Interest

The authors declare no conflict of interest.

References

  1. Krohn, M.D.; Kendall, C.; Evans, J.R.; Fries, T.L. Relations of ammonium minerals at several hydrothermal systems in the western US. J. Volcanol. Geotherm. Res. 1993, 56, 401–413. [Google Scholar] [CrossRef]
  2. King, T.V.; Clark, R.N.; Calvin, W.M.; Sherman, D.M.; Brown, R.H. Evidence for ammonium-bearing minerals on Ceres. Science 1992, 255, 1551–1553. [Google Scholar] [CrossRef] [Green Version]
  3. De Sanctis, M.C.; Ammannito, E.; Raponi, A.; Marchi, S.; McCord, T.B.; McSween, H.Y.; Longobardo, A. Ammoniated phyllosilicates with a likely outer Solar System origin on (1) Ceres. Nature 2015, 528, 241. [Google Scholar] [CrossRef] [Green Version]
  4. Russell, C.T.; Capaccioni, F.; Coradini, A.; De Sanctis, M.C.; Feldman, W.C.; Jaumann, R.; Pieters, C.M. Dawn mission to Vesta and Ceres. Earth Moon Planets 2007, 101, 65–91. [Google Scholar] [CrossRef]
  5. De Sanctis, M.C.; Mitri, G.; Castillo-Rogez, J.; House, C.H.; Marchi, S.; Raymond, C.A.; Sekine, Y. Relict Ocean Worlds: Ceres. Space Sci. Rev. 2020, 216. [Google Scholar] [CrossRef]
  6. Quinn, R.C.; Chittenden, J.D.; Kounaves, S.P.; Hecht, M.H. The oxidation-reduction potential of aqueous soil solutions at the Mars Phoenix landing site. Geophys. Res. Lett. 2011, 38. [Google Scholar] [CrossRef]
  7. Sefton-Nash, E.; Catling, D.C.; Wood, S.E.; Grindrod, P.M.; Teanby, N.A. Topographic, spectral and thermal inertia analysis of interior layered deposits in Iani Chaos, Mars. Icarus 2012, 221, 20–42. [Google Scholar] [CrossRef] [Green Version]
  8. Owen, T.; Mahaffy, P.R.; Niemann, H.B.; Atreya, S.; Wong, M. Protosolar nitrogen. Astrophys. J. 2001, 553, L77–L79. [Google Scholar] [CrossRef]
  9. Poch, O.; Istiqomah, I.; Quirico, E.; Beck, P.; Schmitt, B.; Theulé, P.; Ciarniello, M. Ammonium salts are a reservoir of nitrogen on a cometary nucleus and possibly on some asteroids. Science 2020, 367, eaaw7462. [Google Scholar] [CrossRef] [PubMed]
  10. Stoks, P.G.; Schwartz, A.W. Nitrogen-heterocyclic compounds in meteorites: Significance and mechanisms of formation. Eochim. Cosmochim. Acta 1981, 45, 563–569. [Google Scholar] [CrossRef]
  11. Cook, J.C.; Desch, S.J.; Roush, T.L.; Trujillo, C.A.; Geballe, T.R. Near-infrared spectroscopy of Charon: Possible evidence for cryovolcanism on Kuiper belt objects. Astrophys. J. 2007, 663, 1406–1419. [Google Scholar] [CrossRef]
  12. Cook, J.C.; Dalle Ore, C.M.; Protopapa, S.; Binzel, R.P.; Cartwright, R.; Cruikshank, D.P.; Jennings, D.E. Composition of Pluto’s small satellites: Analysis of New Horizons spectral images. Icarus 2018, 315, 30–45. [Google Scholar] [CrossRef]
  13. Dalle Ore, C.M.; Protopapa, S.; Cook, J.C.; Grundy, W.M.; Cruikshank, D.P.; Verbiscer, A.J.; Young, L.A. Ices on Charon: Distribution of H2O and NH3 from New Horizons LEISA observations. Icarus 2018, 300, 21–32. [Google Scholar] [CrossRef]
  14. Dalle Ore, C.M.; Cruikshank, D.P.; Protopapa, S.; Scipioni, F.; McKinnon, W.B.; Cook, J.C.; Verbiscer, A. Detection of ammonia on Pluto’s surface in a region of geologically recent tectonism. Sci. Adv. 2019, 5, eaav5731. [Google Scholar] [CrossRef] [PubMed] [Green Version]
  15. Spohn, T.; Schubert, G. Oceans in the icy Galilean satellites of Jupiter? Icarus 2003, 161, 456–467. [Google Scholar] [CrossRef]
  16. Khurana, K.K.; Kivelson, M.G.; Stevenson, D.J.; Schubert, G.; Russell, C.T.; Walker, R.J.; Polanskey, C. Induced magnetic fields as evidence for subsurface oceans in Europa and Callisto. Nature 1998, 395, 777–780. [Google Scholar] [CrossRef] [PubMed]
  17. Zimmer, C.; Khurana, K.K.; Kivelson, M.G. Subsurface oceans on Europa and Callisto: Constraints from Galileo magnetometer observations. Icarus 2000, 147, 329–347. [Google Scholar] [CrossRef] [Green Version]
  18. Jia, X.; Kivelson, M.G.; Khurana, K.K.; Kurth, W.S. Evidence of a plume on Europa from Galileo magnetic and plasma wave signatures. Nat. Astron. 2018, 2, 459–464. [Google Scholar] [CrossRef]
  19. Fortes, A.D. Exobiological implications of a possible ammonia–water ocean inside Titan. Icarus 2000, 146, 444–452. [Google Scholar] [CrossRef]
  20. Balić-Žunić, T.; Garavelli, A.; Jakobsson, S.P.; Jonasson, K.; Katerinopoulos, A.; Kyriakopoulos, K.; Acquafredda, P. Fumarolic minerals: An overview of active European volcanoes. In Updates in Volcanology—From Volcano Modelling to Volcano Geology; IntechOpen: London, UK, 2016; pp. 267–322. [Google Scholar]
  21. Holloway, J.M.; Dahlgren, R.A. Nitrogen in rock: Occurrences and biogeochemical implications. Glob. Biogeochem. Cycles 2002, 16, 65-1–65-17. [Google Scholar] [CrossRef]
  22. Harlov, D.E.; Andrut, M.; Melzer, S. Characterization of NH4-phlogopite (NH4)(Mg3)[AlSi3O10](OH)2 and ND4-phlogopite (ND4)(Mg3)[AlSi3O10](OD)2 using IR spectroscopy and Rietveld refinement of XRD spectra. Phys. Chem. Miner. 2001, 28, 77–86. [Google Scholar] [CrossRef]
  23. Plumb, R.C.; Hornig, D.F. Infrared Spectrum, X-ray Diffraction Pattern, and Structure of Ammonium Fluoride. J. Chem. Phys. 1955, 23, 947–953. [Google Scholar] [CrossRef]
  24. Schutte, C.J.H.; Heyns, A.M. Low-Temperature Studies. IV. The Phase Transitions of Ammonium Sulfate and Ammonium-d 4 Sulfate; the Nature of Hydrogen Bonding and the Reorientation of the NX4+ Ions. J. Chem. Phys. 1970, 52, 864–871. [Google Scholar] [CrossRef]
  25. Schlemper, E.O.; Hamilton, W.C. Neutron-Diffraction Study of the Structures of Ferroelectric and Paraelectric Ammonium Sulfate. Int. J. Chem. Phys. 1966, 44, 4498–4509. [Google Scholar] [CrossRef]
  26. Sekine, A.; Sumita, M.; Osaka, T.; Makita, Y. Ferroelectricity and dielectric relaxation in NH4Al(SO4)2·12H2O. J. Phys. Soc. Jpn. 1988, 57, 4004–4010. [Google Scholar] [CrossRef]
  27. Krohn, M.D.; Altaner, S.P. Near-infrared detection of ammonium minerals. Geophysics 1987, 52, 924–930. [Google Scholar] [CrossRef]
  28. Bishop, J.L.; Banin, A.; Mancinelli, R.L.; Klovstad, M.R. Detection of soluble and fixed NH4+ in clay minerals by DTA and IR reflectance spectroscopy: A potential tool for planetary surface exploration. Planet. Space Sci. 2002, 50, 11–19. [Google Scholar] [CrossRef]
  29. Berg, B.L.; Cloutis, E.A.; Beck, P.; Vernazza, P.; Bishop, J.L.; Takir, D.; Mann, P. Reflectance spectroscopy (0.35–8 μm) of ammonium-bearing minerals and qualitative comparison to Ceres-like asteroids. Icarus 2016, 265, 218–237. [Google Scholar] [CrossRef]
  30. Ehlmann, B.L.; Hodyss, R.; Bristow, T.F.; Rossman, G.R.; Ammannito, E.; De Sanctis, M.C.; Raymond, C.A. Ambient and cold-temperature infrared spectra and XRD patterns of ammoniated phyllosilicates and carbonaceous chondrite meteorites relevant to Ceres and other solar system bodies. Meteorit. Planet. Sci. 2018, 53, 1884–1901. [Google Scholar] [CrossRef] [Green Version]
  31. Pasek, M.A.; Mousis, O.; Lunine, J.I. Phosphorus chemistry on Titan. Icarus 2011, 212, 751–761. [Google Scholar] [CrossRef]
  32. Scorei, R. Is boron a prebiotic element? A mini-review of the essentiality of boron for the appearance of life on earth. Orig. Life Evol. Biosph. 2012, 42, 3–17. [Google Scholar] [CrossRef] [PubMed]
  33. Gasda, P.J.; Haldeman, E.B.; Wiens, R.C.; Rapin, W.; Bristow, T.F.; Bridges, J.C.; Lanza, N.L. In situ detection of boron by ChemCam on Mars. Geophys. Res. Lett. 2017, 44, 8739–8748. [Google Scholar] [CrossRef]
  34. Hedman, M.M. Using cosmogenic Lithium, Beryllium and Boron to determine the surface ages of icy objects in the outer solar system. Icarus 2019, 330, 1–4. [Google Scholar] [CrossRef]
  35. Nakamoto, K. Infrared and Raman Spectra of Inorganic and Coordination Compounds: Part A: Theory and Applications in Inorganic Chemistry, 6th ed.; Wiley-Interscience: New York, NY, USA, 2008. [Google Scholar]
  36. Wagner, E.L.; Hornig, D.F. The Vibrational Spectra of Molecules and Complex Ions in Crystals III. Ammonium Chloride and Deutero-Ammonium Chloride. J. Chem. Phys. 1950, 18, 296–304. [Google Scholar] [CrossRef]
  37. Busigny, V.; Cartigny, P.; Philippot, P.; Javoy, M. Quantitative analysis of ammonium in biotite using infrared spectroscopy. Am. Miner. 2004, 89, 1625–1630. [Google Scholar] [CrossRef]
  38. Ross, S.D. Sulfates and Other Oxy-Anions of Group VI. In The Infrared Spectra of Minerals; Farmer, V.C., Ed.; Mineralogical Society: London, UK, 1974; pp. 423–444. [Google Scholar]
  39. Cooper, C.D.; Mustard, J.F. Spectroscopy of loose and cemented sulphate bearing soils: Implications for duricrust on Mars. Icarus 2002, 158, 42–55. [Google Scholar] [CrossRef]
  40. Stefov, V.; Šoptrajanov, B.; Spirovski, F.; Kuzmanovski, I.; Lutz, H.D.; Engelen, B. Infrared and Raman spectra of magnesium ammonium phosphate hexahydrate (struvite) and its isomorphous analogues. I. Spectra of protiated and partially deuterated magnesium potassium phosphate hexahydrate. J. Mol. Struct. 2004, 689, 1–10. [Google Scholar] [CrossRef]
  41. Wu, T.; Peking University. Vibrational Spectra and Structure of Polyatomic Molecules; Edwards, J.W., Ed.; National University of Peking: Kunming, China, 1946. [Google Scholar]
  42. Kolesov, B.A.; Geiger, C.A. The orientation and vibrational states of H2O in synthetic alkali-free beryl. Phys. Chem. Miner. 2000, 27, 557–564. [Google Scholar] [CrossRef]
  43. Clark, R.N.; King, T.V.V.; Klejwa, M.; Swayze, G.A.; Vergo, N. High spectral resolution reflectance spectroscopy of minerals. J. Geophys. Res. Space Phys. 1990, 95, 12653–12680. [Google Scholar] [CrossRef] [Green Version]
  44. Yamatera, H.; Fitzpatrick, B.; Gordon, G. Near infrared spectra of water and aqueous solutions. J. Mol. Spectrosc. 1964, 14, 268–278. [Google Scholar] [CrossRef]
  45. Bayly, J.; Kartha, V.; Stevens, W. The absorption spectra of liquid phase H2O, HDO and D2O from 0.7 μm to 10 μm. Infrared Phys. 1963, 3, 211–223. [Google Scholar] [CrossRef]
  46. Cloutis, E.A.; Hawthorne, F.C.; Stanley, A.; Mertzman, K.K.; Michael, A.C.; Dionne, M.; Michelle Methot, J.S.; John, F.M.; Diana, L.B.; James, F.B., III; et al. Detection and discrimination of sulphate minerals using reflectance spectroscopy. Icarus 2006, 184, 121–157. [Google Scholar] [CrossRef]
  47. Moenke, H.H.W. Vibrational spectra and the crystal-chemical classification of minerals. In The Infrared Spectra of Minerals; Farmer, V.C., Ed.; Mineralogical Society: London, UK, 1974; pp. 111–118. [Google Scholar]
  48. Bishop, J.L.; Dyar, M.D.; Lane, M.D.; Banfield, J.F. Spectral identification of hydrated sulfates on Mars and comparison with acidic environments on Earth. Int. J. Astrobiol. 2004, 3, 275–285. [Google Scholar] [CrossRef] [Green Version]
  49. Maturilli, A.; Helbert, J.; Arnold, G. The newly improved set-up at the Planetary Spectroscopy Laboratory (PSL). In Infrared Remote Sensing and Instrumentation XXVII; SPIE Optical Engineering Applications: San Diego, CA, USA, 2019; Volume 11128, p. 111280T. [Google Scholar]
  50. Rietveld, H.M. A profile refinement method for nuclear and magnetic structures. J. Appl. Crystallogr. 1969, 2, 65–71. [Google Scholar] [CrossRef]
  51. Larson, A.C.; Von Dreele, R.B. Generalized Structure Analysis System; University of California: San Diego, CA, USA, 1988. [Google Scholar]
  52. Toby, B.H. EXPGUI, a graphical user interface for GSAS. J. Appl. Crystallogr. 2001, 34, 210–213. [Google Scholar] [CrossRef] [Green Version]
  53. Dollase, W.A. Correction of intensities for preferred orientation in powder diffractometry: Application of the March model. J. Appl. Crystallogr. 1986, 19, 267–272. [Google Scholar] [CrossRef]
  54. Degen, T.; Sadki, M.; Bron, E.; König, U.; Nénert, G. The HighScore suite. Powder Differ. 2014, 29, S13–S18. [Google Scholar] [CrossRef] [Green Version]
  55. Sergeeva, A.; Zhitova, E.S.; Bocharov, V.N. Infrared and Raman spectroscopy of tschermigite, (NH4)Al(SO4)2∙12H2O. Vib. Spectrosc. 2019, 105, 102983. [Google Scholar] [CrossRef]
  56. Korybska-Sadło, I.; Sitarz, M.; Król, M.; Bartz, W.; Prell, M.; Gunia, P. Spectroscopic characterization of rare hydrated ammonium borate mineral larderellite. J. Mol. Struct. 2018, 1159, 226–232. [Google Scholar] [CrossRef]
  57. Merlino, S.; Sartori, F. The crystal structure of larderellite, NH4B5O7(OH)2·H2O. Acta Crystallogr. Sect. B Struct. Crystallogr. Cryst. Chem. 1969, 25, 2264–2270. [Google Scholar] [CrossRef]
  58. Waclawska, I. Structural mechanism of thermal reactions of larderellite. J. Alloy. Compd. 1997, 257, 191–195. [Google Scholar] [CrossRef]
  59. Ferraris, G.; Fuess, H.; Joswig, W. Neutron diffraction study of MgNH4PO4·6H2O (struvite) and survey of water molecules donating short hydrogen bonds. Acta Cryst. B 1986, 42, 253–258. [Google Scholar] [CrossRef]
  60. Frost, R.L.; Weier, M.L.; Erickson, K.L. Thermal decomposition of struvite. J. Therm. Anal. Calorim. 2004, 76, 1025–1033. [Google Scholar] [CrossRef] [Green Version]
  61. Bayuseno, A.P.; Schmahl, W.W. Thermal decomposition of struvite in water: Qualitative and quantitative mineralogy analysis. Environ. Technol. 2019, 1–7. [Google Scholar] [CrossRef] [PubMed]
  62. Abdeen, A.M.; Will, G.; Schäfer, W.; Kirfel, A.; Bargouth, M.O.; Recker, K. X-ray and neutron diffraction study of alums. Z. Krist. 1981, 157, 147–166. [Google Scholar]
  63. Lim, A.R.; Moon, H.G.; Chang, J.H. Nuclear magnetic resonance study of the phase transitions and local environments of α-alum NH4Al (SO4)2·12H2O single crystals. Chem. Phys. 2010, 371, 91–95. [Google Scholar] [CrossRef]
  64. Zhitova, E.S.; Sergeeva, A.V.; Nuzhdaev, A.A.; Krzhizhanovskaya, M.G.; Chubarov, V.M. Tschermigite from thermal fields of Southern Kamchatka: High-temperature transformation and peculiarities of IR-spectrum. Zapiski RMO (RMS) 2019, 148, 100–116. [Google Scholar] [CrossRef]
  65. López-Beceiro, J.J.; Pascual-Cosp, J.; Artiaga, R.; Tarrío-Saavedra, J.; Naya, S. Thermal characterization of ammonium alum. J. Therm. Anal. Calorim. 2010, 104, 127–130. [Google Scholar] [CrossRef]
  66. Sirdeshmukh, D.B.; Deshpande, V.T. X-ray measurement of the thermal expansion of ammonium chloride. Acta Cryst. A 1970, 26, 295. [Google Scholar] [CrossRef] [Green Version]
  67. Vainshtein, B.K. Refinement of the structure of the group NH4 in the structure of ammonium chloride. Dokl. Akad. Nauk SSSR 1956, 12, 18–24. [Google Scholar]
  68. Wang, C.H.; Wright, R.B. Raman scattering study of the effect of pressure and temperature on the order-disorder phase transition in ammonium chloride. Int. J. Chem. Phys. 1974, 60, 849–854. [Google Scholar] [CrossRef]
  69. Shimada, S.; Katsuda, Y.; Inagaki, M. A study on phase transition of CsCl ⇌ NaCl in CsCl, NH4Cl and NH4Br by simultaneous AE-DTA measurement. Thermochim. Acta 1995, 267, 405–413. [Google Scholar] [CrossRef]
  70. Lane, M.D. Mid-infrared emission spectroscopy of sulfate and sulfate-bearing minerals. Am. Miner. 2007, 92, 1–18. [Google Scholar] [CrossRef]
  71. Felzer, B.; Hauff, P.; Goetz, A.F.H. Quantitative reflectance spectroscopy of buddingtonite from the Cuprite mining district, Nevada. J. Geophys. Res. Space Phys. 1994, 99, 2887–2895. [Google Scholar] [CrossRef]
  72. De Angelis, S.; Carli, C.; Tosi, F.; Beck, P.; Brissaud, O.; Schmitt, B.; Potin, S.; De Sanctis, M.C.; Capaccioni, F.; Piccioni, G. NIR reflectance spectroscopy of hydrated and anhydrous sodium carbonates at different temperatures. Icarus 2019, 317, 388–411. [Google Scholar] [CrossRef]
  73. De Sanctis, M.C.; Ammannito, E.; Raponi, A.; Frigeri, A.; Ferrari, M.; Carrozzo, F.G.; Zambon, F. Fresh emplacement of hydrated sodium chloride on Ceres from ascending salty fluids. Nat. Astr. 2020, 4, 786–793. [Google Scholar] [CrossRef]
Figure 1. (a) Crystal structure of larderellite. In orange, the B trigonal polyhedra, and in green, the B tetrahedra. The blue balls indicate the NH4 groups. (b) The X-ray diffraction spectrum of the sample indicated as larderellite refined with the Rietveld method [50], using GSAS EXPGUI [51,52] software.
Minerals 10 00902 g001
Figure 2. Reflectance spectra at room temperature and 193 K (a) and TG/DSC (b) analysis from room temperature to 773 and 1023 K of larderellite.
Minerals 10 00902 g002
Figure 3. (a) Crystal structure of struvite projected along the x axis. In blue, the ammonium tetrahedra, in green, the phosphorous tetrahedra and in red, the magnesium octahedra are reported. The sticks represent the OH…O and NH---O hydrogen bond systems. (b) The X-ray diffraction spectrum of the sample refined with the Rietveld method [50], using GSAS EXPGUI [51,52] software, indicates that only struvite is present.
Minerals 10 00902 g003
Figure 4. Reflectance spectra at room temperature and 193 K (a) and TG/DSC (b) analysis from room temperature to 773 and 1023 K of struvite.
Minerals 10 00902 g004
Figure 5. (a) Crystal structure of tschermigite. In yellow, the S tetrahedra, red, pink, blue and orange balls represent oxygen, water molecules, NH4 groups and Al octahedra, respectively. (b) The X-ray diffraction spectrum of the sample indicated as tschermigite refined with the Rietveld method [50], using GSAS EXPGUI [51,52] software.
Minerals 10 00902 g005aMinerals 10 00902 g005b
Figure 6. Reflectance spectra at room temperature and 193 K (a) and TG/DSC (b) analysis from room temperature to 773 and 1023 K of tschermigite.
Minerals 10 00902 g006
Figure 7. (a) Crystal structure of mascagnite projected along the x axis. In blue, the ammonium and in yellow, the sulfate tetrahedra are reported. The sticks are the NH…O hydrogen bonds. (b) The X-ray diffraction spectrum of the sample indicated as mascagnite refined with the Rietveld method [50], using GSAS EXPGUI [51,52] software.
Minerals 10 00902 g007aMinerals 10 00902 g007b
Figure 8. Reflectance spectra at room temperature and 193 K (a) and TG/DSC (b) analysis from room temperature to 773 and 1023 K of mascagnite.
Minerals 10 00902 g008
Figure 9. (a) Crystal structure of sal-ammoniac projected along the x axis. Cl atoms in green, N atoms in blue, H atoms in white–pink. The blue sticks indicate the N-H bonds and the pink–green sticks the NH…Cl hydrogen bonds. (b) The X-ray diffraction spectrum of the sample indicated as sal-ammoniac refined with the Rietveld method [50], using GSAS EXPGUI [51,52] software.
Minerals 10 00902 g009aMinerals 10 00902 g009b
Figure 10. Reflectance spectra at room temperature and 193 K (a) and TG/DSC (b) analysis from room temperature to 773 and 1023 K of sal-ammoniac.
Minerals 10 00902 g010
Figure 11. Comparison of the reflectance spectra for mascagnite and sal-ammoniac in the region of 1–16 μm.
Minerals 10 00902 g011
Figure 12. Comparison of part of the reflectance spectra of tschermigite, struvite and laderellite in the region of 1–16 μm.
Minerals 10 00902 g012
Figure 13. Comparison of part of the reflectance spectra of mascagnite, larderellite and sal-ammoniac. Focus between 1.2 and 2.0 μm indicates the 2v3(NH4+) bands.
Minerals 10 00902 g013
Table 1. Chemical formula, minerals’ name and provenances of the selected studied samples.
Minerals NameChemical FormulaSource
Larderellite NH4B5O7OH2·H2OLarderello, Italy
Struvite(NH4)MgPO4·6(H2O)Limfjord, Denmark
Tschermigite(NH4)Al(SO4)2·12(H2O)Cermniky, Czech Republic
Mascagnite(NH4)SO4Pozzuoli, Italy
Sal-ammoniacNH4ClPozzuoli, Italy
Table 2. Absorption band assignments in ammonium-bearing minerals’ spectra following Bishop et al. [28], Berg et al. [29] and Stevof et al. [40].
Mineral NameNH4 Fundamentals NH4 Overtone and Combination
ν3ν43 + ν43ν3 + ν4ν2 + ν4ν2 + ν5ν2 + ν6ν2 + ν3
Larderellite
NH4B5O7(OH)2 H2O
5.84
6.97
7.35
1.54/H2O
2.42
2.58
1.98
2.02
2.10/N-OH
2.23
3.23/ ν1 H2O
Struvite
NH4MgPO4·6H2O
5.88
6.86
7.26
1.401.591.92
2.01
2.15/
PO43−
3.21/ ν1 H2O
Tschermigite
(NH4)Al(SO4)2·12H2O
2.99/ν1 H2O5.90
6.84
1.51
2.52
2.14/
H2O
Mascagnite
(NH4)2SO4
3.01/ν1 H2O5.90
6.72
7.22
1.592.133.23 4.86/2ν1 NH4+
Sal-ammoniac
NH4Cl
3.076.88
7.30
1.321.622.09
2.15
3.255.644.962.06
Table 3. Absorption band assignments, due to anion groups and water, in ammonium-bearing minerals’ spectra following Bishop et al. [28], Stefov et al. [40], Cloutis et al. [46], Sergeeva et al. [55] and Korybska-Sadło et al. [56].
MineralOH Bands (µm)H2O Bands (µm)SO42− Bands (µm)BO Bands (µm)PO43− (µm)
ν1ν3ν4ν2[BO3]3−ν2 [BO4]5−ν3 [BO4]5−Overtone PO43−ν3 PO43−
Larderellite1.54
1.77
1.98
2.02
2.14
8.03 δ B–O–H
8.84 δ B–O–H
3.23
6.16
12.52
13.31
14.11
12.58
13.26
14.15
15.32
9.3
10.3
11.13
11.40
Struvite 1.46
1.59
1.84
1.95
2.03
2.16
3.21
6.31
3.88
4.78
8.54
9.52
10.9
Tschermigite1.80
2.02
2.14
4.05 H2O-Al
10.79 H2O-Al
13.57 H2O-Al
15.69 H2O-Al
7.83
9.03
Mascagnite 9.54
10.27
8.35
8.43
15.73
Sal-ammoniac 7.58 Unspecified feature
Table 4. Band parameters’ variation (centroid = bend center) at decreasing temperature for the analyzed spectral features in the range until 3 μm.
SampleBand’s PositionAbsorptionCentroid vs. Td
Larderellite1.54H2O/NH4+↑ λ
1.76 H2O ↑ λ
2.10 H2O/NH4+ ↓ λ
2.42 NH4+ ↓ λ
2.58NH4+↓ λ
Struvite1.44 H2O ↑ λ
1.59 H2O/NH4+ ↓ λ
1.92 H2O/NH4+ ↓ λ
2.01 H2O/NH4+ ↑ λ
2.15H2O/NH4+↑ λ
Tschermigite1.51 NH4+ ↓ λ
1.76 H2O ↑ λ
2.07 H2O/NH4+ ↓ λ
2.52NH4+↓ λ
Mascagnite1.59 NH4+ ↓ λ
2.13NH4+↓ λ
Sal-ammoniac1.32 NH4+ ↓ λ
1.62 NH4+ ↓ λ
2.15NH4+↓ λ
The arrows indicate the increase (↑) or decrease (↓) in wavelength position. Abbreviation: Td = temperature decrease; λ = wavelength variation.

