Article

Double-Front Crystallization in the Chapesvara Ultramafic Subvolcanic Complex, Serpentinite Belt, Kola Peninsula, Russia

by
Andrei Y. Barkov
1,*,
Vladimir N. Korolyuk
2,
Larisa P. Barkova
1 and
Robert F. Martin
3
1
Research Laboratory of Industrial and Ore Mineralogy, Cherepovets State University, 5 Lunacharsky Avenue, 162600 Cherepovets, Russia
2
V.S. Sobolev Institute of Geology and Mineralogy, Siberian Branch of the Russian Academy of Science, 3 Avenue “Prospekt Koptyuga”, 630090 Novosibirsk, Russia
3
Department of Earth and Planetary Sciences, McGill University, 3450 University Street, Montreal, QC H3A 0E8, Canada
*
Author to whom correspondence should be addressed.
Minerals 2020, 10(1), 14; https://doi.org/10.3390/min10010014
Submission received: 9 October 2019 / Revised: 17 December 2019 / Accepted: 18 December 2019 / Published: 23 December 2019
(This article belongs to the Special Issue Feature Papers in Mineral Geochemistry and Geochronology 2019)

Abstract

:
Dunite–harzburgite–olivine-bearing orthopyroxenite successions in the subvolcanic Chapesvara-I and Chapesvara-II intrusions in the Serpentinite Belt, western Kola Peninsula, are notably magnesian. The mean Mg# value (whole-rock) is 86.6, and the olivine is Fo84−89. The upper contact facies (UCF) displays a lower Mg# (81.6). It consists of grains of Fo92 and abundant chromian spinel, implying rapid crystallization of an almost unfractionated melt. On average, the whole-rock Al2O3/TiO2 value is 22.45, close to 22.9 (UCF) and to the primitive mantle, ~22. The rise of primitive ultramafic magma presumably occurred in a special tectonic setting at the boundary of the Paleoproterozoic Lapland Granulite Terrane and the Belomorian Composite Terrane of Archean age. The Chapesvara suite resembles examples of the Al-undepleted komatiites in the Barberton Belt, South Africa, with magmas of up to 30–35% MgO. The UCF rock yields an anomalously low molar MgO/SiO2 value, close to that of dunitic rocks located at the center of the Chapesvara-II body. This rock is the most primitive, as indicated by the maximum Fo content of olivine, the lowest value of (Gd/Yb)N, 0.52, and the lowest abundances of middle to heavy rare-earth elements (REE) in the chondrite-normalized spectrum. The crystallization of the Chapesvara-II sill-like intrusion likely proceeded in two stages, which are evident from the olivine compositions varying from the maximum Fo92 (UCF) to Fo≤89.5 (the central dunite zone). At Stage 1, the UCF rock (Fo92) crystallized first, close to the upper contact. The area of crystallization then shifted to a central portion of the Chapesvara-II body, in which the dunitic zone (Fo89.5) formed in situ (Stage 2). The compositional variations in chromian spinel are consistent with this suggestion. Two crystallization trends were recognized. The type-1 trend displays a relative maximum or minimum close to the center, and then diverges into two linear subtrends directed upward and downward. This pattern is manifested in the variations of Mg# in olivine and chromian spinel, the whole-rock contents of Al and Ca, and in levels of incompatible elements: Ti, V, Zr, Y, and Hf. The type-2 trend decreases or increases uniformly from top to bottom. Variations in amount of Ni in olivine, the Fe3+# index in chromian spinel, and in values of Mg# (rocks), follow a type-2 trend. Variations in total amounts of REE, Nb, and Th, which gradually increase downward, are also related to a type-2 trend. Thus, a contrasting development and possible interference of the two types of evolutionary trends were observed in the crystallization history of the Chapesvara-II sill-like body. A double-front crystallization, hitherto unreported, involved two fronts moving upward and downward, respectively. The upward subtrend appeared to be of subordinate importance, whereas the extent of fractional crystallization of the downward front was much greater. Crystallization proceeded from the top to the bottom, presumably because of the preferential loss of heat at the roof. Variations in the Fe3+# index indicate that the level of fO2 also increased downward with progressive crystallization. Convection cells were presumably the key mechanism of accumulation of the crystallizing olivine grains to form the central dunite zone close to the center of the sill-like intrusion. The observed characteristics of the Chapesvara complex indicate the existence of a primitive-mantle source and imply a highly magnesian composition of intruding magma not only for Chapesvara, but also for the Pados-Tundra layered complex and associated suites of the Serpentinite Belt in the Kola Peninsula.

1. Introduction

The Serpentinite Belt, so named by A.M. Shukevich in the 1930s [1,2] and further investigated by Murashov [3], located in the Kola Peninsula of northwestern Russia, consists of dunite–harzburgite–orthopyroxenite bodies and associated serpentinite. Along the 40-km belt [4], one finds the Mount Kareka-Tundra suite close to the Finnish border, ultramafic bodies in the upper reaches of the River Terma, the Mount Khanlauta suite, the Chapesvara (I and II) and the Lotmvara (I and II) bodies, and the Pados-Tundra complex [5,6]. Roughly 6 km long, the Pados-Tundra complex is the largest member of the belt in terms of volume. It is Paleoproterozoic, dated at ~2.1 (zircon age) or 2.4–2.5 Ga [7], and was emplaced along a regional shear zone associated with the Kola–Mezenskiy block of the Lapland Granulite Belt (Paleoproterozoic) close to its contact with the Archean Belomorian (Belomorskiy) block. The Pados-Tundra complex hosts chromite mineralization, both podiform and stratiform [5], with associated platinum-group minerals, some of which (the sulfarsenides of ruthenium) are highly unusual [8].
We focus here on the little-known Chapesvara ultramafic complex. We present information on the mineralogy and bulk-rock geochemistry of well-located representative samples of the Chapesvara-I and Chapesvara-II bodies. We document compositional variations, fractionation trends, and crystallization history, which point to a double-front crystallization unreported previously. This information is used to shed light on the petrogenesis of the ultramafic suite.

Background Information

The two components of the Chapesvara intrusive complex, located close to the Pados-Tundra body (Figure 1, Figure 2, Figure 3 and Figure 4), have previously been mapped [9,10,11]. The Chapesvara-II body is fairly well exposed, and less strongly affected by cataclastic deformation than Chapesvara-I. Thus, we have essentially a complete cross-section of this little-known body in its original position. The Chapesvara-I body (Figure 2) was deformed during multiple phases of regional brittle and ductile deformation associated with the Lapland–Kola orogeny at 1.94–1.86 Ga [12,13] or the Svecofennian orogeny at 1.92–1.79 Ga [14]. Our sampling of Chapesvara-I consists of representative samples taken from blocks ≤1 to 3–4 m across in the area shown in Figure 2. They are judged to be sufficient to characterize the body adequately.
Gorbacheva et al. [11] provided a detailed map of the Chapesvara-II body (Figure 5). It generally extends over 8.5 km and dips 40–60° towards the north. Harzburgite (~80% olivine) and olivine orthopyroxenite seem to be subordinate. The proportion of the oxide minerals, mostly chromian spinel and ilmenite, varies from <1–3 to ~15 vol. %. Two generations of chromian spinel are recognized in the Chapesvara complex [15].
The Chapesvara ultramafic bodies are located close to the contact of two regional units of Archean age, one mostly composed of two-mica garnet–kyanite schist and the other of granodiorite, granite, granitic gneiss, and migmatite (Figure 2, Figure 3 and Figure 4). A sharp inflection in the course of the River Nota (Figure 3 and Figure 4) presumably reflects a control by the fine-grained ultramafic rocks exposed at the northern end of the Chapesvara-II sill-like body. Shlayfshteyn [10] revised the small-scale map of [9], on which the Lotmvara complex is shown as a single body. The first author’s 2019 field work implies the existence of Lotmvara-I and Lotmvara-II as separate northeast-striking linear bodies that are subparallel and generally conformable with the Chapesvara-II body. Therefore, all these sill-like bodies may well have formed by injection of an ultramafic magma, derived from a common mantle source, along a subparallel system of northeast-trending regional shear zones.

2. Materials and Methods

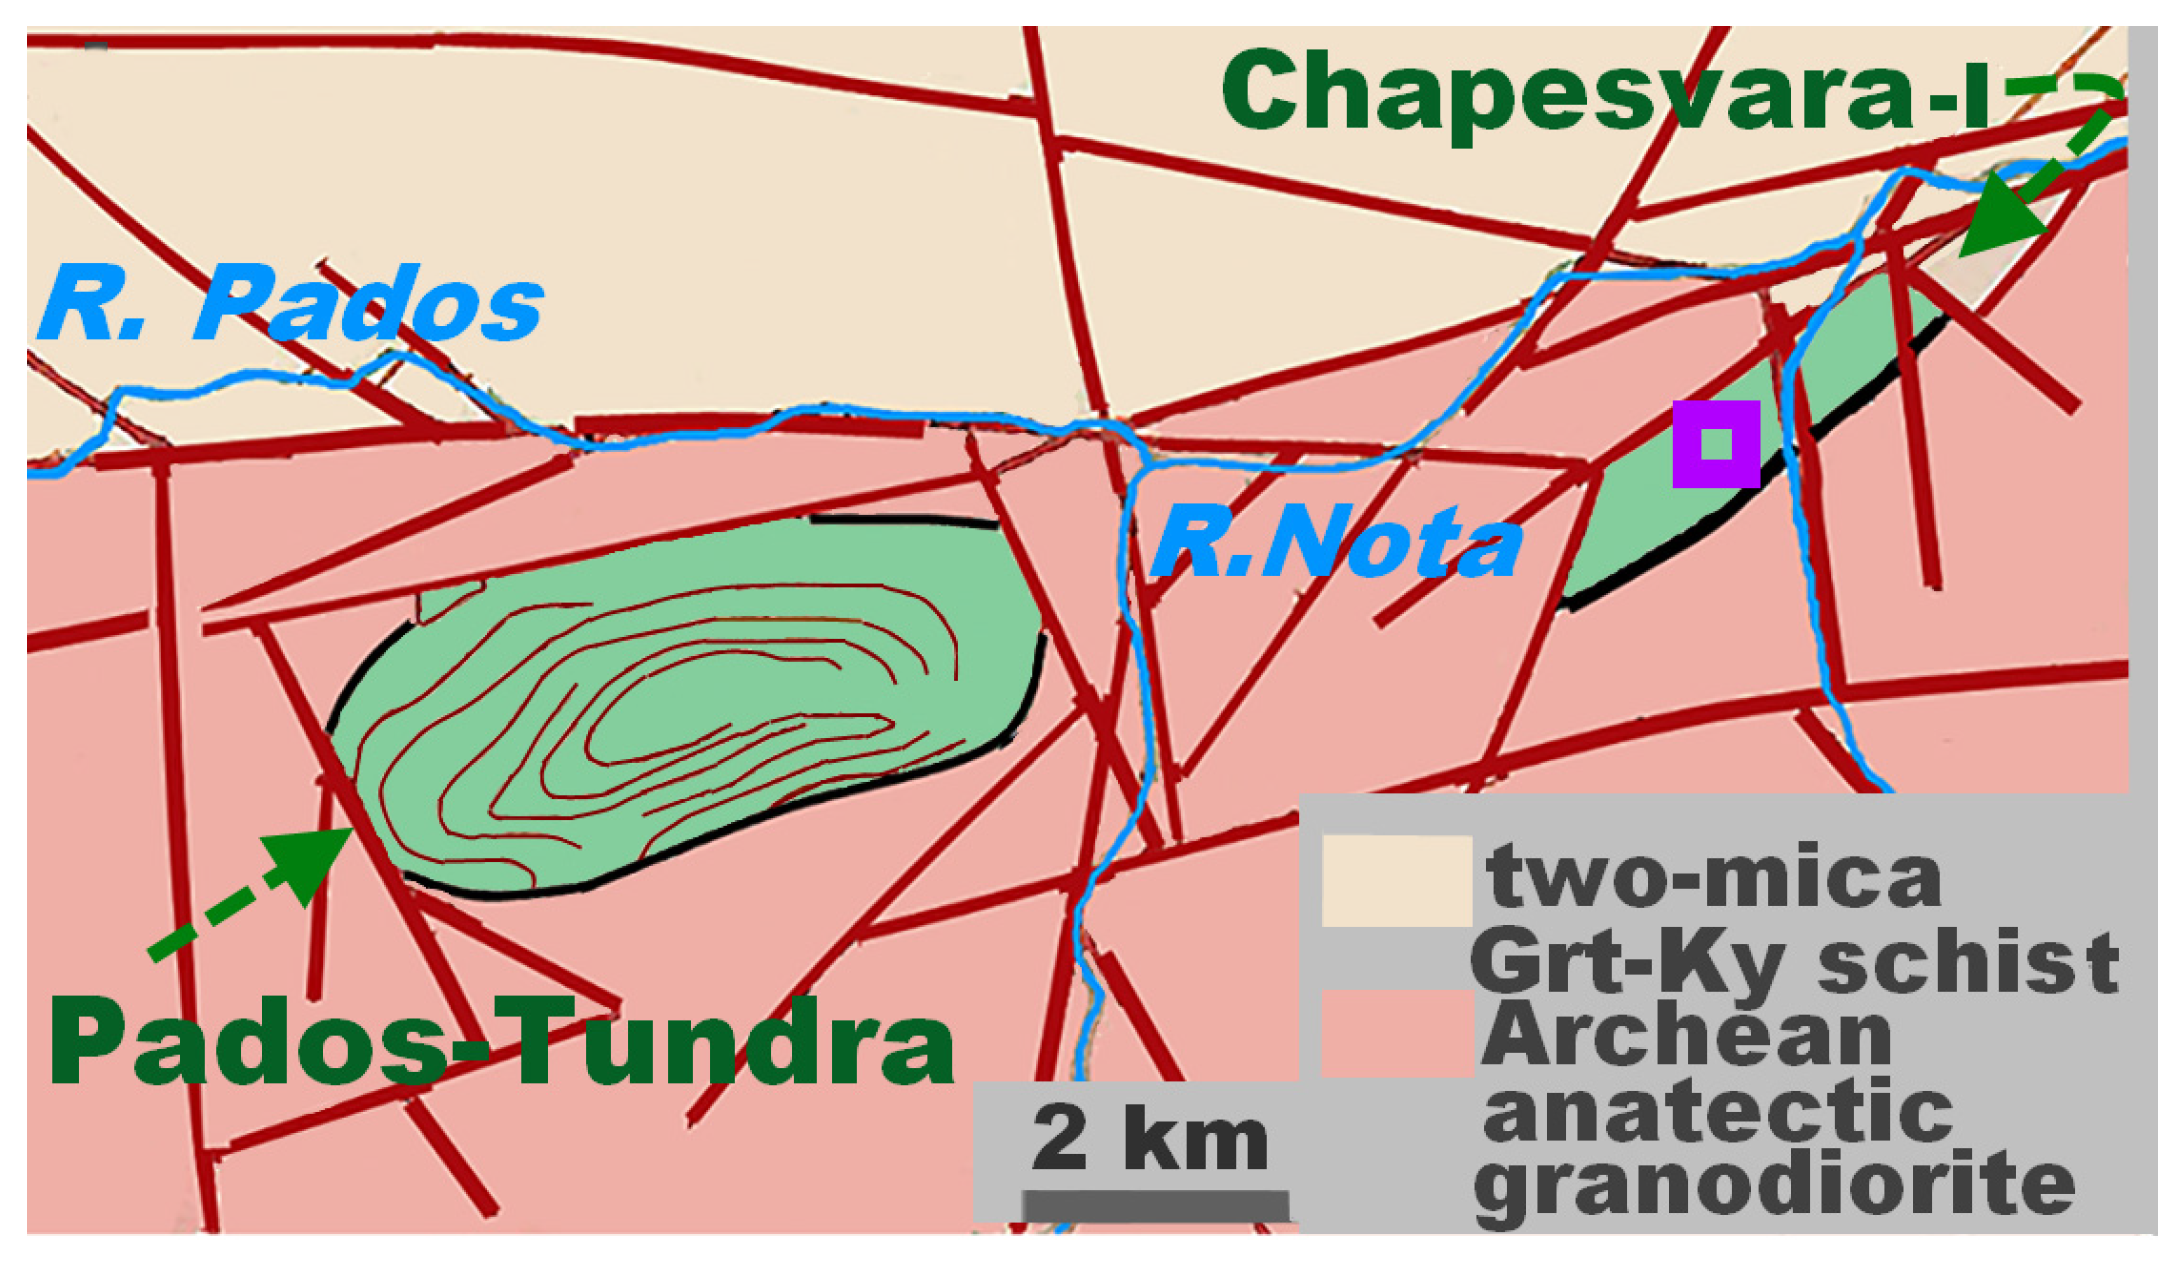
A set of fifty representative samples were collected in the areas shown in Figure 2, Figure 3 and 
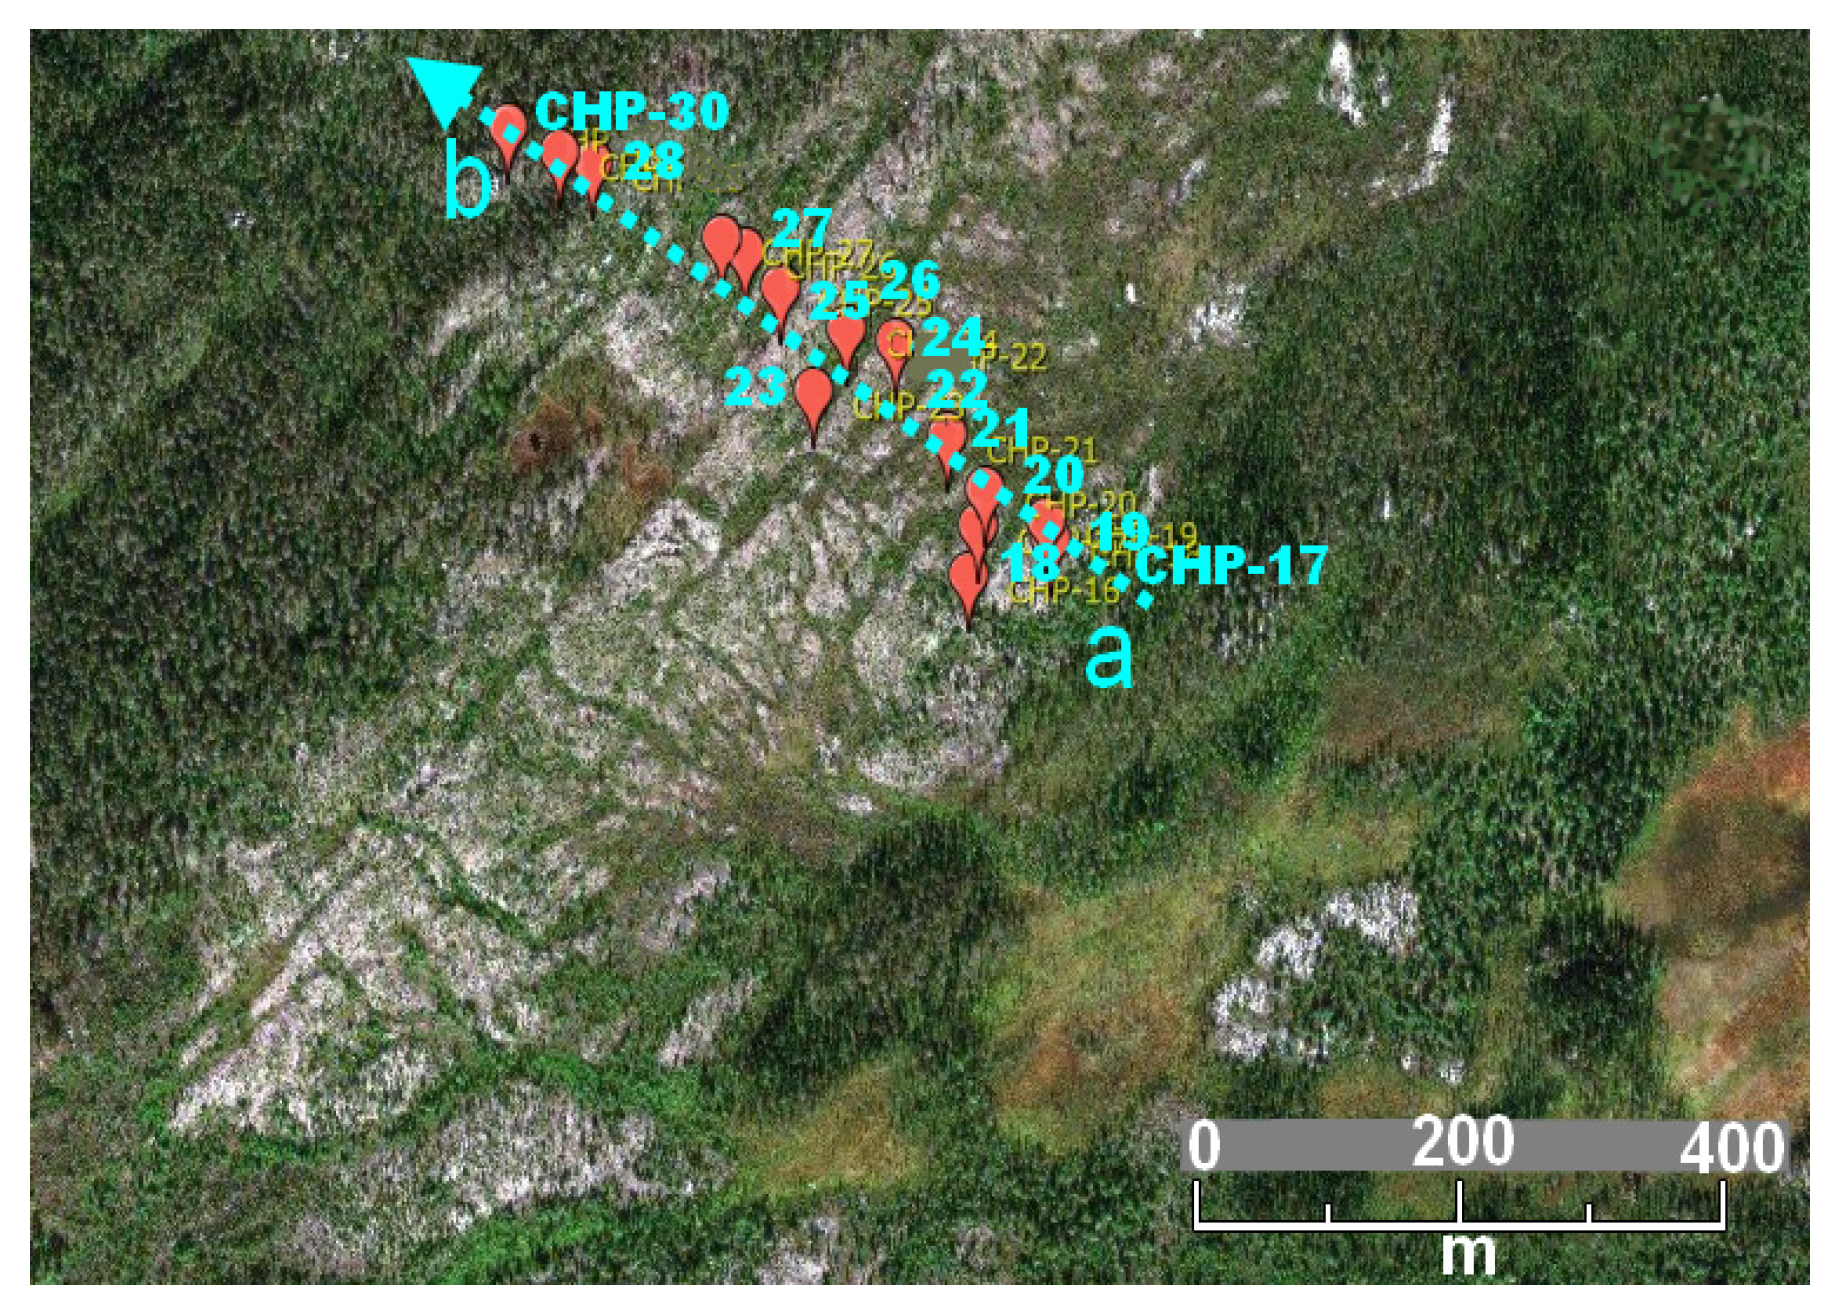
Figure 6. Thirty of these samples, labeled CHP-1–15 (Chapesvara-I) and CHP-16–30 (Chapesvara-II), were studied in detail mineralogically and geochemically. The Chapesvara-II samples were taken along the traverse a–b (Figure 6) and across the following units (bottom to top; this study): amphibole-olivine zone (IV), central dunite zone (II), olivine-bearing orthopyroxenite zone (III), and the upper contact facies (I) (
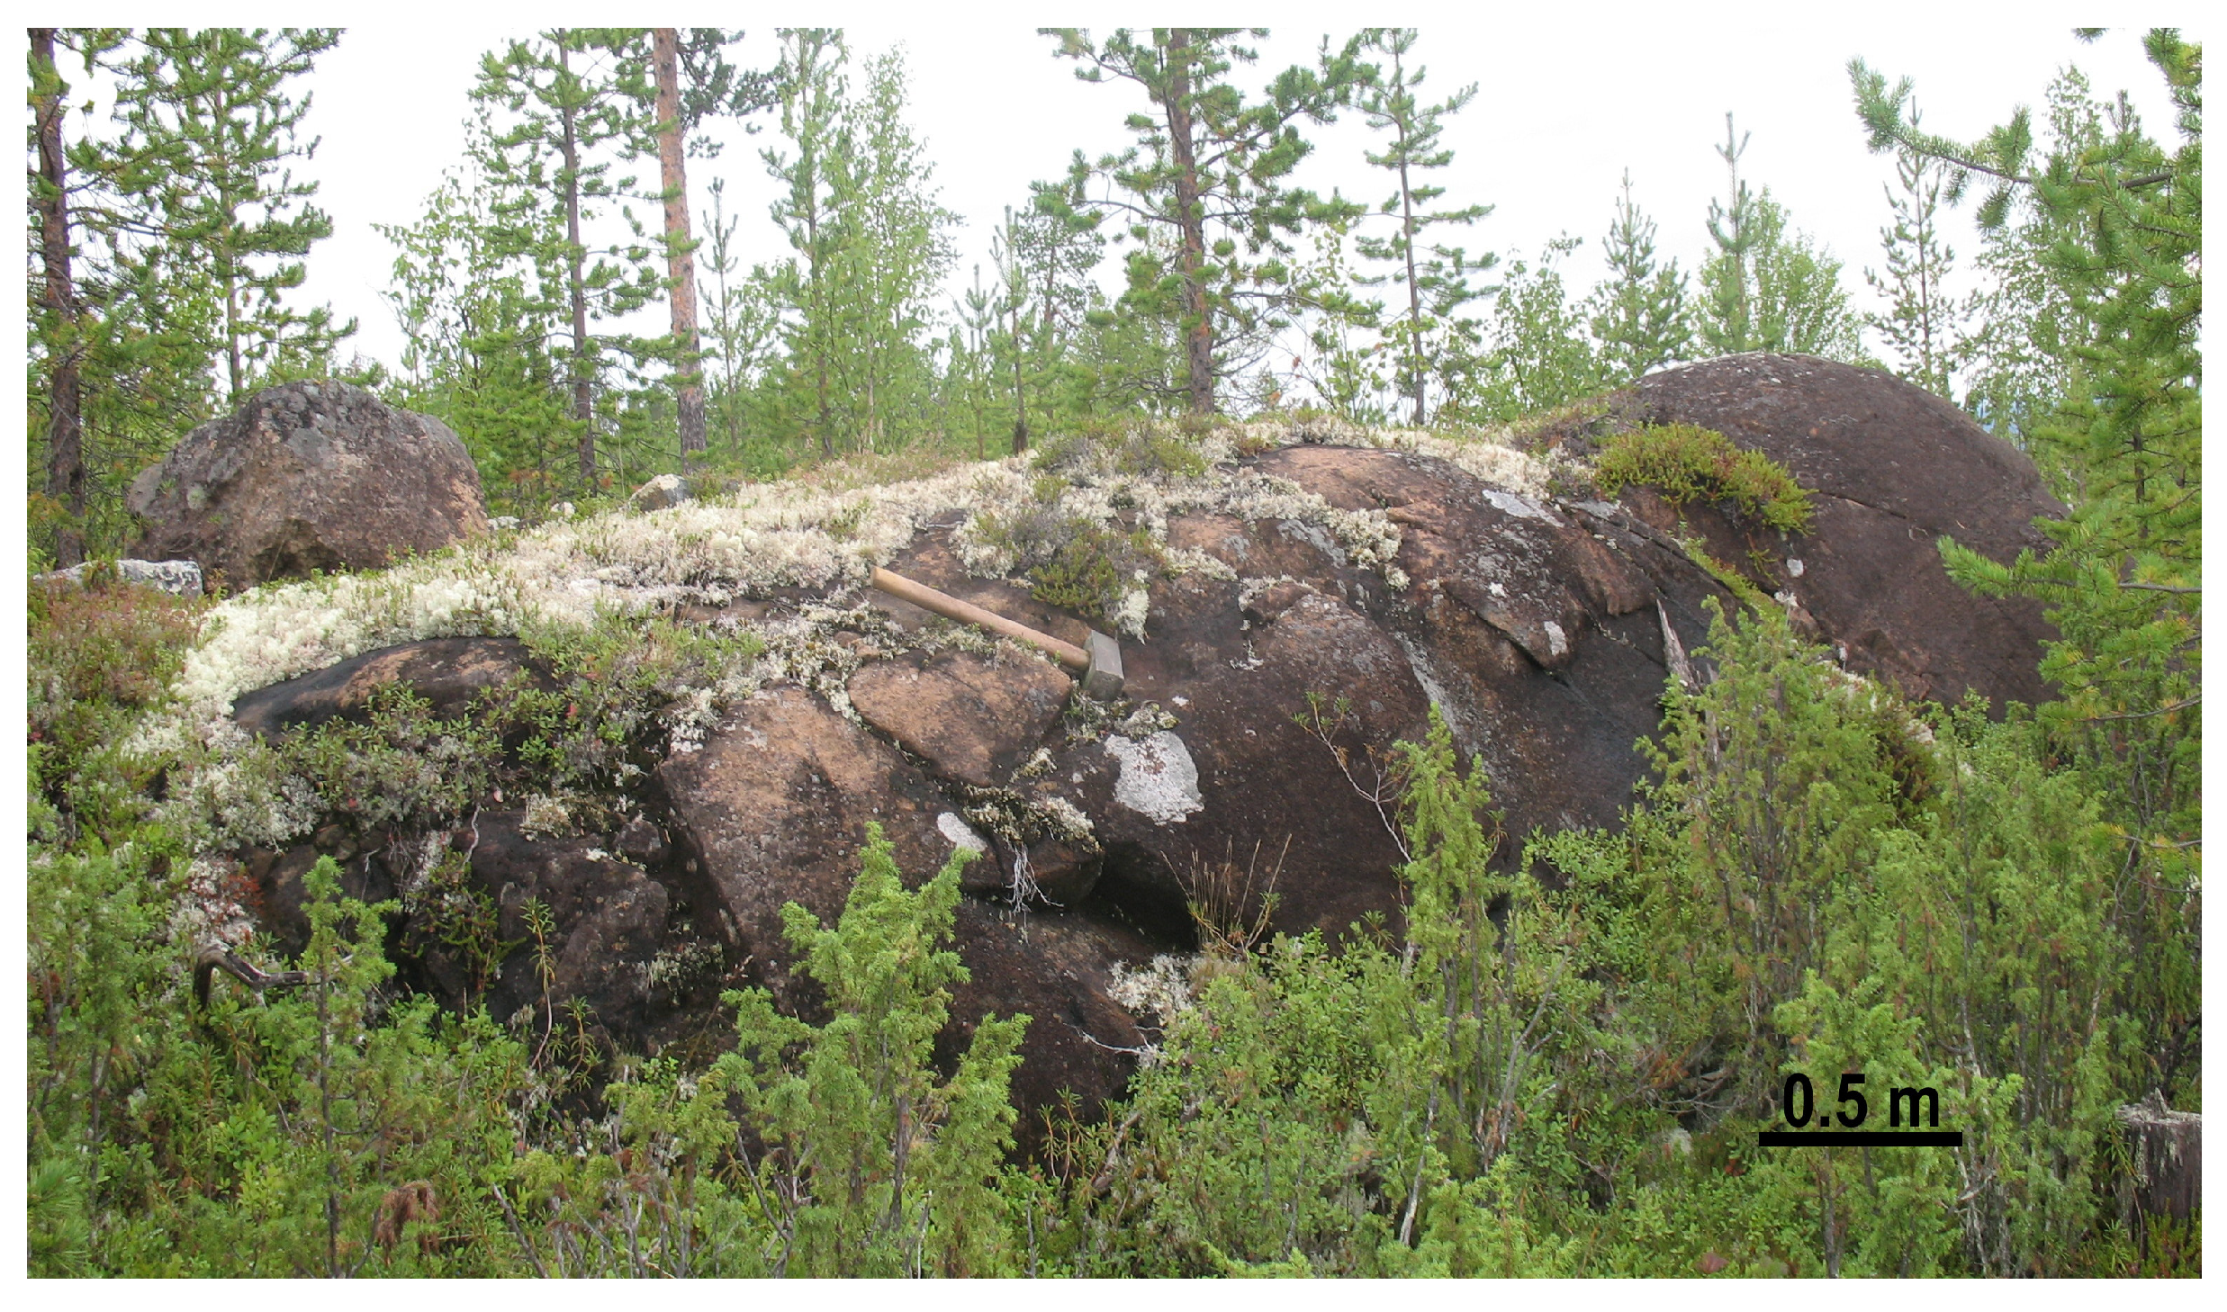
Figure 7). These lithologies represent a comagmatic series that likely formed in the order from I to IV under closed-system conditions during crystallization of the komatiitic magma. A representative example of the outcrops sampled is shown in Figure 8.
All the analyses were conducted at the Analytical Center for Multi-Elemental and Isotope Studies, Institute of Geology and Mineralogy, SB RAS, in Novosibirsk, Russia. The minerals were analyzed using a JEOL JXA-8100 instrument in wavelength-dispersion spectrometry mode (WDS). An accelerating voltage of 20 kV and a probe current of 20–50 nA were used. We employed Kα analytical lines for all elements except for Cr, where the Kβ1 line was used because of peak overlap. Periods of measurements at the peaks were 20 or 10 s. The superposition of the TiKβ1 line on the VKα line and of the VKβ line on the CrKα line was accommodated using the overlap correction software. The beam diameter was ~1 μm. Natural specimens of olivine (Mg, Si, Fe and Ni) and chromiferous or manganiferous garnet (Ca, Cr and Mn) were used as standards for olivine. A natural specimen of magnesian chromite (for Cr, Fe, Mg, and Al), manganiferous garnet (Mn), ilmenite (Ti), and synthetic oxides NiFe2O4 (Ni), ZnFe2O4 (Zn), and V2O5 (V) were used as standards for the chromian spinel. Grains of orthopyroxene and amphiboles were analyzed using pyrope (Si, Al, Fe), a glass Ti standard (GL-6), chromiferous garnet (Cr), diopside and pyrope (Mg, Ca), manganiferous garnet (Mn), albite (Na), and orthoclase (K). Clinopyroxene was analyzed with essentially the same set of standards, and diopside was used for Si, Ca, and Mg. The following standards were applied in the analysis of plagioclase: orthoclase (Si, Al, K), diopside (Ca), pyrope (Fe), and albite (Na). All the data were processed with the ZAF method of corrections. The calculated values of detection limit (for 1σ criteria) are: ≤0.01 wt. % for Ti, Cr, Fe, Ni, Ca, Zn, Mn, and K, and 0.02 wt. % (Na and Al). Special tests [16,17] were done to evaluate the accuracy and reproducibility of the analytical procedures.
The whole-rock abundances of trace elements, including the rare-earth elements (REE), were established at the same center by inductively coupled plasma–mass spectrometry (ICP–MS) using a high-resolution Finnigan MAT mass spectrometer (the model ELEMENT; Finnigan MAT, San Jose, CA, USA). The analytical procedures used were described in [18,19]. Contents of major oxides in the rocks were established at the same center by X-ray fluorescence (XRF) using procedures [20] based on the use of an ARL 9900XP spectrometer Thermo Fisher Scientific, Waltham, MA, USA) equipped with a Lifumat 2.0-Ox high-frequency induction furnace (Linn High Therm GmbH, Eschenfelden, Germany) and a HERZOG hydraulic HTP 40 pellet press (HERZOG Maschinenfabrik GmbH & Co. KG, Osnabrück, Germany). A special set of state-approved standards was used to evaluate the precision of the XRF analyses.

3. Results

3.1. Rock Textures and Mineral Associations

The Chapesvara-I and Chapesvara-II bodies exhibit notable similarities in their textural characteristics (Figure 9 and Figure 10). Modal proportions of olivine vary considerably from ≤10 vol. % in orthopyroxenite to ≥90 vol. % in dunite. Their fine grain-size, down to 0.1–0.3 mm across (Figure 10a), is indicative of fairly rapid crystallization in a subvolcanic setting. Medium-grained varieties also are present. As found in the Pados-Tundra complex [6], a magnesian calcic amphibole corresponding to tremolite is abundant not only as interstitial grains coexisting with fresh domains of olivine, but also as a deuteric (autometamorphic) phase formed by replacement of orthopyroxene or olivine (Figure 9a,b). On the other hand, it is common to see grains of orthopyroxene preferentially replaced by this amphibole, whereas the associated olivine remains relatively fresh. These relations recall observations documented in spheroidally textured specimens (cf. Figure 2 in [21]) of the Pados-Tundra layered complex, in which orthopyroxene oikocrysts are preferentially replaced by tremolite and talc, leaving the matrix olivine intact [21].
Chromian spinel typically forms accessory grains located at boundaries of olivine grains (Figure 9c,d,f and Figure 10c,f), implying that these grains crystallized after olivine. Two textural variants of orthopyroxene, indicative of two generations, are recognizable at Chapesvara (I and II), in agreement with observations at the Pados-Tundra complex [6]. The first is early and pertains to the orthopyroxene of magmatic origin. The second generation is late and occurs in veinlets or as a rim-like zone (dark in back-scattered images: Figure 9c and Figure 10d), or a peripheral replacement, or as lamellae not attributed to exsolution hosted by the matrix phase of early orthopyroxene: cf. Figure 8 in [6].
Clinopyroxene and plagioclase occur sporadically as rare constituents of ultramafic rocks of the Chapesvara bodies. They are involved in breakdown reactions, showing the following assemblages: Cpx → Pl → aluminous Amp, or Pl → aluminous Amp (Figure 9c,f and Figure 10b). On textural evidence, the amphibole rims likely formed from a late hydrous fluid as a result of plagioclase decomposition, which seems to have been the source of the Al.
On the basis of microscopic observations, we infer that the investigated rocks are very poor in S. Pentlandite was documented only as tiny grains ~50 μm in size (Figure 10f).

3.2. Mineralogical Variations

3.2.1. Olivine, Chromian Spinel, and Orthopyroxene

The field of compositions of olivine in rocks of Chapesvara-I and Chapesvara-II (Table 1, Figure 11a,b) largely overlap as a consequence of the close petrogenetic relationship existing between these bodies. A slightly positive correlation of the Mg# index, defined as 100Mg/(Mg + Fe2+ + Mn), versus Ni, and a slightly negative one of Mg# versus Mn, were observed. Trends for these two suites are similar. Note that the compositions of olivine in fine-grained rocks of the upper contact facies (UCF) are plotted in an area distinct from the rest. This unit is distinctive, as is argued below.
Figure 12a displays an interesting and unusual trend in olivine composition across the Chapesvara-II body. Except for the UCF unit, the maximum value of Mg# is attained in olivine of the central dunite zone (Figure 7) close to the center of the ultramafic body. From this point, the values decrease upward and downward, respectively, relative to the a–b traverse direction (Figure 6). Note that the downward subtrend is much more pronounced, showing a broad range of variations. In contrast, the values of Ni in solid solution display rather a single trend decreasing downward (Figure 12b).
Compositional variations in the chromian spinel (Table 2, Figure 12d) are clearly sympathetic with respect to those of olivine. The data points also display, from the same horizon close to the center, a characteristic split into two separate subtrends directed upward and downward in the Chapesvara-II body. Values of the Cr# index 100Cr/(Cr + Al) exhibit a relative decrease at the same central position (Figure 12e), which is accompanied by the corresponding increase in the spinel component (MgAl2O4) at this level. Values of the index Fe3+# 100Fe3+/(Fe3+ + Fe2+) gradually increase downward (Figure 12f), implying a progressive rise in oxygen fugacity, fO2, in this direction during crystallization.
In the Chapesvara-II body, compositions of orthopyroxene show relatively broad lateral variations (Figure 12c, Table 3), which reflect the presence of two generations of the mineral. At low stratigraphic levels, orthopyroxene could not be analyzed, as it was totally transformed to a tremolite-dominant assemblage, presumably as a result of an increase in H2O in the system (in the late-crystallized portions). The two generations of orthopyroxene are separated by a gap (Figure 13a–c). Group-1’s pyroxene (the original phase) contains normal levels of incorporation of Ca, Al, and Cr. In contrast, compositions of the second generation (group 2), which formed by replacement of the original phase, are highly depleted in Ca, Al, and Cr (Figure 13a–c).

3.2.2. Clinopyroxene, Plagioclase and Aluminous Amphibole

Clinopyroxene (Wo43.9–46.0En47.6–49.1Fs6.4–7.0) has a highly magnesian composition at Chapesvara (Table 4). The compositions plot close to the boundary of diopside with augite, as defined in the accepted nomenclature [22]. Plagioclase (Figure 9e and Figure 10b; Table 4) represents a late phase formed from portions of interstitial melt. It is strongly enriched in the albite component: Ab46.8–60.1An39.7–53.0Or0.1–0.2. The aluminous amphibole (Table 4) displays notable variations: (Na1.15–1.26Ca0.56–1.31K0.02–0.18)([Mg3.66–4.43Fe2+0.50–0.77Mn0.01–0.03]Al0.99–1.28)(Si5.77–6.15Al1.85–2.23)O22(OH)2. These compositions are closest to pargasite, although somewhat deficient in Ca [23].

3.2.3. Calcic and Iron-Magnesium Amphiboles, and Deuteric-Stage Assemblages

Compositional fields of the Ca amphibole (tremolite) and Fe–Mg amphibole (anthophyllite) overlap in the Chapesvara-I and Chapesvara-II bodies (Figure 14a,b; Table 5 and Table 6) as a result of the close relationship between these bodies. As noted, the calcic amphibole develops locally in fairly fresh rocks in association with unaltered olivine or orthopyroxene. This mode of occurrence reflects a primary crystallization at a late stage as a result of increase in levels of H2O, cf. [24,25]. It thus differs from amphibole formed deuterically or during regional metamorphism.
Representatives of the serpentine-group minerals, chlorite (clinochlore), talc, and a magnesium carbonate (likely magnesite) are invariably highly magnesian at Chapesvara (Table 7), as a reflection of the composition of primary grains of olivine and orthopyroxene.

3.2.4. Cobaltiferous Pentlandite

As noted, sulfide occurrences are extremely scarce in these samples. A Co-bearing pentlandite (1.2–1.7 wt. % Co) is the only sulfide species documented at Chapesvara (Table 8). Values of the Ni:Fe ratio (atomic) are 0.8–1.1, close to a 1:1 proportion. In general, cobaltiferous pentlandite could represent one of index minerals of the entire Serpentinite Belt. Indeed, it occurs at Pados-Tundra [6], at Khanlauta and at Kareka-Tundra (Barkov et al.; unpublished data).

3.3. Geochemical Characteristics

3.3.1. Whole-Rock Variations and Fractionation Trends

The rocks of the sequence dunite–harzburgite–olivine-bearing orthopyroxenite are highly magnesian. Mean values of Mg# 100MgO/(MgO + FeOtotal), calculated on a whole-rock (molar) basis, are nearly identical: 86.6 for Chapesvara-I (n = 13) and 86.5 for Chapesvara-II (n = 14) (Table 9). A substantial enrichment in Cr (1–2 wt. % Cr2O3) is invariably observed. The whole-rock ratios for Al2O3 and TiO2 (ratios of wt. % values) are 23.9 and 21.0, respectively. These values are indicative of crystallization from batches of a primitive magma derived from a common mantle source.
The whole-rock compositions (Table 9, Table 10 and Table 11) display low contents of Ca and Al and a characteristic depletion in REE and high field-strength elements (Y, Nb, Hf, and Th). The mean values of the (Gd/Yb)N ratio (Table 10), normalized with respect to the C1 chondrite [26], are 1.19 (Chapesvara-I) and 1.11 (Chapesvara-II). These very similar values exhibit a minor extent of depletion in the heavy REE. Mean values of the index Eu/Eu* (Table 10) also are close: 0.72 (Chapesvara-I) and 0.82 (Chapesvara-II). They indicate a slightly negative Eu anomaly, which could reflect a minor extent of plagioclase fractionation.
The two patterns of fractionation recognized in the primary minerals at Chapesvara-II (Figure 6, Table 1 and Table 2) are reflected in geochemical profiles (Table 9, Table 10 and Table 11). Pattern 1 displays a relative maximum or minimum close to the body center. A split into two subtrends then develops, both of which are approximately linear and directed upward and downward in the plots, respectively. This pattern, established on the basis of values of Mg# in Ol and Chr (Figure 12a,d), is also reflected in the whole-rock contents of Al and Ca (Figure 15e and Figure 16d), and levels of incompatible elements: Ti (Figure 15d), V (Figure 17a), Zr (Figure 18b), Y (Figure 18d), and Hf (Figure 18e). The second pattern is representative of variations in values of Ni in olivine (Figure 12b), the Fe3+# index in Chr (Figure 12f), and the Mg# index in bulk-rock compositions (Figure 15b), which all show a single trend of values progressively decreasing or increasing from top to bottom. The variations observed in ΣREE (Figure 18a), Nb, and Th (Figure 18c,f), which gradually increase downward, are related to the second type of trend. The similarities observed in chondrite-normalized spectra of ultramafic rocks of the Chapesvara-I and Chapesvara-II bodies (Figure 19 and Figure 20) provide convincing evidence that they are comagmatic and belong to a single complex.

3.3.2. The Upper Contact Facies (UCF)

The upper contact facies (UCF) represents a distinct unit of fine-grained ultramafic rocks at the top of the Chapesvara-II body (Figure 7). Compared to the rocks below, this unit displays the most strongly magnesian grains of olivine (Fo92; Figure 12a and Table 1). No orthopyroxene grains were observed in the UCF rock. The relative modal proportion of olivine in this rock is greater (Figure 15a), which accounts for the elevated level of Ni (Figure 16e). The presence of abundant disseminations of chromian spinel (Figure 10e) leads to a notable enrichment in Cr (Figure 16a). The UCF rocks also consist of substantial amounts of hydrous silicates, talc [(Mg2.74–2.78Fe0.06Al0.01–0.02Cr0.01)Si4.06–4.08O10(OH)2], and Cr-enriched clinochlore [(Mg4.65–4.72Fe0.22)Al(Si3.26–3.28Al0.47–0.49Cr0.22–0.23)O10(OH)8], which locally form whitish or colorless spherules up to 4–5 mm in diameter. The other geochemical characteristics are: markedly lower SiO2 (Figure 15c) and CaO (Figure 16d) and high values of the molar ratio of MgO/SiO2 (Figure 16f), along with greater abundances of Mn (Figure 16b), V, and Co (Figure 17a,b). In spite of the high MgO (37.04 wt. %), the UCF rock is also enriched in Fe; consequently, the calculated value of its Mg# is not so high (Figure 15b).
The UCF rocks have a low Al2O3/TiO2 value, 22.9 (Mg# = 81.6; Table 9), and are relatively depleted in incompatible elements: REE (Figure 17c–f and Figure 18a), Zr (Figure 18b), Y, Hf, and Th (Figure 18d–f). Their chondrite-normalized spectra are the most primitive in the series, with the lowest abundances of the middle to heavy REE (Figure 20). The indexes (Gd/Yb)N and Eu/Eu* normalized with respect to the C1 chondrite [26] are also anomalous in the UCF rocks: 0.52 and 1.18 (i.e., the Eu anomaly is positive), respectively (Table 10). For comparison, the mean (Gd/Yb)N values are 1.19 (Chapesvara-I) and 1.11 (Chapesvara-II). The mean values of the index Eu/Eu* are 0.72 (Chapesvara-I) and 0.82 (Chapesvara-II). As noted, the UCF rock is composed of the most magnesian olivine: Fo92 versus Fo≤89.5 in the central dunite zone and other ultramafic rocks of the complex (Figure 11a). On the basis of these results, we infer that the UCF rocks represent the most primitive member of the ultramafic suite at Chapesvara.

4. Discussion

The successions of dunite–harzburgite–olivine-bearing orthopyroxenite in the Chapesvara-I and Chapesvara-II subvolcanic intrusive complexes are notably magnesian. The mean Mg# values are 86.6 (Chapesvara-I) and 86.5 (Chapesvara-II). A UCF rock (upper contact facies) displays a slightly lower value, 81.6. This unit occurs near the upper contact, presumably part of a chilled margin, and was likely produced by the rapid crystallization of the intruding melt in its almost unfractionated state. The whole-rock Al2O3/TiO2 values are 23.9 (Chapesvara-I) and 21.0 (Chapesvara-II), giving a mean of 22.45, close to 22.9 (UCF), all very close to the primitive mantle value of ~22 [26]. The depleted mantle has a notably higher Al2O3/TiO2 value of ~32 [27], consistent with the greater compatibility of Al with respect to Ti.
We thus believe that primitive ultramafic magma rose from a deep level in the Chapesvara area of the Serpentinite Belt as a consequence of an unusual tectonic setting. Indeed, the Chapesvara sill-like bodies are located within a major shear zone accompanied by an abundant collisional mélange, part of the Tanaelv high-grade ductile thrust belt. This belt is closely associated with the Lapland Granulite Terrane, LGT (or Lapland Granulite Belt), forming part of the Paleoproterozoic Lapland–Kola Collisional Orogen (LKCO). The Chapesvara intrusive bodies are thus positioned at the boundary of the two large terranes of the Baltic Shield: the Paleoproterozoic LGT and the Belomorian Composite Terrane (BCT) of the Archean age. Deep channels controlling the migration of ultramafic magma thus appeared because of the presence of major faults marking this juxtaposition. Note that the LKCO structure is an essential component of Paleoproterozoic orogenies affecting the entire North Atlantic region and resulting in the formation of a considerable portion of the Nuna supercontinent; the Baltic (Fennoscandian) Shield is considered to be one of surviving fragments of the Nuna supercontinent [28].
On the basis of geochemical characteristics and their highly magnesian nature, the Chapesvara rocks resemble some picrites [29,30]. In spite of the absence of spinifex textures, they closely resemble some examples of the most highly magnesian komatiites, such as those of the Barberton Belt in South Africa, for which magmas with up to 34.8% MgO (and 30.9% MgO in a chilled margin sample) were postulated on the basis of whole-rock chemistry and olivine compositions ([31,32,33,34,35,36,37,38,39], and references therein). The chilled margin sample of the Alexo komatiite flow in Ontario, Canada contains 28% MgO [32], and ~26% MgO is found in a komatiitic sequence at Inyala in Zimbabwe [39]. In addition, a Hawaiian picrite at Mauna Loa was reported with olivine having a Mg# up to ~92, corresponding to a calculated value 21.2% MgO in a parental melt [30]. The level of ~28% MgO is considered to be realistic for the parental magma of the Munro komatiites in the Abitibi Greenstone Belt, Ontario, Canada. The Munro-type komatiites are Al-undepleted, also having close to a primitive-mantle Al2O3/TiO2 ratio of about 22 [31]. Note that Al-depleted komatiites are considered to have been produced in unusually hot mantle plumes by extremely deep (~400 km), high-degree and equilibrium melting at a depth where garnet was a stable residual phase. In contrast, Al-undepleted and Al-enriched komatiites are produced in mantle plumes as a result of shallower melting associated with a garnet-free residue ([37] and references therein).
According to calculations [37], the estimated parental magma of the Al-undepleted komatiite at Komati contains ~30 wt. % MgO and ~12 wt. % FeO, leading to the initial crystallization of Fo94. The analyzed UCF sample at Chapesvara-II gave 37.04% MgO, 14.88% FeOtotal (or 16.54% Fe2O3 total), and the olivine phase is Fo
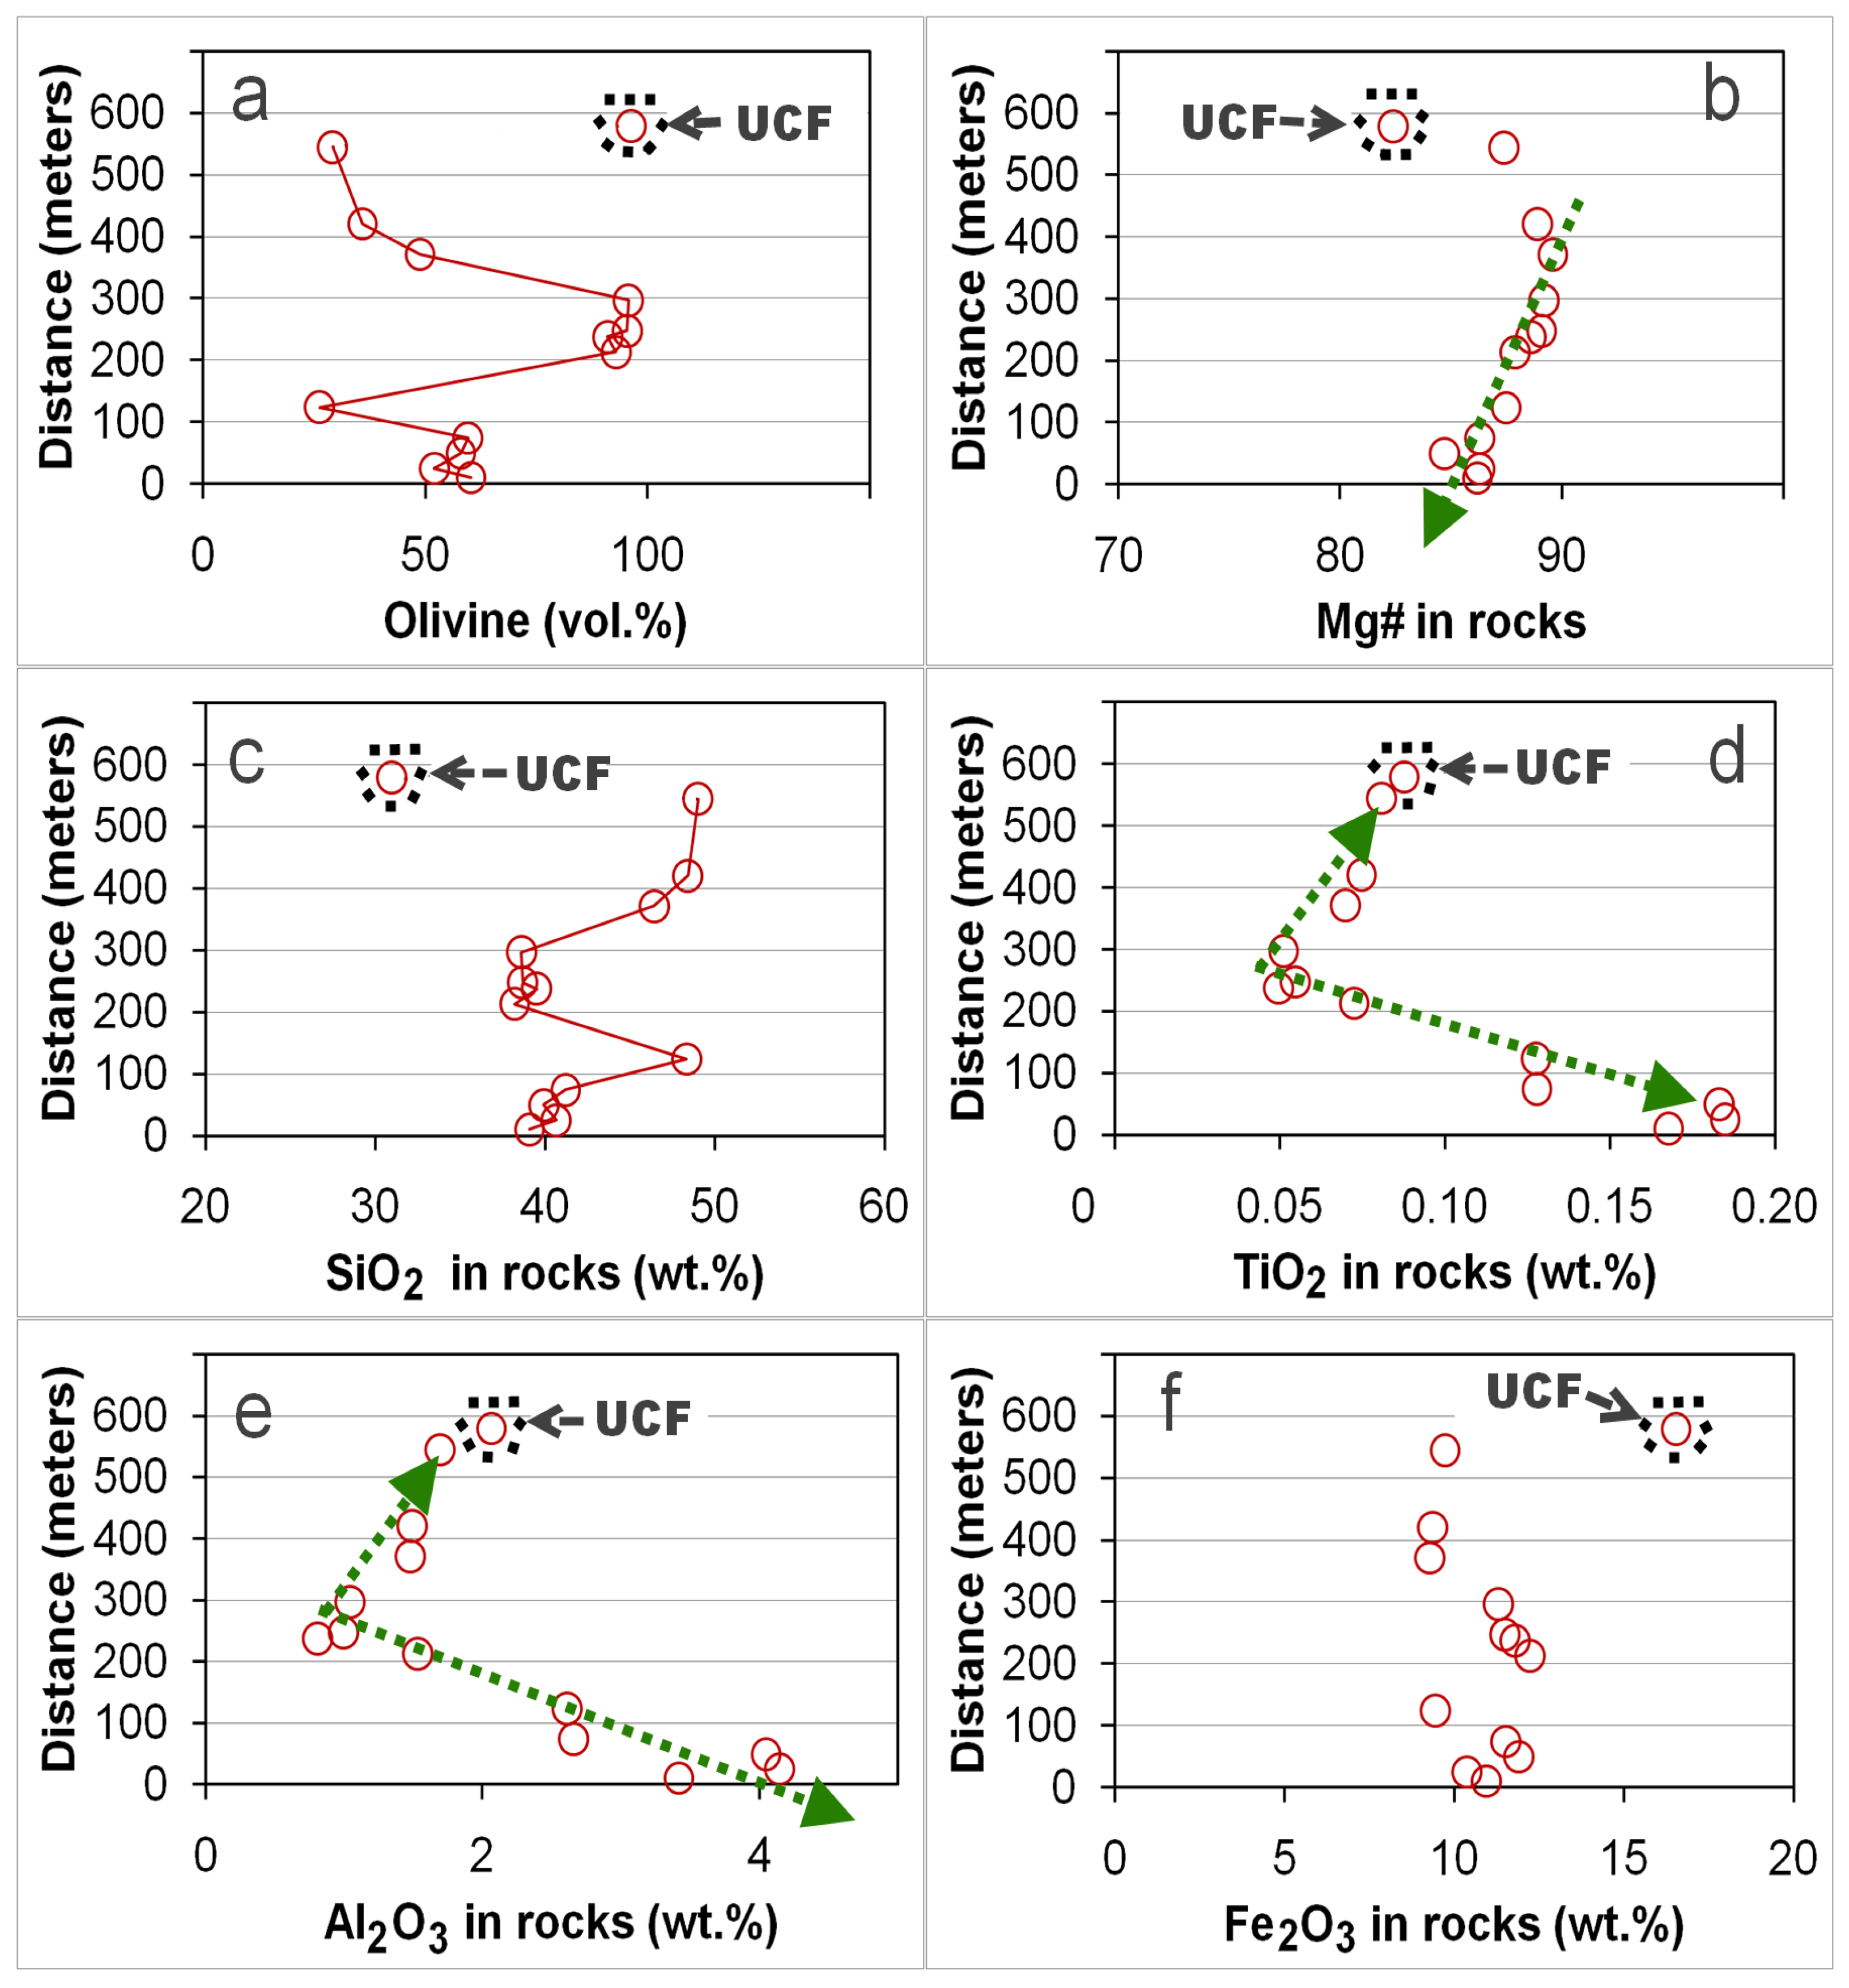
92. This sample (CHP-30) yields a very low value of the molar MgO/SiO2 ratio, close to that of dunitic rocks located at the center (Figure 16f, 
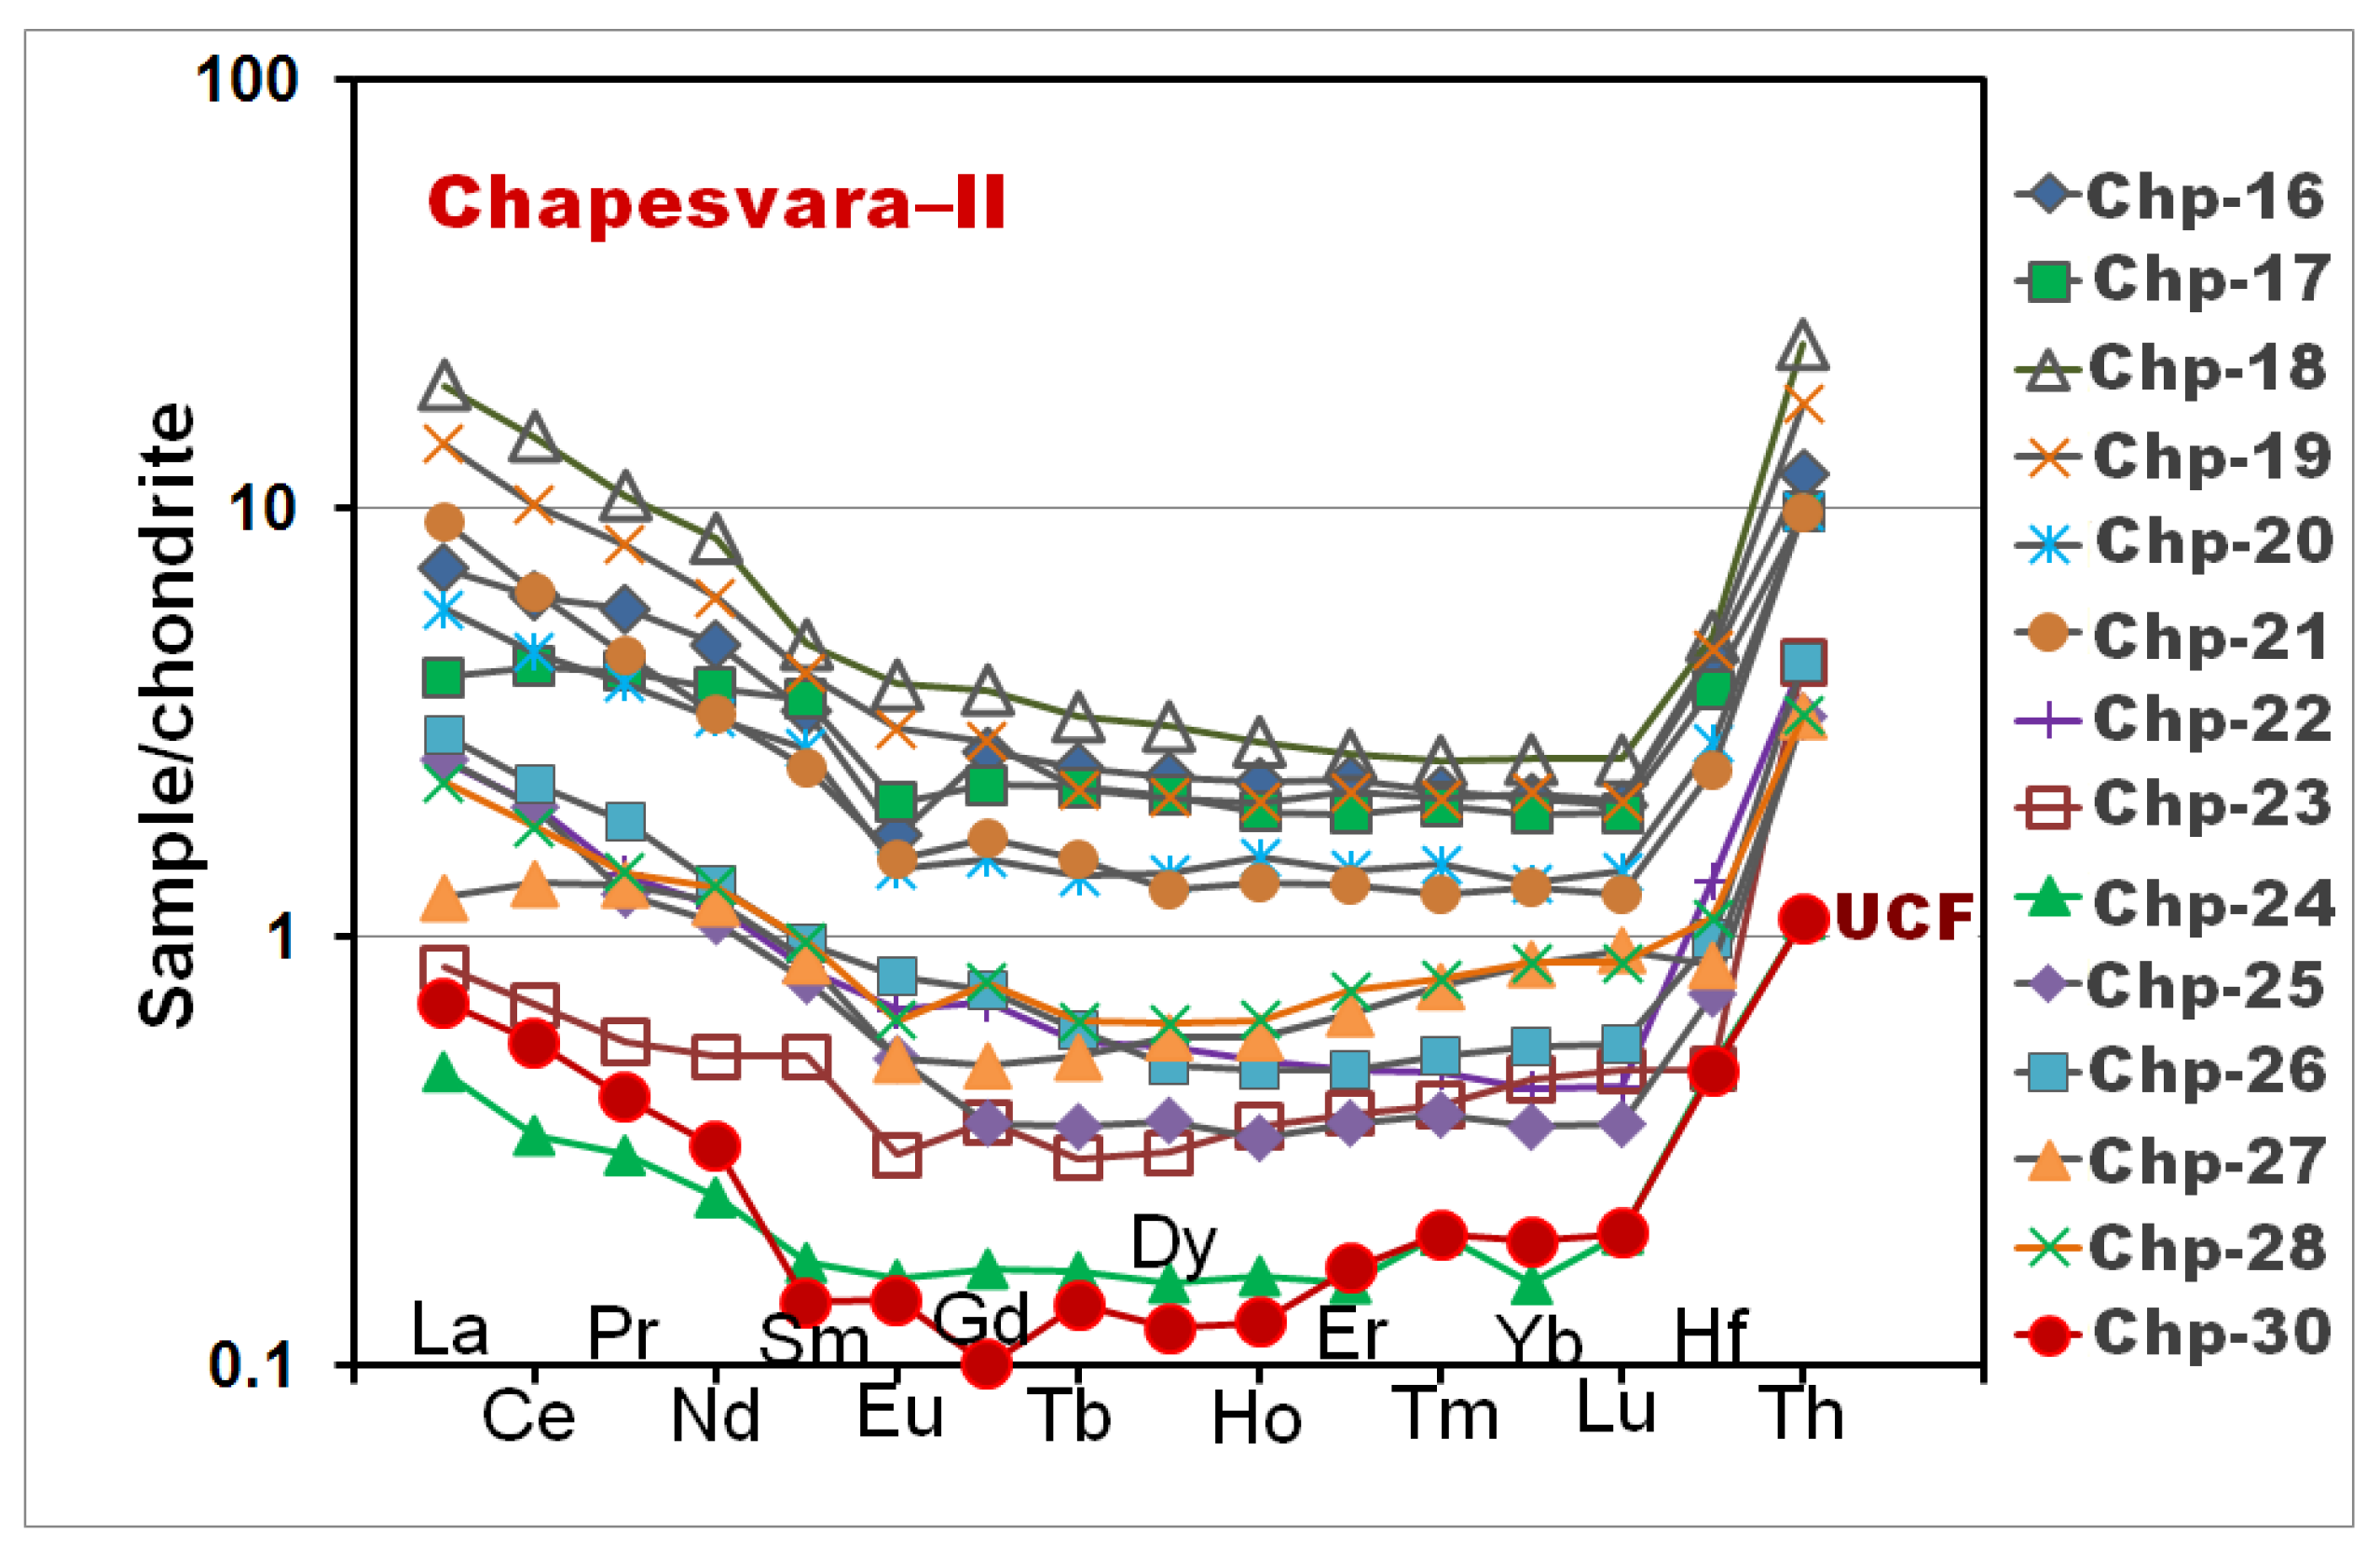
Table 9). Thus, this sample is unlikely to have been subjected to any extent of magmatic contamination by the host rock. Besides, this sample seems to be undifferentiated. Indeed, it is the most primitive of the suite, as indicated by the lowest value of (Gd/Yb)N, 0.52, and the lowest abundances of middle to heavy REE in the chondrite-normalized spectrum (Figure 20). Thus, we contend that this sample reflects fairly well the basic characteristics of a primary melt. The Cr content of sample CHP-30 is anomalously high (10.03 wt. % Cr2O3; Table 9). This enrichment is related to the occurrence of a contact-style mineralization in disseminated chromite.
We thus infer that the UCF rock, which contains the most magnesian olivine (Fo92), was the first to crystallize close to the upper contact. Similarly, Arndt [32] documented the occurrence of most magnesian composition of olivine (Fo94) in the upper chilled margin of the Alexo komatiite flow in Ontario, Canada. After the UCF zone, the inferred area of further crystallization shifted to a central portion of the Chapesvara-II body, where the olivine phase, Fo89.5, crystallized as the second most magnesian composition (Figure 12a). The documented trend of chromian spinel variations is consistent with the inference that crystallization continued at the center (Figure 12d). The zone of high-MgO dunitic rocks (Figure 7 and Figure 16c) crystallized in situ in the central portion at this stage of crystallization.
As noted, at low stratigraphic levels, orthopyroxene was entirely transformed to a tremolite-dominant assemblage as a result of an increase in H2O in the system; i.e., in the late-crystallized portions. In addition, the extent of deuteric alteration and the development of hydrous silicates increase toward the bottom. The inferred crystallization of a primary amphibole at a late magmatic stage presumably reflects the buildup in levels of H2O in the magma. Synthetic tremolite is in its field of stability at 840 °C and 6 kbar [24], whereas the association enstatite + quartz is converted to anthophyllite in the presence of H2O over a range of 670–800 °C at 2 kbar [25]. These conditions are consistent with deposition of the calcic amphibole from a hydrous fluid.
Two trends of evolution are recognized at Chapesvara-II. The first trend displays a relative maximum or minimum close to the center, which then splits into two linear subtrends. These are divergent and directed upward or downward. This pattern is manifested in the variations documented of Mg# in olivine and chromian spinel, the whole-rock contents of Al and Ca, and in levels of incompatible elements: Ti, V, Zr, Y, and Hf (Figure 12a,d, Figure 15d,e, Figure 16d, Figure 17a, Figure 18b,d,e). The second type of element distribution is represented by a single line and shows a decrease or increase from top to bottom; such a pattern applies to the variations in incorporation of Ni in olivine, the Fe3+# index in chromian spinel, and in values of Mg# in bulk-rock compositions. In addition, the total amounts of REE, Nb, and Th, which gradually increase downward, are related to the type-2 trend (Figure 12b,f, Figure 15b, and Figure 18a,c,f).
The contrasting development and possible interference of the two types of evolutionary trends reveal a complex history of crystallization in the Chapesvara-II body. It began with the formation of the UCF zone and continued with the crystallization and accumulation of olivine in the dunite zone close to the center. There were two fronts of crystallization, one moving upward and one progressing downward. The upward subtrend appears to be of subordinate importance, as relevant ranges of values are at least two times smaller than those displayed by the downward subtrend (Figure 12a,d, Figure 15d,e, Figure 16d, Figure 17a, Figure 18b,d,e). Along the downward trend, the extent of progressive fractional crystallization was much greater (Figure 12b,f, Figure 15b, Figure 18a,c,f). These observations indicate that the general crystallization of the Chapesvara-II sill-like body proceeded from the top to the bottom in response to the preferential heat loss through the roof. At the same time, the lithological units observed in the comagmatic series likely formed in the order from I to IV (Figure 7) under closed-system conditions during crystallization of the komatiitic magma.
The oxidation state of iron in spinel-type phases is a well-established monitor of magmatic oxygen fugacity [40,41]. Our results based on compositions of chromian spinel (Figure 12f) imply that the general level of fO2 likely increased downward with progressive crystallization of the Chapesvara-II body. In addition, a relative increase in fO2 at the UCF level, associated with the deposition of accessory chromite, points to the intruding melt itself as the likely agent of oxidation. The inferred trend of increasing fO2 downward (Figure 12f) and close to the chilled margin was likely caused by a relative enrichment in oxygen content of the evolving magma due to the escape of hydrogen once bubbles of H2O appeared [42].
As noted, tremolite-dominant assemblages formed at the expense of Ca-poor pyroxene in the late-crystallized portions at Chapesvara-II. This feature implies the influx of Ca via a late hydrous fluid at a stage of deuteric alteration. What we found, thus, differs from a normal process of “uralitization” [43,44], which represents an autometasomatic alteration of primary clinopyroxene to form “uralite” (i.e., Ca-amphiboles of the actinolite–tremolite series). The same phenomenon is evident in the Pados-Tundra intrusion, where orthopyroxene oikocrysts are entirely replaced by a deuteric assemblage of talc + tremolite [21]. The relative Ca-enrichment, thus, occurred under closed-system conditions at Chapesvara, in contrast to other systems (e.g., [45]).
A puzzling aspect of the Chapesvara–II zoned sill is the presence of the Central Dunite Zone (Figure 7, Figure 15a, and Figure 16c). This zone contrasts with the olivine-enriched cumulates in the more voluminous Pados-Tundra complex [6] and other layered intrusions, which are located at a lower structural level [46,47]. The buildup of olivine in the core of concentrically zoned complexes of alkaline ultramafic rocks like Kondyor [48] seems unrelated in view of the important petrogenetic differences. A zonal arrangement of the same type as that at Chapesvara-II seems present in a large ultramafic complex (possibly up to ~15 km2 in size) investigated previously in the upper reaches of the River Terma in the Serpentinite Belt. As noted [49], there is a reported dominance in central portions of dunite, grading to peridotite (harzburgite) towards the periphery in this body.
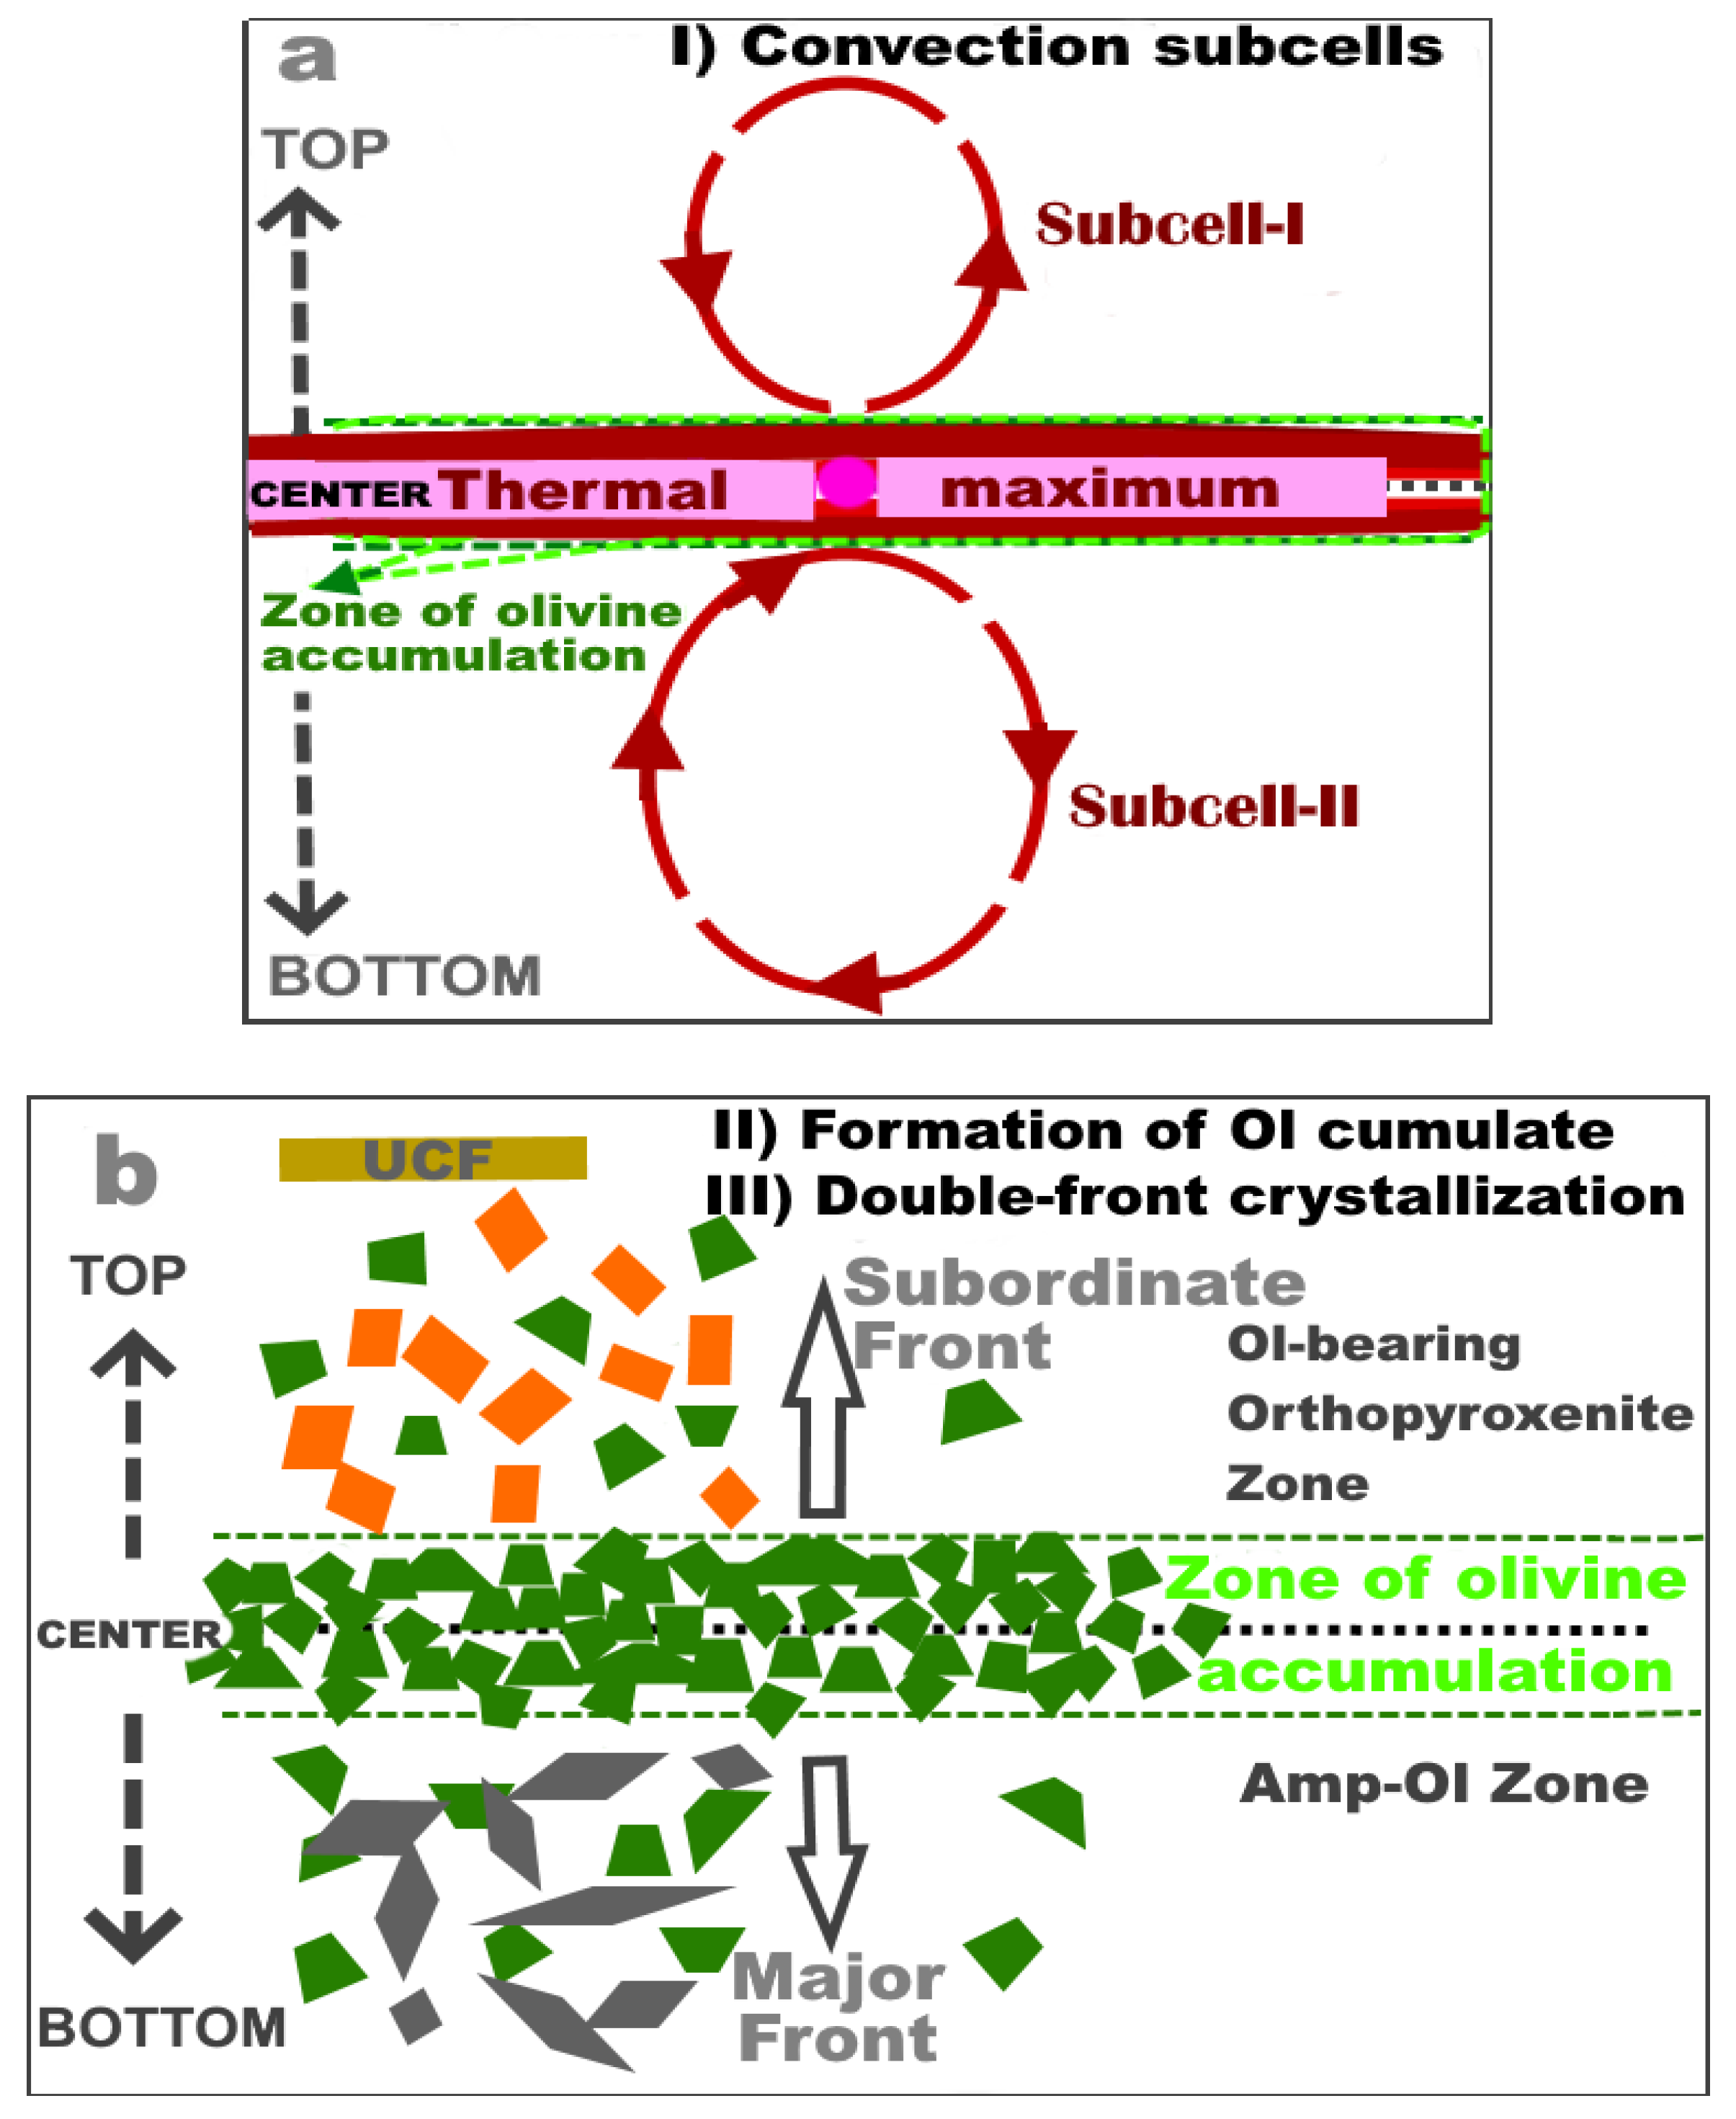
We presume that three events (Figure 21a,b) could be crucial in the crystallization history of the Chapesvara-II sill: (I) the formation of a complementary system of convection subcells around a zone of very hot melt present in the center of magmatic reservoir during cooling; (II) an intensive accumulation of crystallizing olivine crystals in the area between the functioning subcell-I and subcell-II; and (III) the double-front crystallization of the bulk volume of remaining melt. The inferred subcells generated around the zone of thermal maximum (Figure 21a) are elliptical and subvertically elongate in the cross-section, as expected in case of sheet-like or similar geometries (cf. [50]). In addition, komatiite flows are expected to convect vigorously during cooling [32]. In our case, these subcells of convection may have played a twofold role: (1) to transport and accumulate the olivine crystals suspended and clumped together close to the center to form the central dunite zone, and (2) to cause the split of the magmatic reservoir into two subsystems in the upper and bottom half of the sill, which evolved more or less independently, thus showing the contrasting fronts and fractionation trends. The phase Fo89.5 presumably crystallized close to the thermal maximum area in the center, and the opposite trends of cryptic variations involve progressively less forsteritic olivine (Figure 12a).
The conditions of crystallization could differ in important ways in other portions of the chamber, in which olivine-rich cumulate likely formed as a result of olivine settling to the bottom. Thus, there might be areas showing the development of rhythmic cycles of dunite–(harzburgite)-olivine-bearing orthopyroxenite, as was reported by the previous investigators (Figure 5) [11]. On the other hand, our observations may stimulate a re-examination of the presently known structure of the Chapesvara complex.

5. Conclusions

(1) The Chapesvara-I and Chapesvara-II bodies are comagmatic. They belong to one and the same ultramafic subvolcanic complex, which forms part of the Serpentinite Belt in the Kola Peninsula.
(2) The Chapesvara complex is a well-documented example of a highly magnesian Al-undepleted komatiite related to a primitive mantle source, which is associated with northeastern-striking shear zones related with the Tanaelv high-grade ductile thrust belt in the northeastern Fennoscandian Shield.
(3) The Chapesvara complex crystallized from a primitive komatiitic melt that displays an unusual combination of a highly magnesian and Cr-enriched composition with a relative enrichment in Fe, as follows from our observations made on the rock of the upper contact facies at Chapesvara-II. The latter rock is the most primitive in the series, as it contains the most forsteritic olivine (Fo92), has the lowest value of (Gd/Yb)N, 0.52, and the lowest abundances of middle to heavy REE in the chondrite-normalized spectrum. It likely is representative of the basic characteristics of primary melt inferred not only for Chapesvara, but also for the Pados-Tundra layered complex and other subvolcanic suites of the Serpentinite Belt.
(4) We documented a double-front type of crystallization for the first time in a subvolcanic ultramafic complex.
(5) The Chapesvara-II body displays a progressive build-up in fO2 during crystallization. The parental komatiitic melt itself was likely the source of oxidation. We attribute the enrichment in intrinsic oxygen fugacity of the evolving magma to the escape of hydrogen upon degassing in a subvolcanic setting upon vesiculation and dissociation of H2O.
(6) The characteristics of the Chapesvara-II sill-like body are indicative of vigorous convection of the komatiitic magma with the inferred existence of a complementary system of convection subcells functioning around a zone of very hot melt (present in the center of magmatic reservoir). These circumstances were important (a) to cause the split of the magmatic reservoir into two subsystems, evolving independently, and (b) to transport and accumulate the olivine crystals suspended and clumped together close to the center to form dunitic cumulate of the central dunite zone.

Author Contributions

The authors wrote the article together. A.Y.B.: investigations, writing, and conclusions; V.N.K.: observations, analytical results, and writing; L.P.B.: diagrams, interpretations, and writing; R.F.M.: discussion, conclusions, and writing. All authors have read and agreed to the published version of the manuscript.

Funding

This research was funded by the Russian Foundation for Basic Research (project number RFBR 19-05-00181).

Acknowledgments

This paper is dedicated to the memory of late Sergey S. Kramzaev (ChSU, Cherepovets) for his invaluable assistance and efforts during field investigations of the Chapesvara complex. We thank the two reviewers, editorial staff, and academic editors for their comments and suggestions. We are grateful to the staff of the Analytical Center for Multi-Elemental and Isotope Studies, Institute of Geology and Mineralogy, SB RAS, Novosibirsk, Russia. The permission to access and reproduce of materials of unpublished reports was granted by the Department of Mineral Resources of Northwestern Federal District (Sevzapnedra) of the Federal Agency for Mineral Resources of the Russian Federation. A.Y.B. gratefully acknowledges support from the Cherepovets State University. V.N.K. acknowledges that the present work was also done on the state assignment of IGM SB RAS, supported by the Ministry of Science and Higher Education of the Russian Federation".

Conflicts of Interest

The authors declare no conflict of interest.

References

  1. Shukevich, A.M. An Account of Geological Mapping in the Rivers Nota and Pecha Basin in the Years 1932–1933 (Kola Peninsula); The Leningradsky (Northwestern) Geological Survey: Leningrad, Russia, 1933; the inventory number 52; unpublished report in Russia. [Google Scholar]
  2. Shukevich, A.M. The Final Account of Field Trips by the Pados-Tundra Geological Party No. 9 (Kola Peninsula); The Leningradsky (Northwestern) Geological Survey: Leningrad, Russia, 1936; the inventory number 96; unpublished report in Russia. [Google Scholar]
  3. Murashov, D.F. Ultrabasic intrusions of the Serpentinite Belt (Pados-Tundra etc.). In Geology of the USSR, Murmanskaya Oblast, Geological Description; Gosgeoltekhizdat: Moscow, Russia, 1958; pp. 318–321. [Google Scholar]
  4. Vinogradov, L.A. Formations of ultrabasic rocks in the southwestern part of the Kola Peninsula (The Notozerskiy ultrabasic belt). In Problems of Magmatism of the Baltic Shield; Nauka: Leningrad, Russia, 1971; pp. 147–153. [Google Scholar]
  5. Mamontov, V.P.; Dokuchaeva, V.S. The geology and ore potential of the Pados-Tundra massif in the Kola Peninsula. Otechestvennaya Geol. 2005, 6, 52–60. [Google Scholar]
  6. Barkov, A.Y.; Nikiforov, A.A.; Martin, R.F. The structure and cryptic layering of the Pados-Tundra ultramafic complex, Serpentinite Belt, Kola Peninsula, Russia. Bull. Geol. Soc. Finl. 2017, 89, 35–56. [Google Scholar] [CrossRef]
  7. Serov, P.A.; Bayanova, T.B.; Steshenko, E.N.; Kunakkusin, E.L.; Borisenko, E.S. The Pados-Tundra dunite-harzburgite-pyroxenite massif: New Sm–Nd data on the age of rocks of the rhythmically layered series. In The Geology and Minerageny of Northern Eurasia, Proceedings of the Conference Devoted to the 60-Year Anniversary of the IGG SB of the USSR Academy of Sciences, Novosibirsk, Russia, 3–5 October 2017; USSR Academy of Sciences: Novosibirsk, Russia, 2017; pp. 213–214. [Google Scholar]
  8. Barkov, A.Y.; Nikiforov, A.A.; Tolstykh, N.D.; Shvedov, G.I.; Korolyuk, V.N. Compounds of Ru–Se–S, alloys of Os–Ir, framboidal Ru nanophases, and laurite–clinochlore intergrowths in the Pados-Tundra complex, Kola Peninsula, Russia. Eur. J. Mineral. 2017, 29, 613–621. [Google Scholar] [CrossRef]
  9. Sokolova, V.N. North-Western Geological Department, Ministry of Geology and Mineral Resource Protection of the USSR. In Geological Map of Mineral Resources of the USSR (Scale 1:200,000; R-36-XXXI, XXXII): Kola Series; Palferov, D.V., Ed.; Gosgeoltekhizdat: Moscow, Russia, 1960. [Google Scholar]
  10. Shlayfshteyn, B.A. The Account on Results of Additional Geological Appraisal at a Scale of 1: 200,000 in the Northwestern Part of the Kola Peninsula (1981–1987 Years); The Central-Kola geological survey (expedition), “Sevzapgeologiya”, the Ministry of Geology of the RSFSR: Monchegorsk, Russia, 1987; unpublished report in Russia. [Google Scholar]
  11. Gorbacheva, S.A. The Report on Prospecting Works with a Complex Estimation of Mineral Resource Potential in the Conjunction Zone of Complexes of Lapland Granulites and Belomorskiy Gneisses in the Years 1998–2000; The Central Kola Expedition (Geological Survey): Monchegorsk, Russia, 2000; unpublished in Russia. [Google Scholar]
  12. Lehtinen, M.; Nurmi, P.A. Precambrian Geology of Finland: Key to the Evolution of the Fennoscandian Shield; Rämö, O.T., Ed.; Elsevier: Amsterdam, The Netherlands, 2005; p. 750. [Google Scholar]
  13. Daly, J.S.; Balagansky, V.V.; Timmerman, M.J.; Whitehouse, M.J.; Gee, D.G. The Lapland-Kola orogen: Palaeoproterozoic collision and accretion of the northern Fennoscandian lithosphere. In European Lithosphere Dynamics; Stephenson, R.A., Ed.; Geological Society: London, UK, 2006; Volume 32, pp. 561–578. [Google Scholar] [CrossRef]
  14. Lahtinen, R. Main geological features of Fennoscandia. Geol. Surv. Finl. 2012, 53, 13–18. [Google Scholar]
  15. Barkov, A.Y.; Nikiforov, A.A.; Korolyuk, V.V.; Martin, R.F. Chromian spinel—Ilmenite associations in the Chapesvara–I–II ultramafic subvolcanic complex, Serpentinite Belt, Kola Peninsula, Russia. Period. di Mineral. 2019, in press. [Google Scholar]
  16. Korolyuk, V.N.; Usova, L.V.; Nigmatulina, E.N. Accuracy in the determination of the compositions of main rock-forming silicates and oxides on a JXA-8100 microanalyzer. J. Anal. Chem. 2009, 64, 1042–1046. [Google Scholar] [CrossRef]
  17. Lavrent’ev, Y.G.; Korolyuk, V.N.; Usova, L.V.; Nigmatulina, E.N. Electron probe microanalysis of rock-forming minerals with a JXA-8100 electron probe microanalyzer. Russ. Geol. Geophys. 2015, 56, 1428–1436. [Google Scholar] [CrossRef]
  18. Nikolaeva, I.V.; Palesskii, S.V.; Koz’menko, O.A.; Anoshin, G.N. Analysis of geologic reference materials for REE and HFSE by inductively coupled plasma-mass spectrometry (ICP-MS). Geochem. Int. 2008, 46, 1016–1022. [Google Scholar] [CrossRef]
  19. Nikolaeva, I.V.; Palesskii, S.V.; Chirko, O.S.; Chernonozhkin, S.M. Determination of major and trace elements by inductively coupled mass-spectrometry in silicate rocks after fusion with LiBO2. Analitika i Control 2012, 8, 134–142. [Google Scholar]
  20. Karmanova, N.G.; Karmanov, N.S. A universal methodology of X-ray fluorescence analysis of rocks using an ARL-9900XP spectrometer. In Proceedings of the VII All-Russian Conference on X-ray Spectral Analysis, Novosibirsk, Russia, 19–23 September 2011; p. 126. [Google Scholar]
  21. Barkov, A.Y.; Nikiforov, A.A.; Halkoaho, T.A.A.; Konnunaho, J.P. The origin of spheroidal patterns of weathering in the Pados-Tundra mafic-ultramafic complex, Kola Peninsula, Russia. B. Geol. Soc. Finl. 2016, 88, 105–113. [Google Scholar] [CrossRef]
  22. Morimoto, N.; Fabries, J.; Ferguson, A.K.; Ginzburg, I.V.; Ross, M.; Seifert, F.A.; Zussman, J.; Aoki, K.; Gottardi, G. Nomenclature of Pyroxenes. Mineral. Mag. 1988, 52, 535–550. [Google Scholar] [CrossRef]
  23. Hawthorne, F.C.; Oberti, R.; Harlow, G.E.; Maresch, W.V.; Martin, R.F.; Schumacher, J.C.; Welch, M.D. Nomenclature of the amphibole supergroup. Am. Mineral. 2012, 97, 2031–2048. [Google Scholar] [CrossRef]
  24. Jenkins, D.M.; Ventura, G.D.; Oberti, R.; Bozhilov, K. Synthesis and characterization of amphiboles along the tremolite–glaucophane join. Am. Mineral. 2013, 98, 588–600. [Google Scholar] [CrossRef]
  25. Fyfe, W.S. On the relative stability of talc, anthophyllite, and enstatite. Am. J. Sci. 1962, 260, 460–466. [Google Scholar] [CrossRef]
  26. McDonough, W.F.; Sun, S.-S. The composition of the Earth. Chem. Geol. 1995, 120, 223–253. [Google Scholar] [CrossRef]
  27. Salters, V.J.M.; Stracke, A. Composition of the depleted mantle. Geochem. Geophys. Geosystems 2004, 5. [Google Scholar] [CrossRef]
  28. Balagansky, V.V.; Gorbunov, I.A.; Mudruk, S.V. Palaeoproterozoic Lapland-Kola and Svecofennian Orogens (Baltic Shield). Her. (Vestn.) Kola Sci. Cent. RAS 2016, 3, 5–11. [Google Scholar]
  29. Norman, M.D.; Garcia, M.O. Primitive magmas and source characteristics of the Hawaiian plume: Petrology and geochemistry of shield picrites. Earth Planet. Sci. Lett. 1999, 168, 27–44. [Google Scholar] [CrossRef]
  30. Matzen, A.K.; Baker, M.B.; Beckett, J.R.; Stolper, E.M. Fe–Mg Partitioning between Olivine and High-magnesian Melts and the Nature of Hawaiian Parental Liquids. J. Petrol. 2011, 52, 1243–1263. [Google Scholar] [CrossRef]
  31. Arndt, N.T. Thick, layered peridotite–gabbro lava flows in Munro Township, Ontario. Can. J. Earth Sci. 1977, 14, 2620–2637. [Google Scholar] [CrossRef]
  32. Arndt, N.T. Differentiation of Komatiite Flows. J. Petrol. 1986, 27, 279–301. [Google Scholar] [CrossRef] [Green Version]
  33. Arndt, N. Komatiites, kimberlites, and boninites. J. Geophys. Res. 2003, 108, 2293. [Google Scholar] [CrossRef]
  34. Nesbitt, R.W.; Sun, S.S.; Purvis, A.C. Komatiites: Geochemistry and genesis. Can. Mineral. 1979, 17, 165–186. [Google Scholar]
  35. Nesbitt, R.W.; Jahn, B.-M.; Purvis, A.C. Komatiites: An early precambrian phenomenon. J. Volcanol. Geoth. Res. 1982, 14, 31–45. [Google Scholar] [CrossRef]
  36. Sun, S.-S.; Nesbitt, R.W. Petrogenesis of Archaean ultrabasic and basic volcanics: Evidence from rare earth elements. Contrib. Mineral. Petrol. 1978, 65, 301–325. [Google Scholar] [CrossRef]
  37. Robin-Popieul, C.C.M.; Arndt, N.T.; Chauvel, C.; Byerly, G.R.; Sobolev, A.V.; Wilson, A. A New Model for Barberton Komatiites: Deep Critical Melting with High Melt Retention. J. Petrol. 2012, 53, 2191–2229. [Google Scholar] [CrossRef] [Green Version]
  38. Herzberg, C.; Condie, K.; Korenaga, J. Thermal history of the Earth and its petrological expression. Earth Planet. Sci. Lett. 2010, 292, 79–88. [Google Scholar] [CrossRef]
  39. Rollinson, H. The Archean komatiite-related Inyala Chromitite, southern Zimbabwe. Econ. Geol. 1997, 92, 98–107. [Google Scholar] [CrossRef]
  40. Mattioli, G.S.; Wood, B.J. Upper mantle oxygen fugacity recorded by spinel lherzolites. Nature 1986, 322, 626–628. [Google Scholar] [CrossRef]
  41. Murck, B.W.; Campbell, I.H. The effects of temperature, oxygen fugacity and melt composition on the behaviour of chromium in basic and ultrabasic melts. Geochim. Cosmochim. Acta 1986, 50, 1871–1887. [Google Scholar] [CrossRef]
  42. Czamanske, G.K.; Wones, D.R. Oxidation During Magmatic Differentiation, Finnmarka Complex, Oslo Area, Norway: Part 2, The Mafic Silicates. J. Petrol. 1973, 14, 349–380. [Google Scholar] [CrossRef]
  43. Fawcett, J.J. Alteration products of olivine and pyroxene in basalt lavas from the Isle of Mull. Mineral. Mag. 1965, 35, 55–68. [Google Scholar] [CrossRef]
  44. Wilshire, H.G. Alteration of olivine and orthopyroxene in basic lavas and shallow intrusions. Am. Mineral. 1958, 43, 120–147. [Google Scholar]
  45. Martin, R.F.; De Vito, C. The late-stage miniflood of Ca in granitic pegmatites: An open-system acid-reflux model involving plagioclase in the exocontact. Can. Mineral. 2014, 52, 165–181. [Google Scholar] [CrossRef]
  46. Barkov, A.Y.; Nikiforov, A.A. Compositional Variations of Apatite, Fractionation Trends, and a PGE–Bearing Zone in the Kivakka Layered Intrusion, northern Karelia, Russia. Can. Mineral. 2016, 54, 475–490. [Google Scholar] [CrossRef]
  47. O’Driscoll, B.; VanTongeren, J.A. Layered Intrusions: From Petrological Paradigms to Precious Metal Repositories. Elements 2017, 13, 383–389. [Google Scholar] [CrossRef] [Green Version]
  48. Barkov, A.Y.; Shvedov, G.I.; Polonyankin, A.A.; Martin, R.F. New and unusual Pd-Tl-bearing mineralization in the Anomal’nyi deposit, Kondyor concentrically zoned complex, northern Khabarovskiy kray, Russia. Mineral. Mag. 2017, 81, 679–688. [Google Scholar] [CrossRef]
  49. Dyukov, S.A. The Report No. 205 on Works on Geological Mapping and Searching for Mica, Carried out in Western Portion of the Kola Area of Murmanskaya Oblast in the Year of 1949; The Leningradsky (Northwestern) Geological Survey: Leningrad, Russia, 1950; unpublished report in Russian. [Google Scholar]
  50. Marsh, B.D. Encycl. of Solid Earth Geophysics; James, D., Ed.; Van Nostrand and Reinhold Co: New York, NY, USA, 1989; pp. 676–688. [Google Scholar] [CrossRef]
Figure 1. The location of the Chapesvara complex in relation to other complexes of mafic-ultramafic composition in the Kola Peninsula, northwestern Russia.
Minerals 10 00014 g001
Figure 2. The regional geology of the study area based on results of mapping by Shlayfshteyn [10]. The purple symbol shows the location of sampling area in the Chapesvara-I body (present investigation). Ultramafic rocks of the complexes are shown in green.
Minerals 10 00014 g002
Figure 3. The regional geology of the study area based on results of mapping by Sokolova [9]. The purple symbol shows the location of sampling area in the Chapesvara-II body (present investigation). Note that Figure 2 and Figure 3 display neighboring areas, and the sampling area shown in Figure 3 is located about 8 km northeast (along the River Nota bed) of the area shown in Figure 2. Ultramafic rocks of the complexes are shown in green.
Minerals 10 00014 g003
Figure 4. The regional geology of the study area based on results of mapping by Shlayfshteyn [10]. Ultramafic rocks of the complexes are shown in green.
Minerals 10 00014 g004
Figure 5. The geology of the Chapesvara-II body based on results of mapping by Gorbacheva and coworkers [11].
Minerals 10 00014 g005
Figure 6. The location of sampling—traverse (oriented from the point a to b) and across the Chapesvara–II body. The GPS coordinates are plotted on a SAS.Planet© image. Note the development of two systems of abundant perpendicular fractures, which likely formed as a result of contraction at a shallow level as the pressure and temperature decreased sharply.
Minerals 10 00014 g006
Figure 7. A generalized scheme (this study) showing the internal structure of the Chapesvara-II body observed along the traverse a–b shown in Figure 6. The Roman numerals display relative temporal relationships (i.e., the inferred sequence of crystallization) between the lithological units from I (early) to IV (late). See the text for results and discussion. The khaki green color is used (this study) to show the upper contact facies (UCF).
Minerals 10 00014 g007
Figure 8. Characteristic features of a bedrock outcrop in the study area, which indicate the effects of a glacial erosion in the Chapesvara-II area.
Minerals 10 00014 g008
Figure 9. Characteristic textures of ultramafic rocks of the Chapesvara complex, as shown in back-scattered electron images (BSE) in (af). Specimens of fine-grained dunite grading to harzburgite and olivine-bearing orthopyroxenite are composed mainly of olivine (Ol) and orthopyroxene (Opx). Minor clinopyroxene (Cpx) and plagioclase (Pl) are rare in this complex. The label Amp is amphibole, and Chr stands for chromian spinel. Note that a late generation of Opx (dark phase) is present in (c). A reaction assemblage (e), consists of successive rims of Pl and Amp (i.e., an aluminous amphibole of pargasitic composition), which mantles a core of Cpx.
Minerals 10 00014 g009
Figure 10. Examples of textures and mineral associations in dunite and Ol-bearing orthopyroxenite of the Chapesvara complex, as shown in BSE images in (af). The labels used are the same as in Figure 9. Chromian spinel (Chr) is present as accessory grains, Chl is a member of the chlorite group (clinochlore), Pn is pentlandite, and the labels sil-1 and sil-2 pertain to grains of hydrous silicates composed of the assemblage of talc + clinochlore. Note that a late generation of Opx-2 (d) occurs as veinlets or rim-like zones (dark in color) replacing the early generation of orthopyroxene (Opx-1: light phase).
Minerals 10 00014 g010
Figure 11. Plot of values of the index Mg# 100Mg/(Mg + Fe2+ + Mn) compared to the amounts of NiO (a) and MnO (b) expressed in wt. % in WDS compositions of olivine from the Chapesvara–I (blue symbol) and Chapesvara–II (brown symbol) bodies. Results of a total of 177 data-points are plotted. The label UCF (the upper contact facies) refers to a distinctive rock unit (see text for details).
Minerals 10 00014 g011
Figure 12. Variations in values of the Mg# index in olivine (a), orthopyroxene (c), and accessory grains of chromian spinel (d), contents of NiO in olivine (b, quoted in wt. %), and values of the Cr# index 100Cr/(Cr + Al), a ratio of atoms per formula unit, apfu) and of the index Fe3+# 100Fe3+/(Fe3+ + Fe2+) in chromian spinel (e,f), which are observed along the traverse a–b (shown in Figure 6) oriented across the Chapesvara-II body. The ordinate axis represents the distance (in meters) between sample locations of the profile a–b (Figure 6). The label UCF pertains to a rock of the upper contact facies (see text for details).
Minerals 10 00014 g012
Figure 13. Plot of values of the Mg# index in orthopyroxene (WDS compositions) versus their levels of incorporation of Ca (a), Al (b), and Cr (c) (expressed in apfu). Two groups of compositions were observed. Group-1’s pyroxene is normal and pertains to the original (magmatic) phase. The group-2 generations is poor in Ca, Al, and Fe; they are represented by late phases (dark veinlets and peripheral zones shown in Figure 10d) formed by replacement of the original phase of Opx. The dashed lines show relative compositional gaps existing between the group-1 and group-2 generations.
Minerals 10 00014 g013
Figure 14. Compositional variations of values of MgO plotted against FeO (weight percent) in grains of calcic amphibole (tremolite; a) and Fe–Mg amphibole (anthophyllite; b) in the Chapesvara bodies. A total of 102 (a) and 77 data-points (b) are plotted.
Minerals 10 00014 g014
Figure 15. Variations in estimated amounts of olivine in volume percent (a), values of the Mg# index in rocks (b); and whole-rock contents of SiO2 (c), TiO2 (d), Al2O3 (e), and Fe2O3 (f, all Fe as Fe2O3), all expressed in weight percent in results of XRF analyses, which are observed along the traverse a–b oriented across the Chapesvara-II body. The ordinate axis represents the distance (in meters) between sample locations of the profile a–b (Figure 6). As noted, the Chapesvara-II intrusion dips 40–60° towards the north. Therefore, the sampling traverse a–b (i.e., points CHP-17 to CHP-30), shown in Figure 6, is oriented from the bottom to the top. The label UCF pertains to the upper contact facies (see text for details).
Minerals 10 00014 g015
Figure 16. Variations in whole-rock contents of Cr2O3 (a), MnO (b), MgO (c), CaO (d), and NiO (e), expressed in weight percent, and values of the molar MgO/SiO2 ratio derived from results of XRF analyses of rock samples collected along the traverse a–b (shown in Figure 6) oriented across the Chapesvara-II body. The ordinate axis represents the distance (in meters) between sample locations of the profile a–b (Figure 6). The label UCF pertains to the upper contact facies (see text for details).
Minerals 10 00014 g016
Figure 17. Variations in whole-rock contents of vanadium (a), cobalt (b), cerium (c), lanthanum (d), praseodymium (e), and neodymium (f), all expressed in parts per million (ppm), in results of ICP-MS analyses of rock samples collected along the traverse a–b (shown in Figure 6) oriented across the Chapesvara-II body. The ordinate axis represents the distance (in meters) between sample locations of the profile a–b (Figure 6). The label UCF refers to the upper contact facies (see text for details).
Minerals 10 00014 g017
Figure 18. Variations in total amounts of whole-rock contents of rare-earth elements (a), zirconium (b), niobium (c), yttrium (d), hafnium (e), and thorium (f), all expressed in parts per million (ppm), in results of ICP-MS analyses of rock samples collected along the traverse a–b (shown in Figure 6) oriented across the Chapesvara-II body. The ordinate axis represents the distance (in meters) between sample locations of the profile a-b (Figure 6). The label UCF refers to the upper contact facies (see text for details).
Minerals 10 00014 g018
Figure 19. The C1-chondrite-normalized plots of contents of rare-earth elements, hafnium, and thorium in results of whole-rock analyses (ICP-MS) of ultramafic rocks in the Chapesvara-I body. The sampling area is shown in Figure 2. The C1-chondrite-normalizing values [26] were used.
Minerals 10 00014 g019
Figure 20. The C1-chondrite-normalized plots of contents of rare-earth elements, hafnium, and thorium in results of whole-rock analyses (ICP-MS) of ultramafic rocks in the Chapesvara-II body. The sampling traverse location (points Chp-16 to Chp-30) is shown in Figure 3 and Figure 6. The label UCF refers to the upper contact facies (see text for details). The C1-chondrite-normalizing values [26] were used.
Minerals 10 00014 g020
Figure 21. (a,b). Schematic representation of main events inferred in the crystallization history of the Chapesvara-II sill-like body.
Minerals 10 00014 g021
Table 1. Compositions of olivine in the Chapesvara (I and II) ultramafic bodies.
Sample*MSiO2FeOMnONiOMgOCaOTotalMg#
Ch-ra–ICHP-1-39.8214.440.130.3845.22bdl99.9984.7
CHP-4-40.0911.410.130.4047.740.0199.7888.1
CHP-5-40.0713.410.180.3446.56bdl100.5685.9
CHP-6-40.0711.120.170.3947.98bdl99.7288.3
CHP-7-40.1411.100.160.3848.07bdl99.8488.4
CHP-8-40.2211.290.170.3747.36bdl99.4188.0
CHP-9-39.0714.580.180.3145.00bdl99.1484.5
CHP-10-40.1312.630.180.3346.590.0199.8686.6
CHP-11-40.1912.110.150.3947.360.01100.2087.3
CHP-12-39.7812.830.200.3546.430.0199.5986.4
CHP-13-40.1712.490.160.3147.270.01100.4087.0
CHP-15-40.7611.010.150.3648.060.01100.3588.5
Ch-ra–IICHP-171040.3411.720.210.3546.68bdl99.3087.5
CHP-1949.540.0013.060.210.3246.530.01100.1286.2
CHP-2074.340.1212.510.170.3547.390.01100.5487.0
CHP-21123.840.0913.790.170.3346.06bdl100.4585.5
CHP-22212.940.8210.640.170.3948.26bdl100.2788.8
CHP-23237.640.3910.370.150.3948.82bdl100.1189.2
CHP-24247.539.9110.300.140.3949.370.01100.1289.4
CHP-2529741.0110.180.160.3848.510.01100.2589.3
CHP-26371.340.3810.460.130.4348.460.0299.8989.1
CHP-27420.840.1910.840.100.4448.03bdl99.6088.7
CHP-28544.540.6911.070.130.4248.140.01100.4588.5
CHP-30579.240.557.910.190.4150.30bdl99.3791.7
CHP-30579.240.588.030.170.4050.17bdl99.3591.6
Note. Results of electron-microprobe analyses (WDS data) are listed in wt. %. Mg# = 100Mg/(Mg + Fe2+ + Mn). *M is a relative distance (in meters) from the point “a” toward “b” in the transection a–b oriented across the Chapesvara–II body (Figure 2 and Figure 5). bdl: below detection limits.
Table 2. Compositional variations of accessory grains of chromian spinel along a transection oriented across of the Chapesvara–II ultramafic body.
#Sample*MTiO2Al2O3Cr2O3V2O3FeO
Total
FeO
Calc.
Fe2O3
Calc.
MnOMgONiOZnOTotalMg#Cr#Fe3+#
1CHP-17101.730.2622.020.2269.7330.3843.730.451.180.440.13100.546.498.256.4
2CHP-17101.740.2221.860.2470.0530.6543.780.500.960.430.16100.545.298.556.2
3CHP-1824.81.520.1917.110.2474.9130.0549.850.471.400.350.16101.327.598.459.9
4CHP-1824.81.510.1416.760.2876.0130.9250.110.400.900.360.15101.544.998.859.3
5CHP-1949.51.750.1919.670.1773.4231.1846.940.450.910.420.14101.814.998.657.5
6CHP-19A49.51.660.2120.470.2171.8330.8045.600.450.930.420.15100.895.098.557.1
7CHP-2074.31.650.2924.350.2368.3830.9241.620.380.860.490.25101.034.798.354.8
8CHP-2074.31.370.1515.700.2675.7629.9450.920.291.250.550.05100.496.998.660.5
9CHP-21123.80.911.9545.870.3044.5828.5517.810.551.890.100.3298.2610.494.035.9
10CHP-21123.81.051.7345.810.3044.9628.8317.930.551.800.120.2998.409.894.735.9
11CHP-22212.91.236.6346.720.1740.2128.1613.390.623.340.130.24100.6317.282.530.0
12CHP-22212.91.3211.1142.550.1939.7027.5713.480.564.470.140.26101.6522.172.030.5
13CHP-23237.60.751.9752.560.1340.8828.7813.450.702.210.100.20100.8411.894.729.6
14CHP-23237.61.361.7648.330.2044.3528.8117.270.652.570.220.15101.3213.494.935.0
15CHP-24247.52.145.1845.590.2240.5928.2513.720.643.420.180.1999.5217.485.530.4
16CHP-24247.50.773.7455.460.2234.8927.438.290.693.180.080.24100.0916.890.921.4
17CHP-24247.50.8016.5842.690.2132.7725.348.260.506.010.190.44101.0029.363.322.7
18CHP-25297.00.7810.0450.570.1432.5926.087.230.594.820.100.38100.7424.477.220.0
19CHP-25297.01.277.5248.670.2536.5127.4910.030.633.760.120.33100.0619.281.324.7
20CHP-25297.00.4917.1745.630.1029.1324.075.630.496.760.080.50100.9032.964.117.4
21CHP-26371.31.304.5855.250.4134.1827.906.980.423.480.120.42100.8618.089.018.4
22CHP-26371.30.813.1357.270.2933.4827.506.650.453.080.090.4099.6716.492.517.9
23CHP-27420.81.165.6952.900.4634.9027.837.870.513.460.060.34100.2717.986.220.3
24CHP-27420.80.843.8155.710.4034.2327.887.050.532.830.110.3899.5315.190.818.5
25CHP-27420.81.567.3048.830.4536.6027.979.580.493.740.130.34100.4019.081.823.6
26CHP-28544.51.131.6144.060.2848.3328.8821.620.502.200.260.35100.8811.894.840.3
27CHP-28544.51.141.6144.590.2748.5628.9921.740.512.310.250.34101.7612.294.940.3
28CHP-30579.20.232.9847.900.0842.3625.4918.750.823.880.140.29100.5420.891.539.8
29CHP-30579.20.238.2450.020.0734.1424.3210.910.735.250.090.34100.2227.280.328.8
30CHP-30579.20.351.6445.430.0846.4026.1822.460.833.340.260.20100.7718.194.943.6
Note. These compositional data (WDS; in weight percent) were observed along the traverse a–b (shown in Figure 6) oriented across the Chapesvara–II body. The label UCF pertains to the upper contact facies (see text for details). Contents of ferric and ferrous iron were calculated on the basis of stoichiometry and charge balance. *M is the distance in meters. Values of the Mg# index = 100Mg/(Mg + Fe2+ + Mn); the Cr# index = 100Cr/(Cr + Al); the Fe3+# index = 100Fe3+/(Fe3+ + Fe2+).
Table 3. Compositions of orthopyroxene in the Chapesvara (I and II) ultramafic bodies.
# SampleSiO2TiO2Al2O3Cr2O3FeOMnOMgOCaOTotalMg#
1Ch-ra–ICHP-456.280.061.510.706.720.1632.261.5899.2588.6
2CHP-456.080.051.390.766.890.1832.051.5898.9888.4
3CHP-656.320.061.450.726.590.1832.641.4899.4389.4
4CHP-657.500.020.020.068.250.2033.370.0499.4486.5
5CHP-756.210.071.500.676.660.1432.631.6599.5289.7
6CHP-756.370.051.290.676.480.1732.601.4599.0888.7
7CHP-1056.630.071.370.727.670.1731.971.3399.9286.6
8CHP-1056.610.061.240.727.000.1532.541.2499.5588.0
9CHP-1256.370.061.190.767.070.1832.211.4499.2887.6
10CHP-1255.530.091.910.767.800.1930.222.7199.2286.3
11CHP-1457.720.020.170.087.890.2133.660.0799.8187.1
12CHP-1456.450.101.900.637.710.1931.931.31100.2286.6
13CHP-1557.100.081.530.606.730.1632.221.79100.2087.3
14CHP-1557.240.031.260.576.580.1532.731.3799.9387.6
15Ch-ra–IICHP-2656.590.061.350.746.570.1432.761.3599.5789.0
16CHP-2657.790.010.030.027.030.2134.340.0599.4988.9
17CHP-2757.220.071.280.686.980.1732.131.4099.9286.2
18CHP-2756.980.051.380.677.170.1631.601.6599.6685.8
19CHP-2856.650.051.290.617.540.1831.841.3799.5286.6
20CHP-2858.010.030.020.057.700.2034.060.06100.1387.8
Note. Results of electron-microprobe analyses (WDS) are listed in weight percent. All Fe is given as FeO.
Table 4. Compositions of clinopyroxene, plagioclase and aluminous amphibole in the Chapesvara–I ultramafic body.
#SampleMineralSiO2TiO2Al2O3Cr2O3FeOMnOMgOCaONa2OK2OTotal
1CHP-10Cpx52.980.192.811.323.790.1316.7021.160.840.0199.91
252.440.213.301.263.930.1016.5820.970.72bdl99.51
3Pl57.37bdl26.41bdl0.140.01bdl8.757.320.02100.02
454.38bdl28.23bdl0.11bdlbdl10.985.790.0499.54
5Amp40.630.0320.68bdl5.020.1517.918.124.240.1996.98
643.490.0417.070.014.740.1318.848.284.360.1997.13
742.460.0817.710.034.550.0818.528.574.400.4896.88
8CHP-12Cpx52.320.193.021.413.710.1416.0321.530.80bdl99.14
951.840.253.741.354.070.1216.5320.570.77bdl99.24
10Pl53.64bdl28.94bdl0.06bdlbdl11.815.770.04100.26
1155.04bdl28.00bdl0.12bdlbdl10.696.630.03100.51
12Amp42.020.0818.15bdl4.190.1217.3111.214.520.3297.91
1341.550.0619.95bdl6.590.2820.685.274.640.1699.17
1442.140.0519.92bdl6.030.2121.353.784.670.1298.27
1543.030.0618.06bdl4.970.1520.875.754.231.0098.12
Note. Results of electron-microprobe analyses (WDS) are listed in weight percent. All Fe values are given as FeO. Cpx is clinopyroxene, Pl is plagioclase, and Amp is aluminous amphibole (pargasite).
Table 5. Compositions of calcic amphibole in the Chapesvara (I and II) ultramafic bodies.
# SampleSiO2TiO2Al2O3Cr2O3FeOMnOMgOCaONa2OK2OTotal
1Ch-ra–ICHP-158.180.030.520.032.400.0822.9912.600.560.0297.40
2CHP-156.280.092.050.313.090.0922.3811.971.450.0497.75
3CHP-257.840.040.860.082.870.0622.7712.210.800.0397.55
4CHP-358.020.050.740.122.780.0723.1512.170.670.0397.79
5CHP-458.800.020.160.051.880.0722.9313.380.070.0197.37
6CHP-457.940.020.500.102.170.0822.9413.140.230.0397.15
7CHP-558.320.040.430.022.400.0923.6612.550.380.0297.91
8CHP-558.430.020.300.022.180.0823.4113.020.230.0297.70
9CHP-658.020.060.750.082.040.0723.1412.490.350.0297.02
10CHP-758.440.020.650.052.000.0822.8412.770.240.0297.11
11CHP-757.510.081.120.102.130.0723.0812.440.510.0397.06
12CHP-859.140.010.190.031.790.0722.8413.460.170.0197.70
13CHP-958.530.050.620.052.600.0823.0712.350.640.0297.99
14CHP-1158.620.020.420.062.470.1023.3812.160.490.0397.75
15CHP-1358.900.040.230.042.060.0523.1712.650.340.0297.48
16CHP-1456.530.132.480.142.340.0922.8712.060.830.0497.50
17CHP-1458.830.020.310.021.870.0423.3312.870.150.0197.46
18Ch-ra–IICHP-1658.800.050.300.072.510.1023.1012.610.200.0297.74
19CHP-1758.800.040.240.062.050.1323.1412.650.280.0197.39
20CHP-1858.180.020.330.012.380.0923.7212.500.320.0397.58
21CHP-1958.600.040.370.072.330.1223.1612.460.400.0297.56
22CHP-2057.850.050.510.182.230.0823.4112.390.630.0297.35
23CHP-2158.130.040.570.092.420.0823.2112.010.700.0297.27
24CHP-2257.790.061.000.172.120.0823.2212.380.830.0397.68
25CHP-2458.060.050.450.111.870.0823.6212.640.440.0197.33
26CHP-2558.480.050.590.131.910.0723.3012.410.510.0397.48
27CHP-2558.590.030.440.152.200.1224.2311.660.340.0297.78
28CHP-2657.940.060.690.201.960.0923.4012.460.490.0197.30
29CHP-2858.190.050.560.192.150.0723.4912.210.410.0197.33
30CHP-2858.500.060.430.102.080.0723.3712.380.330.0297.33
Note. Results of electron-microprobe analyses (WDS) are listed in wt. %. All Fe is given as FeO.
Table 6. Compositions of Fe–Mg amphibole in the Chapesvara (I and II) ultramafic bodies.
# SampleSiO2TiO2Al2O3Cr2O3FeOMnOMgOCaONa2OK2OTotal
1Ch-ra–ICHP-158.18bdl0.130.0310.410.2827.211.060.100.0197.40
2CHP-158.770.030.100.0110.350.2827.830.350.12bdl97.82
3CHP-259.07bdl0.050.0511.150.3226.860.600.08bdl98.18
4CHP-358.60bdl0.050.0111.220.2927.620.530.030.0198.36
5CHP-558.91bdl0.080.0210.120.3627.930.650.04bdl98.10
6CHP-959.29bdl0.080.0310.030.3027.780.510.09bdl98.10
7CHP-1159.240.010.050.019.550.2928.420.580.04bdl98.18
8CHP-1359.170.010.060.029.770.3127.930.620.05bdl97.92
9Ch-ra–IICHP-1659.400.010.010.029.710.3227.470.570.01bdl97.53
10CHP-1759.01bdl0.020.039.420.4327.720.650.05bdl97.33
11CHP-1858.67bdl0.030.019.730.3528.480.520.01bdl97.81
12CHP-1959.130.010.05bdl9.650.4027.810.630.07bdl97.75
13CHP-19A59.100.020.070.0210.030.4827.680.710.03bdl98.13
14CHP-2058.61bdl0.070.039.400.3428.470.670.030.0197.63
15CHP-2158.860.010.080.0510.160.3127.750.600.09bdl97.92
16CHP-2659.130.010.06bdl8.290.3028.710.500.04bdl97.03
17CHP-2659.010.010.10bdl8.550.2928.810.650.040.0197.46
18CHP-2759.310.010.090.029.010.2628.130.620.08bdl97.52
19CHP-2859.410.020.080.038.800.2428.620.590.04bdl97.82
20CHP-2859.190.010.05bdl9.220.2828.340.620.03bdl97.74
Note. Results of electron-microprobe analyses (WDS) are listed in weight percent. All Fe is given as FeO.
Table 7. Compositions of deuterically formed assemblages of hydrous silicates and a magnesium carbonate in the Chapesvara (I and II) ultramafic bodies.
#SampleMineralSiO2TiO2Al2O3Cr2O3FeOMnOMgOCaONa2OK2OTotal
1CHP-2Chl33.230.0314.702.534.230.0333.140.01bdl0.0187.90
232.780.0314.202.774.190.0333.10bdlbdlbdl87.10
3CHP-332.480.0413.672.454.780.0232.450.03bdl0.0285.94
432.510.0214.482.304.000.0133.330.040.010.0186.71
5CHP-8Srp39.730.020.140.019.060.0836.320.03bdlbdl85.39
6CHP-11Crb0.01bdl0.010.015.420.2342.200.200.02bdl48.09
7Srp41.860.020.030.019.290.1535.620.07bdlbdl87.04
8CHP-15Chl32.420.0316.551.732.930.0233.68bdlbdlbdl87.35
931.930.0716.922.113.090.0233.75bdlbdlbdl87.88
10CHP-1634.350.0413.381.963.960.0234.40bdl0.02bdl88.13
1133.380.0514.332.054.220.0233.83bdl0.01bdl87.89
12CHP-18Srp41.780.01bdl0.0213.930.3033.120.07bdlbdl89.23
1341.620.010.030.0113.610.2633.560.080.01bdl89.20
14Chl34.480.0210.861.515.380.0635.57bdlbdlbdl87.87
1534.270.0313.331.804.550.0233.01bdl0.020.0187.04
16CHP-2134.320.0313.142.393.950.0232.39bdl0.05bdl86.29
17CHP-2332.860.0312.593.353.310.0235.06bdlbdlbdl87.21
1832.890.0212.893.343.240.0135.41bdlbdlbdl87.79
19Crbbdl0.010.000.014.490.2543.390.16bdlbdl48.30
20CHP-24Tlc61.750.020.330.031.300.0131.330.010.24bdl95.02
2162.180.020.290.021.210.0130.870.010.260.0194.88
22CHP-25Chl34.370.0513.583.332.700.0233.320.02bdl0.0187.40
23CHP-29Tlc61.560.060.810.141.26bdl31.08bdl0.630.0195.54
2460.410.111.940.271.340.0131.24bdl1.260.0296.61
25Chl33.380.0513.632.313.660.0134.990.01bdl0.0188.05
2633.440.0413.622.293.660.0235.26bdlbdl0.0188.34
27CHP-30Tlc63.37bdl0.140.040.820.0130.87bdl0.12bdl95.38
2863.00bdl0.110.031.000.0130.90bdl0.07bdl95.12
29Chl32.880.0113.823.122.930.0234.950.01bdlbdl87.73
3033.080.0213.683.163.010.0235.020.020.010.0188.01
Note. Results of electron-microprobe analyses (WDS) are listed in weight percent. All Fe is given as FeO. Labels CHP-2 to CHP-15 pertain to Chapesvara–I, and CHP-16 to CHP-30 pertain to Chapesvara–II. Labels Chl is chlorite (clinochlore), Tlc is talc, Srp is serpentine, and Crb is a magnesium carbonate (magnesite). Bdl: below detection limits.
Table 8. Compositions of Co-bearing pentlandite in the Chapesvara-I–II complex.
Sample FeCoNiSTotalΣMe (apfu)Ni/FeS (apfu)
CHP-13Ch-ra–I30.401.7333.9433.8499.918.871.18.13
CHP-13Ch-ra–I30.151.6733.7633.8799.458.841.18.16
CHP-18Ch-ra–II31.891.2433.8833.63100.648.961.08.04
CHP-18Ch-ra–II31.521.1933.8333.4299.968.961.08.04
CHP-18Ch-ra–II31.691.1933.8433.41100.138.971.08.03
CHP-18Ch-ra–II31.721.1933.6433.49100.048.951.08.05
CHP-19ACh-ra–II35.091.4330.5933.45100.569.000.88.00
CHP-19ACh-ra–II34.911.5230.2733.62100.328.950.88.05
CHP-19ACh-ra–II34.981.3530.3633.65100.348.950.88.05
CHP-19ACh-ra–II35.031.3330.4133.71100.488.950.88.05
Note. Results of electron-microprobe analyses (WDS) are quoted in weight percent. The values in apfu (atoms per formula unit) are based on a total of 17 apfu.
Table 9. Whole-rock contents of major oxides in representative samples of the Chapesvara bodies (I and II).
SampleSiO2TiO2Al2O3Fe2O3MnOMgOCaONa2OK2OP2O5BaOSO3V2O5Cr2O3NiOLOITotalMg#Al2O3/TiO2
Ch-ra–ICHP-138.180.102.5012.430.1335.942.080.070.040.020.010.070.011.280.226.6199.6985.125.0
CHP-349.150.104.788.850.1828.192.540.120.010.010.01<0.030.011.200.124.5999.8986.347.8
CHP-443.680.071.5211.250.1639.610.89<0.050.010.01<0.01<0.030.011.270.231.0099.7487.521.7
CHP-540.280.122.6212.180.1533.012.43<0.050.010.020.010.060.010.950.207.7699.8584.321.8
CHP-644.250.071.6010.190.1638.621.12<0.050.010.010.01<0.030.011.140.202.1999.6588.222.9
CHP-745.050.071.5710.370.1639.491.05<0.050.010.010.01<0.030.011.180.210.79100.0488.322.4
CHP-840.020.071.3511.940.1641.630.86<0.050.010.010.01<0.030.011.460.251.8099.6287.419.3
CHP-944.260.122.7611.270.1631.842.510.060.020.020.010.060.010.900.165.5599.7084.823.0
CHP-1043.930.183.9411.080.1633.222.940.510.180.020.010.050.011.140.182.53100.0985.621.9
CHP-1136.850.091.8410.780.1536.061.29<0.050.010.010.010.060.011.600.2310.8199.7986.920.4
CHP-1245.350.173.7210.930.1633.542.730.450.160.020.01<0.030.011.120.171.68100.2685.921.9
CHP-1441.570.081.7211.550.1540.831.08<0.050.010.010.01<0.030.011.500.251.30100.1387.521.5
CHP-1543.790.071.5010.630.1539.550.99<0.050.010.010.01<0.030.011.230.211.1299.3688.121.4
Ch-ra–IICHP-1641.450.184.1511.430.1628.473.44<0.050.020.030.010.160.011.640.188.73100.0483.223.1
CHP-1739.060.173.4210.950.1632.742.04<0.050.010.030.01<0.030.011.450.209.3099.5885.620.1
CHP-1840.620.184.1510.360.1431.223.20<0.050.010.030.010.070.011.140.197.9899.3585.723.1
CHP-1939.900.184.0511.910.1631.682.920.070.020.020.01<0.030.021.600.196.7199.4884.122.5
CHP-2041.200.132.6611.520.1634.761.71<0.050.010.020.01<0.030.011.220.215.5999.2885.720.5
CHP-2148.310.132.619.450.1531.822.080.140.020.020.01<0.030.011.190.143.5999.6987.020.1
CHP-2238.180.071.5312.230.1642.500.79<0.050.010.010.01<0.030.012.250.301.2699.3887.321.9
CHP-2339.480.050.8111.790.1643.950.40<0.050.000.010.01<0.030.011.230.311.3499.5688.116.2
CHP-2438.670.050.9911.490.1544.870.20<0.050.010.010.01<0.030.011.290.311.7599.8188.619.8
CHP-2538.580.051.0411.310.1644.900.58<0.050.010.010.01<0.030.011.500.311.4299.9088.720.8
CHP-2646.400.071.489.280.1538.171.11<0.050.010.010.01<0.030.010.810.211.7299.4889.121.1
CHP-2748.380.071.499.360.1435.951.24<0.050.010.01<0.01<0.030.010.890.162.1599.9388.421.3
CHP-2848.990.081.699.730.1634.161.34<0.050.010.010.01<0.030.011.020.162.2299.6487.421.1
UCF*CHP-3030.950.092.0616.540.2637.040.06<0.050.010.010.01<0.030.0210.030.272.4699.8681.622.9
Note. Results of XRF analyses are listed in weight percent; all Fe is quoted as Fe2O3. Mg# = 100MgO/(MgO + FeOtotal) on a molar basis. *UCF means the upper contact facies. LOI: loss on ignition.
Table 10. Whole-rock contents of rare-earth elements, Hf and Th in representative samples of the Chapesvara (I and II) ultramafic bodies.
SampleLaCePrNdSmEuGdTbDyHoErTmYbLuHfTh(Gd/Yb)NEu/Eu*
Ch-ra–I CHP-10.611.730.241.010.210.0660.230.0400.290.0660.200.0300.180.0280.160.131.030.93
CHP-20.571.930.341.600.410.0840.400.0630.420.0850.230.0330.210.0300.220.131.560.62
CHP-40.410.740.110.390.0700.0110.0530.0110.0700.0190.0550.0100.0700.0100.100.130.610.53
CHP-50.541.420.220.770.230.0850.240.0370.240.0550.170.0260.160.0250.190.161.211.09
CHP-60.541.100.140.500.0950.0240.120.0200.140.0320.100.0150.0990.0150.140.0950.980.70
CHP-70.420.840.100.420.0960.0250.1000.0200.150.0330.100.0170.120.0180.110.130.670.79
CHP-80.420.890.130.570.110.0200.120.0200.130.0270.0850.0130.100.0140.130.131.030.52
CHP-90.821.980.281.270.350.0820.360.0530.380.0890.240.0380.230.0370.200.221.270.69
CHP-103.16.30.742.90.610.170.540.100.610.120.340.0500.330.0500.430.481.330.87
CHP-111.532.80.301.220.260.0420.230.0290.200.0420.120.0190.130.0200.160.191.460.51
CHP-122.85.80.652.60.580.180.620.0910.570.120.340.0500.320.0480.370.481.550.89
CHP-140.431.160.170.720.160.0410.200.0290.180.0340.100.0160.100.0160.140.131.600.69
CHP-150.380.820.120.430.120.0220.140.0210.130.0330.100.0150.0980.0150.100.0951.170.53
Ch-ra–IICHP-161.733.80.542.20.500.0980.540.0900.580.130.370.0540.340.0500.460.351.280.57
CHP-170.962.60.391.740.530.120.450.0810.530.110.310.0500.310.0480.390.291.170.70
CHP-184.69.01.003.90.720.220.750.120.770.160.430.0640.420.0640.520.701.450.90
CHP-193.46.30.762.80.610.170.570.0800.520.110.350.0520.350.0510.480.511.320.88
CHP-201.382.80.361.490.410.0810.300.0500.340.0840.230.0360.220.0350.290.291.140.67
CHP-212.23.90.421.510.370.0860.340.0550.320.0730.210.0310.210.0310.250.291.300.73
CHP-220.611.250.130.540.120.0380.140.0200.140.0280.0780.0120.0710.0110.140.131.600.87
CHP-230.200.430.0530.240.0780.0170.0740.0110.0770.0200.0620.0100.0750.0120.0510.130.790.69
CHP-240.110.210.0290.110.0260.0090.0340.0060.0390.0090.025<0.0050.025<0.0050.0510.031.090.93
CHP-250.621.240.120.500.120.0290.0730.0130.0920.0190.0590.0100.0580.0090.0760.0951.020.90
CHP-260.711.400.170.610.140.0450.150.0220.120.0270.080.0130.090.0140.100.131.350.94
CHP-270.290.820.120.550.130.0290.1000.0190.140.0320.110.0190.140.0230.0890.100.580.75
CHP-280.551.110.130.600.140.0360.160.0230.150.0350.120.0200.140.0210.110.100.900.73
*UCFCHP-300.170.350.0390.150.0210.0080.020<0.0050.0300.0070.0270.0050.0310.005<0.050.030.521.18
Note. Results of ICP-MS analyses are listed in ppm. The C1-chondrite-normalizing values take after [26]. *UCF means the upper contact facies. Eu/Eu* are the Eu-anomaly values.
Table 11. Whole-rock contents of different elements in representative samples of the Chapesvara (I and II) ultramafic bodies.
SampleScVCrCoNiCuZnRbSrYZrNbCsBaTaU
Ch-ra–ICHP-110.8508803.61351907.313.5920.89241.797.80.31<0.13.3<0.050.06
CHP-213.2608159.5681053.813.9701.1018.03.410.50.46<0.1360.0580.06
CHP-48.9458441.11181937.910.7671.447.91.308.50.19<0.16.0<0.050.03
CHP-511.8646357.61071727.97.2611.51292.68.50.27<0.19.3<0.050.09
CHP-610.1447847.11081748.413.9571.4014.91.044.70.19<0.15.7<0.050.03
CHP-79.6457812.71171844.97.01090.7211.11.138.90.27<0.14.2<0.050.03
CHP-87.3449359.61432263.48.4640.7210.60.8110.60.23<0.14.5<0.05<0.02
CHP-914.5695791.51141462.99.3621.13232.79.80.39<0.1<3<0.050.06
CHP-1014.0787668.71091606.127643.0483.719.00.73<0.163<0.050.06
CHP-117.45010,480.61292037.5<5760.558.11.407.90.31<0.13.3<0.050.03
CHP-1213.8747229.91081527.828763.4433.418.40.69<0.159<0.050.06
CHP-148.2489714.91392227.17.8760.6511.01.4910.70.23<0.14.8<0.050.03
CHP-158.7448117.11221952.47.6710.689.81.394.30.15<0.13.5<0.050.03
Ch-ra–IICHP-1612.68610,581.61011591.1261030.9913.03.8210.35<0.155<0.050.03
CHP-1711.3679250.21161782.17.5690.7917.43.217.80.85<0.16.1<0.050.09
CHP-1812.5757692.41091788.627670.72214.5250.96<0.111.00.0570.09
CHP-1912.09411,088.81161677.812.11311.27253.8210.73<0.16.2<0.050.09
CHP-2010.8647986.61131855.17.2720.7215.52.812.90.35<0.1<3<0.050.03
CHP-2113.1637683.4931198.26.9631.10202.311.40.39<0.18.6<0.050.03
CHP-226.34814,160.81362662.26.9801.168.21.046.00.19<0.13.4<0.050.03
CHP-235.3298503.41432899.311.41728.40.62<30.581.750.35<0.13.7<0.050.09
CHP-245.2328480.81392763.09.4550.755.20.624.50.12<0.13.5<0.05<0.02
CHP-255.93210,063.51442729.36.01510.793.90.843.70.15<0.1<3<0.05<0.02
CHP-269.6395402.91101880.914.3800.865.80.916.70.12<0.1<3<0.05<0.02
CHP-279.9445868.61101474.88.6470.754.61.206.50.15<0.1<3<0.050.03
CHP-2813.5476729.9991417.4<5710.825.61.274.50.15<0.110.6<0.050.03
UCF*CHP-304.9149>10,0002002297.58.83354.3<30.651.130.190.11<3<0.050.03
Note. Results of ICP-MS analyses are listed in ppm. *UCF means the upper contact facies.

