Article

Energy Transfer Processes in NASICON-Type Phosphates under Synchrotron Radiation Excitation

1
Institute of Physics, University of Tartu, 50411 Tartu, Estonia
2
Physics Department, Lomonosov Moscow State University, 119991 Moscow, Russia
3
Chemistry Department, Lomonosov Moscow State University, 119991 Moscow, Russia
4
Laboratory of Arctic Mineralogy and Material Sciences, Kola Science Centre, Russian Academy of Sciences, 184209 Apatity, Russia
5
Skobeltsyn Institute of Nuclear Physics, Lomonosov Moscow State University, 119991 Moscow, Russia
*
Author to whom correspondence should be addressed.
Symmetry 2023, 15(3), 749; https://doi.org/10.3390/sym15030749
Submission received: 15 February 2023 / Revised: 14 March 2023 / Accepted: 16 March 2023 / Published: 18 March 2023
(This article belongs to the Special Issue Advances in Synchrotron and Undulator Radiation Studies Ⅱ)

Abstract

:
The luminescence properties of NASICON-type Na3.6M1.8(PO4)3 (M = Y, Lu) and Na3Sc2(PO4)3 phosphates, undoped and rare earth-doped (RE = Tb3+, Dy3+, Eu3+, Ce3+), were studied using synchrotron radiation in a wide energy region of 4.5–45 eV. Intrinsic emission originating from self-trapped excitons with electron component localized at the 3d Sc states was detected in both doped and undoped Na3Sc2(PO4)3 while only defect-related emission was registered in Na3.6M1.8(PO4)3. Emission of RE ions substituting three-valent cations in low-symmetry sites was detected in all doped phosphates. The efficiency and pass ways of energy transfer from the host to emission centres were analysed based on luminescence excitation spectra. It is shown that the most efficient energy transfer is realized in Tb3+-doped phosphors, while it was poor for other RE ions. The differences in energy transfer efficiencies are explained by different position of RE f states in the crystal electronic band structure influencing the efficiency of charge carrier trapping in the substance. Based on excitation spectra analysis, the bandgap values were estimated to ~8 eV for all studied phosphates.

1. Introduction

Phosphates with a NASICON-type structure are suitable for application as superionic conductors for solid state batteries [1] as well as phosphors for optical thermometry [2] and white pcLEDs [3,4,5]. In particular, rare-earth (RE)-doped NASICON-type phosphates Na3Sc2(PO4)3 and Na3.6Y1.8(PO4)3 have proven themselves as perspective pcLED phosphors demonstrating bright impurity emission with high thermal stability [3,4,6,7]. For instance, Na3Sc2(PO4)3:Eu3+ has shown emission with zero temperature quenching up to 448 K. High thermal stability of the compound emission has been explained by phase transitions occurring in the temperature range 300–500 K and allowing the creation of additional channels of energy transfer from electron and hole traps to activators at elevated temperatures [3]. In addition, phosphates have attracted significant attention as materials for plasma display panels because of their strong absorption in the VUV region and high chemical stability [8,9].
Since phosphates are compounds with a wide band gap [10,11,12,13], the studies of energy transfer processes from the host to RE activators induced to control emission colour [14] can be mainly performed using the methods of vacuum ultraviolet (VUV) spectroscopy. Vacuum ultraviolet is a highly informative energy region for dielectric crystals with a wide band gap because it allows the investigation of their electronic structure and the obtaining of information about the processes of energy relaxation of electronic excitations. Using VUV spectroscopy techniques, it is possible to study not only intrinsic luminescence properties, but also energy transfer processes from the host to RE ions, particularly in the fundamental absorption region [15]. That is why synchrotron radiation (SR) beamlines enabling excitation of materials in a wide spectral range from IR to X-rays with high intensity and unique stability of the temporal structure are the most appropriate setups for such research. Along with free electron lasers [16], SR facilities providing a reduced bunch mode as an option also provide a powerful tool for the study of the evolution of electronic excitation created at high energies. Physical processes that can be studied in solids under SR as well as evolution history and geography of synchrotron radiation facilities in the world are described in the review [17]. Recently a new fourth generation synchrotron radiation light source with outstanding brightness and coherence has started its operation at MAX IV Laboratory (Lund, Sweden), offering photons for a wide variety of research fields, from fundamental physics to biosciences [18,19].
To the best of our knowledge, comprehensive studies of luminescent properties using the methods of VUV spectroscopy were performed only for Zr containing NASICON phosphates [8,9,20,21]. It has been demonstrated that Eu3+ ions occupy multiple sites in the crystal structure of EuIII1/3Zr2(PO4)3 [20]. The interplay between the host and activator states was investigated for Tb3+-doped RE1/3Zr2(PO4)3 (RE = Y, La, Gd and Lu) [14] and RE3+-doped AZr2(PO4)3 (A = Li, Na, K) [9]. For these zirconium-containing phosphors, a broad band in the VUV range (130–160 nm) in excitation spectra of Tb3+ emission has been attributed to the transitions within PO4 groups, while the band at 160–200 nm has been ascribed to the O2− → Zr4+ charge transfer transition [21]. The bands at 225 and 261 nm have been related to the spin-allowed and spin-forbidden f–d transitions (4f8 → 4f75d1) of Tb3+ ions, respectively. A similar set of the excitation peaks in UV and VUV spectral regions has also been observed for undoped and rare-earth (RE = Sm3+, Tb3+, Dy3+)-doped MZr4(PO4)6 (M = Ca, Sr) phosphates of a different structure type and ascribed to the same sequence of electronic transitions [22].
In addition to impurity emission bands observed in the visible spectral range, UV emission bands were also registered by Z.-J. Zhang et al. for CaZr4(PO4)6 and SrZr4(PO4)6 [22] and by us for Na3.6Y1.8(PO4)3:Dy3+ [7] and Na3.6Lu1.8(PO4)3:Eu3+ [23] NASICON phosphates. The origin of these bands has not been fully elucidated, although they indicate a radiative channel which is competitive with the RE emission and thus influences the efficiency of energy transfer to a functional emission centre. In addition, the structure refinement of Na3.6Lu1.8−x(PO4)3 indicated disorder in NASICON structure violating the C3 symmetry of the Lu cation sites due to the displacement of Lu ions inside the (Lu/Na)O6 complexes. It was confirmed by the broadening of emission lines of Eu3+ substituting Lu cations and by the appearance of additional emission peaks uncharacteristic for the C3 site symmetry. Moreover, in the previous studies, the luminescence excitation spectra were recorded only up to 10 eV, which did not allow analysis of the role of different host electronic states in the relaxation of high-energy excitations.
This study is focused on the luminescence properties of NASICON-type Na3.6M1.8(PO4)3 (M = Y, Lu) and Na3Sc2(PO4)3 phosphates, both undoped and rare-earth-doped (RE = Tb3+, Dy3+, Eu3+, Ce3+), under excitation in a wide energy region, whereas the main emphasis is put on the energy transfer processes from the host to emission centres.

2. Materials and Methods

A set of phosphates, Na3.6Y1.8(PO4)3 (NYP), undoped and doped with 0.4 mol%Tb3+, 0.04 mol%Dy3+, or 0.7 mol%Eu3+; Na3.6Lu1.8(PO4)3 (NLP), undoped and doped with 0.4 mol%Tb3+, 0.1 mol%Dy3+, or 0.5 mol%Eu3+; and Na3Sc2(PO4)3 (NSP), undoped and doped with 0.02 mol%Ce3+ or 0.01 mol%Eu3+ were synthesized using a high-temperature solid-state method. The concentrations of the RE activators were selected corresponding to the highest RE emission intensities based on the results of our previous studies of some phosphates [7,23]. For simplicity, impurity concentrations are given without units in chemical formulae later in the text.
For the synthesis of undoped phosphates, raw materials NH4H2PO4 (99.9%), Na2CO3 (99.9%), Lu2O3 (99.99%), Y2O3 (99.99%) or Sc2O3 (99.99%) purchased from Sigma-Aldrich were weighed according to the stoichiometric ratios. For the synthesis of RE-doped phosphates, the above-mentioned raw materials were mixed with simple RE oxides, namely Tb4O7 (99%), Dy2O3 (99.9%) and Eu2O3 (99.9%) according to the stoichiometric ratios as follows:
1.8 Na2CO3 + (1.8 − x)/2 M2O3 + (x/2) RE2O3 + 3 NH4H2PO4 → Na3.6M1.8−xREx(PO4)3
1.8 Na2CO3 + (1.8 − x)/2 M2O3 + (x/4) Tb4O7 + 3 NH4H2PO4 → Na3.6M1.8−xTbx(PO4)3
where M2O3 = Lu2O3 or Y2O3, and RE2O3 = Dy2O3 or Eu2O3.
Na2CO3 was preliminarily dried at 403 K, and the RE oxides were annealed at 1173 K to remove possible sediments of carbonate groups on the surface. Powder X-ray diffraction (PXRD) patterns of the initial components were tested using the JCPDS PDF#4 Database.
The mixtures of raw materials for each of the above-mentioned compositions were transferred into corundum crucibles. These crucibles were placed into a SNOL 7.2/1100 high-temperature tube furnace (SNOL Term, Russia). The raw mixtures were slowly preheated at 573 K and grounded. The second heat treatment was at 773 K for 3 h each time. The final annealing was at 1373 K for 24 h. It should be noted, that all heating treatments were performed at air atmosphere. Finally, the obtained products were cooled in the furnace to room temperature. The final synthesized compounds did not show any reflections corresponding to the impurity / initial / intermediate phases. The fitting of the PXRD patterns shows that Na3.6M1.8−xREx(PO4)3 solid solutions are isostructural to Na3.6Y1.8(PO4)3 (PDF#4 00-047-0972).
For Na3Sc2(PO4)3:RE (RE = 0.02Ce3+ and 0.01Eu3+) phosphates we used high-temperature solid-state synthesis in the reduction atmosphere N2/H2 (90:10). Raw materials were NH4H2PO4 (99.9%), Na2CO3 (99.9%), Sc2O3 (99.99%), and Eu2O3 (99.99%) or CeO2 (99.99%). The mixtures were pre-heated in air at 773 K for 3 h and finally calcinated at 1373 K for 24 h in N2/H2 flow.
PXRD studies were performed using a Bruker D8 Advance X-ray powder diffractometer (CuKα—radiation, λ = 1.5406 Å). The PXRD patterns were recorded in the 2θ range from 7° to 100° (0.02 step, 5 s/step exposition time).
Luminescent spectroscopy in the UV-VUV region was performed using the photoluminescence endstation of the FinEstBeAMS beamline of the MAX IV synchrotron facility [24]. The luminescence excitation spectra were recorded at 7 K in a wide energy range from UV to VUV (4.5–45 eV). When recording the excitation spectra, the higher orders of excitation were suppressed using a set of optical and metal thin-film filters. In particular, the excitation spectra were measured using an optical fused-silica filter in the energy region 4.5–7.0 eV, MgF2 optical filter for 6.5–11 eV, In thin-film filter for 12–17 eV, Sn thin-film filter for 16–24.5 eV, and Mg thin-film filter for 22–45 eV. The resulting excitation spectra were stitched together from the parts measured with different filters. To stitch the data in the region of the 1-eV gap between the spectra measured with MgF2 and In filters, a part of the excitation spectrum was measured without any filter. The spectral resolution in the measurements of excitation spectra was not worse than 4 and 30 meV at E < 10 eV and E = 10–45 eV, respectively. The samples were placed into a closed-cycle helium cryostat from ARS, equipped with a temperature controller, LakeShore 325. For the correction of the excitation spectra, an excitation flux curve obtained by the means of a factory calibrated AXUV-100G diode (OptoDiode Corp, Camarillo, CA, USA) was used. The luminescence spectra were recorded in the spectral range 200–750 nm using a fibre-coupled Andor Shamrock SR-303i (Andor Technology Ltd., Belfast, UK) spectrometer with a Hamamatsu photon counting head H8259-01. The presented luminescence spectra were corrected for the spectral sensitivity of the registration channel. Excitation spectra in the low energy region (3.5–4.5 eV) were measured for the NSP:Ce sample using a laboratory set-up and stitched to the excitation spectra measured at the FinEstBeAMS beamline.

3. Results and Discussion

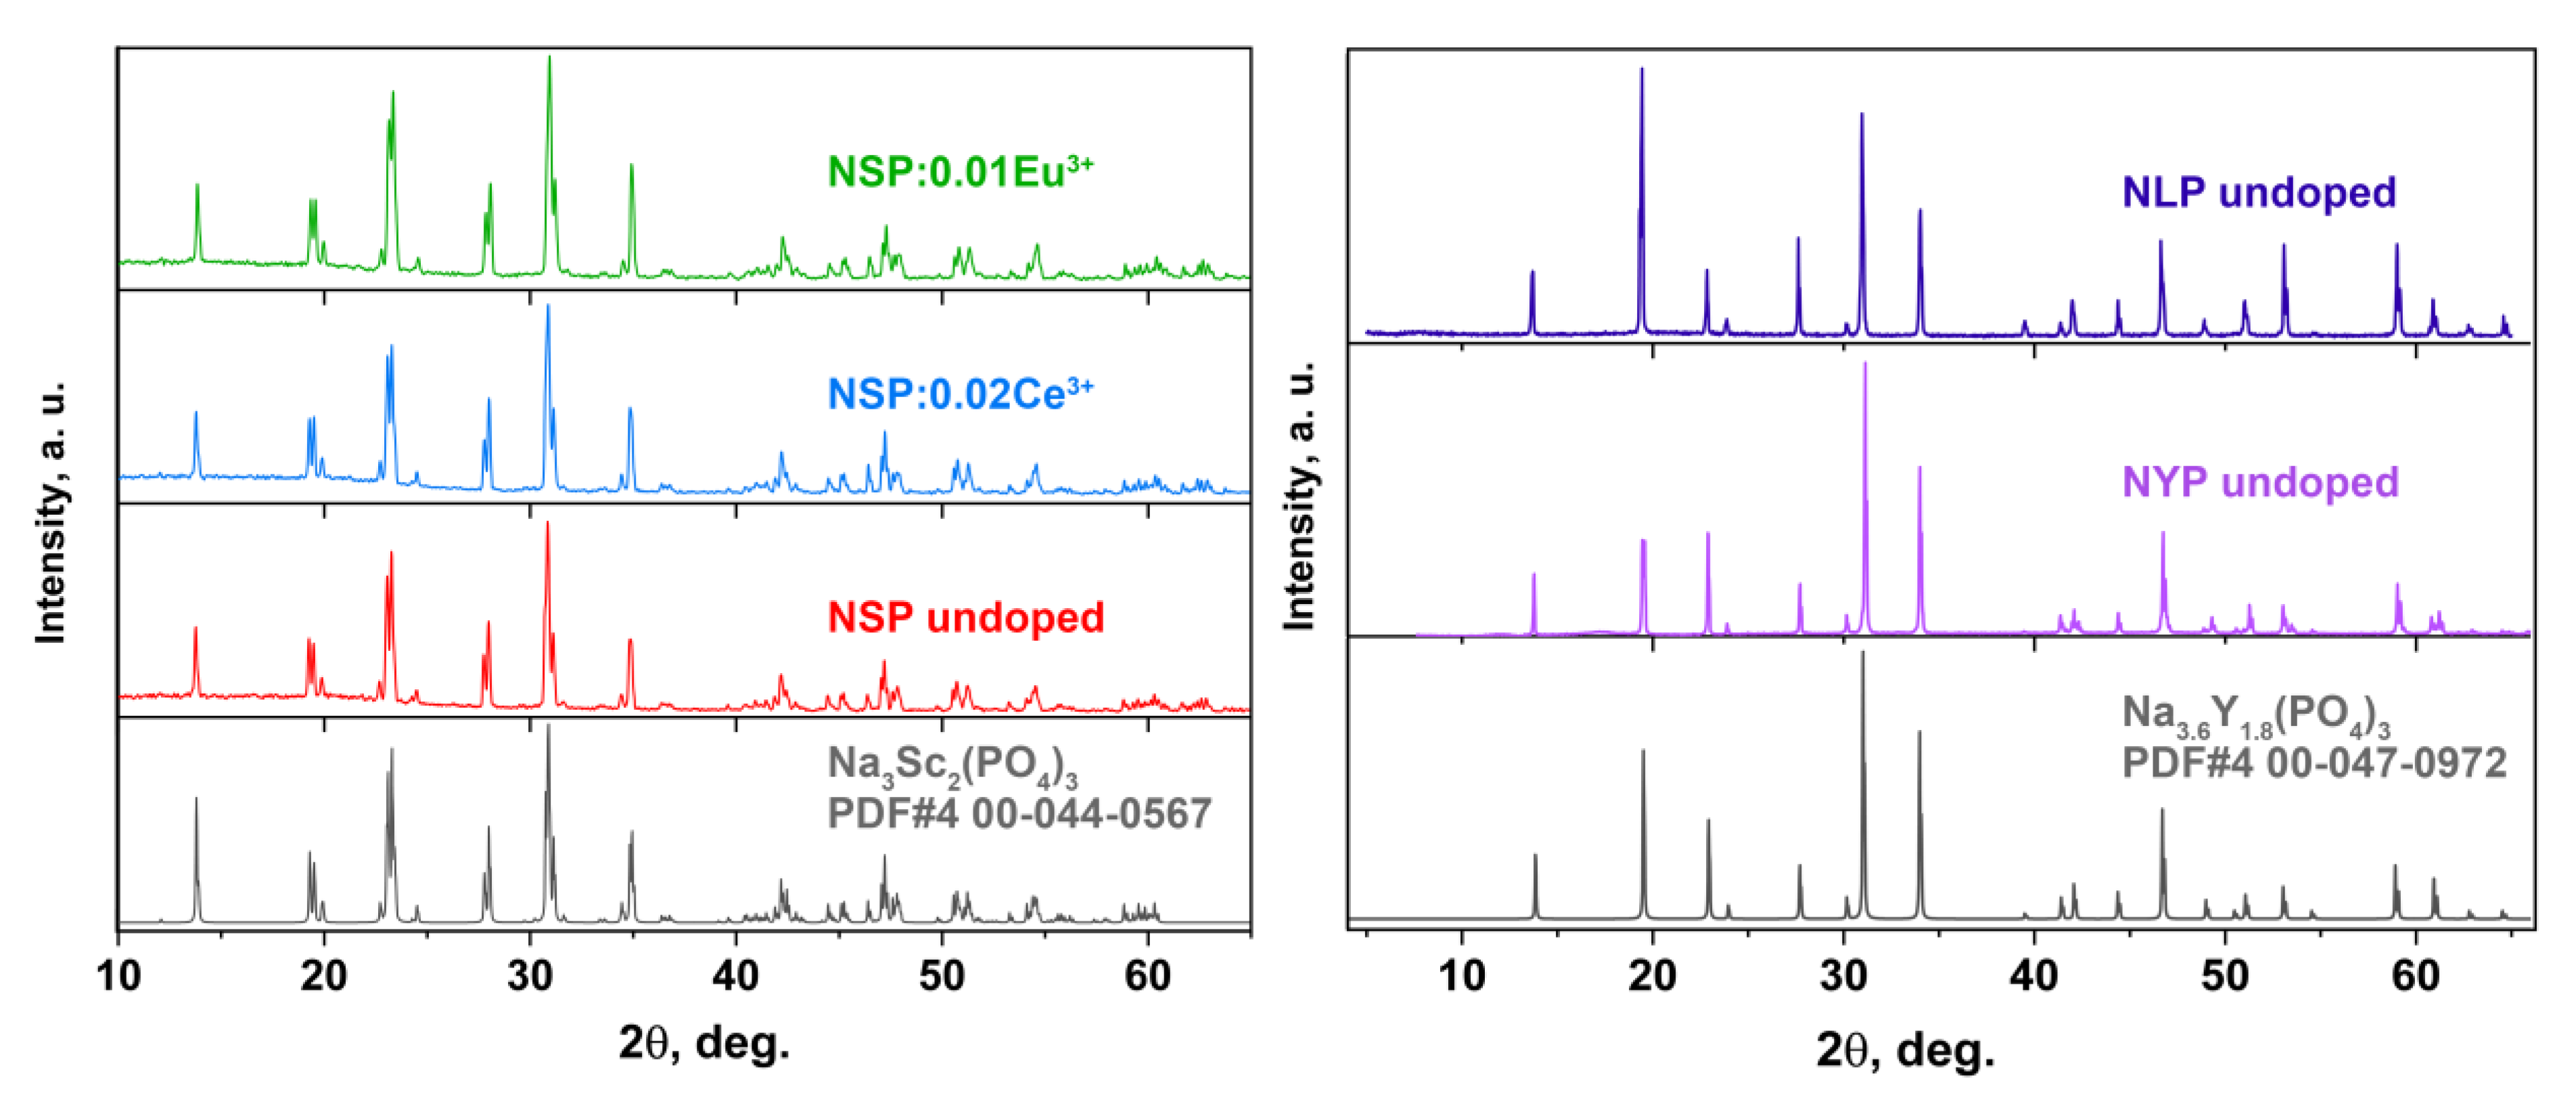
3.1. XRD Characterization

The obtained samples were isostructural to Na3Sc2(PO4)3 (PDF#4 00-044-0567) and Na3.6Y1.8(PO4)3 (PDF#4 00-047-0972) (Figure 1). Thus, the PXRD study revealed that all synthesized samples were single phased. The reflections on the PXRD patterns are attributed to the NASICON-type structure.

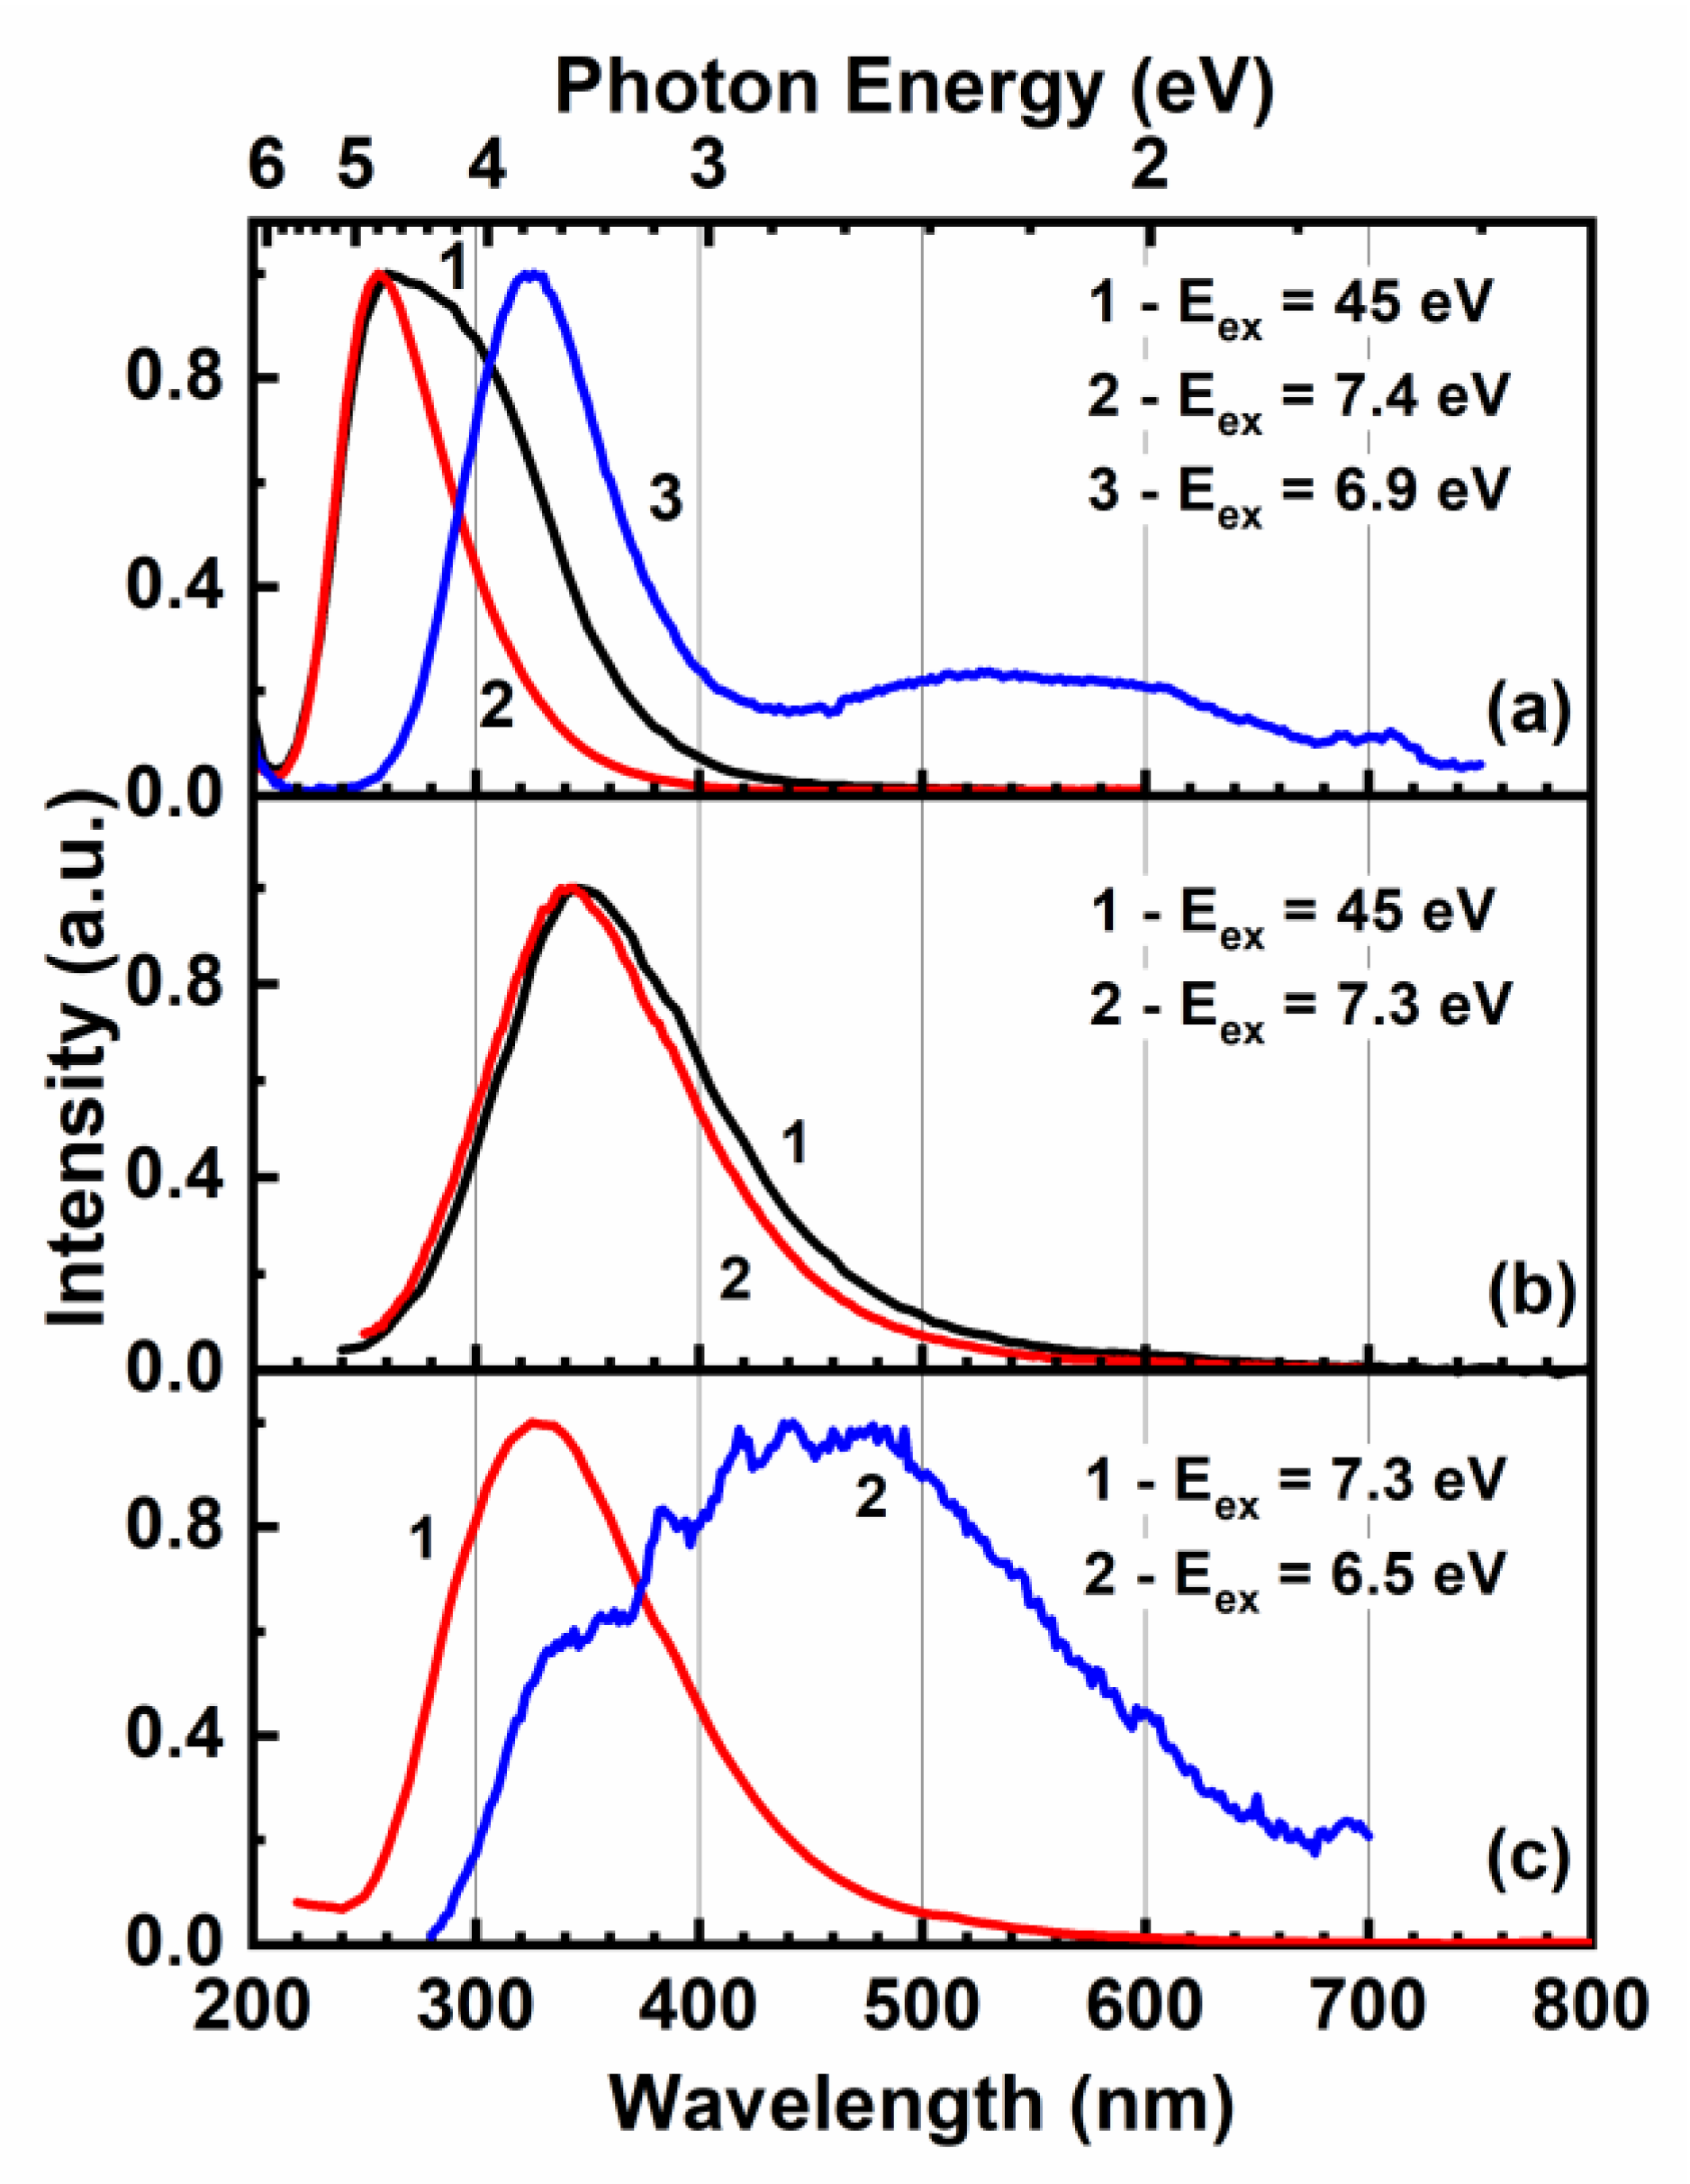
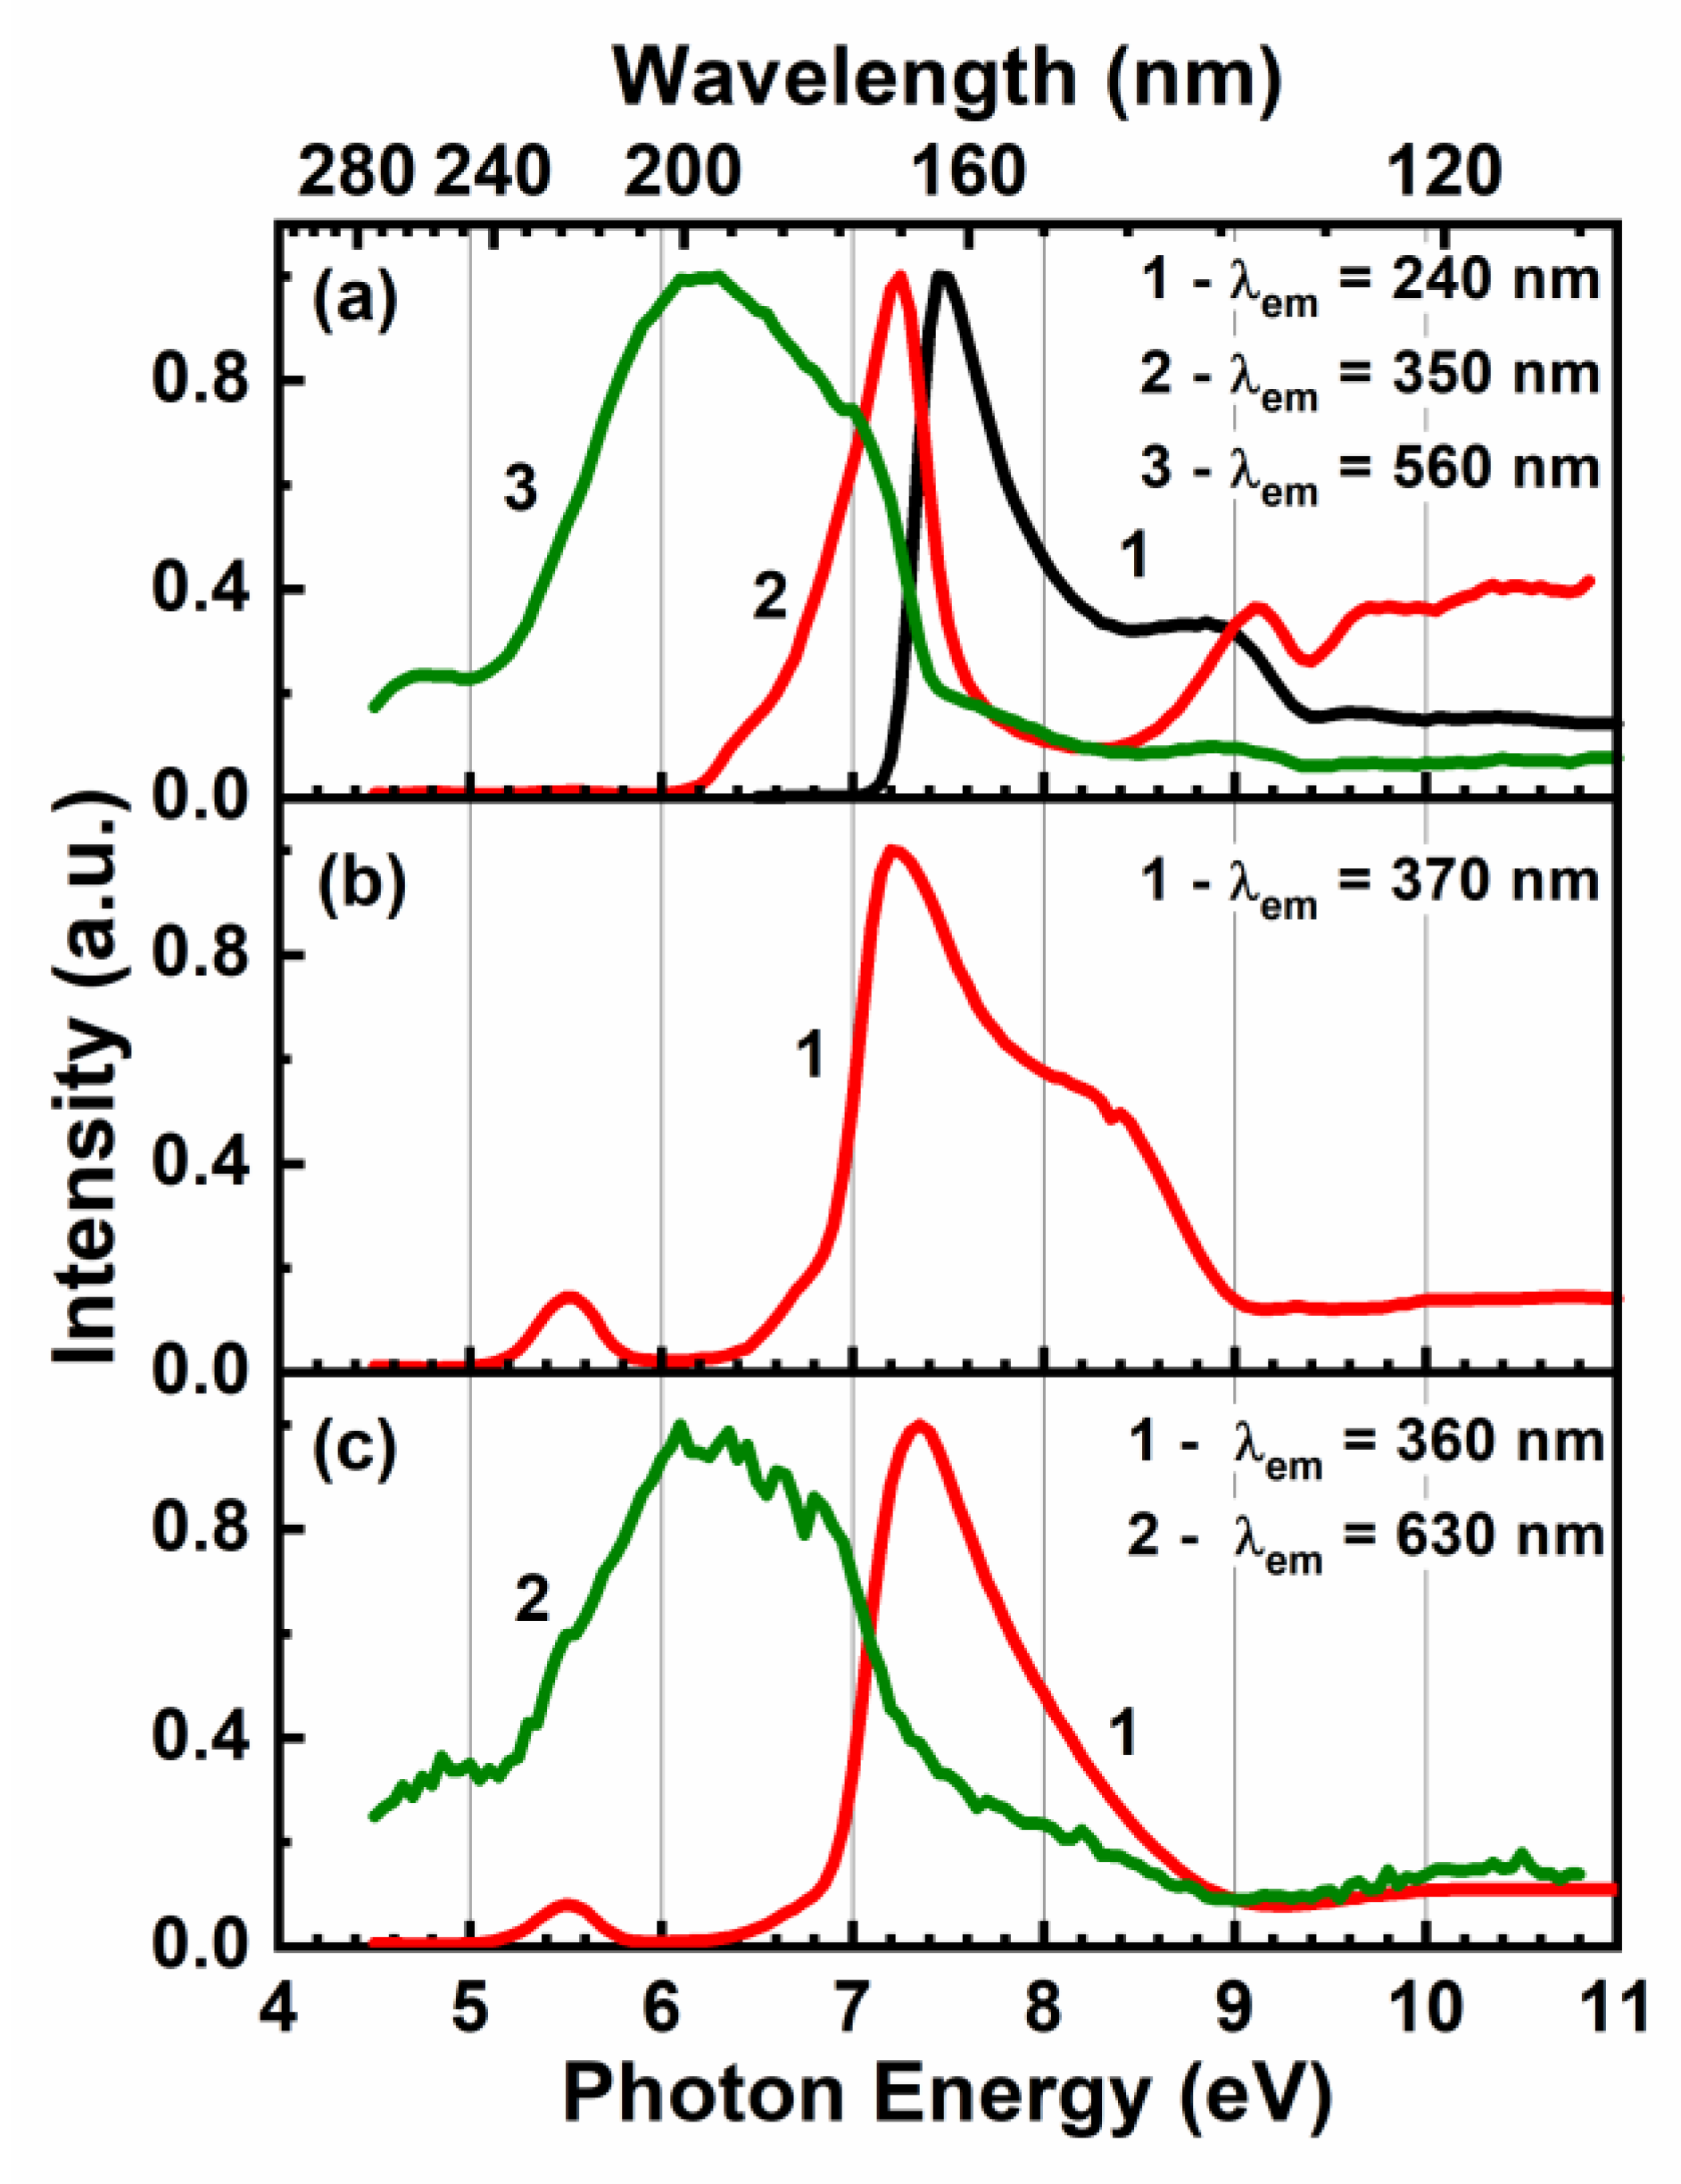
3.2. Undoped NASICON Phosphates

The luminescence spectra of undoped phosphates at different excitation energies are presented in Figure 2. Two broad overlapping UV emission bands were observed for NSP in the ultraviolet spectral region under the interband excitation, while only single UV emission bands peaking at 330 and 340 nm were detected for NYP and NLP, respectively. The overlapping bands in NSP can be separated using selective excitation at lower energies. In this case, two emission bands peaking at 260 and 325 nm were correspondingly registered at Eex = 7.4 eV (168 nm) and Eex = 6.9 eV (180 nm) (Figure 2a). Weak additional broad bands in the visible spectral region peaking at ~530 nm for NSP and at ~480 nm for NYP were also detected (Figure 2a,c).
Excitation spectra of the observed luminescence bands are presented in Figure 3. The spectra were measured at the slopes of the emission bands for NYP and NSP in order to minimize the contribution from the overlapping emissions. An onset at 7.1 eV and a peak at 7.45 eV were observed in the excitation spectrum of the 260-nm emission band in NSP (Figure 3a, curve 1). We suppose the onset to coincide with the fundamental absorption edge, while the first peak to be related to the exciton creation energy. The absence of excitation peaks at lower energies indicates that this emission band is of intrinsic nature for NSP. The excitation spectrum of the emission band at 325 nm (Figure 3a, curve 2) is represented by a peak at 7.24 eV and a shoulder at 6.4 eV. As this emission band can be excited at the energies below the energy of the exciton peak, it is attributed to structural defects. Its excitation efficiency decreases towards excitonic and fundamental absorption energy region that is related to the competition in energy transfer with the emission centres responsible for the 260-nm band. Due to this competition, the higher energy peak in the excitation spectrum of the 325-nm emission is also shifted to the region 8.8–9.1 eV, where a slope of excitation efficiency is observed for the 260-nm emission, although the features in the excitation spectra of both emissions are similar at yet higher energies. A broad excitation band peaking at 6.2 eV is observed for the emission band at 530 nm related to the defects of crystal structure (Figure 3a, curve 3). The intensity in the excitation spectrum drops almost to zero at Eex > 7.5 eV indicating poor energy transfer from the host to this defect emission centre.
The excitation spectra of the UV emission band at 330 nm in NYP and 340 nm in NLP (Figure 3b,c) are similar, indicating their similar origin, which does not depend on cation composition of NASICON phosphates. The spectra demonstrate an intense excitation peak at 7.35 eV for NYP and 7.22 eV for NLP with a shoulder at ~8.2 eV. The observed excitation peak maxima are situated at the energies lower than that of the excitonic peak 7.45 eV in NSP. Moreover, a separate low-intensity peak is also observed in the transparency region at 5.5 eV for both materials indicating the defect origin of the emission. The excitation spectrum of a broad emission band at ~480 nm in NYP is similar to that of the 530-nm emission band in NSP, which indicates a similar origin of defect-related emission centres for these bands.
From this analysis it follows that the intrinsic emission is observed as a band at 260 nm only for NSP while the emission bands of other studied samples originate from crystal structure defects. The electronic band structure of NASICON-type compounds has not been calculated so far, so we can only speculate on the nature of the emission bands. The intrinsic emission band of NSP is attributed to the radiative annihilation of self-trapped excitons with an electron component localized at the 3d Sc states and a hole component at the 2p O states. Excitons of the same origin possessing emission in the same spectral region have been previously observed for the Y1−xScxPO4 solid solutions [25,26]. Such an excitonic emission is not observed for the NYP and NLP samples. In the absence of Sc electronic states, only a single emission band is detected in the UV spectral region for both NLP and NYP, which is related to the structural defects, probably to the complexes containing oxygen vacancies as has been proposed previously in [7]. The excitation spectra of these emissions are similar for NYP and NLP, confirming that these bands have the same origin.
The emission band observed at 325 nm in NSP can also be attributed to structural defects. The difference in the profiles of excitation spectra of defect-related bands for NSP on the one side and NLP and NYP on the other side is connected to the competition with the intrinsic emission centres in NSP. A pronounced peak is observed in the excitation spectra of defect-related emission for all three compounds at E ~ 7.2–7.3 eV. The peak is located at lower energies in comparison to the excitonic one in NSP and can therefore be tentatively attributed to excitons localized near defects, which ensures efficient energy transfer to defect emission centres.
The energies of exciton peaks can be used for the estimation of bandgap energies according to the formula Eg = 1.08 × Eexc [27]. The position of the excitonic peak Eexc = 7.45 eV is known only for NSP, and the bandgap is estimated as Eg = 8.05 eV. Although the positions of excitonic peaks are not known for the NYP and NLP samples, we expect that the bandgap will be also around 8 eV, considering that peak positions for excitons localized near defects change only slightly with respect to those of nonperturbed excitons. It is worth noting that the estimated values of Eg are larger than those obtained previously for NYP (7.1 eV) and NLP (7.2 eV) [7,23]. However, the previous values were obtained on the basis of the analysis of the onset positions of excitation spectra, and so they rather represented the optical bandgaps for these compounds.

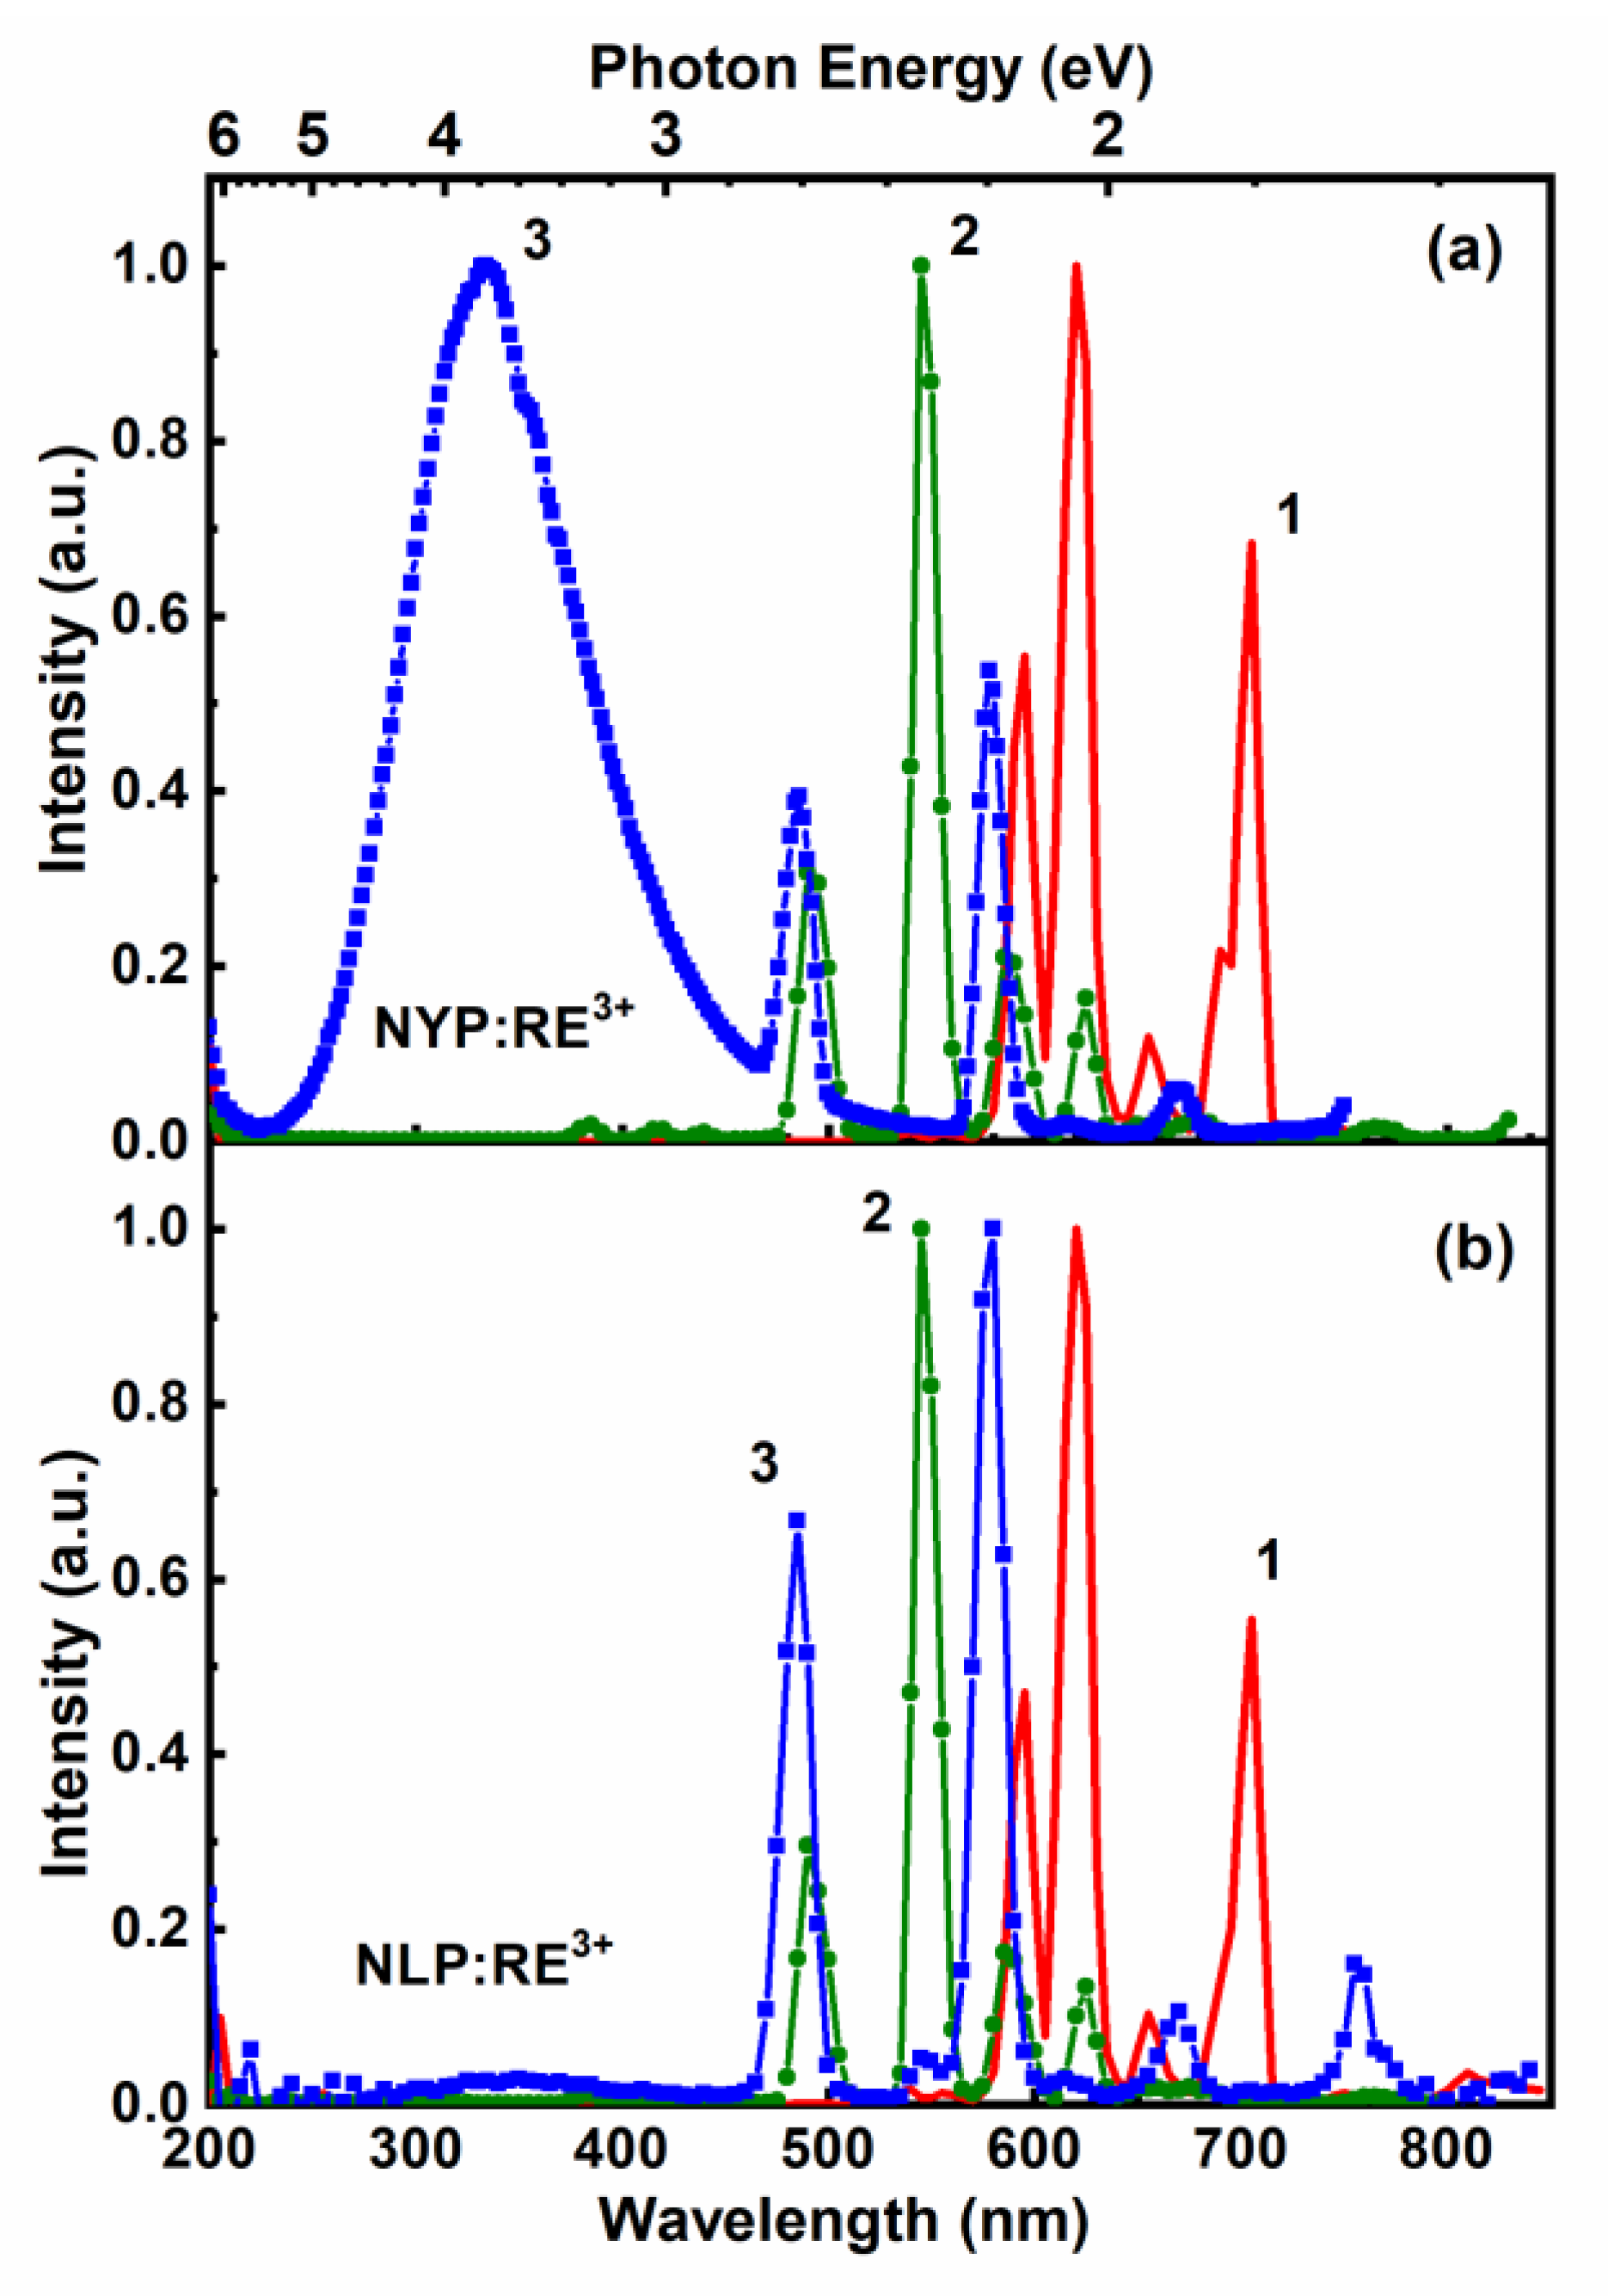
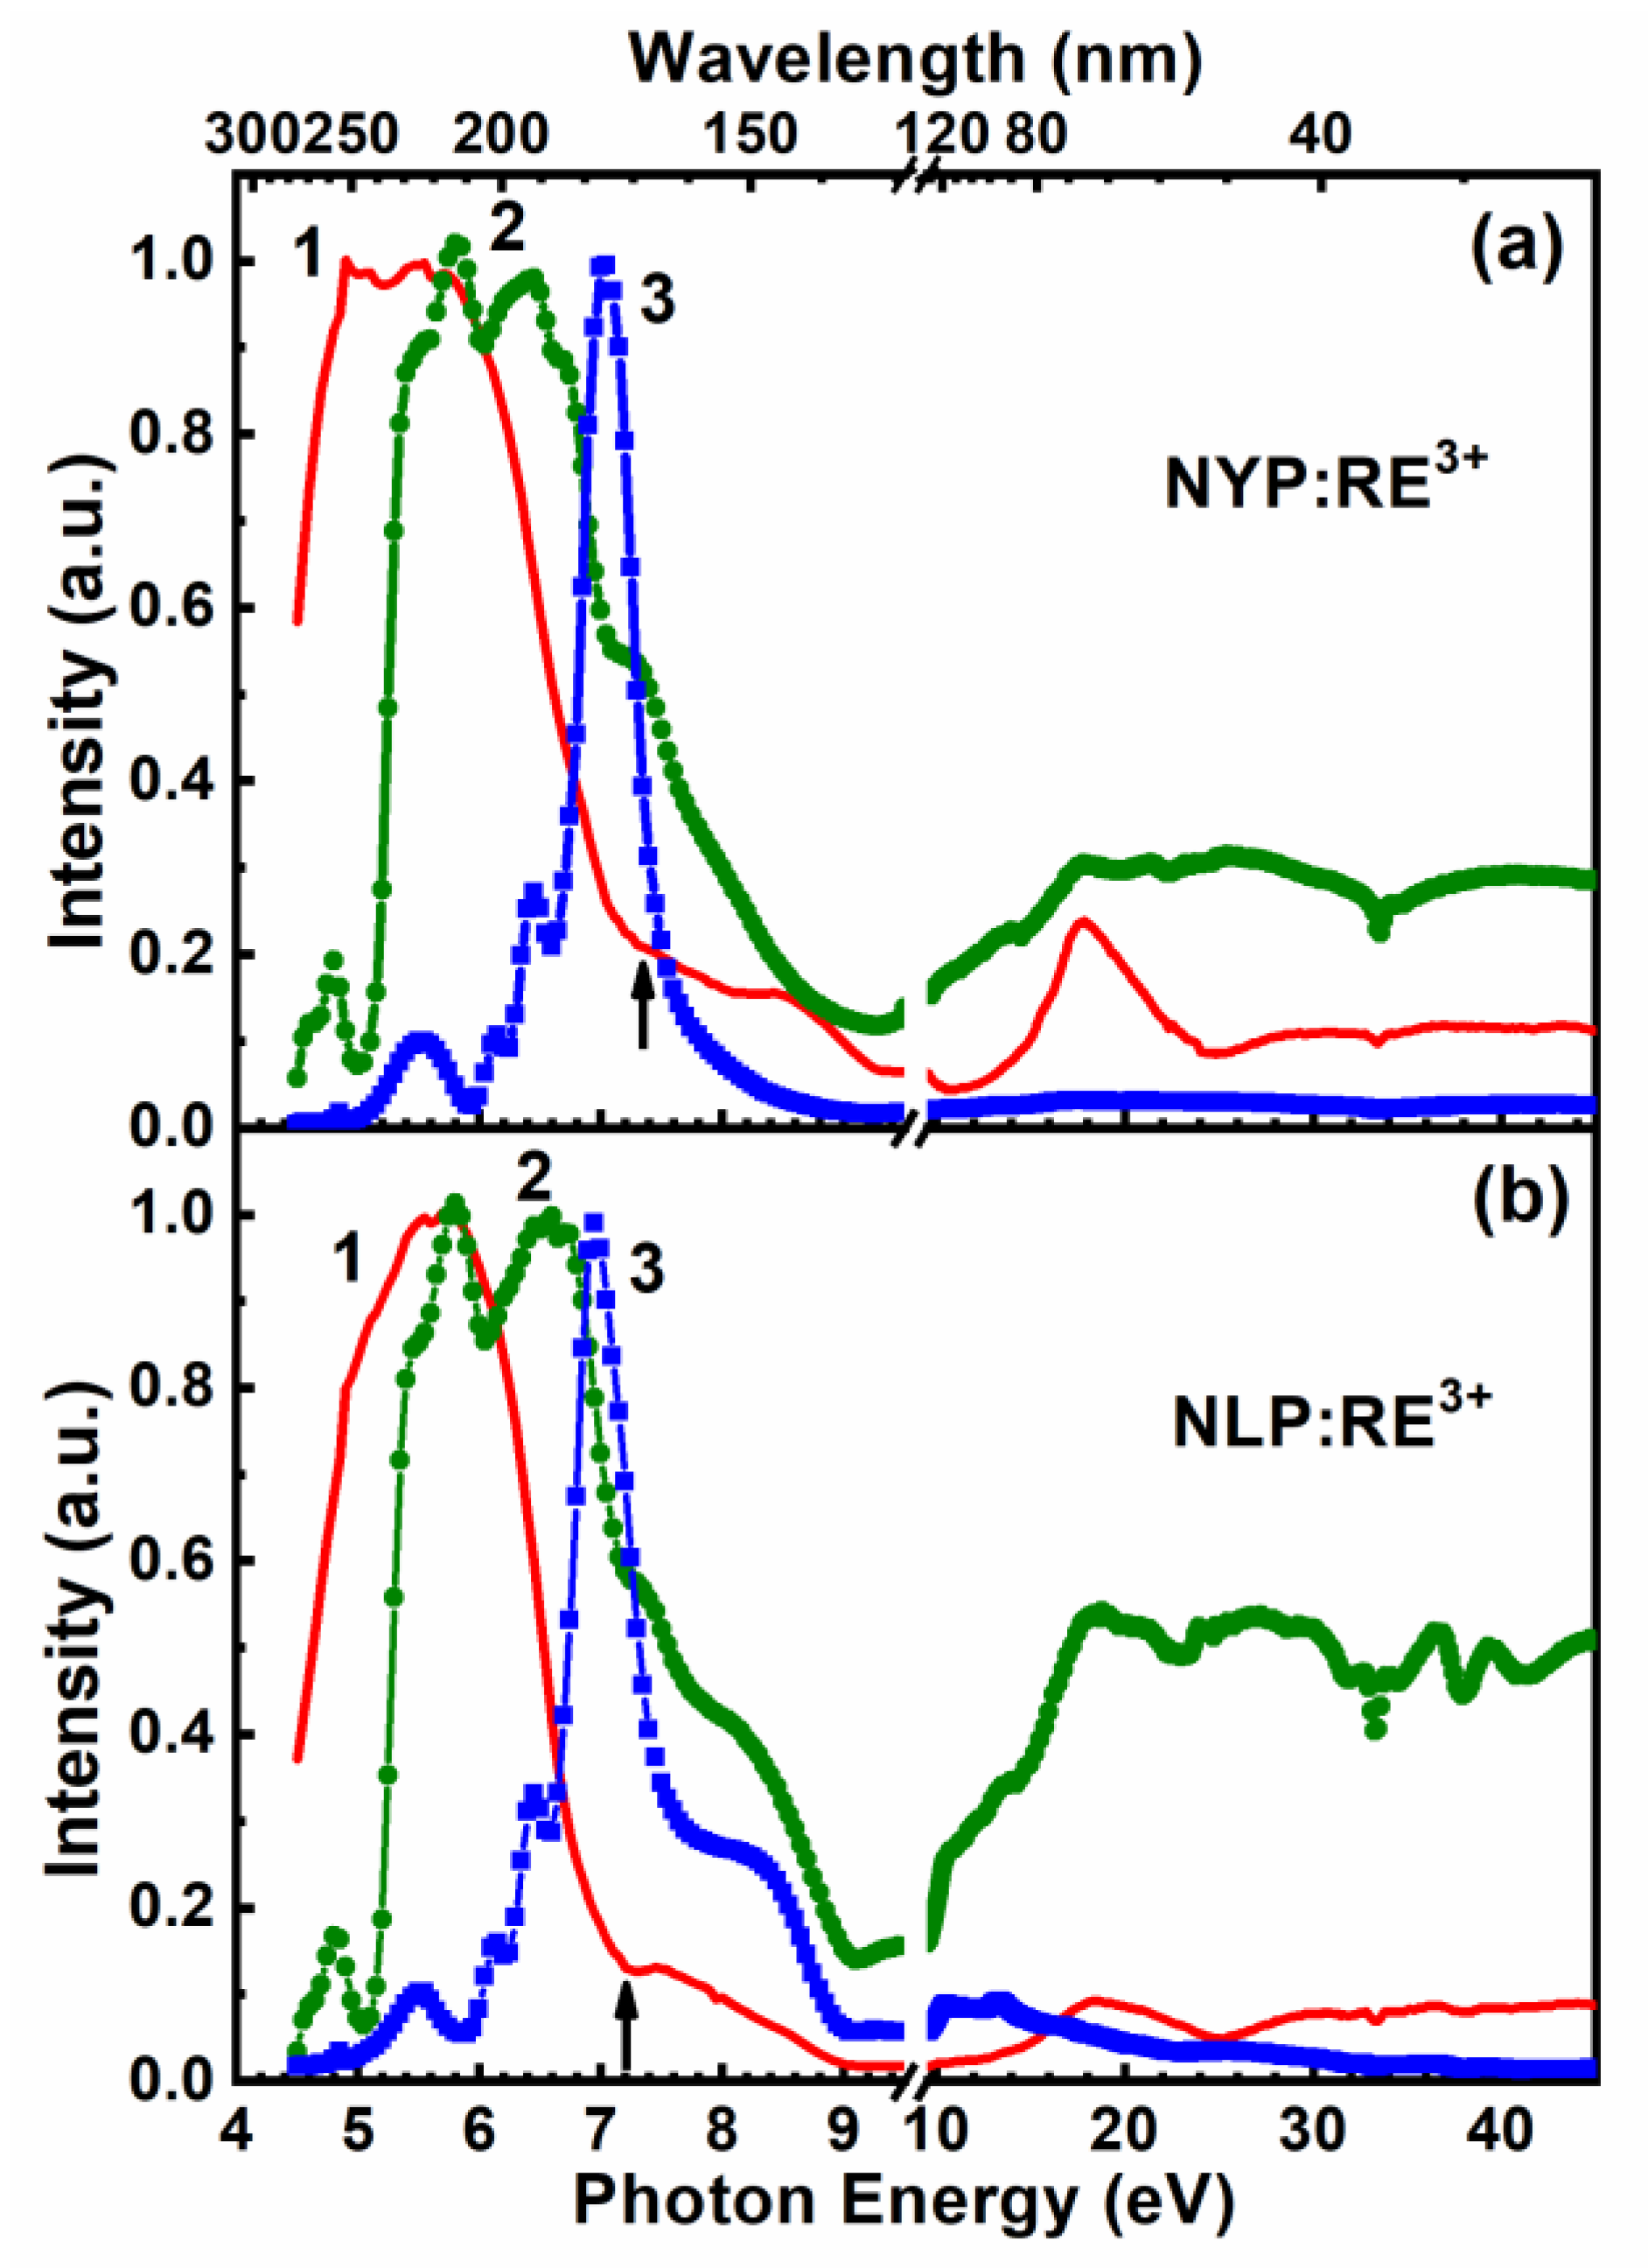
3.3. Na3.6Y1.8(PO4)3:RE3+ and Na3.6Lu1.8(PO4)3:RE3+ Phosphates

Luminescence spectra for NYP:RE and NLP:RE (RE = Eu, Tb, Dy) compounds under VUV excitation are presented in Figure 4a,b. Narrow emission bands characteristic of the given RE ions were observed. The luminescence spectra of Eu3+-doped samples demonstrate a set of emission bands with maxima at 595, 620, 655 and 705 nm, which correspond to the intraconfigurational 5D07FJ (j = 1,2,3,4) transitions in the Eu3+ ion (Figure 4a,b, curve 1) [12]. The most intense peak at 620 nm is attributed to the 5D07F2 electric dipole transition, indicating a low site symmetry for Eu3+ ions in the NASICON host. Luminescence spectrum of Tb3+-doped compounds consists of a typical set of bands at 490, 545, 585 and 625 nm corresponding to the 5D47Fj (j = 6,5,4,3) transitions in the Tb3+ ion. Weak bands in the region 360–460 nm are related to the 5D37F6,5,4,3 transitions in Tb3+ [28,29,30]. Luminescence spectrum of Dy3+-doped compounds consists of a set of lines peaking at 486, 578 and 670 nm, corresponding to the intraconfigurational 4f-4f transitions from the Dy3+ 4F9/2 excited state to the 6H15/2, 6H13/2, and 6H11/2 states, respectively (Figure 4a,b, curve 3). A defect-related broad UV emission band is observed only in Dy3+-doped samples.
The excitation spectra of RE3+ emission are shown in Figure 5a,b. At energies below the bandgap, the spectra demonstrate features related to direct transitions involving RE3+ electronic states. A broad band at ~5.6 eV spread over the region of 4.5–7 eV in the excitation spectrum of Eu-doped NYP and NLP is attributed to the 2p O–4f Eu charge transfer transitions. In luminescence excitation spectra of Tb-doped NYP and NLP, a broad non-elementary band in the region 5–7 eV corresponds to the 4f-5d transitions, while a weak band peaked at 4.8 eV is related to the 7F65K9 transitions within the 4f states of Tb3+ ions (Figure 5a,b, curve 2). The excitation spectra of the Dy3+ emission are represented by weak peaks below 5 eV connected with the intracentre 4f-4f transitions (namely 6H15/24P5/2) [31] and an intense peak at ~7 eV, which has previously been associated with a charge transfer transition from 2p O to 4f Dy states or with an exciton localized near the Dy impurity [7] (Figure 5a,b, curve 3). According to the model proposed in [32], it is possible to estimate the positions of charge transfer bands for various RE3+ ions, based on the position known for one RE ion. In particular, the model predicts that the position of charge transfer band for Dy3+ ion will be shifted by 2.27 eV to higher energies in comparison to that of Eu3+ ion. Therefore, we can estimate the charge transfer band position for Dy3+ ion using the abovementioned value for Eu3+: 5.6 eV + 2.27 eV = 7.87 eV. Thus, the peak at ~7 eV in the luminescence excitation spectrum of NYP:Dy3+ cannot be associated with charge transfer transition, but can be attributed to the excitons localized near Dy impurities.
The excitation spectra at energies Eex > Eg differ for different RE3+ ions, indicating different pass ways of energy transfer from the host to the particular RE3+ ions. In the undoped NLP, a gradual decrease in excitation efficiency is observed up to 45 eV after the pronounced exciton peak at 7.22 eV (Figure 5b, curve 4), indicating low efficiency of energy transfer of high energy excitation to emission centres. This is attributed to charge carrier trapping and subsequent energy losses on surface defects of the samples. The excitonic peak is represented as a low-intensity shoulder for RE3+-doped NYP and NLP samples, indicating a low efficiency of energy transfer from excitons to the dopants. Poor energy transfer from the host to Dy3+ ions is also manifested in a very low intensity of the excitation spectrum in the region of the fundamental absorption. Another indicator of poor energy transfer to Dy3+ ions is that only for Dy3+-doped phosphates the UV emission band (more pronounced for NYP) is observed under interband excitation, whereas doping with Eu3+ and Tb3+ ions results in complete quenching of this emission band. The mechanism of energy transfer from the host differs for Eu3+ and Tb3+ in NASICON phosphates. For the Eu3+ ions, the capture of an electron takes place first with Eu2+ formation and then a hole is trapped forming an excited Eu3+ ion. For Tb3+, on the contrary, a hole trapping occurs first with Tb4+ formation followed by a sequent electron capture. The difference in the sequence of charge carrier capture is due to the different energies of the ground 4f states, which are supposedly situated in the valence band for Eu3+ and in the bandgap for Tb3+ like in other phosphates with comparable bandgap values [11,27,33]. Moreover, the ground Tb2+ state is situated in the conduction band that prevents the capture of an electron by Tb3+. For Tb-doped samples, the consecutive capture of separated holes and electrons at Tb3+ ions is manifested in a gradual increase of intensity in the excitation spectrum in the region of interband transitions starting from 9 and up to 18 eV (Figure 5a,b, curve 2). The consecutive capture of an electron and a hole at Eu3+ is of low probability that results in low intensity of the excitation spectra in the region of interband transitions. However, a slight increase of intensity starts from 12.5 eV and results in a distinct peak at 18 eV (Figure 5a,b, curve 1). The peak can be attributed to the impact ionization of activator ions [34], when the relaxation of high-energy electrons (or holes) can occur through the Auger process with the creation of an excited Eu3+ centre e → e + Eu3+*. The minimum energy needed for impact ionization is the sum of the bandgap (~8 eV) and the onset of the charge transfer Eu3+ band (~4.5 eV), which is equal to about 12.5 eV and corresponds well to the onset of the intensity rise in the excitation spectra.
Poor energy transfer from the host to Dy3+ ions is also observed under excitation energies up to 45 eV. Considering the energy positions of the 4f Dy2+/3+ states in the phosphates with comparable bandgaps [8,11,35], we can speculate that the reason for poor energy transfer to the Dy3+ ion lays in the fact that its ground state is located at the top of the valence band, while the Dy2+ state is located in the region of the bottom of the conduction band. The transfer becomes inefficient if these states are overlapped with the valence and conduction bands, respectively, which is most likely realized in our case.
Therefore, efficient energy transfer from the host to activator ions was detected only for Tb3+-doped NASICON compounds. The efficiency is determined by the energy position of activator levels to energy bands of host material, which in its turn defines the order of charge carriers captures at the activator. Taking into account the obtained results, we suppose that Tb3+-doped Na3.6Y1.8(PO4)3 and Na3.6Lu1.8(PO4)3 phosphates have potential in application as X-ray phosphors.

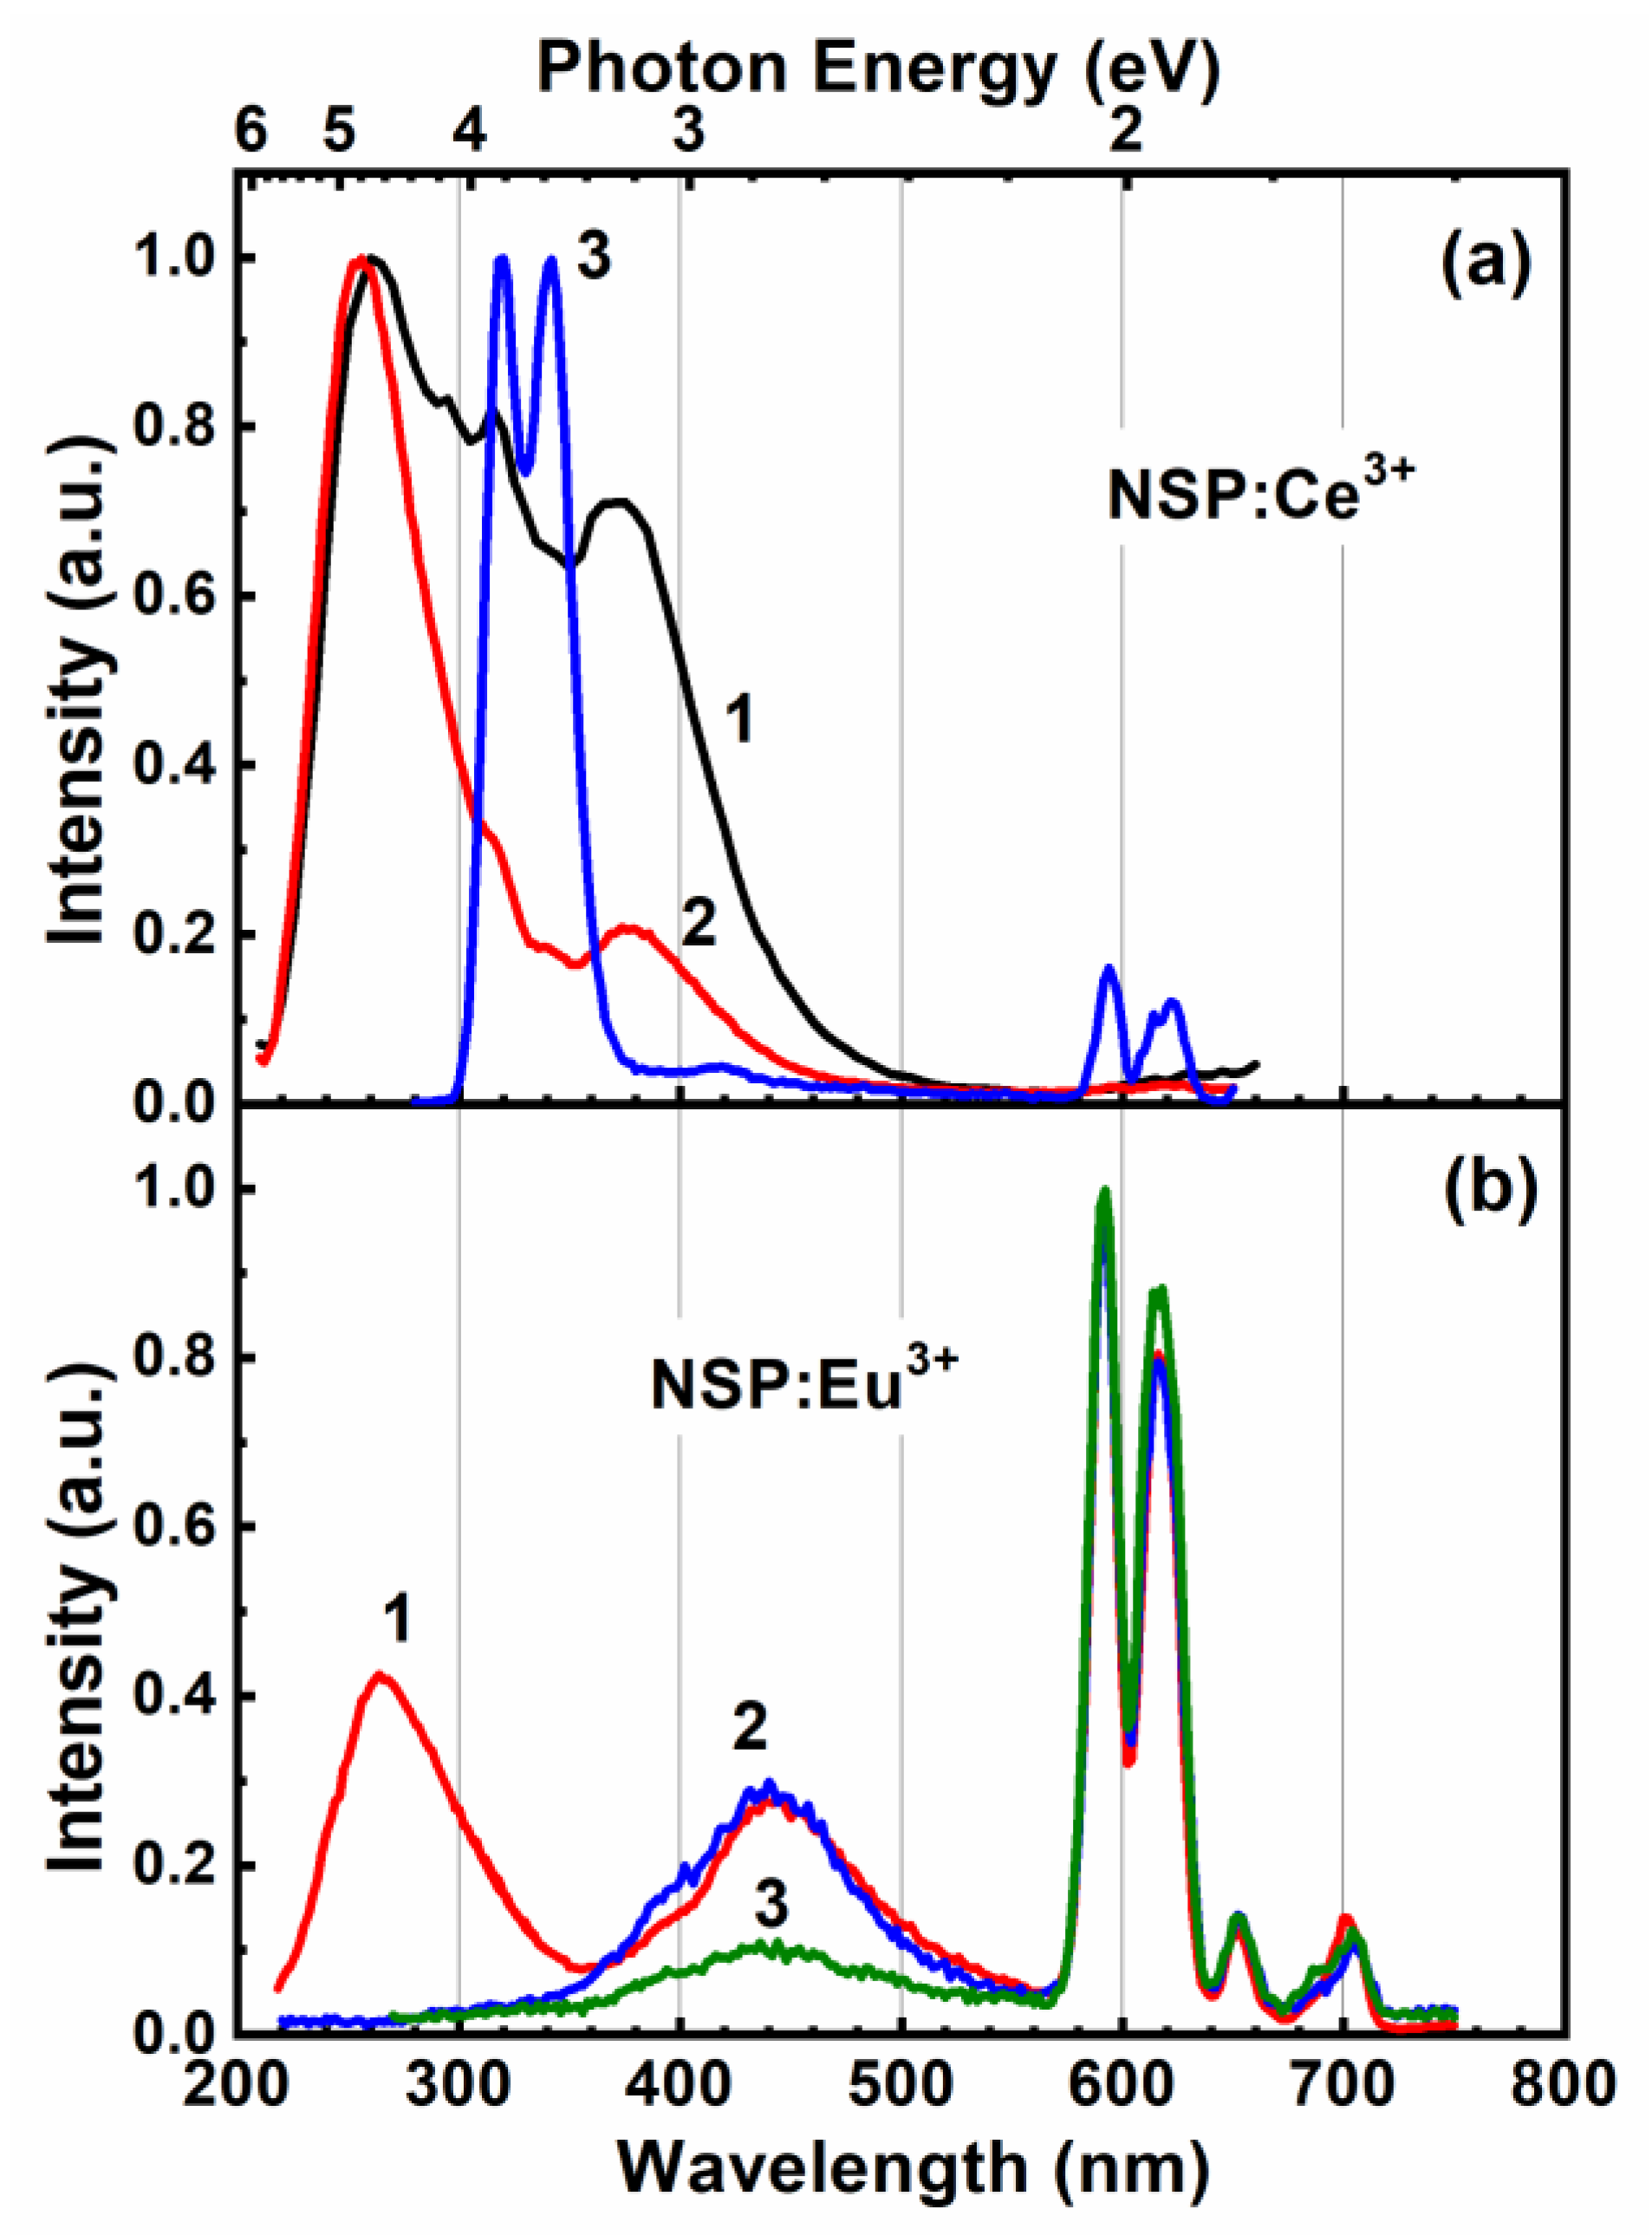
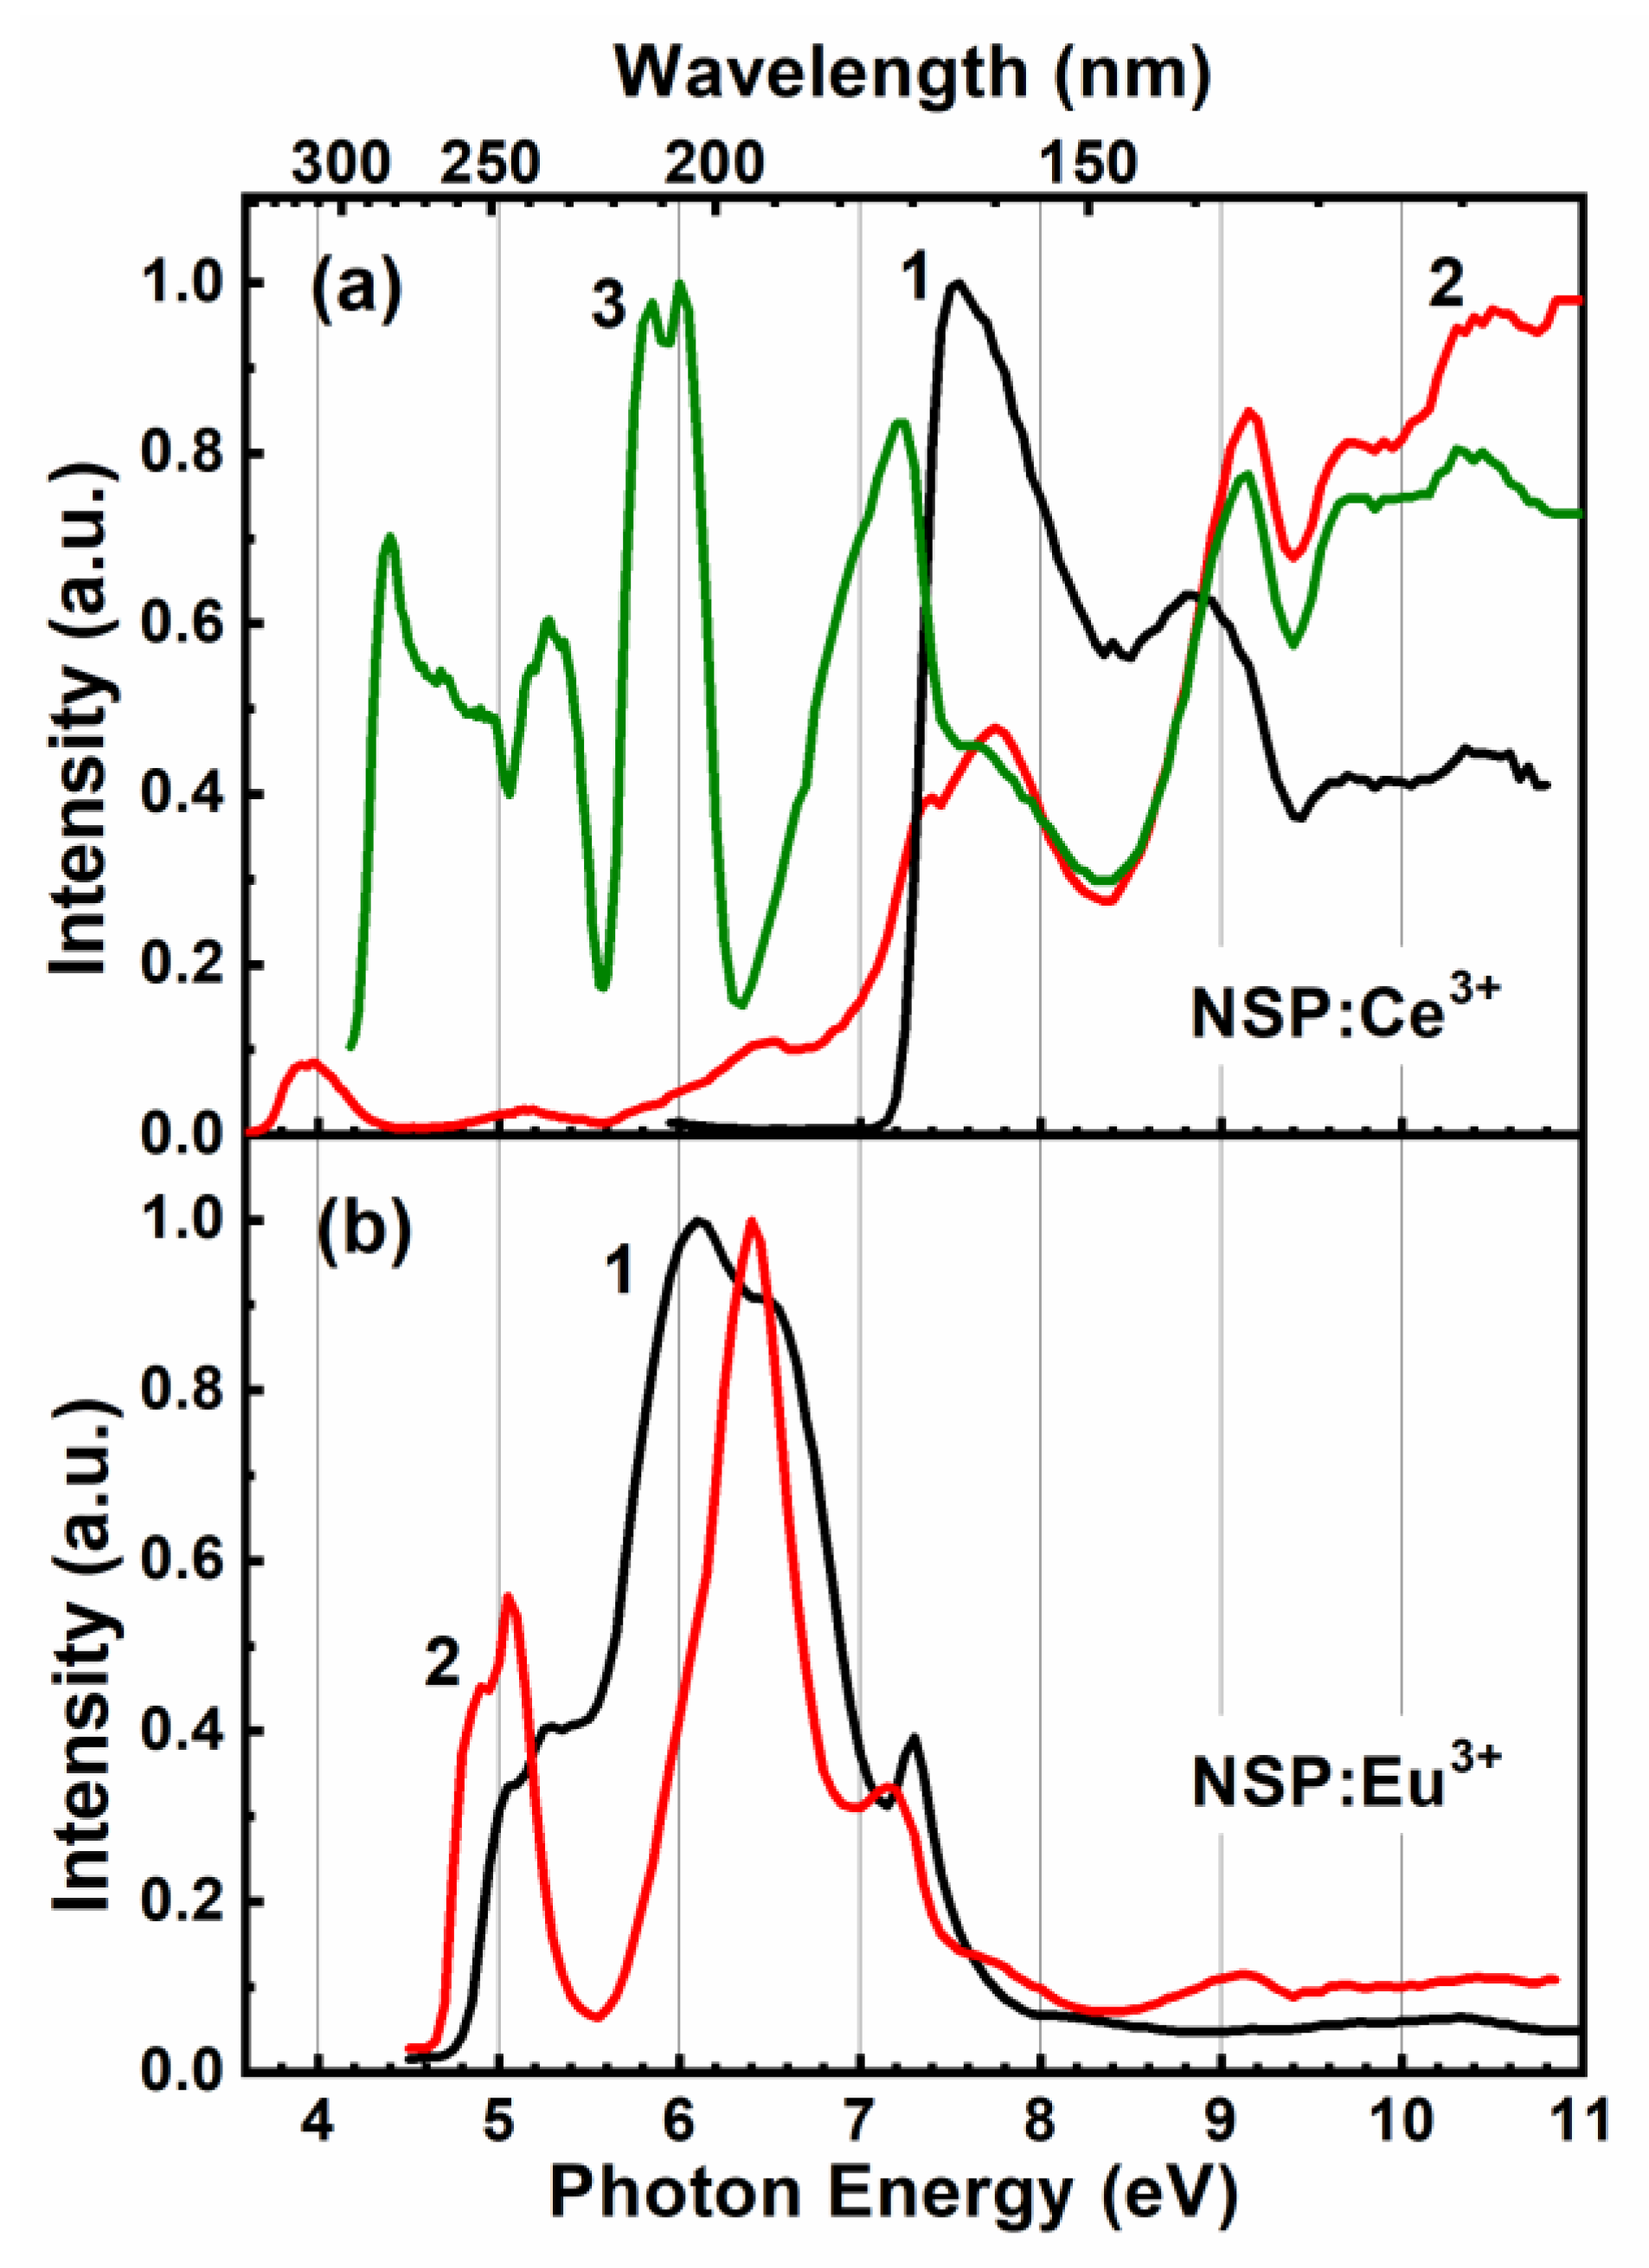
3.4. Na3Sc2(PO4)3:RE3+ Phosphates

Luminescence and excitation spectra of Ce3+- and Eu3+-doped NSP are presented in Figure 6 and Figure 7, respectively. The emission spectra of NSP:Ce3+ and NSP:Eu3+ demonstrate intense intrinsic emission of self-trapped excitons when excitation energy exceeds fundamental absorption edge (Figure 6a,b, curve 1). In the NSP:Ce3+ phosphor, the 5d(1) → 5F7/2, 5F5/2 emission of Ce3+ is represented by a doublet with the peaks at 320 and 340 nm (Figure 6a, curve 3). Narrow peaks at 590 and 620 nm arise due to the contamination of the samples with Eu3+ ions. The Ce3+ emission can be selectively excited in the transparency region in the peaks with maxima at 4.4, 4.92, 5.3, 5.85 and 6.0 eV, which can be related to the intracenter 4f-5d(1–5) transitions in Ce3+ ions (Figure 7a, curve 3). However, the efficiency of the energy transfer to Ce3+ is low in the energy regions of exciton creation and interband transitions. This region can be deduced from the excitation spectra of the intrinsic emission band where an onset observed at 7.2 eV corresponds to the fundamental absorption edge of NSP (Figure 7a, curve 1). As a result, the Ce3+ emission doublet is barely observable because of the overlap with the STE emission as well as with an additional broad emission band peaking at 380 nm (Figure 6a, curves 1,2). The latter band can be ascribed to structural defects considering its excitation spectrum comprising broad bands in the transparency region at 3.9, 5.15 and 6.5 eV (Figure 7a, curve 2). It is worth noting that a single broad band with a maximum at 380 nm (3.26 eV) in Ce3+-doped Na3Sc2(PO4)3 has earlier been ascribed to the Ce3+ emission [36]. In contrast to the doublet at 320 and 340 nm, the band at 380 nm is not split and its excitation spectrum is not typical of Ce3+ emission, which allows the conclusion that previous attribution was not correct.
A set of narrow emission peaks related to the 4f-4f transitions in Eu3+ ions are observed in the region 580–720 nm for NSP:Eu3+ (Figure 6b), similar to those reported in [37]. Alongside the Eu3+ emission and intrinsic emission band at 260 nm, an additional broad band is detected in the region 350–550 nm with maximum at 440 nm. The intensity of this band relative to Eu3+ emission peaks depends on excitation energy (Figure 6b, curves 2 and 3), demonstrating the competition between these emission centres. The broad band is tentatively ascribed to the 5d-4f transition in Eu2+ ions. The presence of both oxidation states of europium ions in the NSP:Eu3+ sample is attributed to an abnormal reduction. The phenomenon of an abnormal reduction of Eu3+ has been previously observed in a number of inorganic hosts, including also phosphates [38,39]. The possibility of such reduction is due to the rigidness of the phosphate structure and the absence of oxidizing ions in Na3Sc2(PO4)3.
The excitation spectrum of Eu3+ emission in the NSP:Eu3+ phosphor is characterized by a broad structured band in the region of 4.8–7.3 eV. It peaks at 6.1 eV and is most likely related to charge transfer from the 2p O to 4f Eu states (Figure 7b, curve 1). The dips at 5.1 and 6.4 eV arise due to the competition with the excitation of Eu2+ ions, whose excitation spectrum demonstrates peaks at exactly these energies (Figure 7b, curve 2). At the high-energy wing of the charge transfer band, a narrow peak is observed at energy 7.3 eV, which corresponds to the region of the fundamental absorption edge, while at higher energies the excitation intensity drops almost to zero indicating low efficiency of the energy transfer from the host to Eu3+. A similar behaviour is observed for the excitation spectrum of the Eu2+ emission. As a result, the most intensive emission band under interband excitation is the intrinsic band at 260 nm, which indicates that the formation of self-trapped excitons and their radiative annihilation is the most probable radiative process under high-energy excitation of NSP samples, both RE-doped and undoped.

4. Conclusions

The luminescence properties of undoped and RE-doped Na3.6M1.8(PO4)3:RE (M = Y, Lu, RE = Tb3+, Dy3+, Eu3+) and Na3Sc2(PO4)3:RE (RE = Ce3+ and Eu3+) phosphates were studied under synchrotron radiation for the first time. The samples were synthesized by the high-temperature solid-state method in air or in the reduction atmosphere. PXRD analysis revealed that single-phase compounds belonging to the NASICON-type structure were obtained. The luminescence properties were studied and the origin of the emission bands was discussed. The intrinsic emission band peaking at 260 nm is observed only for Na3Sc2(PO4)3 compound. The band is related to self-trapped excitons with electron components belonging to 3d Sc that explains its absence in Na3.6Y1.8(PO4)3 and Na3.6Lu1.8(PO4)3. All three crystals demonstrate emission bands peaking in the 325–340 nm region, which are ascribed to defects of crystal structure, presumably to the complexes with oxygen vacancies. The specific feature of this band is that it is efficiently excited via energy transfer from an exciton localized near a defect. Other defect-related bands observed at ~530 nm for Na3Sc2(PO4)3 and at ~480 nm for Na3.6Y1.8(PO4)3 can be excited only below the fundamental absorption edge. The bandgap values were estimated on the basis of excitation spectra analysis to ~8 eV for all investigated phosphates.
Energy transfer processes from the host to activators were studied in the range 2.5–45 eV using the luminescence endstation of FinEstBeAMS synchrotron radiation channel at MAX IV Laboratory. This setup is optimal for such research because of a wide energy region and high intensity of incident light available for the excitation of studied materials. A set of emission bands characteristic of the Eu3+, Tb3+ and Dy3+ ions and connected with their intraconfigurational transitions was detected for Na3.6M1.8(PO4)3 compounds. The efficiency of energy transfer from the host to RE emission centres depends significantly on RE ion, as conditioned by different pass ways of energy transfer from the host to a certain RE, which was revealed by the analysis of excitation spectra at energies Eex > Eg. A low efficiency of energy transfer from excitons to dopants is observed for all studied RE3+-doped Na3.6M1.8(PO4)3. Consecutive capture of separated hole and electron by Tb3+ ions provides the most efficient excitation energy conversion into luminescence. This allows us to consider the Tb3+-doped Na3.6Y1.8(PO4)3 and Na3.6Lu1.8(PO4)3 phosphates as potential X-ray phosphors. A reverse sequence of charge carrier capture is less efficient in the case of Eu3+-doped NASICON phosphates and the excitation energy is efficiently transferred only via impact ionization of the activator. For the Dy3+-doped sample, energy transfer from the host is inefficient, probably due to the fact that its ground state is located at the top of the valence band, while the excited state is located in the region of the bottom of the conduction band that makes localization of charge carriers at Dy3+ less probable.
The emission spectra of Na3Sc2(PO4)3, doped by Ce3+ or Eu3+ ions, demonstrate intense dopant emission only under intraband excitation while at the excitation energies Eex > 7.1 eV (above the onset of the fundamental absorption), it is weak because intrinsic excitonic emission forms a competitive to RE3+ ions channel of energy relaxation.

Author Contributions

Conceptualization—N.K., D.S. and D.D.; investigation—N.K., D.S., I.R. and D.D.; validation—D.S. and V.N.; writing—original draft preparation—N.K. and D.S.; writing—review and editing—V.N. All authors have read and agreed to the published version of the manuscript.

Funding

The research was performed within the projects of Estonian Research Council (projects MOBJD613 and PUT PRG629). We acknowledge MAX IV Laboratory for time on Beamline FinEstBeAMS under Proposal 20200327. Research conducted at MAX IV, a Swedish national user facility, is supported by the Swedish Research council under contract 2018-07152, the Swedish Governmental Agency for Innovation Systems under contract 2018-04969, and Formas under contract 2019-02496. The X-ray study was carried out in accordance with the state of the Russian Federation, state registration number 122011300125-2.

Institutional Review Board Statement

Not applicable.

Informed Consent Statement

Not applicable.

Data Availability Statement

Data will be available from the corresponding author on reasonable request.

Conflicts of Interest

The authors declare no conflict of interest.

References

  1. Wu, F.; Liu, L.; Wang, S.; Xu, J.; Lu, P.; Yan, W.; Peng, J.; Wu, D.; Li, H. Solid state ionics—Selected topics and new directions. Prog. Mater. Sci. 2022, 126, 100921. [Google Scholar] [CrossRef]
  2. Liu, F.; Deng, D.; Wu, M.; Chen, B.; Zhou, L.; Xu, S. Alkali ions substitution induced tuning of sensitivity in mixed-valence europium ion co-doped NaZr2(PO4)3 thermochromic phosphor for optical thermometry. J. Alloys Compd. 2021, 865, 158820. [Google Scholar] [CrossRef]
  3. Kim, Y.H.; Arunkumar, P.; Kim, B.Y.; Unithrattil, S.; Kim, E.; Moon, S.-H.; Hyun, J.Y.; Kim, K.H.; Lee, D.; Lee, J.-S.; et al. A zero-thermal-quenching phosphor. Nat. Mater. 2017, 16, 543–550. [Google Scholar] [CrossRef] [PubMed]
  4. Farooq, U.; Sun, X.; Zhao, Z.; Janjua, R.A.; Gao, C.; Dai, R.; Wang, Z.; Zhang, Z. Thermally stable Na3.6Y1.8(PO4)3:Eu3+ phosphor, luminescent properties and application in WLEDs. J. Alloys Compd. 2020, 821, 153513. [Google Scholar] [CrossRef]
  5. Miao, S.; Liang, Y.; Zhang, Y.; Chen, D.; Yan, S.; Liu, J.; Wang, X.-J. Spectrally tunable and thermally stable near-infrared luminescence in Na3Sc2(PO4)3:Cr3+ phosphors by Ga3+ co-doping for light-emitting diodes. J. Mater. Chem. C 2022, 10, 994–1002. [Google Scholar] [CrossRef]
  6. Zhao, M.; Zhang, H.; Zou, X.; Wei, Q.; Meng, S.; Su, C. Up-conversion luminescent properties of Er3+/Yb3+ co-doped transparent glass ceramics containing Na3.6Y1.8(PO4)3 crystals. J. Alloys Compd. 2017, 728, 357–362. [Google Scholar] [CrossRef]
  7. Krutyak, N.; Spassky, D.; Nagirnyi, V.; Antropov, A.V.; Deyneko, D.V. Novel NASICON-type Na3.6Y1.8-x(PO4)3:xDy3+ phosphor: Structure and luminescence. Opt. Mater. 2021, 122, 111738. [Google Scholar] [CrossRef]
  8. Lin, X.; Feng, A.; Zhang, Z.; Zhao, J. VUV spectroscopic properties of rare-earth (RE=Eu, Tb and Dy)-doped A2Zr(PO4)2 (A = Li, Na and K) phosphates. J. Rare Earths. 2014, 32, 946–951. [Google Scholar] [CrossRef]
  9. Zhang, Z.-J.; Chen, H.-H.; Yang, X.-X.; Zhao, J.-T.; Zhang, G.-B.; Shi, C.-S. VUV spectroscopic properties of rare-earth (RE3+ = Eu, Tb, Tm)-doped AZr2(PO4)3 (A+ = Li, Na, K) type phosphate. J. Phys. D Appl. Phys. 2008, 41, 105503. [Google Scholar] [CrossRef]
  10. Pustovarov, V.A.; Zatsepin, A.F.; Cheremnykh, V.S.; Syrtsov, A.A.; Cholakh, S.O. Spectroscopy of defects in irradiated AlPO4 and GaPO4 crystals. Radiat. Eff. Defects Solids 2002, 157, 751–754. [Google Scholar] [CrossRef]
  11. Dikhtyar, Y.Y.; Spassky, D.A.; Morozov, V.A.; Deyneko, D.V.; Belik, A.A.; Baryshnikova, O.V.; Nikiforov, I.V.; Lazoryak, B.I. Site occupancy, luminescence and dielectric properties of β-Ca3(PO4)2- type Ca8ZnLn(PO4)7 host materials. J. Alloys Compd. 2022, 908, 164521. [Google Scholar] [CrossRef]
  12. Levushkina, V.S.; Spassky, D.A.; Tretyakova, M.S.; Zadneprovski, B.I.; Kamenskikh, I.A.; Vasil’ev, A.N.; Belsky, A. Luminescence properties of solid solutions LuxY1-xPO4:Eu3+. Opt. Mater. 2018, 75, 607–611. [Google Scholar] [CrossRef]
  13. Kappelhoff, J.; Keil, J.-N.; Kirm, M.; Makhov, V.N.; Chernenko, K.; Moller, S.; Jüstel, T. Spectroscopic studies on Pr3+ doped YPO4 and LuPO4 upon vacuum ultraviolet (VUV) and synchrotron radiation excitation. Chem. Phys. 2022, 562, 111646. [Google Scholar] [CrossRef]
  14. Wang, J.; Zhang, Z.-J. Luminescence properties and energy transfer studies of color tunable Tb3+-doped RE1/3Zr2(PO4)3 (RE = Y, La, Gd and Lu). J. Alloys Compd. 2016, 685, 841–847. [Google Scholar] [CrossRef]
  15. Mikhailin, V.V. Luminescence of solids excited by synchrotron radiation. Nucl. Instrum. Methods Phys. Res. B 1995, 97, 530–535. [Google Scholar] [CrossRef]
  16. Zhukovsky, K. Theoretical Analysis of the Radiation Properties of Some Major X-ray Free Electron Lasers. Ann. Phys. 2021, 533, 2100091. [Google Scholar] [CrossRef]
  17. Bel’skii, A.N.; Vasil’ev, A.N.; Ivanov, S.N.; Kamenskikh, I.A.; Kolobanov, V.N.; Makhov, V.N.; Spasskii, D.A. Optical and luminescent VUV spectroscopy using synchrotron radiation. Crystallogr. Rep. 2016, 61, 886–896. [Google Scholar] [CrossRef]
  18. Pärna, R.; Sankari, R.; Kukk, E.; Nõmmiste, E.; Valden, M.; Lastusaari, M.; Kooser, K.; Kokko, K.; Hirsimäki, M.; Urpelainen, S.; et al. FinEstBeaMS—A wide-range Finnish-Estonian Beamline for Materials Science at the 1.5 GeV storage ring at the MAX IV Laboratory. Nucl. Instrum. Meth. A. 2017, 859, 83–89. [Google Scholar] [CrossRef] [Green Version]
  19. Omelkov, S.I.; Chernenko, K.; Ekström, J.C.; Jurgilaitis, A.; Khadiev, A.; Kivimäki, A.; Kotlov, A.; Kroon, D.; Larsson, J.; Nagirnyi, V.; et al. Recent advances in time-resolved luminescence spectroscopy at MAX IV and PETRA III storage rings. J. Phys. Conf. Ser. 2022, 2380, 012135. [Google Scholar] [CrossRef]
  20. Wang, J.; Zhang, Z.-J.; Zhao, J.-T. A Novel Facile Room Temperature Chemical Lithiation for Reduction of Eu3+ in NASICON Crystal Structure. Z. Anorg. Allg. Chem. 2015, 641, 1527–1532. [Google Scholar] [CrossRef]
  21. Wankhade, R.N.; Bajaj, N.S.; Bhatkar, V.B.; Omanwar, S.K. Combustion Synthesis and Optimization of Tb3+ Doped AZr2(PO4)3 (A+ = Li, Na, K) Phosphors for Mercury Free Lamp and Plasma Display Panels Application. J. Chin. Adv. Mater. Soc. 2015, 3, 1–11. [Google Scholar] [CrossRef]
  22. Zhang, Z.-J.; Zhang, S.-L.; Zhang, W.-B.; Guo, Y.-Y.; Yang, W.; Zhao, J.-T. Vacuum ultraviolet spectroscopic properties of rare-earth (RE3+ = Sm3+, Tb3+, Dy3+)-activated zirconium-based phosphates MZr4(PO4)6 (M2+ = Ca2+, Sr2+). Opt. Mater. 2015, 39, 251–257. [Google Scholar] [CrossRef]
  23. Krutyak, N.; Spassky, D.; Deyneko, D.V.; Antropov, A.; Morozov, V.A.; Lazoryak, B.I.; Nagirnyi, V. NASICON-type Na3.6Lu1.8−x(PO4)3:xEu3+ phosphors: Structure and luminescence. Dalton Trans. 2022, 51, 11840. [Google Scholar] [CrossRef] [PubMed]
  24. Chernenko, K.; Kivimaki, A.; Parna, R.; Wang, W.; Sankari, R.; Leandersson, M.; Tarawneh, H.; Pankratov, V.; Kook, M.; Kukk, E.; et al. Performance and characterization of the FinEstBeAMS beamline at the MAX IV laboratory. J. Synchrotron Radiat. 2021, 28, 1620–1630. [Google Scholar] [CrossRef] [PubMed]
  25. Spassky, D.; Vasil’ev, A.N.; Nagirnyi, V.; Kudryavtseva, I.; Deyneko, D.; Nikiforov, I.; Kondratyev, I.; Zadneprovski, B. Bright UV-C phosphors with excellent thermal stability—Y1-xScxPO4 solid solutions. Materials 2022, 15, 6844. [Google Scholar] [CrossRef]
  26. Spassky, D.; Voznyak-Levushkina, V.; Arapova, A.; Zadneprovski, B.; Chernenko, K.; Nagirnyi, V. Enhancement of Light Output in ScxY1-xPO4:Eu3+ Solid Solutions. Symmetry 2020, 12, 946. [Google Scholar] [CrossRef]
  27. Dorenbos, P. The Eu3+ charge transfer energy andthe relation with the band gap of compounds. J. Lumin. 2005, 111, 89–104. [Google Scholar] [CrossRef]
  28. Cavalli, E.; Boutinaud, P.; Mahiou, R.; Bettinelli, M.; Dorenbos, P. Luminescence Dynamics in Tb3+-Doped CaWO4 and CaMoO4 Crystals. Inorg. Chem. 2010, 49, 4916–4921. [Google Scholar] [CrossRef]
  29. Dobrowolska, A.; Karsu, E.C.; Bos, A.J.J.; Dorenbos, P. Spectroscopy, thermoluminescence and afterglow studies of CaLa4(SiO4)3O:Ln (Ln = Ce, Nd, Eu, Tb, Dy). J. Lumin. 2015, 160, 321–327. [Google Scholar] [CrossRef]
  30. Qin, D.; Tang, W. Crystal structure, tunable luminescence and energy transfer properties of Na3La(PO4)2:Tb3+,Eu3+ phosphors. RSC Adv. 2017, 7, 2494–2502. [Google Scholar] [CrossRef] [Green Version]
  31. Carnall, W.T.; Goodman, G.L.; Rajnak, K.; Rana, R.S. A systematic analysis of the spectra of the lanthanides doped into single crystal LaF3. Supplementary Tables. J. Chem. Phys. 1989, 90, 3443. [Google Scholar] [CrossRef]
  32. Dorenbos, P. Charge transfer bands in optical materials and related defect level location. Opt. Mater. 2017, 69, 8–22. [Google Scholar] [CrossRef]
  33. Dorenbos, P. Systematic behaviour in trivalent lanthanide charge transfer energies. J. Phys. Condens. Matter. 2003, 15, 8417–8434. [Google Scholar] [CrossRef]
  34. Belsky, A.N.; Krupa, J.C. Luminescence excitation mechanisms of rare earth doped phosphors in the VUV range. Displays 1999, 19, 185–196. [Google Scholar] [CrossRef]
  35. Bos, A.J.J.; Dorenbos, P.; Bessier, A.; Viana, B. Lanthanide energy levels in YPO4. Radiat. Meas. 2008, 43, 222–226. [Google Scholar] [CrossRef]
  36. Guo, H.; Devakumar, B.; Li, B.; Huang, X. Novel Na3Sc2(PO4)3:Ce3+,Tb3+ phosphors for white LEDs: Tunable blue-green color emission, high quantum efficiency and excellent thermal stability. Dyes Pigm. 2018, 151, 81–88. [Google Scholar] [CrossRef]
  37. Guo, H.; Huang, X.; Zeng, Y. Synthesis and photoluminescence properties of novel highly thermalstable red-emitting Na3Sc2(PO4)3:Eu3+ phosphors for UV-excited white-light-emitting diodes. J. Alloys Compd. 2018, 741, 300–306. [Google Scholar] [CrossRef]
  38. Li, H.; Wang, Y. Effect of Oxygen Vacancies on the Reduction of Eu3+ in Mg3Ca3(PO4)4 in Air Atmosphere. Inorg. Chem. 2017, 56, 10396–10403. [Google Scholar] [CrossRef]
  39. Dang, P.; Liu, D.; Li, G.; Liang, S.; Lian, H.; Shang, M.; Lin, J. Mixing the valence control of Eu2+/Eu3+ and energy transfer construction of Eu2+/Mn2+ in the solid solution (1−x)Ca3(PO4)2–xCa9Y(PO4)7 for multichannel photoluminescence tuning. Inorg. Chem. Front. 2019, 6, 2837–2849. [Google Scholar] [CrossRef]
Figure 1. XRD patterns for undoped and RE-doped Na3Sc2(PO4)3, as well as for undoped Na3.6Lu1.8(PO4)3 and Na3.6Y1.8(PO4)3.
Symmetry 15 00749 g001
Figure 2. Normalized luminescence spectra of undoped NASICON phosphates ((a)—Na3Sc2(PO4)3, (b)—Na3.6Lu1.8(PO4)3, (c)—Na3.6Y1.8(PO4)3) at different excitation energies, T = 7 K.
Symmetry 15 00749 g002
Figure 3. Luminescence excitation spectra of undoped NASICON phosphates ((a)—Na3Sc2(PO4)3, (b)—Na3.6Lu1.8(PO4)3, (c)—Na3.6Y1.8(PO4)3) at T = 7 K.
Symmetry 15 00749 g003
Figure 4. Luminescence spectra of Na3.6Y1.8(PO4)3 (a) and Na3.6Lu1.8(PO4)3 (b), doped with Eu3+ (1), Tb3+ (2) and Dy3+ (3) at Eex = 45 eV, T = 7 K.
Symmetry 15 00749 g004
Figure 5. Luminescence excitation spectra of Na3.6Y1.8(PO4)3 (a) and Na3.6Lu1.8(PO4)3 (b), doped with Eu3+ (1), Tb3+ (2) and Dy3+ (3) at T = 7 K; λem = 620 nm (1), 545 nm (2) and 580 nm (3). Arrows indicate exciton peak position in undoped samples.
Symmetry 15 00749 g005
Figure 6. Luminescence spectra of Na3Sc2(PO4)3, doped with 0.02 Ce3+ (a) at Eex = 45 eV (1), 7.8 eV (2) and 6.0 eV (3) and 0.01 Eu3+ (b) at Eex = 7.7 eV (1), 6.4 eV (2) and 5.3 eV (3), T = 7 K.
Symmetry 15 00749 g006
Figure 7. Luminescence excitation spectra of Na3Sc2(PO4)3, doped with 0.02 Ce3+ (a) at λem = 240 (1), 340 (2) and 400 (3) nm and 0.01 Eu3+ (b) at λem = 600 (1) and 450 (2) nm, T = 7 K.
Symmetry 15 00749 g007
Disclaimer/Publisher’s Note: The statements, opinions and data contained in all publications are solely those of the individual author(s) and contributor(s) and not of MDPI and/or the editor(s). MDPI and/or the editor(s) disclaim responsibility for any injury to people or property resulting from any ideas, methods, instructions or products referred to in the content.

