Article

A Robust-Reliable Decision-Making Methodology Based on a Combination of Stakeholders’ Preferences Simulation and KDD Techniques for Selecting Automotive Platform Benchmark †

1
Institute of Informatics, Slovak Academy of Sciences, 845 07 Bratislava, Slovakia
2
Department of Mechanical Engineering, Sharif University of Technology, Tehran 11155-8639, Iran
3
School of Computer Science and Statistics, Trinity College Dublin, D02 YY50 Dublin, Ireland
*
Author to whom correspondence should be addressed.
This article is an extended version of the conference paper “Human Judgment Simulation and KDD Techniques in Automotive Platform Benchmark Selection” that was previously presented at 2022 IEEE 20th Jubilee International Symposium on Intelligent Systems and Informatics (SISY).
Symmetry 2023, 15(3), 750; https://doi.org/10.3390/sym15030750
Submission received: 23 January 2023 / Revised: 17 February 2023 / Accepted: 15 March 2023 / Published: 18 March 2023
(This article belongs to the Special Issue Algorithms for Multi-Criteria Decision-Making under Uncertainty)

Abstract

:
The automotive family design is known as one of the most complex engineering design problems with multiple groups of stakeholders involved from different domains of interest and contradictory attributes. Taking into account all stakeholders’ preferences, which are generally symmetrical, non-deterministic distributions around a mean value, and determining the right value of attributes for each alternative are two basic challenges for these types of decision-making problems. In this research, the possibility to achieve a robust-reliable decision by focusing on the two aforementioned challenges is explored. In the proposed methodology, a random simulation technique is used to elicit stakeholders’ preferences and determine the relative importance of attributes. The decision space and values of attributes are determined using the Knowledge Discovery in Databases (KDD) technique, and to achieve a robust-reliable decision, statistical and sensitivity analyses are performed. By implementing this methodology, the decision-maker is assured that the preferences of all stakeholders are taken into account and the determined values for attributes are reliable with the least degree of uncertainty. The proposed methodology aims to select benchmark platforms for the development of an automotive family. The decision space includes 546 automobiles in 11 different segments based on 34 platforms. There are 6223 unique possible states of stakeholders’ preferences. As a result, five platforms with the highest degree of desirability and robustness to diversity and uncertainty in the stakeholders’ preferences are selected. The presented methodology can be implemented in complex decision-making problems, including a large and diverse number of stakeholders and multiple attributes. In addition, this methodology is compatible with many Multi-Attribute Decision-Making (MADM) techniques, including SAW, AHP, SWARA, and TOPSIS.

1. Introduction

MADM is an important component of modern decision science [1]. There are plenty of applications of MADM methods, such as finding an optimal solution, selecting the best alternative, or ranking alternatives [2]. MADM is used to solve discrete decision problems with several attributes and a limited number of predetermined alternatives that are usually conflicting [3].
The MADM methods have been widely used in various fields of management, engineering, economics, medicine, military, etc. Akbas et al. [4] proposed a hybrid algorithm for stock portfolio selection. Hadikurniawati et al. [5] proposed a hybrid decision making based on the technique for order preference by similarity to ideal solution (TOPSIS), simple additive weighting (SAW), and analytic hierarch process (AHP) in order to make the selection of the experts’ decision on an electrician through a competency test. Jiang et al. [6] analyzed critical factors affecting emergency logistics system reliability using MADM. Using the AHP technique, a decision model was developed for logistic facilities and transport siting in urban environments by Fraile et al. [7]. Ziemba et al. [8] used a PROMETHEE-based approach to evaluate enterprise resource planning (ERP) systems supporting supply chain management. To select the best hospital supplier, Akcan et al. [9] presented four integrated MADM methods. Naeem et al. [10] used the MADM under an m-polar neutrosophic environment to classify blood disorder types. In a work by Adriyendi et al. [11], a hybrid MADM approach based on a benefit–cost model was adopted for sustainable fashion materials. Three MADM techniques: SAW, TOPSIS, and complex proportional assessment (COPRAS), were applied by Dhiman et al. [12] in the process of the hybrid operation selection of wind farms. Zavadskas et al. [13] performed an extensive literature review on multi-criteria decision-making techniques suitable for the improvement of sustainability engineering processes. Saghari et al. [14] employed the AHP method to make optimal decisions in the selection of orbit transfer systems of a student micro-satellite. Lafleur [15] used a combination of AHP and TOPSIS techniques for the selection of a satellite orbit and launch vehicle. Saghari et al. [16] proposed a hybrid method based on MADM and optimization techniques to find an optimal robust-reliable parameter of an earth observation mission. Potential sites for the construction of a river bridge aimed at suitability were ranked through the use of the fuzzy analytical hierarchy process (FAHP) by Ardeshir et al. [17].
Particularly in the automotive industry, Ulkhaq et al. [18] used a combination of AHP and TOPSIS for car selection problems. Sakthivel et al. [19] proposed two decision models based on FAHP and PROMETHEE for evaluating an automobile purchase problem. A review was conducted by Renzi et al. [20] on decision-making methods in the area of automotive engineering design. Jamil et al. [21] studied MADM methods for supplier selection in Malaysia’s automotive industry. Five decision-making tools were analyzed in this study, namely, AHP, FAHP, TOPSIS, fuzzy TOPSIS, and FAHP integrated with FTOPSIS. The research of Castro et al. [22] focused on energy efficiency using multi-criteria decision-making in the automotive engineering field. Yousefi et al. [23] proposed an integrated model based on AHP and TOPSIS to examine the performance of the Iran automobile industry. Pu et al. [24] used the method of grey relational analysis (GRA) integrated with AHP to solve the car body lightweight material selection problem. Shahanaghi et al. [25] proposed an MODM-MCDM approach for partner selection in the automotive industry (Mazda of Iran). The application of the AHP method to develop guidelines for preparing vendor selection models (VSMs) was the work of Mohan et al. [26]. The FTOPSIS method was used to solve the best automobile selection problem by Yildiz et al. [27]. Nguyen [28] utilized multi-objective optimization ratio analysis (MOORA) and AHP to rank the car models in the Vietnam market. To examine the improvement fields of the Indian automobile industry, Raut et al. [29] proposed a combined model from the AHP and the quality function deployment (QFD)-fuzzy technique. To solve the MADM problems, a wide range of techniques have been extensively discussed in the literature [2,30,31,32,33,34]. The five most frequently used methods are: SAW, weighted product model (WPM), AHP, TOPSIS, and PROMETHEE, and a combination of these methods with fuzzy concepts [30,31,32,33,35].
Each of the MADM techniques has its strengths and weaknesses, discussed in [30,34,36,37,38]. One way to improve the performance of MADM techniques is to combine them with other decision-making techniques when solving decision-making problems. For instance, Sakthivel et al. [19] used a combination of FAHP and PROMETHEE to evaluate the best car. Ulkhaq et al. [18] employed a combination of AHP and TOPSIS to evaluate car selection. A hybrid decision-making technique based on AHP, SAW, and TOPSIS was proposed by Hadikurniawati et al. [5] for electrician selection. Matic et al. [37] developed a hybrid model that integrates the rough COPRAS with the full consistency method (FUCOM) for evaluating and selecting construction company suppliers in a sustainable supply chain.
MADM methods contain four main components [30,34]:
  • Alternatives: solutions or options that should be evaluated based on attributes, and ranked or selected according to the most appropriate.
  • Attributes: properties, qualities, or features of the alternatives. Each attribute can have several sub-attributes.
  • The relative importance of attributes (an attribute’s weight of importance): The degree of preference of an attribute over another attribute or sub-attribute.
  • Evaluation function: final criterion for evaluating and ranking the alternatives.
One of the major challenges of MADM methods mentioned in [8,36,39,40,41,42] is their dependence on the preferences, knowledge, and experience of stakeholder groups. As the preferences, level of knowledge, and experience of stakeholder groups are different, stakeholder preferences can be diverse and uncertain. Uncertainties in preferences are typically symmetrically distributed around a value, especially in cases with multiple and different stakeholders, such as automotive design problems as a product with a global market. Inevitably, decision-makers will always face levels of unreliability and lack of knowledge, which may result in different outcomes. Uncertainties and a lack of knowledge can be observed in measuring the relative importance of attributes [16,40,41,43,44,45], determining the values of attributes [43,45,46,47], and even identifying alternatives (decision space).
Several methods have been introduced to determine attribute weights: objective weighting methods, subjective weighting methods, and hybrid weighting methods [34,39,48]. In objective weighting methods, the preferences of stakeholders have no role in determining attributes’ weights. Based on the difference in the values of the attributes in each alternative, each attribute’s weight is calculated. In contrast, in subjective methods, attributes are weighted according to stakeholder preferences and judgments. A combination of different objective and subjective weighting methods is used in hybrid methods.
There are different ways to determine the value of attributes and the decision space, including expert judgment (linguistic statements) or numerical values. The linguistic nature of human judgment, as well as the different levels of knowledge and experience that people have, always causes ambiguity and uncertainty in making a final decision. Consequently, enabling methods are required to handle such an uncertain decision space and reach a reliable and desirable decision.
Different methods have so far been proposed to solve MADM problems under uncertainty; Jiang et al. [49] proposed a decision-theoretic fuzzy rough set model in hesitant fuzzy information systems and discussed its application in MADM. A large group of emergency decision-making methods based on relative entropy, Bayesian theory, and Euclidean distance were proposed by Wang et al. [50], which were applied for a large-group emergency decision making with expert weights, unknown attribute weights, and uncertain probabilities of occurrence. Alkan et al. [51] proposed a model to evaluate the most appropriate sustainable construction material by combining the Bayesian best–worst method (BWM) with SAW. Darko et al. [52] developed a novel decision evaluation model that integrates online consumer reviews (OCRs) and MADM with probabilistic linguistic information to rank mobile payment services. They employed the probabilistic linguistic term set theory and statistical analysis to convert the sentiment scores into probabilistic linguistic elements. Akram et al. [53], to select the best industrial waste management technique by using the linguistic Pythagorean fuzzy sets, introduced a dynamic MAGDM model by integrating the evaluation based on distance from average solution method and the criteria importance through inter-criteria correlation method. A new Best–Worst MADM method under probabilistic linguistic information was presented by Wu et al. [54], which was applied to a practical example of selecting optimal green enterprises. Wu et al. [55] made a comprehensive overview of published papers in the field of cognitively inspired MADM methods under uncertainty. Piasecki et al. [56] examined the effect of the orientation of the ordered fuzzy assessment on the SAW method. A novel MADM approach for the intuitionistic fuzzy numbers environment was proposed by Dhankhar et al. [57]. Xu et al. [58] proposed an MADM method based on interval-valued q-rung dual hesitant uncertain linguistic sets. A novel MADM method was proposed under a probabilistic hesitant fuzzy environment by Song et al. [59], which is based on the new distance measures of probabilistic hesitant fuzzy elements and the COPRAS method. Zavadskas et al. [60] proposed an MADM model by applying Grey numbers. An interactive decision-making approach was developed by De et al. [61] to solve MAGDM problems with incomplete weight information by using a probabilistic interval-valued intuitionistic hesitant fuzzy Set. Zhang et al. [62] proposed a probabilistic hybrid linguistic approach for MAGDM with decision hesitancy and the prioritization of attribute relationships. Peng et al. [63] developed a three-way MADM method for an incomplete mixed information system, in which both utility functions and the objective determination of conditional probabilities without a decision label are pivotal issues. Ziemba et al. [8] evaluated the impact of various degrees of uncertainty in preferences in the supply chain management systems selection problem using the PROMETHEE method. A method based on probability theory was presented by Saghari et al. [16] for solving the MADM problem under uncertainty. The literature review indicates that four theories have been used in MADM problems to handle uncertainties: fuzzy set, probability, Grey systems, and Bayesian.
In solving real decision problems under uncertainties, simulation tools are used to consider different conditions and analyze the sensitivity of the output against these uncertainties [64,65,66]. Monte Carlo simulation is the most common tool to simulate uncertainties [44,65,67]. Bertsch et al. [68] presented a Monte Carlo approach to cope with the decision-makers’ preferential uncertainties to facilitate the process of weight elicitation. A Monte Carlo simulation was used by Jimenez et al. [67] to investigate the sensitivity of a decision support system’s output to the weights of attributes. To eliminate the limitations of deterministic and fuzzy MAGDM methods, Bayram et al. [69], based on a Monte Carlo simulation of triangular data and TOPSIS, presented a probabilistic methodology. Tervonen et al. [70] applied a Monte Carlo simulation to describe the share of parameter values assigned to different categories for each alternative. Mateos et al. [71] used a Monte Carlo simulation for group decision making with incomplete information. Lafleur [15] presented a probabilistic methodology based on a Monte Carlo simulation to facilitate such decision-making processes, particularly those with an uncertainty in decision-maker preferences.
One idea to reduce the level of uncertainty and lack of knowledge to determine the value of attributes and the decision space is to utilize the knowledge contained in the database of produced products instead of using the vague and uncertain linguistic statement of human judgment. Especially in decisions related to product design, it is a smart approach to reduce the uncertainty and lack of knowledge by using the data from successful previous products [72,73,74]. Progress in data collection and analysis tools makes it possible to collect a large amount of data on various topics and store them in the form of databases. KDD techniques can be used to extract knowledge from these databases. In 1996, Fayyad et al. introduced the concept of KDD [75], according to which: “knowledge discovery in databases is the non-trivial process of identifying valid, novel, potentially useful, and ultimately understandable patterns in data” [72,75,76]. In many decision-making problems, utilizing KDD techniques to extract the knowledge contained in the database will significantly reduce the level of complexity and uncertainties caused by the lack of knowledge. Liou et al. [77] developed a data-driven MADM model that utilizes potential rules/patterns derived from a large amount of historical data to support decision-makers objectively selecting proper green suppliers and providing systematic improvement strategies to reach the desired level. A human-centered design approach for developing a dynamic decision support system based on knowledge discovery in databases was proposed by Ltifi et al. [78]. Mosavi [79] introduced the classification task of data mining as a functional option to identify the most effective variables of the MCDM systems.
The automotive family design is known as a complex engineering design problem engaging multiple groups of stakeholders from different domains of interest with contradictory attributes. The right selection of an automotive platform benchmark to develop an automotive family enables designers to make the right trade-offs in the early stages of the development process. It also helps designers to efficiently identify the characteristics and levels expected for the objectives, attributes, and design constraints. Finally, convergence on the optimal design point can be achieved faster by considering all design constraints, attributes, and objectives. The main objective of this research is to provide a robust-reliable decision-making methodology to select a set of automotive platform benchmarks. To this end, there are two main research questions:
  • How to ensure the reliability of the decision?
  • How to ensure the robustness of the decision?
Choosing an appropriate and reliable MADM method, along with providing access to reliable sources for evaluating alternatives, is vital to achieving a desirable and reliable decision. In this research, the SAW method has been chosen to evaluate alternatives and make decisions. According to the literature [2,32,80,81,82], the SAW method is the simplest, oldest, and most widely used MADM method. As a result, we can ensure that the decision-making method is reliable and proven.
In this study, instead of determining the decision space and the values of the attributes based on human judgment (which always contains some degrees of imprecision and uncertainty), using KDD techniques, the decision space and values of the attributes are elicited from the database. This leads to the elimination of the uncertainties and inaccuracies caused by human judgments. On the other hand, given that the database contains information about successful products that have been tested and proved, the values of attributes will be quite reliable. As a result, it increases the reliability of the decision-making process.
The robustness of a decision refers to its insensitivity to uncertain variables and parameters involved in a decision-making process. The main source of uncertainty in MADM problems with multiple groups of stakeholders is attributable to the weight of attributes. In the real decision-making problem of engineering design, the opinion of stakeholders, which could include suppliers, design and development teams, assembly and manufacturing teams, quality control, standards and environment, sales and after-sales services, government and upstream organizations, and the end users, should be considered. Therefore, due to the involvement of multiple entities, the weight of attributes should be determined subjectively. In this research, to achieve a robust decision considering all possible states of stakeholders’ judgments, the simulation of stakeholders’ judgments is performed using probability theory and Monte Carlo simulation. The decision-maker can measure the sensitivity of the output by using this simulation and can determine a robust decision by analyzing the statistical data.
The main novelty of this research is to suggest a multidisciplinary methodology to solve engineering design decision-making problems based on different techniques. Although some techniques have been used alone in the literature, such a combination of techniques in the form of the integrated methodology under one umbrella has no record in the literature. In addition, the utilization of the previous products’ database and KDD technique to determine the value of the attributes and decision space, simulating all the possible states of the stakeholders’ preferences, and using the statistical techniques to determine the desirable-robust alternatives, as well as the defined problem (selection of benchmark platforms for the development of the automotive family), have no history in the literature (to the best of the author’s knowledge).
This paper as an extended version of [83] is organized as follows: the next section addresses the proposed method. The implementation in the automotive platform benchmark selection is given in Section 3. The discussion about the results is given in Section 4, and conclusions appear in Section 5.

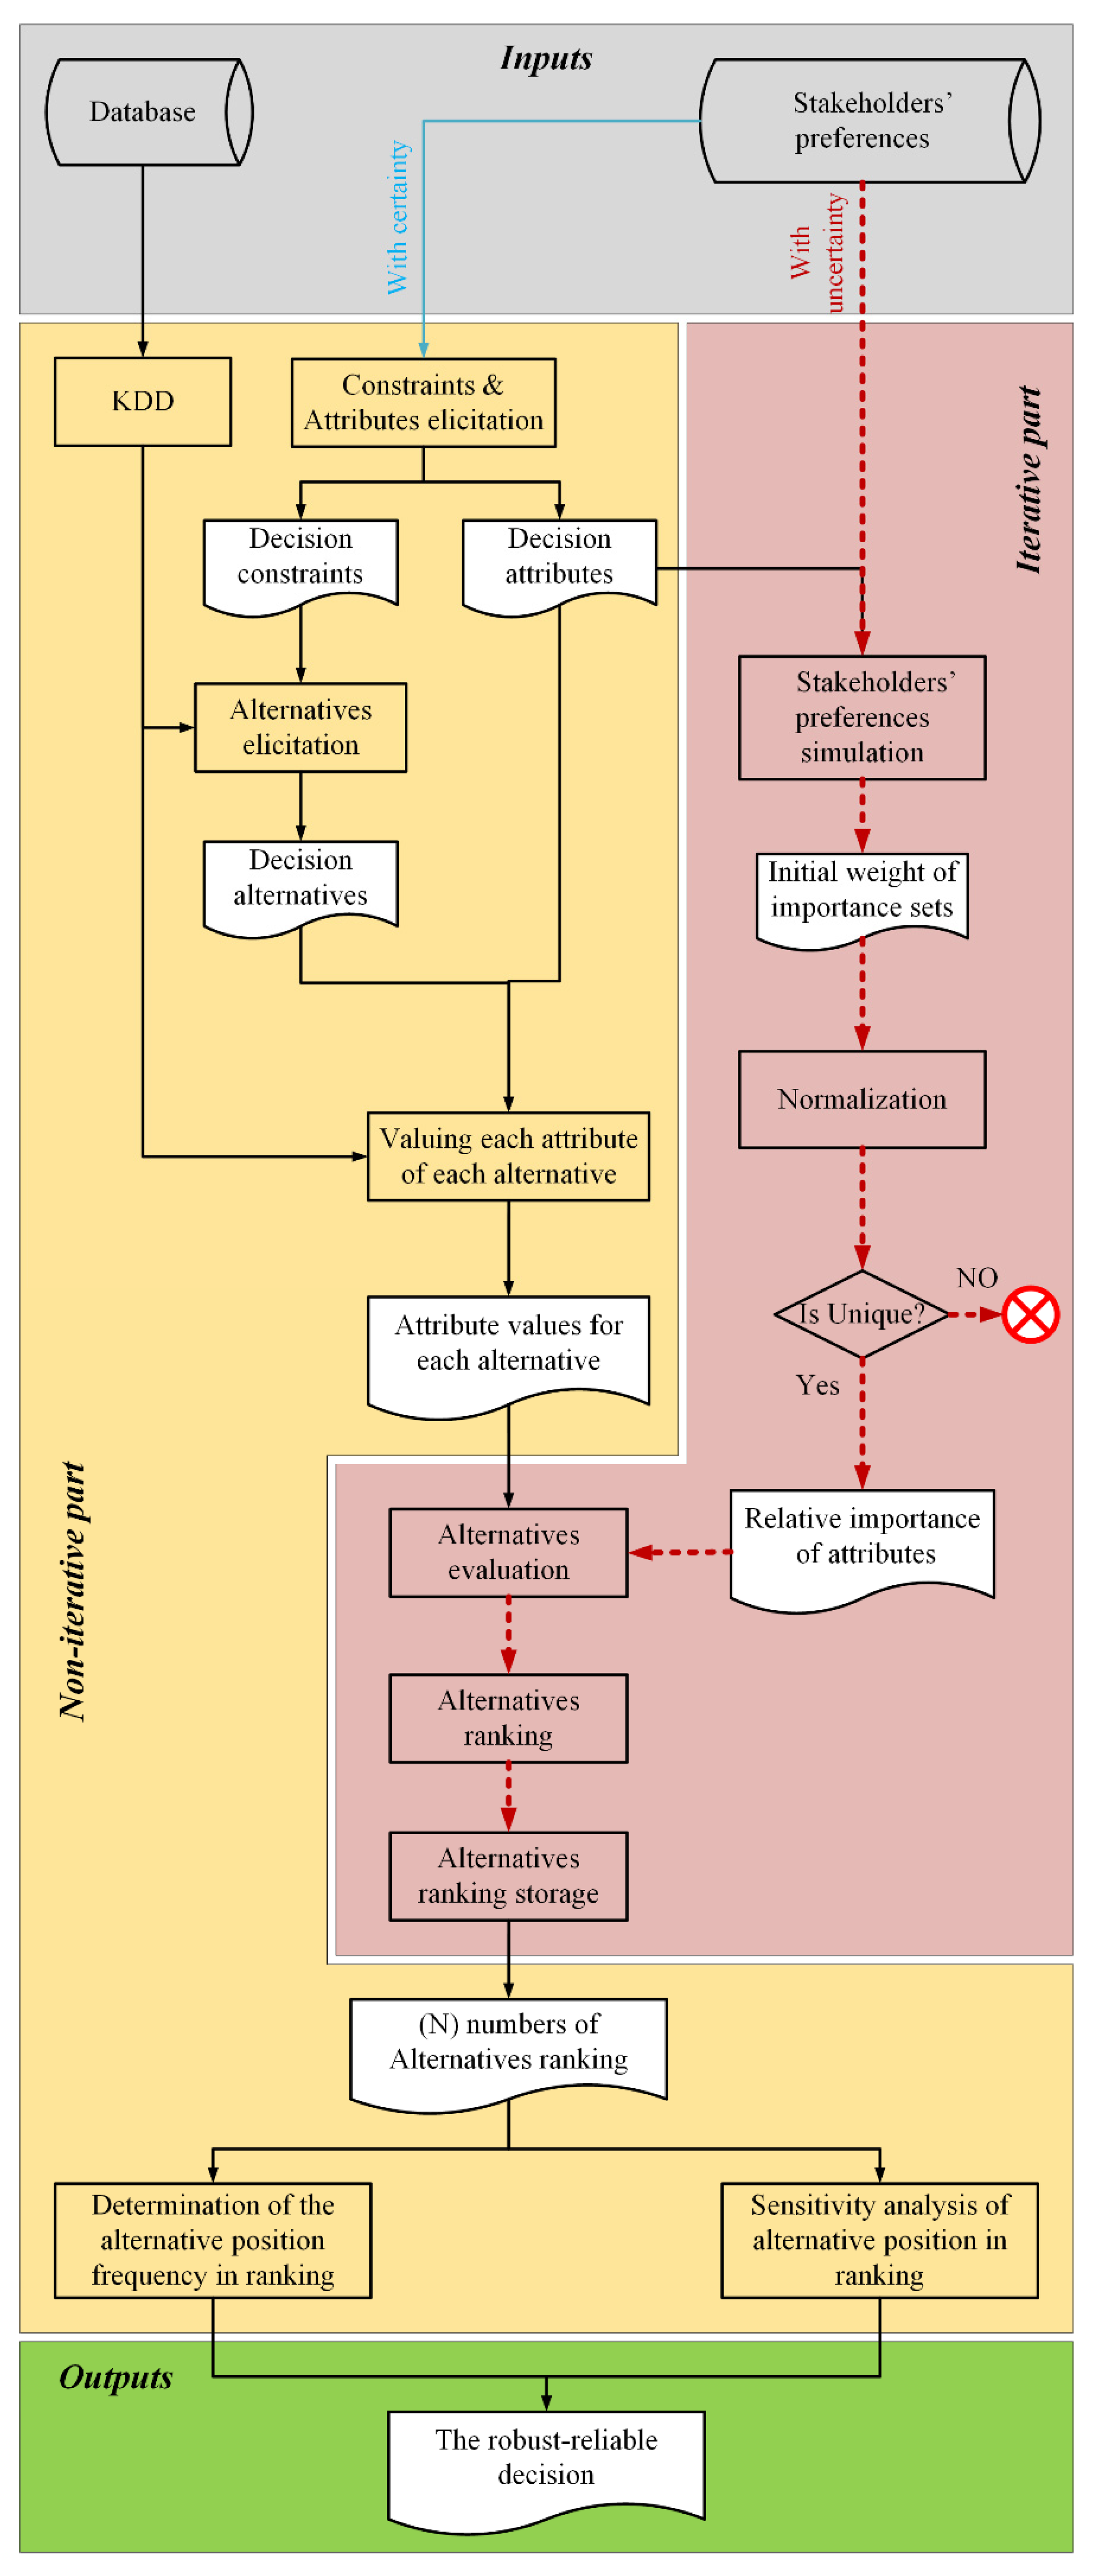
2. The Proposed Methodology

The proposed methodology includes the following steps:
Step (A)—Problem Inputs: In this step, certain statements of stakeholders’ preferences as well as the required database are compiled.
Step (B)—Elicitation of attributes and constraints: In this step, based on certain statements of stakeholders’ preferences, problem constraints and effective attributes in decision-making are determined.
Step (C)—Identification of decision alternatives and valuing the attributes for each alternative: In this step, according to the constraints of the problem, the KDD techniques are utilized to elicit the decision alternatives and quantitative models for attributes from the database.
Step (D)—Determination of the relative importance of attributes: In this step, the process of determining the relative importance of attributes by considering all possible stakeholders’ preferences is simulated.
Step (E)—Evaluating, ranking, and storing alternatives: In this step, the final score of each alternative is calculated using the evaluation function, and the alternatives are prioritized accordingly. Generated rankings are stored for later analysis.
Step (F)—Statistical analysis and sensitivity assessment of outputs: In this step, statistical analysis and sensitivity assessment of iterative problem-solving outputs are discussed. Determining the frequency of positions occupied in ranking, the standard deviation, the number of positions occupied by each alternative, and other statistical characteristics is examined in this step.
Step (G)—Finally, after statistical analysis and sensitivity assessment of the stored outputs, a robust-reliable decision is made to select five platforms as a benchmark.
Figure 1 shows the steps required to achieve a robust-reliable decision. In Section 3, the proposed methodology is applied to solve the automotive platform benchmarks decision problem.

3. Implementation

The decision-making problem addressed in this section is the selection of the five most fitted platforms as benchmarks for the development of an automotive family. The motivation to propose this methodology could be first related to the importance of the under-decision case and then to the utilization of existing potentials to solve the decision problem.
As mentioned earlier, the automotive family design is known as one of the most complex engineering design problems with multiple groups of stakeholders in different domains of interest and contradictory attributes. The right choice of automotive platform benchmarks for the development of an automotive family allows designers to make the right trade-offs in the early stages of the design and development process. It also helps them to efficiently identify the characteristics and levels expected for the attributes, objectives, and design constraints. Finally, convergence on the optimal design point can be achieved faster by considering all design constraints, attributes, and objectives.
Many automobiles in different models and segments have been produced and launched on the market based on different platforms. With the progress in data collection techniques and tools, it is possible to create an enriched database of information about the cars in the market. The database contains valuable information that can be utilized as a reliable source for a decision-making process. By using this database, a logical relationship between the characteristics of the automobiles and the characteristics of the platforms can be achieved. It allows a more accurate determination of decision attributes and the decision space, consequently minimizing the uncertainty and lack of knowledge in decision-making. Furthermore, it is possible to model the possible states of stakeholders’ judgment by using simulation tools. Then, by using statistical analysis techniques, a robust and reliable decision can be achieved by considering all the possible preferences of stakeholders.

3.1. Problem Inputs

The inputs consist of two main parts: stakeholders’ preferences and the database. As can be seen in Figure 1, the stakeholders’ preferences contained certain and uncertain statements. Certain statements will determine the type of decision attributes and problem constraints/requirements. Uncertain statements will determine the attributes’ degree of importance. A database of automobiles and platforms worldwide was collected to elicit quantitative models for attributes and determine their values. Information such as types of platforms, automobile segments, models, manufacturers, prices, years of production, annual production numbers, and platform manufacturers was included in the database.
The statements of stakeholders’ preferences are defined below:
  • The selected automotive platform should support the automotive family in segments B, C, and SS (Small SUV).
  • The automobiles developed based on the platforms must be less than 25 years old.
  • It is desirable to develop low-cost automobiles using the platforms.
  • It is desirable to develop automobiles in various price classes based on the platforms.
  • It is desirable to develop different segments of automobiles based on the platforms.
  • It is desirable to develop different models of automobiles based on the platforms.
  • More popular and trustworthy platforms are desirable.

3.2. Elicitation of Constraints and Decision Attributes

According to the statements of stakeholders’ preferences, the constraints and attributes of the decision problem were determined.
The constraints for defining the decision space are as follows:
  • The automotive family developed based on the platform must include at least one of the B or C or SS segments.
  • All the automobiles manufactured based on each of the platforms must be under 25 years old.
By analyzing the stakeholders’ preferences, four attributes that meet the stakeholders’ preferences were defined. Based on models and values elicited from the database, the defined attributes were quantified. The four decision attributes were as follows:
1. Segment adaptation: This attribute is vital in defining the degree of compatibility of the platform within the segments that were defined for the development of the automotive family. The valuing was performed based on the degree of resemblance between the stakeholder’s expected segments and developed segments from each platform alternative in the database.
2. Price: The price attribute itself consists of two sub-attributes, the minimum price and the price range of the automobiles developed based on each platform alternative. It is worth noting that as automobiles were manufactured in different countries over various periods of time, all prices should be standardized based on an underlying currency. The 2019 value of the U.S. dollar was chosen here.
3. Platform flexibility: This attribute contains two sub-attributes, the number of segments covered by each platform and the number of models produced based on each platform. A greater number of models as well as the number of segments indicate a more flexible platform.
4. Platform popularity: This is an attribute describing the level of popularity and reliance on a platform. Here, the attribute was divided into two sub-attributes, the annual production rate of the automobiles based on the platform and the number of manufacturers using the platform.

3.3. Valuation of the Attributes and Alternatives Definition

By using KDD techniques, the decision space was narrowed down to 34 alternatives for the benchmark automotive platforms. Overall, the design space included 546 automotive models in 11 automotive segments that were developed based on 34 platforms. The hierarchical structure of the decision-making problem is shown in Figure 2.
In Figure 2, (W1 to W4) are the weights of importance of the attributes, (w2.1, w2.2, w3.1, w3.2, w4.1, w4.2) are the weights of importance of the sub-attributes, and (P1 to P34) indicate the number of platform alternatives.
The values of attributes and sub-attributes were obtained using the KDD technique as shown in Table 1.
As can be seen in Table 1, the range and unit of the obtained values for the attribute/sub-attribute had different ranges and units. These values must be normalized for a correct evaluation. Different methods were proposed to normalize the values of attributes [82,84,85,86,87]. Some of the most widely used normalization methods in MADM are presented in Table 2.
In Table 2, ( V i j ) is the value of each attribute for each alternative, ( n ) is the number of alternatives, ( j ) is the alternative number, and ( i ) is the attribute number. Based on the experiment result, Chakraborty et al. [87] confirmed that vector normalization and linear normalization methods outperform other normalization methods in the SAW method. In this study, the vector normalization method was used for attribute normalization. Table 3 presents the normalized values of each attribute/sub-attribute. Weights of importance of the sub-attributes in calculating the values of the second to fourth attributes were considered as follows: (w2.1 = 0.5, w2.2 = 0.5 w3.1 = 0.3, w3.2 = 0.7, w4.1 = 0.5, w4.2 = 0.5).

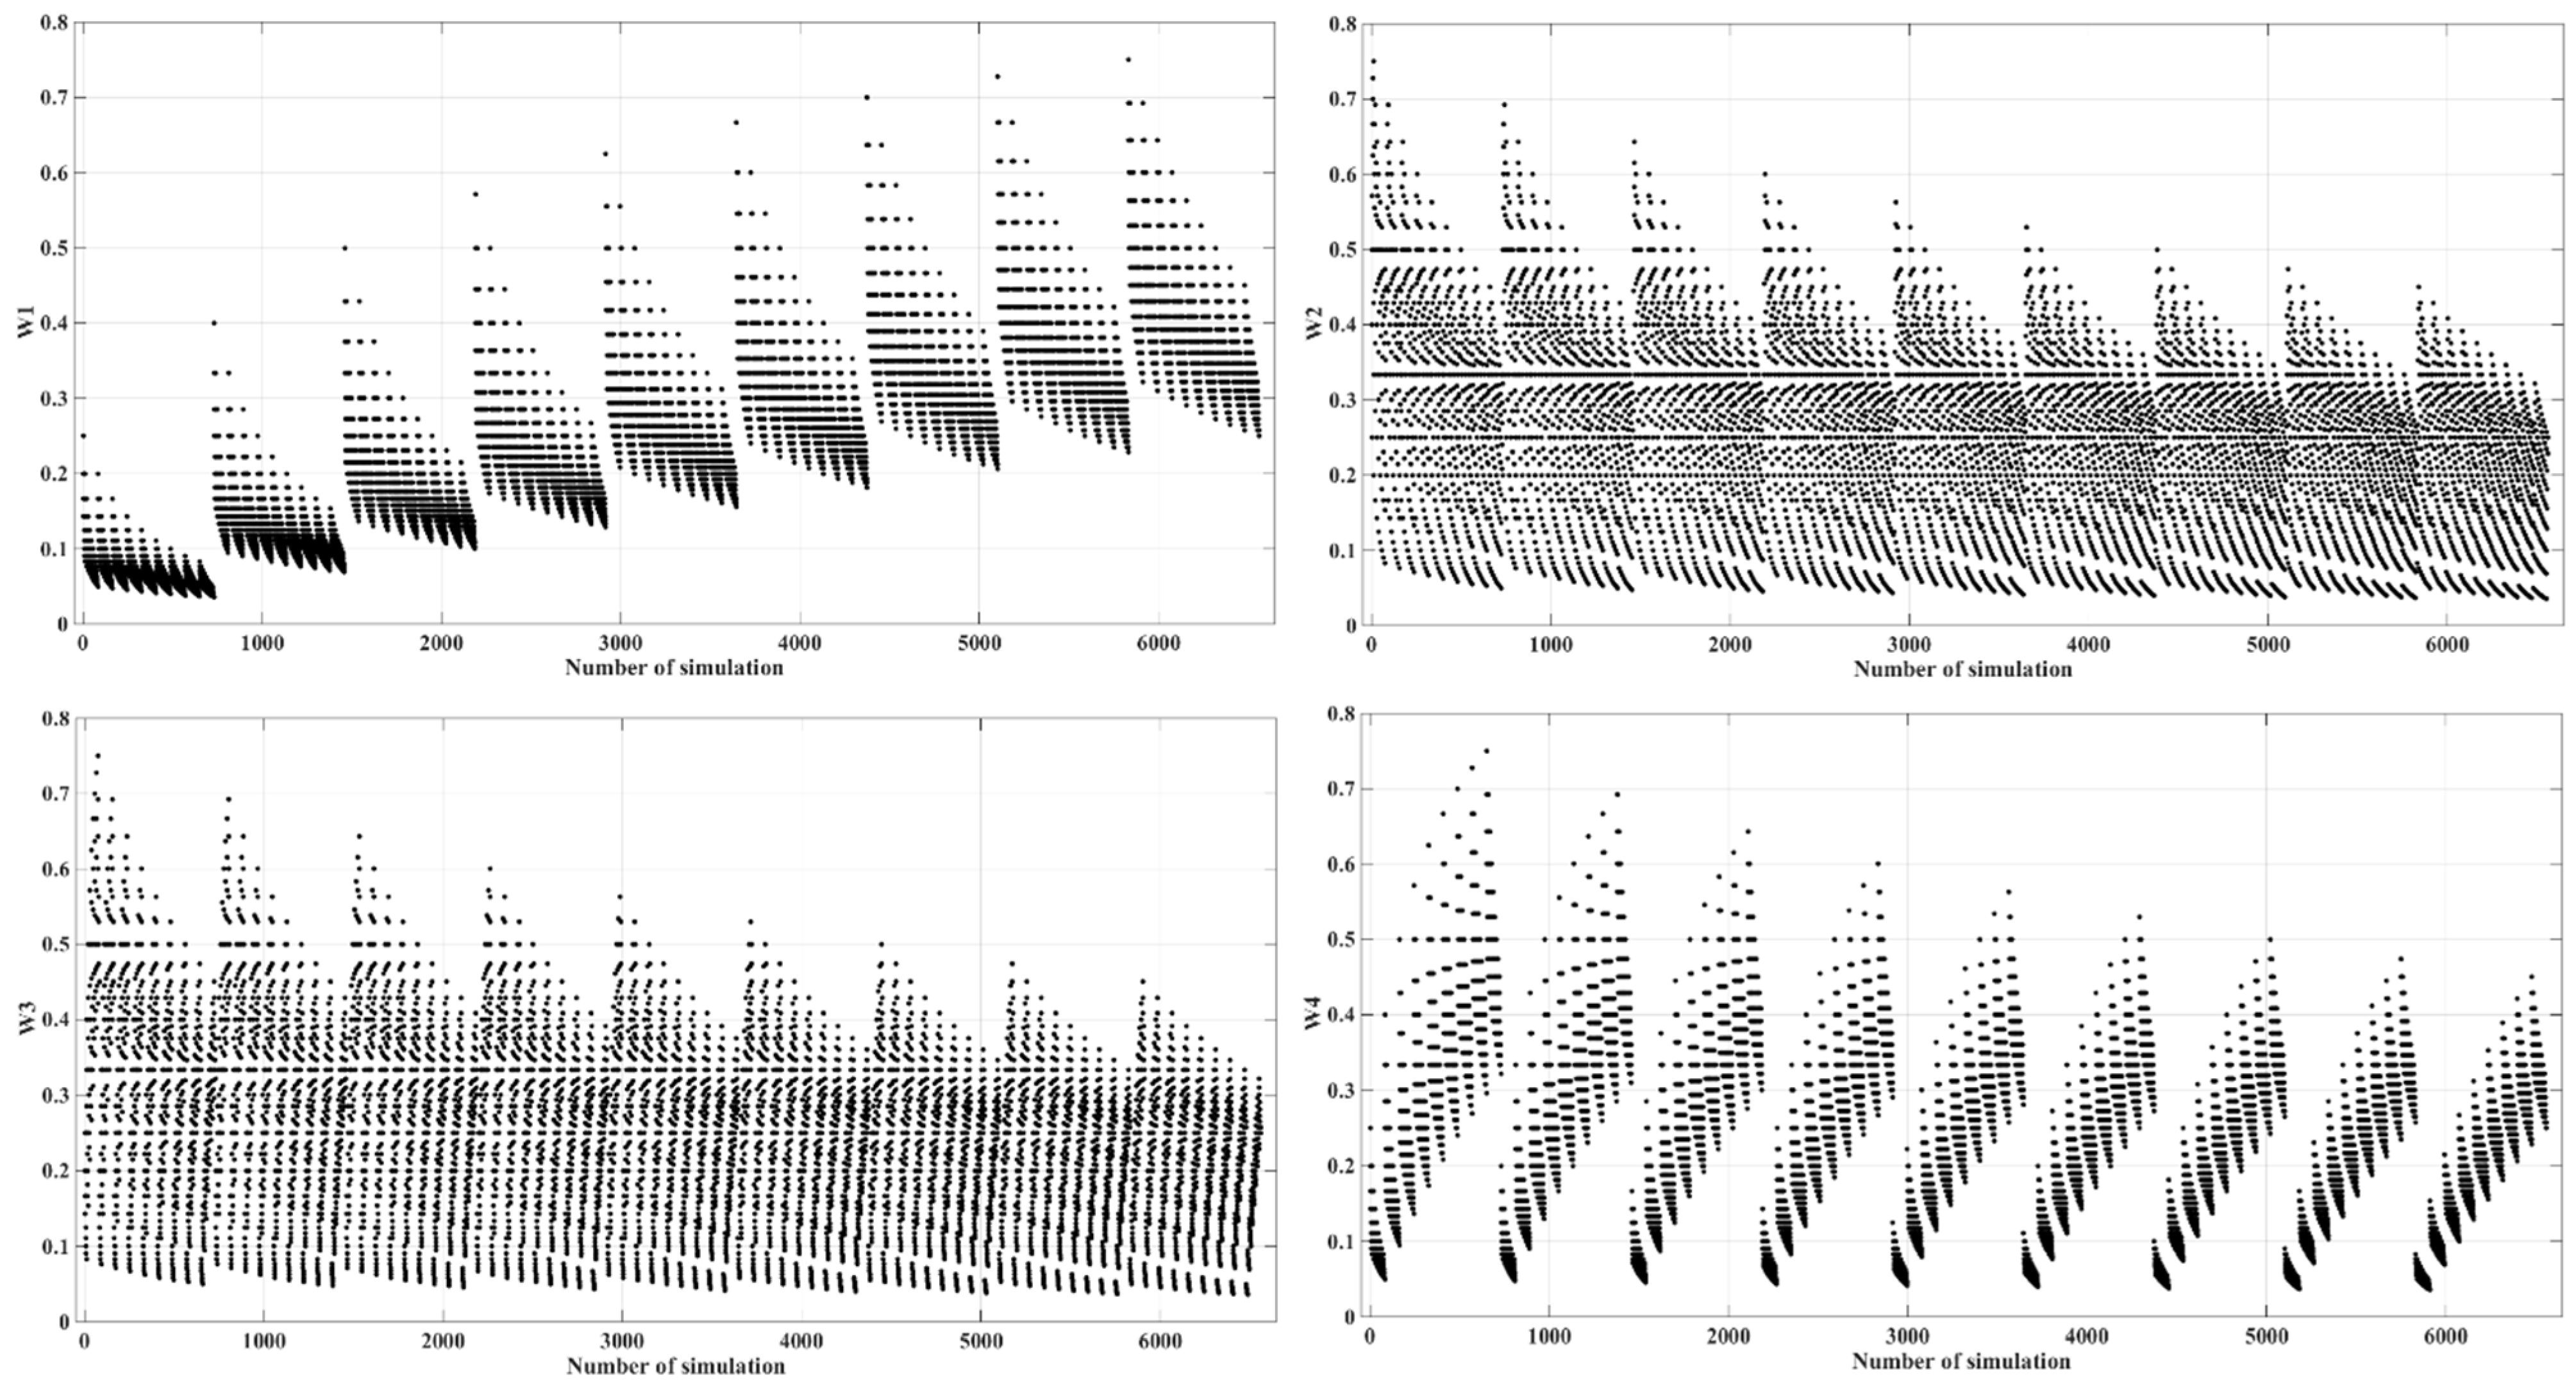
3.4. Generation of the Relative Importance of Attributes

The attributes’ degree of importance is a function of stakeholders’ preferences. Due to the existence of different stakeholders with diverse preferences and judgments about the attributes, in this study, the process of determining the attributes’ degree of importance by stakeholders was simulated. To consider all possible stakeholders’ judgment scenarios, the following constraints were considered:
  • A scale of 1 to 9 was used to quantify the relative importance of each attribute.
  • Uniform and symmetric probability distributions were used to determine the relative importance of the attributes.
  • There was no similarity between any of the sets of attributes’ relative importance.
Given that there were four main attributes, and the relative importance value of each attribute was determined with numbers 1 to 9, based on the Thomas L. Saaty method [88], the number of possible non-repetitive states was equal to 6561. The 6223 unique sets of relative importance remained after removing sets of weights that were multiples of each other. Finally, the simulated weights of importance were normalized so that the total weight of the values in each set was equal to one. In Figure 3, the normalized values of the simulated weights of importance are shown.

3.5. Evaluating, Ranking, and Storing the Alternatives

Following the determination of the attributes’ values as well as the attributes’ relative importance simulation, the evaluation process of each alternative began. This process was iterated as many times as the number of unique sets of the relative importance of attributes (6223 times), and finally, the obtained rankings were stored for further analysis and identification of the robust-reliable decisions.
Decision-making methods must be chosen carefully to ensure a reliable solution while being as simple as possible. For this study, the SAW method was selected because, considering the type of the decision problem, i.e., a decision-making problem with a large number of decision alternatives under uncertain conditions, this method was superior to others in terms of reducing computational complexity. In this method, the evaluation function of each alternative was calculated using Equation (1).
E j = i = 1 m W i N o r m a l i z e d V i j N o r m a l i z e d
  • E j : The value of the evolution function for each alternative.
  • W i : Attributes weight of importance.

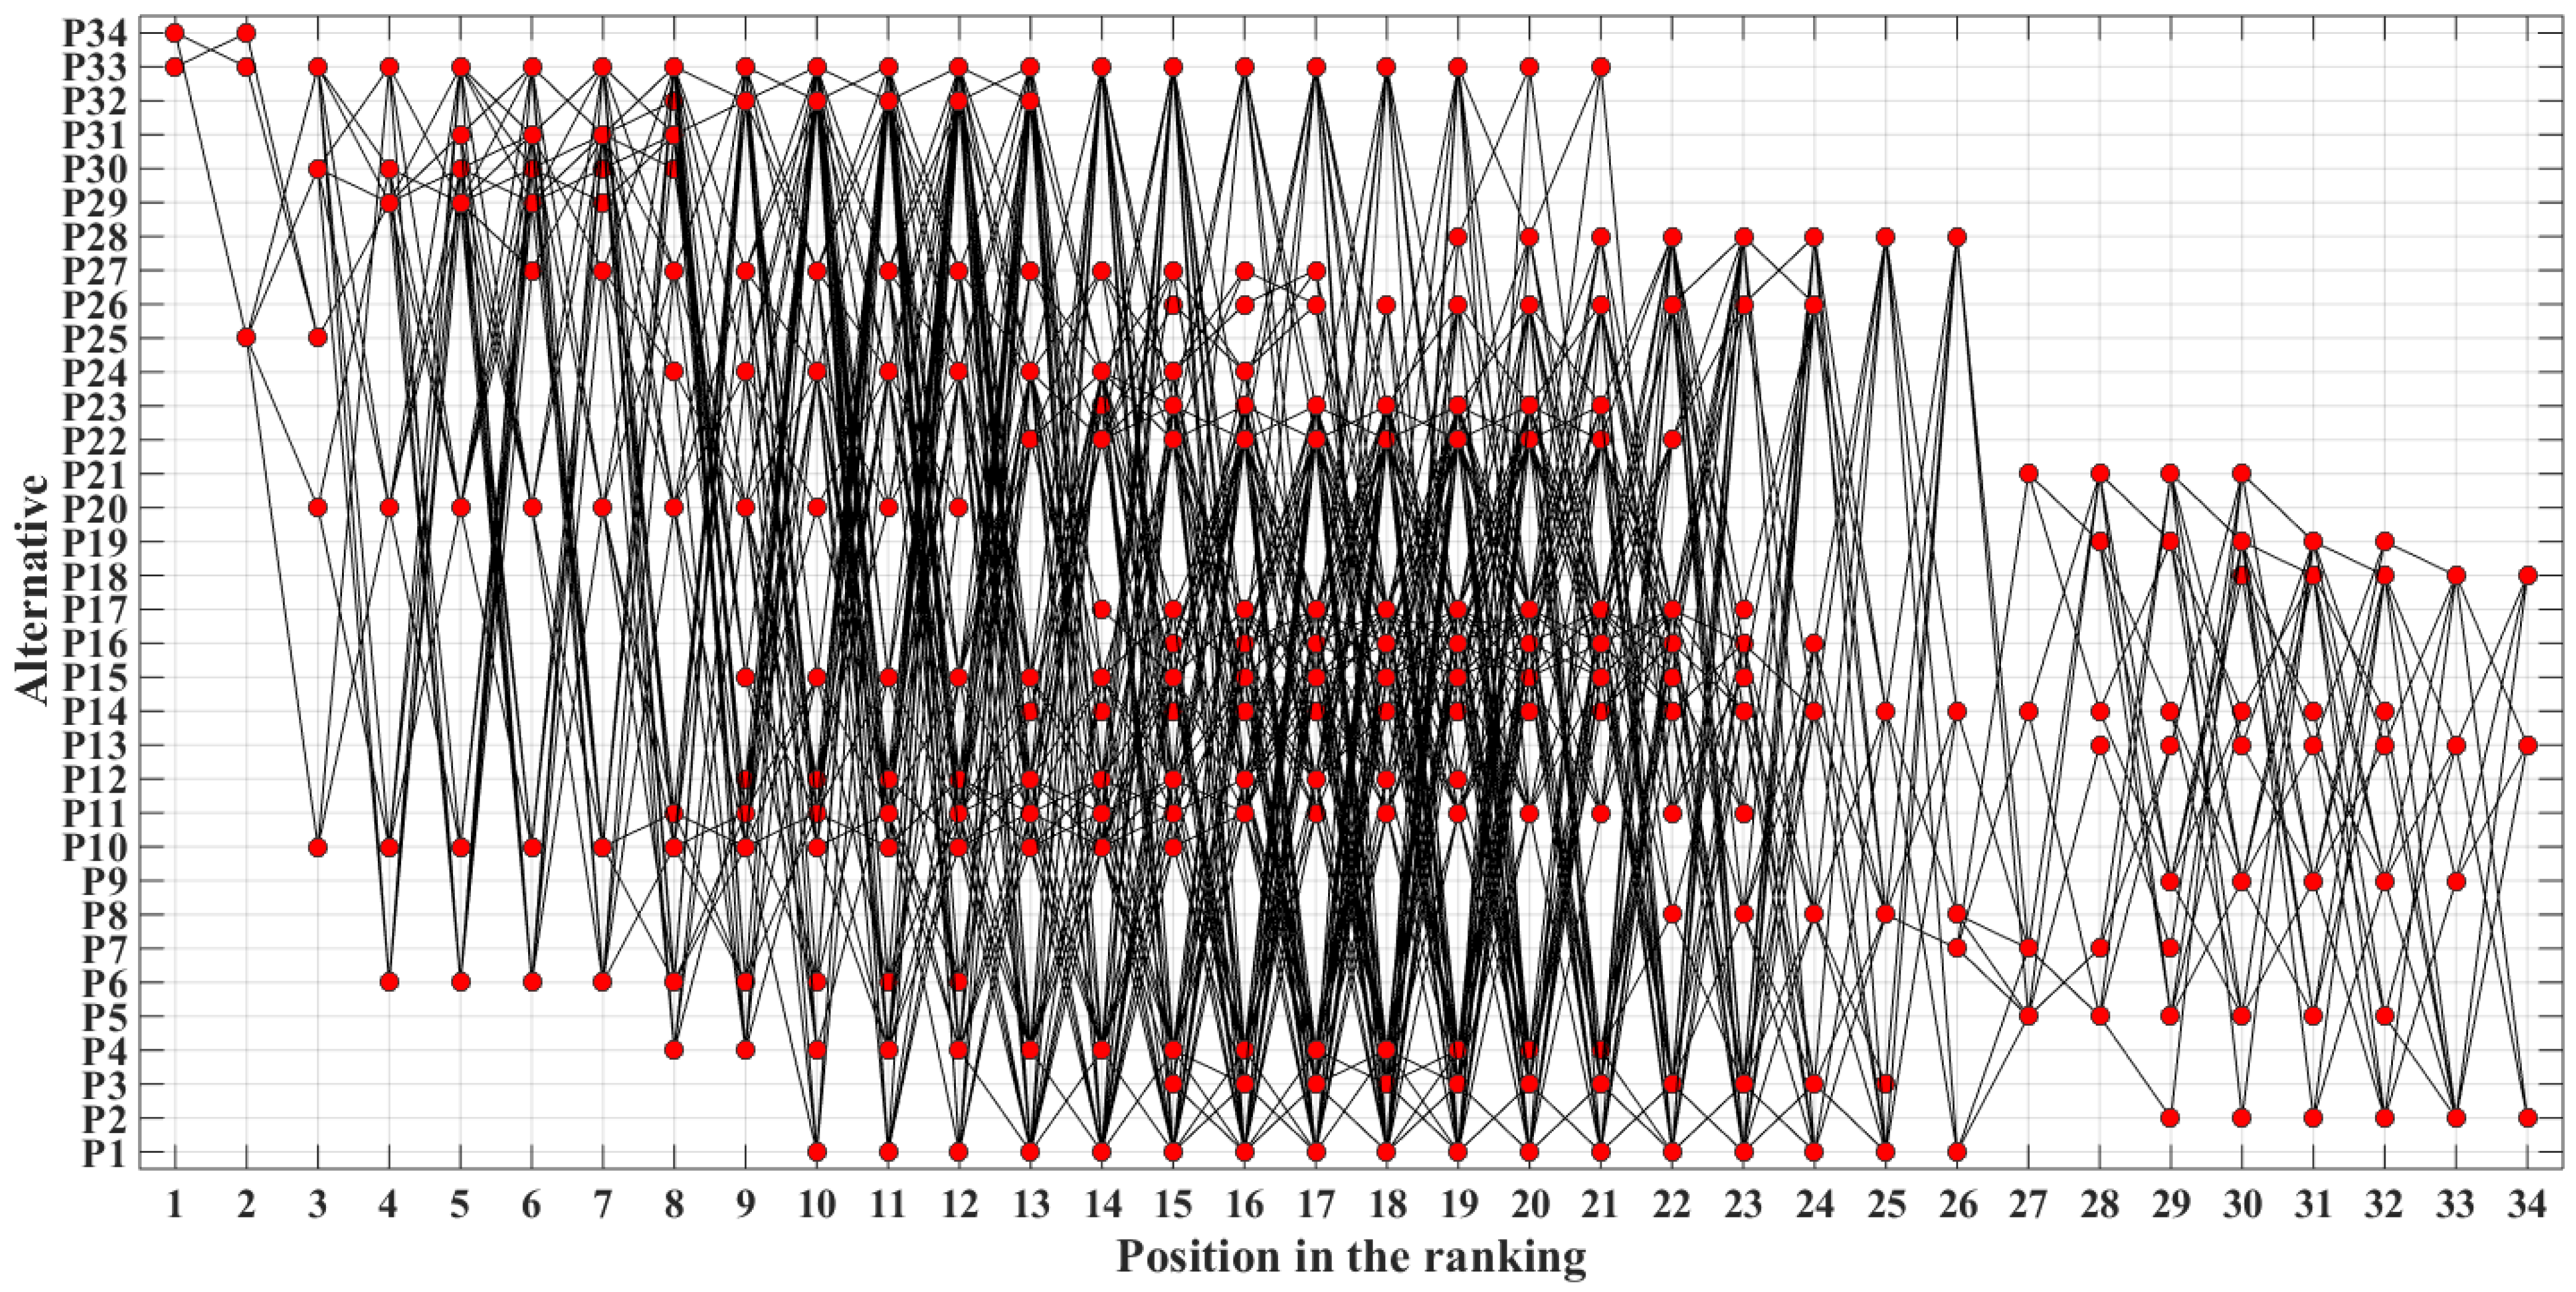
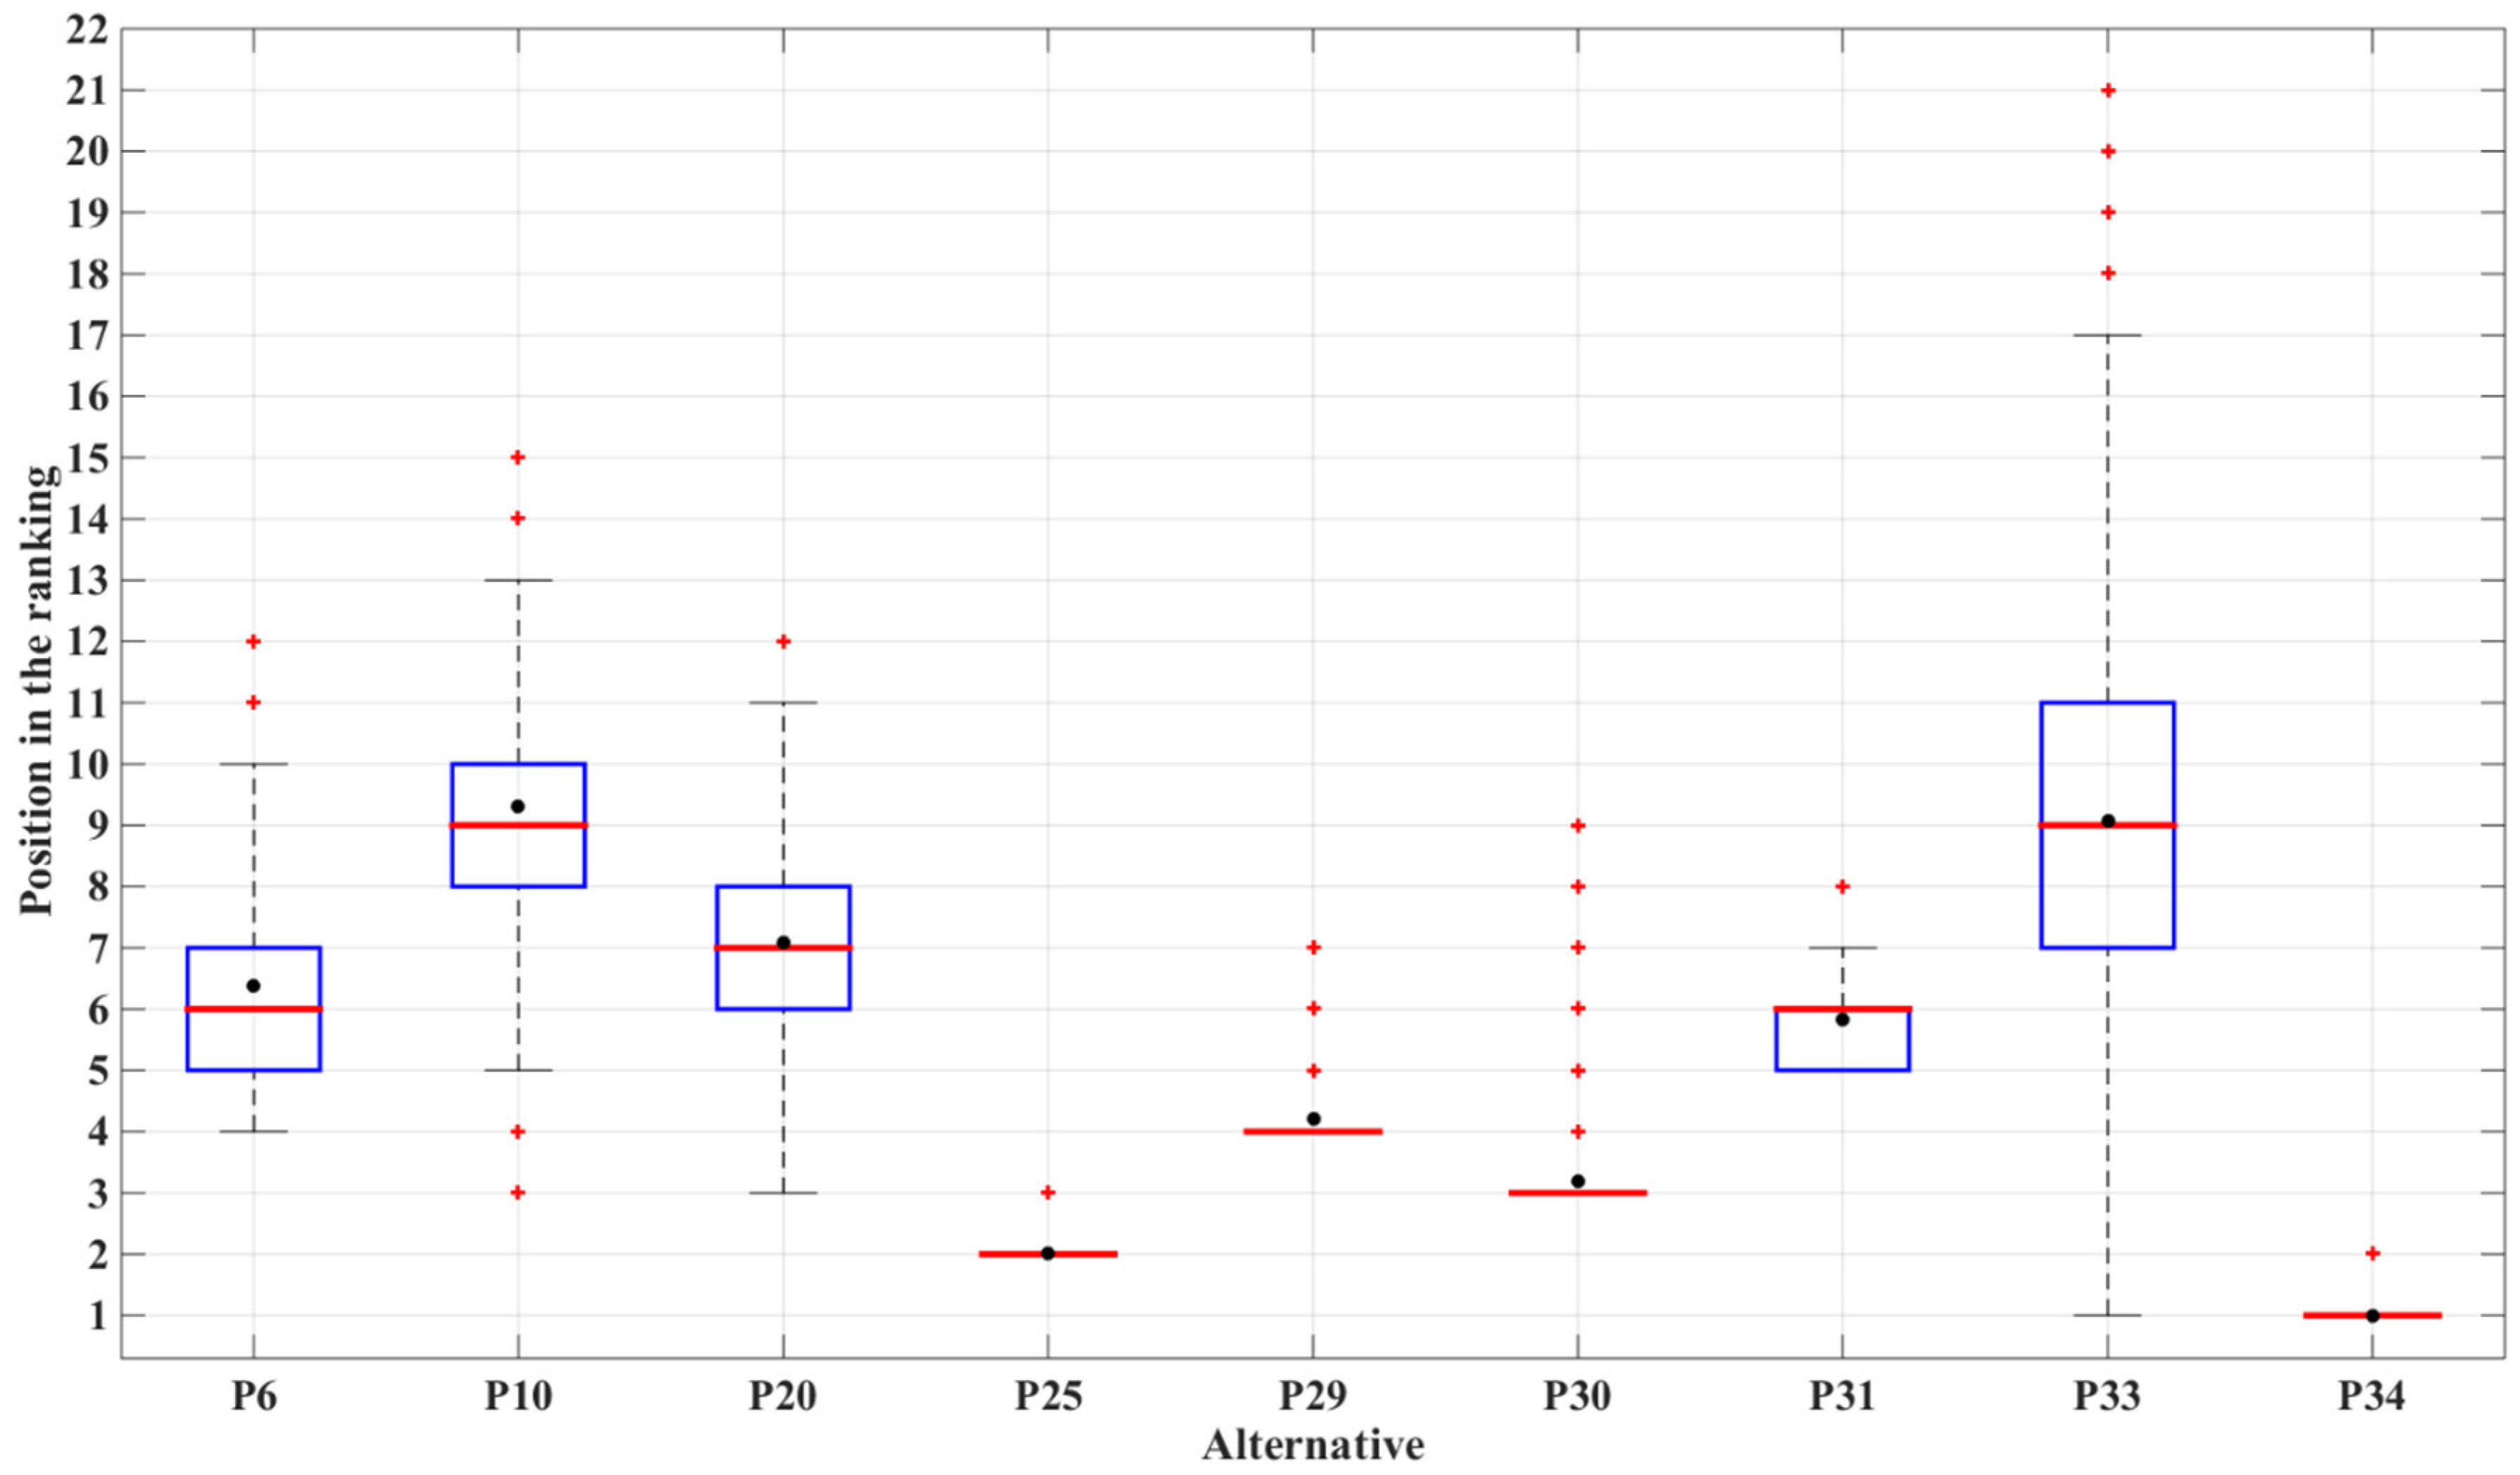
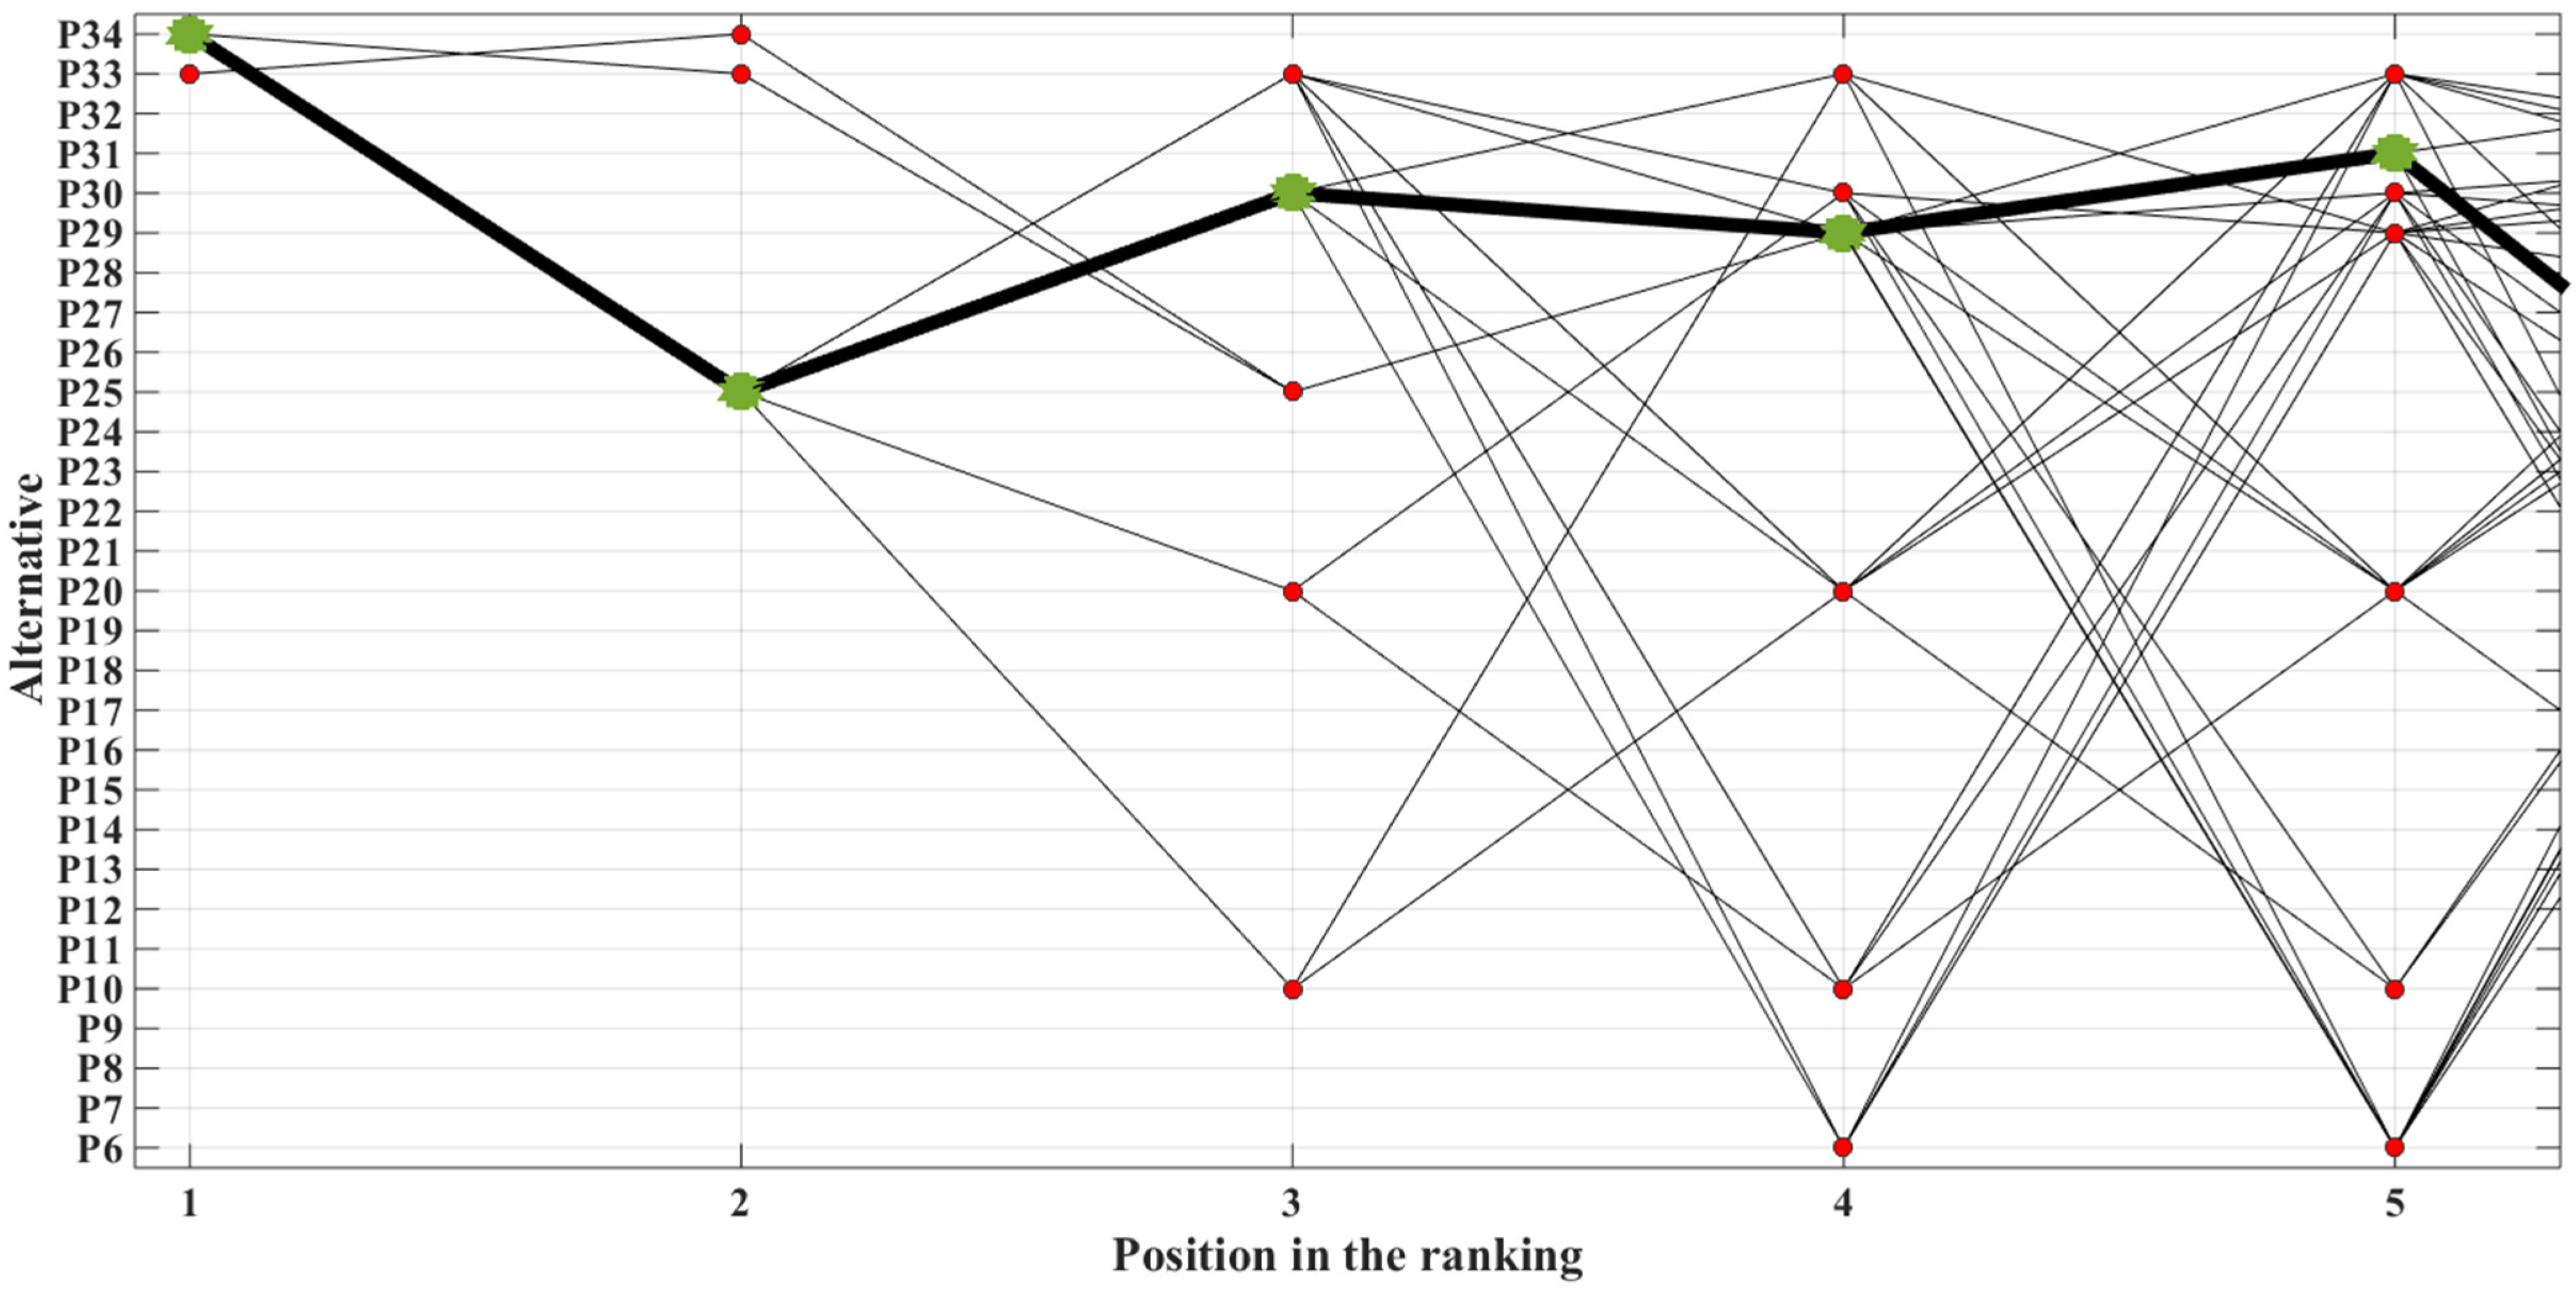
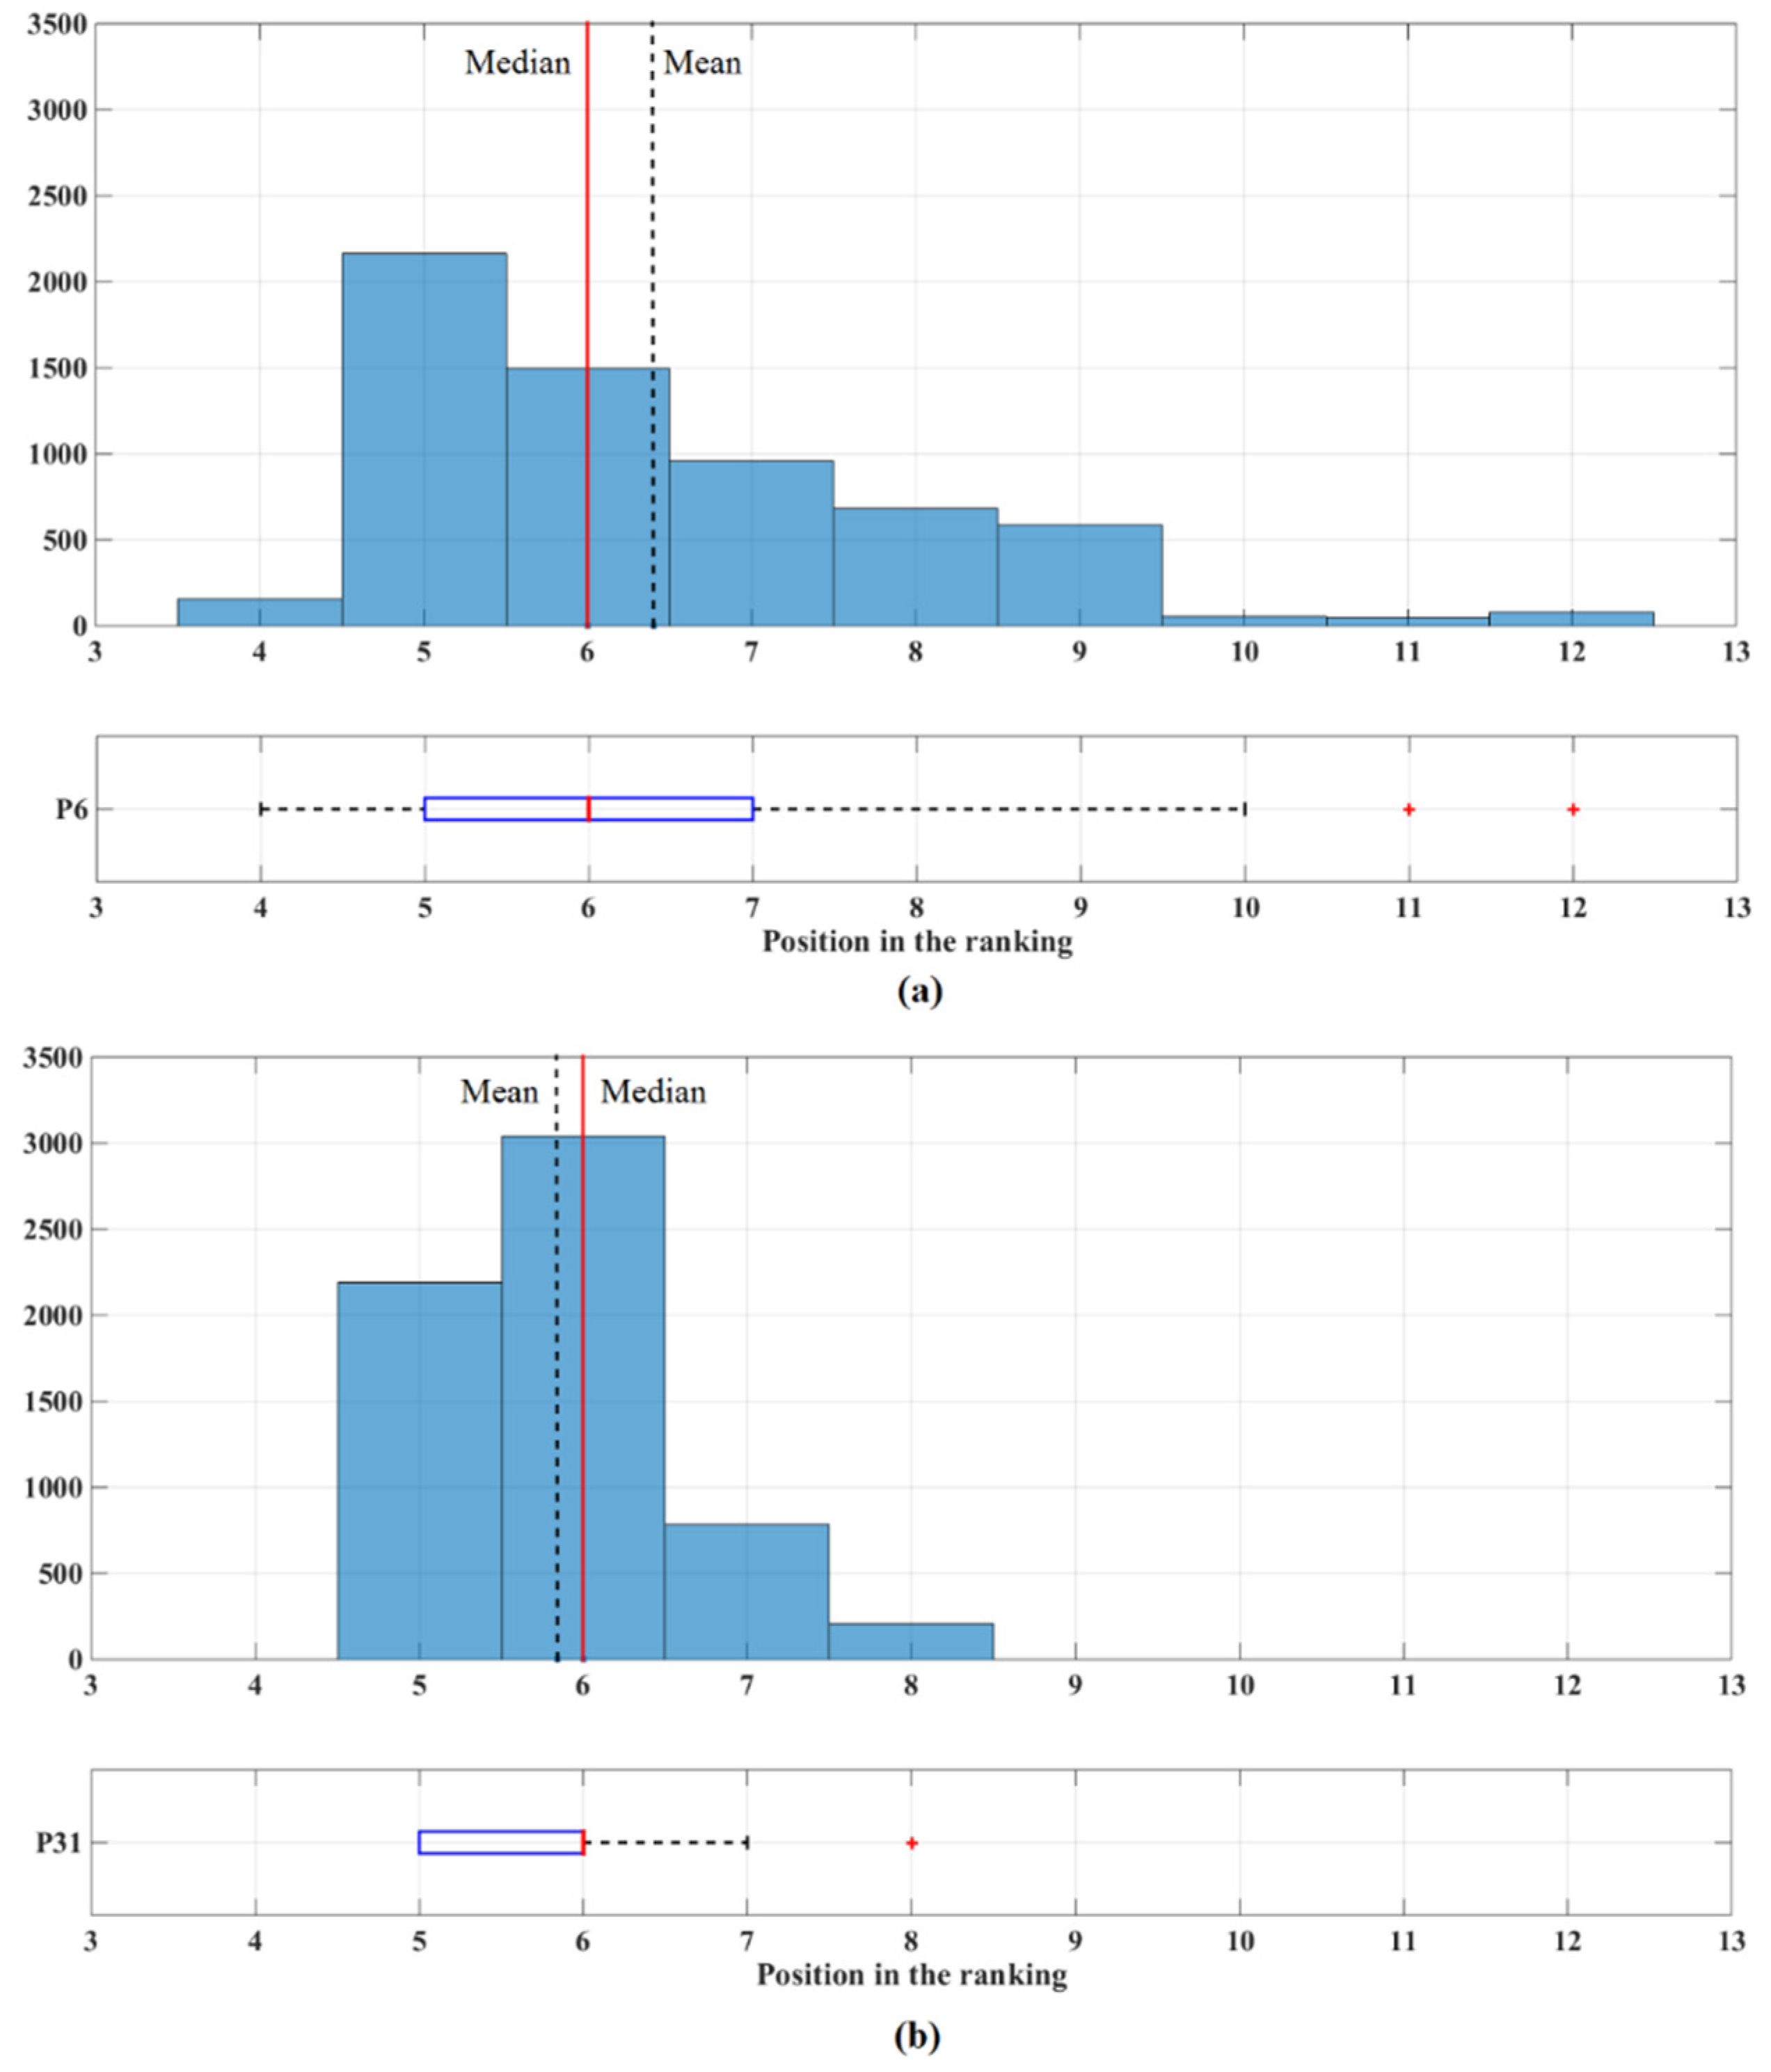
3.6. Statistical Analysis and Sensitivity Assessment of Outputs

By looking at the 6223 stored data of rankings, it was possible to identify the different positions occupied by each alternative and to begin the process of analysis and sensitivity assessment accordingly. Figure 4 shows the positions occupied by each alternative in 6223 repetitions of the decision-making problem.
As can be seen in Figure 4, by changing the attributes’ weights of importance, the ranking order of alternatives changed and the alternatives occupied different positions in the ranking. Considering that five benchmark platforms are needed in the definition of the problem, and to reduce the computational load, only the alternatives that at least once had occupied positions 1 to 5 were considered for further analysis (P6, P10, P15, P20, P25, P29, P30, P31, P33, and P34). Figure 5 illustrates the diversity of the order of these alternatives in the first five positions of the ranking order.
In Table 4, the frequency of occupation of each position in the ranking order is shown.
To make the most robust decision, the sensitivity of the positions occupied by the alternatives in the ranking should be analyzed. The abundance of positions is not necessarily a reliable criterion for making the most robust decision. The distribution parameters of the occupied positions and the occupation frequency of each position should determine the sensitivity of the position of an alternative in the ranking to changes in the relative importance of the attributes. The concept of standard deviation is a suitable criterion for analyzing the sensitivity of the occupied position of each alternative to the uncertainties of the relative importance of the attributes. Table 5 presents the statistical parameters related to the position of each alternative in the ranking.
Box diagrams better represent the diversity and distribution of occupied positions in the ranking. Figure 6 shows a diagram for each of the alternatives listed in Table 5.
In Figure 6, the black dots represent the mean position numbers occupied by each alternative. The red lines indicate the median value, the lower side of the blue boxes indicates the value of the first quadrant (Q1), and the upper side indicates the value of the third quadrant (Q3). Red plus signs indicate outliers. Horizontal black lines represent the minimum and maximum values, which are defined based on Equations (2) and (3), respectively.
M a x i m u m = Max p o s i t i o n n u m b e r if Max p o s i t i o n n u m b e r Q 3 + 1.5 × Q 3 Q 1 Q 3 + 1.5 × Q 3 Q 1 if Max p o s i t i o n n u m b e r > Q 3 + 1.5 × Q 3 Q 1
M i n i m u m = Min p o s i t i o n n u m b e r if Min p o s i t i o n n u m b e r > Q 1 1.5 × Q 3 Q 1 Q 1 1.5 × Q 3 Q 1 if Min p o s i t i o n n u m b e r Q 1 1.5 × Q 3 Q 1

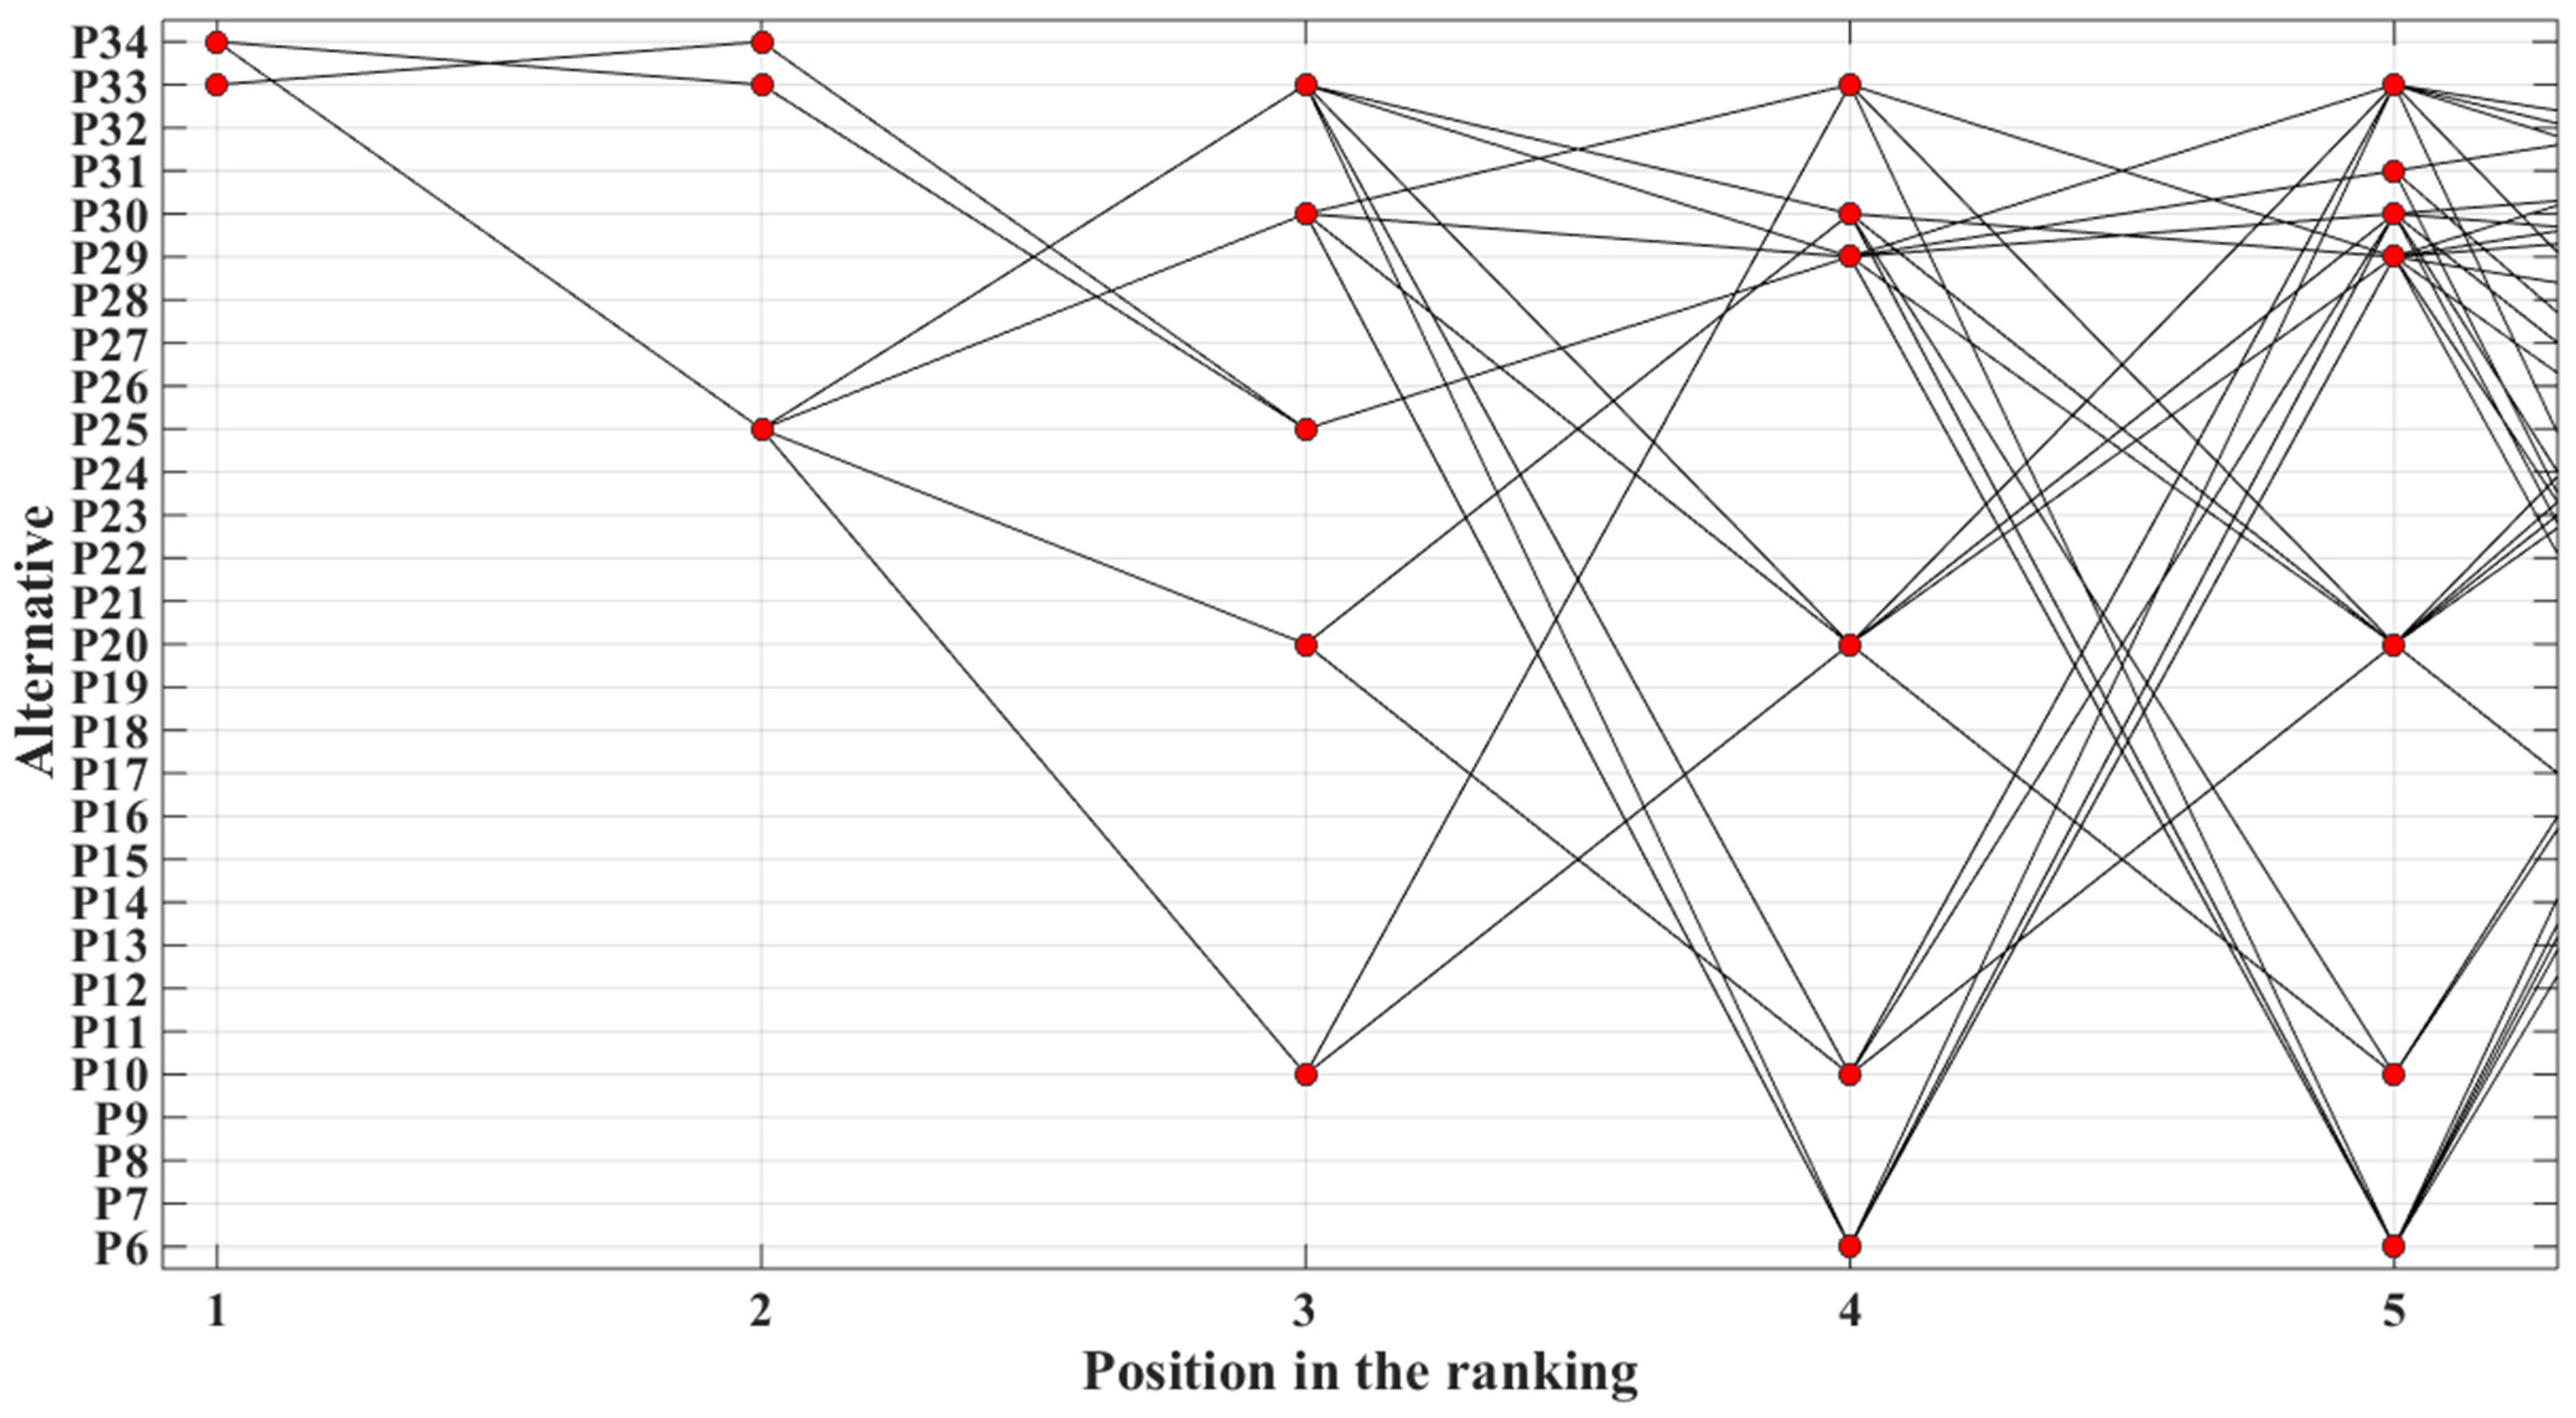
3.7. Identification of the Robust-Reliable Decision

In order to determine the most robust-reliable decision, two criteria were introduced:
1.
Achieving the best relative position (mean position number) in all rankings with the different relative importance of attributes (desirability criterion)
As there is a possibility of a change in the positions occupied by the alternatives for different attributes’ weights of importance—and, on the other hand, for two alternatives—the highest repetitions may occur for the same ranking positions, considering that the mean of the position numbers occupied by each alternative is a more reliable criterion for comparing the desirability of the alternatives.
2.
The lowest standard deviation in the occupied positions in the ranking (robustness criterion)
An alternative with a lower standard deviation indicates a higher focus on a given position in the ranking, which means it is more robust to changes in the relative importance of the attributes. In Table 6, the first five alternatives were selected based on each of the two criteria.
As seen in Table 6, the alternatives P34 and P25 in both criteria had a higher priority than the other alternatives. The P30 alternatives were in the third priority of desirability, while in terms of robustness, the alternative P29, which was in the fourth desirability priority, was better than the alternative P30, but this superiority was not enough to affect the final prioritization of the alternatives. The P30 alternative was 28% better than that of the P29 alternative in the desirability criterion, while the P29 alternative was only 2.6% better than that of the P30 alternative in the robustness criterion.
The most robust-reliable decisions on benchmark platforms to develop an automotive family according to the defined attributes that considered all possible stakeholders’ preferences can be seen in Table 7.
Finally, the most robust-reliable ranking order in the first five positions is obtained as shown in Figure 7.

4. Discussion

As seen in Table 5 and Table 6, the platforms P34 and P25 were significantly superior to the other alternatives, both in terms of the frequency of occupying a particular position and in terms of the standard deviation. As for the alternatives P29 and P30, from the desirability point of view, P30 had a superiority of almost 28% over P29. Meanwhile, in terms of robustness, the superiority of P29 over P30 was only 2.6%. The fifth priority for both criteria was P31. However, it was important to consider that, according to Table 4 and Table 5, alternative P31 occupied the sixth position in 48.8% of cases. As a result, position 6 was considered the position with the highest frequency for alternative P31. For the alternative P6, the fifth position was considered the position with the highest frequency (34.7%). In addition, alternative P31 ranked fifth in 35.2% of cases. In such circumstances, considering the most frequent position as a criterion for evaluating alternatives led to choosing alternative P6 as the fifth priority. Meanwhile, as shown in Figure 8, alternative P31 was on average better than alternative P6.
Finally, it can be concluded that to achieve a robust-reliable decision, all alternatives must be evaluated in all positions occupied, and in this evaluation, the standard deviation and the mean of position numbers occupied by each alternative are the main evaluation criteria.

5. Conclusions

A robust-reliable decision-making methodology was developed for selecting automotive platform benchmarks for the development of an automotive family in this study. There was a combination of techniques included in this methodology, each contributing to a specific part of the process of reaching a robust and reliable decision solution:
  • As the most widely used, reliable, and proven MADM method, the SAW decision-making method was used to reduce the level of computational complexity for problems containing a large number of decision options.
  • Building a database for the product and using KDD techniques instead of relying solely on the vague and uncertain statements of the experts, led to a precise determination of the attribute values and decision space. As a result, the level of uncertainty and lack of knowledge in decision-making processes were greatly reduced.
  • The simulation of the preferences of all stakeholders provided a comprehensive view of possible changes in the priority of alternatives over changes in the relative importance of attributes.
  • Statistical analysis and sensitivity assessment were used to determine which alternatives were the most robust and reliable.
This is the first time that this kind of methodology has been proposed, that integrates the SAW method as the evaluation core, the KDD technique to determine the value of attributes and the decision space, the probabilistic theory for simulating stakeholder preferences, and a statistical technique to determine the most robust-reliable alternatives in the decision space. Incorporation of these techniques into a methodology as an innovative concept simultaneously reduces uncertainty sources and manages unavoidable uncertainties to achieve a reliable and robust decision.
The presented methodology can be implemented in complex decision-making problems, including a large number of stakeholders and multiple attributes, particularly engineering product design problems.
The use of different MADM techniques, such as SAW, AHP, SWARA, and TOPSIS, and different normalization methods within this methodology can be evaluated.
As an immediate next step to improve the performance of the proposed methodology, real linguistic statements of stakeholders with different probability distribution functions will be used to simulate the relative importance of attributes.

Author Contributions

Conceptualization, A.S.; methodology, A.S.; software, S.R.; validation, M.H., A.S.; formal analysis, A.S.; data gathering, M.H.; writing—original draft preparation, A.S.; writing—review and editing, S.R.; visualization, A.S.; supervision, I.B.; funding acquisition, I.B. All authors have read and agreed to the published version of the manuscript.

Funding

This work was supported by: The Slovak Scientific Grand Agency VEGA under the contract 2/0135/23 “Intelligent sensor systems and data processing”. The National Scholarship Programme (NSP), administrated by the Slovak Academic Information Agency (SAIA). The Science Foundation Ireland Centre for Research Training in Artificial Intelligence under Grant No. 18/CRT/6223.

Data Availability Statement

Not applicable.

Conflicts of Interest

The authors declare no conflict of interest.

References

  1. Saghari, A.; Hosseinimehr, M.; Rahmani, S.; Budinská, I. Human Judgment Simulation and KDD Techniques in Automotive Platform Benchmark Selection. In Proceedings of the 2022 IEEE 20th Jubilee International Symposium on Intelligent Systems and Informatics (SISY), Subotica, Serbia, 15–17 September 2022; IEEE: Piscataway, NJ, USA; pp. 423–430. [Google Scholar]
  2. Xu, Z. Uncertain Multi-Attribute Decision Making: Methods and Applications; Springer: Berlin/Heidelberg, Germany, 2015. [Google Scholar]
  3. Vinogradova, I. Multi-attribute decision-making methods as a part of mathematical optimization. Mathematics 2019, 7, 915. [Google Scholar] [CrossRef] [Green Version]
  4. Azar, F.S. Multiattribute Decision-Making: Use of Three Scoring Methods to Compare the Performance of Imaging Techniques for Breast Cancer Detection; Technical Reports (CIS); Department of Computer & Information Science, University of Pennsylvania: Philadelphia, PA, USA, 2000. [Google Scholar]
  5. Akbaş, S.; Dalkiliç, T.E. A hybrid algorithm for portfolio selection: An application on the Dow Jones Index (DJI). J. Comput. Appl. Math. 2021, 398, 113678. [Google Scholar] [CrossRef]
  6. Hadikurniawati, W.; Wardoyo, R. A Hybrid Multi-Attribute Decision Making For Electrician Selection Based On Ahp, Saw And Topsis. J. Theor. Appl. Inf. Technol. 2015, 77, 136–142. [Google Scholar]
  7. Jiang, P.; Wang, Y.; Liu, C.; Hu, Y.-C.; Xie, J. Evaluating critical factors influencing the reliability of emergency logistics systems using multiple-attribute decision making. Symmetry 2020, 12, 1115. [Google Scholar] [CrossRef]
  8. Fraile, A.; Larrodé, E.; Magrenán, Á.A.; Sicilia, J.A. Decision model for siting transport and logistic facilities in urban environments: A methodological approach. J. Comput. Appl. Math. 2016, 291, 478–487. [Google Scholar] [CrossRef]
  9. Ziemba, P.; Gago, I. Uncertainty of Preferences in the Assessment of Supply Chain Management Systems Using the PROMETHEE Method. Symmetry 2022, 14, 1043. [Google Scholar] [CrossRef]
  10. Akcan, S.; Güldeş, M. Integrated multicriteria decision-making methods to solve supplier selection problem: A case study in a hospital. J. Healthc. Eng. 2019, 2019, 5614892. [Google Scholar] [CrossRef] [Green Version]
  11. Naeem, K.; Divvaz, B. Information measures for MADM under m-polar neutrosophic environment. Granul. Comput. 2022, 8, 1–20. [Google Scholar] [CrossRef]
  12. Adriyendi, A.; Melia, Y. Multi-Attribute Decision Making using Hybrid Approach based on Benefit-Cost Model for Sustainable Fashion. Int. J. Adv. Data Inf. Syst. 2021, 2, 9–24. [Google Scholar] [CrossRef]
  13. Dhiman, H.S.; Deb, D.; Muresan, V.; Unguresan, M.-L. Multi-criteria decision making approach for hybrid operation of wind farms. Symmetry 2019, 11, 675. [Google Scholar] [CrossRef] [Green Version]
  14. Zavadskas, E.K.; Pamučar, D.; Stević, Ž.; Mardani, A. Multi-Criteria Decision-Making Techniques for Improvement Sustainability Engineering Processes. Symmetry 2020, 12, 986. [Google Scholar] [CrossRef]
  15. Saghari, A.; Mahrooz, M.H.; Rahmani, S. Optimal Decision Making for Orbit Transfer System of A Student Micro-Satellite, Using Multi-Criteria Decision Making. In Proceedings of the 2015 IEEE International Symposium on Systems Engineering (ISSE), Rome, Italy, 28–30 September 2015; IEEE: Piscataway, NJ, USA; pp. 29–33. [Google Scholar]
  16. Lafleur, J.M. Probabilistic AHP and TOPSIS for Multi-Attribute Decision-Making Under Uncertainty. In Proceedings of the 2011 Aerospace Conference, Big Sky, MT, USA, 5–12 March 2011; IEEE: Piscataway, NJ, USA; pp. 1–18. [Google Scholar]
  17. Saghari, A.; Kosari, A.; Sellgren, U.; Ebrahimi, M. Utilizing the uncertainty-based MADM-optimization approach to find robust-reliable design parameters for a platform-based product by considering aleatory uncertainties and human judgment effect. Res. Eng. Des. 2021, 32, 105–126. [Google Scholar] [CrossRef]
  18. Ardeshir, A.; Mohseni, N.; Behzadian, K.; Errington, M. Selection of a bridge construction site using fuzzy analytical hierarchy process in geographic information system. Arab. J. Sci. Eng. 2014, 39, 4405–4420. [Google Scholar] [CrossRef]
  19. Ulkhaq, M.M.; Wijayanti, W.R.; Zain, M.S.; Baskara, E.; Leonita, W. Combining the AHP and TOPSIS to Evaluate Car Selection. In Proceedings of the 2nd International Conference on High Performance Compilation, Computing and Communications, Hong Kong, 15–17 March 2018; pp. 112–117. [Google Scholar]
  20. Sakthivel, G.; Ilangkumaran, M.; Nagarajan, G.; Raja, A.; Ragunadhan, P.; Prakash, J. A hybrid MCDM approach for evaluating an automobile purchase model. Int. J. Inf. Decis. Sci. 2013, 5, 50–85. [Google Scholar] [CrossRef]
  21. Renzi, C.; Leali, F.; Di Angelo, L. A review on decision-making methods in engineering design for the automotive industry. J. Eng. Des. 2017, 28, 118–143. [Google Scholar] [CrossRef]
  22. Jamil, N.; Besar, R.; Sim, H. A study of multicriteria decision making for supplier selection in automotive industry. J. Ind. Eng. 2013, 2013, 841584. [Google Scholar] [CrossRef]
  23. Castro, D.M.; Parreiras, F.S. A review on multi-criteria decision-making for energy efficiency in automotive engineering. Appl. Comput. Inform. 2020, 17, 53–78. [Google Scholar] [CrossRef]
  24. Yousefi, A.; Hadi-Vencheh, A. An integrated group decision making model and its evaluation by DEA for automobile industry. Expert Syst. Appl. 2010, 37, 8543–8556. [Google Scholar] [CrossRef]
  25. Pu, Y.; Ma, F.; Han, L.; Wang, G. Material selection of green design processes for car body via considering environment property. Math. Probl. Eng. 2020, 2020, 9241634. [Google Scholar] [CrossRef] [Green Version]
  26. Shahanaghi, K.; Yavarian, H. MODM-MCDM Approach to Partner Selection in Auto Industry: A Case Study on Mazda of Iran. Int. J. Bus. Manag. 2010, 5, 183. [Google Scholar] [CrossRef] [Green Version]
  27. Mohan, R.; Sharma, L.K. Multi Criteria Decision Making in Automobile Sector. Int. J. Mech. Eng. Inf. Technol. 2014, 2, 532–549. [Google Scholar]
  28. Yildiz, A.; Ergul, E.U. Usage of Fuzzy Multi-criteria decision making method to solve the automobile selection problem. J. Eng. Fundam. 2014, 1, 1–10. [Google Scholar] [CrossRef]
  29. Nguyen, P.-H. Investigating car purchasing decision-making process using Multi-Objective Optimization Ratio Analysis based Analytical Hierarchy Process Model: An empirical case from Vietnam. J. Contemp. Issues Bus. Gov. 2021, 27, 532–549. [Google Scholar]
  30. Raut, R.D.; Bhasin, H.V.; Kamble, S.S. Multi-criteria decision-making for automobile purchase using an integrated analytical quality fuzzy (AQF) technique. Int. J. Serv. Oper. Manag. 2011, 10, 136–167. [Google Scholar] [CrossRef]
  31. Rao, R.V. Decision Making in the Manufacturing Environment: Using Graph Theory and Fuzzy Multiple Attribute Decision Making Methods; Springer: Berlin/Heidelberg, Germany, 2007. [Google Scholar]
  32. Penadés-Plà, V.; García-Segura, T.; Martí, J.V.; Yepes, V. A review of multi-criteria decision-making methods applied to the sustainable bridge design. Sustainability 2016, 8, 1295. [Google Scholar] [CrossRef] [Green Version]
  33. Taherdoost, H.; Madanchian, M. Multi-Criteria Decision Making (MCDM) Methods and Concepts. Encyclopedia 2023, 3, 77–87. [Google Scholar] [CrossRef]
  34. Aruldoss, M.; Lakshmi, T.M.; Venkatesan, V.P. A survey on multi criteria decision making methods and its applications. Am. J. Inf. Syst. 2013, 1, 31–43. [Google Scholar]
  35. Hwang, C.; Yoon, K. Multi-Objective Decision Making–Methods and Application; A state-of-the-art study; ed: Springer: New York, NY, USA, 1981. [Google Scholar]
  36. Triantaphyllou, E. Multi-criteria decision making methods. In Multi-Criteria Decision Making Methods: A Comparative Study; Springer: Berlin/Heidelberg, Germany, 2000; pp. 5–21. [Google Scholar]
  37. Benítez, J.; Delgado-Galván, X.; Izquierdo, J.; Pérez-García, R. Consistent completion of incomplete judgments in decision making using AHP. J. Comput. Appl. Math. 2015, 290, 412–422. [Google Scholar] [CrossRef]
  38. Matić, B.; Jovanović, S.; Das, D.K.; Zavadskas, E.K.; Stević, Ž; Sremac, S.; Marinković, M. A new hybrid MCDM model: Sustainable supplier selection in a construction company. Symmetry 2019, 11, 353. [Google Scholar] [CrossRef] [Green Version]
  39. Singh, A.; Malik, S.K. Major MCDM Techniques and their application-A Review. IOSR J. Eng. 2014, 4, 15–25. [Google Scholar] [CrossRef]
  40. Keshavarz-Ghorabaee, M.; Amiri, M.; Zavadskas, E.K.; Turskis, Z.; Antucheviciene, J. Determination of objective weights using a new method based on the removal effects of criteria (MEREC). Symmetry 2021, 13, 525. [Google Scholar] [CrossRef]
  41. de Hierro, A.R.L.; Sánchez, M.; Roldán, C. Multi-criteria decision making involving uncertain information via fuzzy ranking and fuzzy aggregation functions. J. Comput. Appl. Math. 2022, 404, 113138. [Google Scholar] [CrossRef]
  42. Khan, A.A.; Abdullah, S.; Shakeel, M.; Khan, F.; Amin, N.U.; Luo, J. A new ranking methodology for Pythagorean trapezoidal uncertain linguistic fuzzy sets based on Einstein operations. Symmetry 2019, 11, 440. [Google Scholar] [CrossRef] [Green Version]
  43. Mo, H. An emergency decision-making method for probabilistic linguistic term sets extended by D number theory. Symmetry 2020, 12, 380. [Google Scholar] [CrossRef] [Green Version]
  44. Xu, L.; Yang, J.-B. Introduction to Multi-Criteria Decision Making and the Evidential Reasoning Approach; Manchester School of Management Manchester: Manchester, UK, 2001. [Google Scholar]
  45. Butler, J.; Jia, J.; Dyer, J. Simulation techniques for the sensitivity analysis of multi-criteria decision models. Eur. J. Oper. Res. 1997, 103, 531–546. [Google Scholar] [CrossRef]
  46. Xu, H.; Chen, L.; Li, Q.; Yang, J. A Multi-Attribute Decision Method under Uncertainty Environment Conditions—The Green Supplier Evaluation Perspective. Int. J. Environ. Res. Public Health 2021, 18, 344. [Google Scholar] [CrossRef]
  47. Akram, M.; Al-Kenani, A.N.; Alcantud, J.C.R. Group decision-making based on the VIKOR method with trapezoidal bipolar fuzzy information. Symmetry 2019, 11, 1313. [Google Scholar]
  48. Huynh, V.-N.; Nakamori, Y.; Ho, T.-B.; Murai, T. Multiple-attribute decision making under uncertainty: The evidential reasoning approach revisited. IEEE Trans. Syst. Man Cybern. Part A Syst. Hum. 2006, 36, 804–822. [Google Scholar]
  49. Yua, B.; Xub, Z.; Daia, J.; Yanga, T. A novel multi-attribute decision-making method based on neighborhood approximations and its application. Expert Syst. Appl. 2022, 199, 116946. [Google Scholar] [CrossRef]
  50. Jiang, H.; Hu, B.Q. A decision-theoretic fuzzy rough set in hesitant fuzzy information systems and its application in multi-attribute decision-making. Inf. Sci. 2021, 579, 103–127. [Google Scholar] [CrossRef]
  51. Wang, P.; Chen, J. A Large Group Emergency Decision Making Method Considering Scenarios and Unknown Attribute Weights. Symmetry 2023, 15, 223. [Google Scholar] [CrossRef]
  52. Alkan, R.; Yucesan, M.; Gul, M. A Multi-attribute Decision-Making to Sustainable Construction Material Selection: A Bayesian BWM-SAW Hybrid Model. In Advances in Best-Worst Method: Proceedings of the Second International Workshop on Best-Worst Method (BWM2021); Springer: Berlin/Heidelberg, Germany, 2022; pp. 67–78. [Google Scholar]
  53. Darko, A.P.; Liang, D.; Xu, Z.; Agbodah, K.; Obiora, S. A novel multi-attribute decision-making for ranking mobile payment services using online consumer reviews. Expert Syst. Appl. 2023, 213, 119262. [Google Scholar] [CrossRef]
  54. Akram, M.; Ramzan, N.; Deveci, M. Linguistic Pythagorean fuzzy CRITIC-EDAS method for multiple-attribute group decision analysis. Eng. Appl. Artif. Intell. 2023, 119, 105777. [Google Scholar] [CrossRef]
  55. Wu, Z.; Zhang, S.; Liu, X.; Wu, J. Best-worst multi-attribute decision making method based on new possibility degree with probabilistic linguistic information. IEEE Access 2019, 7, 133900–133913. [Google Scholar] [CrossRef]
  56. Wu, H.; Xu, Z. Cognitively Inspired Multi-attribute Decision-making Methods Under Uncertainty: A State-of-the-art Survey. Cogn. Comput. 2022, 14, 511–530. [Google Scholar] [CrossRef]
  57. Piasecki, K.; Roszkowska, E.; Łyczkowska-Hanćkowiak, A. Impact of the Orientation of the Ordered Fuzzy Assessment on the Simple Additive Weighted Method. Symmetry 2019, 11, 1104. [Google Scholar] [CrossRef] [Green Version]
  58. Dhankhar, C.; Kumar, K. Multi-attribute decision-making based on the advanced possibility degree measure of intuitionistic fuzzy numbers. Granul. Comput. 2022, 1–12. [Google Scholar] [CrossRef]
  59. Xu, W.; Shang, X.; Wang, J.; Xu, Y. Multi-attribute decision-making based on interval-valued q-rung dual hesitant uncertain linguistic sets. IEEE Access 2020, 8, 26792–26813. [Google Scholar] [CrossRef]
  60. Song, H.; Chen, Z.-C. Multi-attribute decision-making method based distance and COPRAS method with probabilistic hesitant fuzzy environment. Int. J. Comput. Intell. Syst. 2021, 14, 1229–1241. [Google Scholar] [CrossRef]
  61. Zavadskas, E.K.; Kaklauskas, A.; Turskis, Z.; Tamošaitienė, J. Multi-attribute decision-making model by applying grey numbers. Informatica 2009, 20, 305–320. [Google Scholar] [CrossRef]
  62. De, A.; Das, S.; Kar, S. Multiple attribute decision making based on probabilistic interval-valued intuitionistic hesitant fuzzy set and extended TOPSIS method. J. Intell. Fuzzy Syst. 2019, 37, 5229–5248. [Google Scholar] [CrossRef]
  63. Zhang, J.; Hong, Y.; Qi, X.; Liang, C. Probabilistic hybrid linguistic approaches for multiple attribute group decision making with decision hesitancy and the prioritization of attribute relationships. Symmetry 2020, 12, 235. [Google Scholar] [CrossRef] [Green Version]
  64. Peng, L.; Zhou, X.; Zhao, J.; Sun, Y.; Li, H. Three-way multi-attribute decision making under incomplete mixed environments using probabilistic similarity. Inf. Sci. 2022, 614, 432–463. [Google Scholar] [CrossRef]
  65. Zavadskas, E.K.; Turskis, Z.; Dejus, T.; Viteikiene, M. Sensitivity analysis of a simple additive weight method. Int. J. Manag. Decis. Mak. 2007, 8, 555–574. [Google Scholar] [CrossRef]
  66. Goodridge, W.S. Sensitivity analysis using simple additive weighting method. Int. J. Intell. Syst. Appl. 2016, 8, 27. [Google Scholar] [CrossRef] [Green Version]
  67. Memariani, A.; Amini, A.; Alinezhad, A. Sensitivity analysis of simple additive weighting method (SAW): The results of change in the weight of one attribute on the final ranking of alternatives. J. Optim. Ind. Eng. 2009, 2, 13–18. [Google Scholar]
  68. Jiménez, A.; Ríos-Insua, S.; Mateos, A. Monte-Carlo simulation techniques in a multi-attribute decision support system. In Proceedings of the 12th IASTED International Conference on Applied Simulation and Modelling; ACTA Press: Calgary, AB, Canada, 2003; pp. 85–90. [Google Scholar]
  69. Bertsch, V.; Geldermann, J.; Rentz, O. Multidimensional monte carlo sensitivity analysis in multi-criteria decision support. IFAC Proc. Vol. 2006, 39, 141–146. [Google Scholar] [CrossRef]
  70. Bayram, H.; Şahin, R. A simulation based multi-attribute group decision making technique with decision constraints. Appl. Soft Comput. 2016, 49, 629–640. [Google Scholar] [CrossRef]
  71. Tervonen, T.; Figueira, J.R.; Lahdelma, R.; Dias, J.A.; Salminen, P. A stochastic method for robustness analysis in sorting problems. Eur. J. Oper. Res. 2009, 192, 236–242. [Google Scholar] [CrossRef]
  72. Mateos, A.; Jiménez, A.; Ríos-Insua, S. Monte Carlo simulation techniques for group decision making with incomplete information. Eur. J. Oper. Res. 2006, 174, 1842–1864. [Google Scholar] [CrossRef]
  73. Dudas, C.; Ng, A.; Boström, H. Knowledge Extraction in Manufacturing using Data Mining Techniques. In Proceedings of the Swedish Production Symposium 2008, Stockholm, Sweden, 18–20 November 2008; p. 8. [Google Scholar]
  74. Lucio, S. Generating construction knowledge with knowledge discovery in databases. Comput. Civ. Build. Eng. 2000, 2, 914–921. [Google Scholar]
  75. Sari, Y.D.; Zarlis, M. Data-driven Modelling for decision making under uncertainty. In Proceedings of the IOP Conference Series: Materials Science and Engineering, Medan, Indonesia, 21–23 August 2017; IOP Publishing: Bristol, UK; Volume 300, p. 12013. [Google Scholar]
  76. Fayyad, U.M.; Piatetsky-Shapiro, G.; Smyth, P. Knowledge Discovery and Data Mining: Towards a Unifying Framework. KDD 1996, 96, 82–88. [Google Scholar]
  77. Gullo, F. From patterns in data to knowledge discovery: What data mining can do. Phys. Procedia 2015, 62, 18–22. [Google Scholar] [CrossRef] [Green Version]
  78. Liou, J.J.; Chuang, Y.-C.; Zavadskas, E.K.; Tzeng, G.-H. Data-driven hybrid multiple attribute decision-making model for green supplier evaluation and performance improvement. J. Clean. Prod. 2019, 241, 118321. [Google Scholar] [CrossRef]
  79. Ltifi, H.; Kolski, C.; Ayed, M.B.; Alimi, A.M. A human-centred design approach for developing dynamic decision support system based on knowledge discovery in databases. J. Decis. Syst. 2013, 22, 69–96. [Google Scholar] [CrossRef]
  80. Mosavi, A. Multiple criteria decision-making preprocessing using data mining tools. arXiv 2010, arXiv:1004.3258. [Google Scholar]
  81. Podvezko, V. The comparative analysis of MCDA methods SAW and COPRAS. Eng. Econ. 2011, 22, 134–146. [Google Scholar] [CrossRef] [Green Version]
  82. Piasecki, K.; Roszkowska, E.; Łyczkowska-Hanćkowiak, A. Simple additive weighting method equipped with fuzzy ranking of evaluated alternatives. Symmetry 2019, 11, 482. [Google Scholar] [CrossRef] [Green Version]
  83. Chakraborty, S.; Yeh, C.-H. Rank similarity based MADM method selection. In Proceedings of the 2012 International Conference on Statistics in Science, Business and Engineering (ICSSBE), Langkawi, Malaysia, 10–12 September 2012; IEEE: Piscataway, NJ, USA; pp. 1–6. [Google Scholar]
  84. Vafaei, N.; Ribeiro, R.; Camarinha-Matos, L.M. Importance of data normalization in decision making: Case study with TOPSIS method. In Proceedings of the ICDSST 2015 Proceedings—The 1st International Conference on Decision Support Systems Technologies, An EWG-DSS Conference. Theme: Big Data Analytics for Decision-Making, Belgrade, Serbia, 27–29 May 2015; pp. 27–29. [Google Scholar]
  85. Vafaei, N.; Ribeiro, R.A.; Camarinha-Matos, L.M. Normalization techniques for multi-criteria decision making: Analytical hierarchy process case study. In Doctoral Conference on Computing, Electrical and Industrial Systems; Springer: Berlin/Heidelberg, Germany, 2016; pp. 261–269. [Google Scholar]
  86. Vafaei, N.; Ribeiro, R.A.; Camarinha-Matos, L.M. Selecting normalization techniques for the analytical hierarchy process. In Doctoral Conference on Computing, Electrical and Industrial Systems; Springer: Berlin/Heidelberg, Germany, 2020; pp. 43–52. [Google Scholar]
  87. Chakraborty, S.; Yeh, C.-H. A simulation based comparative study of normalization procedures in multiattribute decision making. In Proceedings of the 6th Conference on 6th WSEAS Int. Conf. on Artificial Intelligence, Knowledge Engineering and Data Bases, Corfu Island, Greece, 16–19 February 2007; Volume 6, pp. 102–109. [Google Scholar]
  88. Saaty, T.L. Priority setting in complex problems. IEEE Trans. Eng. Manag. 1983, 3, 140–155. [Google Scholar] [CrossRef]
Figure 1. Flowchart of the proposed method.
Symmetry 15 00750 g001
Figure 2. Hierarchical system for the MADM problem.
Symmetry 15 00750 g002
Figure 3. The normalized values of the simulated weights of importance.
Symmetry 15 00750 g003
Figure 4. Each alternative’s position in ranking after solving the decision-making problem 6223 times.
Symmetry 15 00750 g004
Figure 5. Variation in the order of alternatives in the first five positions of ranking order.
Symmetry 15 00750 g005
Figure 6. Box diagram of the positions occupied by the alternatives in 6223 solutions of the decision problem.
Symmetry 15 00750 g006
Figure 7. The most robust-reliable ranking order in the first five positions.
Symmetry 15 00750 g007
Figure 8. Statistical comparison of (a) alternative P6 and (b) alternative P31.
Symmetry 15 00750 g008
Table 1. Values of each attribute/sub-attribute for 34 alternative platforms.
Alternative NumberPlatform NameSegment AdaptationPrice (USD)Platform FlexibilityPlatform Popularity
Minimum PricePrice RangeSegment ScoreModel ScoreAnnual ProductionNumber of Manufacturers
P1BMW CLAR8239,587147,152613686,6062
P2BMW Life-Drive4241,508121,7922231,2581
P3BMW UKL9020,02679,872413680,4653
P4Fiat Compact10816,11038,51157329,7595
P5Fiat Mini40883917,01225548,9693
P6Fiat-GM Small12011,25637,080618914,1525
P7Ford Global B6512,26021,89338760,2701
P8Ford Global C6518,45533,582381,475,4092
P9Ford C25024,88519,94524321,1962
P10GM Delta8316,13759,1504231,457,5516
P11GM Epsilon6521,54851,218520748,9077
P12GM Gamma105975820,146511941,5423
P13GM Lambda3329,37118,91924240,1384
P14GM Theta3317,12238,056210341,4238
P15Hyundai-Kia J6513,64274,7903272,196,5392
P16Hyundai-Kia Small9012,77123,1394181,127,8522
P17Hyundai-Kia Y7519,14639,4055171,385,1952
P18Mercedes-Benz MFA5030,22844,20723472,0361
P19Mercedes-Benz W1765025,25042,88324226,9432
P20Mitsubishi GS9114,92543,940521798,6888
P21PSA CMP EMP15020,88821,68324295,4873
P22PSA EMP28323,80347,552417805,2995
P23PSA PF19010,04022,624416994,9223
P24PSA PF210014,68932,478521760,7774
P25Renault-Nissan B122891935,3256482,372,8226
P26Renault-Nissan C6511,61429,373316976,1264
P27Renault-Nissan CMF11616,76031,5996151,294,8092
P28Toyota B8310,77418,851416858,8572
P29Toyota MC11616,86446,5706231,959,9533
P30Toyota TNGA12519,60038,5287152,029,5593
P31VW A10713,52538,9885291,643,2904
P32VW A090931029,3894261,227,1475
P33VW MLB6528,843267,499521936,2485
P34VW MQB13318,74559,1127413,253,2745
Table 2. The most widely used normalization methods in MADM.
Normalization MethodsEquation
Max (Linear normalization) V i j N o r m a l i z e d = V i j M a x V i (for Benefit)
V i j N o r m a l i z e d = 1 V i j M a x V i (for Cost)
Max-Min (Linear normalization) V i j N o r m a l i z e d = V i j M i n V i M a x V i M i n V i (for Benefit)
V i j N o r m a l i z e d = M a x V i V i j M a x V i M i n V i (for Cost)
Sum (Linear normalization) V i j N o r m a l i z e d = V i j j = 1 n V i j (for Benefit)
V i j N o r m a l i z e d = 1 V i j j = 1 n 1 V i j (for Cost)
Vector normalization V i j N o r m a l i z e d = V i j j = 1 n V i j 2 (for Benefit)
V i j N o r m a l i z e d = 1 V i j j = 1 n V i j 2 (for Cost)
Logarithmic normalization V i j N o r m a l i z e d = ln V i j ln j = 1 n V i j (for Benefit)
V i j N o r m a l i z e d = 1 ln V i j ln j = 1 n V i j n 1 (for Cost)
Table 3. Normalized values of each attribute/sub-attribute for 34 alternative platforms.
Alternative NumberPlatform NameSegment AdaptationPricePlatform FlexibilityPlatform Popularity
Minimum PricePrice RangeSegment ScoreModel ScoreAnnual ProductionNumber of Manufacturers
P1BMW CLAR0.16460.66280.36950.23390.11720.09460.0841
P2BMW Life-Drive0.08430.64650.30580.0780.0180.00430.0421
P3BMW UKL0.18060.82940.20060.15590.11720.09380.1262
P4Fiat Compact0.21680.86280.09670.19490.06310.04540.2104
P5Fiat Mini0.08030.92470.04270.0780.04510.07570.1262
P6Fiat-GM Small0.24090.90410.09310.23390.16230.1260.2104
P7Ford Global B0.13050.89560.0550.1170.07220.10480.0421
P8Ford Global C0.13050.84280.08430.1170.07220.20340.0841
P9Ford C20.10040.7880.05010.0780.03610.04430.0841
P10GM Delta0.16660.86260.14850.15590.20740.20090.2524
P11GM Epsilon0.13050.81650.12860.19490.18040.10320.2945
P12GM Gamma0.21070.91690.05060.19490.09920.12980.1262
P13GM Lambda0.06620.74980.04750.0780.03610.03310.1683
P14GM Theta0.06620.85420.09560.0780.09020.04710.3366
P15Hyundai-Kia J0.13050.88380.18780.1170.24350.30270.0841
P16Hyundai-Kia Small0.18060.89120.05810.15590.16230.15540.0841
P17Hyundai-Kia Y0.15050.83690.09890.19490.15330.19090.0841
P18Mercedes-Benz MFA0.10040.74250.1110.0780.02710.06510.0421
P19Mercedes-Benz W1760.10040.78490.10770.0780.03610.03130.0841
P20Mitsubishi GS0.18260.87290.11030.19490.18940.11010.3366
P21PSA CMP EMP10.10040.82210.05440.0780.03610.04070.1262
P22PSA EMP20.16660.79730.11940.15590.15330.1110.2104
P23PSA PF10.18060.91450.05680.15590.14430.13710.1262
P24PSA PF20.20070.87490.08160.19490.18940.10490.1683
P25Renault-Nissan B0.24490.9240.08870.23390.43290.3270.2524
P26Renault-Nissan C0.13050.90110.07380.1170.14430.13450.1683
P27Renault-Nissan CMF0.23280.85720.07930.23390.13530.17850.0841
P28Toyota B0.16660.90820.04730.15590.14430.11840.0841
P29Toyota MC0.23280.85640.11690.23390.20740.27010.1262
P30Toyota TNGA0.25090.83310.09670.27290.13530.27970.1262
P31VW A0.21480.88480.09790.19490.26150.22650.1683
P32VW A00.18060.92070.07380.15590.23450.16910.2104
P33VW MLB0.13050.75430.67170.19490.18940.1290.2104
P34VW MQB0.26690.84030.14840.27290.36980.44840.2104
Table 4. The position occupied by each alternative and the frequency of its occurrence.
Alt. No.P6P10P31P20P25P29P30P33P34
Position in Ranking
Rank 10000000166207
Rank 200061970001016
Rank 302580260549905930
Rank 41601042100520744201000
Rank 52162104528072616221903510
Rank 6149817195501849630391990
Rank 795849721420106177845770
Rank 8685170115240052108750
Rank 9584160660300209320
Rank 10526167500004920
Rank 11461758800006350
Rank 12783191800004550
Rank 130387000002410
Rank 140384000003770
Rank 150134000001850
Rank 160000000430
Rank 170000000570
Rank 180000000450
Rank 190000000200
Rank 20000000080
Rank 210000000120
Rank 22000000000
Rank 23000000000
Rank 24000000000
Rank 25000000000
Rank 26000000000
Rank 27000000000
Rank 28000000000
Rank 29000000000
Rank 30000000000
Rank 31000000000
Rank 32000000000
Rank 33000000000
Rank 34000000000
Table 5. Statistical status of the alternatives in the ranking.
Alt. No.The Most Frequented Occupied Position in the Ranking (Mode)The Percentage of Maximum Repetition in the RankingThe Mean Value of Occupied Positions in the Ranking (Mean Rank Number)The Number of Occupied Positions in the RankingThe Standard Deviation of Occupied Positions in the Ranking
P6Rank 534.70%6.40239 positions1.5801
P10Rank 827.30%9.305413 positions2.3584
P20Rank 734.40%7.0710 positions1.4271
P25Rank 299.50%2.00422 positions0.0645
P29Rank 483.70%4.22694 positions0.5803
P30Rank 388.40%3.18627 positions0.5955
P31Rank 648.80%5.84154 positions0.7667
P33Rank 915%9.063321 positions3.5196
P34Rank 199.70%1.00262 positions0.0506
Table 6. Prioritization of alternatives based on the two criteria of desirability and robustness.
Prioritization Based on the DesirabilityPrioritization Based on the Robustness
Prioritized AlternativesAlt. No.Mean Position in the RankingPrioritized AlternativesAlt. No.The Standard Deviation of Occupied Positions
The first
(The most desirable)
P341.0026The first
(The most robust)
P340.05064086
The secondP252.0042The secondP250.06450266
The thirdP303.1862The thirdP290.58030464
The fourthP294.2269The fourthP300.59554597
The fifthP315.8416The fifthP310.76667009
Table 7. The most robust-reliable decision in choosing the benchmark platforms.
Prioritized AlternativesAlt. No.Platform Name
The first
(The most robust-reliable decision)
P34VW MQB
The secondP25Renault-Nissan B
The thirdP30Toyota TNGA
The fourthP29Toyota MC
The fifthP31VW A
Disclaimer/Publisher’s Note: The statements, opinions and data contained in all publications are solely those of the individual author(s) and contributor(s) and not of MDPI and/or the editor(s). MDPI and/or the editor(s) disclaim responsibility for any injury to people or property resulting from any ideas, methods, instructions or products referred to in the content.

