
Modeling and Performance Analysis of Municipal Solid Waste Treatment in Plasma Torch Reactor

Abstract
:1. Introduction
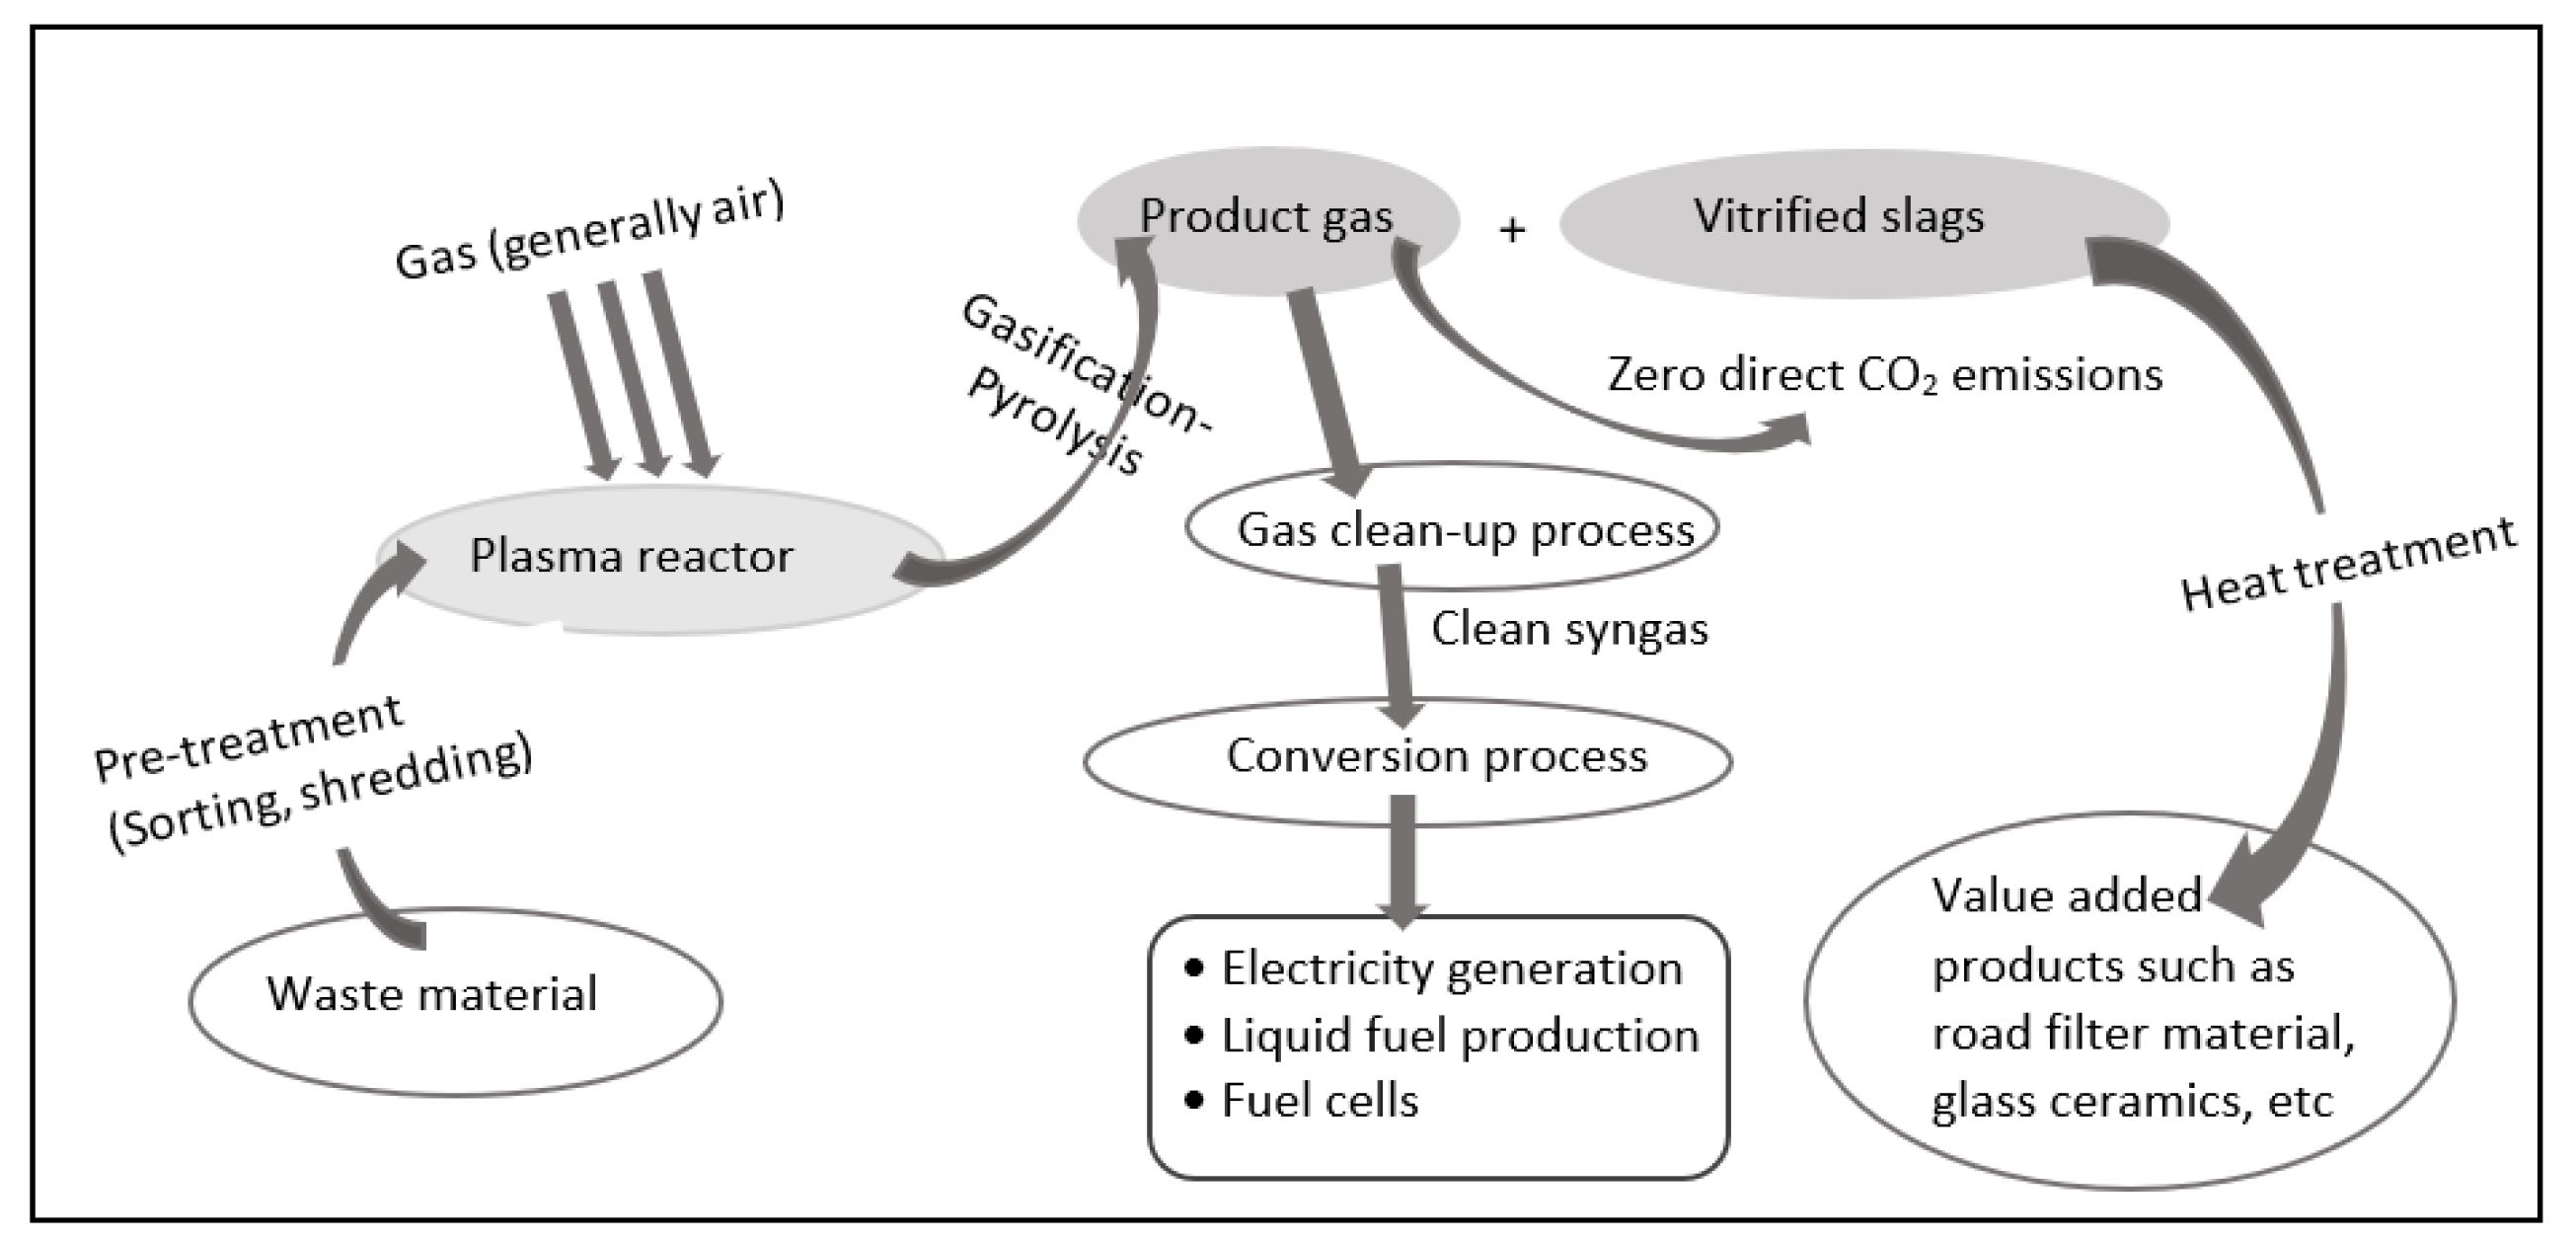
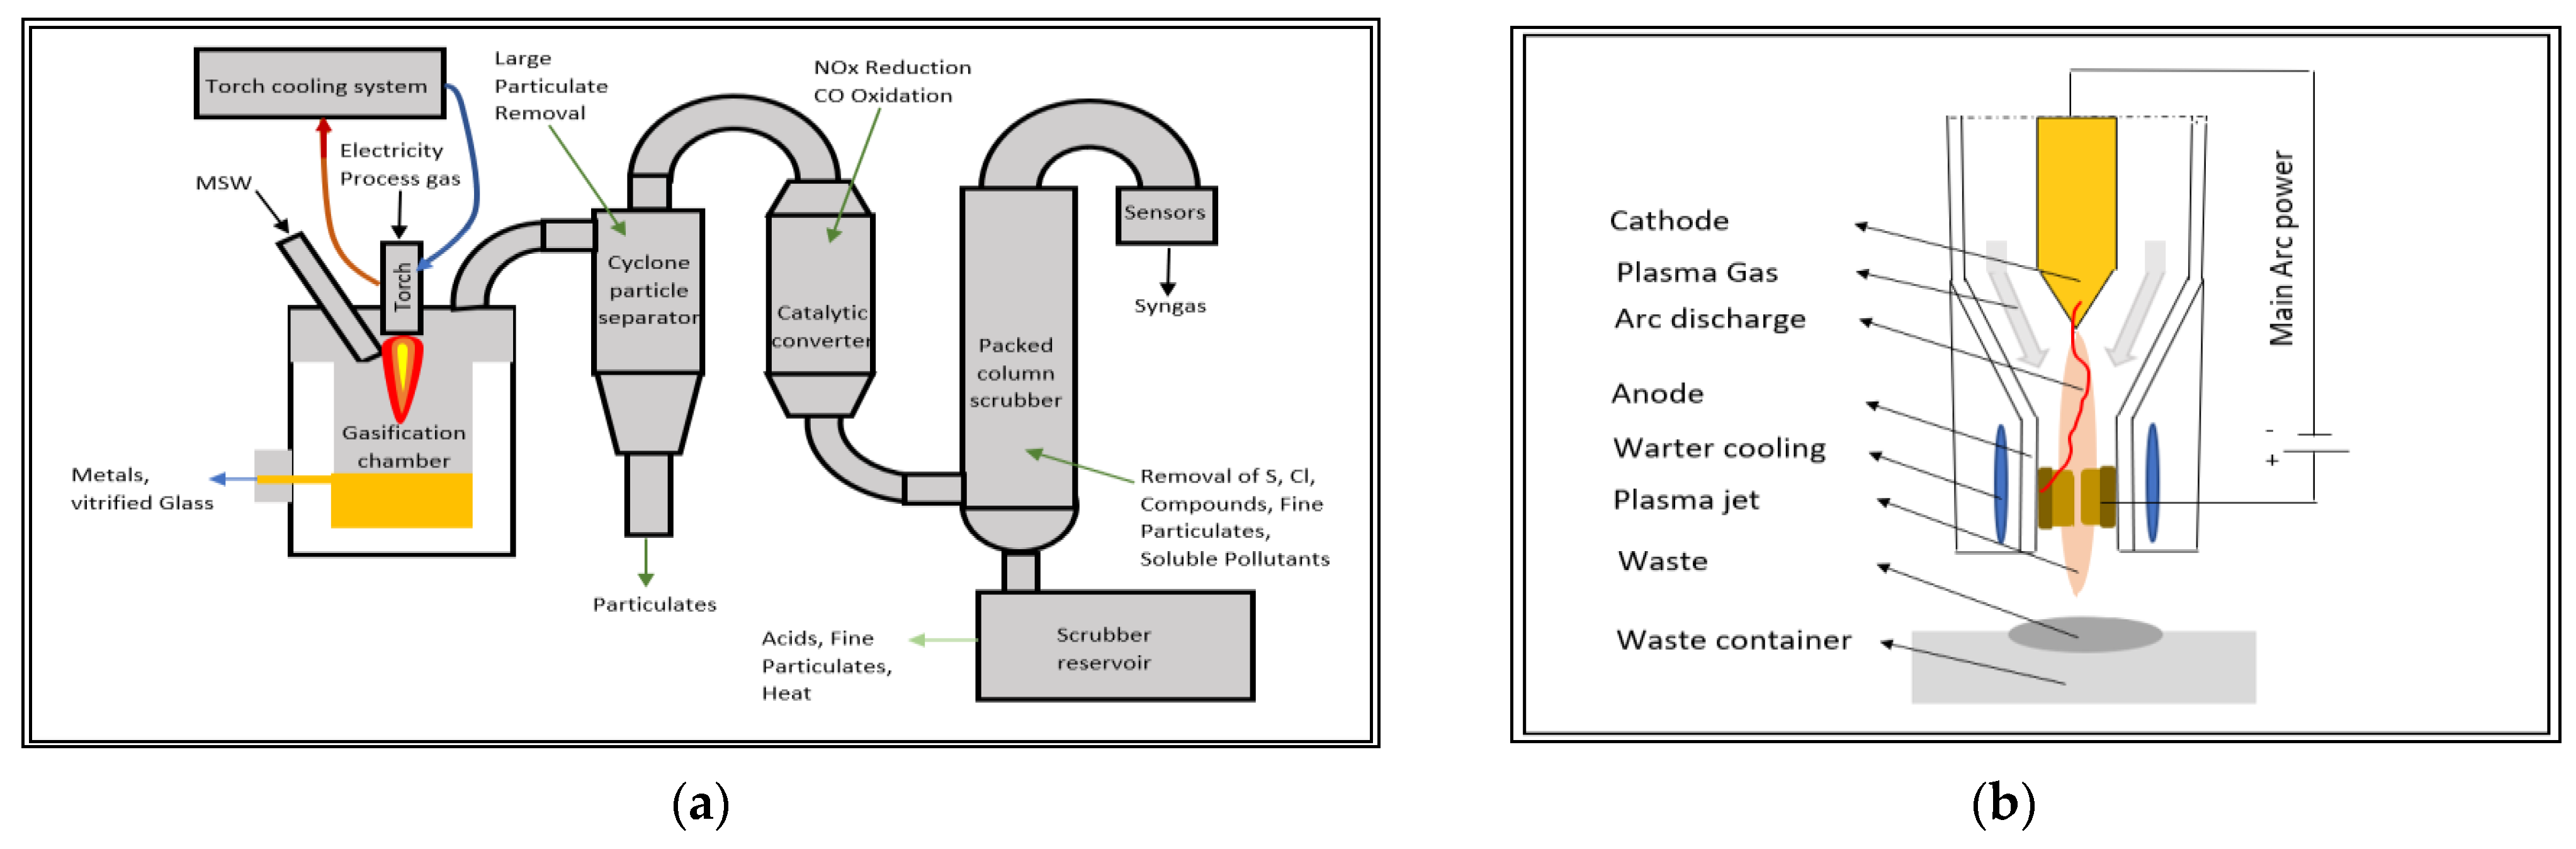
2. Technology of Waste Treatment Setup
3. Plasma Reactor for MSW Gasification
4. Mathematical Model
4.1. Assumption
4.2. Model Equations
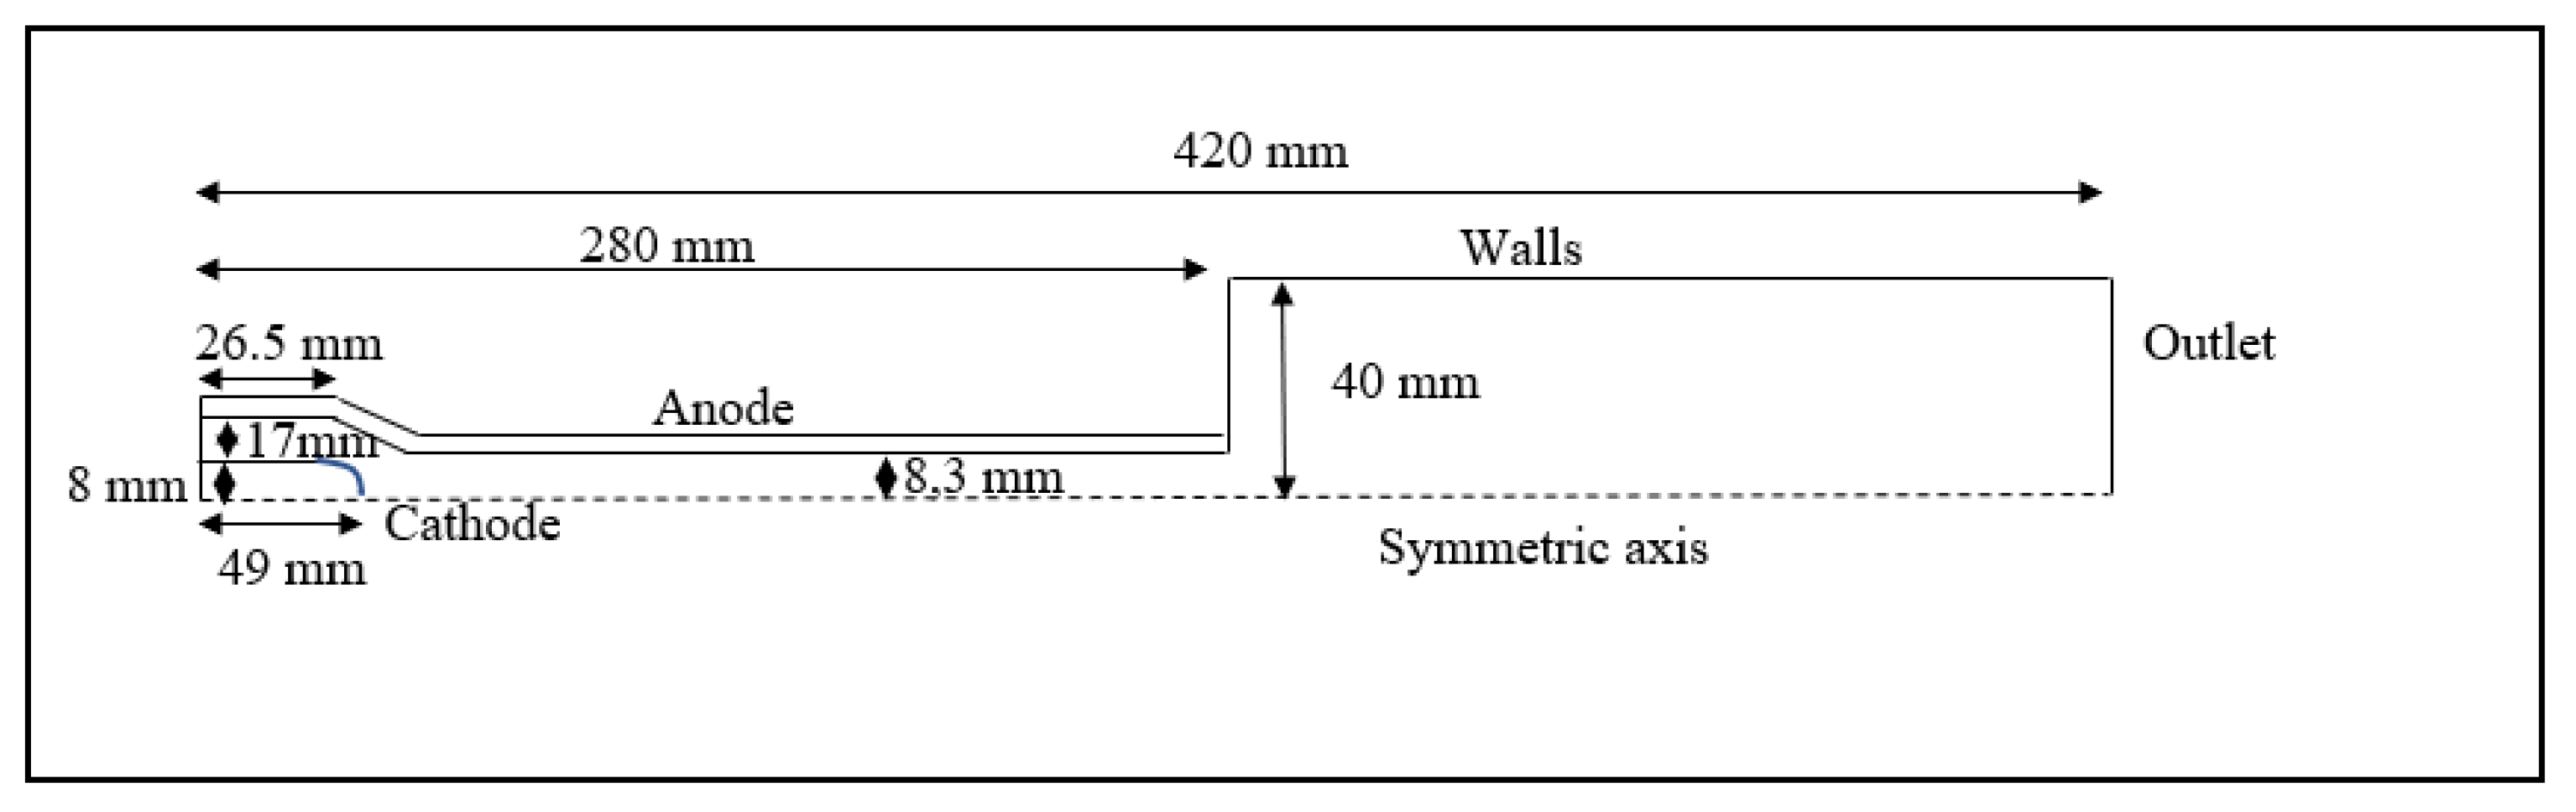
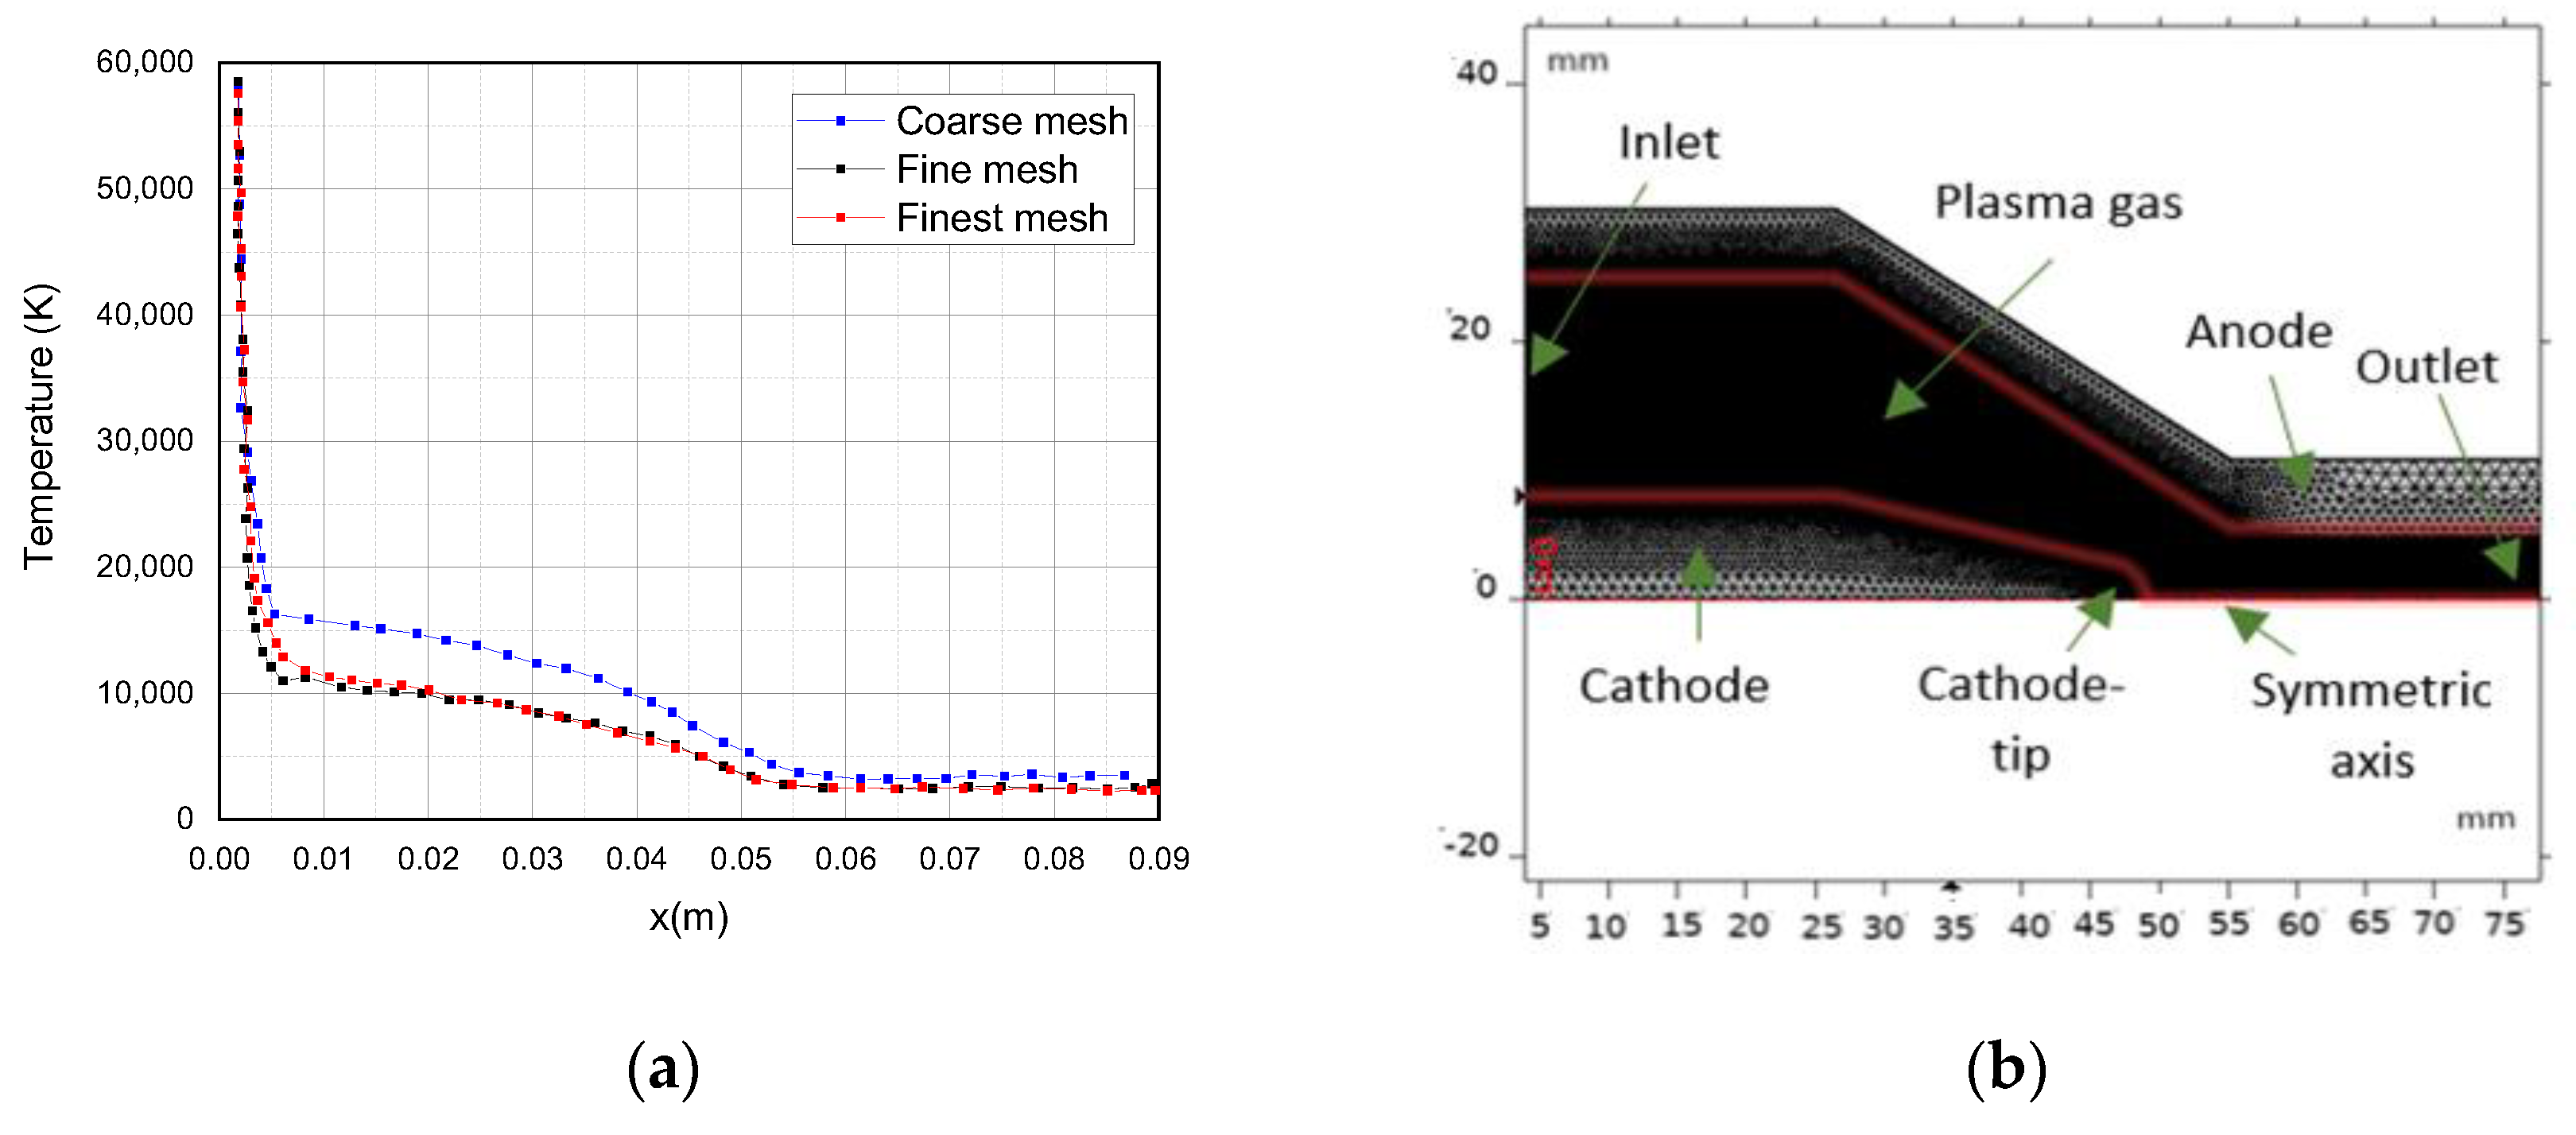
4.3. Simulation Domain and Parameters
5. Results
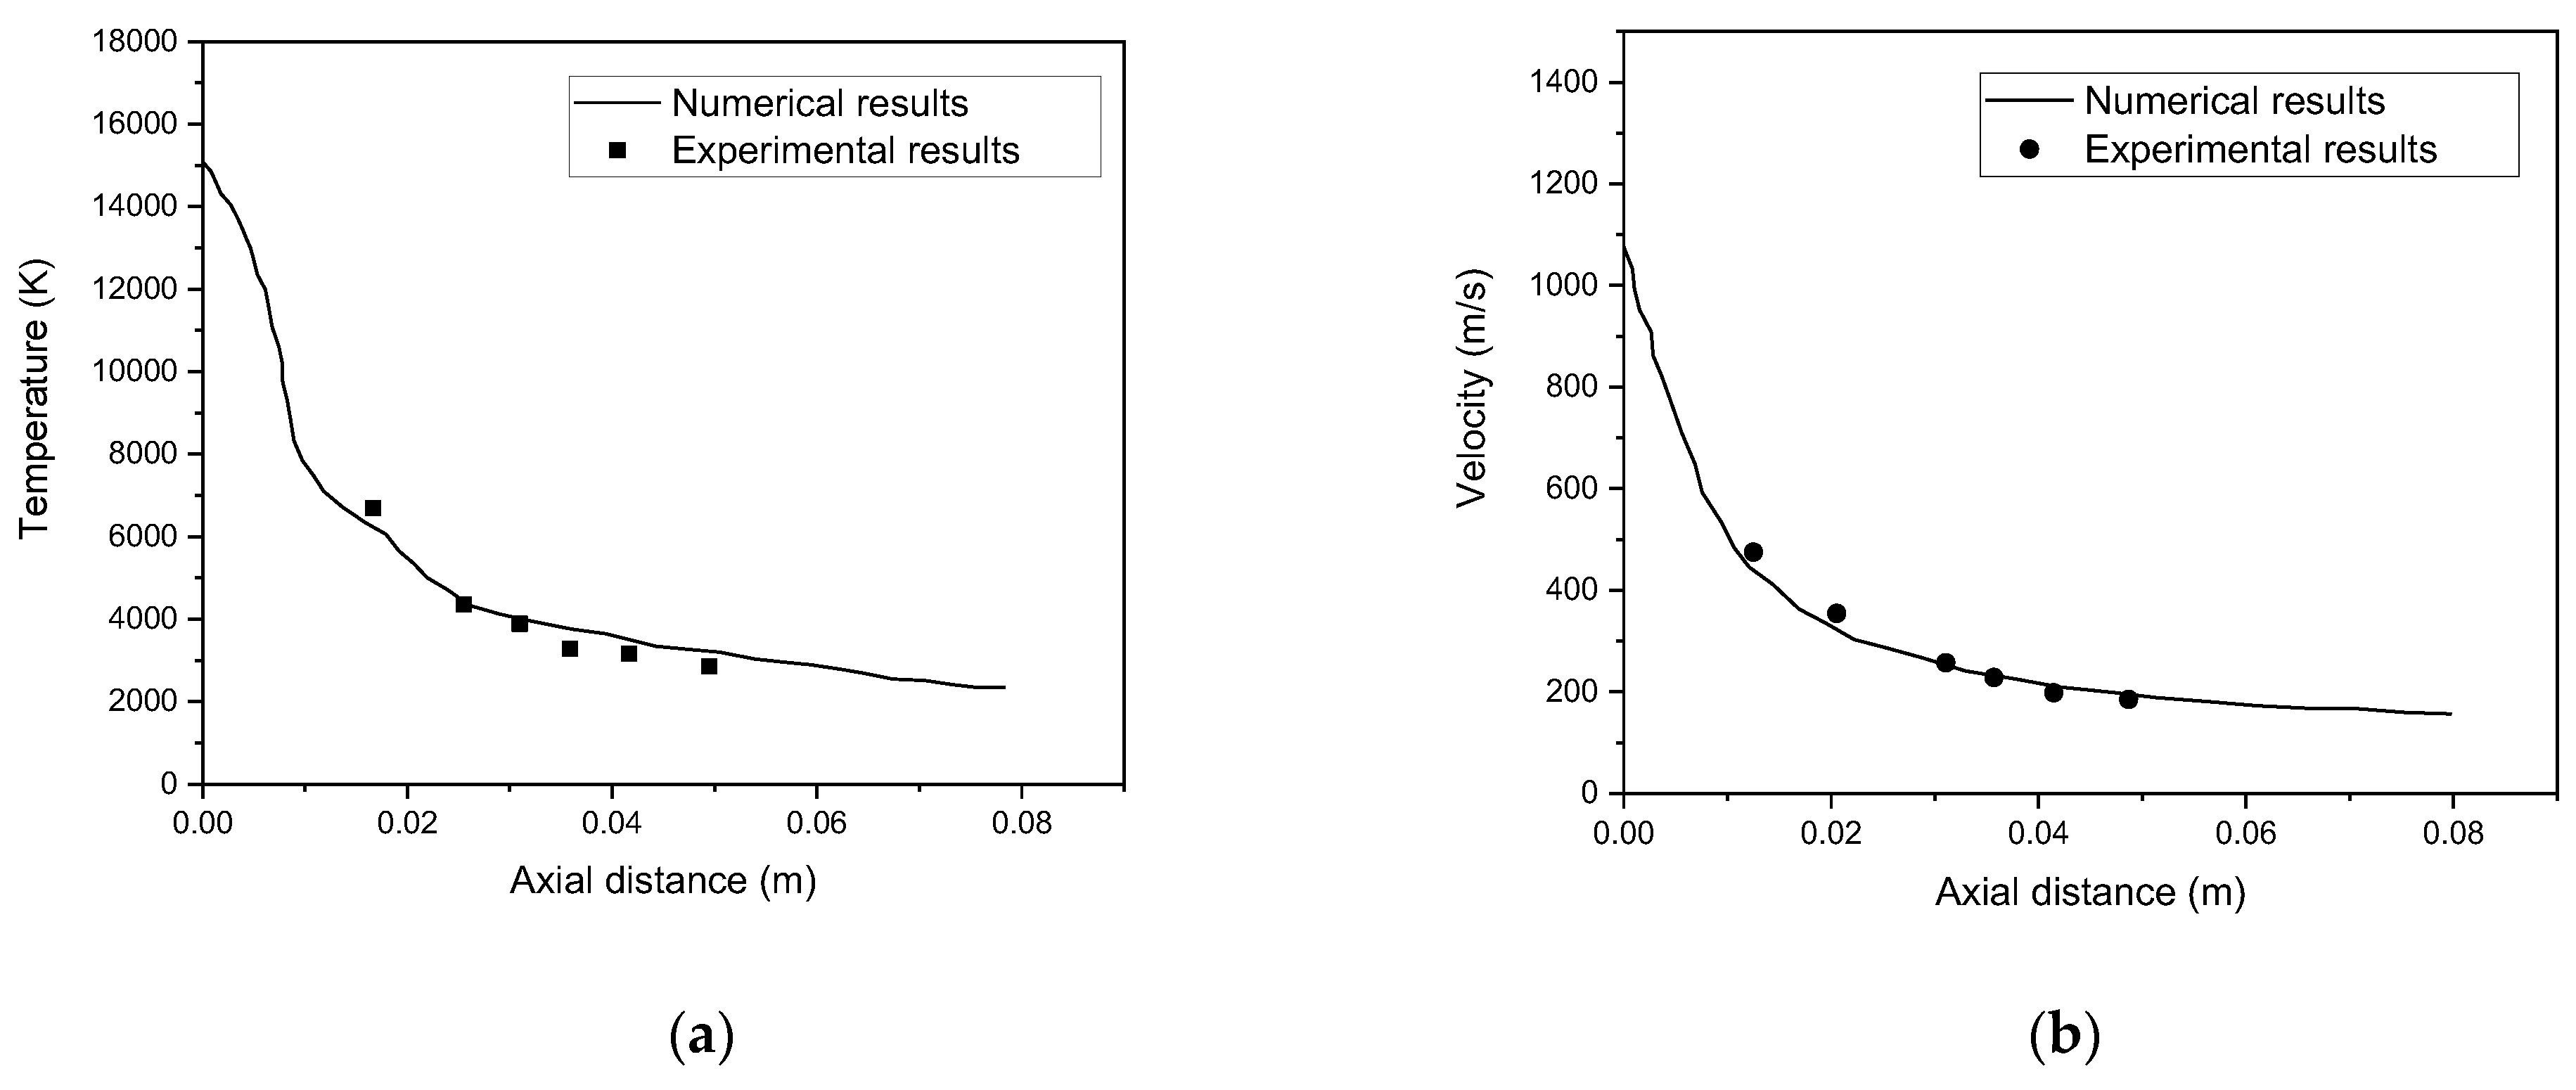
5.1. Comparison with Experimental Data
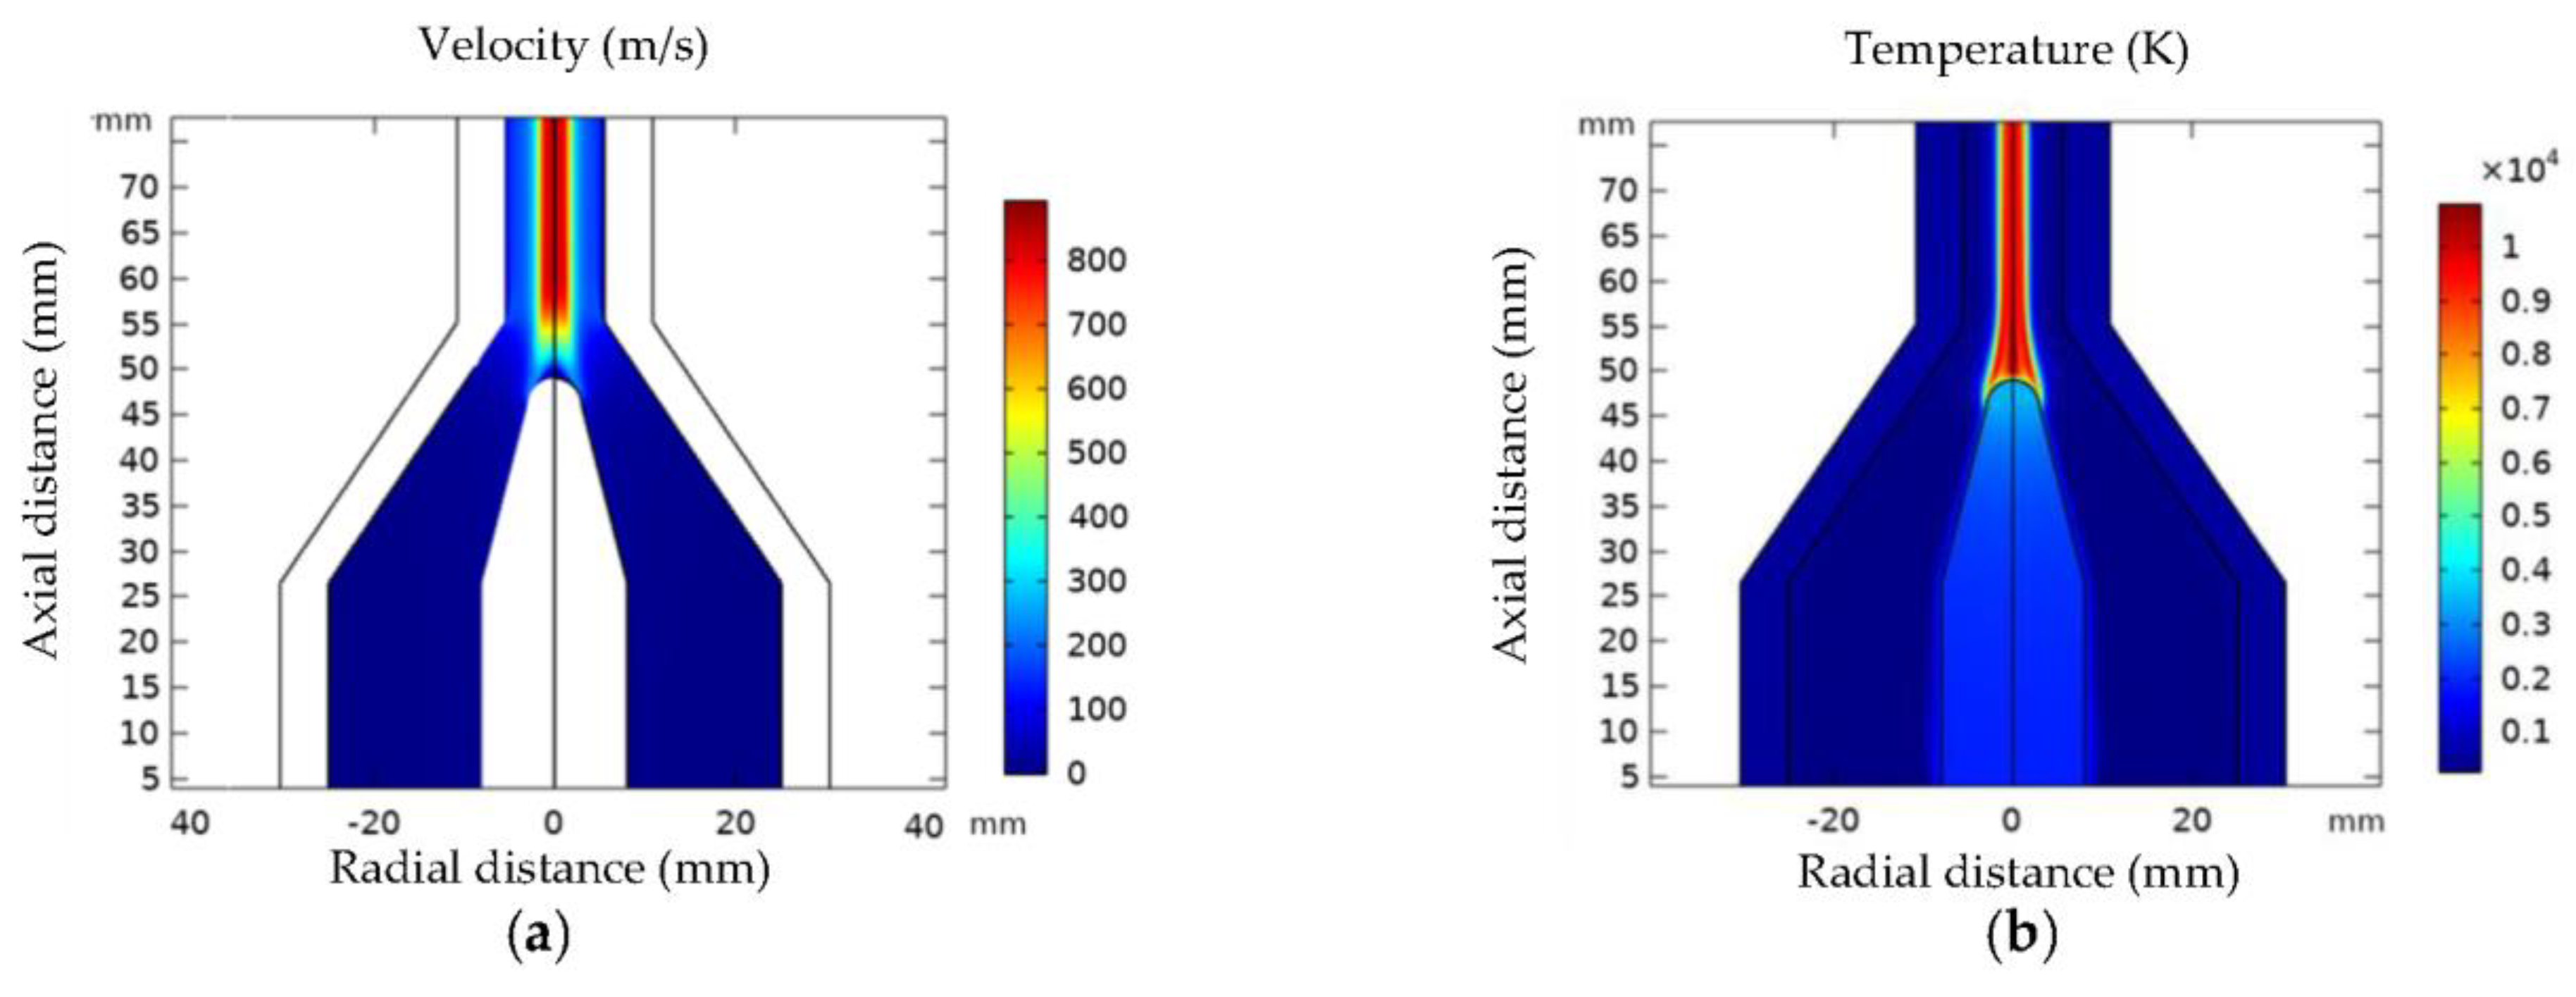
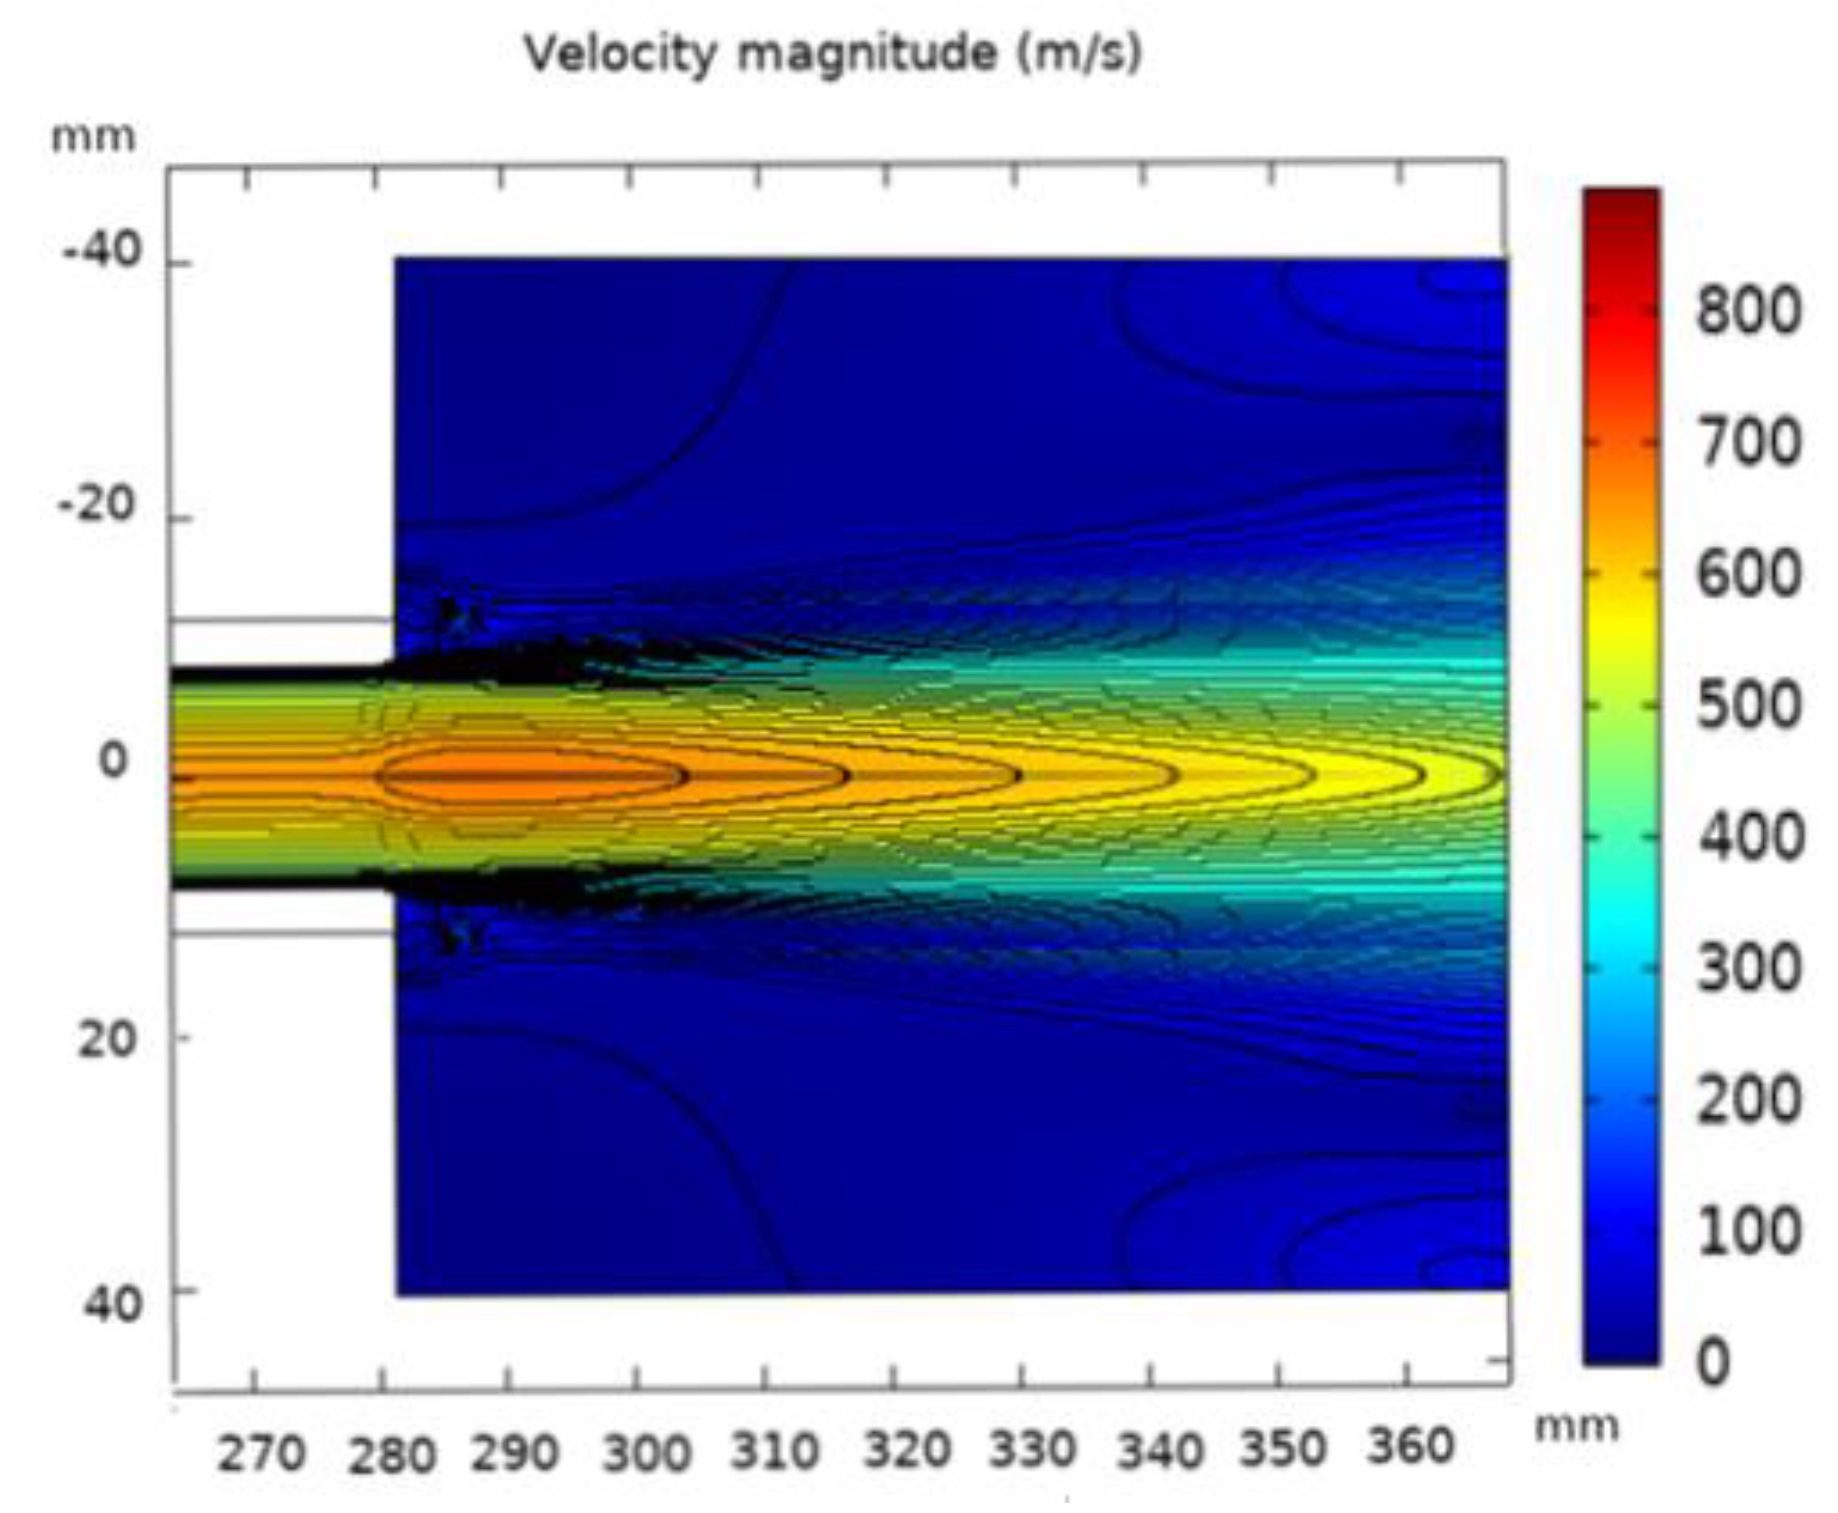
5.2. Velocity and Temperature Evolution in the Plasma Torch
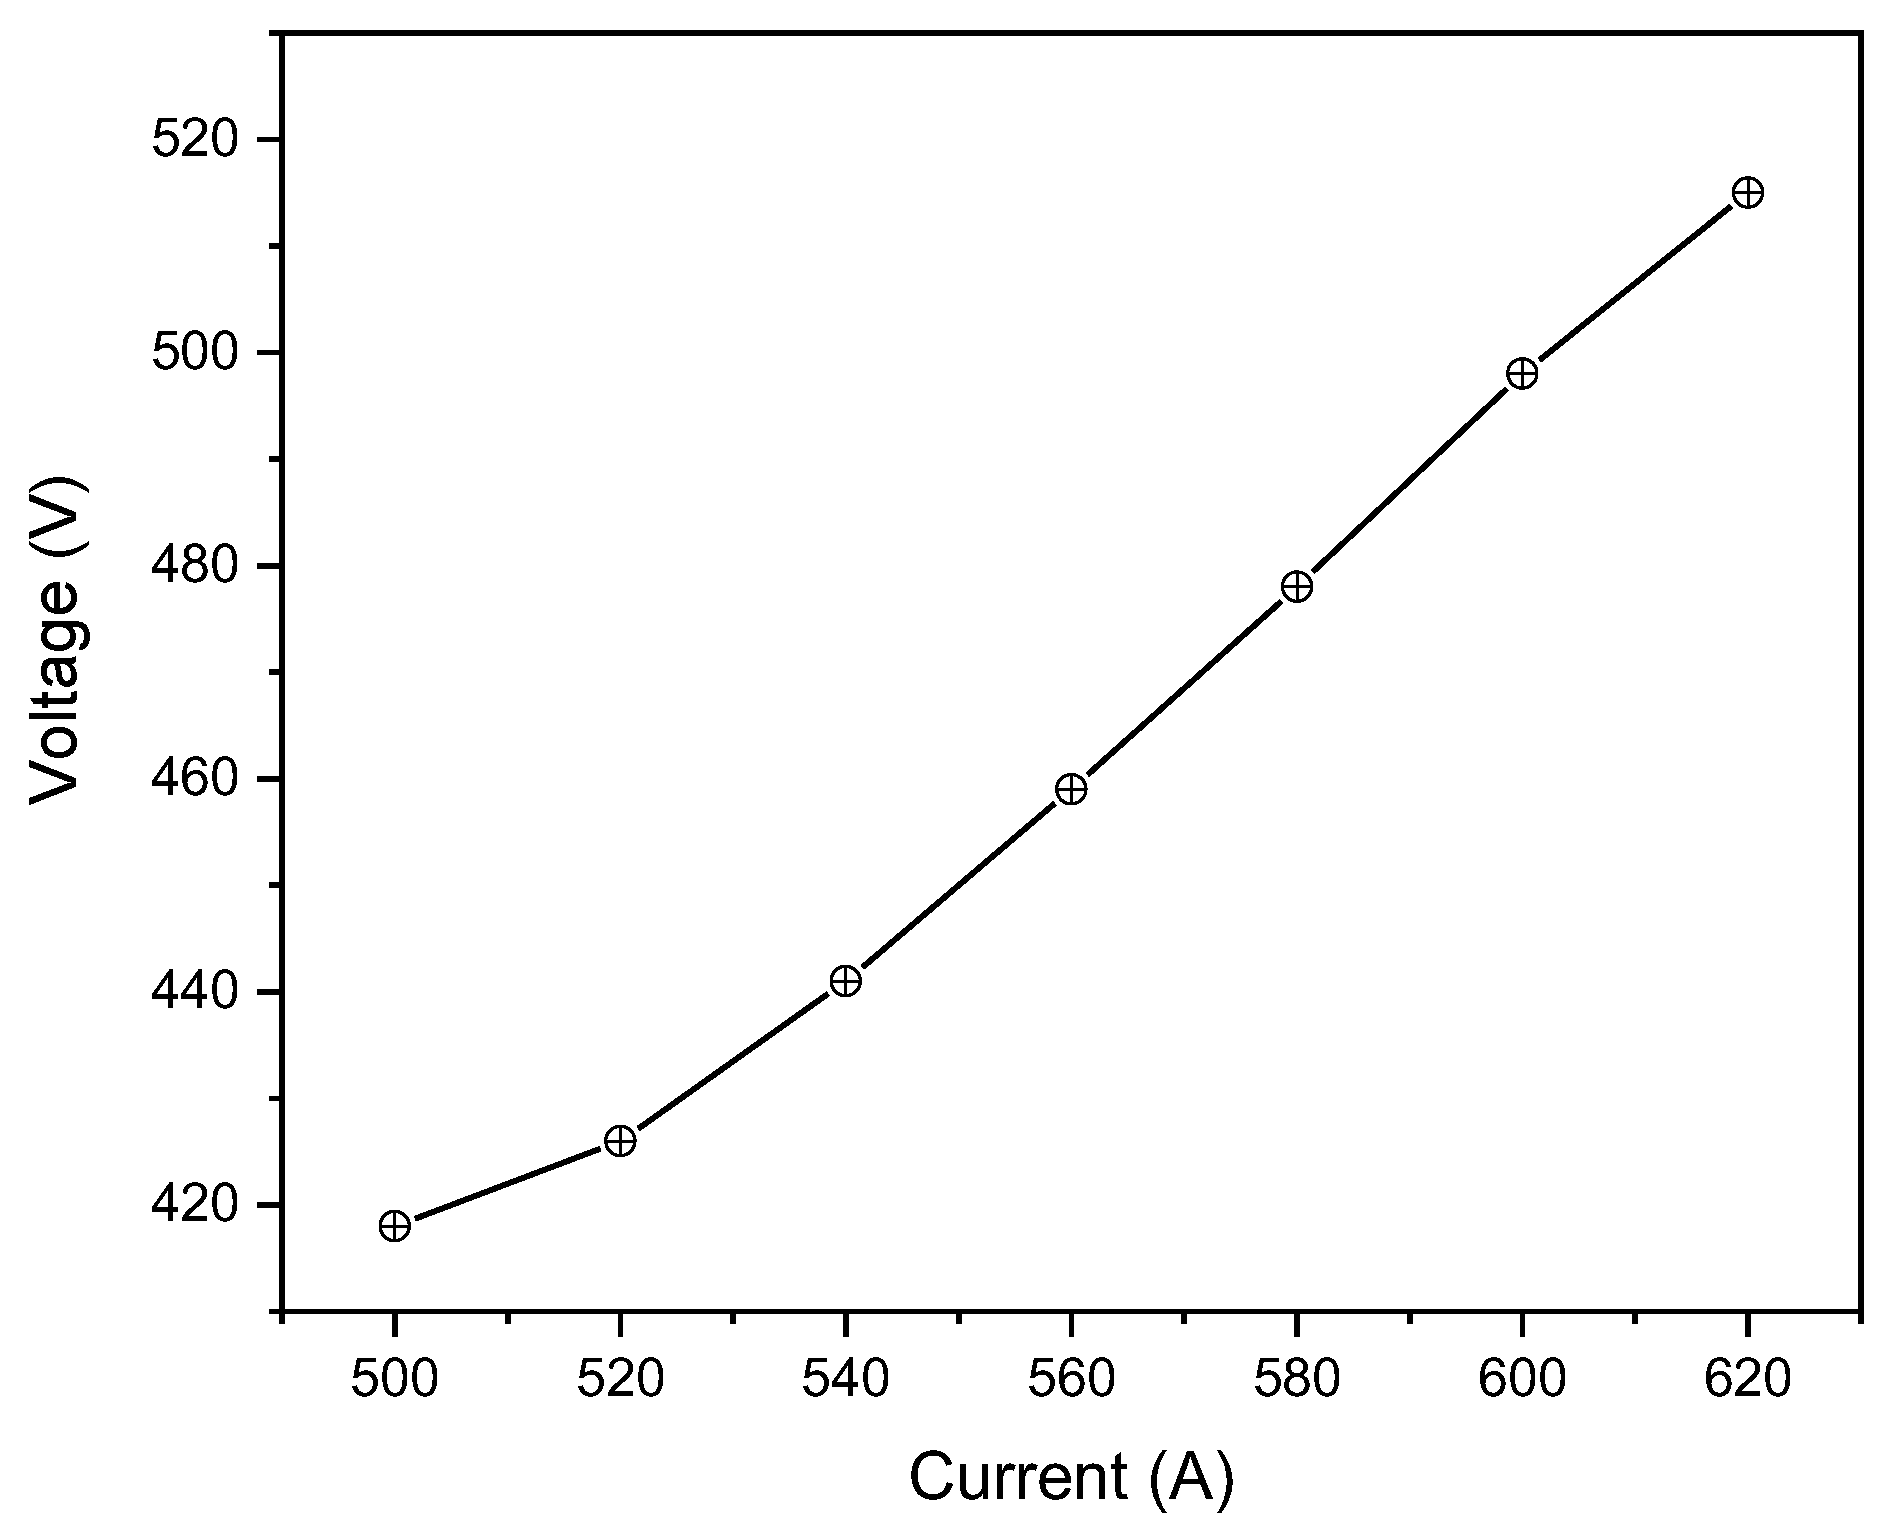
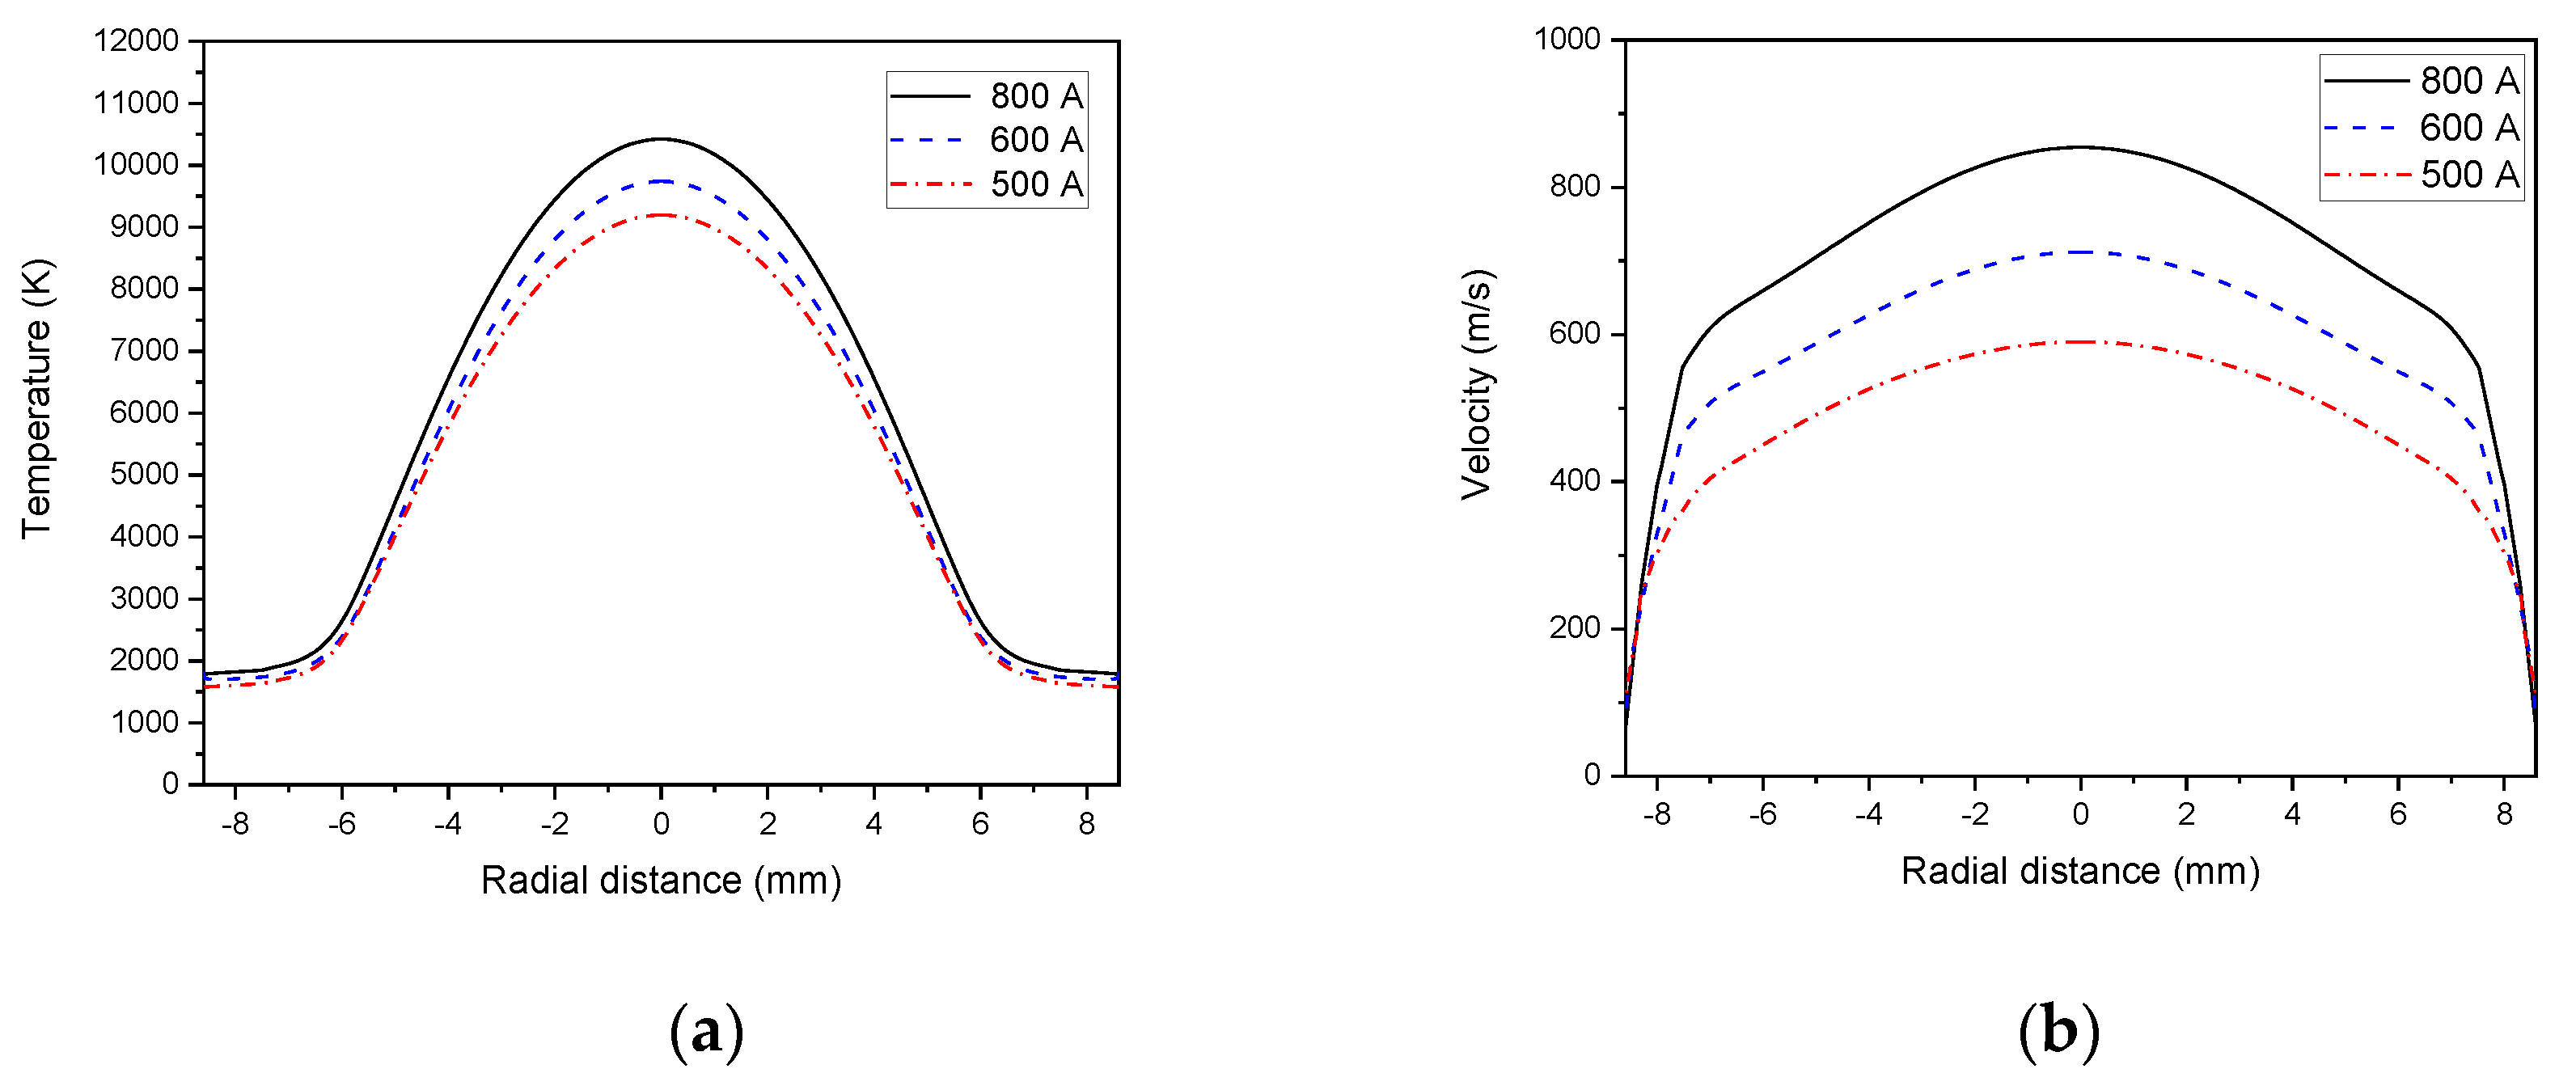
5.3. Influence of Plasma Current
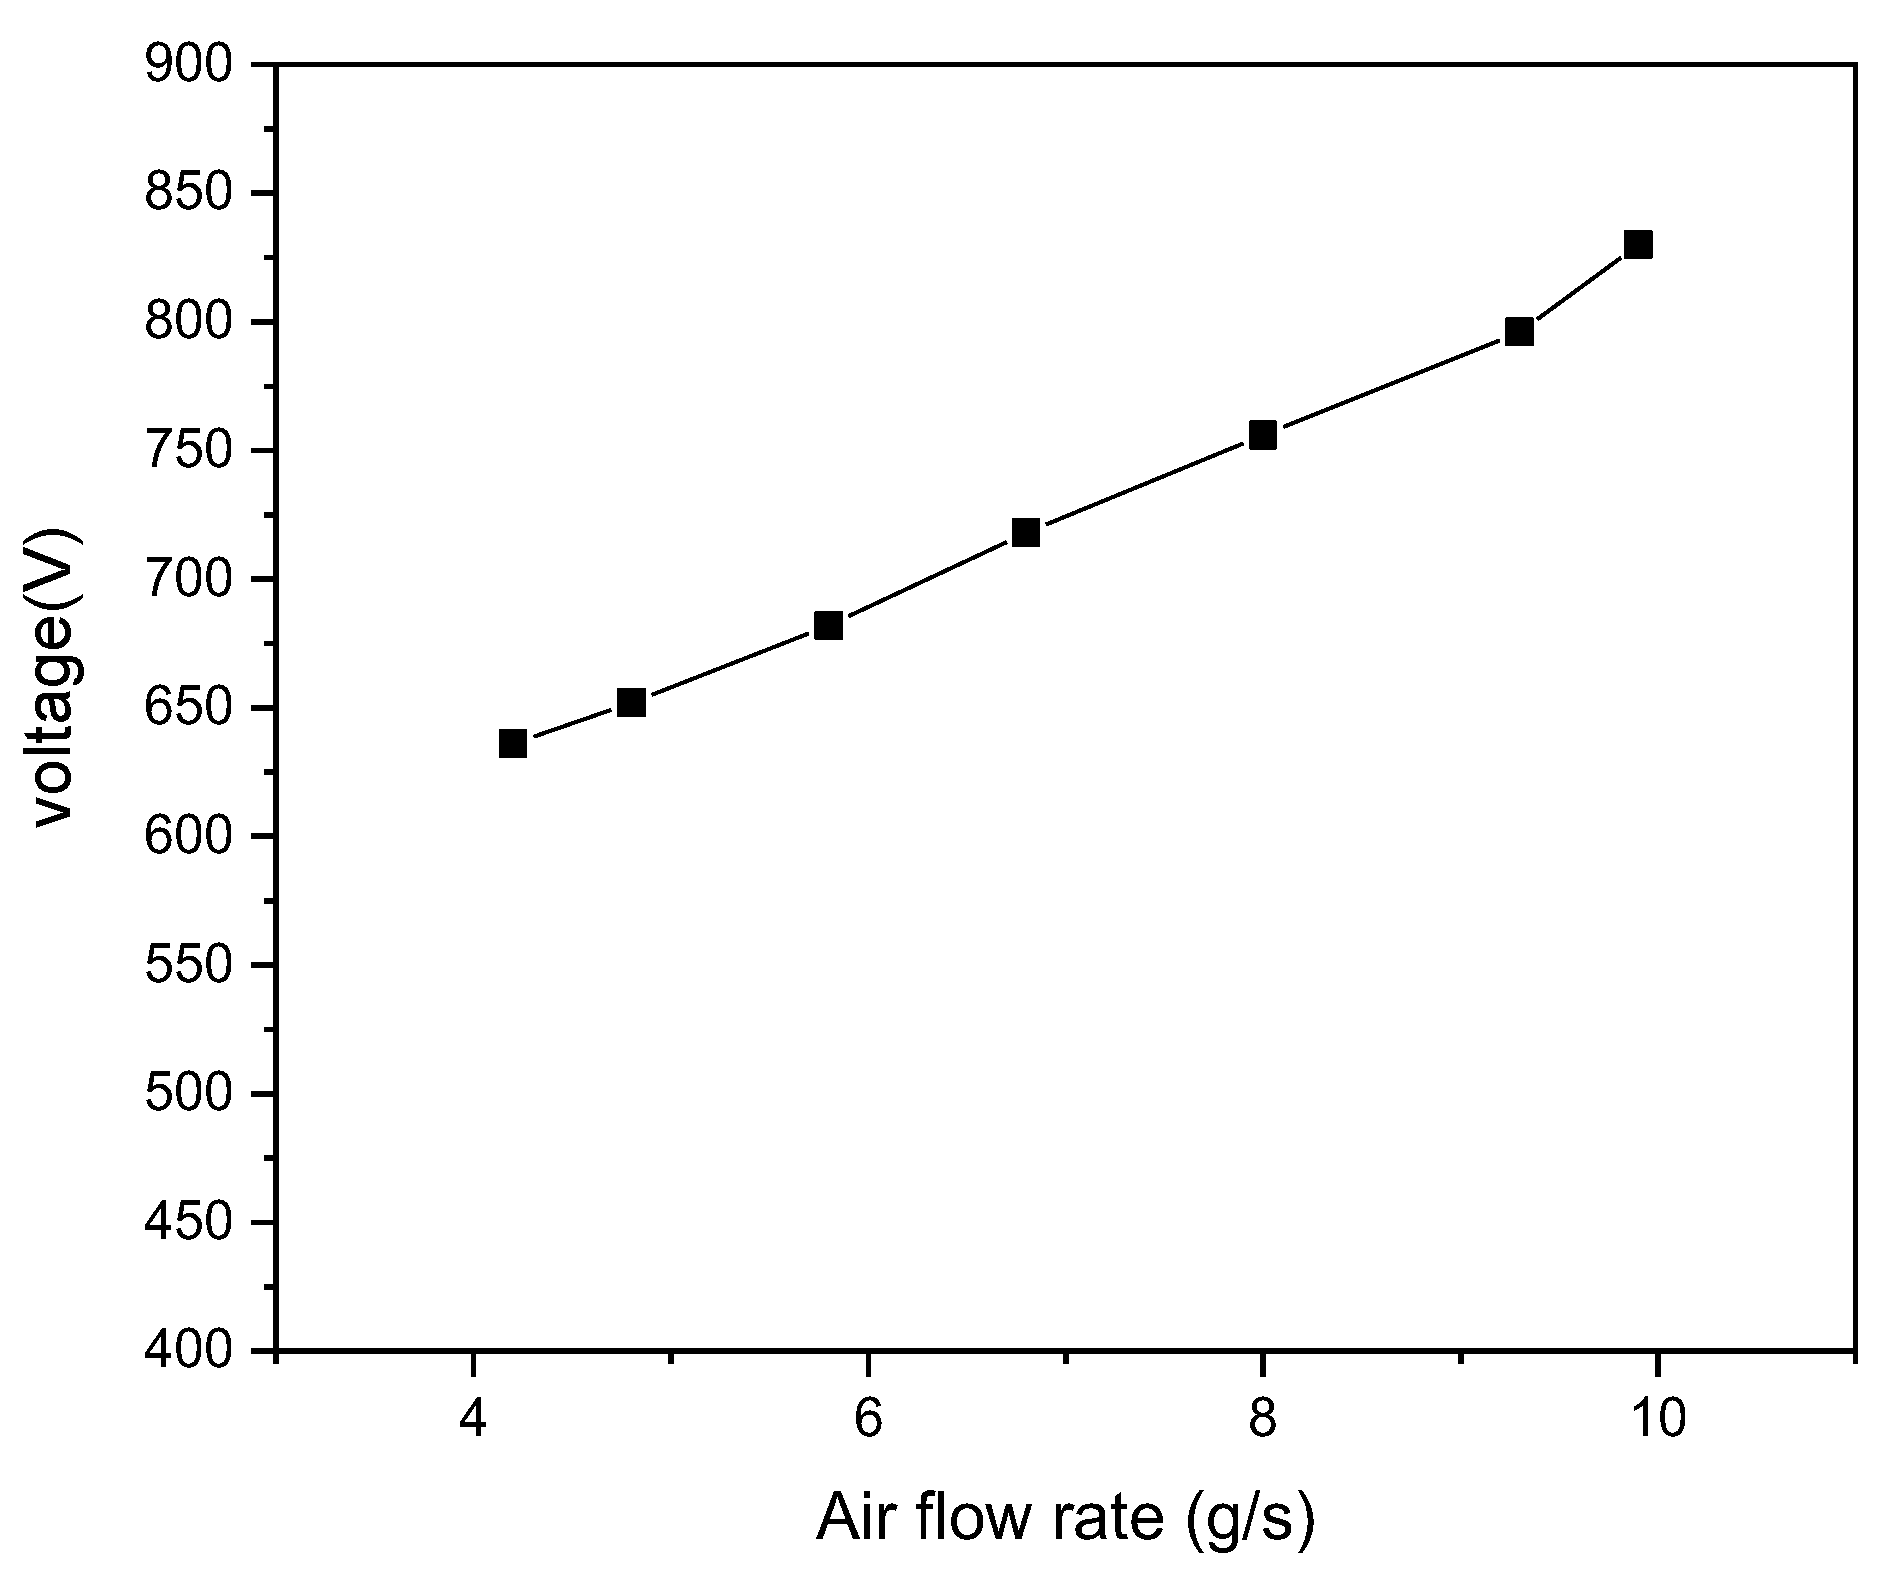
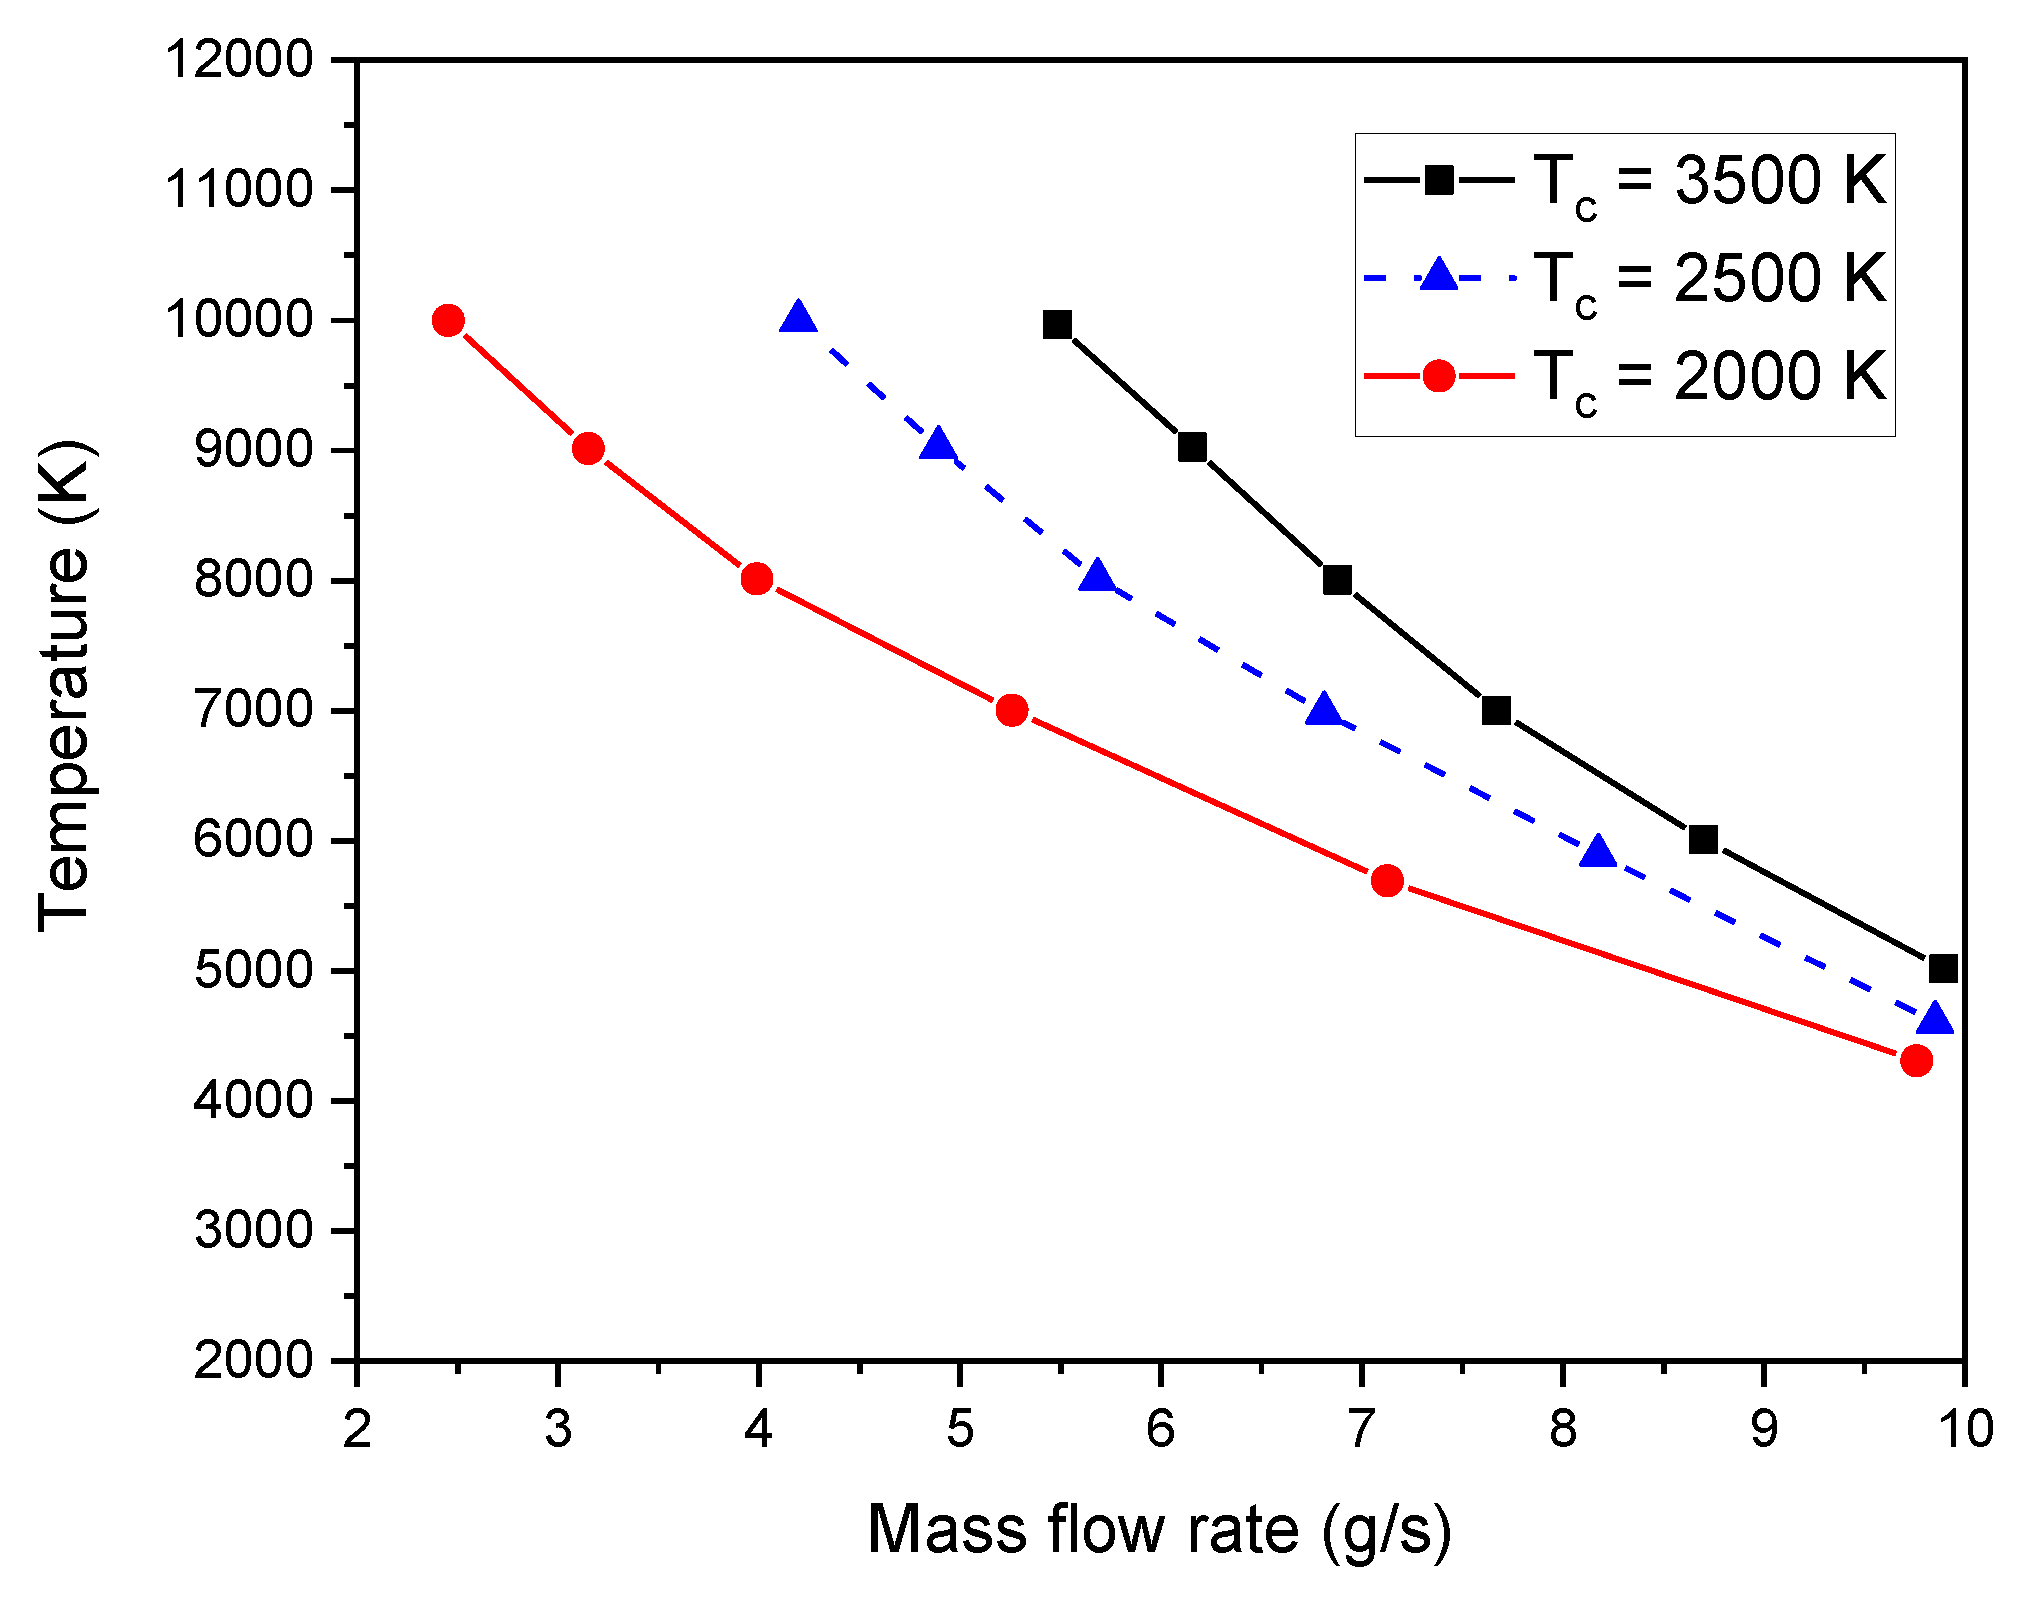
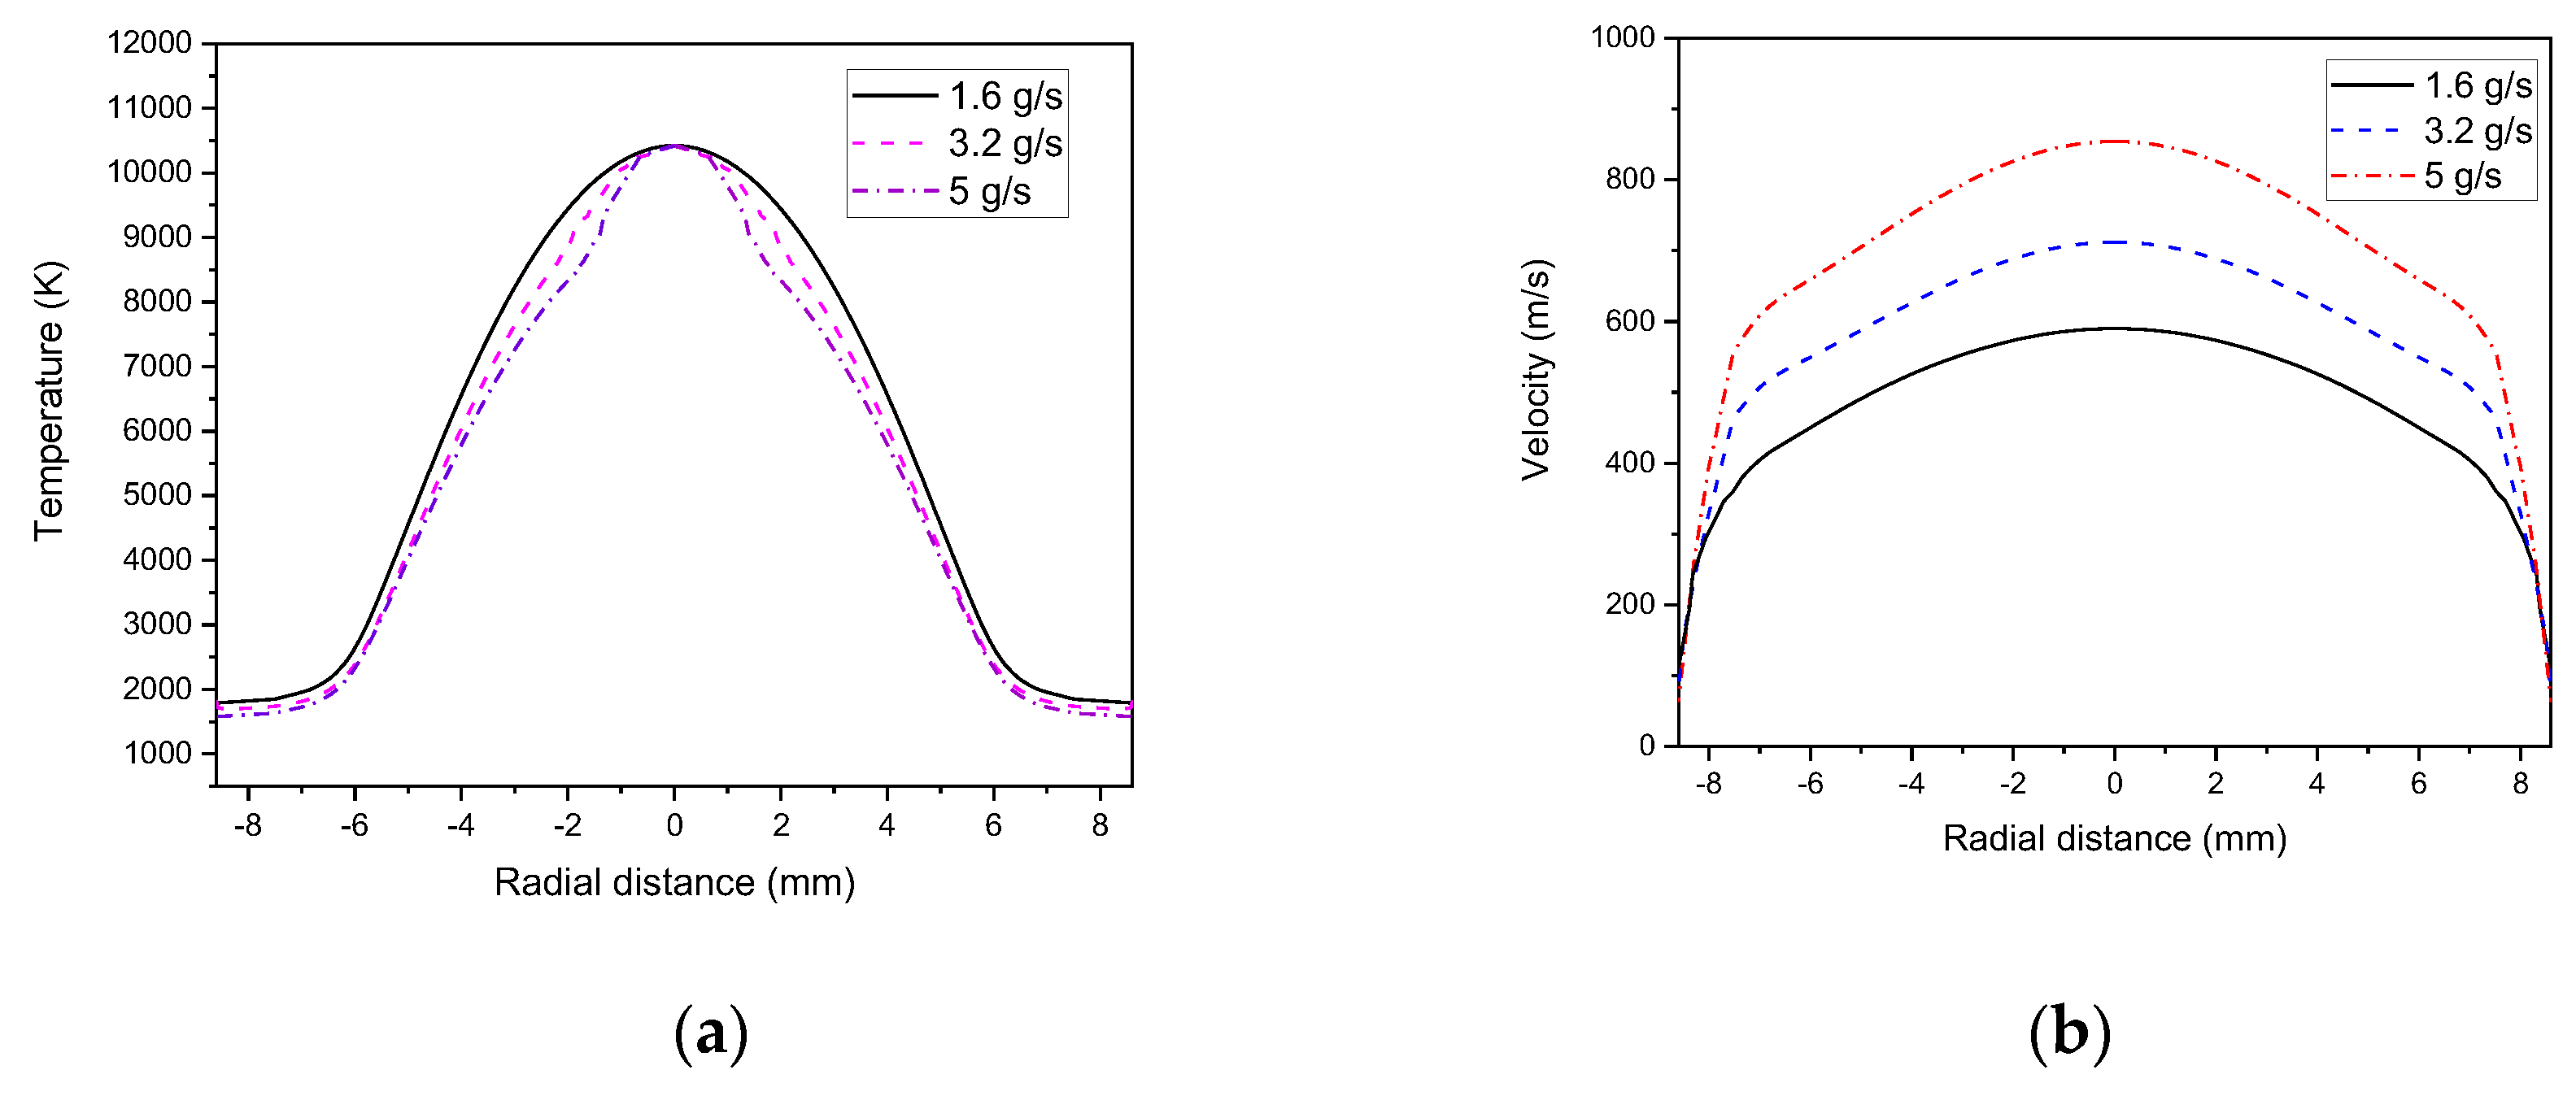
5.4. Influence of Air Mass Flow Rate
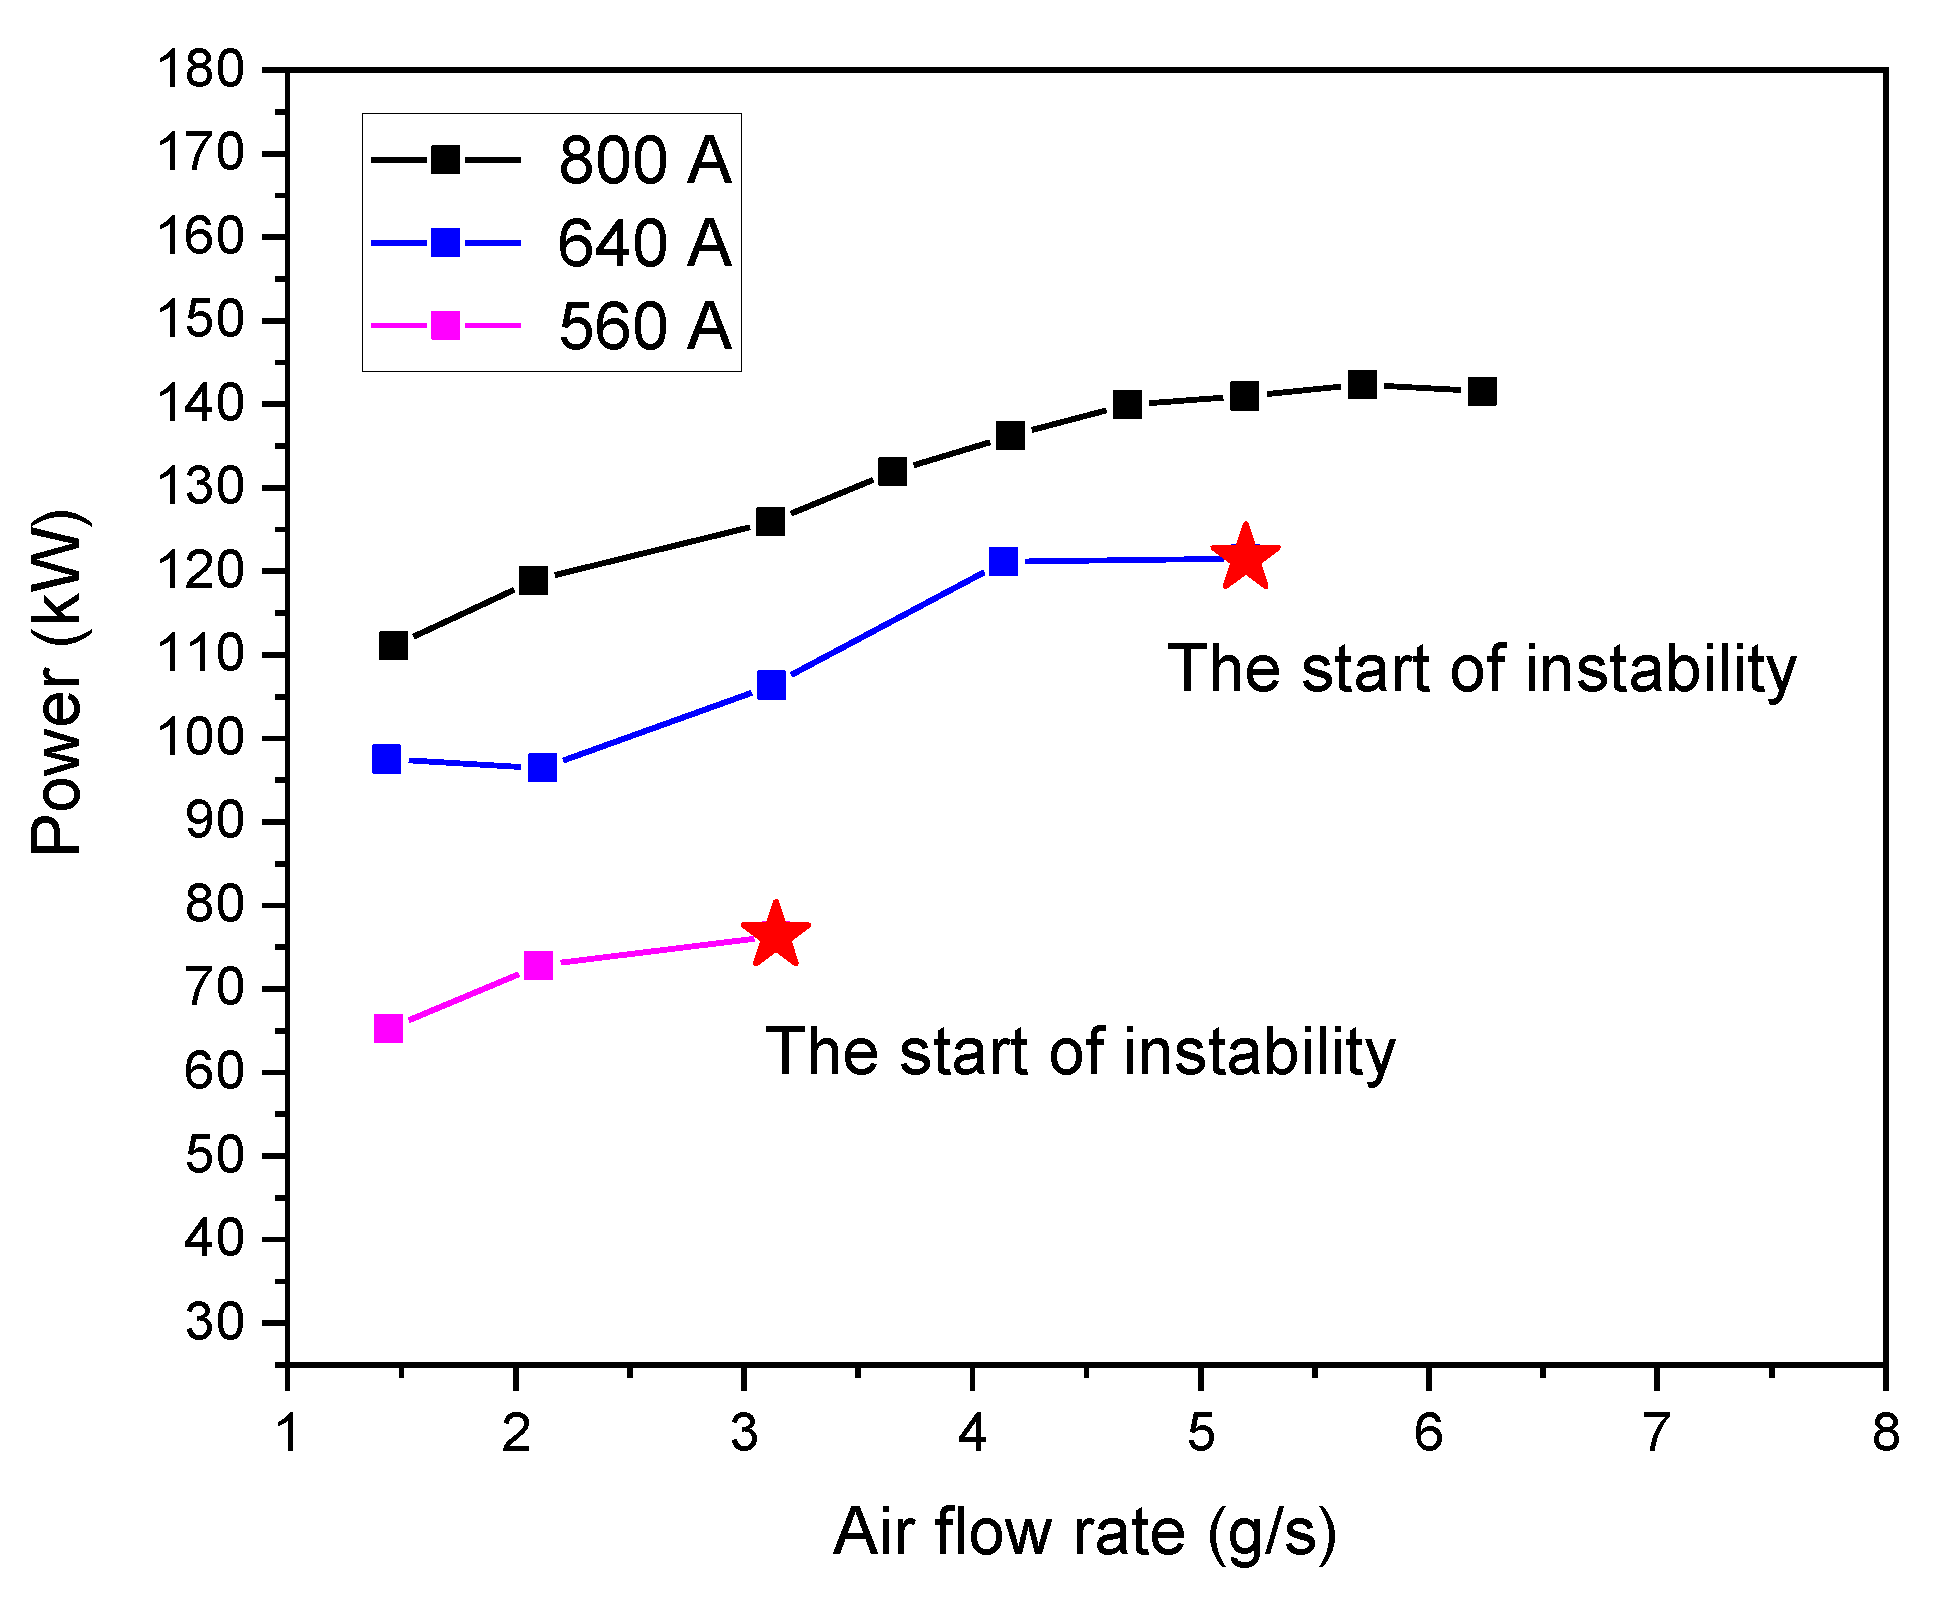
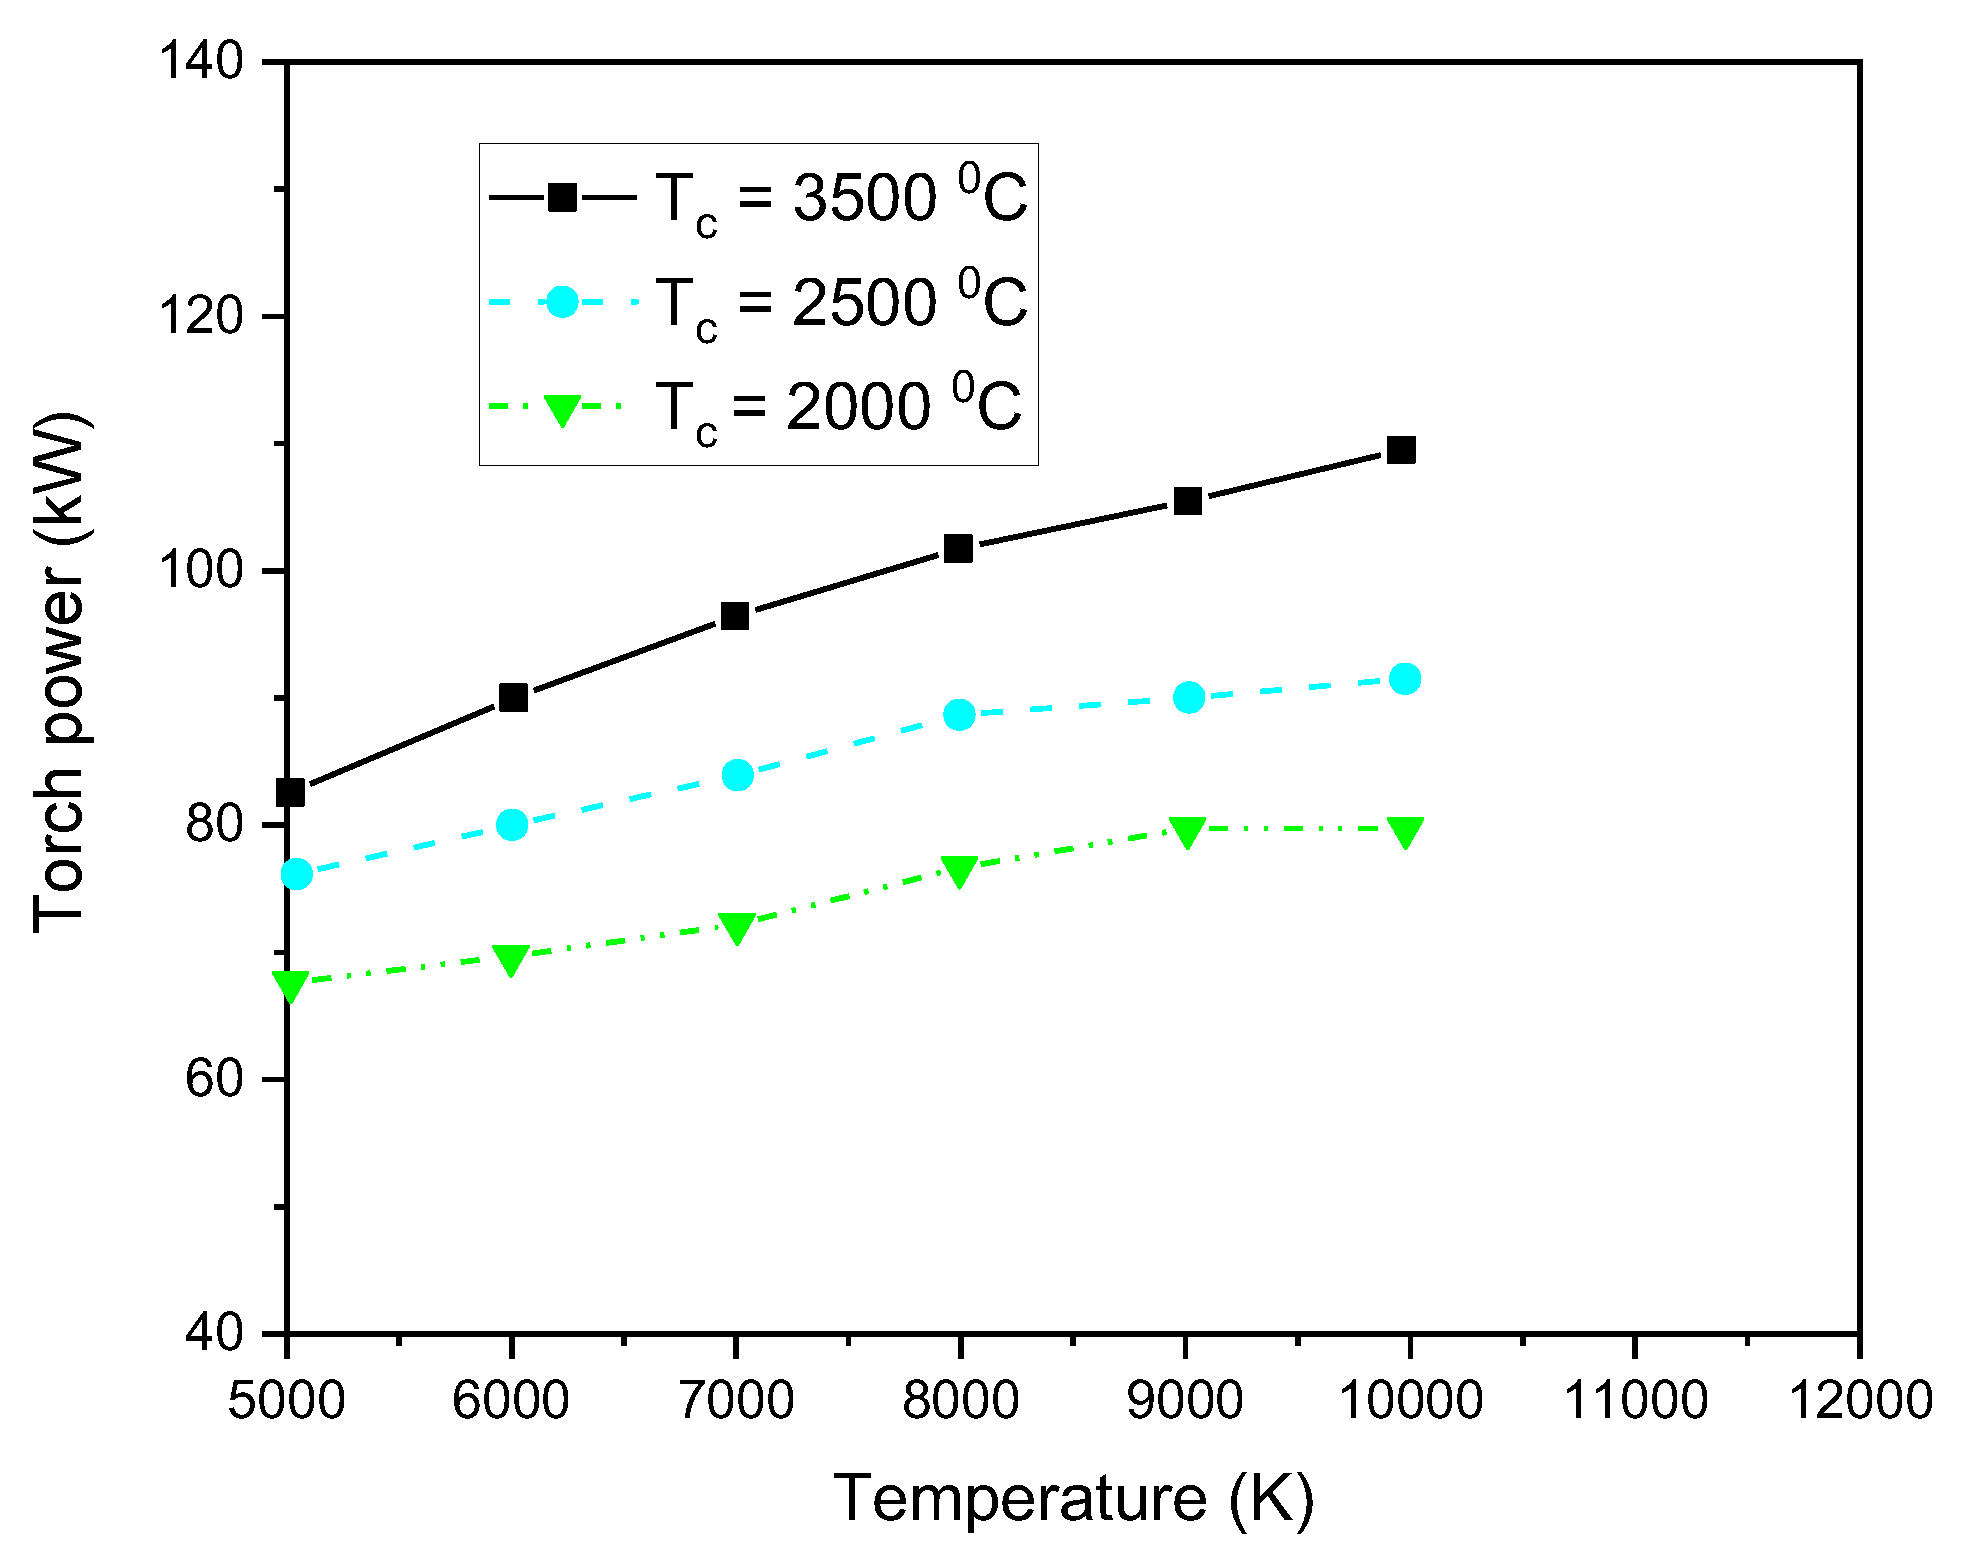
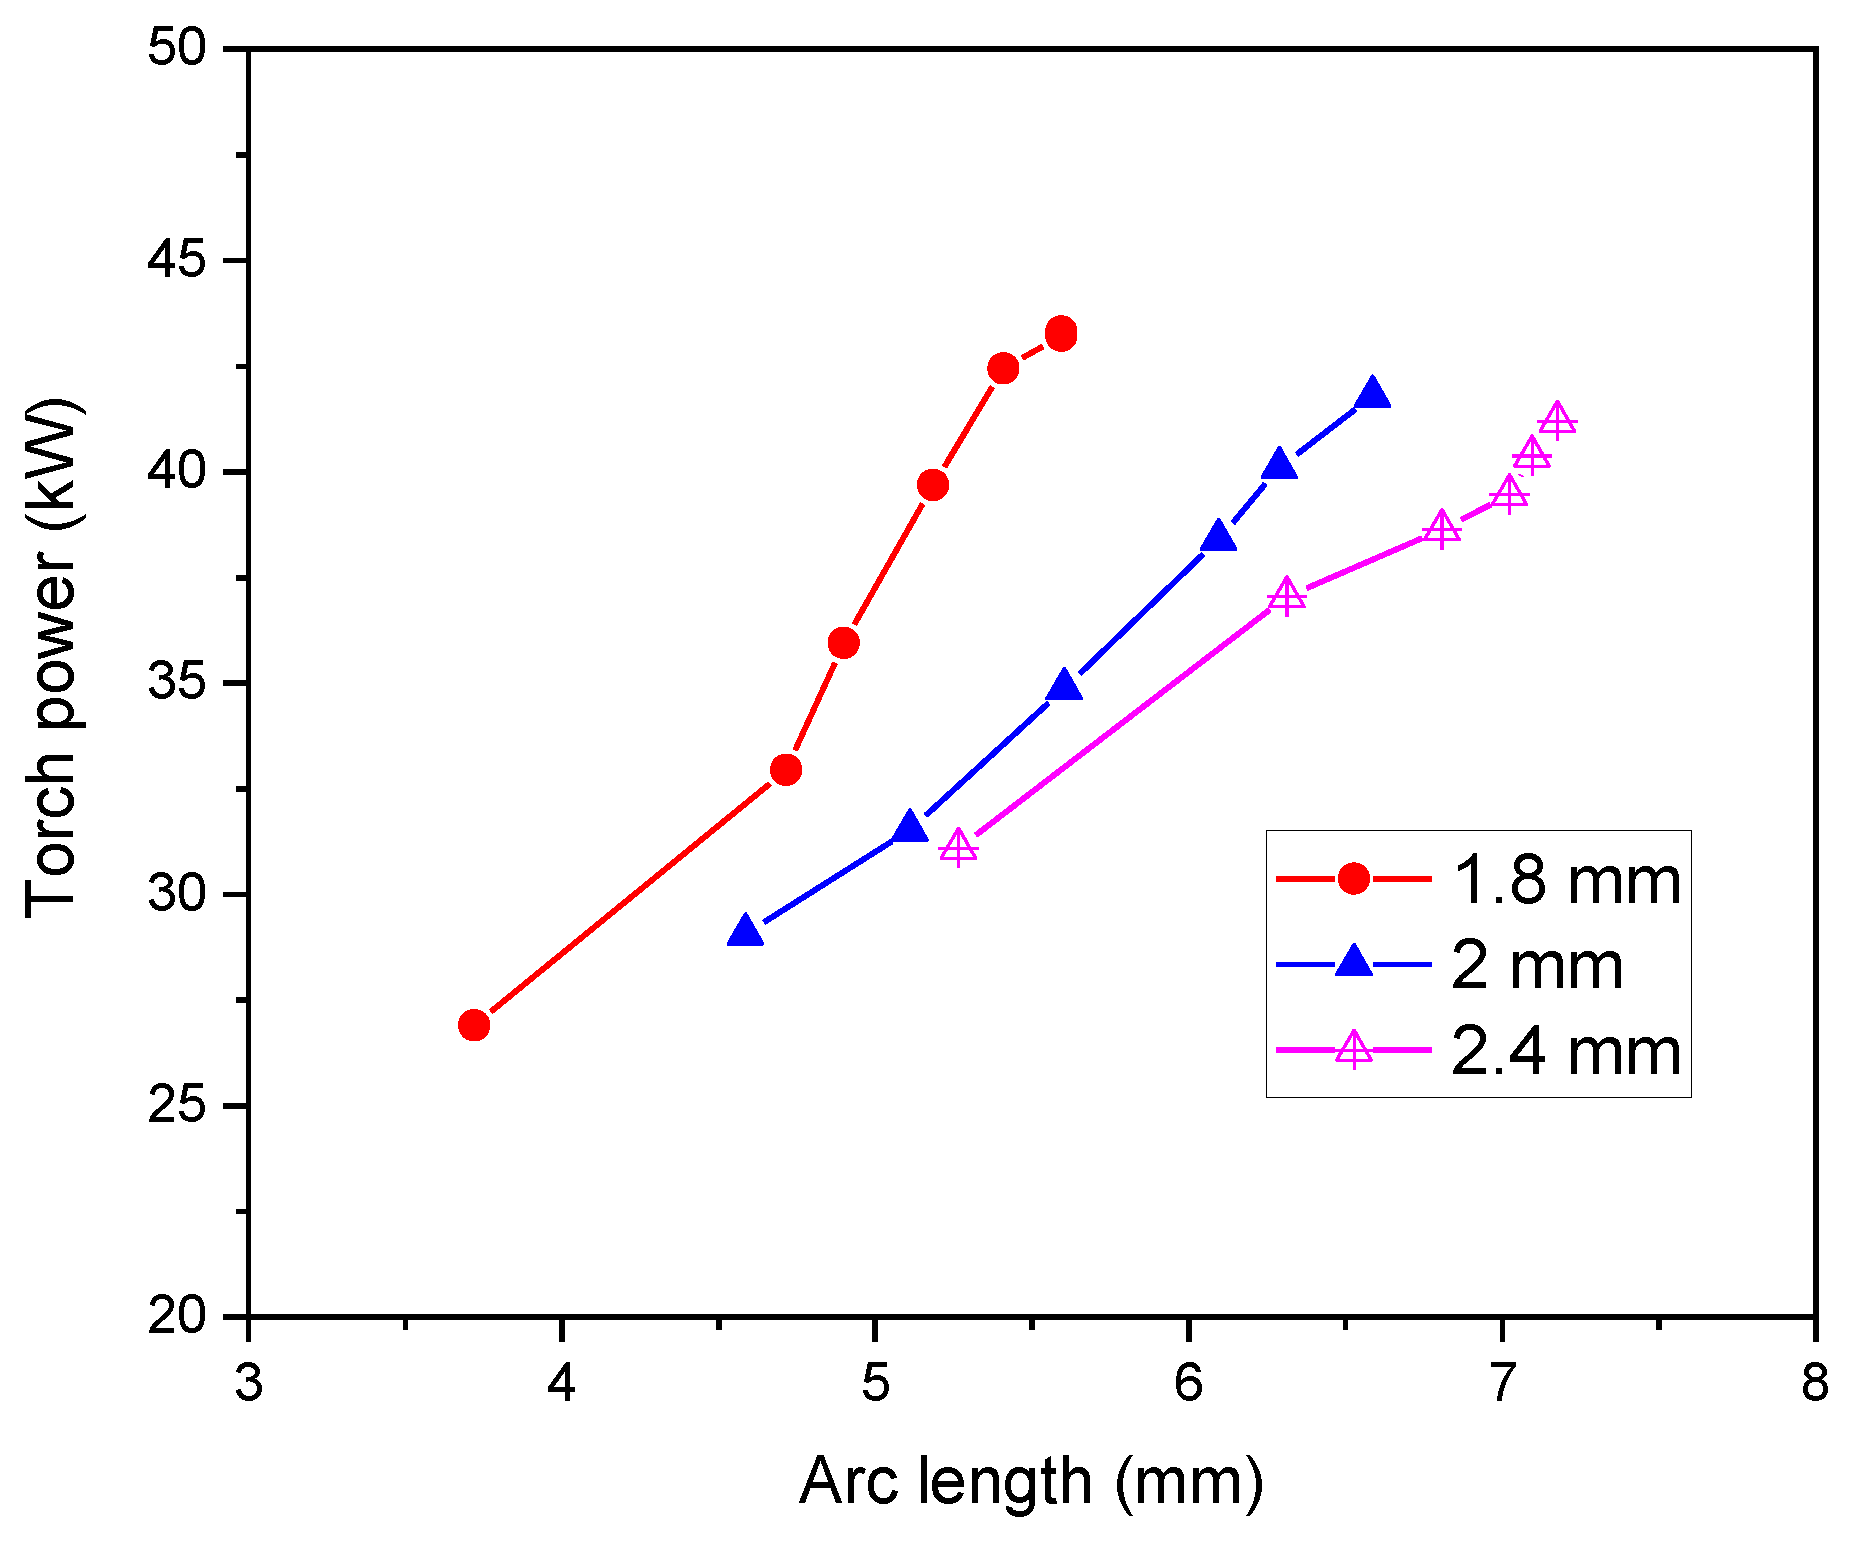
5.5. Deposited Power
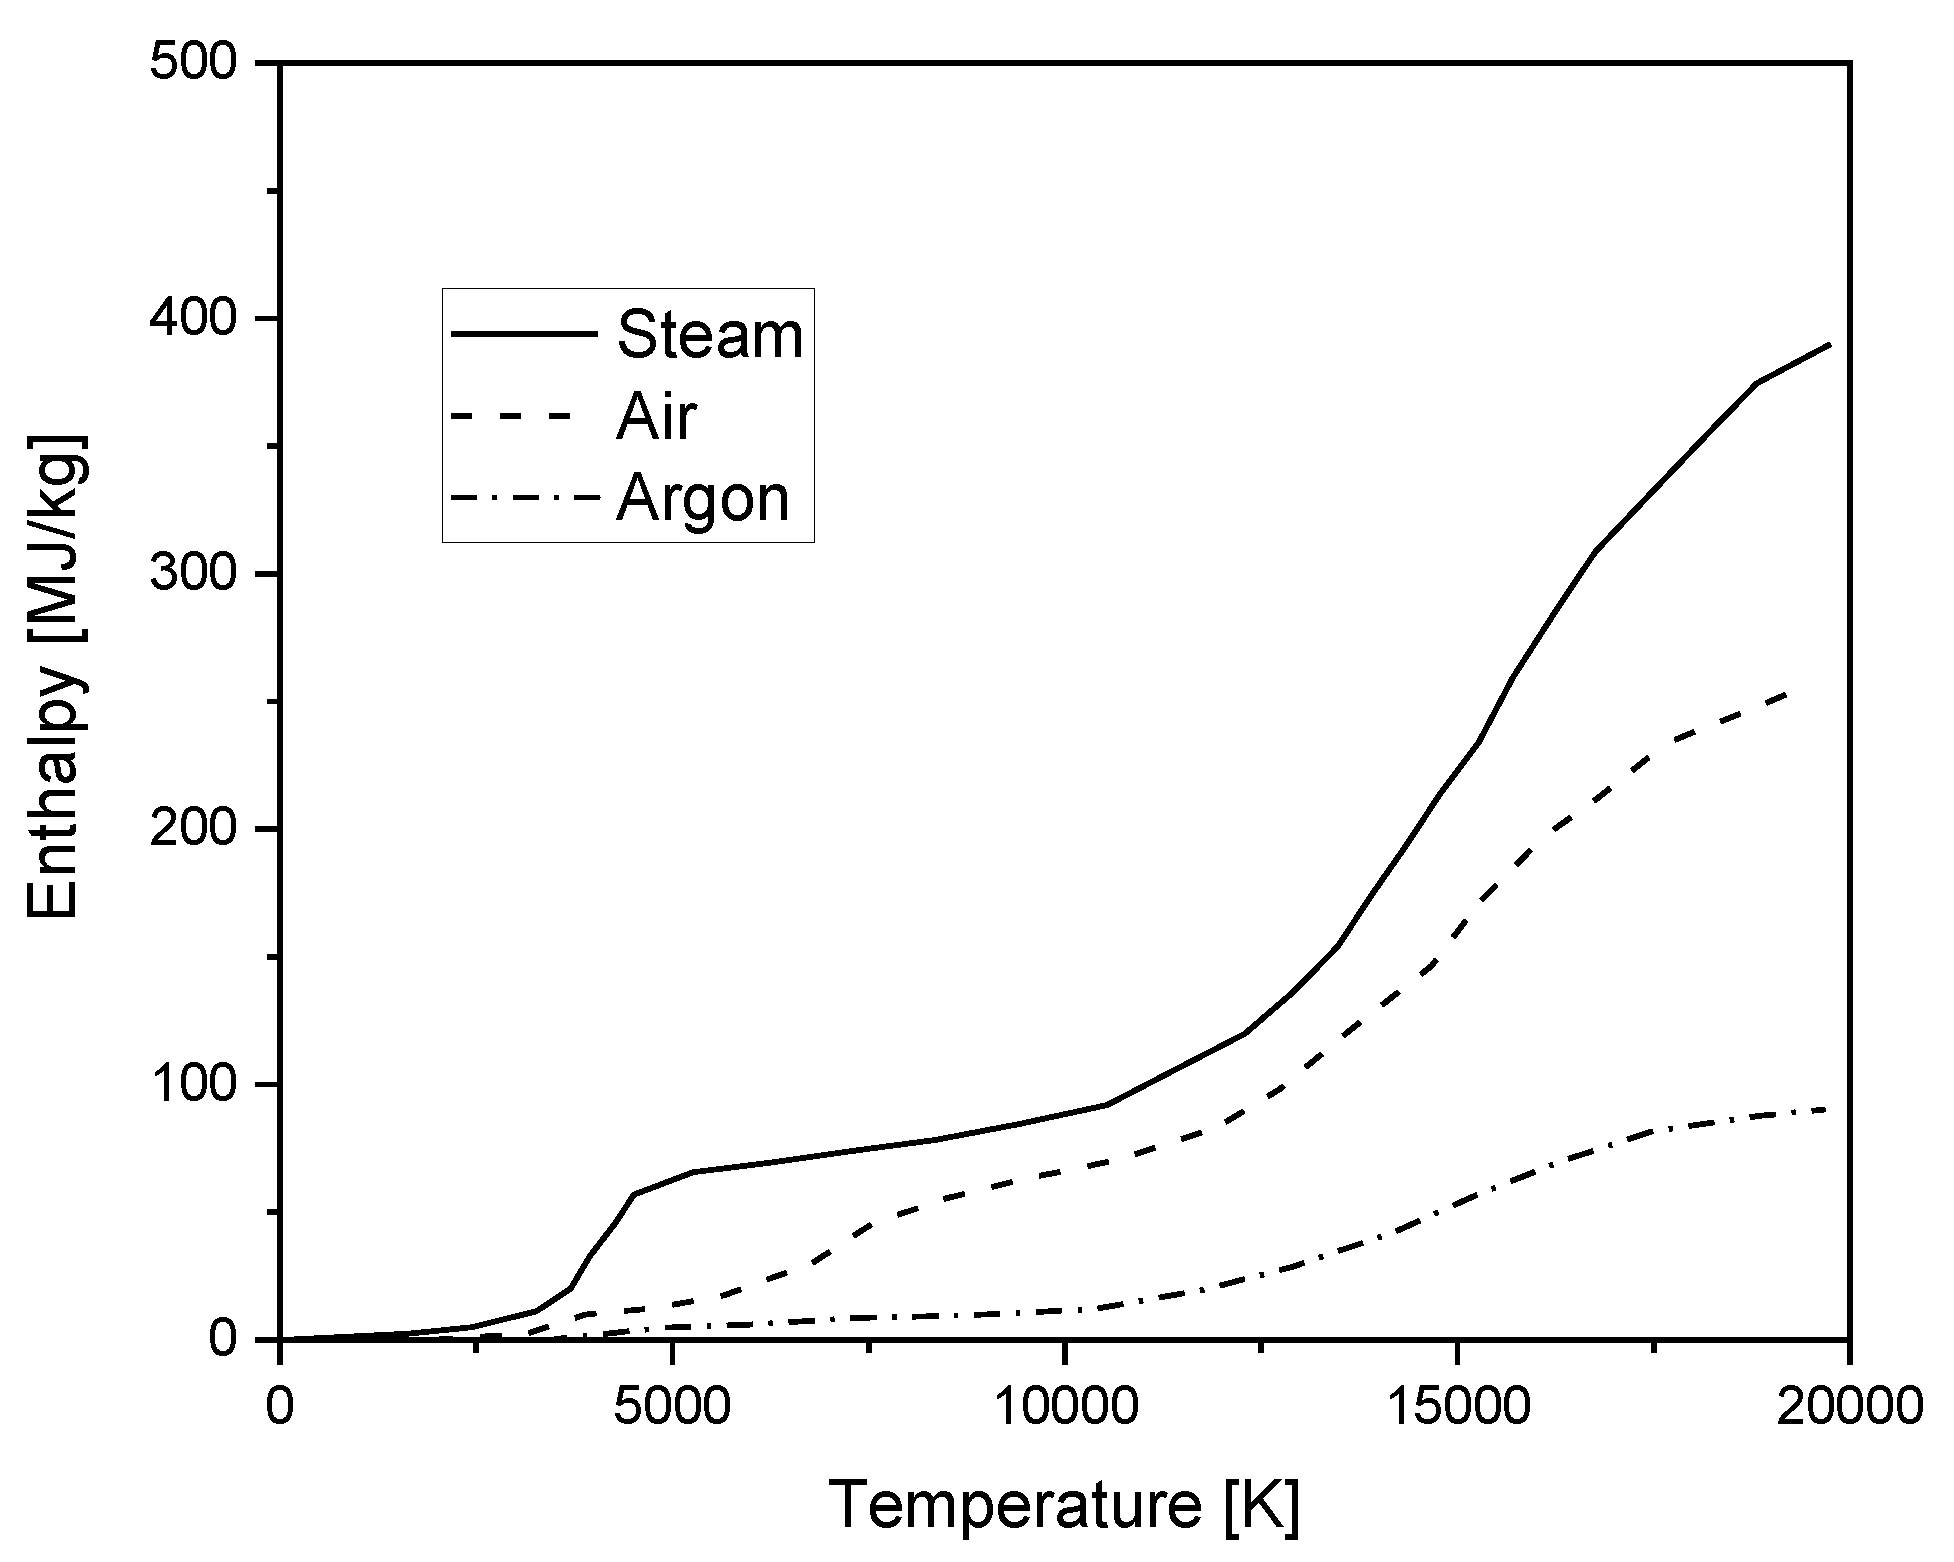
5.6. Enthalpy
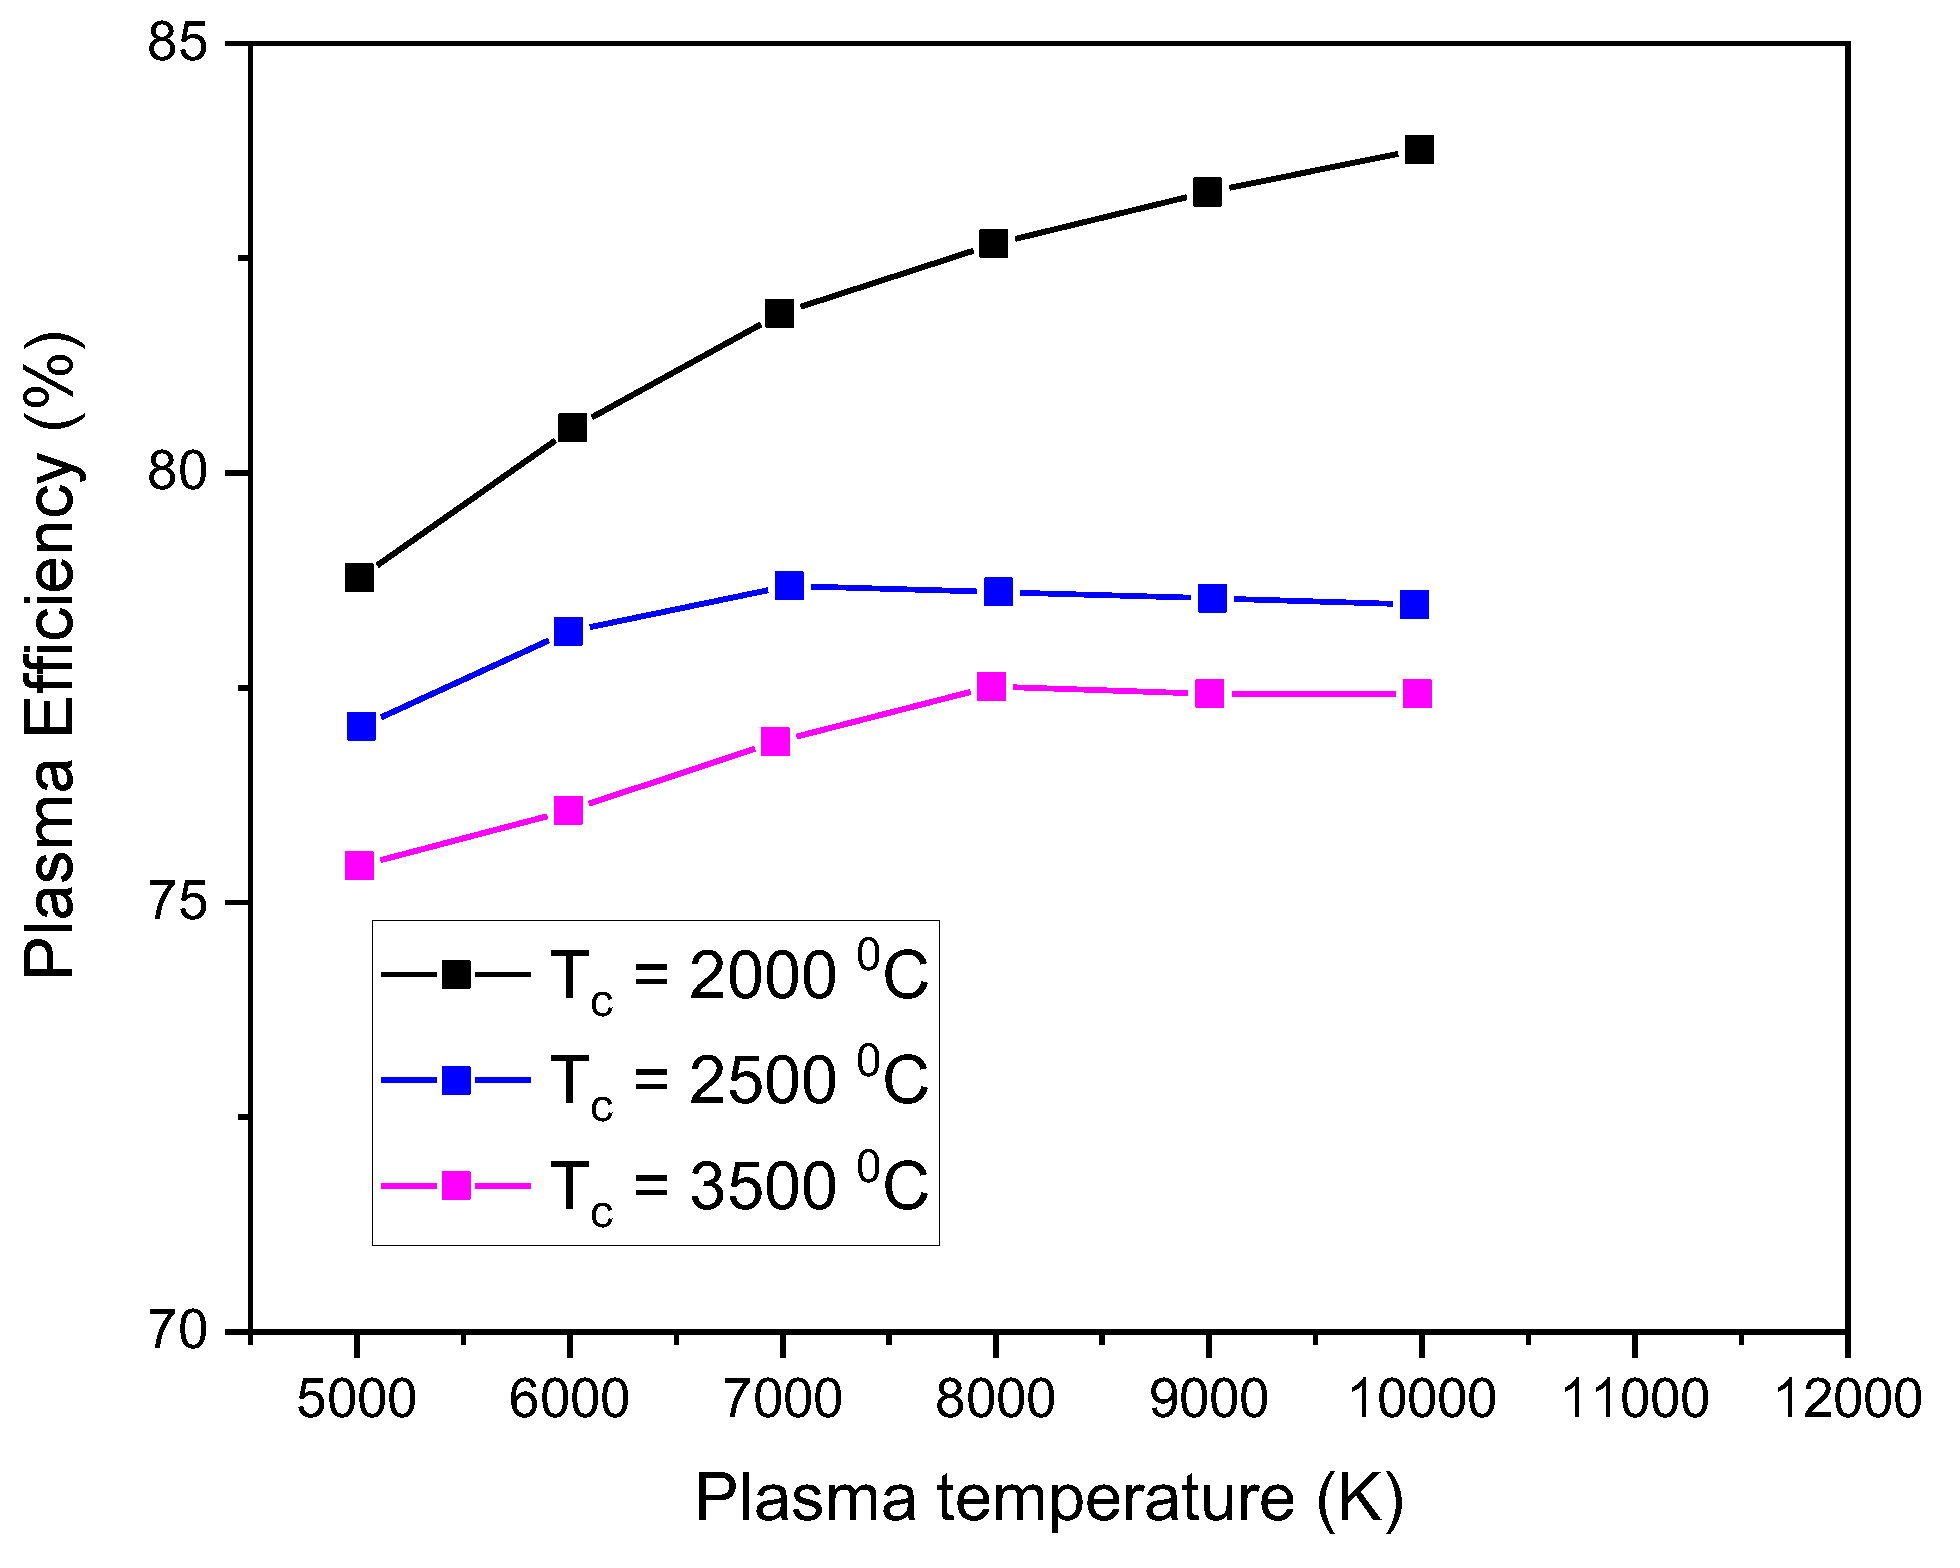
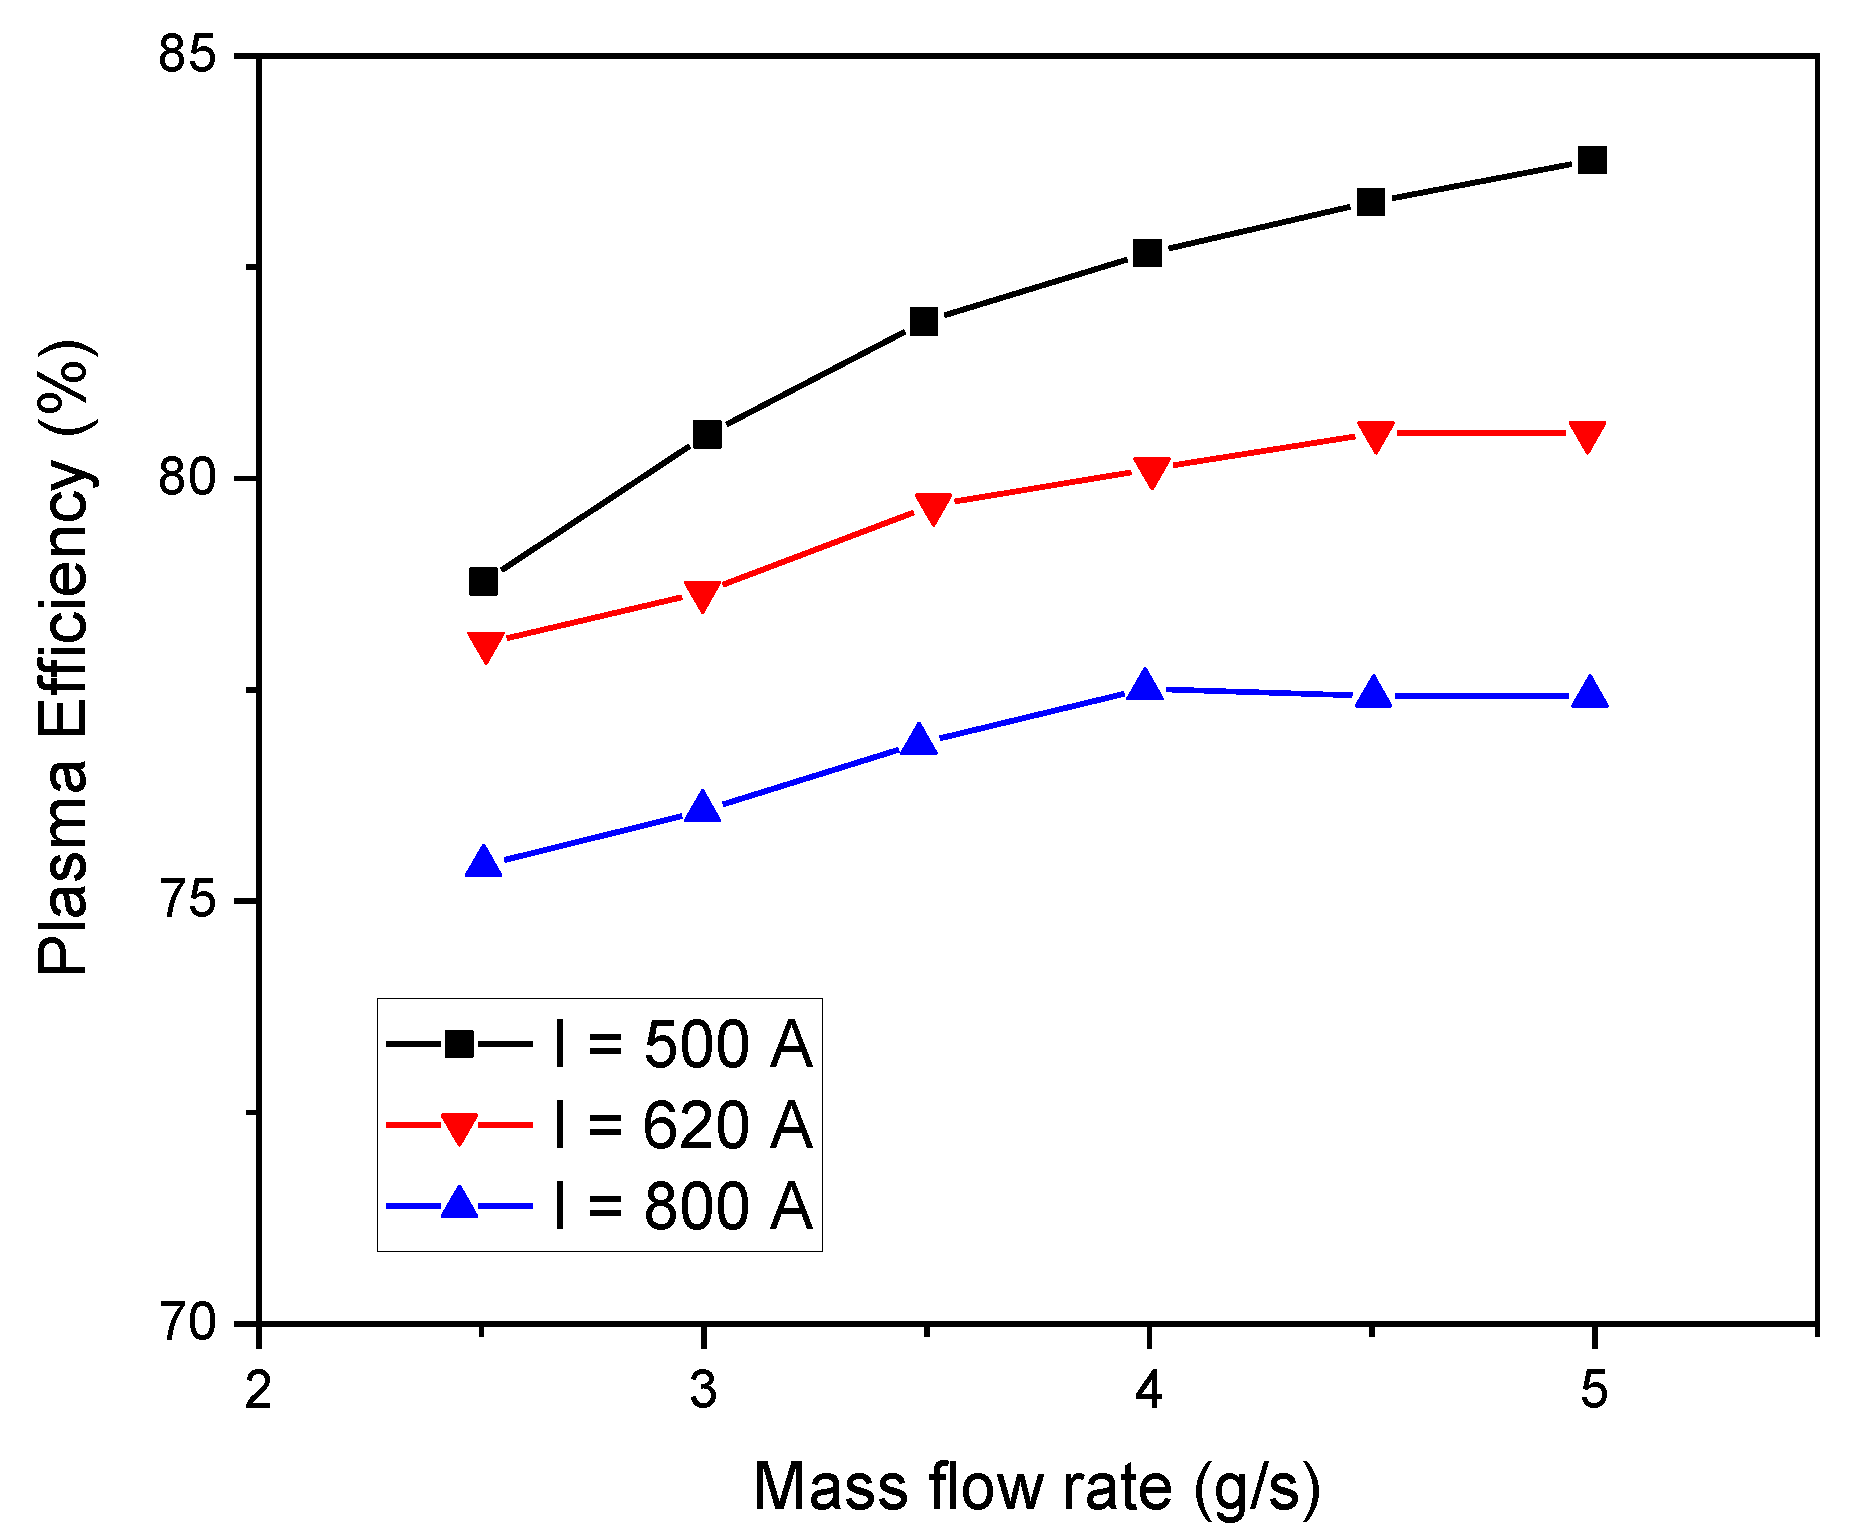
5.7. Efficiency
6. Conclusions
Author Contributions
Funding
Institutional Review Board Statement
Informed Consent Statement
Data Availability Statement
Acknowledgments
Conflicts of Interest
References
- Khan, S.; Anjum, R.; Raza, S.T.; Bazai, N.A. Technologies for municipal solid waste management: Current status, challenges, and future perspectives. Chemosphere 2022, 288 Pt 1, 132403. [Google Scholar] [CrossRef] [PubMed]
- Vyas, S.; Prajapati, P.; Shah, A.V.; Varjani, S. Municipal solid waste management: Dynamics, risk assessment, ecological influence, advancements, constraints and perspectives. Sci. Total Environ. 2022, 814, 152802. [Google Scholar] [CrossRef] [PubMed]
- Andeobu, L.; Wibowo, S.; Grandhi, S. Medical Waste from COVID-19 Pandemic—A Systematic Review of Management and Environmental Impacts in Australia. Int. J. Environ. Res. Public Health 2022, 19, 1381. [Google Scholar] [CrossRef] [PubMed]
- Fazzo, L.; Minichilli, F.; Santoro, M.; Ceccarini, A.; Della Seta, M.; Bianchi, F.; Comba, P.; Martuzzi, M. Hazardous waste and health impact: A systematic review of the scientific literature. Environ. Health 2017, 16, 107. [Google Scholar] [CrossRef] [Green Version]
- Montiel-Bohorquez, N.D.; Saldarriaga-Loaiza, J.D.; Perez, J.F. Analysis of investment incentives for power generation based on an integrated plasma gasification combined cycle power plant using municipal solid waste. Case Stud. Therm. Eng. 2022, 30, 101748. [Google Scholar] [CrossRef]
- Kollu, V.K.R.; Kumar, P.; Gautam, K. Comparison of microwave and autoclave treatment for biomedical waste disinfection. Syst. Microbiol. Biomanuf. 2022, 2, 732–742. [Google Scholar] [CrossRef]
- Tavares, R.; Ramos, A.; Rouboa, A. A theoretical study on municipal solid waste plasma gasification. Waste Manag. 2019, 90, 37–45. [Google Scholar] [CrossRef]
- Li, H.; Sun, C.; Zhang, Y.; Li, T.; Wei, X. Performance investigation of the gasification for the kitchen waste powder in a direct current plasma reactor. J. Energy Inst. 2022, 100, 170–176. [Google Scholar] [CrossRef]
- Ma, W.; Fang, Y.; Chen, D.; Chen, G.; Xu, Y.; Sheng, H.; Zhou, Z. Volatilization and leaching behaviour of heavy metals in MSW incineration fly ash in a DC arc plasma furnace. Fuel 2017, 210, 145–153. [Google Scholar] [CrossRef] [Green Version]
- Zhang, K.; Harvey, A.P. CO2 decomposition to CO in the presence of up to 50% O2 using a nonthermal plasma at atmospheric temperature and pressure. Chem. Eng. J. 2021, 405, 126625. [Google Scholar] [CrossRef]
- Dobslaw, C.; Glocker, B. Plasma Technology and Its Relevance in Waste Air and Waste Gas Treatment. Sustainability 2020, 12, 8981. [Google Scholar] [CrossRef]
- Recebli, Z.; Selimli, S.; Ozkaymak, M.; Gonc, O. Biogas production from animal manure. J. Eng. Sci. Technol. 2015, 10, 722–729. [Google Scholar]
- Sikarwar, V.S.; Hrabovskýa, M.; Oost, G.V.; Pohorelý, M.; Jeremiáš, M. Progress in waste utilization via thermal plasma. Prog. Energy Combust. Sci. 2020, 81, 100873. [Google Scholar] [CrossRef]
- Gabbar, H.A.; Darda, S.A.; Damideh, V.; Hassen, I.; Aboughaly, M.; Lisi, D. Comparative study of atmospheric pressure DC, RF, and microwave thermal plasma torches for waste to energy applications. Sustain. Energy Technol. Assess. 2021, 47, 101447. [Google Scholar] [CrossRef]
- Heberlein, J.; Murphy, A. B Thermal plasma waste treatment. J. Phys. D Appl. Phys. 2008, 41, 053001. [Google Scholar] [CrossRef]
- Valdivia-Barrientos, R.; Ibañez-Olvera, M.; Pacheco-Sotelo, J.; Pacheco-Pacheco, M.; Estrada-Martinez, N.; Silva-Rosas, J.; Rivera-Rodríguez, C. Acid gas degradation by non-thermal plasma and energy estimation. J. Phys. Conf. Ser. 2012, 370, 012037. [Google Scholar] [CrossRef]
- Prado, E.S.P.; Miranda, F.S.; de Araujo, L.G.; Petraconi, G.; Baldan, M.R. Thermal plasma technology for radioactive waste treatment: A review. J. Radioanal. Nucl. Chem. 2020, 325, 331–342. [Google Scholar] [CrossRef]
- Leal-Quiros, E. Plasma Processing of Municipal Solid Waste. Braz. J. Phys. 2004, 34, 1587–1593. [Google Scholar] [CrossRef]
- Sakhrajia, M.; Ramos, A.; Monteiro, E.; Bouziane, K.; Rouboa, A. Plasma gasification process using computational fluid dynamics modelling. Energy Rep. 2022, 8, 1541–1549. [Google Scholar] [CrossRef]
- Li, Y.; Huang, Z.; Xu, Y.; Sheng, H. Plasma-arc technology for the thermal treatment of chemical wastes. Environ. Eng. Sci. 2009, 26, 731–737. [Google Scholar] [CrossRef] [Green Version]
- Tang, L.; Huang, H.; Zhao, Z.; Wu, C.Z.; Chen, Y. Pyrolysis of polypropylene in a nitrogen plasma reactor. Ind. Eng. Chem. Res. 2003, 42, 1145–1150. [Google Scholar] [CrossRef]
- Mountouris, A.; Voutsas, E.; Tassios, D. Solid waste plasma gasification: Equilibrium model development and exergy analysis. Energy Convers. Manag. 2006, 47, 1723–1737. [Google Scholar] [CrossRef]
- Zhang, Q.; Dor, L.; Fenigshtein, D.; Yang, W.; Blasiak, W. Gasification of municipal solid waste in the plasma gasification melting process. Appl. Energy 2012, 90, 106–112. [Google Scholar] [CrossRef]
- Favas, J.; Monteiro, E.; Rouboa, A. Hydrogen production using plasma gasification with steam injection. Int. J. Hydrogen Energy 2017, 42, 10997–11005. [Google Scholar] [CrossRef]
- Janajreh, I.; Raza, S.S.; Valmundsson, A.S. Plasma gasification process: Modelling, simulation, and comparison with conventional air gasification. Energ Convers. Manag. 2013, 65, 801–809. [Google Scholar] [CrossRef]
- COMSOL Multiphysics® V. 5.1. CFD Module User’s Guide; COMSOL AB: Stockholm, Sweden, 2015; Available online: http://www.comsol.com (accessed on 1 November 2021).
- Kuo, Y.M.; Chang, J.E.; Chang, Y.; Chao, C.C.; Tuan, Y.J.; Chang-Chien, G.P. Stabilization of Residues Obtained from the Treatment of Laboratory Waste. Part 1-Treatment Path of Metals in a Plasma Melting System. J. Air Waste Manag. 2010, 60, 429–438. [Google Scholar] [CrossRef]
- Barjasteh, A.; Dehghani, Z.; Lamichhane, P.; Kaushik, N.; Choi, E.H.; Kaushik, N.K. Recent Progress in Applications of Non-Thermal Plasma for Water Purification, Bio-Sterilization, and Decontamination. Appl. Sci. 2021, 11, 3372. [Google Scholar] [CrossRef]
- Li, J.; Liu, K.; Yan, S.; Li, Y.; Han, D. Application of thermal plasma technology for the treatment of solid wastes in China: An overview. Waste Manag. 2016, 58, 260–269. [Google Scholar] [CrossRef]
- Zhao, P.; Ni, G.; Jiang, Y.; Chen, L.; Chen, M.; Meng, Y. Destruction of inorganic municipal solid waste incinerator fly ash in a DC arc plasma furnace. J. Hazard. Mater. 2010, 181, 580–585. [Google Scholar] [CrossRef]
- Zhang, Q.; Dor, L.; Zhang, L.; Yang, W.; Blasiak, W. Performance analysis of municipal solid waste gasification with steam in a Plasma Gasification Melting reactor. Appl. Energy 2012, 98, 219–229. [Google Scholar] [CrossRef]
- Gomez, E.; Amutha Rani, D.; Cheesemanb, C.R.; Deeganc, D.; Wisec, M.; Boccaccini, A.R. Thermal plasma technology for the treatment of wastes: A critical review. J. Hazard. Mater. 2009, 161, 614–626. [Google Scholar] [CrossRef] [PubMed]
- Zhang, Q.; Dor, L.; Biswas, A.K.; Yang, W.; Blasiak, W. Modelling of steam plasma gasification for municipal solid waste. Fuel Process. Technol. 2013, 106, 546–554. [Google Scholar] [CrossRef]
- Chiné, B. A 2D Model of a Plasma Torch. In Proceedings of the 2016 Comsol Conference, Munich, Germany, 12–14 October 2016; Available online: https://www.comsol.ch/paper/download/357271/chine__paper.pdf (accessed on 7 September 2022).
- Mashayak, S.Y. CFD Modeling of Plasma Thermal Reactor for Waste Treatment. Master’s Thesis, Purdue University West Lafayette, West Lafayette, IN, USA, August 2009. [Google Scholar]
- Ibrahimoglu, B.; Cucen, A.; Yilmazoglu, M.Z. Numerical Modelling of DC Arc Plasma Torch with MHD Module. In Proceedings of the 1st International Plasma Technologies Congress, Kayseri, Turkey, 28–30 April 2014. [Google Scholar]
- Soni, V.; Naik, V. Gasification—A Process for Energy Recovery and Disposal of Municipal Solid Waste. Am. J. Mod. Energy 2016, 2, 38–42. [Google Scholar] [CrossRef]
- Bauchire, J.M.; Gonzalez, J.J.; Gleizes, A. Modeling of a DC Plasma Torch in Laminar and Turbulent Flow. Plasma Chem. Plasma Process. 1997, 17, 409–432. [Google Scholar] [CrossRef]
- Anggraini, R.A.N.; Kusumandari, K.; Saraswati, T.E. Plasma reactor with continuous flow system for degradation of methylene blue. AIP Conf. Proc. 2018, 2014, 020037. [Google Scholar] [CrossRef]
- Trelles, J.P.; Chazelas, C.; Vardelle, A.; Heberlein, J.V.R. Arc Plasma Torch Modeling. J. Therm. Spray Technol. 2009, 18, 5–6. [Google Scholar] [CrossRef] [Green Version]
- Trelles, J.P.; Heberlein, J.V.R. Simulation Results of Arc Behaviour in Different Plasma Spray Torches. J. Therm. Spray Technol. 2006, 15, 563–569. [Google Scholar] [CrossRef]
- Boulos, M.I.; Fauchais, P.; Pfender, E. Thermal Plasmas: Fundamentals and Applications, 1st ed.; Plenum Press: New York, NY, USA, 1994; 467p, ISBN 978-1489913388. [Google Scholar]
- Li, H.P.; Zhang, X.N.; Xia, W.D. A numerical model of non-equilibrium thermal plasmas. II. Governing equations. Phys. Plasmas 2013, 20, 033509. [Google Scholar] [CrossRef]
- Dedulle, J.M. Pedagogic using of COMSOL Multiphysics for learning Numerical Method and Numerical Modelling. In Proceedings of the Conference COMSOL Multiphysics, Paris, France, 12 December 2007. [Google Scholar]
- Samal, S.; Blanco, I. An Overview of Thermal Plasma Arc Systems for Treatment of Various Wastes in Recovery of Metals. Materials 2022, 15, 683. [Google Scholar] [CrossRef]
- Pfender, E.; Fincke, J.; Spores, R. Entrainment of Cold Gas into Thermal Plasma Jets. Plasma Chem. Plasma Process. 1991, 11, 529. [Google Scholar] [CrossRef]
- Kuzenov, V.V.; Ryzhkov, S.V. The Qualitative and Quantitative Study of Radiation Sources with a Model Configuration of the Electrode System. Symmetry 2021, 13, 927. [Google Scholar] [CrossRef]
- Bogaerts, A.; Tu, X.; Whitehead, J.C.; Centi, G.; Lefferts, L.; Guaitella, O.; Azzolina-Jury, F.; Kim, H.H.; Murphy, A.B.; Schneider, W.F.; et al. The 2020 plasma catalysis roadmap. J. Phys. D Appl. Phys. 2020, 53, 443001. [Google Scholar] [CrossRef]
- Minutillo, M.; Perna, A.; Di Bona, D. Modelling and performance analysis of an integrated plasma gasification combined cycle (IPGCC) power plant. Energy Convers. Manag. 2009, 50, 2837–2842. [Google Scholar] [CrossRef]
- Selvan, B.; Ramachandran, K.; Pillai, B.C.; Subhakar, D. Modelling of the plasma-substrate interaction and prediction of substrate temperature during the plasma heating. Eur. Phys. J. D 2011, 61, 663–675. [Google Scholar] [CrossRef]
- Chen, X.; Geng, Y.; Fujita, T. An overview of municipal solid waste management in China. Waste Manag. 2010, 30, 716–724. [Google Scholar] [CrossRef] [PubMed]
- Murashov, I.; Frolov, V.; Korotkik, M.; Ushomirskaya, L. Numerical simulation of DC air plasma torch modes and plasma jet instability for thermal spraying technology. MATEC Web Conf. 2018, 245, 04003. [Google Scholar] [CrossRef]
- Duan, Z.; Heberlein, J. Arc Instabilities in a Plasma Spray Torch. J. Therm. Spray Technol. 2002, 11, 44–51. [Google Scholar] [CrossRef]
- Trelles, J.P. Computational study of flow dynamics from a dc arc plasma jet. J. Phys. D Appl. Phys. 2013, 46, 255201. [Google Scholar] [CrossRef]
- Cedzvnska, K.; Kolacinski, Z.; Izydorczyk, M.; Sroczynski, W. Plasma vitrification of waste incinerator ashes. In International Ash Utilization Symposium; Center of Applied Energy Research, University of Kentucky: Kentucky, UK, 1999. [Google Scholar]
- Bolot, R.; Li, J.; Coddet, C. Modeling of thermal plasma jets: A comparison between PHOENICS and FLUENT. In ITSC2004; ASM International: Almere, The Netherlands, 2004. [Google Scholar] [CrossRef]
- Shumeiko, A.I.; Telekh, V.D.; Ryzhkov, S.V. Probe Diagnostics and Optical Emission Spectroscopy of Wave Plasma Source Exhaust. Symmetry 2022, 14, 1983. [Google Scholar] [CrossRef]
- Lebouvier, A.; Delalondre, C.; Fresnet, F.; Boch, V.; Rohani, V.; Cauneau, F.; Fulcheri, L. Three-Dimensional Unsteady MHD Modeling of a Low Current—High Voltage Non-Transferred DC Plasma Torch Operating with Air. IEEE Trans. Plasma Sci. 2011, 39, 1889–1899. [Google Scholar] [CrossRef] [Green Version]
- Li, H.; Li, T.; Wei, X. Main performance analysis of kitchen waste gasification in a small-power horizontal plasma jet reactor. J. Energy Inst. 2020, 93, 367–376. [Google Scholar] [CrossRef]
- Franciélle, R.; Paulino, S.; Essiptchouk, A.M.; Costa, L.P.C.; Silveira, J.L. Thermodynamic analysis of biomedical waste plasma gasification. Energy 2021, 244 Pt A, 122600. [Google Scholar] [CrossRef]
- Valmundsson, A.S.; Janajreh, I. Plasma gasification process modelling and energy recovery from solid waste. In Proceedings of the ASME 2011 5th International Conference on Energy Sustainability ES2011, Washington, DC, USA, 7–10 August 2011. [Google Scholar] [CrossRef]
- Zhovtyansky, V.; Valinčius, V. Efficiency of Plasma Gasification Technologies for Hazardous Waste Treatment. In Gasification for Low-Grade Feedstock; Yun, Y., Ed.; IntechOpen: Rijeka, Croatia, 2018; Chapter 9. [Google Scholar] [CrossRef] [Green Version]
- Selvan, B.; Ramachandran, K. Comparisons Between Two Different Three-Dimensional Arc Plasma Torch Simulations. J. Therm. Spray Technol. 2009, 18, 846. [Google Scholar] [CrossRef]
- Achinas, S.; Kapetanios, E. Efficiency Evaluation of RDF Plasma Gasification Process. Energy Environ. Res. 2013, 3, 150–157. [Google Scholar] [CrossRef] [Green Version]


| Parameters | Values |
|---|---|
| Power | 75–10,000 kW |
| Voltage | 150–10,000 V |
| Current | 500–1000 A |
| Plasma gas | Air |
| Air flow rate | 4–10 g/s |
| Temperature of exit gas in plasma jet | 5000–100,000 K |
| Pressure | 1 atm |
| Inlet | Outlet | Walls | Anode | Cathode Tip | Cathode | |
|---|---|---|---|---|---|---|
| (m/s) | /ρAinlet | 0 | 0 | 0 | 0 | |
| (m/s) | 0 | 0 | 0 | 0 | 0 | |
| (m/s) | 6.1 to 19.1 | 0 | 0 | 0 | 0 | |
| T (K) | 300 | |||||
| 0 | −σ = J(r) | |||||
| 1.013 × 10⁵ | ||||||
| 0 | ||||||
| 0 | ||||||
| 0 | ||||||
| (m/s) | /ρAinlet | 0 | 0 | 0 | 0 | |
| (m/s) | 0 | 0 | 0 | 0 | 0 |
Disclaimer/Publisher’s Note: The statements, opinions and data contained in all publications are solely those of the individual author(s) and contributor(s) and not of MDPI and/or the editor(s). MDPI and/or the editor(s) disclaim responsibility for any injury to people or property resulting from any ideas, methods, instructions or products referred to in the content. |
© 2023 by the authors. Licensee MDPI, Basel, Switzerland. This article is an open access article distributed under the terms and conditions of the Creative Commons Attribution (CC BY) license (https://creativecommons.org/licenses/by/4.0/).
Share and Cite
Elaissi, S.; Alsaif, N.A.M. Modeling and Performance Analysis of Municipal Solid Waste Treatment in Plasma Torch Reactor. Symmetry 2023, 15, 692. https://doi.org/10.3390/sym15030692
Elaissi S, Alsaif NAM. Modeling and Performance Analysis of Municipal Solid Waste Treatment in Plasma Torch Reactor. Symmetry. 2023; 15(3):692. https://doi.org/10.3390/sym15030692
Chicago/Turabian StyleElaissi, Samira, and Norah A. M. Alsaif. 2023. "Modeling and Performance Analysis of Municipal Solid Waste Treatment in Plasma Torch Reactor" Symmetry 15, no. 3: 692. https://doi.org/10.3390/sym15030692