1. Introduction
The gait function is possible even with simple mechanical lower-limb prostheses [
1,
2]. Advanced bionic lower-limb prostheses allow for adjusting the settings within the ankle joint depending on the gait cycle [
3]. The running function is often associated with a far-reaching modification of the prosthesis structure, where the mechanics and shape do not resemble those of the amputated part of the limb [
4].
The prosthesis replaces the lost part of the body. An important factor in prosthesis is the recovery of lost functions, the most important of which is the gait function coming as close as possible to the state before amputation. The problem arises at the stage of defining the correct gait function. Gait is an individual feature of each of us, allowing us to stand out, just like in the case of fingerprints. That this feature does not remain constant and is adjusted depending on various factors [
5].
Therefore, it is extremely difficult to determine the quality of gait in amputated patients. There is no doubt that the quality of life of amputees is related to the quality of walking. It has been shown that prosthesis is mainly related to the age of the patient [
6]. On the other hand, gait in people after lower-limb amputation never recreates the function of the gait before amputation. Gait cycles are overimposed repetitive loops of stance and swing phase for each leg with a ratio of 60 to 40%. Each step forward makes the upright body lose its balance with consecutive steps to regain it temporarily. The forces produced by the gait cycle allow the movement of the body. Those are the main features of the gait: movement and balance. They are strictly related to each other. A proper gait is harmonious due to each cycle being repeated with proper timing.
The evaluation of the gait can be descriptive—by observation of the gait cycle or by measuring its parameters, which can be grouped in three main categories: main temporal-spatial, kinematic, and dynamic or additional.
Many factors can affect the quality of walking after amputation, but it is still difficult to relate them to the quality of walking. Van Velzen et al. (2006) showed strong correlation between balance and walking ability and doubtful or insufficient relations between other elements of physical capacity and walking ability. Despite this, the authors point out that other factors should not be ignored, especially at the rehabilitation stage [
1].
Following lower-limb amputation, demographics (i.e., age, sex, and amputation etiology) have been identified as non-modifiable factors impacting function [
7]. Given the complex interdependence of physical, personal, and specific factors in amputees influencing gait asymmetry, multivariate analyses can identify which of these factors have the greatest impact on people with lower-limb amputation and can help clinicians focus their treatment on the most critical factors [
8].
The aim of this study was to determine the factors influencing the asymmetry of gait in amputated patients. The study attempted to determine the correlation of the quality of gait in prosthetic patients with demographic factors (age, sex), morphological features (height, weight), factors related to amputation (cause and side of amputation, time of prosthesis, and prosthesis fixation), and pain.
2. Materials and Methods
The study was conducted in two groups: the study group—consisting of people after unilateral amputation in the area of the lower leg—and the control group.
The study group consisted of 12 people, including 4 women and 8 men. The age range was 20–73 years. The most common cause of amputation was trauma, e.g., as a result of a traffic accident (in half of the subgroup). Other causes were described as non-traumatic (diabetes, sepsis). In seven people the amputated limb was the lower left limb, and in five the right. Inclusion criteria included one-side below-knee amputation, time since amputation, using the prosthesis for more than one year, and no additional support during normal walking, whereas the exclusion criteria were bruises or scarring of the stum, other conditions necessitating the readjustment of the prosthesis, other medical conditions with possible pain localized in the limb (disc protrusion or other root compression due to degeneration, osteoarthritis of the hip joint or knee joint), and lack of agreement to participate in the study.
All subjects used a prosthesis with a rigid foot, that is, it did not reflect the movement in the ankle joint. Three of the participants walked on a wooden one and the remaining nine on a composite prosthetic foot. The types of prosthetic suspensions were as follows: PIN (four people) and negative pressure; passive—five people and active—three people. Most prosthetic users experienced pain in the lower lumbar spine, as well as around the knee and hip when walking for a long time. There were also occasional pains and abrasions in the area of the arrowhead. Excluding factors from the study were amputation at the level of the knee joint and above, amputation of both lower limbs, lack of regular use of the prosthesis, age under 18 or over 75 years, and the use of additional support while walking (armpits, elbows, tripod, quadruple, walker, etc.).
The control group consisted of 14 people (4 women and 10 men) aged 24–45 years, without developmental deformities in the lower limbs and with a negative medical history of injuries in the lower limbs. Control-group inclusion criteria were healthy individuals with no trauma of the lower limb in medical history, and exclusion criteria were malformation of the lower limbs or limb discrepancy, pain of any nature during walking, and lack of the agreement to participate the study.
2.1. Gait Analysis
The tests were performed in the biomechanics laboratory of the locomotor system at ENforce Medical Technologies LLC (ul. Szelagowska 45 A, Poznan, Poland) in the period from December 2021 until March 2022. The gait analysis was performed by a trained physiotherapist (coauthor KŁ) with 2 years’ experience with gait analysis both in clinical application and evaluating reports from the gait laboratory.
Gait quality was assessed on the basis of the following parameters:
The difference in the length of the support phase of the left and right limbs (%) (diff_supp_ph_%);
The difference in the length of the support phase of the left and right limbs (s) (diff_supp_ph);
Width of the support base during the double-support phase (m) (width_supp_base);
Average walking speed (m/s) (walking speed);
Ankle ROM difference in flexion and extension of the normal limb to the prosthetic joint (°) (diff_ROM).
The studies were performed using the Motion Capture MoCap OptiTrack
® system (NaturalPoint, Inc. DBA OptiTrack—Corvallis, OR, USA). The gait study was performed on motion-measurement equipment using slow-motion cameras recording the movement of passive markers located at characteristic points on the subject’s body (
Figure 1). Information about the movement of individual points on the body was further embedded in the coordinate system in Motive. The analysis of the results from the study was performed in SST SYSTEMS Clinical 3DMA (
Figure 2).
At the beginning, the examined person walked several laps around the laboratory in order to become familiar with the measuring track, and then the gait recording began. There were no tripping hazards in the measuring area and the floor was lined with a rubber lining to minimize the risk of the patient slipping.
The task of the subject was to walk 20–30 times the length of the 6.5 m-long, 1.5 m-wide track at the speed that was optimal for them. The number of passes depended on the patient’s physical condition, the occurrence of pain symptoms, and the body’s capacity.
The processing of the receipt of the results to obtain the final reports and recordings was performed with the Motive and STT Insight applications. The middle of all registered crossings was analyzed. Additionally, the material for the analysis was verified by a biomechanist and a physiotherapist in order to exclude incidental gait disturbances.
The final report included the assessed parameters in the form of averaging data from several gait cycles, allowing the comparison of the left and right limbs at the same time. In addition, the results were plotted on the parameters of healthy people available in the SST SYSTEMS Clinical 3DMA application.
The obtained parameters describing the quality of gait were combined with the following epidemiological data: age, weight, height, side of amputation, period of prosthesis, cause of amputation, occurrence of pain, type of prosthetic foot, and type of prosthetic socket.
2.2. Statystical Analysis
The analysis used Statistica software (Version 13.0, StatSoft Inc., Tulsa, OK, USA). Spearman’s rank correlation was performed to determine the relationship between the gait-quality parameters and epidemiological and clinical parameters. The analysis was performed to evaluate variables from the independent assumption showing the mutual relationships between the analyzed factors by applying principal component analysis (PCA).
3. Results
There was no correlation between the difference in the length of the support phase of the left and right limbs and age, body weight, and height in either the control or the amputation group. In the control group, there was a positive correlation (0.54) with the width of the base of support during the double-support phase, which was not shown in the amputated group.
A positive correlation was found between the average walking speed and height in the study group. The parameter was significantly negatively correlated with age in the study group (−0.76), whereas in the control group the correlation was −0.46 and no statistical significance was demonstrated (
Table 1.).
The ratio/difference of ankle-joint ROM for both limbs was negatively correlated with age in both the control and amputation groups. A significant positive correlation was shown between the ankle ROM ratio of both limbs and the height in the test group (−0.61), whereas in the control group the correlation was the opposite (−0.51).
The gait-quality parameters were not statistically significantly associated with pain intensity or duration of prosthesis.
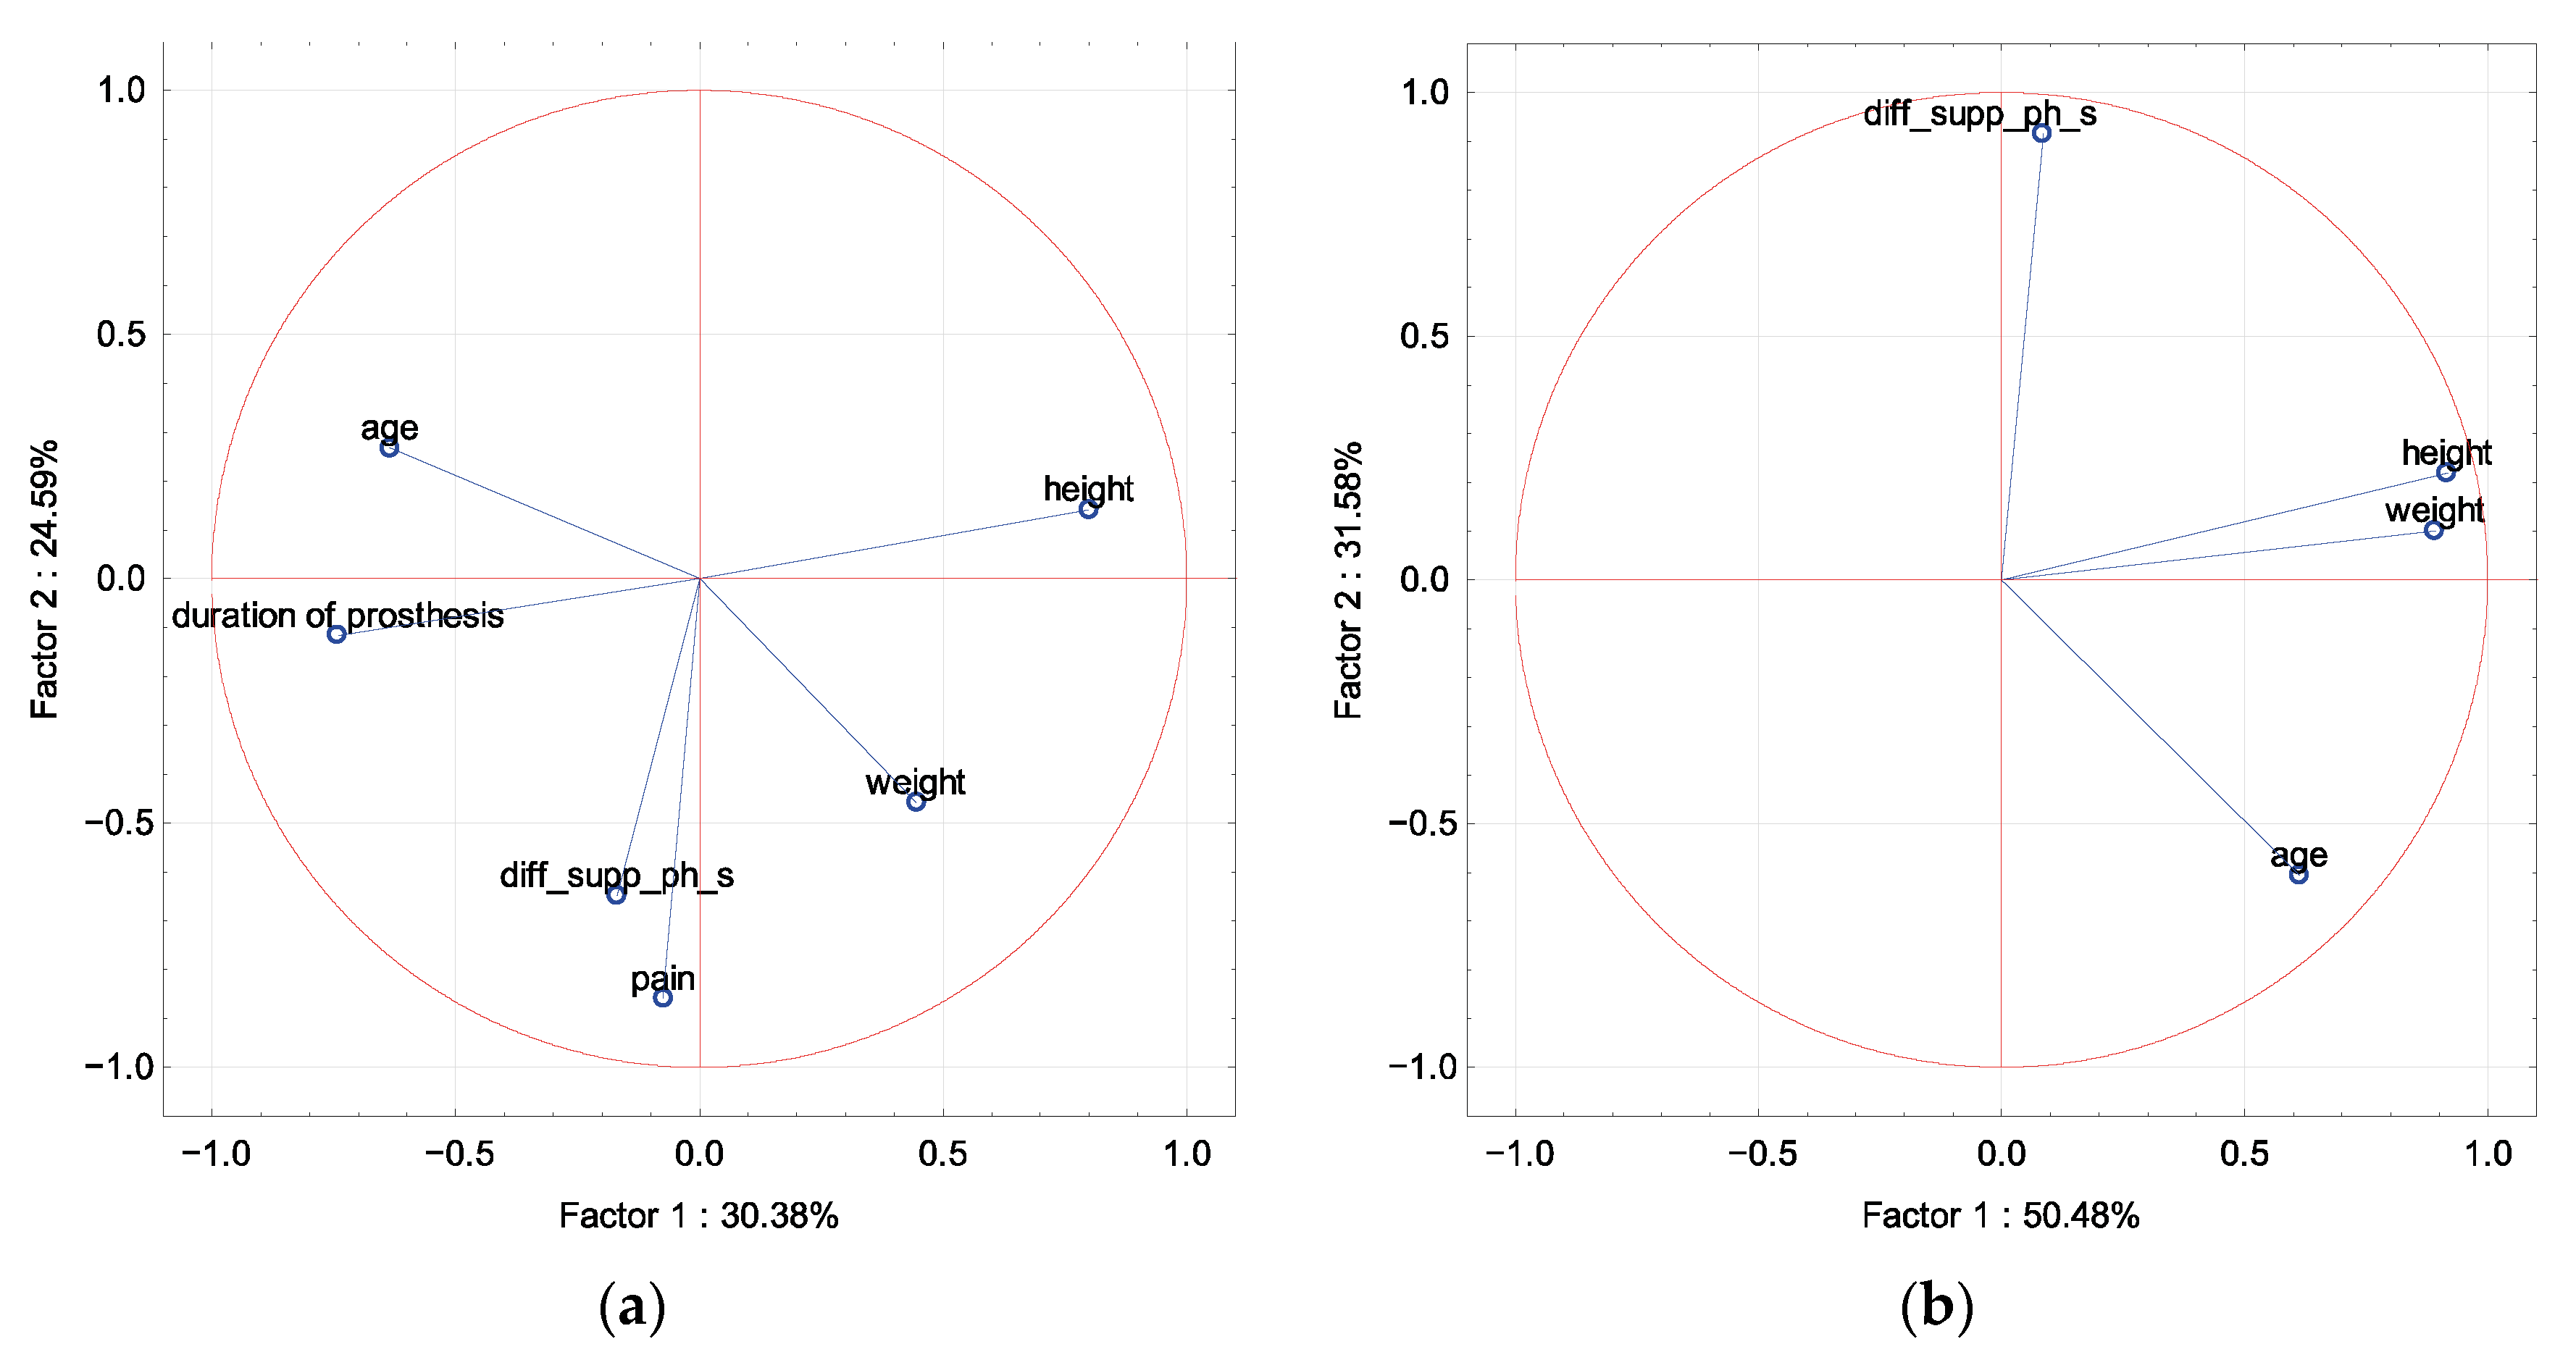
In PCA in the amputation and control groups, the difference in the length of the support phase of the left and right limbs (s) and (%) was described by factor 2, whereas the epidemiological parameters were described by factor 1, with age and duration of prosthesis correlated with each other (
Figure 3 and
Figure 4).
In PCA in the amputation and control groups, the width of the support base during the double-support phase (m) was described by factor 2, whereas the epidemiological parameters were described by factor 1, with age and duration of prosthesis in the amputation group correlated with each other (
Figure 5).
In PCA in the amputation and control groups, mean walking speed was described by factor 1 as opposed to age. Body weight was described by factor 2 (
Figure 6).
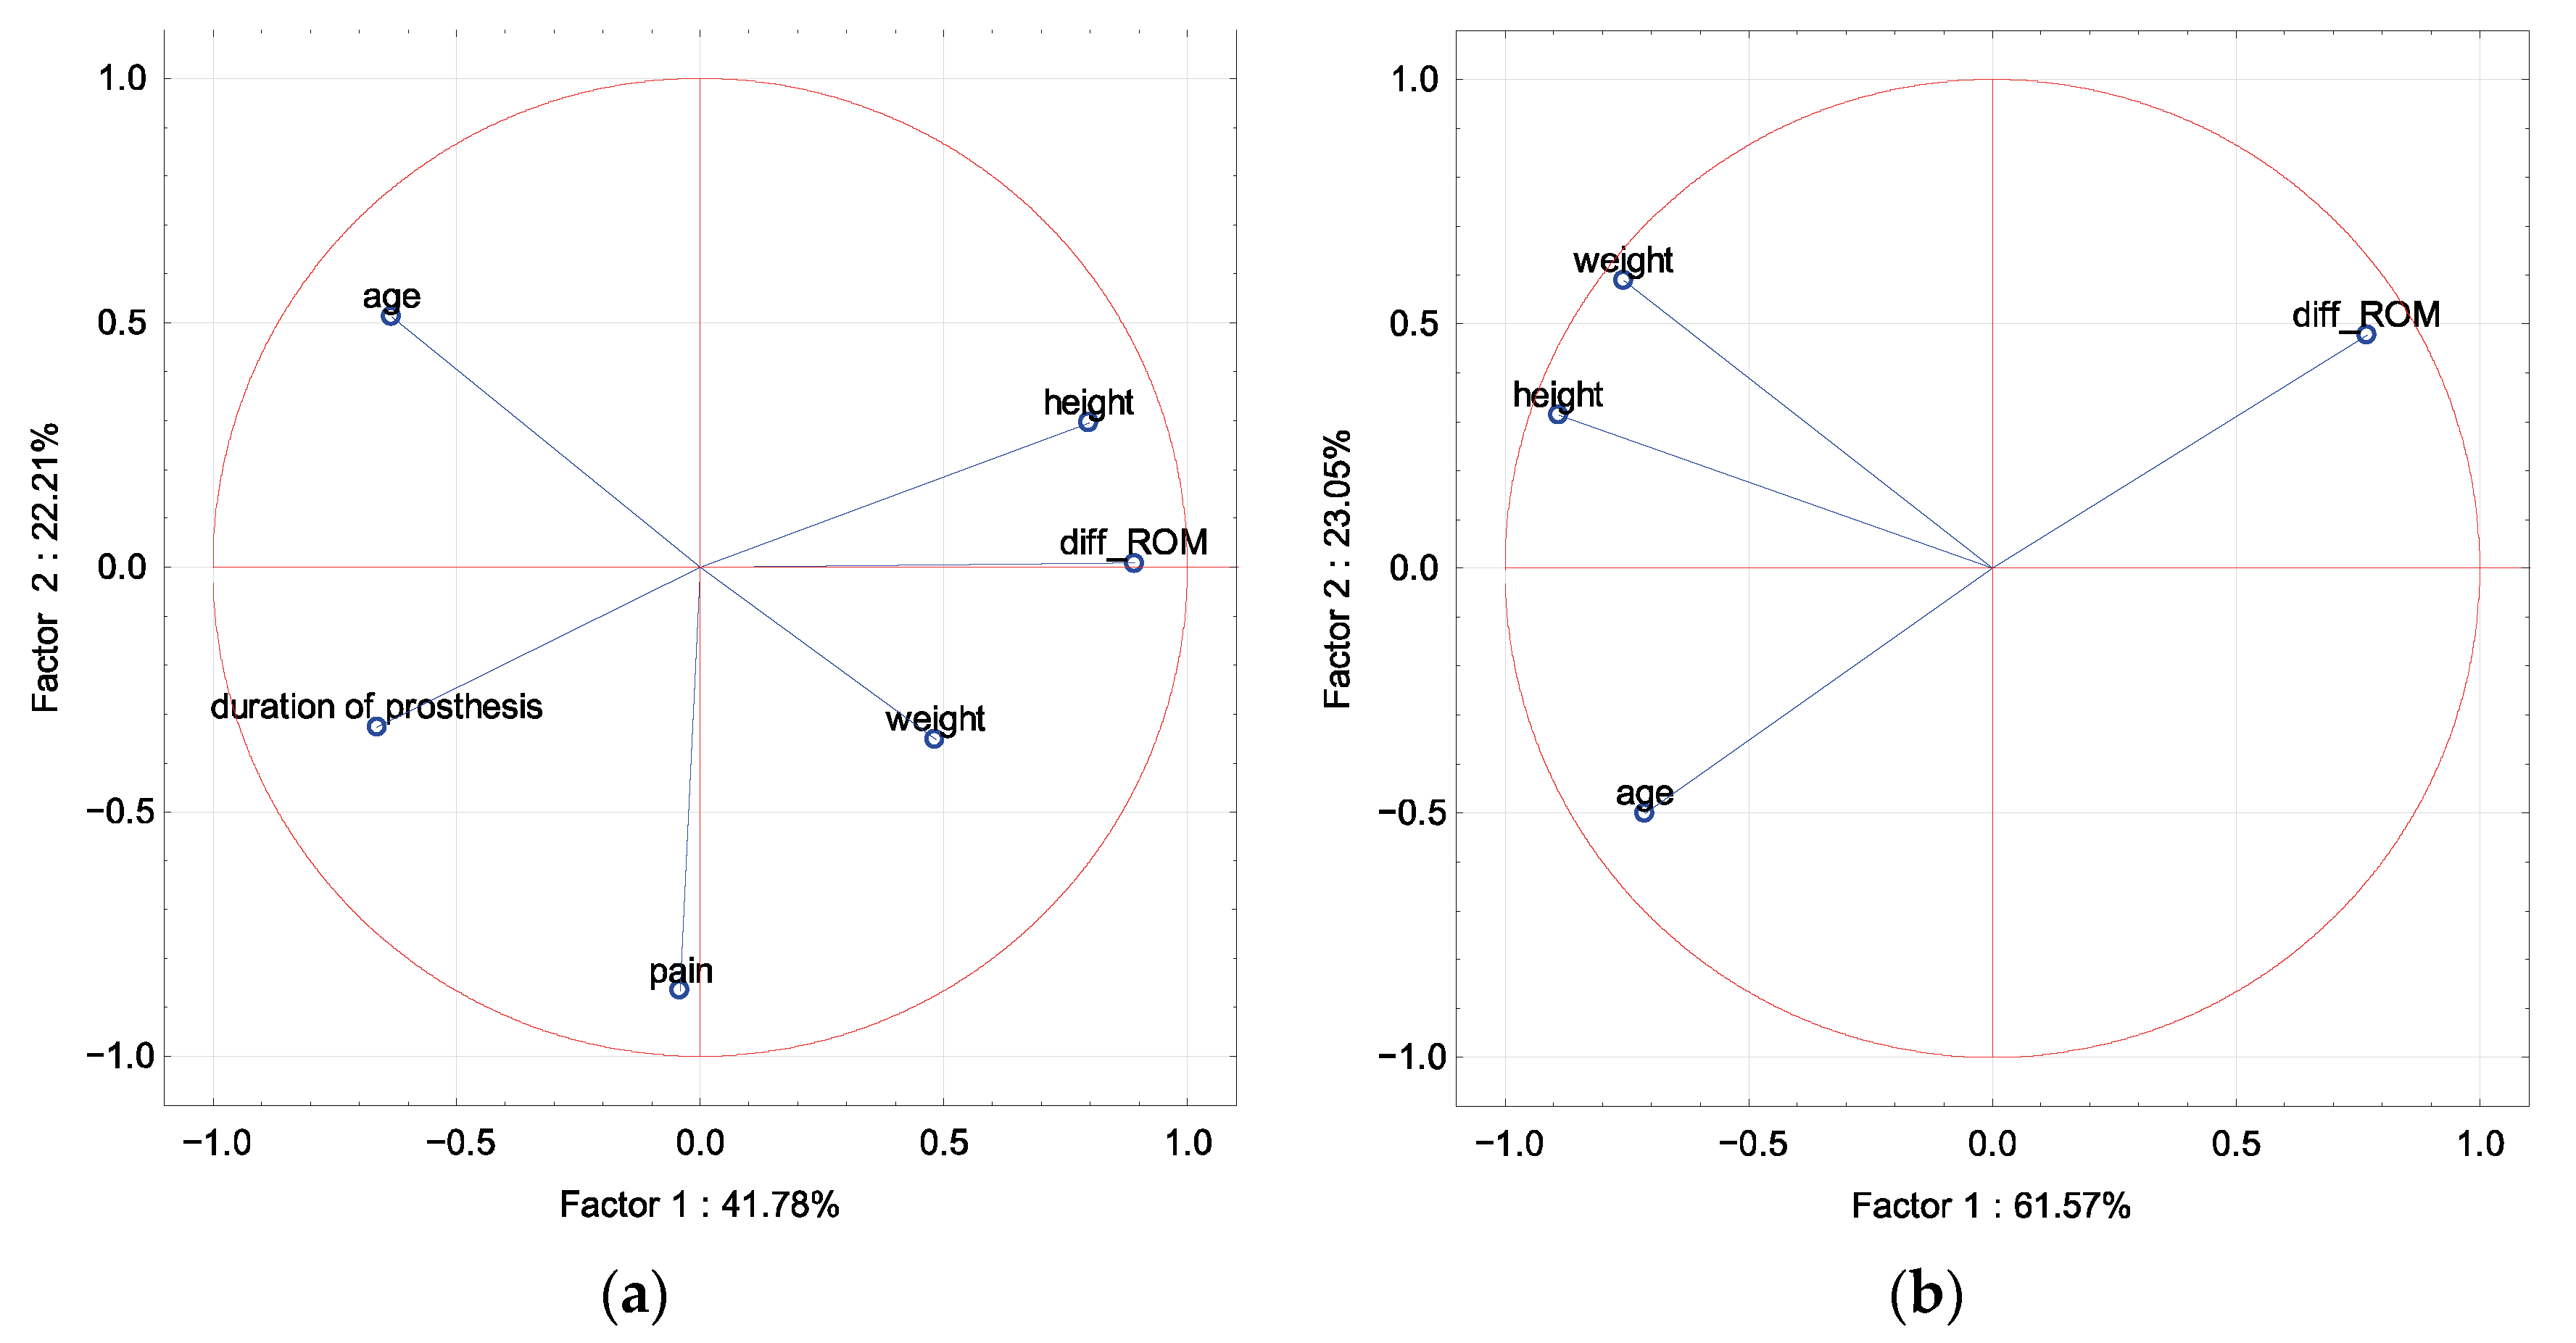
In PCA in the amputation and control groups, the difference in ROM was described by factor 1, and was opposite to age. Pain in the amputation group was described by factor 2, and age was correlated with the duration of prosthesis for factor 1 (
Figure 7).
A significant positive correlation was demonstrated between the ROM difference in the ankle joint between the limbs and height only in the group of patients after traumatic amputations. No other significant correlations were found. Opposite correlations were found for the groups of patients after traumatic and non-traumatic amputation in all factors (age, weight, height, duration of prosthesis, pain) for the parameters of the difference in the length of the support phase of the left and right limbs (%) and (s) (
Table 2).
In the group of amputations due to non-traumatic reasons, the difference in the length of the support phase of the left and right limbs (s) and (%) was described by factor 2 and was opposite to pain, whereas in the traumatic group the parameters correlated with each other. At the same time, the parameter the difference in the length of the support phase of the left and right limbs was opposite to the period of prosthesis, regardless of the reason for the amputation. Epidemiological parameters were described by factor 1 regardless of the cause of amputation (
Figure 8 and
Figure 9).
In the group of amputations due to non-traumatic reasons, the width of the support base during the double-support phase (m) was described by factor 1 and correlated with weight and height and was opposite to age. In this group, the pain and the period of prosthesis were described by factor 2.
In the trauma group, the width of the base of support during the double-support phase (m) correlated with pain symptoms in relation to factor 2, whereas the epidemiological parameters were described by factor 1 (
Figure 10).
There was a significant negative correlation between walking speed and age for the pressure-fixation group, but it did not differ from the pin-lock suspension system. There were no other significant correlations or large differences between the groups based on the suspension system of the prosthesis (
Table 3).
There were no other significant correlations or differences between the groups based on the side of the prosthetic (
Table 4).
4. Discussion
Statistical analysis showed that mean walking speed and ROM difference in the study group were positively related to height and negatively to age. No other statistical relationship with the parameters describing gait asymmetry was found.
Asymmetry of the gait is one of the parameters evaluating the functionality of the prosthesis. There is an array of potential factors influencing the positive reception of the prosthesis as well as its failure. The prosthesis process is personalized, i.e., prostheses are usually tuned to individual characteristics based on the general pattern. Therefore, it is difficult to define potential traits that influence gait asymmetry in this population, in addition to the fact that the manufacturing process is usually dispersed within the population, yielding small potential groups to analyze the data with the use of classical statistics. The study points to epidemiological data that are more prone to causing gait asymmetry that may be addressed during the process of prosthesis production and rehabilitation for new users. Multivariate analysis indicated that pain symptoms and the period of prosthesis were of significant importance in the case of parameters describing the asymmetry of gait (asymmetry of the support phase), especially in patients after amputation in the course of metabolic disease, but other factors such as age, height, and weight determined the main variability of the system in two basic factors.
These factors were less important in patients with traumatic amputations, but they also did not affect the major variability of the two basic factors. In addition, pain complaints were of the greatest importance in the group of amputated people in the course of metabolic disease in relation to the difference in mobility of the ankle joint, without being one of the main factors describing system variability. On the other hand, in the group of patients after traumatic amputation, the factor of highest importance included in the group of main factors was growth.
It is not always possible to walk after an amputation. Van Velzen et al. (2006) pointed out that the total number of people with an amputation regaining walking ability (with or without walking aids such as crutches) in different studies ranges from 56% to 97%, and the percentage of outdoor walkers is even smaller, between 26% and 62% [
1]. The possibility of making a prosthesis does not always mean it will be used effectively. The obvious cause is both the age and the performance of the amputee, which was also shown in the above analysis.
Analyses of walking speed after amputation show variability—some studies show a reduction in walking speed, and some studies show no changes [
9]. To reduce transport costs and discomfort, patients with lower-limb amputation spend more time on the intact limb and reduce their walking speed [
10]. In our group, the average walking speed was also significantly lower than in the control group.
Gait asymmetry has been found in most studies. Jaegers et al. (1995) [
11] showed that asymmetry was dominant, especially in patients after amputation within the thigh. Long-term studies confirm that asymmetry may persist in the 10-year period after prosthesis without the possibility of indicating a trend of improvement in gait symmetry in the later period [
11,
12,
13].
Many studies, apart from the kinematic assessment, do not analyze the factors that could potentially influence gait asymmetry. Seth et al. (2015) demonstrated a relationship between step-length and stance-time asymmetry that was associated with poor performance-based physical function, suggesting in the conclusions that gait asymmetry may be a factor in poor physical function after lower-limb amputation [
14]. They indicated physical function as the main factor of asymmetry in the study, as well as in the study protocol. At the same time, fewer symmetry disturbances are observed in people with amputation below the knee.
Gait asymmetry is probably inevitable due to the high variability of demographic, musculoskeletal, and prosthetic features [
15]. Determining the factors influencing asymmetry remains a problem. Adamczyk et al. postulate that asymmetry is, unfortunately, an element that is to some extent impossible to avoid in amputees [
15]. A significant limitation is also the adopted methods of analysis, where it has been shown that the analysis of single factors describing asymmetry is insufficient for the evaluation of comprehensive gait function [
16].
Time since amputation, below-knee amputation, and male gender were predictors of better quality of life and better adaptation to amputation [
17]. We showed no effect of the duration of prosthesis as a factor of gait asymmetry. Gait asymmetry during walking was significantly related to physical fitness in adults with unilateral lower-limb amputation, and the increase in stride length and the asymmetry of posture time corresponded to the deterioration of the results [
14].
A slight increase in the size of the load, as seen here, in combination with kinematic changes, may initiate trauma and lead to pain complaints, the presence of which in people with lower-limb amputation is influenced by the presence of more than two comorbidities and phantom pain [
8,
18]. Our study did not find any factors that would increase the risk of painful symptoms. Only the opposite relationship between pain and asymmetry of gait was demonstrated between patients after traumatic and non-traumatic amputations.
Researchers indicate that two research pathways should be delineated to better predict gait-asymmetry factors—experimental-design parameterization and model-based simulations—but combining them to improve real-world performance remains a challenge [
19].
Sanders et al. (2018) analyzed the effects of three different outpatient aids (traditional crutches, knee scooters, and prostheses) on lower-limb muscle activation as measured by surface EMG. The researcher indicated that the temporary-injury prosthesis showed the smallest total deviation of muscle activation from normal gait [
20]. It has also been shown that amputees increase the co-activation of the muscles of the healthy limb while walking as a compensatory/adaptive mechanism for coping with prosthetic limbs, possibly playing a role in prosthetic gait asymmetry and energy consumption. [
21]. Other authors showed that amputees walked symmetrically, but had stance-time asymmetry, and the metabolic cost of symmetrical walking was 13.6% higher [
22].
The main limitation of the research is the small size of the analyzed groups. In the review study, the size of the groups ranged from eight to 17 people. In addition to the small size of the groups, they were heterogeneous in terms of the analyzed factors. Another limitation may be the limited number of factors that were defined to assess the asymmetry. There are more of them, because asymmetry is a very complex and multi-variant phenomenon. However, adding more would pose an even greater analytical challenge. With such small, heterogeneous groups, the tools of classical statistics usually turn out to be imprecise. Therefore, taking the above into account, we decided to assess the relationship of epidemiological factors with gait-symmetry indicators using PCA. The greatest advantage of PCA is the utilization of collectives of multivariate data of the unrelated characteristic. Through the calibration and modeling process, it is suitable for pattern recognition and classification. The diversity of the data through PCA allows for the correction of the impact of the specific traits on the whole system, as well as compression of the information for the benefit of the statistical-process control. Additionally, it is important that PCA can be performed on small samples without significant loss of the quality of the obtained results, which is a significant limitation for classical statistics. All of the above elements indicate that PCA may be the optimal method for analyzing gait disturbances in amputees.
5. Conclusions
The presented studies indicate that the age and height of the patient influenced the walking speed and the differences in ROM in the study group. In addition, there were clear differences in the impact of pain on quality in traumatic and non-traumatic patients. Moreover, no other statistical correlations with the parameters describing gait asymmetry were found. The pain symptoms and the period of prosthesis were of significant importance in the case of parameters describing the asymmetry of gait (asymmetry of the support phase), especially in patients after amputation in the course of metabolic disease, but other factors such as age, height, and weight determined the main variability of the system in two basic factors.
Author Contributions
Conceptualization, Ł.K., A.G., and K.Ł.; methodology, M.D. and K.Ł.; formal analysis, M.D.; investigation, K.Ł. and A.G.; writing—original draft preparation, Ł.K., M.D., and K.Ł.; writing—review and editing, Ł.K. and M.D.; visualization, K.Ł. and M.D.; supervision, Ł.K. and A.G.; project administration, Ł.K. All authors have read and agreed to the published version of the manuscript.
Funding
“Development of an innovative, individually fitted vacuum prosthetic socket” No. POIR.01.01.01-00-0839/20, funded by NCBiR.
Institutional Review Board Statement
The study was conducted in accordance with the Declaration of Helsinki, and approved by the Institutional Review Board (or Ethics Committee) of Bioethics Committee at Poznan University of Medical Sciences (943/21, 9 December 2021).
Informed Consent Statement
Informed consent was obtained from all subjects involved in the study.
Data Availability Statement
Data available on request.
Conflicts of Interest
The authors declare no conflict of interest.
References
- van Velzen, J.M.; van Bennekom, C.A.M.; Polomski, W.; Slootman, J.R.; van der Woude, L.H.V.; Houdijk, H. Physical Capacity and Walking Ability After Lower Limb Amputation: A Systematic Review. Clin. Rehabil. 2006, 20, 999–1016. [Google Scholar] [CrossRef] [PubMed]
- Morgan, S.J.; Hafner, B.J.; Kartin, D.; Kelly, V.E. Dual-Task Standing and Walking in People with Lower Limb Amputation: A Structured Review. Prosthet. Orthot. Int. 2018, 42, 652–666. [Google Scholar] [CrossRef] [PubMed]
- Young, A.J.; Simon, A.M.; Fey, N.P.; Hargrove, L.J. Intent Recognition in a Powered Lower Limb Prosthesis Using Time History Information. Ann. Biomed. Eng. 2013, 42, 631–641. [Google Scholar] [CrossRef]
- Beck, O.N.; Taboga, P.; Grabowski, A.M. How Do Prosthetic Stiffness, Height and Running Speed Affect the Biomechanics of Athletes with Bilateral Transtibial Amputations? J. R. Soc. Interface 2017, 14, 20170230. [Google Scholar] [CrossRef] [PubMed]
- Horst, F.; Eekhoff, A.; Newell, K.M.; Schöllhorn, W.I. Intra-Individual Gait Patterns across Different Time-Scales as Re-vealed by Means of a Supervised Learning Model Using Kernel-Based Discriminant Regression. PLoS ONE 2017, 12, e0179738. [Google Scholar] [CrossRef] [PubMed]
- Bilodeau, S.; Hébert, R.; Desrosiers, J. Lower Limb Prosthesis Utilisation by Elderly Amputees. Prosthetics Orthot. Int. 2000, 24, 126–132. [Google Scholar] [CrossRef]
- Kahle, J.T.; Highsmith, M.J.; Schaepper, H.; Johannesson, A.; Orendurff, M.S.; Kaufman, K. Predicting Walking Ability Following Lower Limb Amputation: An Updated Systematic Literature Review. Technol. Innov. 2016, 18, 125–137. [Google Scholar] [CrossRef]
- Devan, H.; Hendrick, P.; Hale, L.; Carman, A.; Dillon, M.; Ribeiro, D.C. Exploring Factors Influencing Low Back Pain in People with Nondysvascular Lower Limb Amputation: A National Survey. PMR 2017, 9, 949–959. [Google Scholar] [CrossRef]
- Prinsen, E.C.; Nederhand, M.J.; Rietman, J.S. Adaptation Strategies of the Lower Extremities of Patients with a Transtibial or Transfemoral Amputation During Level Walking: A Systematic Review. Arch. Phys. Med. Rehabil. 2011, 92, 1311–1325. [Google Scholar] [CrossRef]
- Sagawa, Y., Jr.; Turcot, K.; Armand, S.; Thevenon, A.; Vuillerme, N.; Watelain, E. Biomechanics and Physiological Parameters during Gait in Lower-Limb Amputees: A Systematic Review. Gait Posture 2011, 33, 511–526. [Google Scholar] [CrossRef]
- Jaegers, S.M.; Arendzen, J.H.; de Jongh, H.J. Prosthetic Gait of Unilateral Transfemoral Amputees: A Kinematic Study. Arch. Phys. Med. Rehabil. 1995, 76, 736–743. [Google Scholar] [CrossRef]
- Sjödahl, C.; Jarnlo, G.-B.; Söderberg, B.; Persson, B. Kinematic and Kinetic Gait Analysis in the Sagittal Plane of Trans-Femoral Amputees Before and After Special Gait Re-Education. Prosthetics Orthot. Int. 2002, 26, 101–112. [Google Scholar] [CrossRef] [PubMed]
- Sjödahl, C.; Jarnlo, G.B.; Persson, B.M. Gait Improvement in Unilateral Transfemoral Amputees by a Combined Psycho-logical and Physiotherapeutic Treatment. J. Rehabil. Med. 2001, 33, 114–118. [Google Scholar] [PubMed]
- Seth, M.; Coyle, P.C.; Pohlig, R.T.; Beisheim, E.H.; Horne, J.R.; E Hicks, G.; Sions, J.M. Gait Asymmetry Is Associated with Performance-Based Physical Function Among Adults with Lower-Limb Amputation. Physiother. Theory Pract. 2021, 1, 1–11. [Google Scholar] [CrossRef]
- Adamczyk, P.G.; Kuo, A.D. Mechanisms of Gait Asymmetry Due to Push-Off Deficiency in Unilateral Amputees. IEEE Trans. Neural Syst. Rehabil. Eng. 2014, 23, 776–785. [Google Scholar] [CrossRef]
- Roerdink, M.; Roeles, S.; van der Pas, S.C.; Bosboom, O.; Beek, P.J. Evaluating Asymmetry in Prosthetic Gait with Step-Length Asymmetry Alone Is Flawed. Gait Posture 2012, 35, 446–451. [Google Scholar] [CrossRef] [PubMed]
- Thibaut, A.; Beaudart, C.; Maertens DE Noordhout, B.; Geers, S.; Kaux, J.-F.; Pelzer, D. Impact of Microprocessor Prosthetic Knee on Mobility and Quality of Life in Patients with Lower Limb Amputation: A Systematic Review of the Literature. Eur. J. Phys. Rehabil. Med. 2022, 58, 452–461. [Google Scholar] [CrossRef]
- Banks, J.J.; Wedge, R.D.; Caldwell, G.E.; Umberger, B.R. Are Lower Back Demands Reduced by Improving Gait Symmetry in Unilateral Transtibial Amputees? Clin. Biomech. 2022, 95, 105657. [Google Scholar] [CrossRef]
- Price, M.A.; Beckerle, P.; Sup, F.C. Design Optimization in Lower Limb Prostheses: A Review. IEEE Trans. Neural Syst. Rehabil. Eng. 2019, 27, 1574–1588. [Google Scholar] [CrossRef]
- Sanders, M.; Bowden, A.E.; Baker, S.; Jensen, R.; Nichols, M.; Seeley, M.K. The Influence of Ambulatory Aid on Low-Er-Extremity Muscle Activation During Gait. J. Sport Rehabil. 2018, 27, 230–236. [Google Scholar] [CrossRef]
- Tatarelli, A.; Serrao, M.; Varrecchia, T.; Fiori, L.; Draicchio, F.; Silvetti, A.; Conforto, S.; De Marchis, C.; Ranavolo, A. Global Muscle Coactivation of the Sound Limb in Gait of People with Transfemoral and Transtibial Amputation. Sensors 2020, 20, 2543. [Google Scholar] [CrossRef] [PubMed]
- Wedge, R.D.; Sup, F.C., IV.; Umberger, B.R. Metabolic Cost of Transport and Stance Time Asymmetry in Individuals with Unilateral Transtibial Amputation Using a Passive Prostheses While Walking. Clin. Biomech. 2022, 94, 105632. [Google Scholar] [CrossRef] [PubMed]
Figure 1.
Distribution of passive markers on anatomical points of the subject’s body. Own source.
Figure 1.
Distribution of passive markers on anatomical points of the subject’s body. Own source.
Figure 2.
Final processing of the gait-test results. ENforce Lab Materials.
Figure 2.
Final processing of the gait-test results. ENforce Lab Materials.
Figure 3.
A graphic illustration of the principal component analysis of the epidemiological parameters (age, height, weight), duration of prosthesis, and the parameter of the difference in the length of the support phase of the left and right limbs (%). Projection of the variables on the factor plane of the first two principal components for the amputated group (a) and the control group (b).
Figure 4.
A graphic illustration of the principal component analysis of epidemiological parameters (age, height, weight), duration of prosthesis, and the parameter of the difference in the length of the support phase of the left and right limbs (s). Projection of the variables on the factor plane of the first two principal components for the amputated group (a) and the control group (b).
Figure 5.
A graphic illustration of the principal component analysis of the epidemiological parameters (age, height, weight), duration of prosthesis, and the parameter of the width of the support base during the double-support phase. Projection of the variables on the factor plane of the first two principal components for the amputated group (a) and the control group (b).
Figure 6.
A graphic illustration of the principal component analysis of the epidemiological parameters (age, height, weight), duration of prosthesis, and the parameter of walking speed. Projection of the variables on the factor plane of the first two principal components for the amputated group (a) and the control group (b).
Figure 7.
A graphic illustration of the principal component analysis of the epidemiological parameters (age, height, weight), duration of prosthesis, and the parameter of ROM difference in the ankle joint between the limbs. Projection of the variables on the factor plane of the first two principal components for the amputated group (a) and the control group (b).
Figure 8.
A graphic illustration of the principal component analysis of the epidemiological parameters (age, height, weight), duration of prosthesis, and the parameter of the difference in the length of the support phase of the left and right limbs (%). Projection of the variables on the factor plane of the first two principal components for the amputated group with a division for the cause of amputation: non-traumatic (a) and traumatic (b).
Figure 9.
A graphic illustration of the principal component analysis of the epidemiological parameters (age, height, weight), duration of prosthesis, and the parameter of the difference in the length of the support phase of the left and right limbs (s). Projection of the variables on the factor plane of the first two principal components for the amputated group with a division for the cause of amputation: non-traumatic (a) and traumatic (b).
Figure 10.
A graphic illustration of the principal component analysis of the epidemiological parameters (age, height, weight), duration of prosthesis, and the parameter of the width of the support base during the double-support phase. Projection of the variables on the factor plane of the first two principal components for the amputated group with a division for the cause of amputation: non-traumatic (a) and traumatic (b).
Table 1.
Characteristics and correlation coefficients for the parameters of gait quality and epidemiological factors for the amputee group and the control group.
Table 1.
Characteristics and correlation coefficients for the parameters of gait quality and epidemiological factors for the amputee group and the control group.
| Parameters | Age | Weight | Height | Duration of Prosthesis | Pain | Age | Weight | Height |
|---|
Characteristic
(mean ± SD) | 47.7 ± 15.6 | 91 ± 16.4 | 176.9 ± 9.5 | | | 28.8 ± 7.7 | 79.4 ± 14.7 | 181 ± 8.6 |
| | Amputation group | Control group |
| diff_supp_ph_% | 0.08 | −0.01 | −0.04 | 0.05 | 0.09 | 0.21 | 0.36 | 0.15 |
| diff_supp_ph | −0.02 | −0.01 | −0.05 | −0.10 | 0.08 | −0.01 | 0.32 | 0.13 |
| width_supp_base | 0.25 | 0.16 | 0.17 | −0.12 | 0.25 | −0.26 | 0.54 *
p = 0.047 | 0.07 |
| Walking speed | −0.74 *
p = 0.01 | −0.23 | 0.76 *
p = 0.01 | −0.03 | −0.19 | −0.46 | −0.04 | 0.11 |
| diff_ROM | −0.57 | 0.22 | 0.67 *
p = 0.03 | −0.48 | −0.13 | −0.61 *
p = 0.04 | −0.38 | −0.51 |
| Duration of prosthesis | 0.13 | −0.37 | −0.40 | | 0.27 | | | |
| Pain | −0.09 | 0.34 | −0.20 | | | | | |
Table 2.
Correlation coefficients for the gait-quality and epidemiological parameters by cause of amputation. * statistical significance (p < 0.05).
Table 2.
Correlation coefficients for the gait-quality and epidemiological parameters by cause of amputation. * statistical significance (p < 0.05).
| Gait Parameters | Cause of Amputation | Age | Weight | Height | Duration of Prosthesis | Pain |
|---|
| diff_supp_ph_% | Traumatic | 0.2 | −0.30 | −0.20 | 0.4 | 0.53 |
| diff_supp_ph | 0.2 | −0.36 | −0.10 | 0.4 | 0.43 |
| width_supp_base | 0.2 | −0.21 | −0.05 | 0.2 | 0.65 |
| Walking speed | −1.0 | −0.70 | 0.80 | −0.6 | −0.53 |
| diff_ROM | −0.6 | 0.10 | 0.9 * | −1.0 | 0.05 |
| diff_supp_ph_% | Non-traumatic | −0.5 | 0.5 | 0.5 | −1.0 | −0.87 |
| diff_supp_ph | −0.5 | 0.5 | 0.5 | −1.0 | −0.87 |
| width_supp_base | −0.9 | 0.9 | 0.9 | 0.0 | 0.50 |
| Walking speed | −1.0 | 1.0 | 1.0 | −0.5 | 0.00 |
| diff_ROM | −0.5 | 0.5 | 0.5 | −1.0 | −0.87 |
Table 3.
Correlation coefficients for the gait-quality and epidemiological parameters based on suspension systems: pin-lock and pressure. * statistical significance (p < 0.05).
Table 3.
Correlation coefficients for the gait-quality and epidemiological parameters based on suspension systems: pin-lock and pressure. * statistical significance (p < 0.05).
| Gait Parameters | Suspension Systems | Age | Weight | Height | Duration of Prosthesis | Pain |
|---|
| diff_supp_ph_% | Pin-lock | 0.40 | 0.00 | −0.20 | 0.40 | 0.74 |
| diff_supp_ph | 0.32 | 0.21 | 0.11 | 0.11 | 0.89 |
| width_supp_base | 0.40 | 0.20 | 0.80 | −0.40 | 0.63 |
| Walking speed | −0.80 | 0.60 | 0.40 | −0.80 | −0.21 |
| diff_ROM | −0.40 | 0.80 | 0.20 | −0.40 | 0.95 |
| diff_supp_ph_% | Pressure | 0.00 | 0.26 | −0.09 | −0.20 | −0.49 |
| diff_supp_ph | −0.22 | −0.03 | 0.03 | −0.41 | −0.79 |
| width_supp_base | −0.07 | 0.32 | 0.00 | −0.12 | −0.40 |
| Walking speed | −0.81 * | −0.31 | 0.71 | 0.60 | 0.10 |
| diff_ROM | −0.32 | 0.71 | 0.60 | −0.37 | −0.10 |
Table 4.
Correlation coefficients for the gait-quality and epidemiological parameters based on side of amputation. * statistical significance (p < 0.05).
Table 4.
Correlation coefficients for the gait-quality and epidemiological parameters based on side of amputation. * statistical significance (p < 0.05).
| Gait Parameters | Site | Age | Weight | Height | Duration of Prosthesis | Pain |
|---|
| diff_supp_ph_% | Left | 0.30 | 0.20 | −0.50 | 0.4 | 0.32 |
| diff_supp_ph | 0.21 | 0.15 | −0.36 | 0.4 | 0.22 |
| width_supp_base | 0.30 | 0.20 | −0.50 | 0.4 | 0.32 |
| Walking speed | −0.90 * | −0.60 | 0.70 | −0.2 | −0.74 |
| diff_ROM | −0.50 | 0.60 | 0.70 | −1.0 | −0.74 |
| diff_supp_ph_% | Right | 0.20 | −0.70 | 0.10 | −0.30 | −0.21 |
| diff_supp_ph | 0.05 | −0.36 | 0.00 | −0.56 | 0.05 |
| width_supp_base | 0.05 | −0.15 | 0.76 | −0.67 | 0.16 |
| Walking speed | −0.70 | 0.30 | 0.82 | 0.30 | 0.63 |
| diff_ROM | −0.60 | −0.10 | 0.67 | −0.10 | 0.58 |
| Publisher’s Note: MDPI stays neutral with regard to jurisdictional claims in published maps and institutional affiliations. |
© 2022 by the authors. Licensee MDPI, Basel, Switzerland. This article is an open access article distributed under the terms and conditions of the Creative Commons Attribution (CC BY) license (https://creativecommons.org/licenses/by/4.0/).


