Article

ELM-Based Active Learning via Asymmetric Samplers: Constructing a Multi-Class Text Corpus for Emotion Classification

1
School of Computer and Information, Hefei University of Technology, Hefei 230601, China
2
School of Computer Science and Engineering, University of Electronic Science and Technology of China, Chengdu 610056, China
*
Authors to whom correspondence should be addressed.
Symmetry 2022, 14(8), 1698; https://doi.org/10.3390/sym14081698
Submission received: 13 July 2022 / Revised: 5 August 2022 / Accepted: 9 August 2022 / Published: 16 August 2022
(This article belongs to the Special Issue Symmetry/Asymmetry and Fuzzy Systems)

Abstract

:
A high-quality annotated text corpus is vital when training a deep learning model. However, it is insurmountable to acquire absolute abundant label-balanced data because of the huge labor and time costs needed in the labeling stage. To alleviate this situation, a novel active learning (AL) method is proposed in this paper, which is designed to scratch samples to construct multi-class and multi-label Chinese emotional text corpora. This work shrewdly leverages the superiorities, i.e., less learning time and generating parameters randomly possessed by extreme learning machines (ELMs), to initially measure textual emotion features. In addition, we designed a novel combined query strategy called an asymmetric sampler (which simultaneously considers uncertainty and representativeness) to verify and extract ideal samples. Furthermore, this model progressively modulates state-of-the-art prescriptions through cross-entropy, Kullback–Leibler, and Earth Mover’s distance. Finally, through stepwise-assessing the experimental results, the updated corpora present more enriched label distributions and have a higher weight of correlative emotional information. Likewise, in emotion classification experiments by ELM, the precision, recall, and F1 scores obtained 7.17%, 6.31%, and 6.71% improvements, respectively. Extensive emotion classification experiments were conducted by two widely used classifiers—SVM and LR—and their results also prove our method’s effectiveness in scratch emotional texts through comparisons.

1. Introduction

Large amounts of electronic textual data are produced by media or mobile platforms every day (due to the rapid development of social media). By deeply mining the raw data collected from the internet, a large number of valuable threads and rules can be found and used, promoting various research developments, such as patient emotion state detecting [1], bot detection [2,3,4], emergency response [5], and disease diagnosis [6]. Information recognition study is usually conducted on various deep neural networks (DNNs), which need large amounts of labeled data. However, data labeling is extremely tedious, as well as labor-, cost-, and time-consuming, and requires professional knowledge by human experts. Moreover, keeping labels balanced while tagging also requires expert resources. Thus, labeled data corpora are expensive [7,8] and hard to acquire, which restricts the sharing and spreading of high-level corpora worldwide. Moreover, the labeled data shortage has evolved as a ‘bottleneck’ to the development of artificial intelligence (AI) [9]. As an important branch of machine learning, active learning (AL) has the ability to alleviate the shortage of labeled data. AL aims to (1) acquire labeled data through the cooperation between computer model selections and human expert labeling, or (2) complete the challenging task via tagging pseudo labels based on accurate label predictions.
However, in real applications, the existing AL approaches still have some problems. On the one hand, traditional machine learning methods have embarrassing performances when recognizing language semantics, even with the help of pre-trained word vectors (based on the bag of words proposed by Markov [10]), or when looking for precise pre-trained word vectors. On the other hand, more deep active learning (DAL) [11,12] models are introduced into AL tasks to generate multi-dimension feature representations with long training times, such as TextCNN [13], BERT [14], LSTM [15], and their variants. In NLP tasks, they usually achieve better performances when compared to traditional machine learning regarding homologous data features; however, their long training times involve unaffordability, conflicts with the original intentions of AL, and are inharmonious when it comes to cooperating with human experts. Therefore, we need to build a kind of AL method with a lightweight neural network that is (1) highly explainable, (2) effective in extracting emotional information, and (3) takes up less training time.
In this work, ELM (as proposed in 2006 by Huang et al. [16] with a single-layer feed-forward network (SLFN)), considering its previous excellent performance and less training time, was employed to (instruct to) build the AL framework in a novel method. In the proposed AL framework, the widely-used vectorization tool TF-IDF was initially utilized to provide textual representation for the instances. Then, through ELM’s particular processing, textual representations of the features were transformed as burgeoning feature maps before being executed via sampling criteria for probability comparisons in the AL iteration progress. In this work, we argue that asymmetric samplers constructed by uncertainty [17,18] and representativeness [19,20] can select important and needed instances; these two strategies are normally successively reflected by cross-entropy, Kullback–Leibler divergence, and earth mover’s distance. The selected samples were professionally annotated by Human Oracle, progressively updating the training corpus. Furthermore, to verify the efficiency of the designed AL method, it was examined on sentence-level Chinese text extracted from a social media platform; extensive emotion classification experiments were conducted simultaneously. Moreover, the referred data from the experiments were divided into eight emotion classes referred from Ren Lab’s emotion taxonomy and an additional neutral class. Moreover, the recurrent emotion classification experiments verified the selected samples by our method and could improve the model’s learning ability progressively.
In this work, there are three main contributions involved in constructing a high-quality sentence-level Chinese textual emotion corpus: (1) A novel AL model that employs SLFN (ELM) as a textual feature processor, replenishing the method to build the Chinese text corpus. (2) A novel combined query strategy—called asymmetric samplers—that simultaneously considers two asymmetric factors (i.e., uncertainty and representativeness) and achieve state-of-the-art performances among the mentioned query strategies. (3) The learning efficiency and ceiling performances for text emotion classification are significantly improved with the proposed method.
The remainder of this paper is organized as follows. Section 2 reviews the working procedure of ELM, traditional AL, and the development of emotion taxonomy. The model’s methodology is described in Section 3. We illustrate the experimental results in detail and compare the differences among the multi-query strategies in Section 4. Finally, Section 5 concludes this study.

2. Related Works

The research of AL helps to alleviate the pressure of obtaining the labeled text in mining and analyzing the emotion polarity described by the targeted text [21,22]. While designing the AL algorithm, two vital parts are attracting the attention of researchers—the precise probability predictor and excellent sampling criterion [17,18,19,20]. In this section, we briefly review the related research on ELM and highlight the merits and achievements. The existing AL technologies are briefly introduced, which use different feature processors and query strategies. Later, the developing history of emotion taxonomy is described concisely.

2.1. Extreme Learning Machine

A single-layer feed-forward network (SLFN), different from the deep learning model (with many learning layers), has a more brief and bright structure with only one hidden layer, which means higher computing speeds and lower computing resource costs when dealing with enormous amounts of data. In the past decades, ELM, as the representative model of SLFN, except for the advantages mentioned above, has two advantages: (1) generating hidden layer unit parameters randomly, and (2) admirable interpretability.
To cast off the limitations of parameter tuning in general DNNs while training, in ELM, parameters in the hidden layer are exhaustive and generated randomly, which does not need manual tuning or control. Moreover, this operation can save parameter fine-tuning time. Moreover, ELM has other specialties—activation functions can be bounded, non-constant piecewise continuous functions as well as integrable piecewise continuous functions, which means we can adjust ELM’s activation functions to fit our own tasks, which is how we can explain its working mechanism in a detailed manner. With these two traits, ELM can be transferred to many tasks that concern the fields of visual [23,24], audio [25,26], natural language [27,28], and physiological signals [29,30], comfortably and flexibly. Thus, many works have been conducted on the deuterogenic ELM, achieving decent results. For example, Yang et al., in [31], offered an ELM-based learning method that could improve its performance by pulling back the residual network error to the hidden layer. Moreover, due to fewer hidden nodes employed in the model, the learning speed was one hundred times faster than other ELMs. Migel et al. [32] also proposed stacking multi-ELM modules together to construct a DNN, and they controlled the inputting data dimensions by a weighted matrix between two ELM modules, which reduced the computing complexity. In [33], Deng et al. continued the research by shortening the learning times by fusing the singular value decomposition (SVD) with the hidden ELM layer, which reduced learning costs in the task and improved the classifier’s performance of high-dimensional data. Normally, ELM is used in classification and regression tasks, and the learning data are in an imbalanced state. To adjust ELM (to adapt to this situation), Li et al. [34] used a modified AdaBoost, which could provide weighted training samples to weighted ELM. Follow-up studies focused on assembling ELM with a novel learning structure for different aims as well as on optimizing the inner loss functions to obtain a reduction of errors. In [35], Li et al. abandoned the conventional modus operandi for optimizing the output layer’s error in training. They reduced the calculating error via controlling hidden units based on the number of training samples before being sent to the hidden layer. The above description shows that ELM has indomitable vitality in classification and regression tasks. However, to our knowledge, ELM is seldom reported or employed in the AL field. Thus, we decided to utilize ELM’s extraordinary ability in recognizing instance information and transfer it into our AL work.

2.2. Traditional Active Learning

One challenge in machine learning is how to acquire an appreciable quantity of labeled data to ‘learn’ an outstanding model in a variety of tasks [21,22,36]. With the hope of decreasing the sampling times and minimizing annotated data costs, the investigator wields various information distance evaluating measurements to classify or cluster unlabeled samples via training on small labeled data corpora, discarding the redundant parts according to the designed sampling rules. Then, the selected samples are transferred into a training set after being labeled by Human Oracle; this selecting and labeling process continues until they stop being triggered. Overall, the above sampling procedure is called AL.
Normally, the core of AL is the query strategy to investigate the similarity of samples and complete the selection of wanted samples [37]. Typically, we summarize various strategies into two types: uncertainty [38] and representativeness [19,20]. With uncertainty, if the candidate samples are far away from the baseline data in the probability map and cannot confirm their classes based on current extracted features, there is adequate evidence to suggest that such samples with high uncertainty scores should be selected to enrich the previous training set and be annotated by Human Oracle. However, unitary sampling hurts the AL model when filtering information. Therefore, combining representativeness with uncertainty to form asymmetric samplers can make the selection procedure more justifiable. Moreover, the hybrid model can help reduce the costs of eliminating the samples with less information [39]. Nowadays, it is hard to say which query strategy has universal relevance in various AL tasks (in the background of the big data era). However, researchers are attempting to optimize typical methods or recommend renewable ideas to progressively improve the model’s performance. Through verification—cross-entropy, Kullback–Leibler divergence and earth mover’s distance contribute to the research on measuring sample distances when they are employed in enlarging data sets. In recent years, earth mover’s distance, as a burgeoning difference assessing method, has been pursued by many researchers when measuring information similarities. However, previous AL models declared that they were effective in only one certain research realm, which means many targets should be overcome. Thus, this paper proposes a novel AL model to alleviate the pressure of labeled corpora shortages.
By adjusting the format of data inputting as a decisive standard, we can roughly categorize information-oriented AL into three main scenarios—pool-based, stream-based, and membership query synthesis. Moreover, due to text sets usually being closed in classifications, we followed the format of pool-based AL in this work. Therefore, to bridge the gap between the need for labeled data and labeling costs, this work proposes asymmetric sample AL fused with label-balanced mechanisms.

2.3. Emotion Taxonomy

Miller T.L. et al. [40] enhanced Ekman’s emotion category, i.e., human emotions could be categorized into six basic classes from the view of psychology—anger, disgust, fear, happiness, sadness, and surprise, regardless of race, culture, and language. Since then, more elaborate emotion taxonomies have been nominated according to the needs of different research tasks, such as psychology, face emotion recognition, mental diseases, and others. For example, Plutchik and Kellerman [41] employed four bipolar axes—joy vs. sadness, anger vs. fear, trust vs. disgust, surprise vs. anticipation for modeling emotions in a multi-dimensional space. Moreover, a tree-structured model was proposed by Shaver et al. [42], in which anger, fear, joy, love, sadness, and surprise were the emotions of the main branches, each of which had subordinate categories, such as affection, lust, and longing.
More recently, Quan et al. [43] from Ren Lab, after deeply studying human communication habits in the text (based on Ekman’s six basic emotions), proposed a peculiar emotion sorting technique suitable for natural language processing, for anxiety, anger, sorrow, hate, joy, love, expect, and surprise. Moreover, the fine-grained emotion distribution is closer to ‘feeling’ expressions in daily life. Furthermore, Ren Lab released a large and thoroughly annotated emotion corpus Ren CECps (Available online: http://a1-www.is.tokushima-u.ac.jp/member/ren/Ren-CECps1.0/DocumentforRen-CECps1.0.html (accessed on 16 October 2018)), this corpus has attracted many related research studies [44,45,46,47,48]. Therefore, this is why Ren Lab’s emotion taxonomy was adopted in this work.
A lightweight network is remarkable in data mining. For further excavating its potency, in our research, ELM, as an outstanding SLFN, was first employed to predict the pseudo-emotion labels for expanding the Chinese textual emotion corpus. Moreover, asymmetric samplers were constructed to evaluate textual emotion distributions based on the emotion category proposed by Ren Lab.

3. Methodology

In this section, the proposed AL via asymmetric samplers is introduced in detail Algorithm 1. First, ELM is described from its inner structure and its working procedure on multi-class Chinese textual tasks. Then, detailed descriptions of query strategies in asymmetric samplers are presented in mathematical derivations.
Algorithm 1. ELM-based active learning algorithm
Input: Training set D t r a i n R l , Raw set D s a m p l e _ p o o l R l e n ( D s a m p l e _ p o o l )
Output: Updated training set D u p d a t e d _ t r a i n
 1: repeat
 2:    Learn a multi-label emotion classifier ELM on X;
3:    repeat
4:       i means the similarity measurements C E , K L , E M
5:        D s a m p l e _ p o o l u m a x p a r t i t i o n ( D s a m p l e _ p o o l , D i ) (Figure A1a)
6:    until stop criterion 1
7:    repeat
8:       j means the similarity measurements C E , C E b , E M b
9:        D s a m p l e _ p o o l r m i n p a r t i t i o n ( D s a m p l e _ p o o l u , S i m ( x ) j ) (Figure A1b)
10:    until stop criterion 2
11:    obtain ground truth label from Human Oracle y t for D s a m p l e _ p o o l r (Figure A2)
12:     D u p d a t e d _ t r a i n = D t r a i n + ( D s a m p l e _ p o o l r , y t )
 13: until stop criterion 3
 14: return D u p d a t e d _ t r a i n

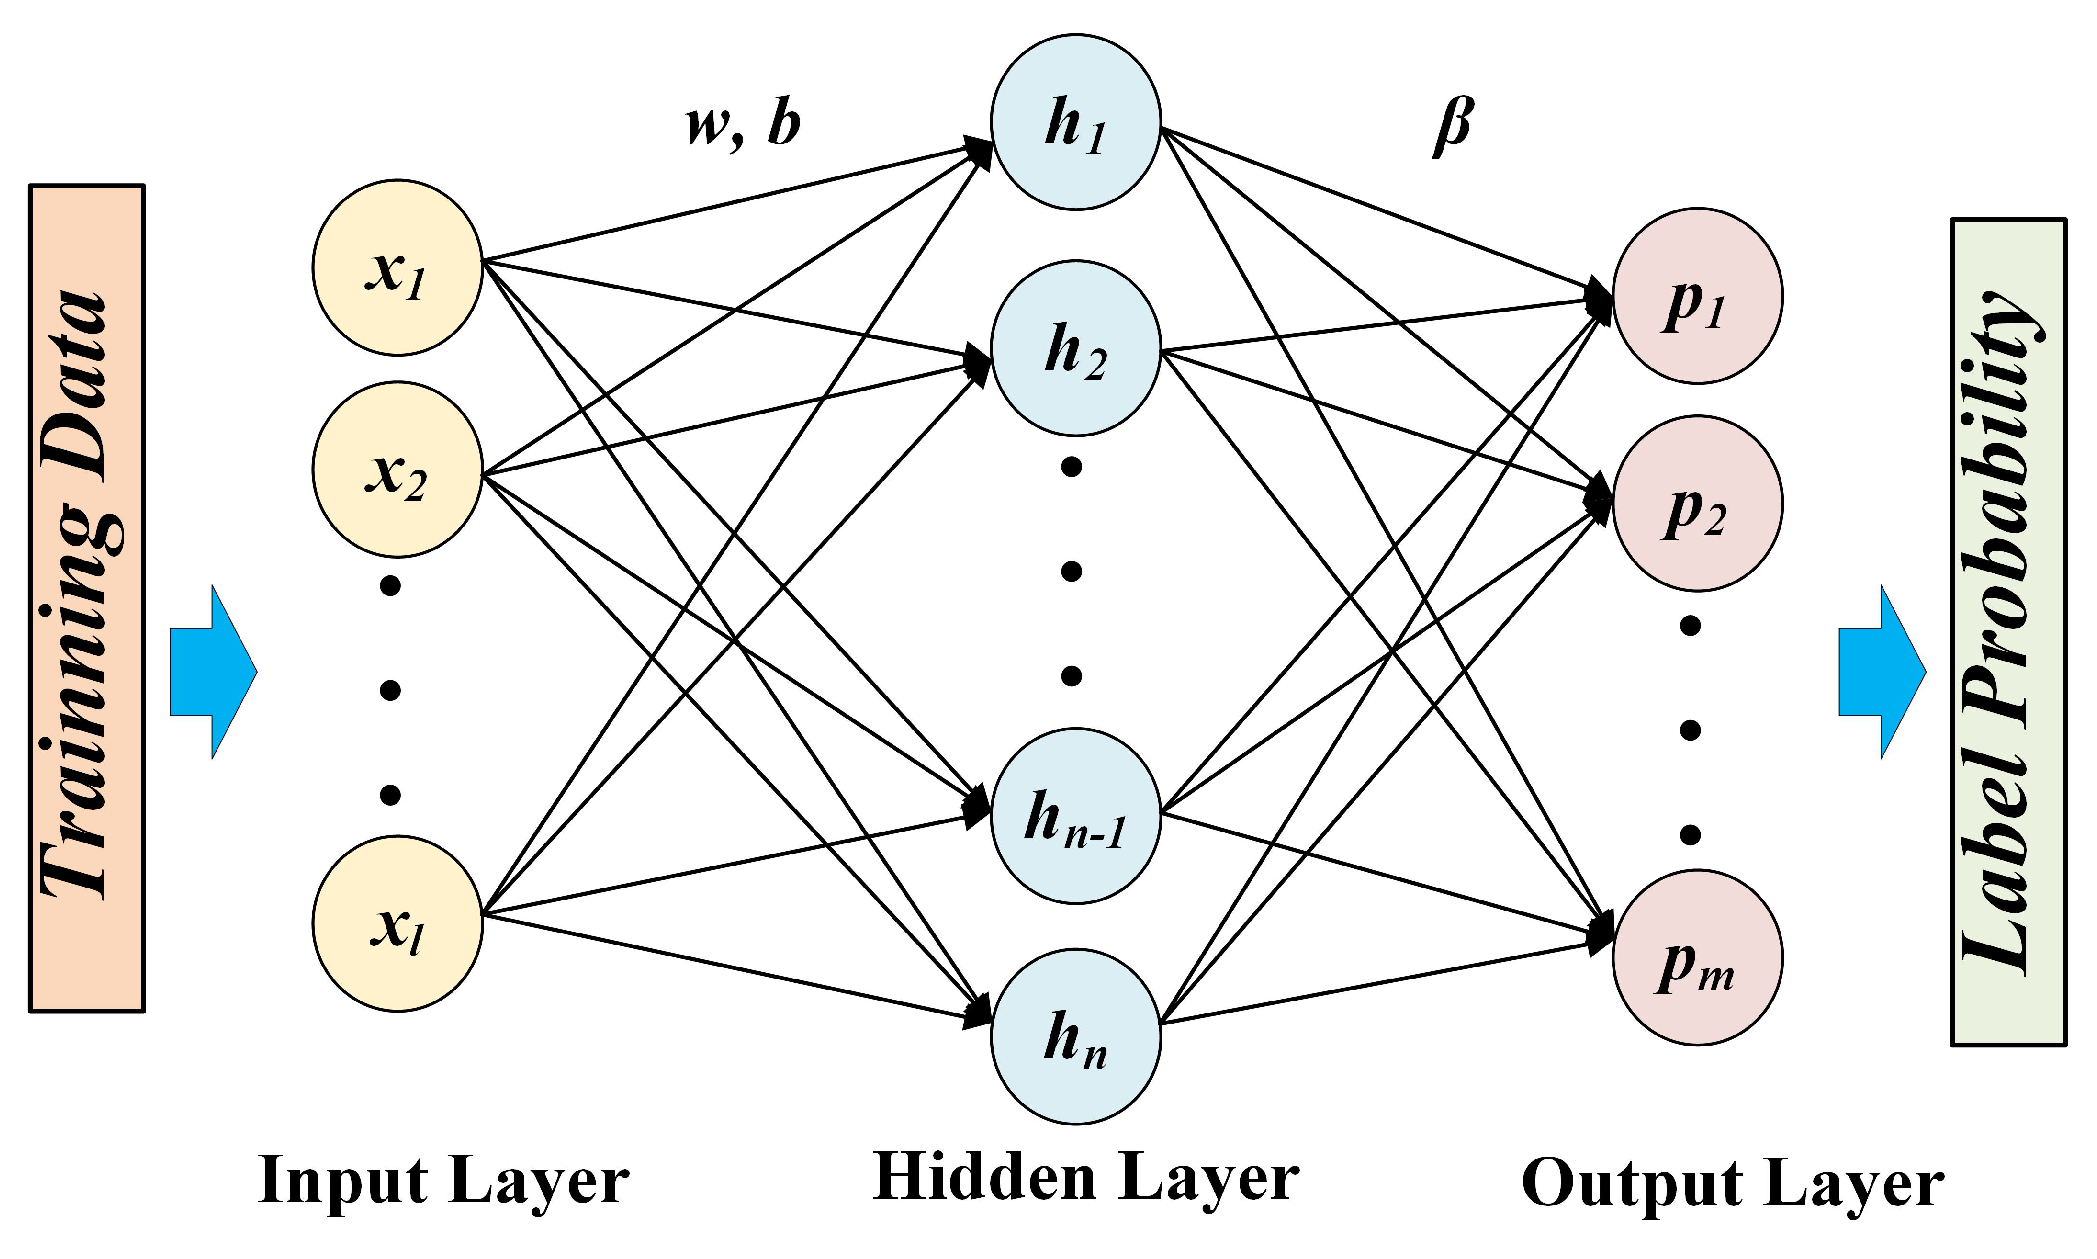
3.1. Working Procedure of ELM

Firstly, a brief explanation is given of ELM and how it is used in the proposed model. Generally, within the realm of machine learning, fewer layers in the model mean fewer time–costs in the training. As the classical representative of SLFN, ELM has a single hidden layer that can adjust and generate hidden unit numbers randomly. With this property, our ELM-based AL method saves a lot of training time.
As a single-layer neural network, compared to other traditional SLFNs, ELM can promise learning accuracy while having a faster learning speed [49]. While training, in the hidden layer, ELM employs random weights w and biases b. Moreover, training data are denoted as D t r a i n R l , which are already encoded by TF-IDF in the form of X , Y = x 1 , y 1 , , x i , y i , , x l , y l , where xi means the instance and yi is the ground truth label. The activation function in the hidden layer (h in Figure 1) is g * (sigmoid, in this paper). Thus, the single-layer network transformation can be expressed as:
F ( x ) = β g ( X ; w , b )
where β is the weight matrix, w is the weight between the hidden nodes and input nodes, and b is the bias.
Compared with the ordinary SLFN, the most soul-stirring innovation in ELM is that all the initial parameters in β are generated randomly after fixing the number of hidden nodes and activation functions. Then, when training on D t r a i n , the least square (LS) can be formulated compactly as:
L ( X , Y ; β ) = Y β H 2 0
H = g ( X ; w , b )
where X is the text, Y is the true textual emotion label, and H is the matrix of the collection about the activation functions.
While setting the deviation between the predicted probability and true value being 0 (Equation (2)), ELM finds the value of the simulation, which is extremely close to the ground truth value. Thus, parameter β is determined directly by
β ^ = H * Y ,
where H * is the Moore–Penrose generalized inverse of H. Moreover, the learned parameter β ^ is a key role in the procedure of predicting the raw Chinese textual emotion label. In theory, due to LS being preset as 0, the emotion probability should be trusted with a high confidence score.
By reviewing ELM, we separate its architecture into two parts: learning and predicting. In learning, the goal is to learn the parameter β ^ . Moreover, in predicting, with the help of learned β ^ , ELM predicts the raw Chinese textual emotion state precisely, which enhances the instance selection work in the query strategy phase.

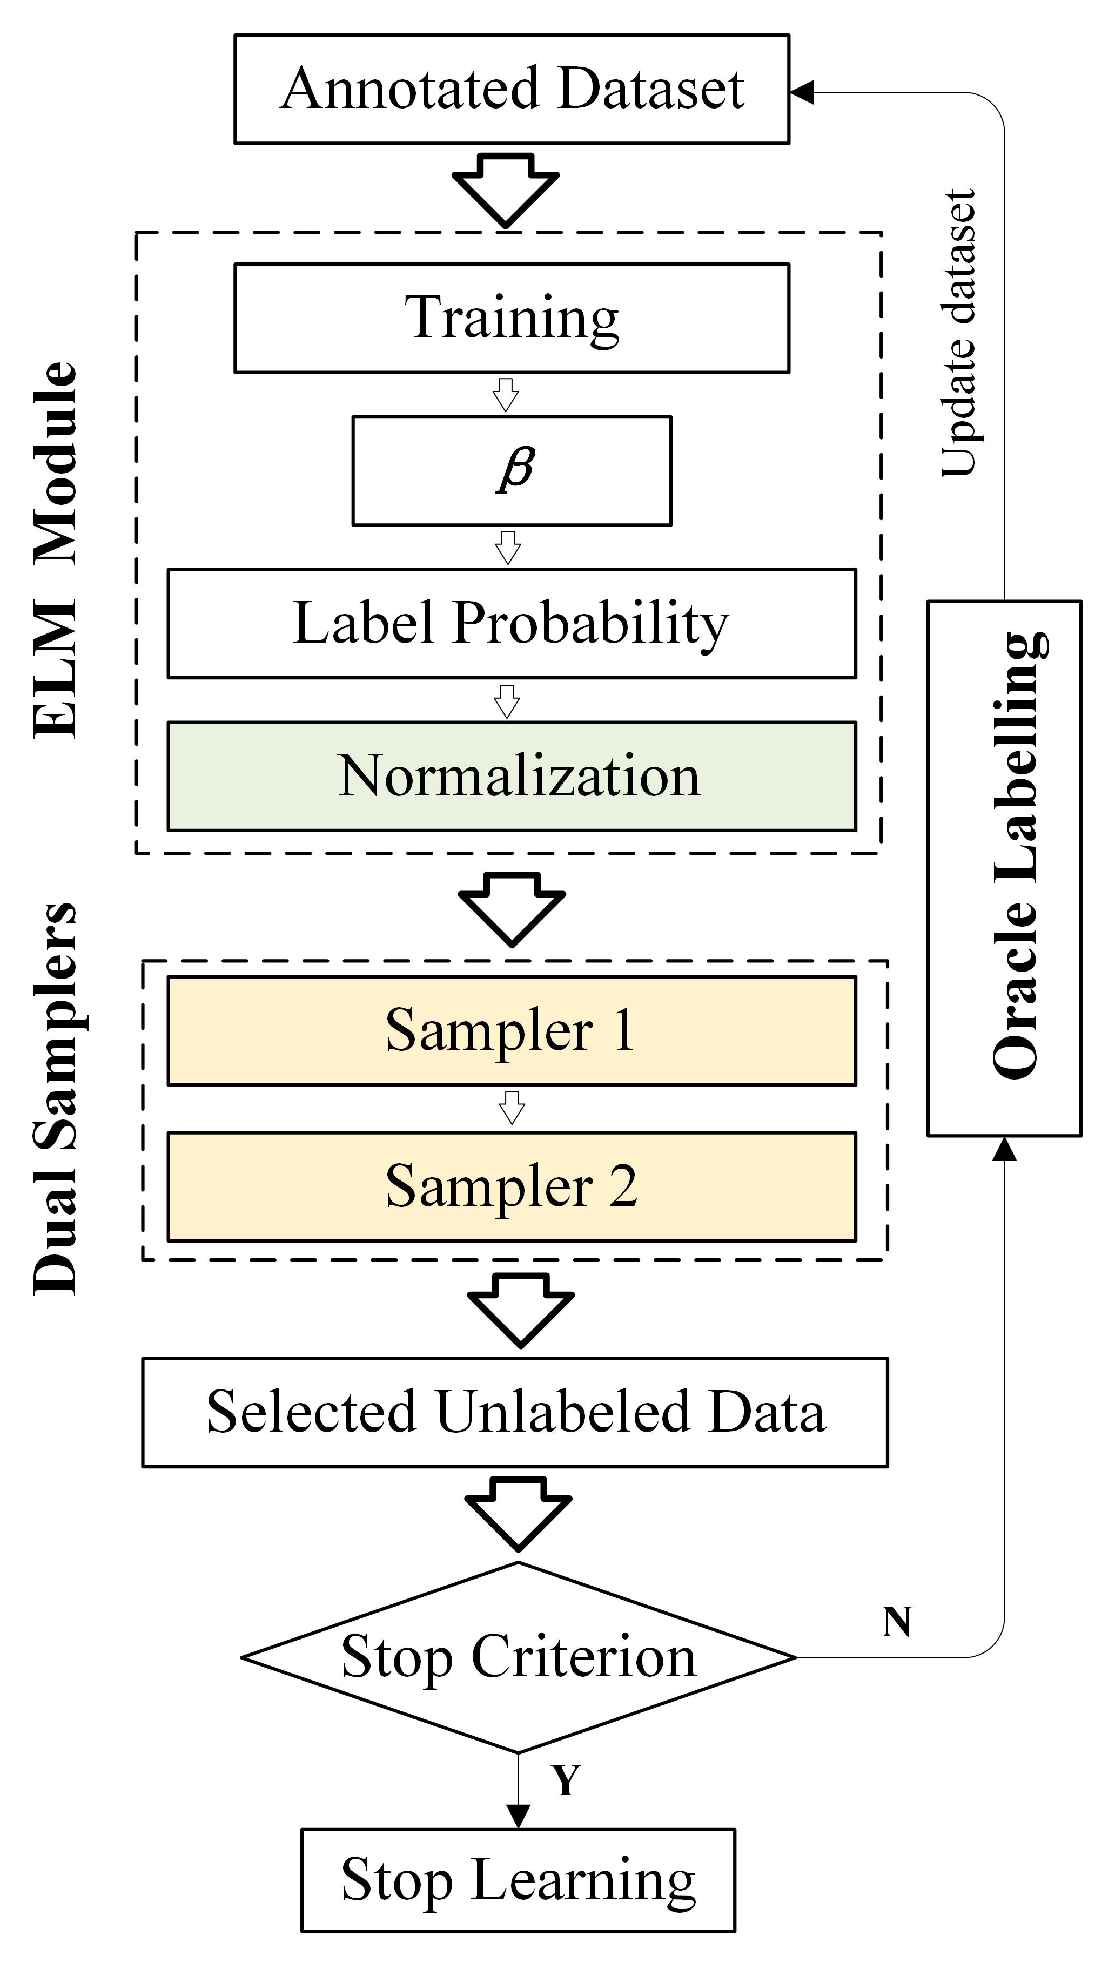
3.2. Proposed Active Learning Method

The core idea of AL is to extract the wanted samples to alleviate the current pressure in mining and labeling texts with both high uncertainty and representativeness [50,51,52]. Due to our raw data set being a closed set, we executed our experiments as a pool-based batch-mode scenario as mentioned in Section 2.

3.2.1. Proposed Textual Label Predicting Mechanism

In this paper, we employed ELM as the representation executor to nominate text features on the presupposed eight emotion classes. The predicted probabilities on candidate texts were provided by basic ELM. According to the learning parameters β ^ , the text emotion probability can be noted as:
P = β ^ g ( T ; w , b ) = β ^ H
where T D s a m p l e _ p o o l = t 1 , , t j , , t n R n , and H = g ( T ; w , b ) . To simulate our daily communication convention more closely, we fully believe that being ‘neutral’, as the common emotion state in life, should be introduced in our work. We denote its probability as:
p 9 = 1 M a x ( P )
The sigmoid function is used to normalize the ELM output p m P M = p 1 , p 2 , · · · , p 9 R M within the interval [ 0 , 1 ] , and the sum of the nine emotion probabilities is equal to 1 (see details in Figure 2), which is written as:
P ( σ ) = 1 1 + e ( P M )
where P ( σ ) denotes the finally textual feature representations (denoted in the format of probabilities). Then the textual independently identical distributions on the nine emotion states are obtained. Since 0 and 1 are included in the range of probability, the ultimate endpoint is hardly reached. Hereto, we already completed the preparation work, giving the estimation of each raw text by ELM.
From the above description of traditional AL in Section 2, researchers usually construct AL models from two aspects: uncertainty and representativeness. Thus, to fully investigate text information, the proposed AL via asymmetric samplers integrates the above two aspects simultaneously. In this work, to make a strong and direct comparison, we constructed baselines on the support of these three similar measurements: cross-entropy (CE), earth mover’s distance (EM), and Kullback–Leibler divergence (KL), which are distinguished query strategies in information theory. The detailed descriptions of the computational processes between P ( σ ) and Y are as follows.
CE, known as the most popular loss function, plays a vital role in information theory. In this paper, it is rewritten as:
D C E ( P ( σ ) , Y ) = M a x ( m = 1 M Y l o g ( P ( σ ) ) ) .
Observing the above function, the texts with maximum loss are far away from the training data; it is difficult to distinguish their classes. In the other words, they should be selected and annotated by human experts carefully.
From the definition of EM described in [53], the distance from one distribution to another distribution can be measured based on the given approach. Moreover, from its name, this method’s ‘mathematics’ means to find the shortest way to deliver one distribution to another. The lower the score achieved, the higher the similarity between two distributions. If we scratch the maximum distribution, it means the corresponding text has a higher opportunity to be extracted. Moreover, EM evaluates the distance between P ( σ ) and Y via the formula given by
D E M ( P ( σ ) , Y ) = M a x ( m = 1 M j = 1 n ρ m j η m j m = 1 M j = 1 n ρ m j ) .
EM is also known as the optimal transport (OT) distance. In this paper, it is used to measure the distance from one textual distribution P ( σ ) to another textual distribution Y through an optimized process, until P ( σ ) is geometrically reshaped as Y. Moreover, ρ m j indicates the cost of the transferred probability from the mth stack of P ( σ ) to the jth stack of Y, and η m j indicates the quantity of transferred probability from the mth stack of P ( σ ) to the jth stack of Y. Considering the important properties of EM, such as symmetry and triangle inequality, this paper also adopts it as a sample query strategy.
Specifically, KL divergence is a widely-used similarity measurement in sampling work, which evaluates the log difference between P ( σ ) and Y under the expectation of P ( σ ) . Moreover, it is also employed in this paper as an instance query strategy; we rewrote it in the format as,
D K L ( P ( σ ) , Y ) = M a x ( m = 1 M P ( σ ) m l o g ( Y m P ( σ ) m ) ) .

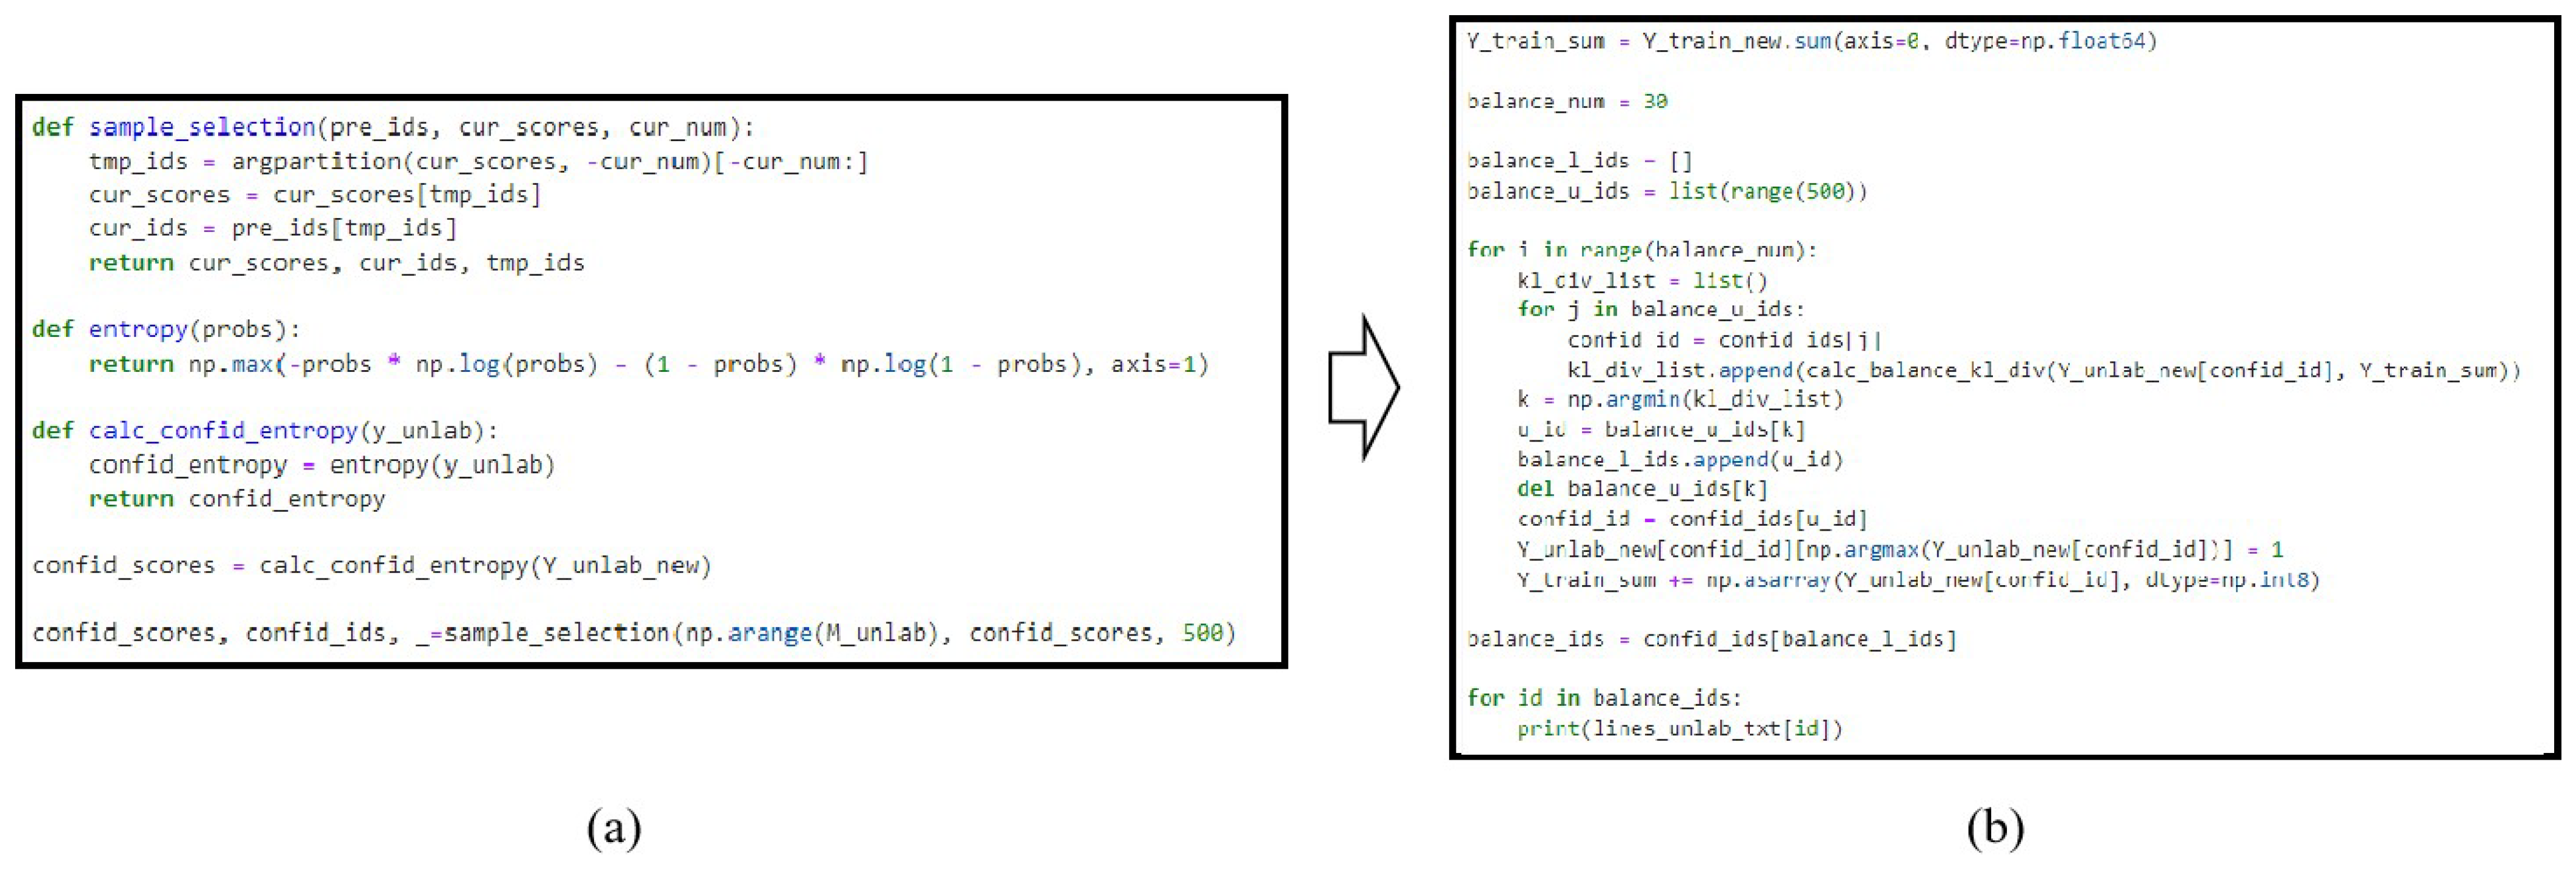
3.2.2. Query Strategies used in Asymmetric Samplers

Based on the above similarity evaluation methods and related experiments (shown in Section 4), the proposed methodology for the uncertainty criterion is CE. In uncertainty, AL wants to select the instances that are furthest from the training data. However, regarding representativeness, the model expects to find the samples with the shortest distance in the matrix space. For a better self-comparison between the instances, we rewrote cross-entropy as:
H ( P ( σ ) ) = M i n ( P ( σ ) l o g P ( σ ) ( 1 P ( σ ) ) l o g ( 1 P ( σ ) ) .
Through the method posted by Equation (11), the texts with the most expectations of uncertainty were extracted. These instances were selected and treated as seed players by another criterion (representativeness). In representativeness, the sampler employs CE (Equation (12)), CE with a balancing strategy (Equation (13)), and EM with a balancing strategy (Equation (14)) to instruct sampling work from three aspects, respectively. In each sampler, AL minimizes the distance scores to find the nearest sample point to strengthen data representativeness. Therefore, this process is described as follows.
For cross-entropy (DS1),
S i m ( x ) C E = M i n { D C E ( P ( σ ) , Y ^ ) , Y ^ Y } .
For cross-entropy with a balancing strategy (DS2),
S i m ( x ) C E b = M i n { D C E b ( P ( σ ) , Y ^ ) , Y ^ Y y ^ x } .
For the earth mover’s distance with the balancing strategy (DS3),
S i m ( x ) E M b = M i n { D E M b ( P ( σ ) , Y ^ ) , Y ^ Y y ^ x } ,
where x means the seeds in the raw data pool and y ^ x are the predicted labels of the selected texts by Equation (15).
Moreover, inspired by paper [54], asymmetric samplers refer to (and modify) the label balanced strategies. While balancing, the emotion class with the largest predicting probability is directly marked as 1. The balancing strategy is given by
y ^ x = 1 , { M a x { p ( σ ) m x } , m M } 0 , o t h e r s s . t : x D s a m p l e _ s e e d s
where D s a m p l e _ s e e d s is the selected unlabeled sample set by the first sampler, each of which is a candidate influencing the emotion label balancing state in the training set.
Based on the above textual information similarity measurements, to excavate the ELM module’s potential capacity in AL, asymmetric samplers simultaneously mine textual emotion information from uncertainty and representativeness and successively utilize three mainstream distance strategies (CE, EM, KL) as sampling strategies in this work. Furthermore, the conceptual graph of asymmetric samplers is shown in Figure 2. In the design, the first sampler is utilized to measure the uncertainty of texts and the second sampler is employed to measure textual representativeness. Moreover, a novel label balancing method is proposed in this section, which strengthens the label balance exploration.

4. Experiments and Discussion

In this section, AL tasks and extensive classification experiments were conducted successively. The comparisons are presented on the experimental results, not only from traditional key indicators, such as micro precision, recall, and F1 but also from current popular visual evaluating methods, such as the WordCloud graph for emotion words. Based on these descriptions and analyses of the referred experimental results, this work also provides discussions and unscrambles the unique expressing phenomena in Chinese short-texts.

4.1. Evaluations

Choosing applicable evaluations is extremely important to reflect the model’s efficiency and is necessary to present the rules of the selected texts. In this paper, we mainly evaluate asymmetric samplers from three aspects: the improvement of the emotion classifiers’ learning abilities depending on the updated training set, the distribution of textual emotion labels, and the emotion word rates. To check the ability of the updated text set in learning classifiers, this work constructs three multi-label emotion classifiers based on ELM, logistic regression (LR), and the support vector machine (SVM), which provide compared experiments on updated training corpora annotated by Human Oracle. Moreover, the main evaluation methods employed in this work are micro precision (Equation (16)), recall (Equation (17)), and F1 (Equation (18)), which are widely used in the study of machine learning [55,56]. Moreover, these three indicators are formulated as:
P m i c r o = m = 1 M T P m m = 1 M T P m + F P m ,
R m i c r o = m = 1 M T P m m = 1 M T P m + F N m ,
F 1 m i c r o = 2 × P m i c r o × R m i c r o P m i c r o + R m i c r o .
Furthermore, the second aspect involves the ground truth rate of each emotion percentage in the updated set, which denotes the model’s capacity in capturing the useful text in this work. Moreover, the third aspect is presented by WordCloud, which can be seen as the information percentage for each emotion class in the selected instances by our methods.

4.2. Text Preprocessing

Previous research [57] divided texts into three classes—document, sentence, and word (or tokens), depending on the averaged length of the text. Specifically, sentence-level texts express the users’ emotions, intensively and directly, without redundant textual information. Thus, we conducted AL experiments on sentence-level Chinese text from Weibo (Available online: https://weibo.com/ (accessed on 23 March 2013)) in this work. Before experiments, data cleaning is important and necessary in NLP tasks, due to various noises mixed in the raw text resources.
Moreover, in this paper, text pre-processing included filtering, segmenting, and duplicate removal. Firstly, a tiny noisy text set was constructed, which contained 1907 noise sentences, including advertisements, English text, the promotion of games, recipes, etc. By learning these noise examples and filtering the highly similar texts, the number of raw texts in each D s a m p l e _ p o o l can be cleaned and reduced from nearly 20,000 to 7000 obviously. This operation provides a more clear target for the sampling criteria. Secondly, Chinese text has its own traits in syntax rules, which are significantly different from English, with a blank space token between two words and beginning with the capital letter in every independent sentence. However, in Chinese, there are no more marks between characters, and it takes more attention to semantics while expressing. Thus, this work employed the segment module THULAC (Available online: http://thulac.thunlp.org/ (accessed on 11 November 2019)) developed by Tsinghua University, publicly, which is widely used in Chinese text segment work. With the help of THULAC, whole sentences can be split into separate words and characters. In this way, the separated words or characters can be easily encoded by AL algorithm. Thirdly, with the specialized tiny module, duplicated texts are removed from the raw text set. Reasonably, they hurt indiscriminate learning regarding ELM weights. Finally, through these three pre-processing steps, text data are largely purified. Moreover, large amounts of computing resources are saved, improving the efficiency of human–computer interactions. As a result, the sampling procedures of AL are accelerated widely.

4.3. Experimental Setting

In SLFN, the most important parameter is the number of hidden nodes, which largely influence the computational complexities as well as the accuracies in recognizing objects. Referring to papers [28,58], this work sets the model’s hidden nodes as 1000, which is appropriate to our middleweight raw text set.
Generally, the experiment is split into two stages in this work. In the first stage, text sampling work was executed by a single sampler named ‘uncertainty’, which was constituted by CE, EM, and KL. The experimental results in this stage are regarded as baselines or foundations ({(CE: B1), (KL: B2), (EM: B3)}). In the second stage, AL via asymmetric samplers, including uncertainty and representativeness, was constructed based on B1, and denoted as {(double CE: DS1), (CE with balancing strategy: DS2), (EM with balancing strategy: DS3).}
In this work, AL stop criteria were 60 iterations on the AL model (stop criterion 3 in Algorithm 1), 30 sentence-level texts were extracted from D s a m p l e _ p o o l in each iteration (stop criterion 2 in Algorithm 1). In contrast, in AL via asymmetric samplers, stop criterion 1 (in Algorithm 1) selected 500 texts by uncertainty in each iteration.
The initial D t r a i n largely impacted AL via the asymmetric sampler model’s learning ability. In this work, Ren Lab collected and labeled 2022 and 1589 sentence-level texts on nine emotion states for D t r a i n and D t e s t , respectively. In D t r a i n , the emotion label distribution was nearly kept at a balanced state, except N e u t r a l , which was treated as a control role to the eight other emotion categories via manual intervention. Correspondingly, in D t e s t , the quantity of each emotion label in the category was nearly 150.

4.4. Experimental Results

The classification performance is a key indicator of corpus quality. Concretely, micro precision, recall, and the F1 score can present the textual information from three different sides. In this section, two widely-used methods provide the comparisons of classification results, and three state-of-the-art query strategies were selected as the baselines.

4.4.1. Results of Baselines

In this section, we mainly discuss the choice of the first sampler depending on the performance of classification tasks and label distribution.
Firstly, Table 1, Table 2 and Table 3 present the initial and final emotion classification experimental results on D t r a i n , conducted by ELM, LR, and SVM, respectively.
After 60 loops, updated text corpora based on B1 improve the performances of the classifiers and the improvements of classification experiments are {(precision, 6.10%), (recall, 5.37%), (F1, 5.71%)}, {(precision, 4.31%), (recall, 3.27%), (F1, 3.87%)}, and {(precision, 1.85%), (recall, 0.34%), (F1, 1.08%)} on ELM, LR, and SVM, respectively. Meanwhile, corpora built by B2 do not train competent SVM classifiers with the improvements as {(precision, −1.31%), (recall, −2.93%), (F1, −2.13%)}, and corpora built by B3 also have the same commonplace performances in classification experiments conducted by SVM, which are {(precision, 1.59%), (recall, −0.27%), (F1, 0.64%)}. It is clearly shown that the corpora constructed by B1 improve the three classifier learning abilities the most, which indirectly demonstrate that texts extracted by the B1 sampler contain more information on emotions. Figure 3 presents the increments of micro precision, recall, and F1 scores in the experiments. We observed that B1 performed better than B2 and B3 in all three aspects, and its score distributions were more compact, which meant emotional information in the corpus improved smoothly and progressively. Moreover, through comparing the final results, ELM was the suboptimal classifier in Table 1 and Table 3. ELM had a hidden layer in the network as the representative of SLFN, and it required a large amount of data to fine-tune its state, while SVM and LR did not need as many samples to learn due to their formalistic mechanisms.
Secondly, Table 4 and Figure 4a–c present the emotion label distributions of the final D t r a i n from the three baselines. The expectations of each emotion class show the differences from the ideal state to reality. The experimental results for the expectations are presented in Table 4, and their scores are observed at approximately {(B1, 1336), (B2, 2589.56), and (B3, 1397.56)}, respectively, which means B1 treats emotion texts more equally. Additionally, the tight-binding label rate is achieved in Figure 4a–c and it proves that B1 outperforms the other two baselines in controlling emotional text increments. Furthermore, the Hamming loss training (of B1, B2, and B3) is shown in Figure 5a. B1-based D t r a i n learns the classifier better with the same amount of emotional texts.
In conclusion, despite the classification performance or quantity of textual emotion labels observed from the above results, it is proper to construct B1 (CE) as the basic sampler. Moreover, to show the improvements in emotion classification performances within groups in a detailed manner, we present the results achieved by ELM on the final corpus of B1 in Table 5. Moreover, the table shows that the consequences also enhance the conclusions obtained from the above analysis, in that B1 (CE) is excellent at extracting emotional texts.

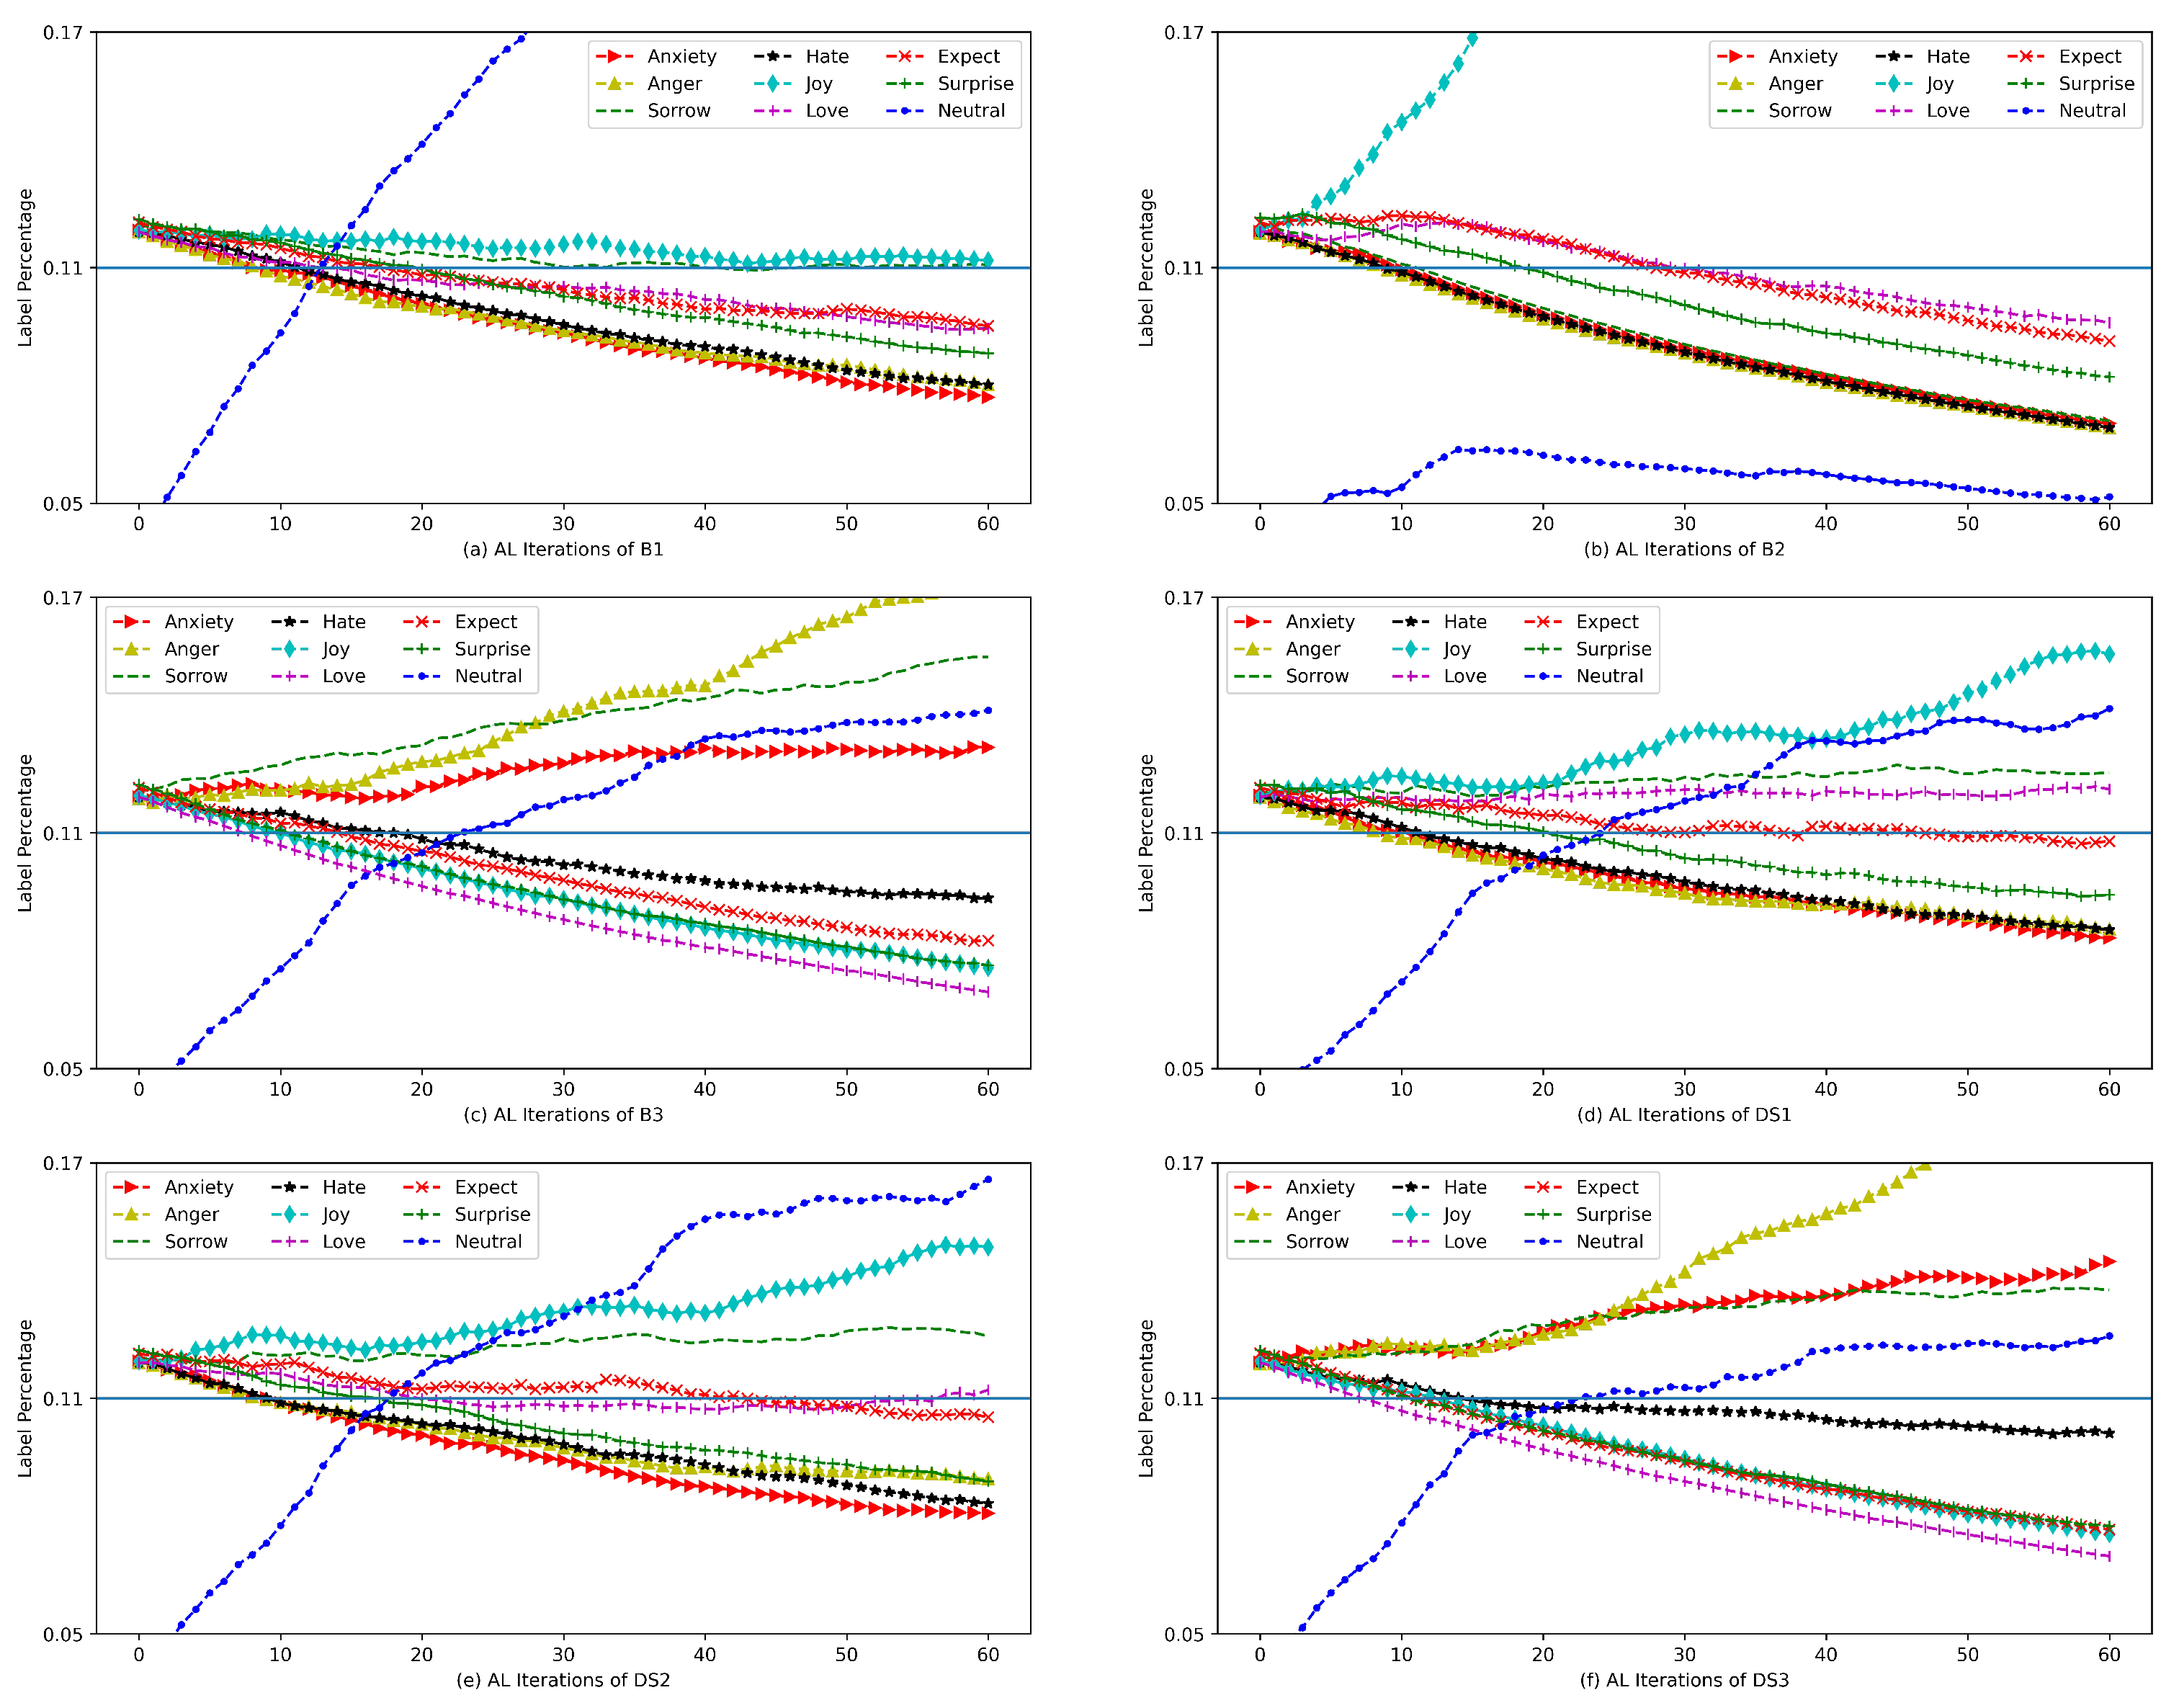
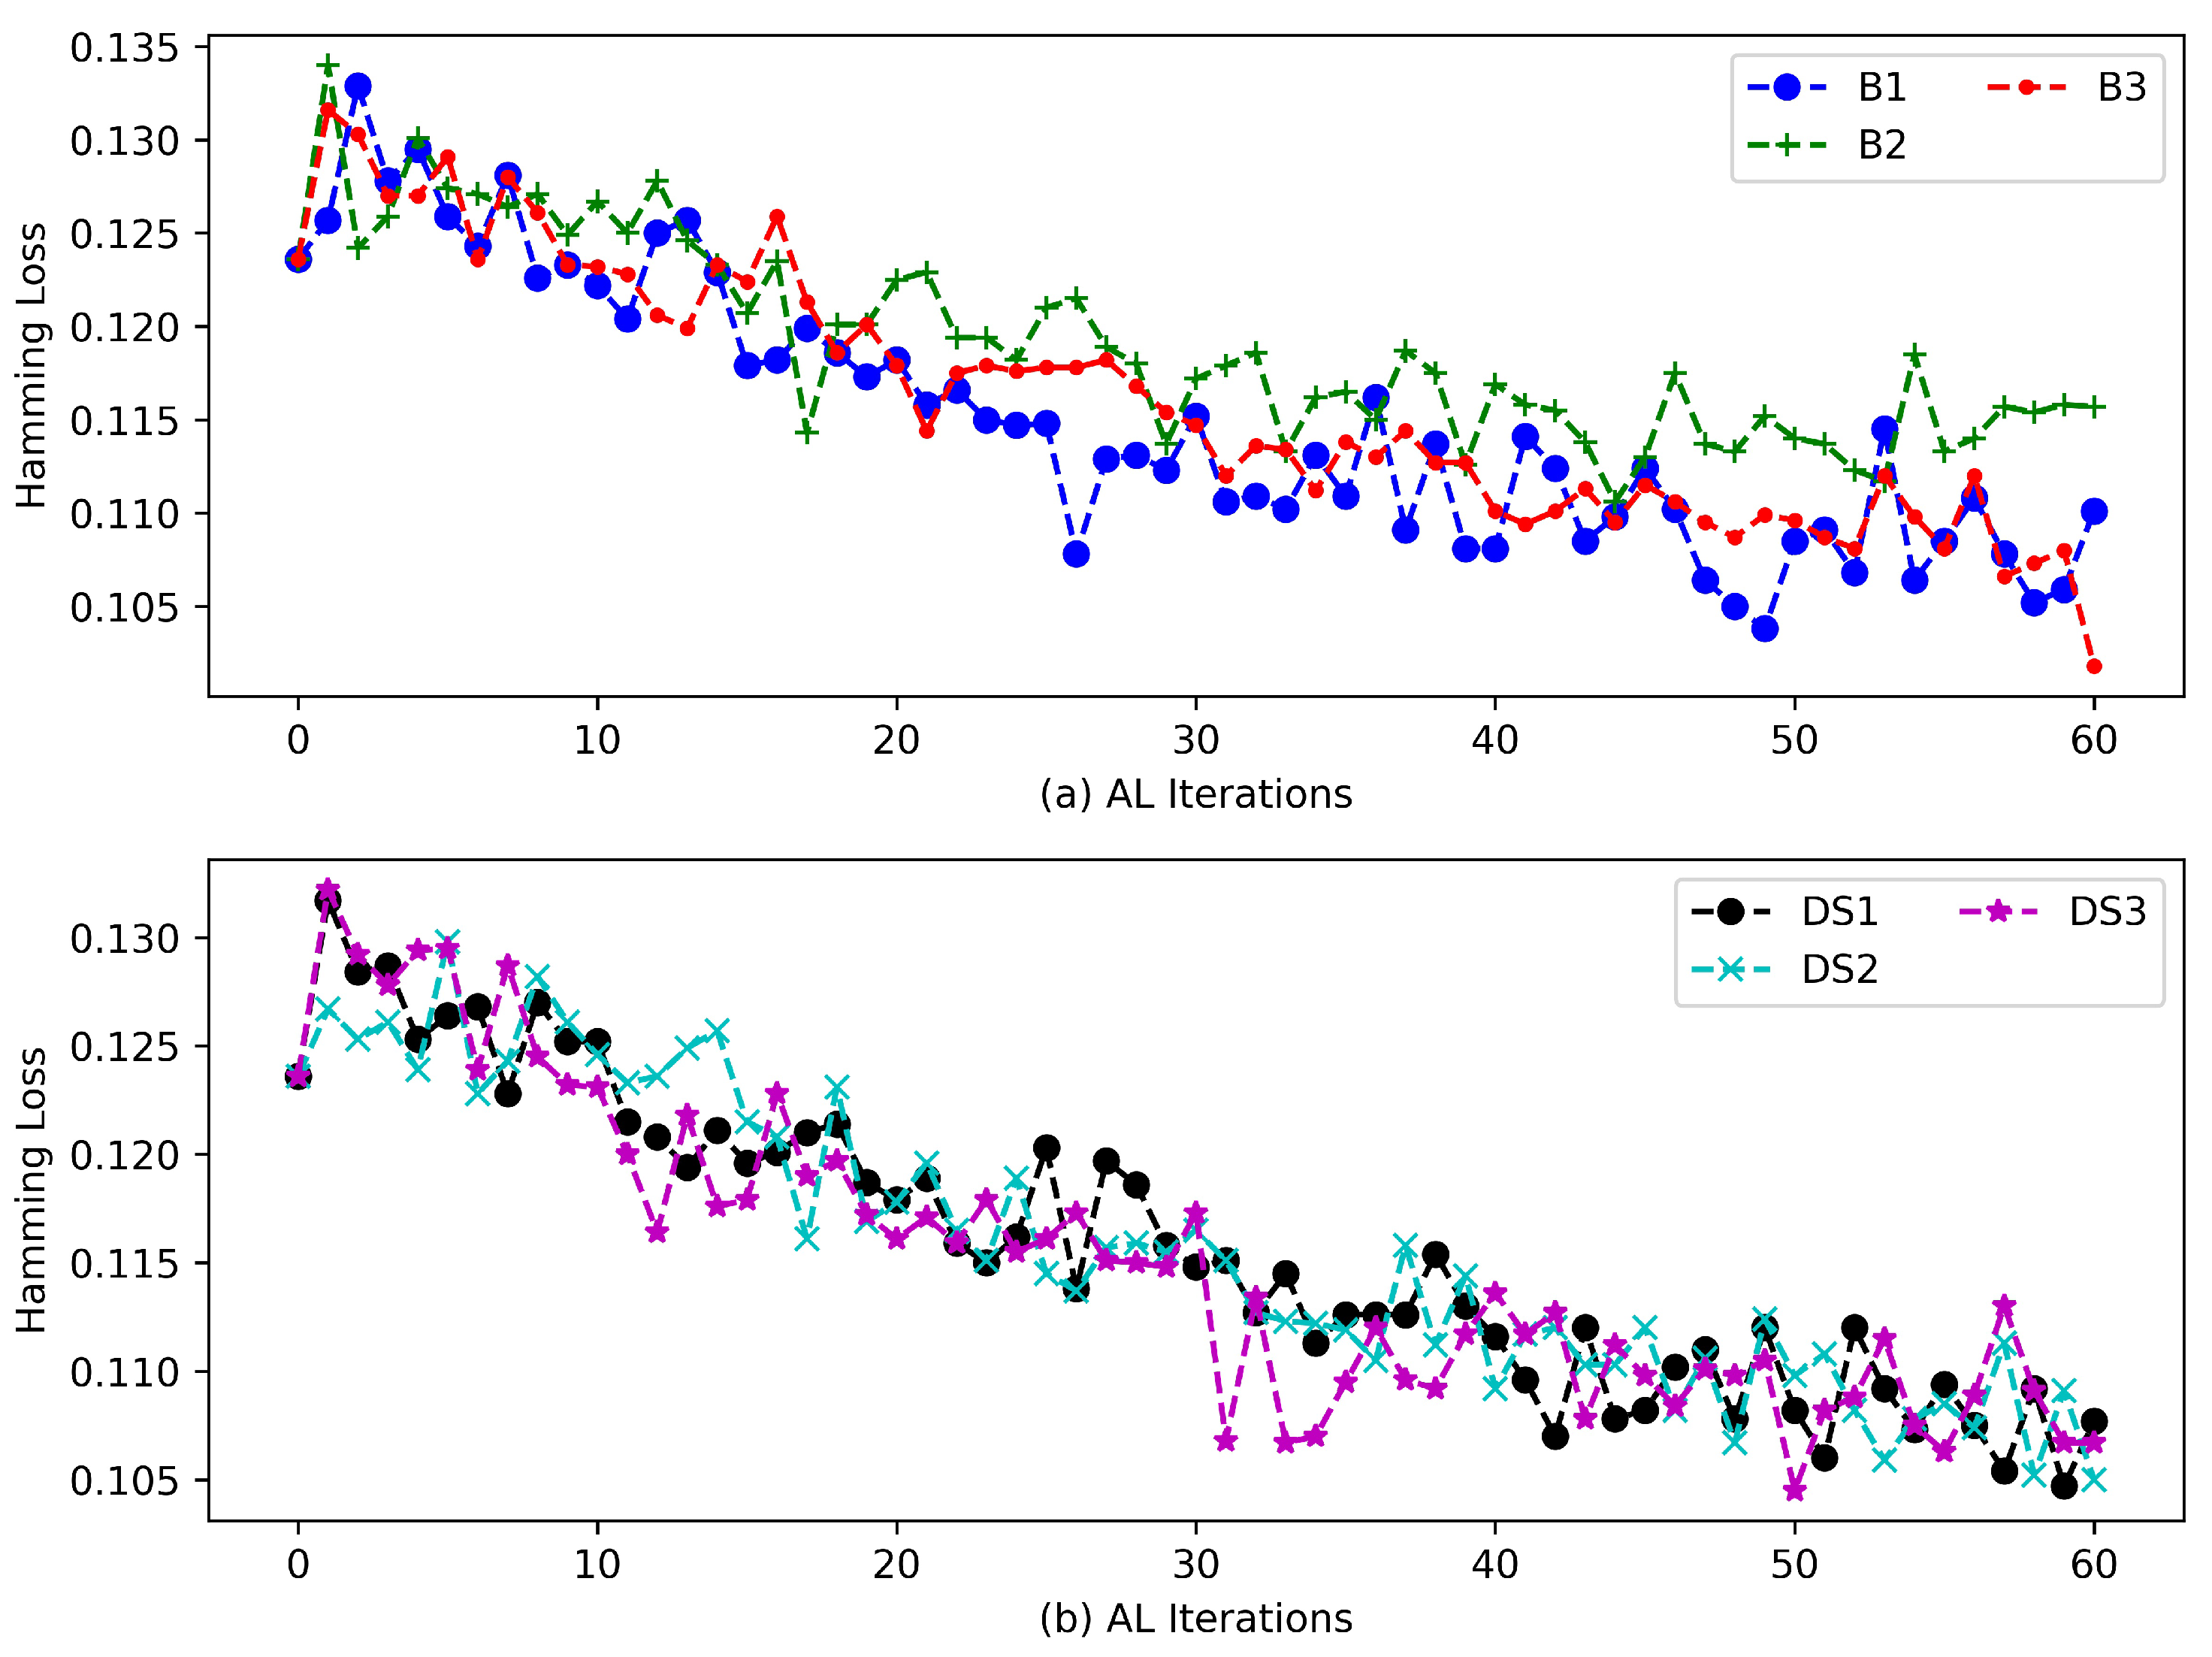
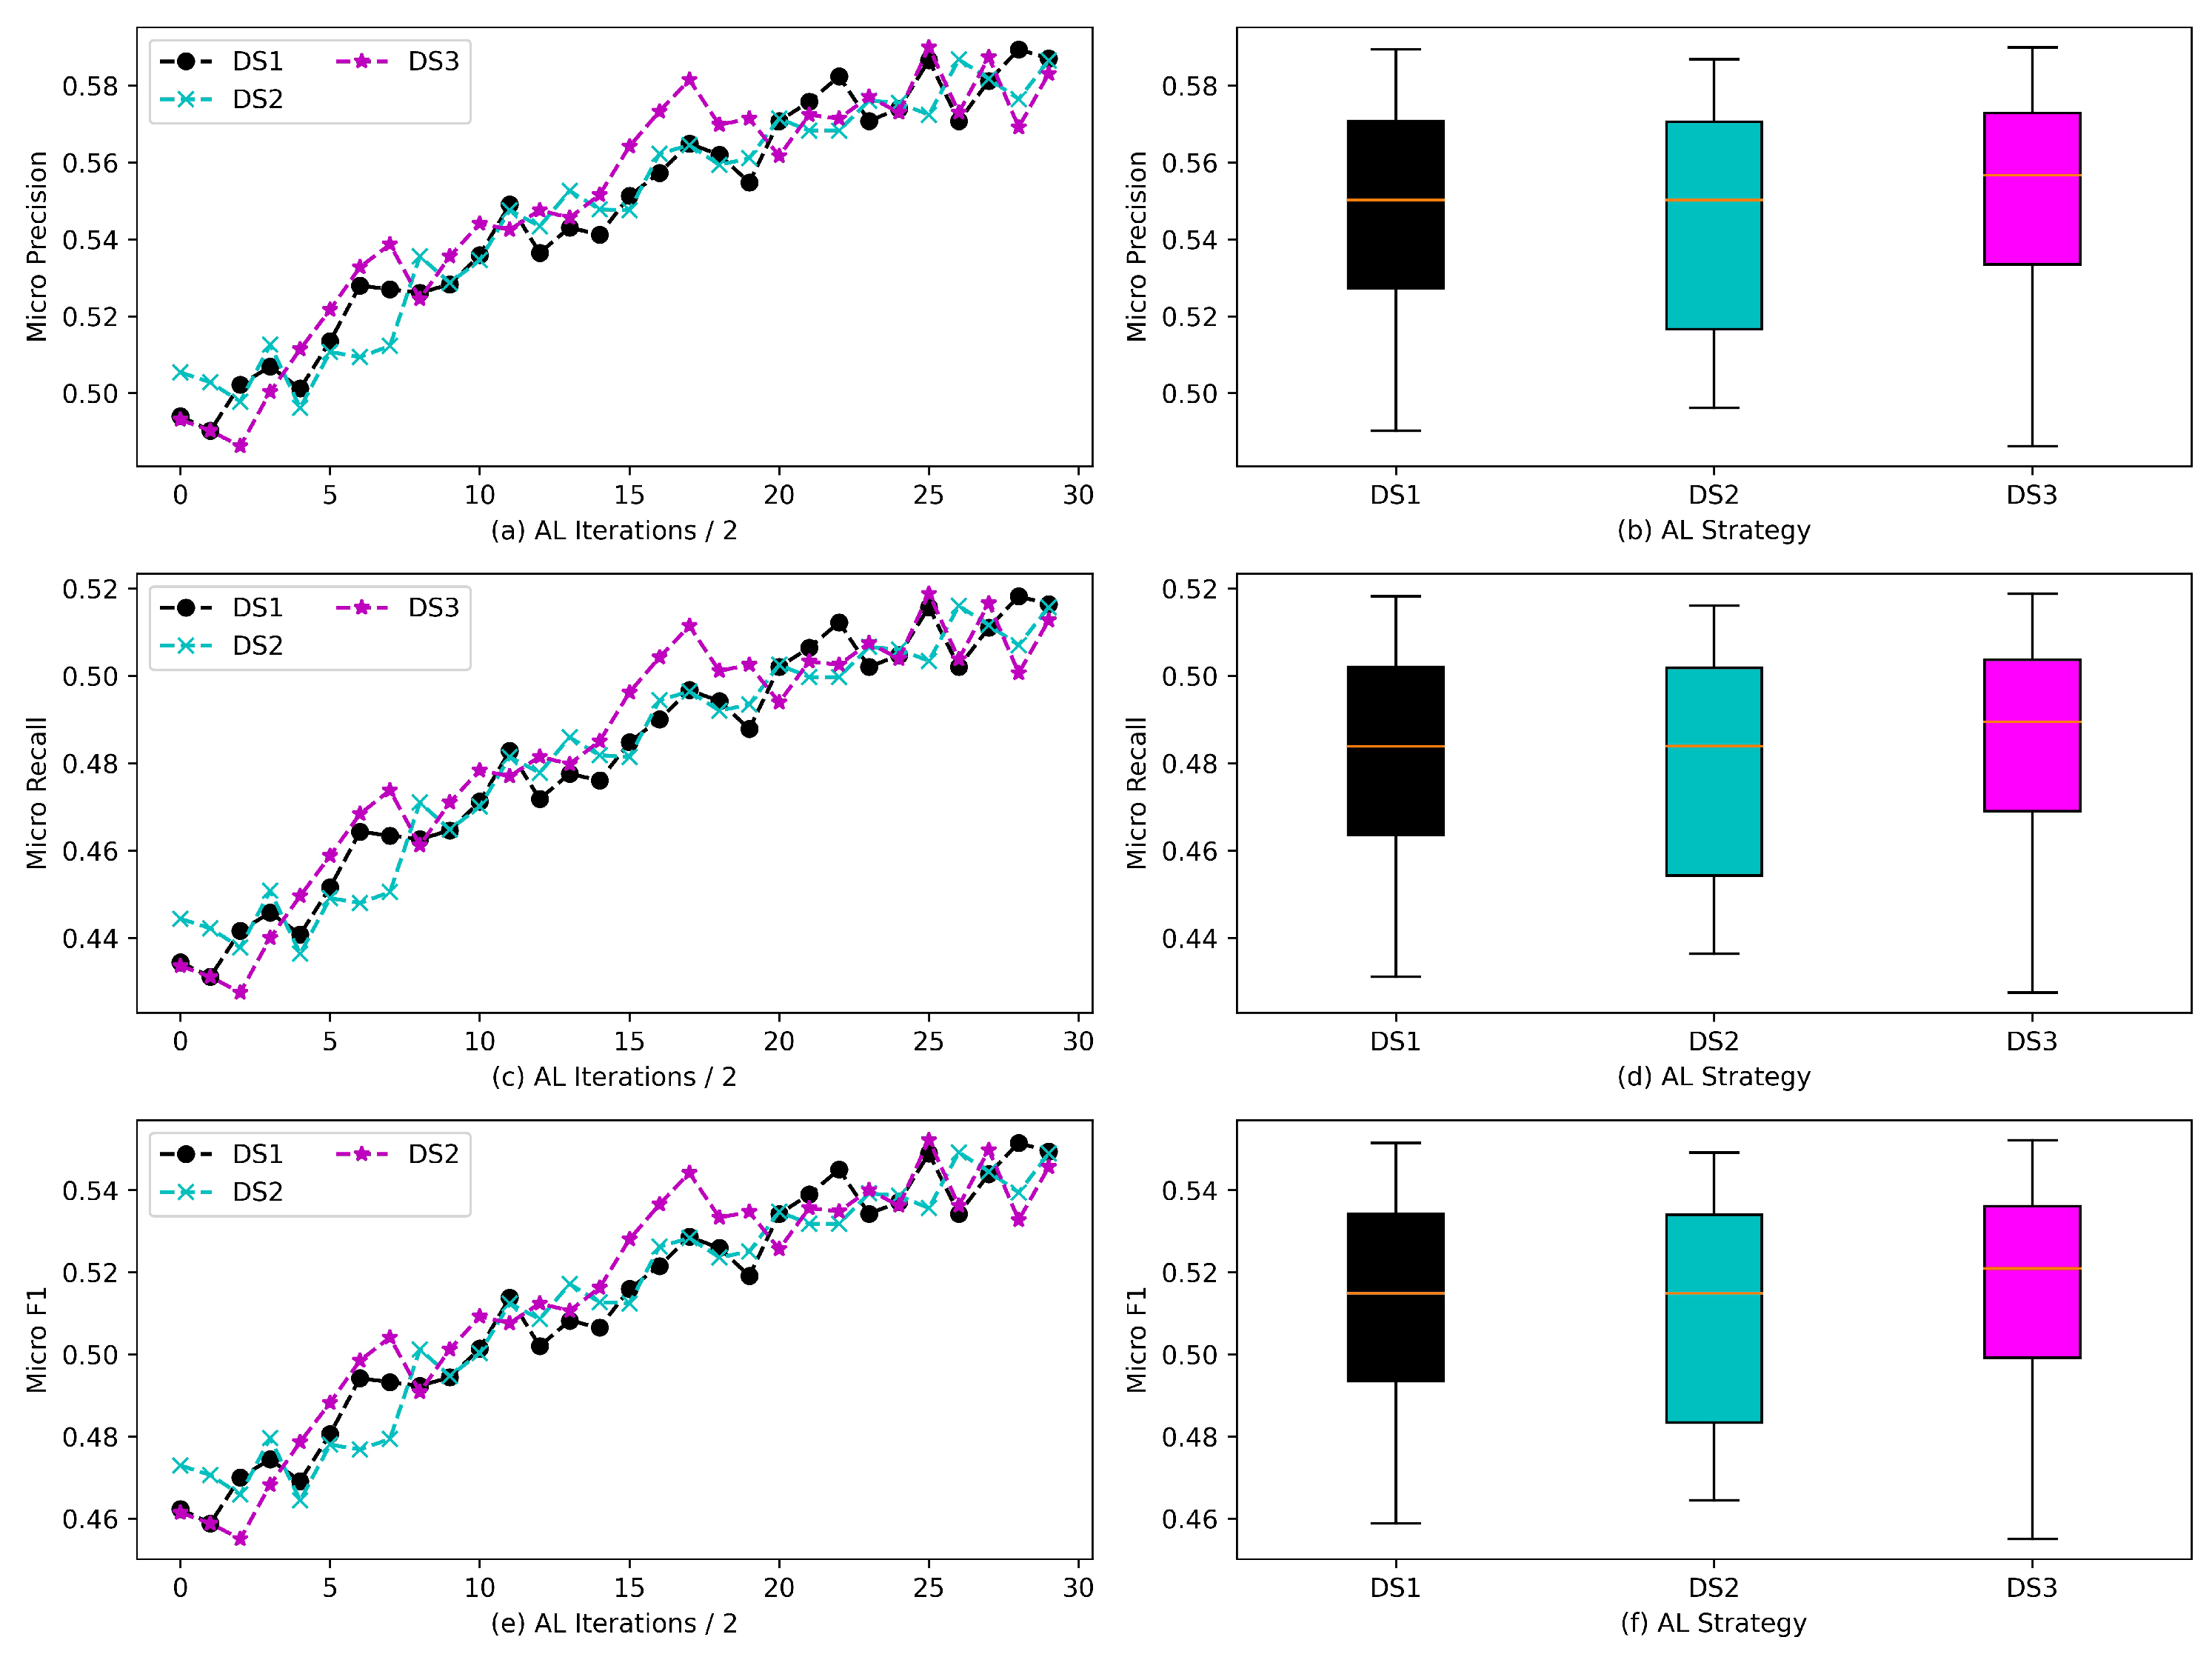
4.4.2. Results of AL via Asymmetric Samplers

In this section, extended instance selection experiments were conducted by AL via the asymmetric sampler model, designed to verify the effectiveness of representativeness criteria in sampling. Firstly, to find the effective query strategy for the second sampler, we conducted extensive experiments; the results can be seen in Table 6, Table 7 and Table 8 and Figure 6. Moreover, the results show that, regardless of what indicators are utilized to evaluate the performances of the models, double CE always outperforms the baselines (DS2 and DS3).
Table 6, Table 7 and Table 8 and Figure 6 demonstrate the changing of micro precision, recall, and F1 in the classification experiments. Table 6, Table 7 and Table 8 show that DS1 has a better performance on LR and SVM than ELM. Moreover, DS2 has higher improvements in {(precision, 8.37%), (recall, 7.36%), and (F1, 7.83%)} on the classifier ELM, but it only achieves {(precision, 3.83%), (recall, 0.22%), (F1, 2.21%)}, and {(precision, 0.94%), (recall, −1.10%), and (F1, −0.10%)} in tasks conducted by LR and SVM, respectively. Meanwhile, DS1 achieves all positive improvements in the three classification experiments, which are {(precision, 7.17%), (recall, 6.31%), (F1, 6.71%)}, {(precision, 4.55%) on ELM, (recall, 1.44%), (F1, 3.16%)} on LR and {(precision, 2.40%), (recall, 0.61%), (F1, 1.11%)} on SVM, respectively. Furthermore, from the tendency of precision, recall, and F1 scores shown in Figure 6, scores achieved by DS1 are smoother and more compact than the other two. Hereto, the usefulness of AL via asymmetric samplers is proved directly and strongly.
Secondly, label distributions are also measured in this section. From Figure 4d,e,f, we observe that the differences in the fluctuations of the emotion label percentages between DS1 and DS2 are difficult to distinguish. Therefore, we took the implementations of the direct quantities of each class emotion label to analyze the tiny distinctions. Based on the quantities of the emotion labels in Table 9, except for the numbers, the expectations on every final D t r a i n were easily achieved via mathematical computing, and the results were {(DS1, 996.44), (DS2, 962.22), and (DS3, 1245.33),} which depicts the manner of DS2 utilizing the balancing strategy, but its superiority is tiny to DS1.
Thirdly, the Hamming loss measures the importance of text corpora to classifiers from another perspective. In this task, the Hamming loss (based on corpora updated by DS1, DS2, and DS3) is shown in Figure 5b, and it is clear that the curves of the Hamming loss converged rapidly while training on the basis of DS1. Conclusively, D t r a i n based on DS1 could provide more ‘emotion’ features to ‘learn’ more proper distributed weights in ELM; improves the classification performance with the same number of labeled texts. Additionally, the improvements within groups of emotion classification on the final corpus based on DS1 by ELM are shown in Table 10. It is clear that the performances of the overwhelming majority of groups increased visibly in precision, recall, and F1, which proved the proposed method’s efficiency in recognizing emotional tokens.

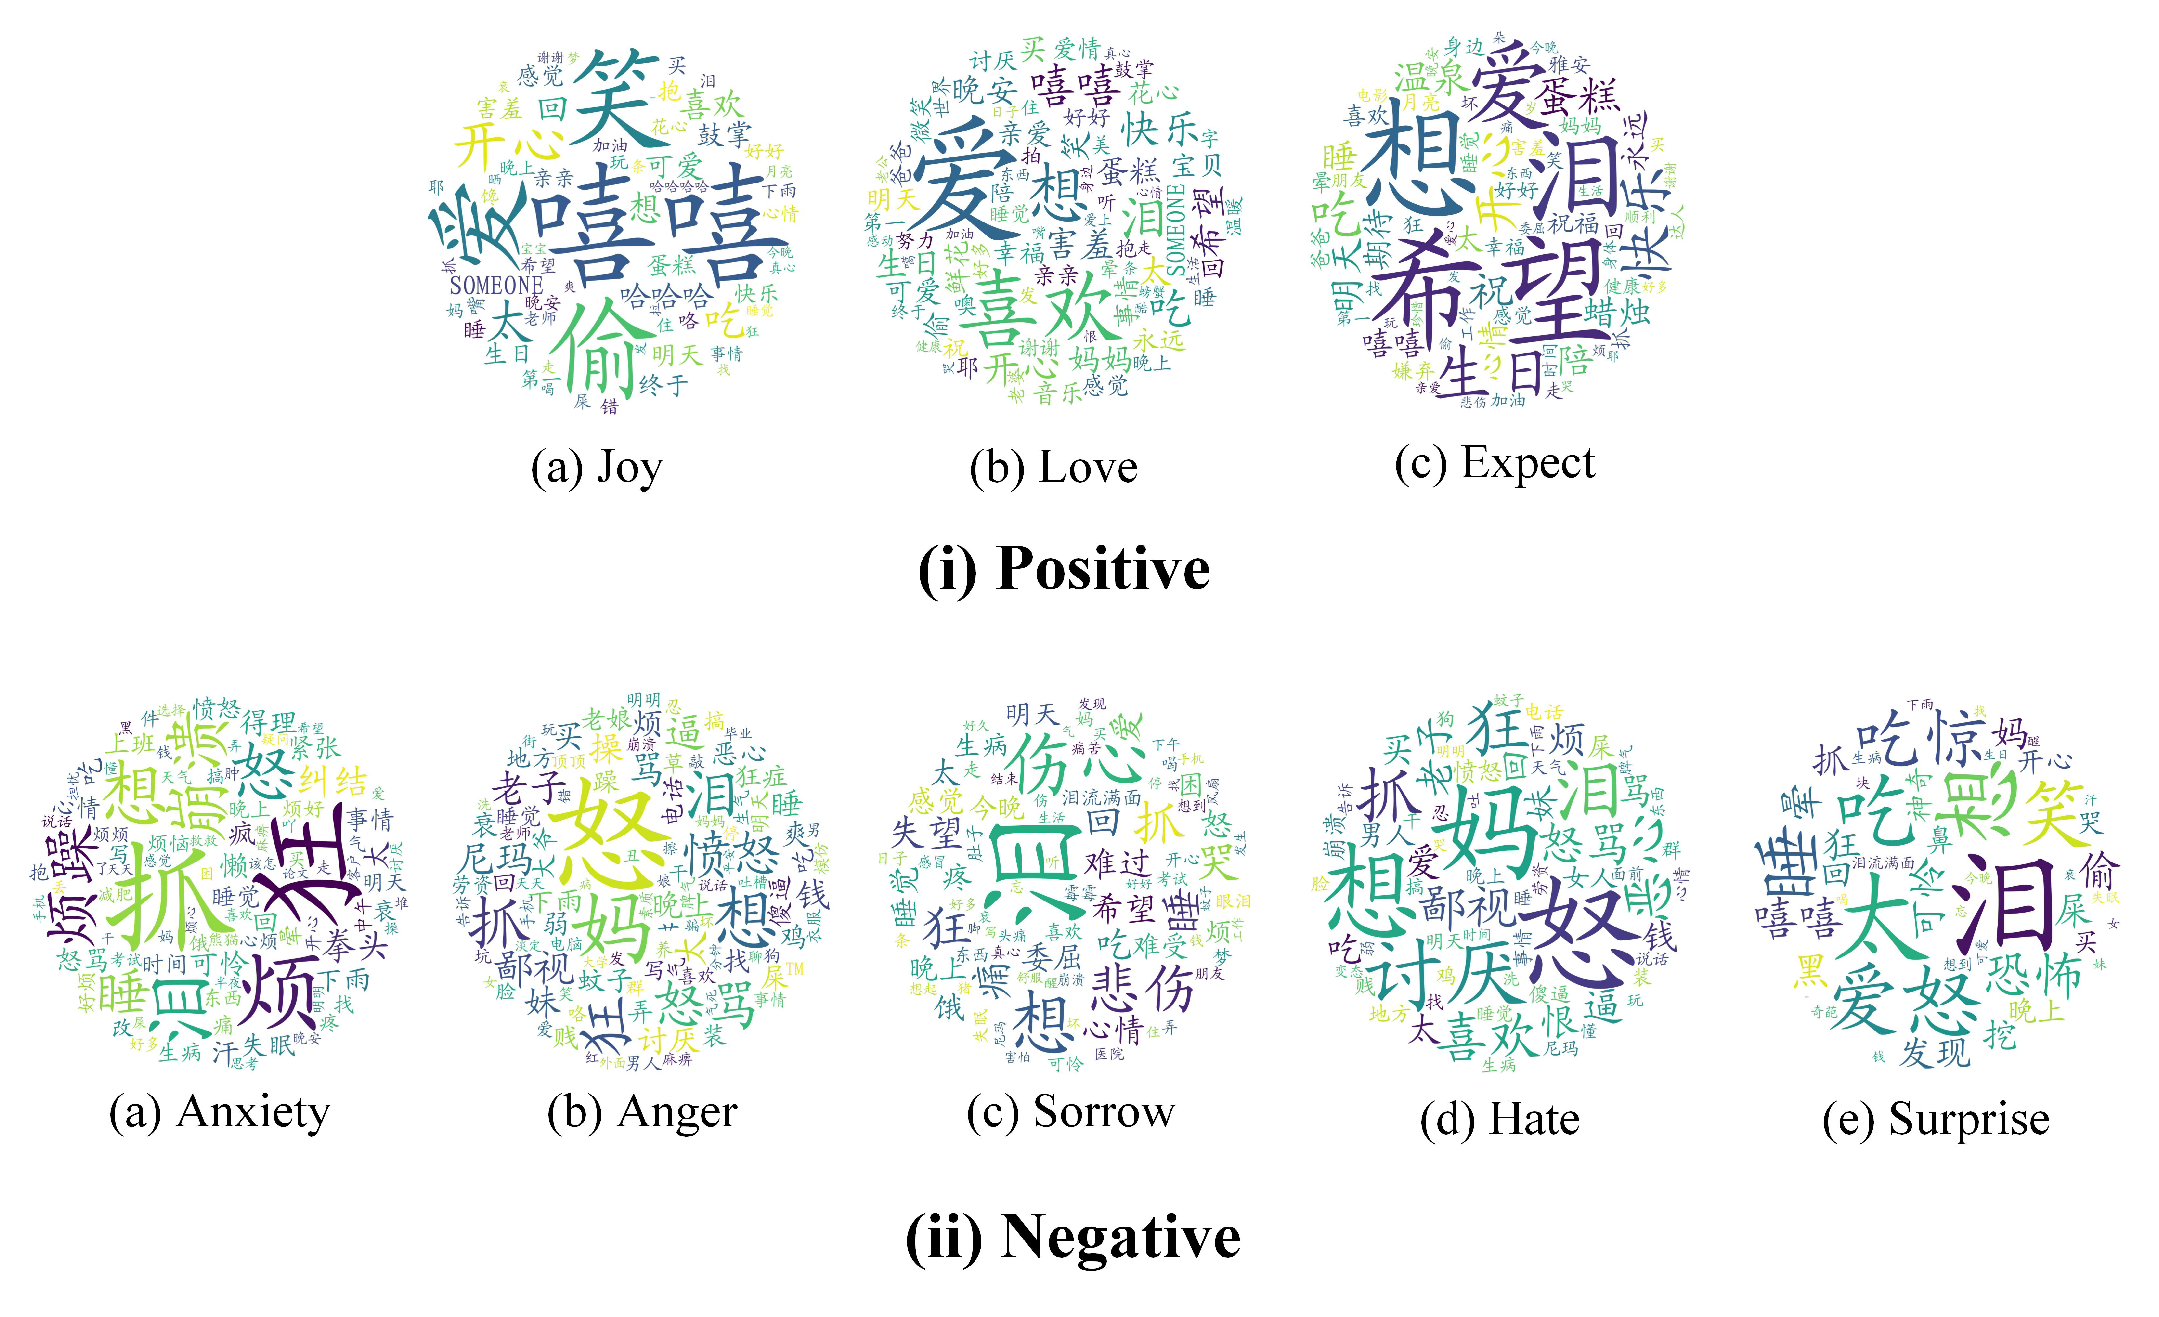
4.5. Emotional Information in Corpus Built by DS2

From the above description, the proposed AL via asymmetric samplers presents an excellent performance in extracting sentence-level text to enrich the emotional information in the text sets. To further mine emotional lexicons and information in D t r a i n built by DS1, this work roughly explores Chinese expressing traditional customs and shows high-frequency emotion words via WordCloud.
By observing the texts in D t r a i n , we believe that two significant points from empirical evidence impact the model’s learning ability most. Firstly, due to its traditional culture (different from the direct expression manner in English), Chinese is implicit while showing its inner true feelings in some certain emotions. For example, “愿为梁祝”. There are only four characters—and its literal meaning is “want to be Liang and Zhu”, with an ‘emotion’ state of “expect”. However, the publisher presents his “love” in the manner of a love story. Therefore, more accurate text linguistic representation is needed to prevent misunderstanding the integrated emotional information.
Secondly, textual emotion probing is still a research hot topic, but it is a hard point in NLP, especially in multi-class and multi-label tasks. Figure 7 shows the WordCloud drawn from D t r a i n , built by DS1. For more distinct details, we split emotion into two groups: positive and negative. The emotions joy, love, and expect are arranged positively; the other five emotion labels are believed to be negative. While expressing emotional text randomly, it is obvious that some special words are used with high frequency. In the positive part, “joy” is usually represented by “嘻嘻” (Mimetic word, Xi Xi), “偷笑” (Titter), while “love” is more likely to be expressed by “爱, 喜欢” (both mean love in Chinese). In “expect”, “希望” (expect) and “想” (want) are the most frequent tokens. Moreover, it was found that “泪” (Tears) has a large font size in “expect”. Through an analysis, we observed that the Chinese prefer to express “expect” when they are in an awful situation; it encourages them to overcome the difficulties in their lives due to nationality characteristics.
In contrast, in the negative part, “anxiety” is always represented by words such as “抓狂” (Crazy) and “烦躁” (anxiety). The “anger” expression in Chinese is single, and the most frequent character is “怒” (Anger). In “sorrow”, “泪” (Tears), “伤心” (Sad), and “悲伤” (Sorrow) usually appear together. Compared to the latter-day obscure expression style, it means that the directly emotive expression is the tendency in Chinese. While Chinese shows the feeling “讨厌” (Hate), the token “怒” (Anger) is often used together to intensify people’s feelings. When it comes to “surprise”, it is complex, with its definition being something to happen or messages beyond one’s control or thinking in Chinese. Thus, too many aspects/intentions can be summarized in this class, such as “惊喜” (surprise with happy), “惊吓” (Scare), “惊扰” (Alarm), and so on. However, the above statement does not mean “surprise” texts are collected easily because of the low percentage of this emotion in daily life. Thus, an effective solution is urgently needed to prevent diverting the correct meaning of the input sentence during the process of embedding learning in multi-label and multi-class tasks.
Overall, from the above analyses, we can see that it is important to grasp Chinese from its textual semantics and syntax; this will be our (continued) research point in future work.

5. Conclusions

In this paper, to alleviate the pressure from the shortage of labeled data, we proposed a novel AL via an asymmetric sampler model based on ELM for sentence-level Chinese texts. This model integrates information measurement and a label-balanced strategy to capture emotional texts efficiently, to build a Chinese sentence-level emotion corpus and guide the textual learning of ELM. To begin with, this paper proposes using the highly explainable SLFN (ELM) as the textual feature generator in AL research; our research findings show that it can be transferred into the AL domain conveniently and efficiently, providing a new method to explore the AL field. Furthermore, in the proposed AL model, a novel combined query strategy, known as asymmetric samplers, which consider two asymmetric factors (i.e., uncertainty and representativeness) simultaneously, was utilized to update the text corpus; the updated corpus achieved a state-of-the-art performance among the mentioned query strategies. Finally, the experiments found that ELM-based AL via asymmetric samplers based on double CE achieved state-of-the-art classification performances, and greatly reduced human labor in selecting the raw text, which could largely alleviate the pressure of shortages in acquiring the emotion labels of Chinese texts.
In the future, we plan to study more effective implementations of the query strategy based on ELM. Furthermore, more lightweight neural networks will be employed in our AL research. Moreover, we will introduce an auto-labeling module to the AL study, which would provide the exact predicted labeled data to the text and further reduce labeled data pressure in NLP tasks. Moreover, we will conduct more relative research on correlations among different emotion groups and probe the influences of cross-performances in AL sampling tasks.

Author Contributions

Conceptualization, X.S. (Xuefeng Shi), M.H. and F.R.; methodology and investigation, X.S. (Xuefeng Shi) and M.H.; resources, X.S. (Xuefeng Shi) and P.S.; writing—original draft preparation, X.S. (Xuefeng Shi), M.H. and P.S.; writing—review and editing, X.S. (Xuefeng Shi), M.H., F.R. and X.S. (Xiao Sun); supervision, M.H, F.R. and X.S. (Xiao Sun); project administration, M.H., F.R. and X.S. (Xiao Sun); funding acquisition, M.H. and F.R. All authors have read and agreed to the published version of the manuscript.

Funding

This research was funded by the National Natural Science Foundation of China under grant nos. 62176084 and 62176083, and in part by the Fundamental Research Funds for the Central Universities of China under grant PA2021GDSK0093 and PA2022GDSK0068.

Data Availability Statement

Not applicable.

Acknowledgments

This work was supported in part by the National Natural Science Foundation of China under Grant 62176084, and Grant 62176083, and in part by the Fundamental Research Funds for the Central Universities of China under grant PA2021GDSK0093 and PA2022GDSK0068. We acknowledge the use of the facilities and equipment provided by the Hefei University of Technology. We would like to thank every party stated above for providing help and assistance in this research.

Conflicts of Interest

The authors declare no conflict of interest.

Appendix A

Figure A1. Asymmetric samplers in the designed AL model; (a) selects the proper candidate sentence-level texts by uncertainty; (b) denotes samples extracted by representativeness.
Symmetry 14 01698 g0a1
Figure A2. The output of the selected sentence-level texts by AL via asymmetric samplers.
Symmetry 14 01698 g0a2

References

  1. Deng, J.; Ren, F. Multi-label Emotion Detection via Emotion-Specified Feature Extraction and Emotion Correlation Learning. IEEE Trans. Affect. Comput. 2020. [Google Scholar] [CrossRef]
  2. Derhab, A.; Alawwad, R.; Dehwah, K.; Tariq, N.; Khan, F.A.; Al-Muhtadi, J. Tweet-based bot detection using big data analytics. IEEE Access 2021, 9, 65988–66005. [Google Scholar] [CrossRef]
  3. Feng, S.; Tan, Z.; Li, R.; Luo, M. Heterogeneity-aware twitter bot detection with relational graph transformers. In Proceedings of the AAAI Conference on Artificial Intelligence, online, 22 February–1 March 2022; Volume 36, pp. 3977–3985. [Google Scholar]
  4. Suchacka, G.; Cabri, A.; Rovetta, S.; Masulli, F. Efficient on-the-fly Web bot detection. Knowl.-Based Syst. 2021, 223, 107074. [Google Scholar] [CrossRef]
  5. Dwarakanath, L.; Kamsin, A.; Rasheed, R.A.; Anandhan, A.; Shuib, L. Automated machine learning approaches for emergency response and coordination via social media in the aftermath of a disaster: A review. IEEE Access 2021, 9, 68917–68931. [Google Scholar] [CrossRef]
  6. Mansour, R.F.; El Amraoui, A.; Nouaouri, I.; Díaz, V.G.; Gupta, D.; Kumar, S. Artificial intelligence and internet of things enabled disease diagnosis model for smart healthcare systems. IEEE Access 2021, 9, 45137–45146. [Google Scholar] [CrossRef]
  7. Lin, Y.; Li, M.; Watanabe, Y.; Kimura, T.; Matsunawa, T.; Nojima, S.; Pan, D.Z. Data efficient lithography modeling with transfer learning and active data selection. IEEE Trans.-Comput.-Aided Des. Integr. Circuits Syst. 2018, 38, 1900–1913. [Google Scholar] [CrossRef]
  8. Yan, Y.; Huang, S.J. Cost-Effective Active Learning for Hierarchical Multi-Label Classification. In Proceedings of the IJCAI, Stockholm, Sweden, 13–19 July 2018; pp. 2962–2968. [Google Scholar]
  9. Yoo, D.; Kweon, I.S. Learning loss for active learning. In Proceedings of the IEEE/CVF Conference on Computer Vision and Pattern Recognition, Long Beach, CA, USA, 16–17 June 2019; pp. 93–102. [Google Scholar]
  10. Le, Q.; Mikolov, T. Distributed representations of sentences and documents. In Proceedings of the International Conference on Machine Learning, Beijing, China, 21–26 June 2014; pp. 1188–1196. [Google Scholar]
  11. Zhang, A.; Li, B.; Wang, W.; Wan, S.; Chen, W. MII: A novel text classification model combining deep active learning with BERT. Comput. Mater. Contin. 2020, 63, 1499–1514. [Google Scholar] [CrossRef]
  12. Zhang, X.; Zhao, J.; LeCun, Y. Character-level convolutional networks for text classification. Adv. Neural Inf. Process. Syst. 2015, 28, 649–657. [Google Scholar]
  13. De Angeli, K.; Gao, S.; Alawad, M.; Yoon, H.J.; Schaefferkoetter, N.; Wu, X.C.; Durbin, E.B.; Doherty, J.; Stroup, A.; Coyle, L.; et al. Deep active learning for classifying cancer pathology reports. BMC Bioinform. 2021, 22, 1–25. [Google Scholar] [CrossRef]
  14. Dor, L.E.; Halfon, A.; Gera, A.; Shnarch, E.; Dankin, L.; Choshen, L.; Danilevsky, M.; Aharonov, R.; Katz, Y.; Slonim, N. Active learning for BERT: An empirical study. In Proceedings of the 2020 Conference on Empirical Methods in Natural Language Processing (EMNLP), online, 1 May 2020; pp. 7949–7962. [Google Scholar]
  15. Khowaja, S.A.; Khuwaja, P. Q-learning and LSTM based deep active learning strategy for malware defense in industrial IoT applications. Multimed. Tools Appl. 2021, 80, 14637–14663. [Google Scholar] [CrossRef]
  16. Huang, G.B.; Zhu, Q.Y.; Siew, C.K. Extreme learning machine: Theory and applications. Neurocomputing 2006, 70, 489–501. [Google Scholar] [CrossRef]
  17. Nguyen, V.L.; Shaker, M.H.; Hüllermeier, E. How to measure uncertainty in uncertainty sampling for active learning. Mach. Learn. 2022, 111, 89–122. [Google Scholar] [CrossRef]
  18. Huang, S.J.; Zhou, Z.H. Active query driven by uncertainty and diversity for incremental multi-label learning. In Proceedings of the 2013 IEEE 13th International Conference on Data Mining, Dallas, TX, USA, 7–10 December 2013; pp. 1079–1084. [Google Scholar]
  19. Du, B.; Wang, Z.; Zhang, L.; Zhang, L.; Liu, W.; Shen, J.; Tao, D. Exploring representativeness and informativeness for active learning. IEEE Trans. Cybern. 2015, 47, 14–26. [Google Scholar] [CrossRef] [PubMed]
  20. Liu, Z.; Jiang, X.; Luo, H.; Fang, W.; Liu, J.; Wu, D. Pool-based unsupervised active learning for regression using iterative representativeness-diversity maximization (iRDM). Pattern Recognit. Lett. 2021, 142, 11–19. [Google Scholar] [CrossRef]
  21. Kang, X.; Wu, Y.; Ren, F. Progressively improving supervised emotion classification through active learning. In Proceedings of the International Conference on Multi-disciplinary Trends in Artificial Intelligence, Hanoi, Vietnam, 18–20 November 2018; pp. 49–57. [Google Scholar]
  22. Yao, L.; Huang, H.; Wang, K.W.; Chen, S.H.; Xiong, Q. Fine-grained mechanical Chinese named entity recognition based on ALBERT-AttBiLSTM-CRF and transfer learning. Symmetry 2020, 12, 1986. [Google Scholar] [CrossRef]
  23. Khan, M.A.; Kadry, S.; Zhang, Y.D.; Akram, T.; Sharif, M.; Rehman, A.; Saba, T. Prediction of COVID-19-pneumonia based on selected deep features and one class kernel extreme learning machine. Comput. Electr. Eng. 2021, 90, 106960. [Google Scholar] [CrossRef]
  24. Zhang, L.; Zhang, D. Evolutionary cost-sensitive extreme learning machine. IEEE Trans. Neural Netw. Learn. Syst. 2016, 28, 3045–3060. [Google Scholar] [CrossRef]
  25. Muhammad, G.; Rahman, S.M.M.; Alelaiwi, A.; Alamri, A. Smart health solution integrating IoT and cloud: A case study of voice pathology monitoring. IEEE Commun. Mag. 2017, 55, 69–73. [Google Scholar] [CrossRef]
  26. Muhammad, G.; Alhamid, M.F.; Alsulaiman, M.; Gupta, B. Edge computing with cloud for voice disorder assessment and treatment. IEEE Commun. Mag. 2018, 56, 60–65. [Google Scholar] [CrossRef]
  27. Cambria, E.; Gastaldo, P.; Bisio, F.; Zunino, R. An ELM-based model for affective analogical reasoning. Neurocomputing 2015, 149, 443–455. [Google Scholar] [CrossRef]
  28. Oneto, L.; Bisio, F.; Cambria, E.; Anguita, D. Statistical learning theory and ELM for big social data analysis. IEEE Comput. Intell. Mag. 2016, 11, 45–55. [Google Scholar] [CrossRef]
  29. Shi, L.C.; Lu, B.L. EEG-based vigilance estimation using extreme learning machines. Neurocomputing 2013, 102, 135–143. [Google Scholar] [CrossRef]
  30. Murugavel, A.M.; Ramakrishnan, S. Hierarchical multi-class SVM with ELM kernel for epileptic EEG signal classification. Med. Biol. Eng. Comput. 2016, 54, 149–161. [Google Scholar] [CrossRef] [PubMed]
  31. Yang, Y.; Wu, Q.J. Extreme learning machine with subnetwork hidden nodes for regression and classification. IEEE Trans. Cybern. 2015, 46, 2885–2898. [Google Scholar] [CrossRef]
  32. Tissera, M.D.; McDonnell, M.D. Deep extreme learning machines: Supervised autoencoding architecture for classification. Neurocomputing 2016, 174, 42–49. [Google Scholar] [CrossRef]
  33. Deng, W.Y.; Bai, Z.; Huang, G.B.; Zheng, Q.H. A fast SVD-Hidden-nodes based extreme learning machine for large-scale data Analytics. Neural Netw. 2016, 77, 14–28. [Google Scholar] [CrossRef]
  34. Li, K.; Kong, X.; Lu, Z.; Wenyin, L.; Yin, J. Boosting weighted ELM for imbalanced learning. Neurocomputing 2014, 128, 15–21. [Google Scholar] [CrossRef]
  35. Li, J.; Du, Q.; Li, W.; Li, Y. Optimizing extreme learning machine for hyperspectral image classification. J. Appl. Remote. Sens. 2015, 9, 097296. [Google Scholar] [CrossRef]
  36. Huang, S.J.; Chen, J.L.; Mu, X.; Zhou, Z.H. Cost-Effective Active Learning from Diverse Labelers. In Proceedings of the IJCAI, Melbourne, Australia, 20 August 2017; pp. 1879–1885. [Google Scholar]
  37. Neutatz, F.; Mahdavi, M.; Abedjan, Z. ED2: A case for active learning in error detection. In Proceedings of the 28th ACM International Conference on Information and Knowledge Management, Beijing, China, 3–7 November 2019; pp. 2249–2252. [Google Scholar]
  38. Cai, J.J.; Tang, J.; Chen, Q.G.; Hu, Y.; Wang, X.; Huang, S.J. Multi-View Active Learning for Video Recommendation. In Proceedings of the IJCAI, Macao, China, 11–12 August 2019; pp. 2053–2059. [Google Scholar]
  39. Wang, M.; Fu, K.; Min, F.; Jia, X. Active learning through label error statistical methods. Knowl.-Based Syst. 2020, 189, 105140. [Google Scholar] [CrossRef]
  40. Miller, T.L.; Grimes, M.G.; McMullen, J.S.; Vogus, T.J. Venturing for others with heart and head: How compassion encourages social entrepreneurship. Acad. Manag. Rev. 2012, 37, 616–640. [Google Scholar] [CrossRef]
  41. Plutchik, R.; Kellerman, H. Theories of Emotion; Academic Press: Cambridge, MA, USA, 2013; Volume 1. [Google Scholar]
  42. Mohammad, S.M.; Turney, P.D. Crowdsourcing a word-emotion association lexicon. Comput. Intell. 2013, 29, 436–465. [Google Scholar] [CrossRef]
  43. Quan, C.; Ren, F. A blog emotion corpus for emotional expression analysis in Chinese. Comput. Speech Lang. 2010, 24, 726–749. [Google Scholar] [CrossRef]
  44. Ren, F.; Quan, C. Linguistic-based emotion analysis and recognition for measuring consumer satisfaction: An application of affective computing. Inf. Technol. Manag. 2012, 13, 321–332. [Google Scholar] [CrossRef]
  45. Ren, F.; Kang, X. Employing hierarchical Bayesian networks in simple and complex emotion topic analysis. Comput. Speech Lang. 2013, 27, 943–968. [Google Scholar] [CrossRef]
  46. Ptaszynski, M.; Rzepka, R.; Araki, K.; Momouchi, Y. Automatically annotating a five-billion-word corpus of Japanese blogs for sentiment and affect analysis. Comput. Speech Lang. 2014, 28, 38–55. [Google Scholar] [CrossRef]
  47. Shi, W.; Wang, H.; He, S. Sentiment analysis of Chinese microblogging based on sentiment ontology: A case study of ‘7.23 Wenzhou Train Collision’. Connect. Sci. 2013, 25, 161–178. [Google Scholar] [CrossRef]
  48. Gunter, B.; Koteyko, N.; Atanasova, D. Sentiment analysis: A market-relevant and reliable measure of public feeling? Int. J. Mark. Res. 2014, 56, 231–247. [Google Scholar] [CrossRef]
  49. He, Q.; Shang, T.; Zhuang, F.; Shi, Z. Parallel extreme learning machine for regression based on MapReduce. Neurocomputing 2013, 102, 52–58. [Google Scholar] [CrossRef]
  50. Tan, Y.; Yang, L.; Hu, Q.; Du, Z. Batch mode active learning for semantic segmentation based on multi-clue sample selection. In Proceedings of the 28th ACM International Conference on Information and Knowledge Management, Beijing, China, 3–7 November 2019; pp. 831–840. [Google Scholar]
  51. Guo, Y.; Ding, G.; Gao, Y.; Han, J. Active learning with cross-class similarity transfer. In Proceedings of the AAAI Conference on Artificial Intelligence, San Francisco, CA, USA, 4–9 February 2017; Volume 31. [Google Scholar]
  52. Jamshidpour, N.; Aria, E.H.; Safari, A.; Homayouni, S. Adaptive Self-Learned Active Learning Framework for Hyperspectral Classification. In Proceedings of the 2019 10th Workshop on Hyperspectral Imaging and Signal Processing: Evolution in Remote Sensing (WHISPERS), Amsterdam, The Netherlands, 24–26 September 2019; pp. 1–5. [Google Scholar]
  53. Rubner, Y.; Tomasi, C.; Guibas, L.J. The earth mover’s distance as a metric for image retrieval. Int. J. Comput. Vis. 2000, 40, 99–121. [Google Scholar] [CrossRef]
  54. Kang, X.; Shi, X.; Wu, Y.; Ren, F. Active learning with complementary sampling for instructing class-biased multi-label text emotion classification. IEEE Trans. Affect. Comput. 2020, 1. [Google Scholar] [CrossRef]
  55. Li, Y.; Lv, Y.; Wang, S.; Liang, J.; Li, J.; Li, X. Cooperative hybrid semi-supervised learning for text sentiment classification. Symmetry 2019, 11, 133. [Google Scholar] [CrossRef]
  56. Sarker, I.H.; Abushark, Y.B.; Alsolami, F.; Khan, A.I. Intrudtree: A machine learning based cyber security intrusion detection model. Symmetry 2020, 12, 754. [Google Scholar] [CrossRef]
  57. Zhu, S.; Li, S.; Chen, Y.; Zhou, G. Corpus fusion for emotion classification. In Proceedings of the COLING 2016, the 26th International Conference on Computational Linguistics: Technical Papers, Osaka, Japan, 11–16 December 2016; pp. 3287–3297. [Google Scholar]
  58. Iosifidis, A.; Tefas, A.; Pitas, I. Minimum variance extreme learning machine for human action recognition. In Proceedings of the 2014 IEEE International Conference on Acoustics, Speech and Signal Processing (ICASSP), Florence, Italy, 4–9 May 2014; pp. 5427–5431. [Google Scholar]
Figure 1. Inner structure of the traditional single-layer neural network.
Symmetry 14 01698 g001
Figure 2. Framework of AL via asymmetric samplers.
Symmetry 14 01698 g002
Figure 3. The performance of the corpus updated with a single sampler on emotion classification experiments. In (ac), the x-axis means the loops in AL experiments, and the y-axis note precision, recall, and F1. In (df), the x-axis means three baselines B1, B2, B3, and the y-axis notes precision, recall, and F1. In the boxplot, the orange line means the median of data distribution; the other four transverse lines from top to bottom note the highest, quarter, three-quarters, and lowest scores, respectively.
Symmetry 14 01698 g003
Figure 4. The tendency of the emotion label’s quantity in the updated corpus. The x-axis denotes the text numbers in the updated corpus, and the y-axis means each label’s proportion.
Symmetry 14 01698 g004
Figure 5. Hamming loss of emotion classification experiments.
Symmetry 14 01698 g005
Figure 6. The corpus performance updated with asymmetric samplers on emotion classification experiments. In (a,c,e), the x-axis means the loops in the AL experiments, and the y-axis notes precision, recall, and F1. In (b,d,f), the x-axis means three baselines DS1, DS2, DS3, and the y-axis notes precision, recall, and F1. In the boxplot, the orange line means the median of data distribution, and the other four transverse lines from top to bottom note the highest quarter, three-quarters, and lowest score, respectively.
Symmetry 14 01698 g006
Figure 7. WordCloud of emotional tokens in the final corpus built by DS1.
Symmetry 14 01698 g007
Table 1. The results of the emotion classification experiments on the final corpora of baselines by ELM. (↑ means the improvement, and ↓ notes the decrement).
PrecisionrecallF1
Initial (%)Final (%) or (%)Initial (%)Final (%) or (%)Initial (%)Final (%) or (%)
B151.2357.336.10↑45.0550.425.37↑47.9453.655.71↑
B251.2354.813.58↑45.0548.203.15↑47.9451.303.36↑
B351.2361.049.18↑45.0553.688.63↑47.9457.139.19↑
Table 2. The results of emotion classification experiments on the final corpora of baselines by LR. (↑ means the improvement, and ↓ notes the decrement).
PrecisionRecallF1
Initial (%)Final (%) or (%)Initial (%)Final (%) or (%)Initial (%)Final (%) or (%)
B157.3261.634.31↑65.1968.463.27↑61.0064.873.87↑
B257.3261.754.43↑65.1968.623.43↑61.0065.014.01↑
B357.3260.142.82↑65.1967.292.10↑61.0063.522.52↑
Table 3. The results of emotion classification experiments on the final corpora of baselines by SVM. (↑ means the improvement, and ↓ notes the decrement).
PrecisionRecallF1
Initial (%)Final (%) or (%)Initial (%)Final (%) or (%)Initial (%)Final (%) or (%)
B157.1759.021.85↑56.7257.060.34↑56.9458.021.08↑
B257.1755.861.31↓56.7253.792.93↓56.9454.812.13↓
B357.1758.761.59↑56.7256.450.27↓56.9457.580.64↑
Table 4. The quantity of each emotion label in the final baselines corpus.
AnxietyAngerSorrowHateJoyLoveExpectSurpriseNeutral
Initial30130030430030130030630899
B13383524863524914154183871153
B23163113193111794431410369232
B3584774686414335308366338626
Table 5. The emotion classification performances within groups on the final corpus of B1 by ELM. (↑ means the improvement, and ↓ notes the decrement).
PrecisionRecallF1
Initial (%)Final (%) or (%)Initial (%)Final (%) or (%)Initial (%)Final (%) or (%)
Anxiety49.7664.9015.14↑57.3055.062.24↓53.2659.576.31↑
Anger38.1561.1923.04↑32.8440.807.96↑35.2948.9613.67↑
Sorrow51.6365.0513.43↑43.1855.0011.82↑47.0359.6112.58↑
Hate38.8953.1914.30↑43.2628.0915.17↓40.9636.764.20↓
Joy70.0084.0214.02↑58.8866.367.48↑63.9674.1510.19↑
Love68.4779.3310.83↑65.5756.139.44↓66.9965.751.24↓
Expect52.8365.7312.90↑50.0052.232.23↑51.3858.216.83↑
Surprise43.7256.7012.98↑42.5529.2613.29↓43.1338.604.53↓
Neutral33.3329.533.80↓8.8566.1557.30↑13.9940.8426.85↑
Table 6. The results of the emotion classification experiments on the final asymmetric sampler corpus by ELM. (↑ means the improvement, and ↓ notes the decrement).
PrecisionRecallF1
Initial (%)Final (%) or (%)Initial (%)Final (%) or (%)Initial (%)Final (%) or (%)
DS151.2358.407.17↑45.0551.366.31↑47.9454.656.71↑
DS251.2359.608.37↑45.0552.417.36↑47.9455.777.83↑
DS351.2358.843.61↑45.0551.746.69↑47.9455.067.12↑
Table 7. The results of the emotion classification experiments on the final asymmetric sampler corpus by LR. (↑ means the improvement, and ↓ notes the decrement).
PrecisionRecallF1
Initial (%)Final (%) or (%)Initial (%)Final (%) or (%)Initial (%)Final (%) or (%)
DS157.3261.874.55↑65.1966.631.44↑61.0064.163.16↑
DS257.3261.153.83↑65.1965.410.22↑61.0063.212.21↑
DS357.3260.633.31↑65.1967.242.05↑61.0063.762.76↑
Table 8. The results of the emotion classification experiments on the final asymmetric sampler corpus by SVM. (↑ means the improvement, and ↓ notes the decrement).
PrecisionRecallF1
Initial (%)Final (%) or (%)Initial (%)Final (%) or (%)Initial (%)Final (%) or (%)
DS157.1759.572.40↑56.7257.330.61↑56.9458.431.49↑
DS257.1758.130.94↑56.7255.621.10↓56.9456.840.10↓
DS357.1759.382.21↑56.7256.780.06↑56.9458.051.11↑
Table 9. The quantity of each emotion label in the final asymmetric sampler corpus.
AnxietyAngerSorrowHateJoyLoveExpectSurpriseNeutral
Initial30130030430030130030630899
DS1372382560381695541482421633
DS2360399561371662500469396739
DS3643848611449335310340344559
Table 10. The emotion classification performances within groups on the final corpus of DS1 by ELM.
PrecisionRecallF1
Initial (%)Final (%) or (%)Initial (%)Final (%) or (%)Initial (%)Final (%) or (%)
Anxiety49.7657.397.63↑57.3056.740.56↓53.2657.063.80↑
Anger38.1555.2817.13↑32.8444.2811.44↑35.2949.1713.88↑
Sorrow51.6361.7210.09↑43.1858.6415.46↑47.0360.1413.11↑
Hate38.8955.3816.49↑43.2640.452.81↓40.9646.755.79↑
Joy70.0074.234.23↑58.8867.298.41↑63.9670.596.63↑
Love68.4776.007.53↑65.5762.742.83↓66.9968.731.74↑
Expect52.8361.118.28↑50.0054.024.02↑51.3857.355.97↑
Surprise43.7248.594.87↑42.5536.705.85↓43.1341.821.31↓
Neutral33.3334.310.98↑8.8536.4627.61↑13.9935.3521.36↑
Publisher’s Note: MDPI stays neutral with regard to jurisdictional claims in published maps and institutional affiliations.

