1. Introduction
Temperature is an important basis for judging the state of underground cables in high voltage substations. Cable fire is closely related to the temperature in the trench [
1,
2,
3,
4]. Due to the tightness of high voltage cable trench structures and the flammability of cable materials, cable fires occur from time to time, resulting in serious economic losses [
5,
6,
7], which poses a great threat to the safe operation of the power system [
8,
9]. In the early stage of cable trench fire development, it is impossible to observe the internal fire developing from outside the trench, so it is urgent to find other indirect means to judge the fire’s development [
10,
11]. Therefore, it is of great significance to study the identification of ignition points of high voltage cable trenches in substations using temperature distribution. Then targeted fire extinguishing measures can be employed to control the spread of the fire and to reduce personal and property losses [
12,
13,
14].
At present, scholars have carried out experimental simulation research on cable tunnel fires and have reached conclusions with engineering-guiding significance. Yang have explored the influence of fire source power, longitudinal position of the fire’s source, and pipe gallery slope on the temperature distribution under the ceiling in instances of comprehensive pipe gallery fire, and put forward a dimensionless transverse temperature rise prediction model considering the influence of pipe gallery slope [
15]; Zhou adopted the method of a reduced size model experiment and theoretical analysis to obtain the empirical formula of dimensionless longitudinal attenuation of ceiling temperature rise, coupled with the size of a circular pipe gallery, the size of fire source and the location of fire source [
16]; Zhao et al. studied the temperature attenuation caused by a fire under the ceiling of a longitudinally ventilated metro tunnel, analyzed and compared the different temperature distributions on the upstream and downstream sides of the fire source, and proposed a modified attenuation model for the temperature distribution on the upstream side of the fire source [
17]; Ahmed et al. studied the law of roof temperature attenuation and smoke diffusion in tunnels with natural ventilation, and deduced the formula for predicting temperature distribution and smoke diffusion [
18]; Oka et al. put forward the concept of jet thickness, concluded that the heat loss from tunnel walls has a great impact on jet thickness, and established an empirical formula for the internal velocity and the distribution of temperature rise in a top jet perpendicular to the tunnel roof [
19]; Sun studied the influence of open and closed conditions at both ends of the tunnel on tunnel fires, and fitted the maximum temperature attenuation formula under the two conditions [
20].
At present, the research mostly focuses on the characteristic parameters of hot smoke spread, such as jet radius and jet thickness of tunnel ceiling fires, and pays more attention to the influence of longitudinal ventilation speed, upstream and downstream difference from the fire source, thermal radiation, and other factors on the maximum change of ceiling temperature. The ceiling temperature of cable trenches is an important basis for studying the combustion characteristics of cables, which is closely related to the location of ignition points. The ceiling temperature will be highest directly above the cable ignition point, and cement ceilings change color at high temperatures. Observing the change of ceiling color after a fire can make a preliminary judgment on the location of fire’s ignition point.
In addition, the existing studies have not linked the early distribution of fire temperatures in cable trenches with the location of ignition points. In the early stages of a cable fire, the flame has a small range, the ignition point is more concentrated, and there is no large-scale spread. Exploring the relationship between the temperature distribution and the location of the ignition point in the early stage of a cable trench fire is of great research significance, as quickly and accurately finding the ignition point will allow countermeasures to be employed in time.
In this paper, a 1:1 cable trench fire experimental platform is designed to study the temperature distribution of cable combustion at different distances between the blocking partition and the ignition point. This experiment adopts the experimental method of symmetrical double ignition points, which can effectively reduce the influence of the right opening on the leftward temperature distribution, and thus ensuring the accuracy of the cable trench fire experimental platform. The nonlinear fitting method is used to determine the fitness of the relationship between cable trench ceiling temperature and distance from the ignition point.
2. Experimental Platform
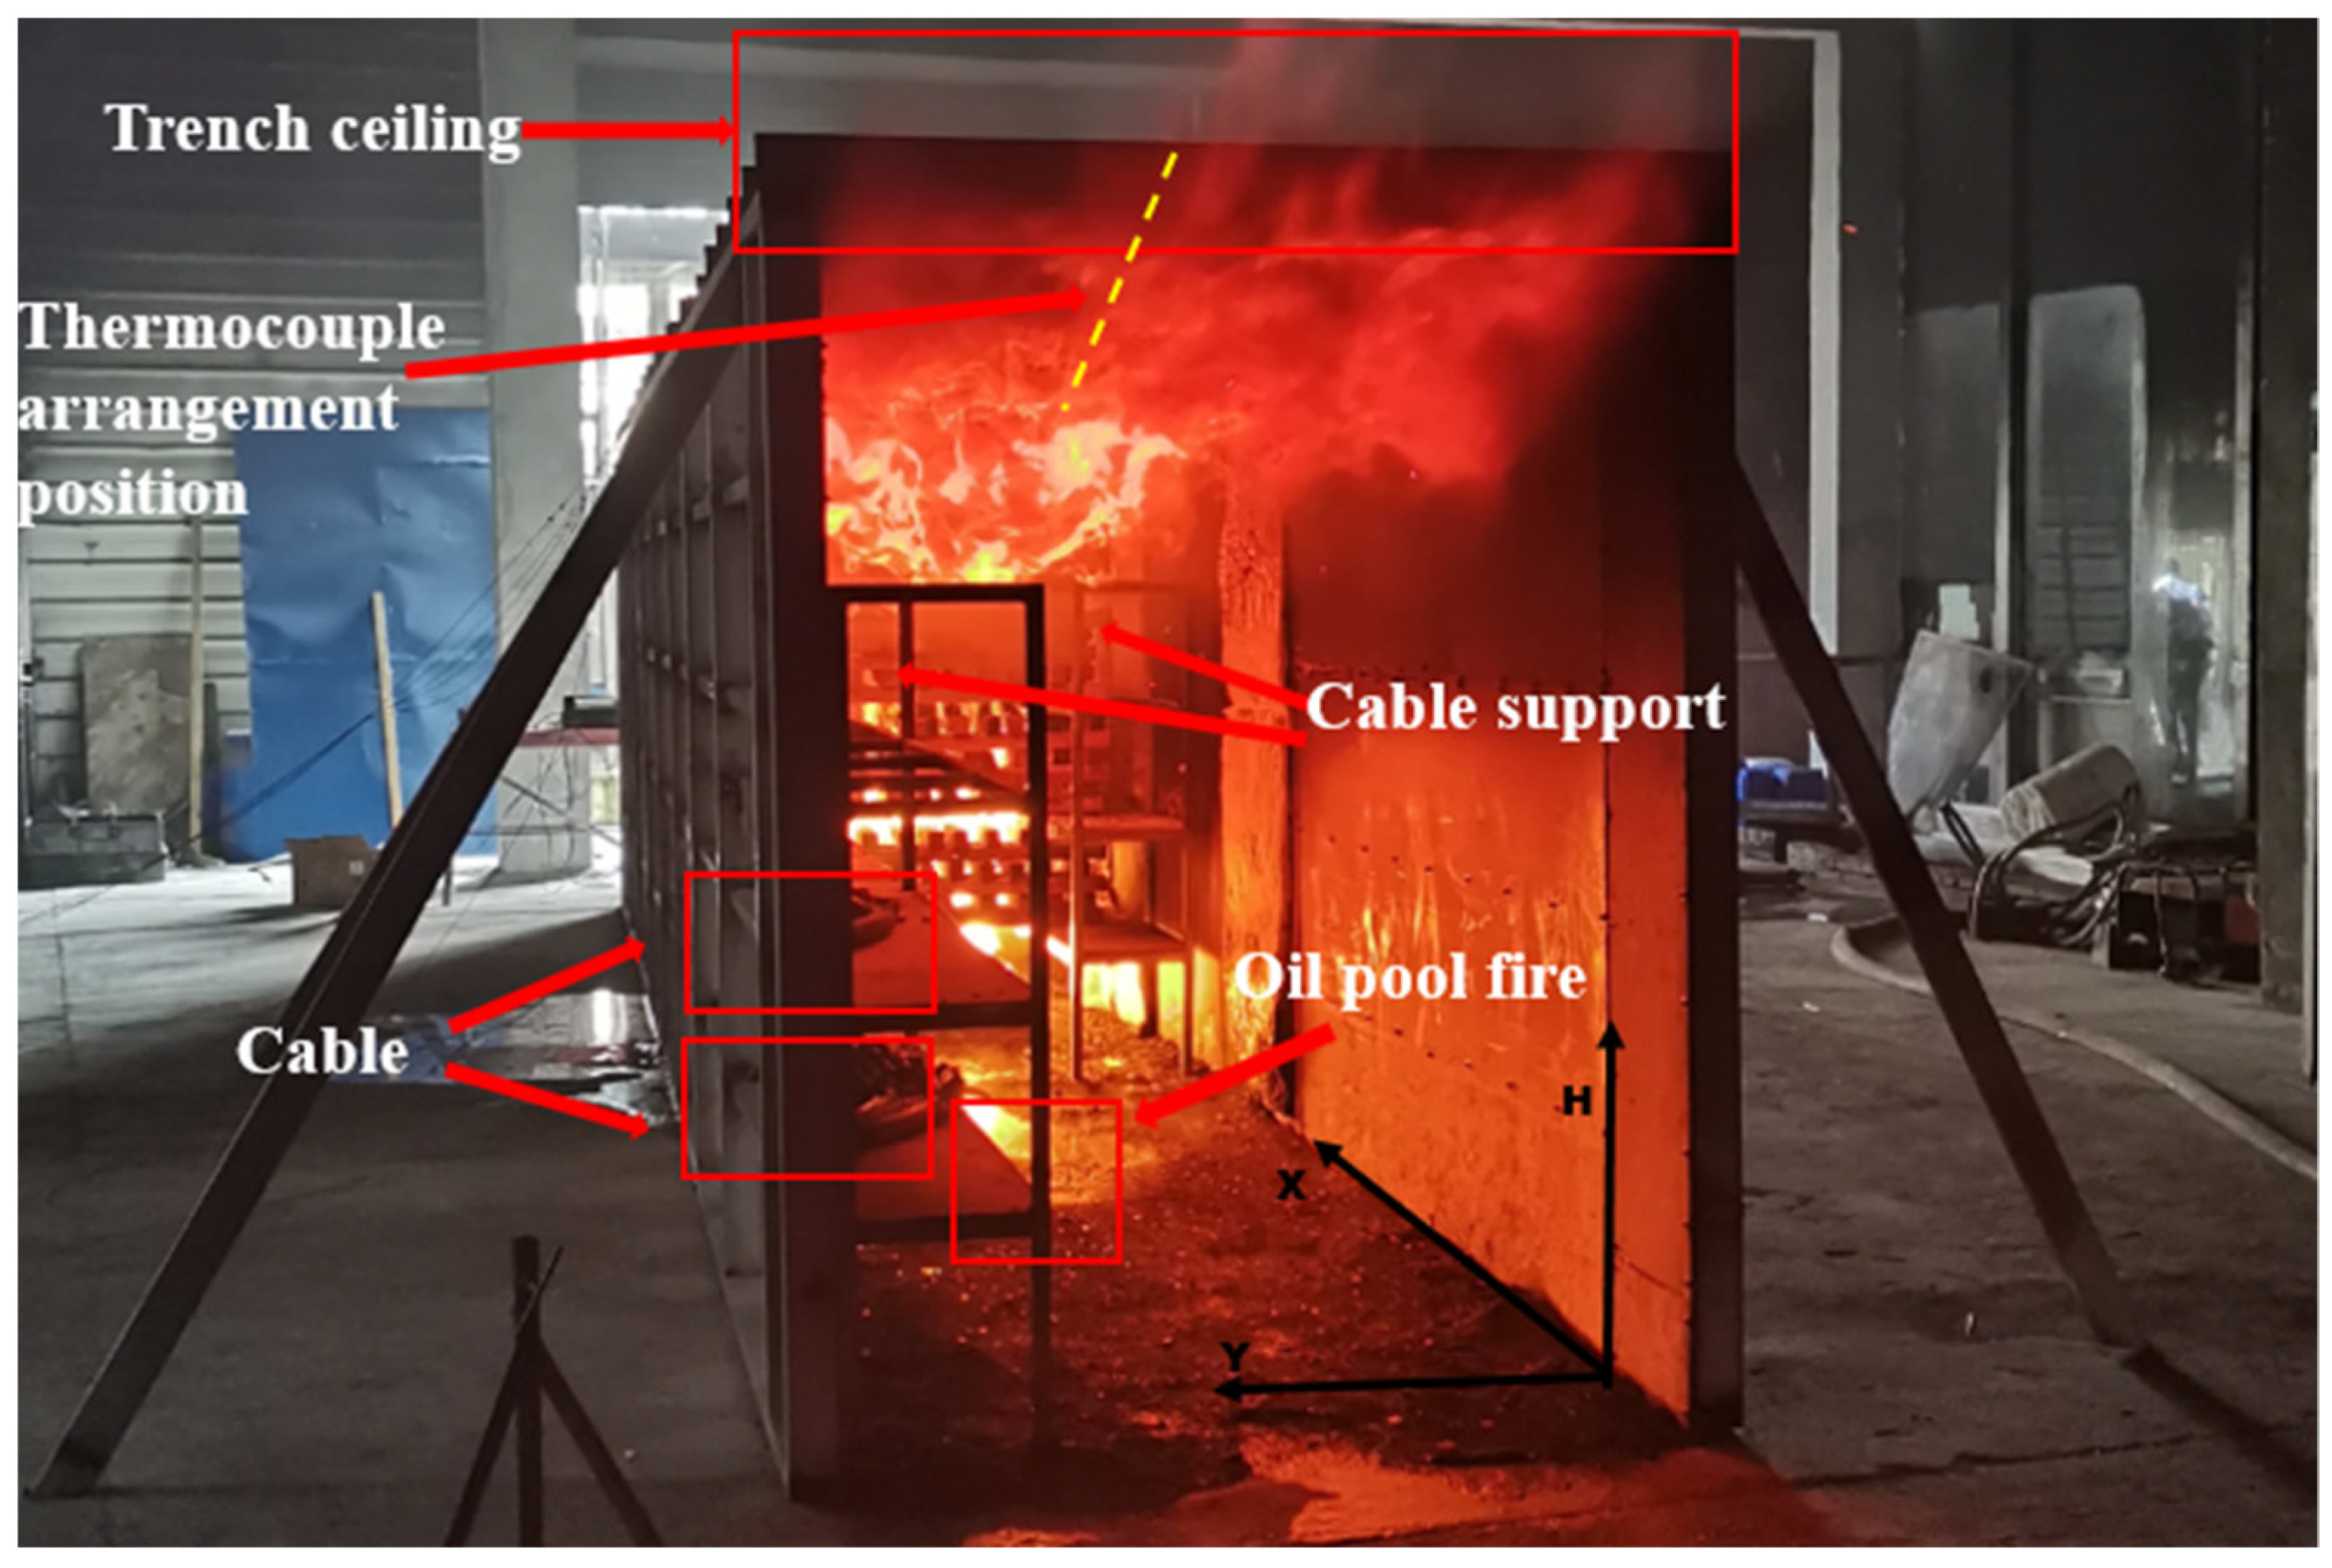
Figure 1 shows the 1:1 cable trench fire test platform, with length, width and height of 10 m, 1.4 m and 2 m, respectively. The test platform is supported by a steel frame and sealed by a fireproof diaphragm to simulate the environment of an underground cable trench. This experiment is carried out indoors, the ambient temperature is 20 °C, and the influence of ambient wind speed can be ignored.
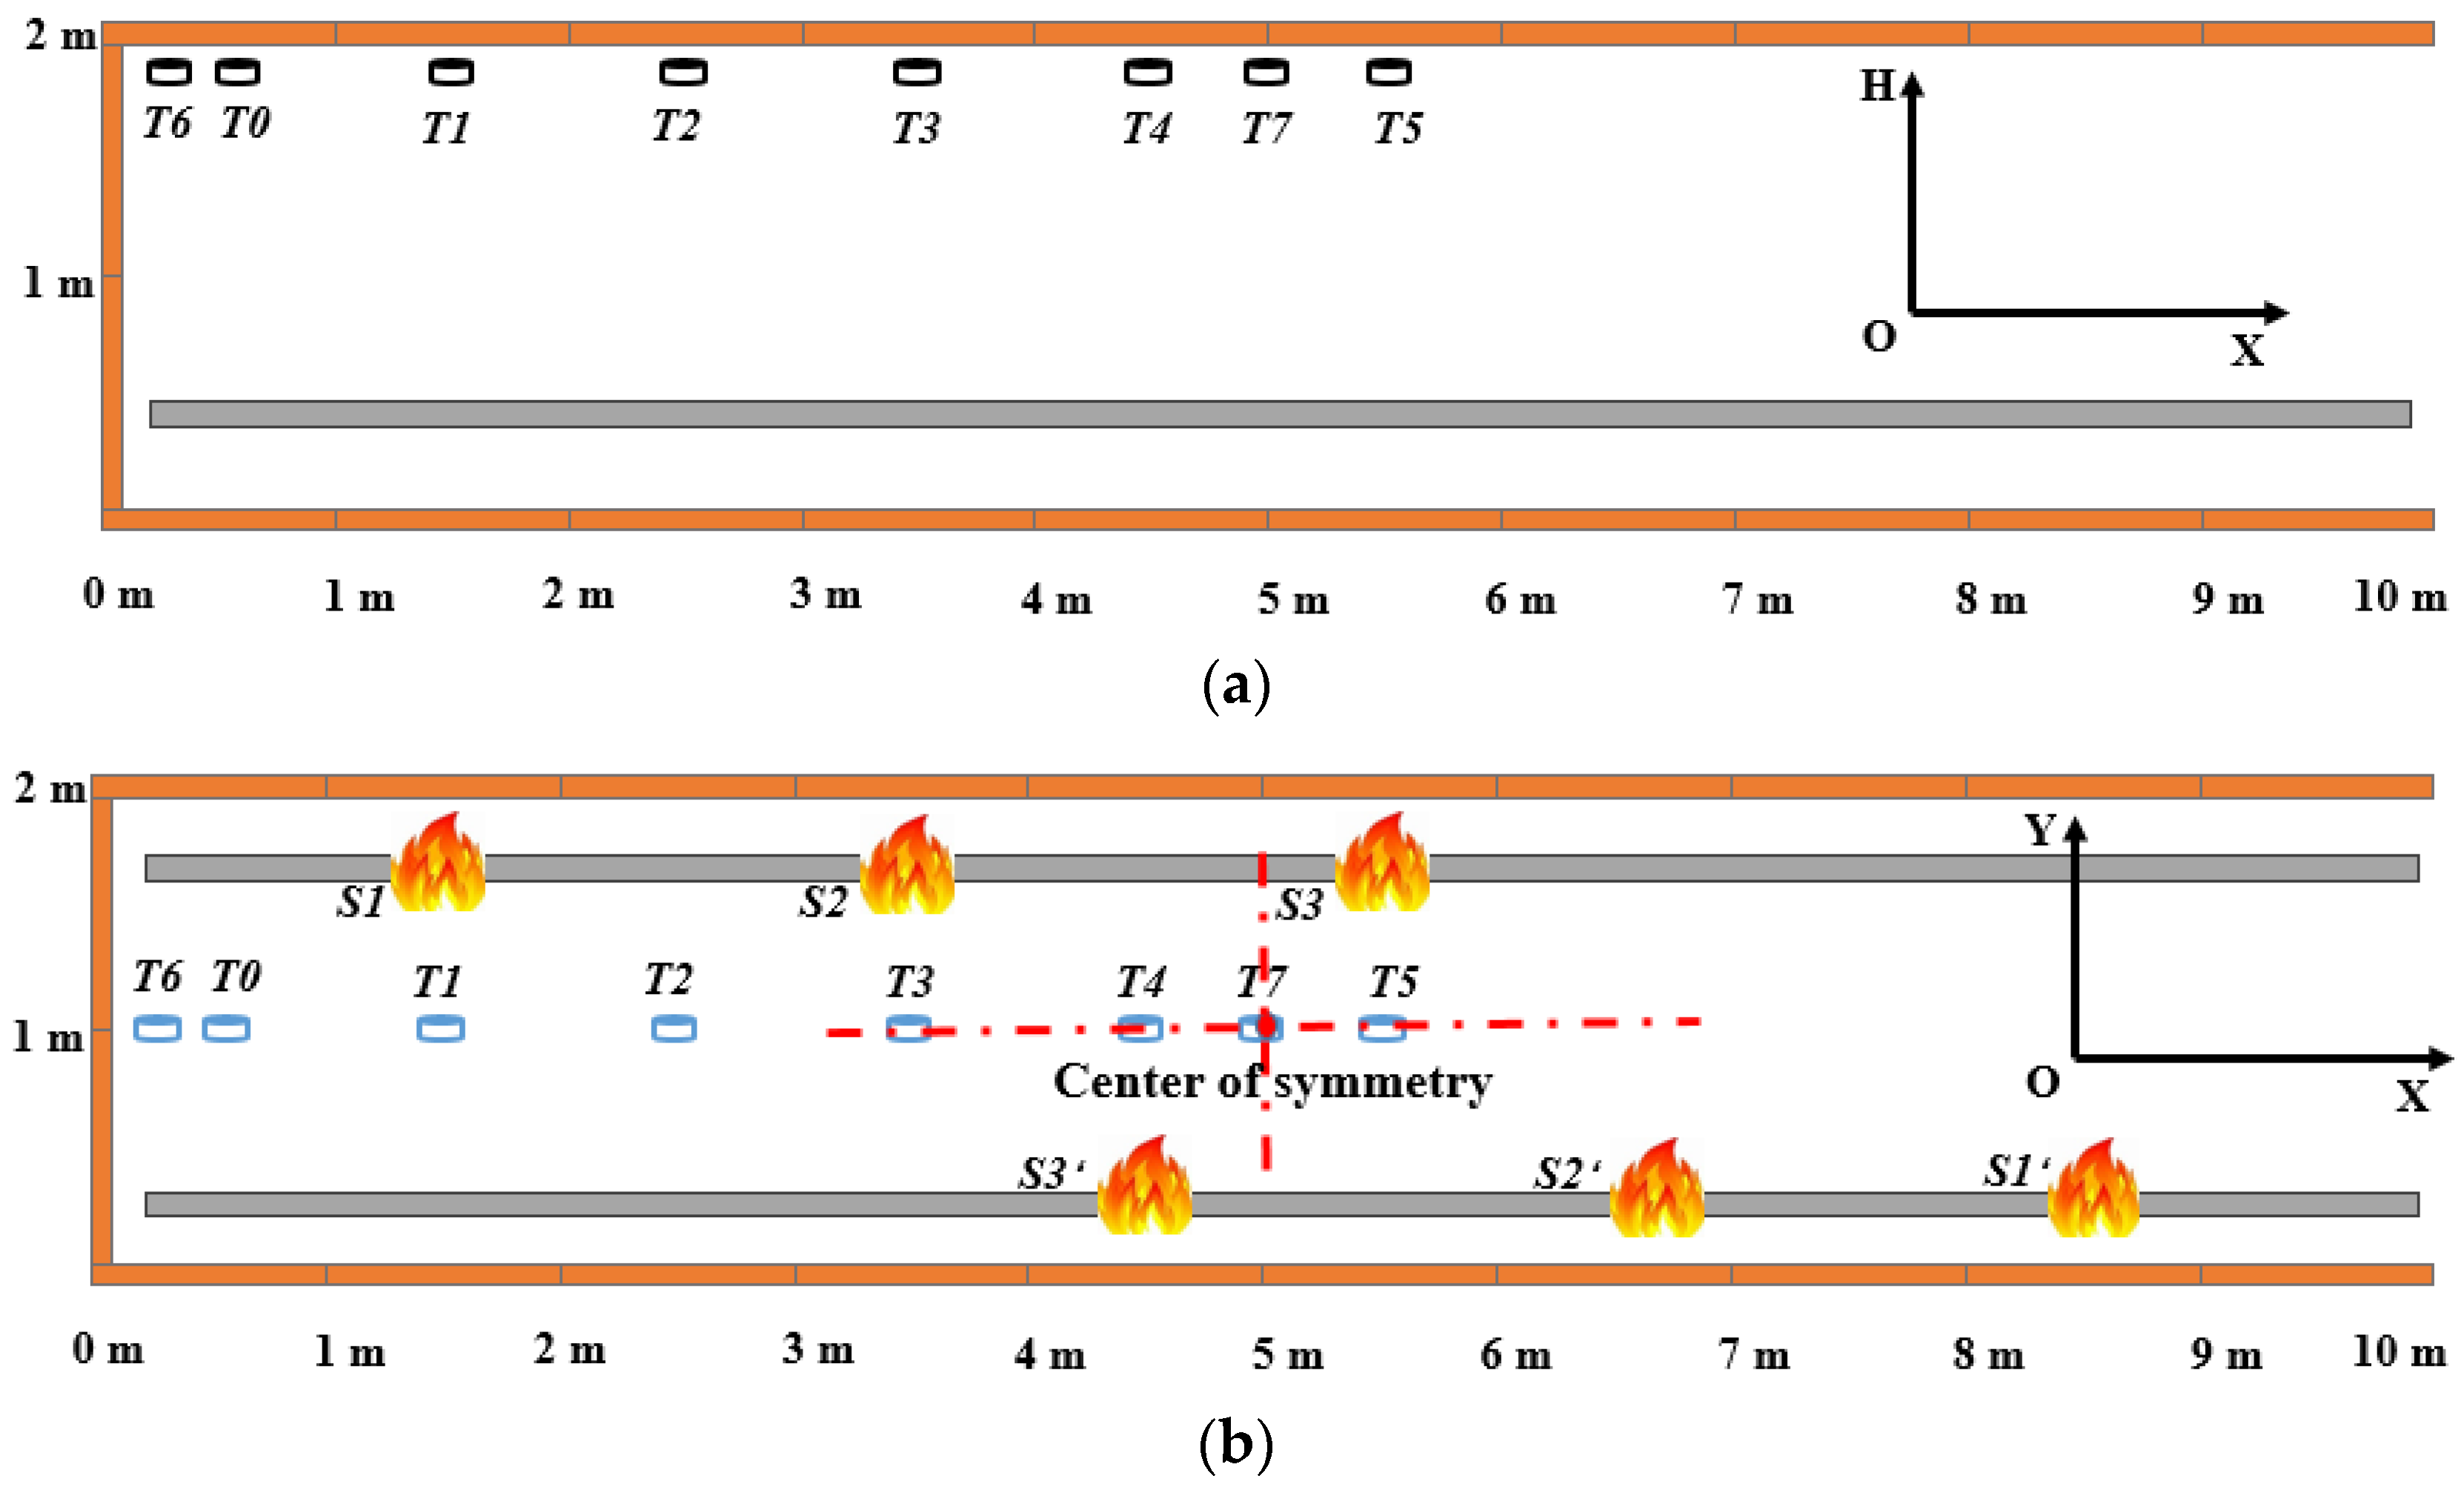
The experimental measurement system includes the temperature acquisition system in the cable trench, and the calculation and analysis platform. K-type thermocouple and Aglient34970a data collector are used for temperature measurement. The maximum temperature that can be accurately measured by the K-type thermocouple is 1000 °C. Using the Aglient34970a data collector and the self-contained acquisition software, real-time temperature acquisition and display can be realized using a computer graphical interface. The measurement frequency is 1 s each time. Eight K-type armored thermocouples of the same model (WRNK-191) are arranged 10 cm below the ceiling of the experimental platform, and are located on the center line of the cable trench, as shown by the yellow dotted line in
Figure 1. The thermocouples marked T0 (X = 0.5 m) to T5 (X = 5.5 m) are arranged at equal intervals along the positive direction (longitudinal direction) of the X-axis, and the distance between adjacent thermocouples is 1 m. The measurement results of thermocouples T6 (X = 0 m) and T7 (X = 5 m) are used to verify the accuracy of the method. The fitting curve is obtained using the maximum temperature measured by T0–T5, and then the accuracy of the fitting curve is verified by using the temperature data measured by T6 and T7. The experiment adopts the symmetrical simulation of double ignition points to reduce the influence of the opening on the right side of the experimental platform on the experimental results of the left half of the channel. In this experiment, an oil pool fire is used at the ignition point, the fuel is propane, the power is 1 MW, and the ignition point is 0.1 m above the ground and below the bottom cable, simulating the working condition of a fault leading to the combustion of the bottom cable. The cable model is ZR-YJLW03 1 × 630 and the cable is mainly composed of a copper conductor layer, an XLPE insulation layer, and a PVC sheath layer. The thickness of the sheath layer is 10 mm, the thickness of insulation layer is 10 mm, and the radius of copper conductor is 20 mm. The distribution of ignition point and thermocouple position corresponding to each experimental scheme are shown in
Figure 2.
The three groups of experiments take (5, 1) as the symmetrical center. The two oil pool fire basins for Experiment 1 are placed at the corresponding positions of S1 (1.5, 2) and S1’ (8.5, 0) in the top view of
Figure 2 respectively. The distance between the cable ignition point and the blocking diaphragm is 1.5 m. The experiment was repeated for three times, and the average value of the three measurement was taken as the result. Similarly, in Experiment 2 and 3, the oil pool fire basins are placed at S2 (3.5, 2) and S2’ (6.5, 0), and S3 (5.5, 2) and S3’ (4.5, 0) respectively, the temperature distribution was measured three times, and the average value was used for the results. The experimental conditions are shown in
Table 1.
3. Analysis of Experimental Results
3.1. Analysis of Variation Law of Ceiling Temperature
After the cable catches fire, the fire plume rises until it hits the ceiling of the cable trench, when it is blocked by and diffuses along the ceiling to both sides of the trench. During the movement, the hot flue gas constantly sucks in cooler air and exchanges heat with the wall, which has a lower temperature, and thus the temperature gradually decreases. Thus, the ceiling temperature decreases symmetrically on both sides of the center directly above the ignition point.
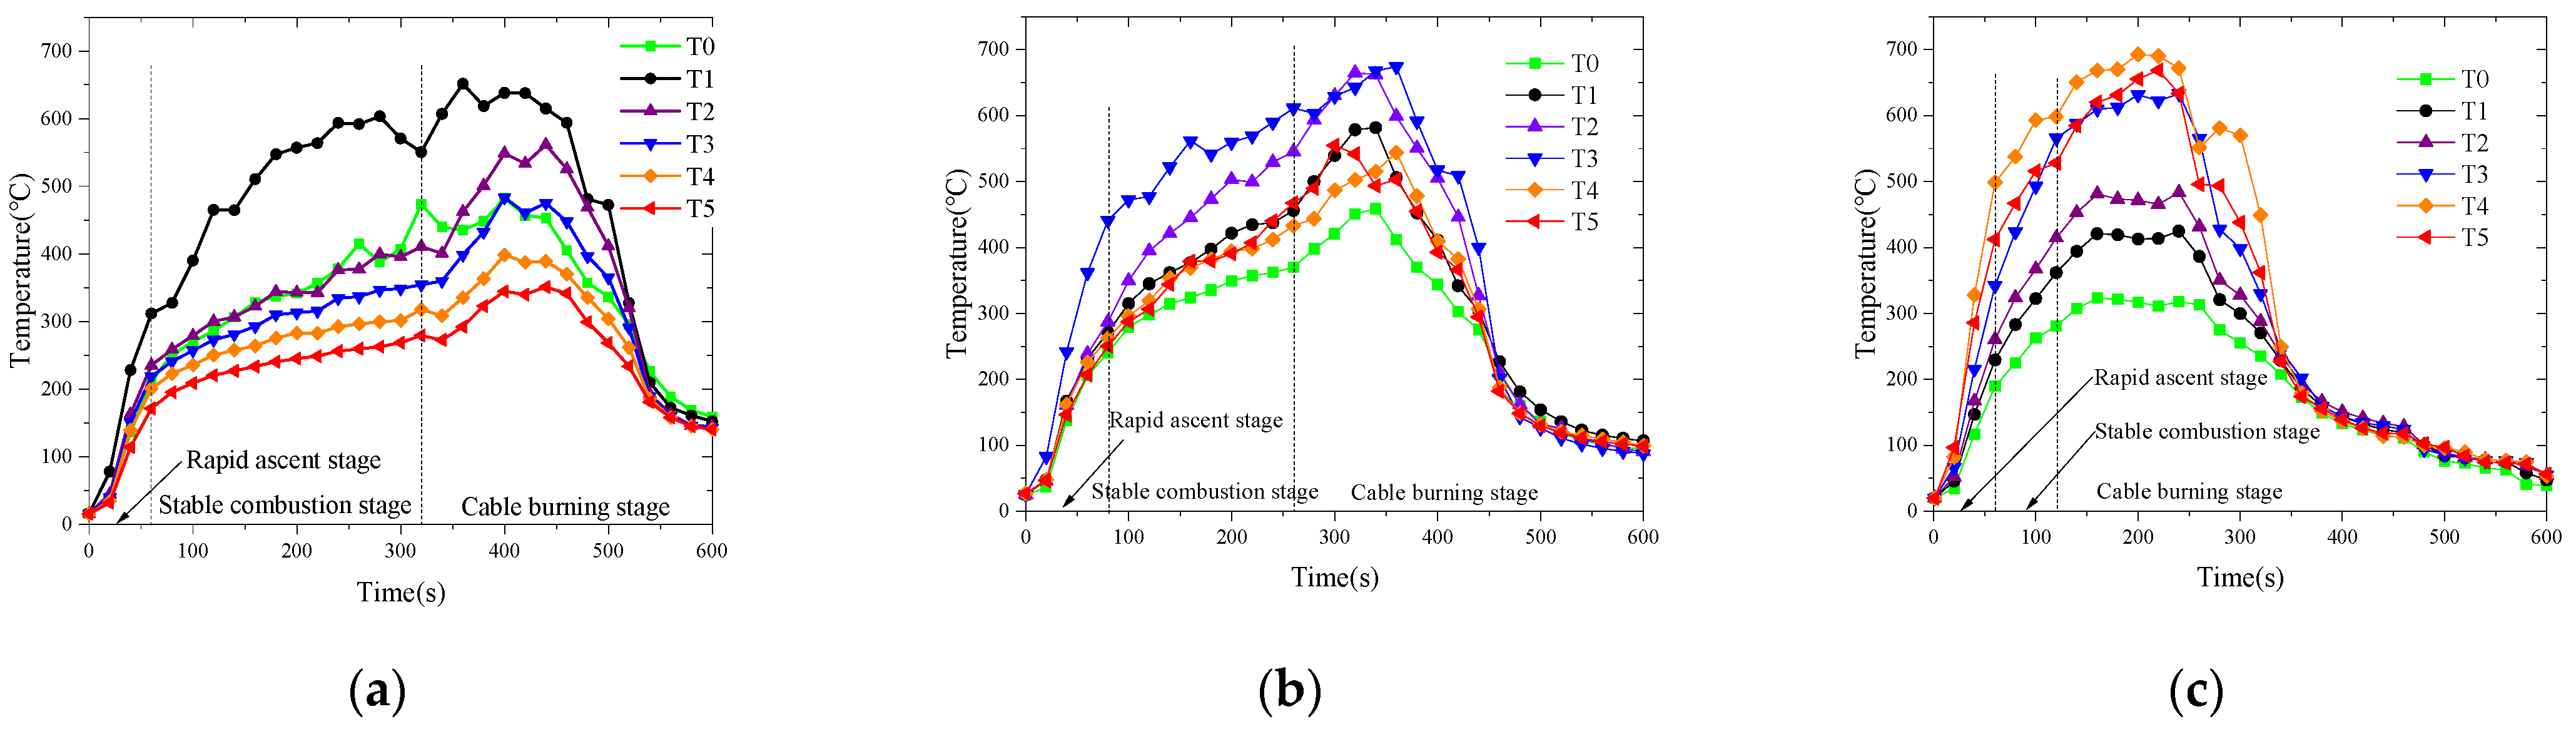
Figure 3 shows that in Experiment 1, the temperature measured by temperature sensor T1 directly above cable ignition point S1 is the highest, the temperature measured by temperature sensors T3 and T4 directly above the ignition points are the highest in Experiments 2 and 3, respectively, and the ceiling temperature gradually decreases from the location of the ignition point on both sides, which is consistent with the above hot flue gas diffusion law.
According to the experimental temperature change curve, the early temperature change of cable ignition can be divided into three stages: rapid ascent stage, cable combustion stage and stable combustion stage. After the oil pool fire is ignited, the heat release power rises rapidly in proportion to the square of time, and the temperature in the channel rises rapidly. In the stable combustion stage, the oil pool fire burns stably, the heat release power of the ignition point is greater than the heat diffusion rate, and the ambient temperature in the channel rises slowly. In the cable burning stage, after the cable near the oil basin is ignited, the heat generated by combustion is superimposed with the oil pool fire, and the temperature rise rate increases. The last ceiling temperature drop in the three groups of experiments in
Figure 3 is because the fuel has been exhausted. This paper focuses on the variation law of ceiling temperature in the early stage of fire development, so the influence of ceiling temperature drop range can be ignored.
The blocking partition is a non-combustible and water-resistant fireproof plate, which has the characteristics of fire resistance, water resistance and corrosion resistance, and thus can prevent the spread of fire. The experimental platform is blocked by a blocking partition on single side, firstly, to minimize the heat loss caused by the heat exchange between the fire experimental platform and the surrounding environment, and secondly, to observe the cable combustion and avoid the influence of ventilation on the experiment. In Experiment 1, the distance between the ignition point and the blocking partition is close, the space on one side of the flame is narrow, and the supply of oxygen is limited after consumption, which makes the fire and temperature develop slowly. At about 310 s, the heat released by combustion is the superposition of the heat released by the oil pool fire and cable combustion, and the rising rate of the temperature curve is accelerated. In Experiment 2, there was also a time period when the temperature rise rate accelerated, which occurred about 260 s after the propane was ignited, which was 50 s earlier than Experiment 1. From the temperature change curve for Experiment 3, the peak temperature occurs before 250 s, therefore, the cable combustion time is earlier than 250 s, and the cable ignition time is earlier than in Experiment 2. Therefore, with the increase of the distance between the blocking partition and the ignition point, the temperature rise rate after the fire in the cable trench increases, which promotes the upward development of the fire.
3.2. Analysis of Maximum Ceiling Temperature
In the cable trench fire experiment, in addition to the attenuation of the temperature in a longitudinal direction, the temperature in the trench also shows the stratification phenomenon of being higher up and lower down along the H-axis (vertical direction). Based on the maximum temperature rise formula for the channel ceiling proposed in reference, the relationship between the maximum temperature rise of the channel ceiling, the heat release rate of the ignition point, the distance between the ignition point and the channel ceiling is given as follows:
where,
is the maximum temperature rise of the ceiling (°C);
Q is the heat release power of ignition point (W);
H is the height from the ignition point to the ceiling (m); α is the proportional coefficient, and the empirical value is 17.5 [
21].
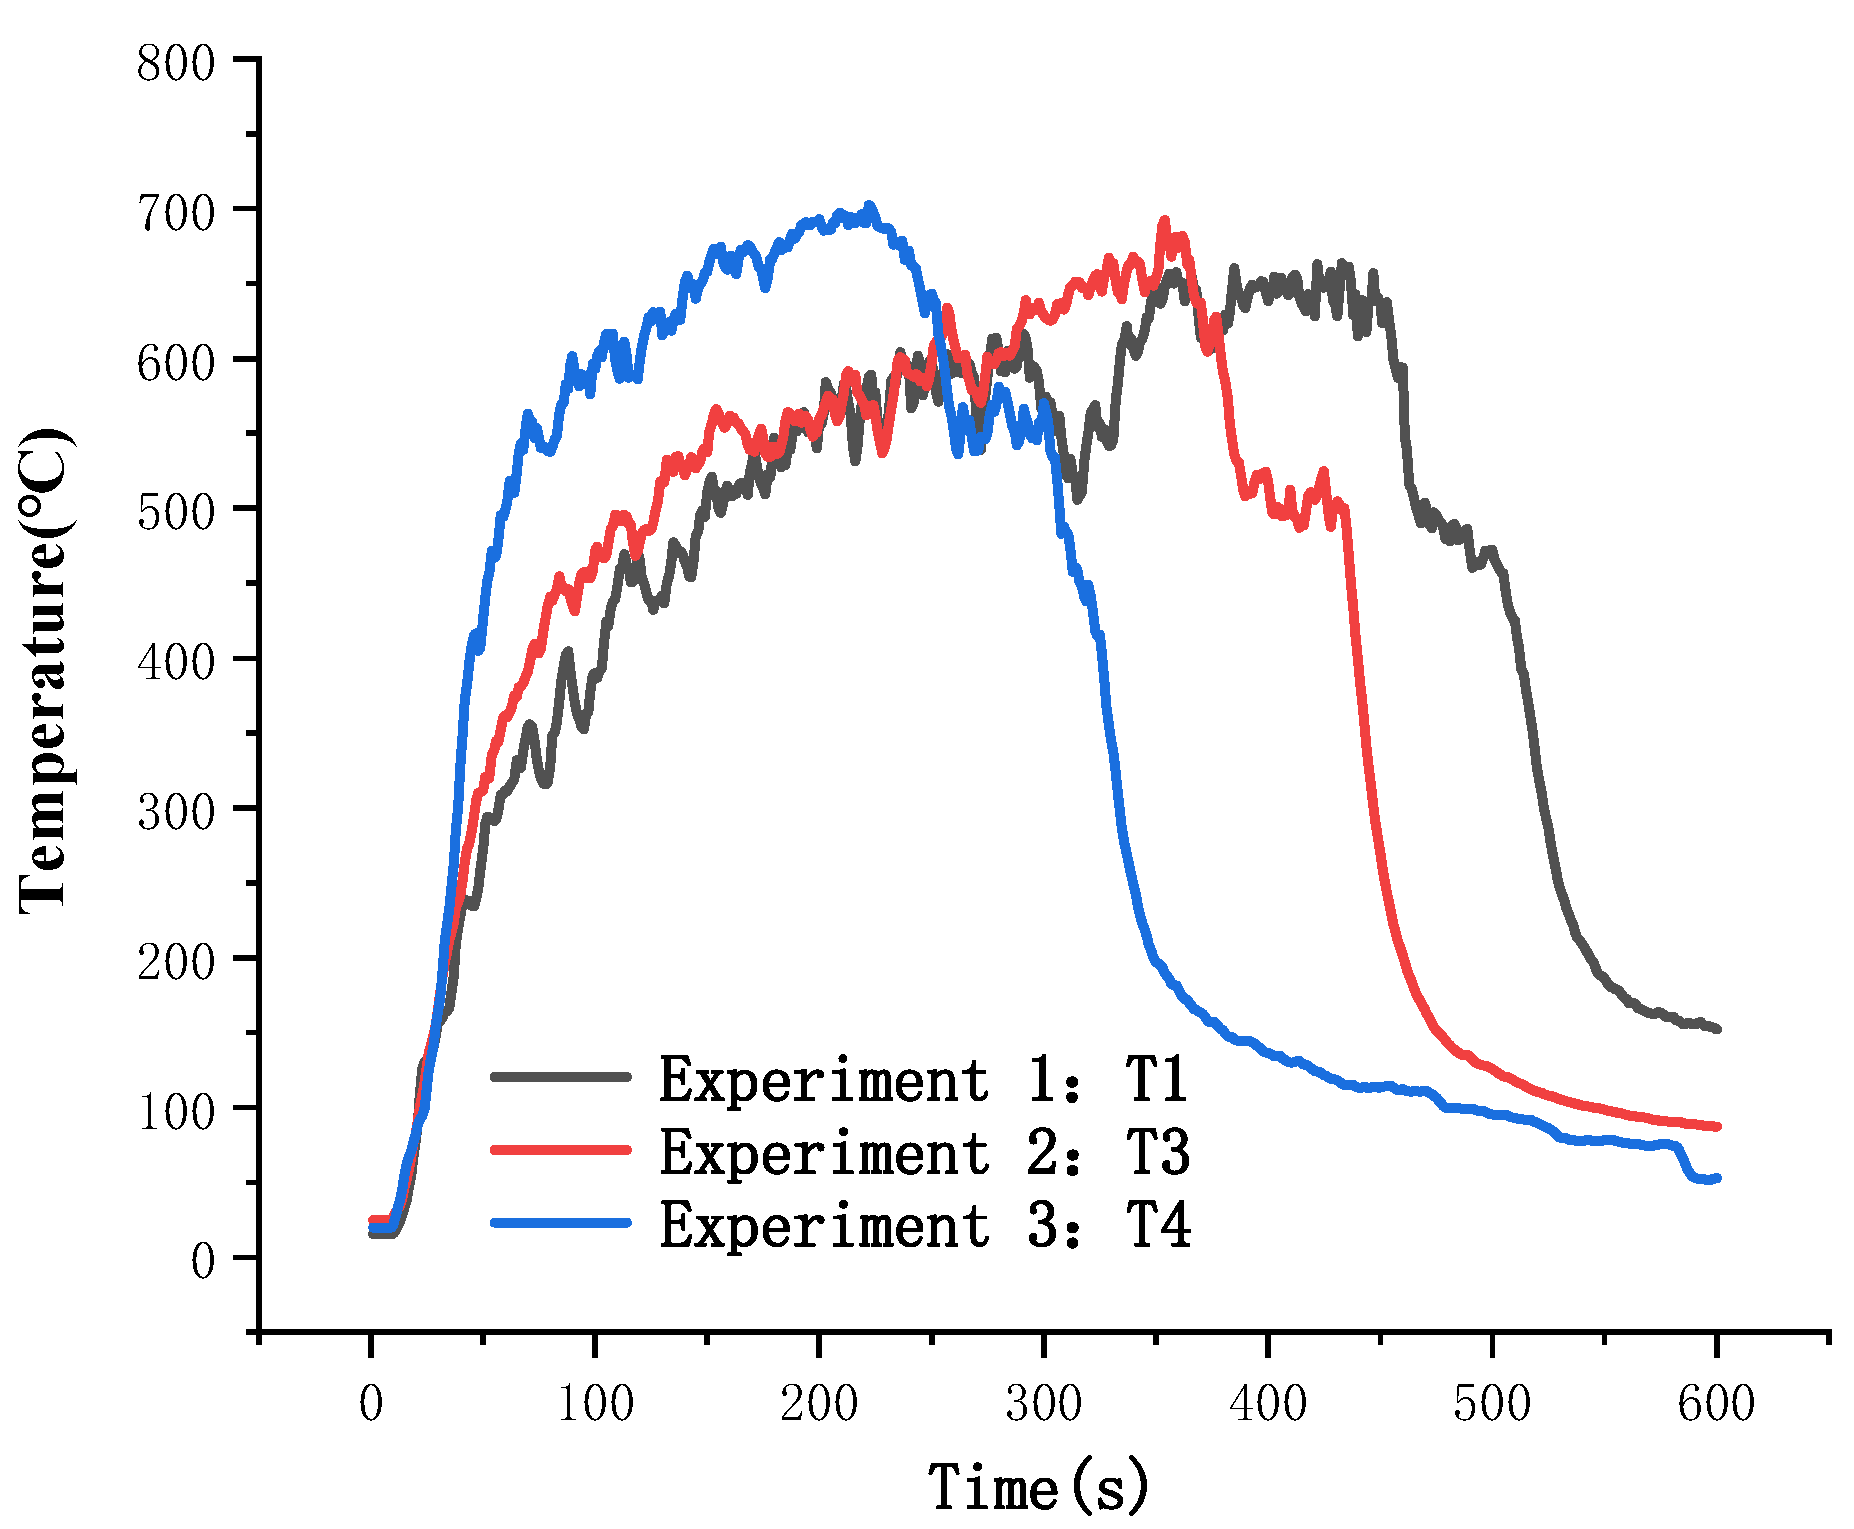
The variation curve of the maximum ceiling temperature is shown in
Figure 4. The ceiling temperature directly above the ignition point reached a maximum value of 659 °C in 429 s in Experiment 1, 688 °C in 361 s in Experiment 2, and 701 °C in 222 s in Experiment 3. In all of the experiments, the propane cylinder is connected to the pressure reducing system, and the gas flow through the pressure reducing valve is connected to the glass rotameter. The flow of propane gas is adjusted through the glass rotameter to control
Q = 1000 KW. In addition,
H is taken as 1.8 m. The calculation results of including these experimental parameters into Formula (1) are shown in
Table 2.
From Experiments 1, 2 and 3, the α average value is 17.69, which is close to the conclusion of the temperature rise prediction model. It can be seen that this experiment adopts the experimental method of symmetrical double ignition points, which can effectively reduce the influence of the right opening on the left temperature distribution and ensure the accuracy of the cable trench fire experimental platform.
3.3. Fitting Function of Ceiling Temperature Change
The longitudinal attenuation law of temperature is an important basis to explore the fire temperature distribution and channel structure damage. The hot smoke generated by the ignition point strikes the ceiling and diffuses to both sides, and the attenuation law dictates that the temperature decreases equally from the ignition point to both sides. The longitudinal temperature rise ratio under the ceiling of a cable trench
to distance ratio
decays exponentially as follows:
where,
is the maximum temperature rise in the cable trench (°C);
is the maximum temperature rise at the longitudinal coordinate
y (°C);
r is the longitudinal distance between the temperature measuring point and the ignition point at the longitudinal coordinate
y (m);
is the vertical height between the ignition point and the temperature measuring point (m);
p and
q are formula coefficients, which are related to the shape and size of cable trench and the heat release power of ignition point.
Experiment 1 was repeated 3 times, and these repetitions are Experiments A, B and C. The fitting curves for A, B and C are calculated in
Table 3, and their fitting coefficients (R
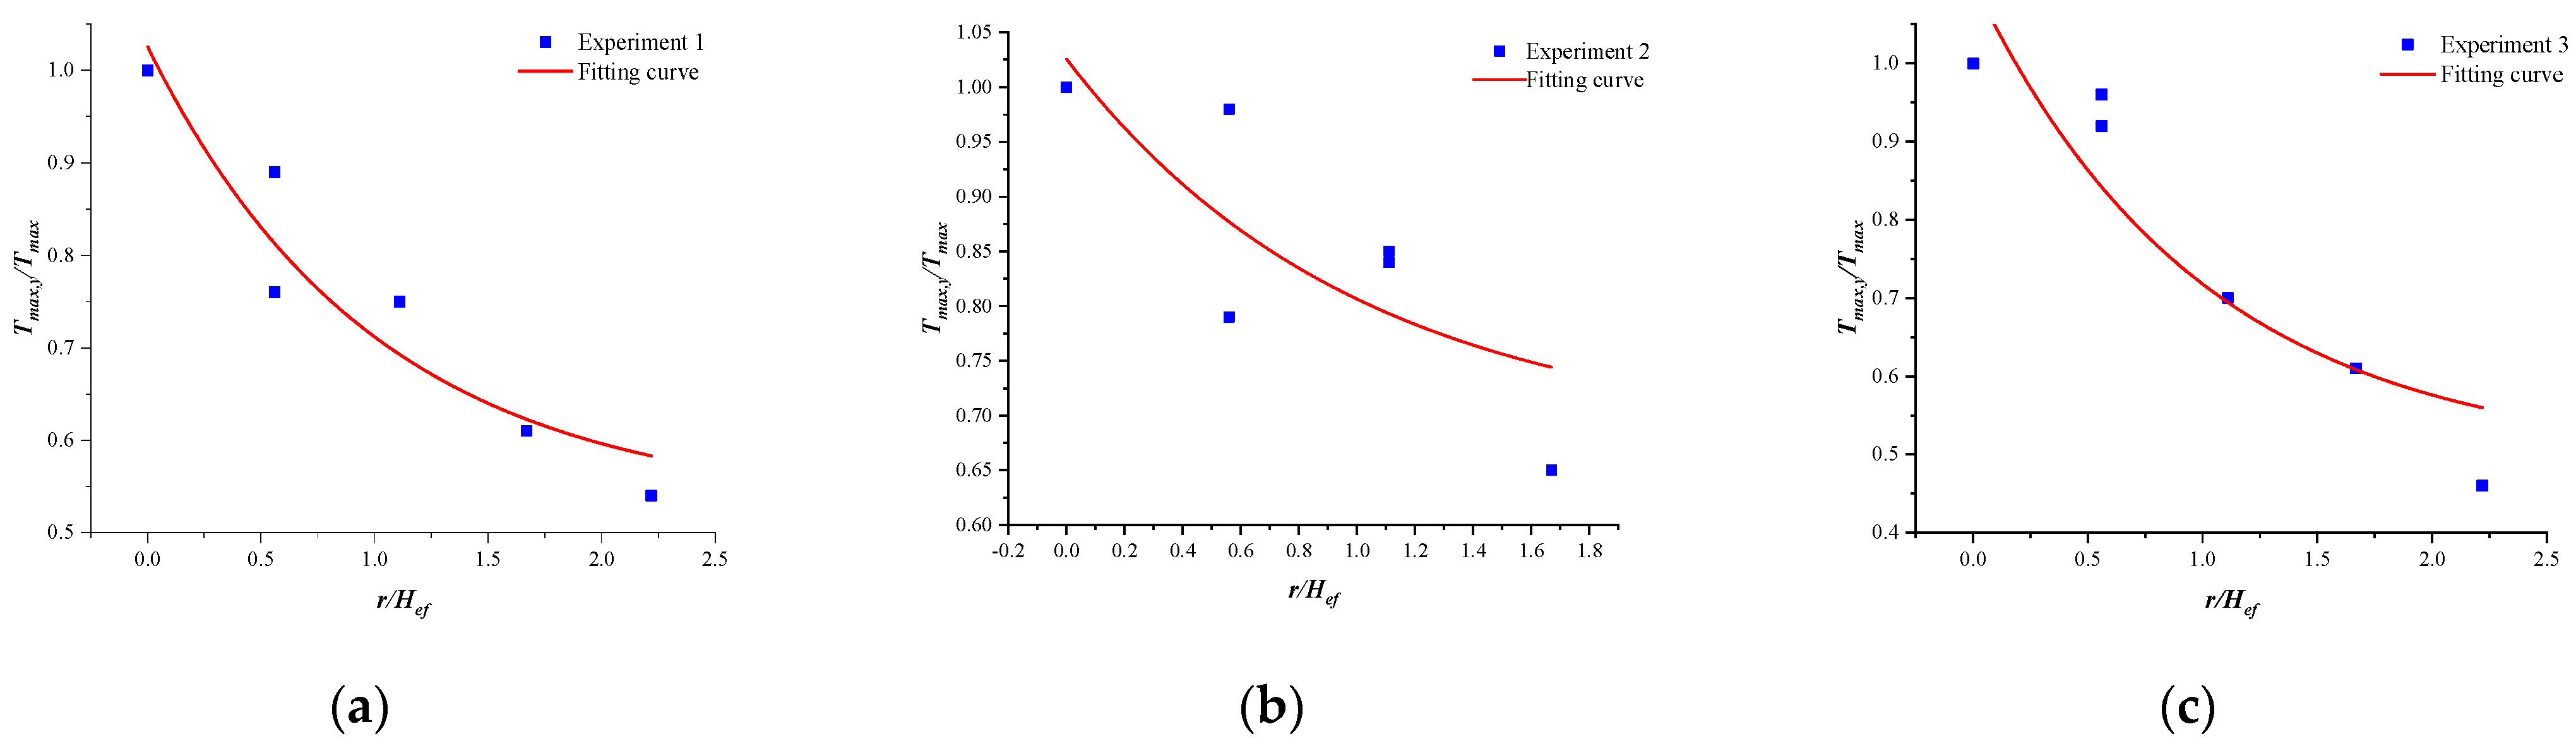
2) are 0.9, 0.88 and 0.85, respectively. Therefore, Experiment A has the best fit, and is used as the fitting curve for Experiment 1. Experiment 2 was also repeated 3 times (Experiments D, E and F), and their fitting coefficients are 0.54, 0.58 and 0.6, respectively. Thus Experiment F has the best fit, and is used as the fitting curve for Experiment 2. Experiment 3 was repeated 3 times (Experiments G, H and I), and their fitting coefficients are 0.82, 0.81 and 0.83, respectively. Experiment F has the best fit for Experiment 3, and is used as the fitting curve.
The experimental results consider optimal fitting function, and the results are shown in
Figure 5 and
Table 4.
According to the results shown in
Figure 5 and
Table 4, the R
2 of Experiments 1 and Experiment 3 are 0.90 and 0.83, respectively, which strongly reflect the result of the variation of ceiling temperature with longitudinal distance. The reason why the R
2 for Experiment 2 is only 0.60 is mainly that the distance ratio (
) of data points measured in Experiment 2 produces only four value points in the range of (0, 1.76), and thus the value range is small. Compared with the distance ratio of 0, 0.59, 1.18, 1.76 and 2.35 in Experiment 1 and Experiment 3, the fitting degree of the curve for Experiment 2 is significantly reduced. The influence of the value range calculated by the distance ratio
on the degree of fitness needs to be further studied and discussed, and verified in future fire experiments.
3.4. Identification of Ignition Point of Cable Trench
Ignoring the temperature distribution difference of each height layer of the cable trench, and the fitting of longitudinal distance with the maximum temperature rise of the trench ceiling temperature, a two-dimensional graph can be plotted using trench fire temperature distribution with the longitudinal distance from the ignition point as the abscissa and the vertical height from the ignition point as the ordinate. Therefore, a method for identifying the location of the ignition point based on the temperature distribution in the cable trench is proposed. Firstly, the ceiling temperature distribution in the early stage of cable ignition is measured, and this data is added to the attenuation formula to calculate the values of coefficients
p and Q (Formula (2)). Secondly, based on the analysis of the longitudinal distribution of ceiling temperature, it can be seen that:
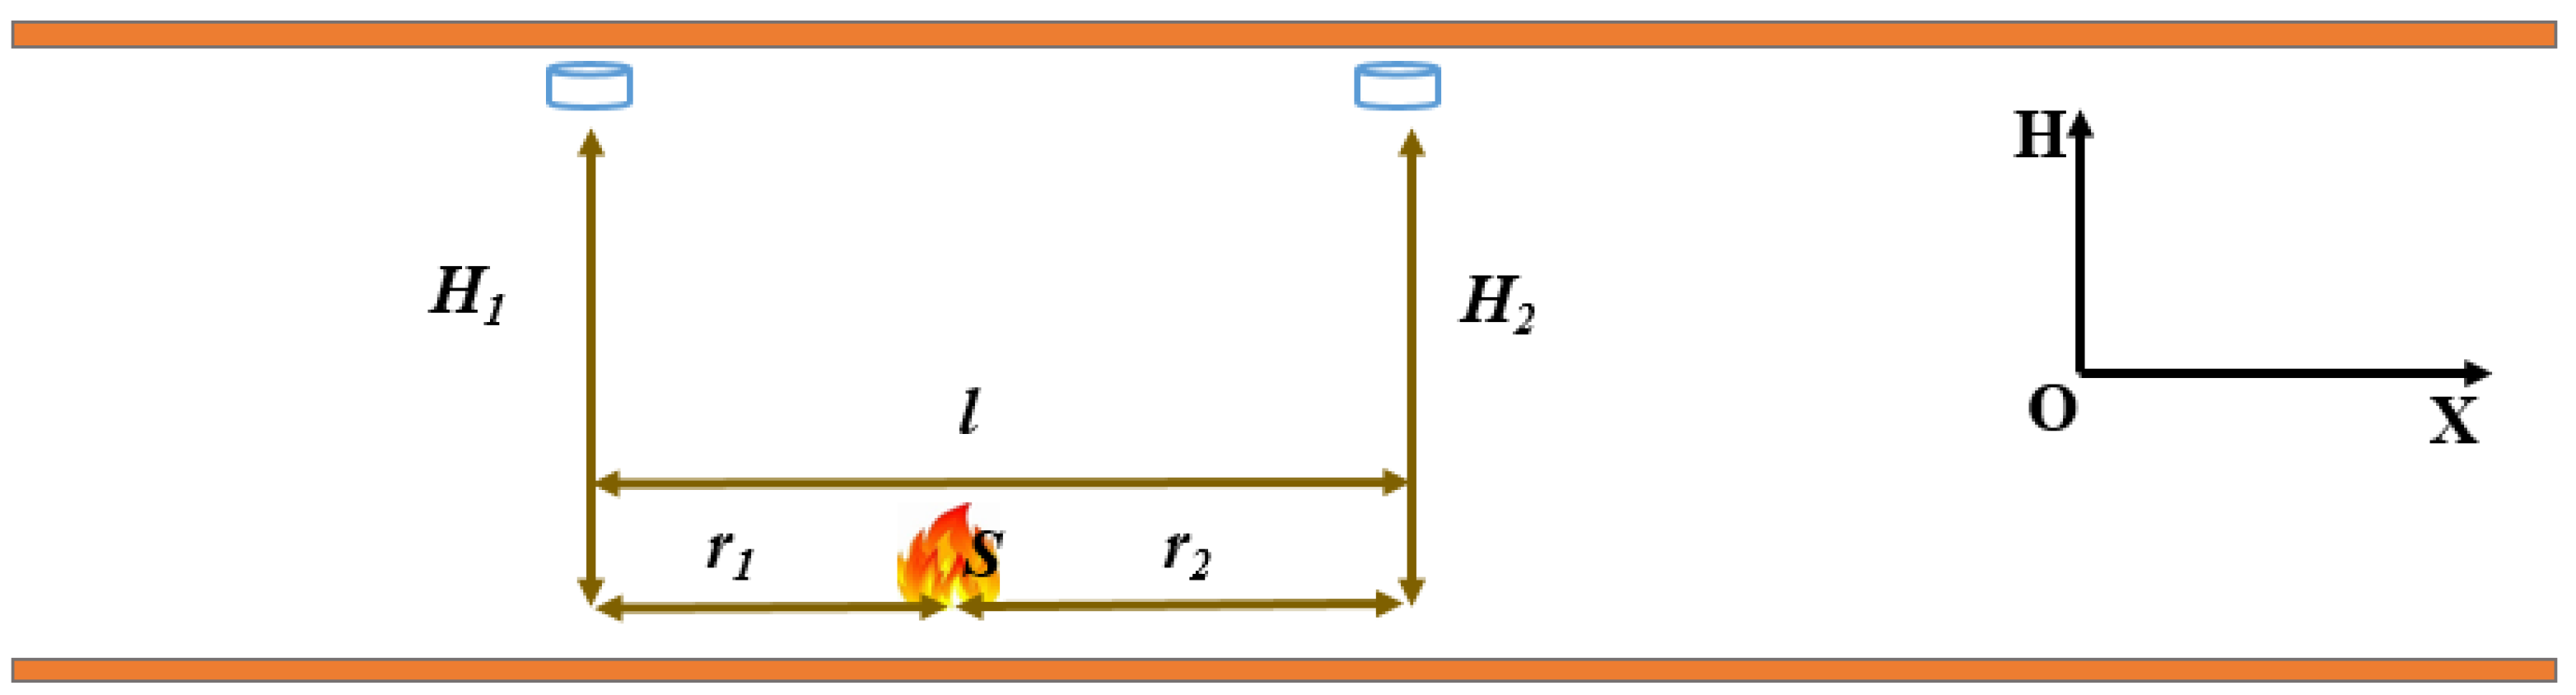
In the early stage of a fire in the cable trench, two temperature measurements points in the fault range can be selected and substituted into the ceiling temperature attenuation formula obtained from the experiment to identify the location of the ignition point, as shown in
Figure 6.
Assuming that the longitudinal distance between the two points and the ignition point is
and
, respectively, the distance between the two temperature measuring points is
l, the maximum temperature rise measured by the temperature measuring point is
and
, respectively, and the vertical height between the temperature measuring point and the ignition point is
and
, respectively, and
=
, then the maximum temperature rise
and
corresponding to the temperature measuring point at the same height layer are equal. These parameters can be converted into equation group (4):
The maximum values of and and channel ceiling temperature and can be calculated, and the specific location of the ignition point along the longitudinal direction of the cable channel can be determined by and .
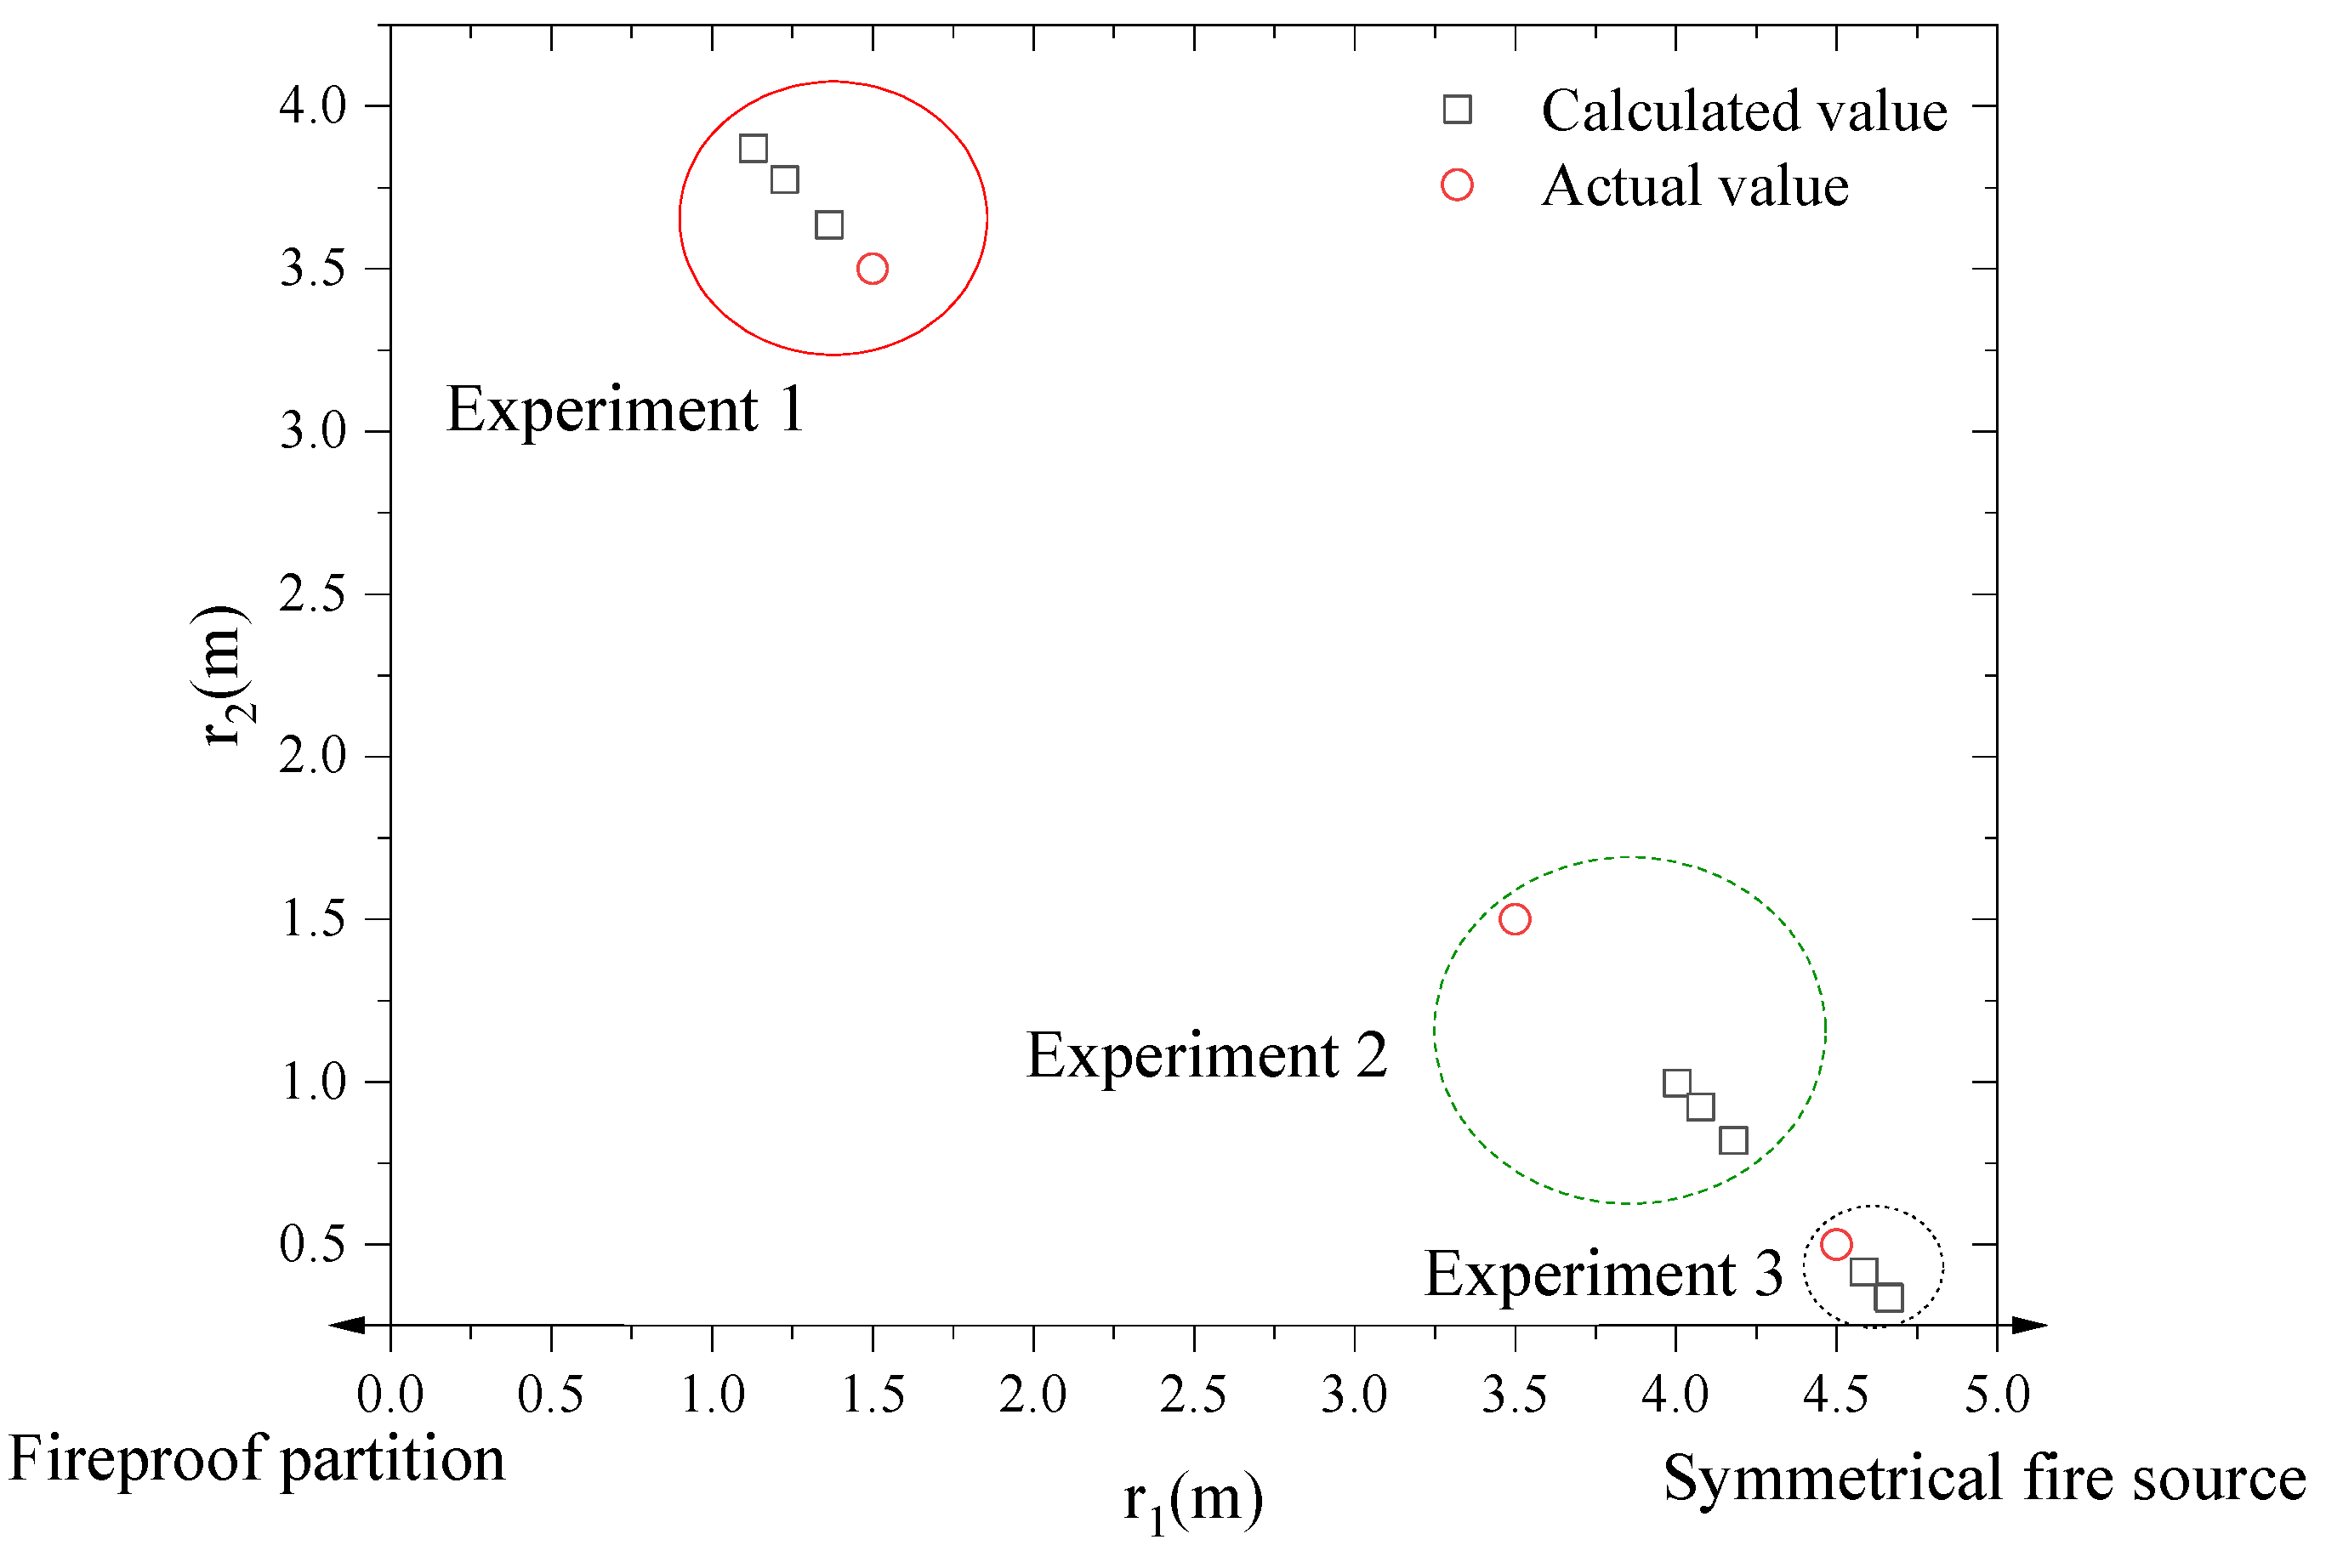
The data obtained from temperature measuring points T6 and T7 and the identification results of early ignition point of fire are shown in
Table 5. It can be seen that the maximum errors between the calculation results of Experiment 1 and Experiment 3 and the actual position of the ignition point are 0.413 m and 0.169 m respectively, and the average calculation accuracy is 92.4% and 97.0% respectively, while the accuracy of Experiment 2 is only 83.9%, which is closely related to the low fitting degree of the longitudinal distribution fitting function of the maximum ceiling temperature rise.
In addition,
Figure 7 shows that the deviation direction of the calculated ignition points from the actual ignition point is the same within each group of experiments. Experiment 1 is biased to the side of the fireproof blocking partition, while Experiments 2 and 3 are biased to the side of the symmetrical ignition point. There are two main reasons. Firstly, the blocking partition blocks the further diffusion of the ceiling jet, and the high-temperature air flow accumulates close to the blocking partition, resulting in the high temperature of T6 measurement. Secondly, the symmetrical ignition point overlaps with the actual ignition point temperature field, which makes the measured temperature of T7 higher. In Experiment 1, the ignition point S1 is close to the blocking partition, and the temperature rise effect of the blocking partition plays a main role, while the ignition points in Experiments 2 and 3 are closer to the corresponding symmetrical ignition points, so that the temperature rise effect of the symmetrical ignition point plays a main role.
4. Conclusions
In this paper, a two-point temperature measurement using ceiling temperature distribution is proposed to identify the ignition point of high voltage cable trench fires in substations. The differences of temperature distribution in a high voltage cable trench are compared and analyzed when different ignition points were used. Based on the fitness of the relationship between the maximum ceiling temperature rise and the longitudinal direction along the cable trench, the accuracy of the proposed cable trench ignition point identification method is verified. This experiment adopted the experimental method of symmetrical double ignition points, and the conclusions are as follows:
- (1)
Proportion coefficient of the formula for calculating the maximum temperature rise of the ceiling α average value is 17.69, which verifies the accuracy of the temperature data measured by the experimental platform.
- (2)
Longitudinally, the ceiling temperature decreases on both sides from the ignition point of a high voltage cable trench fire. A ceiling temperature change curve shows that the temperature change in the early stage of cable ignition can be divided into three stages: rapid rise stage, stable combustion stage and cable combustion stage.
- (3)
The accuracy of the ignition point identification method is related to the fitting degree of the fitting function of the maximum change of ceiling temperature rise. The experiments performed for this paper had a range of 5 m, and within this range, the average identification accuracy of Experiment 1 and Experiment 3 were 92.4% and 97.0% respectively, thus accurately identifying the position of the ignition point in the cable trench. However, in Experiment 2, due to the low fitting degree of the fitting function, the accuracy of ignition point location identification was only 83.9%.
The relevant research results of this paper can provide reference for the laying of power cables in high voltage cable trenches, the construction methods of fire prevention measures, and the fire supervision and early warning of closed cable trench fires, improve the safe operation of high voltage cables in the cable trench, improve the fire prevention capacity, and provide scientific guidance for the safe, stable and reliable operation of high voltage cable trenches.


