Article

Numerical Simulation and Experimental Analysis of Thermal Cycles and Phase Transformation Behavior of Laser-Welded Advanced Multiphase Steel

1
Materials Research Laboratory, Faculty of Mechanical Engineering, Silesian University of Technology, Konarskiego 18a, 44-100 Gliwice, Poland
2
Department of Welding Engineering, Faculty of Mechanical Engineering, Silesian University of Technology, Konarskiego 18a, 44-100 Gliwice, Poland
3
Łukasiewicz Research Network-Institute of Welding, 16-18 Błogosławionego Czesława, 44-100 Gliwice, Poland
4
Department of Engineering Materials and Biomaterials, Faculty of Mechanical Engineering, Silesian University of Technology, Konarskiego 18a, 44-100 Gliwice, Poland
*
Author to whom correspondence should be addressed.
Symmetry 2022, 14(3), 477; https://doi.org/10.3390/sym14030477
Submission received: 4 February 2022 / Revised: 15 February 2022 / Accepted: 22 February 2022 / Published: 26 February 2022
(This article belongs to the Special Issue Advances in Metallic Material and Symmetry/Asymmetry)

Abstract

:
This work presents the results of the comparison between simulations and experiments of the laser welding of advanced multiphase steel. The numerical simulations of welding with different parameters were carried out using the Sysweld software. The geometry of the weld and structural constituents as well as stress distributions were analyzed. The simulated thermal cycles were incorporated in the JMatPro software to determine the phase transformation kinetics during cooling. The experimental tests were performed to compare the simulations with the real results. According to them, the shape of the weld and its width were symmetrical according to the weld axis. The simulated values were higher compared to the real one at heat inputs higher than 0.048 kJ/mm. The microstructure investigations conducted with scanning electron microscopy showed a good agreement in the fusion zone. Some differences in the microstructure of heat-affected zone and transition zone were identified. According to the phase transformation simulations, the weld should be composed of only martensite. The real microstructure was composed of martensite and some fraction of bainite in the heat affected zone. The more complex microstructure consisting of ferrite, bainite and retained austenite was present in the transition zone. The results of measured and simulated hardness indicated the good agreement with the difference of 17 HV0.1.

1. Introduction

The material needs for the automotive industry are growing continuously more challenging. The reasons for this are high safety requirements and rising environmental problems due to car pollution [1,2,3,4]. For this purpose, advanced high-strength steels (AHSS) were developed. So far, three generations of the steels have been developed [2,3]. The main difference between the three generations is a manganese content. The I generation contains ~1.5% Mn, the II generation AHSS includes steels with Mn contents from 20 to 30%, whereas the Mn concentration is decreased to a level of 3–12% for the newest III generation AHSS [3,4,5]. However, the I generation of multiphase steels is mainly used in the automotive industry because of the lowest costs and developed manufacturing processes. One of the most promising steel grades are the so-called TRIP-assisted (Transformation Induced Plasticity) steels. These sheet steels are characterized by multiphase microstructures containing ferrite, bainite, and retained austenite [6,7]. The most important phase is the retained austenite (RA), which undergoes strain-induced martensite transformation (SIMT) during forming operations [6,7,8]. This effect increases the plasticity of the steel sheets allowing for forming more complex shapes of car body elements [9,10]. Yet, the most used technique for elements joining is resistance spot welding or laser welding (LW). The LW process is characterized by dynamic heating and cooling cycles, which unfortunately lead to the destruction of the microstructure [11,12,13,14]. However, the LW of the TRIP steels is a hot research topic, as the steel has high potential for automotive applications. As reported by Rahul et al. [15], depending on the laser incident angle, it is possible to increase the strength of the weld. Han et al. [16] investigated the influence of the welding gas used on the porosities in the weld. According to them, many porosities were observed during welding with low speed and Ar atmosphere. They reported that, when the welding power is reduced or the Ar+He gas mixture is used, the porosity level can be limited. Xia et al. [17] analyzed the difference in the microstructure of two different TRIP steels after LW. One steel was alloyed with Al and the other one with Si. According to the results, the Al-alloyed steel is characterized by lower hardness compared to the steel containing Si. The reason for this was the higher amount of softer phases in the fusion and heat affected zones. However, the Si-alloyed steel was prone to some decrease in the strength–ductility balance in the fusion zone. Therefore, it is important to analyze the influence of welding parameters on the weld symmetry and microstructure evolution during the process. Simulation methods of the welding process are necessary [13,14]. Moreover, this is especially important because new steel grades (for example, TRIP steels) are not included in the databases of simulation software or they are included only partially. The numerical approach is increasingly used for the fast, initial analyses of the welding processes. The numerical analyses of welding processes have recently become a very popular tool supporting the design of the manufacturing technology of welded structures. They present their advantages mainly wherever we want to obtain a result in a very limited time, and at the same time making prototypes is difficult or even impossible due to the costs and time of their implementation [18]. In literature, there are many examples of the use of numerical analyses to simulate welding processes with the use of a laser beam as an efficient and precise welding heat source [19,20]. Kuppuswamy et al. [21] described how laser welding is increasingly used in the automotive industry for the assembly of sheet metal structures due to its efficiency and reliability. The significance of the combination of various materials and their joining processes in this type of applications was also indicated, which in turn poses a serious challenge to understand the behavior of welded joints during crash tests. Rong et al. [22] described the application of finite element analysis regarding the negative impact of the welding process on the assembly accuracy and service performance. It is still a problem to understand the fact that the full use of the possibilities offered by numerical analyses of welding processes requires a very precise description of the material properties and the course of the welding process itself [23,24,25]. A properly calibrated and validated model is able to provide many important information not only about the final result after the end of the welding process, but also during its duration [26,27].
The novelty of the work is to use modern computational tools for predicting the weld geometry and effects of the welding process on the microstructure–hardness relationship. This allows for much more detailed tracking of the effects of the welding process of modern TRIP steels. This information will make it possible to understand the mechanisms taking place during the LW process as well as to fill a gap in difficulties to directly measure parameters, which describe the welding process during its duration. Therefore, the work aims at comparing the Sysweld and JMatPro simulations with experimental results of laser-welded laboratory-manufactured TRIP-assisted multiphase sheet steel.

2. Materials and Methods

The numerical simulation of laser welding and phase transformation kinetics calculations were performed using the Sysweld (release 2020.5) and JMatPro (version 12) softwares [28], respectively. The welding simulations were carried out for different welding parameters, such as a beam power and a welding speed (Table 1). These parameters were selected on the basis of the previous work [29] to reflect a wide range of technological conditions.
The investigation of the change of pool symmetry, thermal cycles, and stresses introduced into a weld during welding were simulated using the Sysweld. The phase transformation kinetics using the JMatPro in a fusion zone (FZ), a heat-affected zone (HAZ), and an intercritical region (transition zone–TZ) was analyzed for 0.24C-1.5Mn-0.9Si-0.4Al-0.034Nb-0.023Ti laboratory-produced TRIP-aided steel on the basis of thermal profiles from the welding simulations. The steel was cast after vacuum melting. The ingot was forged and then thermomechanically rolled. The final material in the shape of 2 mm thick and 100 mm width sheet was used. These numerical simulations were next reflected in experimental schedules performed by laser welding of 2 mm thick steel sheet. The LW was carried out using the TruDisc 12,002 and solid state laser type Yb:YAG. Figure 1 presents the initial models used in the simulation of laser welding. The simulations were carried out for the 2 mm thick steel sheet. The prepared calculation 3D model consists of a 58,380 3D solid element with 64,529 nodes. A mesh was concentrated symmetrically in the weld area to increase the calculation accuracy. The boundary conditions related to heat dissipation to the environment were defined on all external surfaces of the model as convective heat dissipation and radiation to the environment at 20 °C. The boundary conditions related to the clamping of the welded elements were set in such a way that the model behaves like a sample lying on the welding table without any additional fixing. All calculations were performed as the “transient” calculations method; it means that analyses were continuous with the moving heat source model along the trajectory as a real welding process. As a heat source model in all laser welding cases, a volumetric 3D conical model was used [18].
This type of source is used for the correct design of welding simulations using a laser or electron beam characterized by high power density [23]. Total energy described by this model can be expressed with the following equations:
q ( x , y , z ) = q 0 e x p ( x 2 + y 2 r 0 2 ( z ) )
r 0 2 ( z ) = r e + r i r e z i z e ( z z e )
where q0—total heat flux density, re, ri—3D cone radius dimensions parameters, ze, zi—3D cone length parameters, x,y,z—model coordinates.
The JMatPro was used to determine the phase transformation kinetics during continuous and isothermal cooling conditions. The CCT and TTT curves of the steel and changes of phase chemical composition dependent on a cooling rate were calculated. The initial microstructure of the sheet steel was composed of ferrite, bainite, and some fraction of retained austenite. The weld samples were subjected to standard metallographic procedures with final etching in 2% Nital. Detailed identification of the macro- and microstructures in the different weld zones were done using the light microscopy (LM) using the Zeiss AxioObserver and scanning electron microscopy using a Zeiss Supra 25 scanning electron microscope (SEM) working in secondary electrons (SE) mode. Hardness measurements were conducted using the Vickers method to determine its changes across the weld section. The hardness was conducted using the load of 1 N and dwell time of 15 s.

3. Results and Discussion

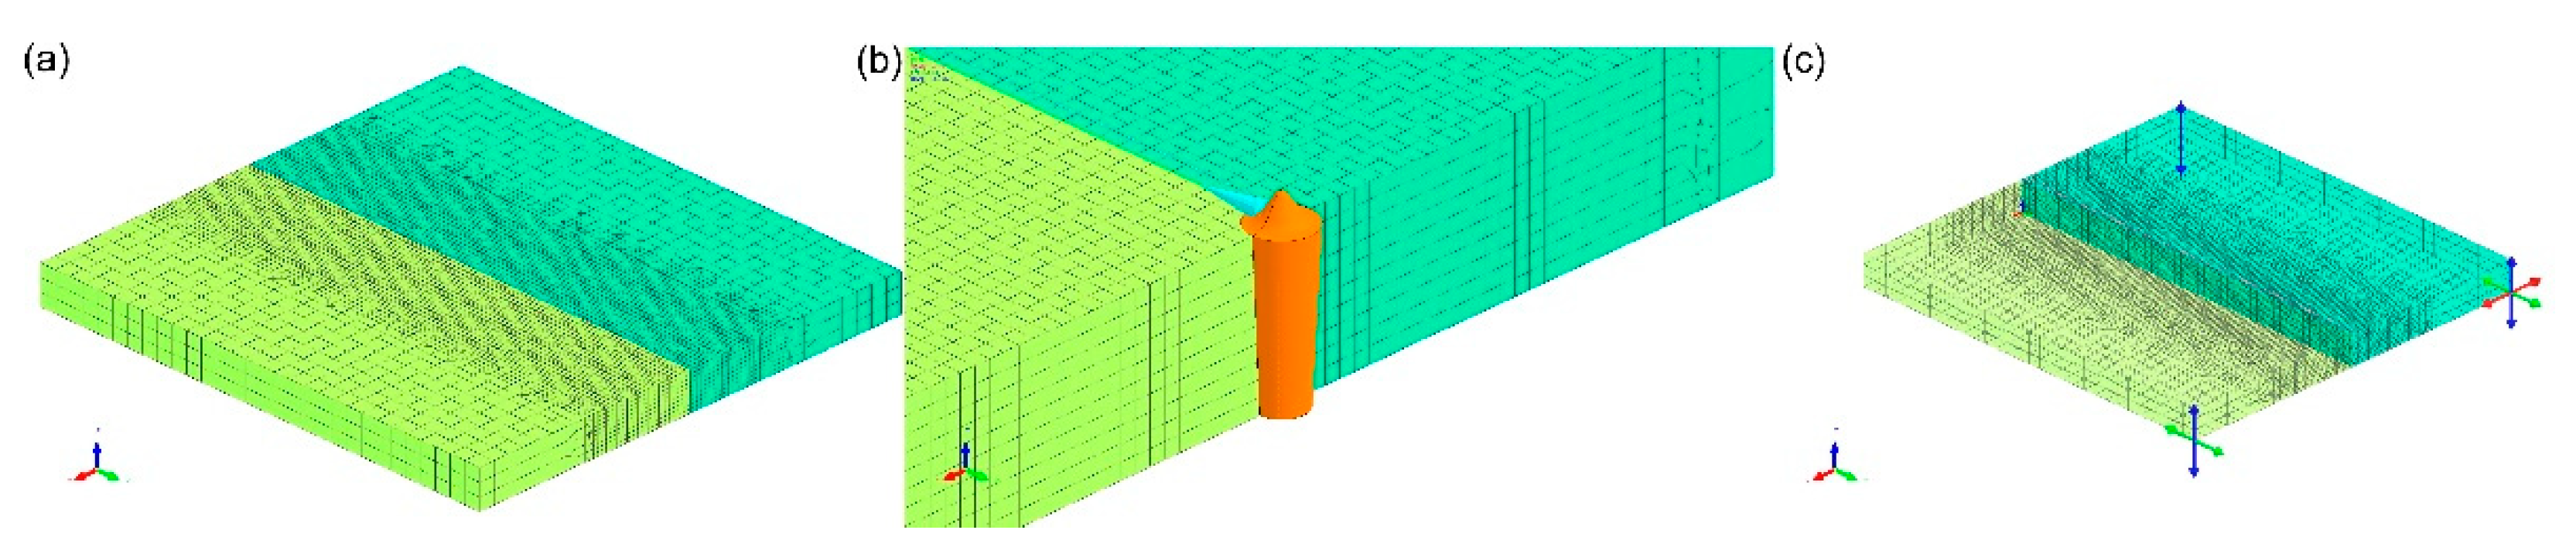
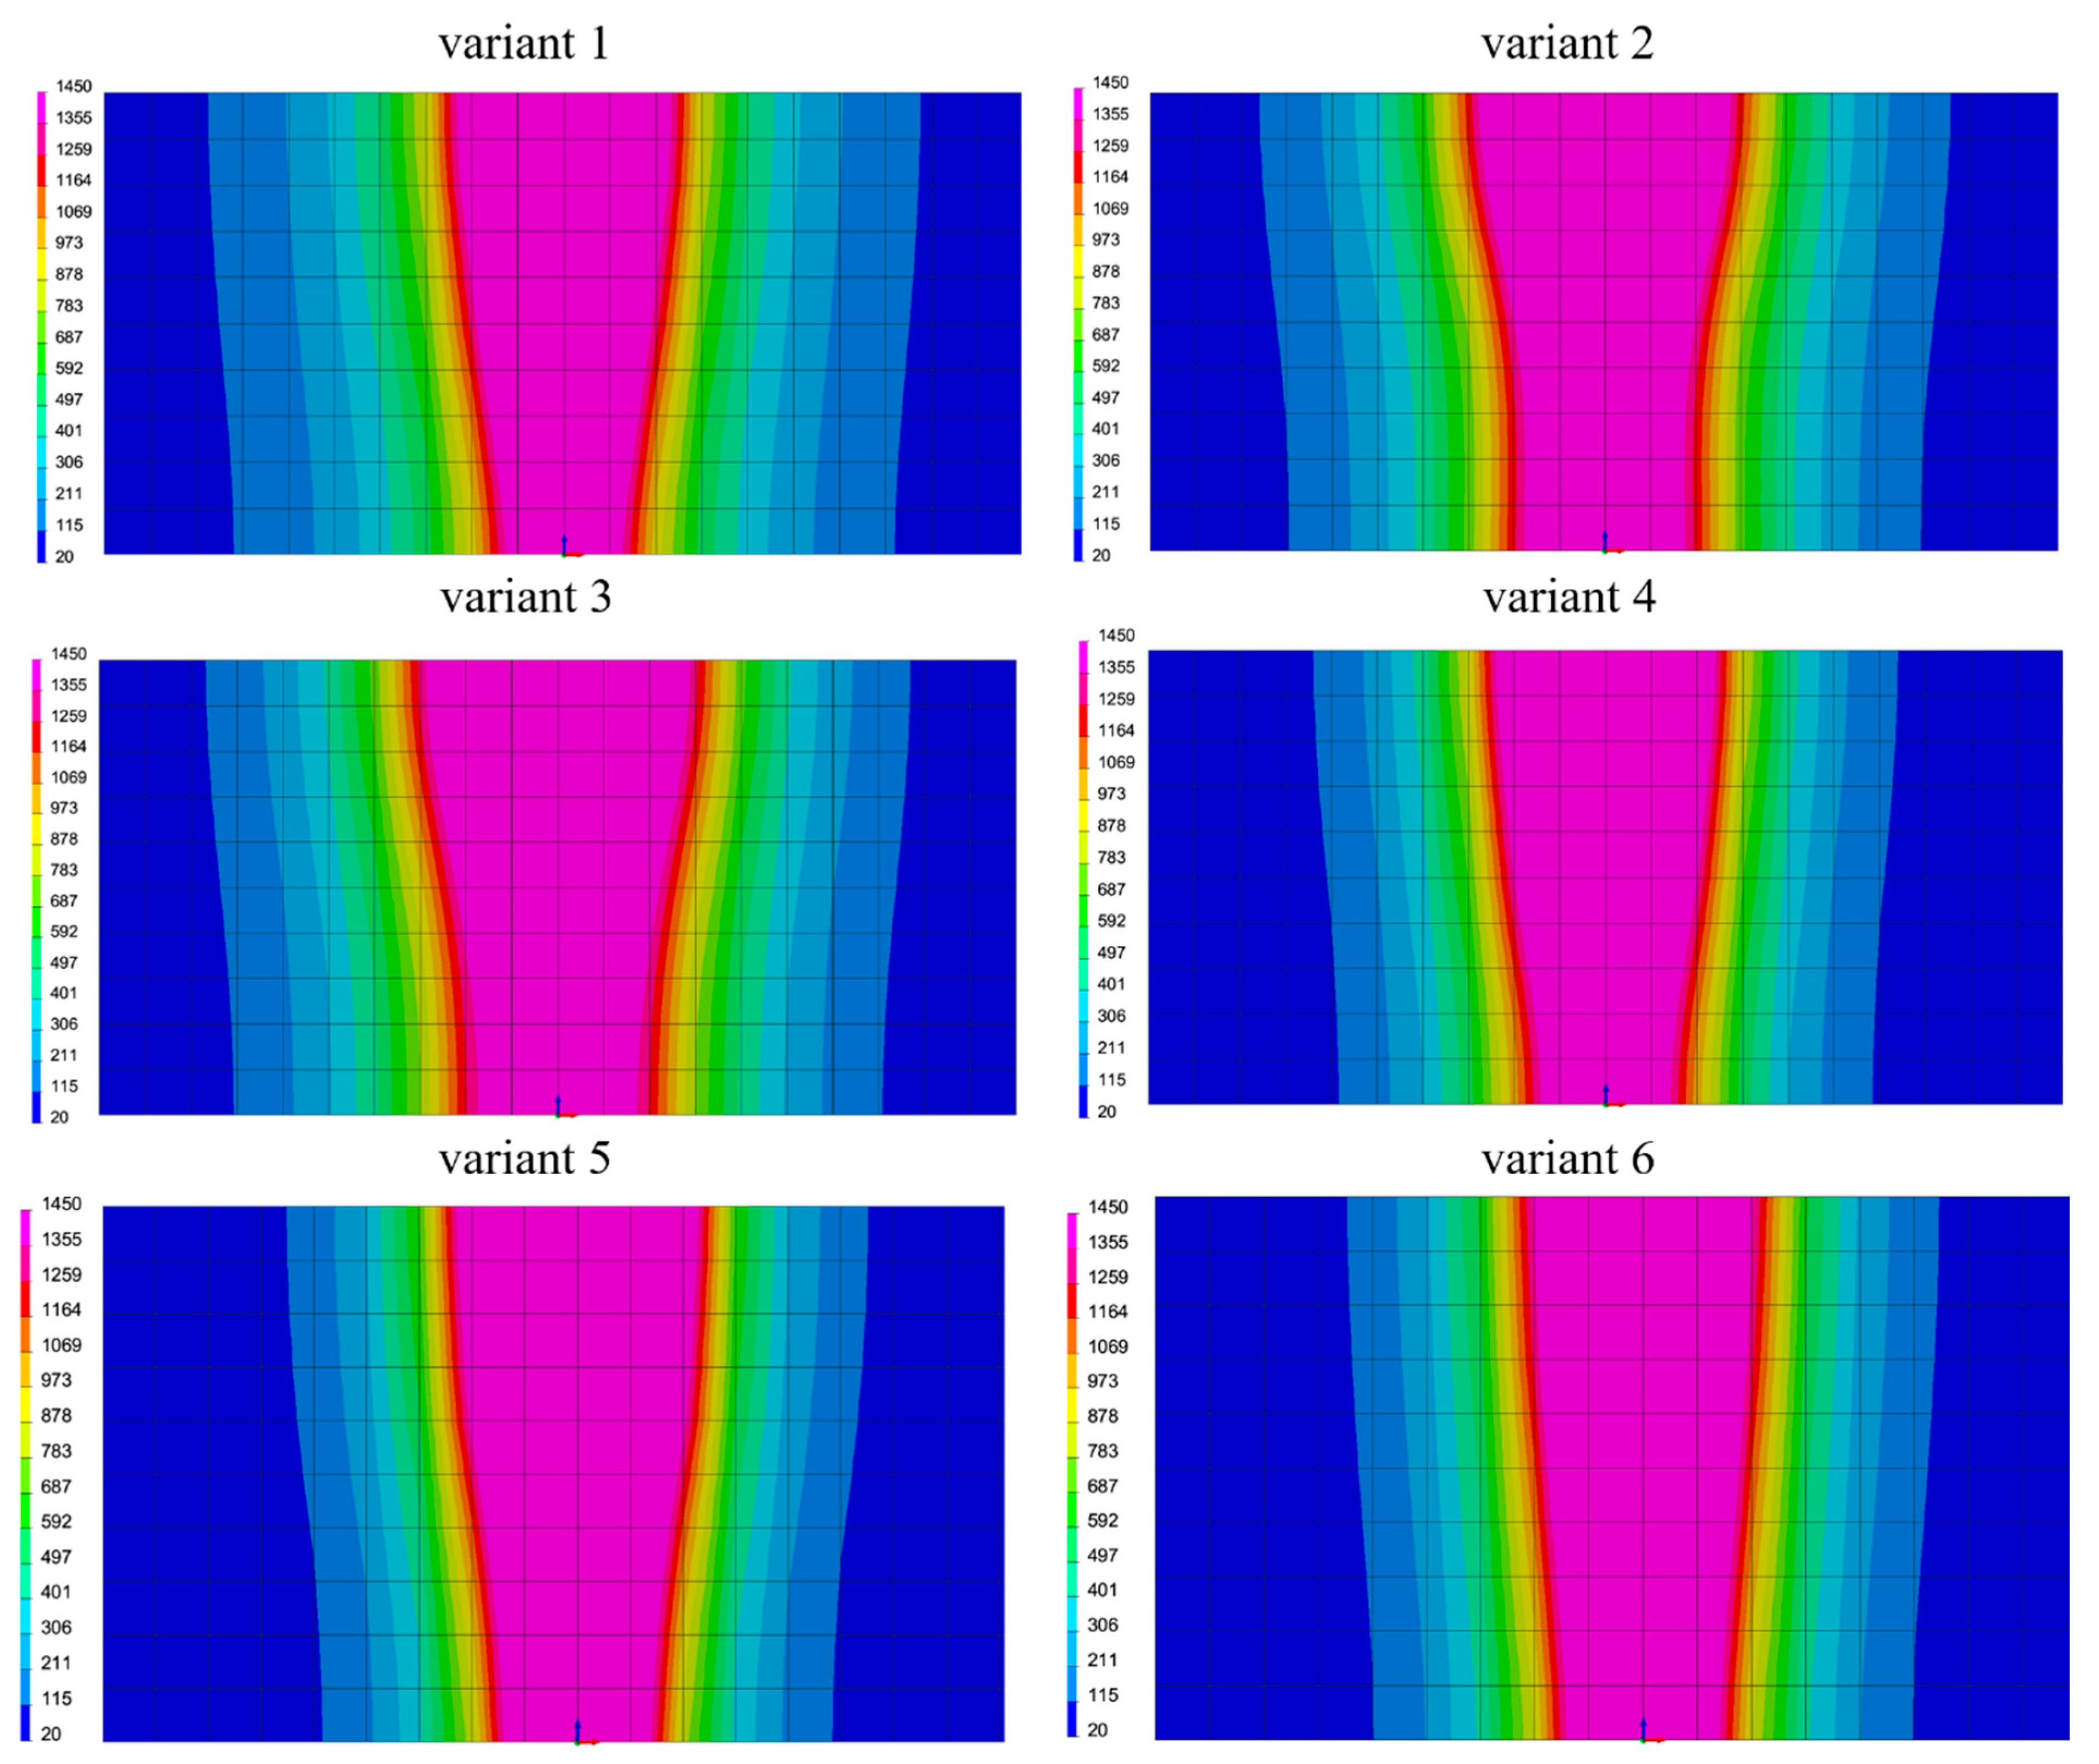
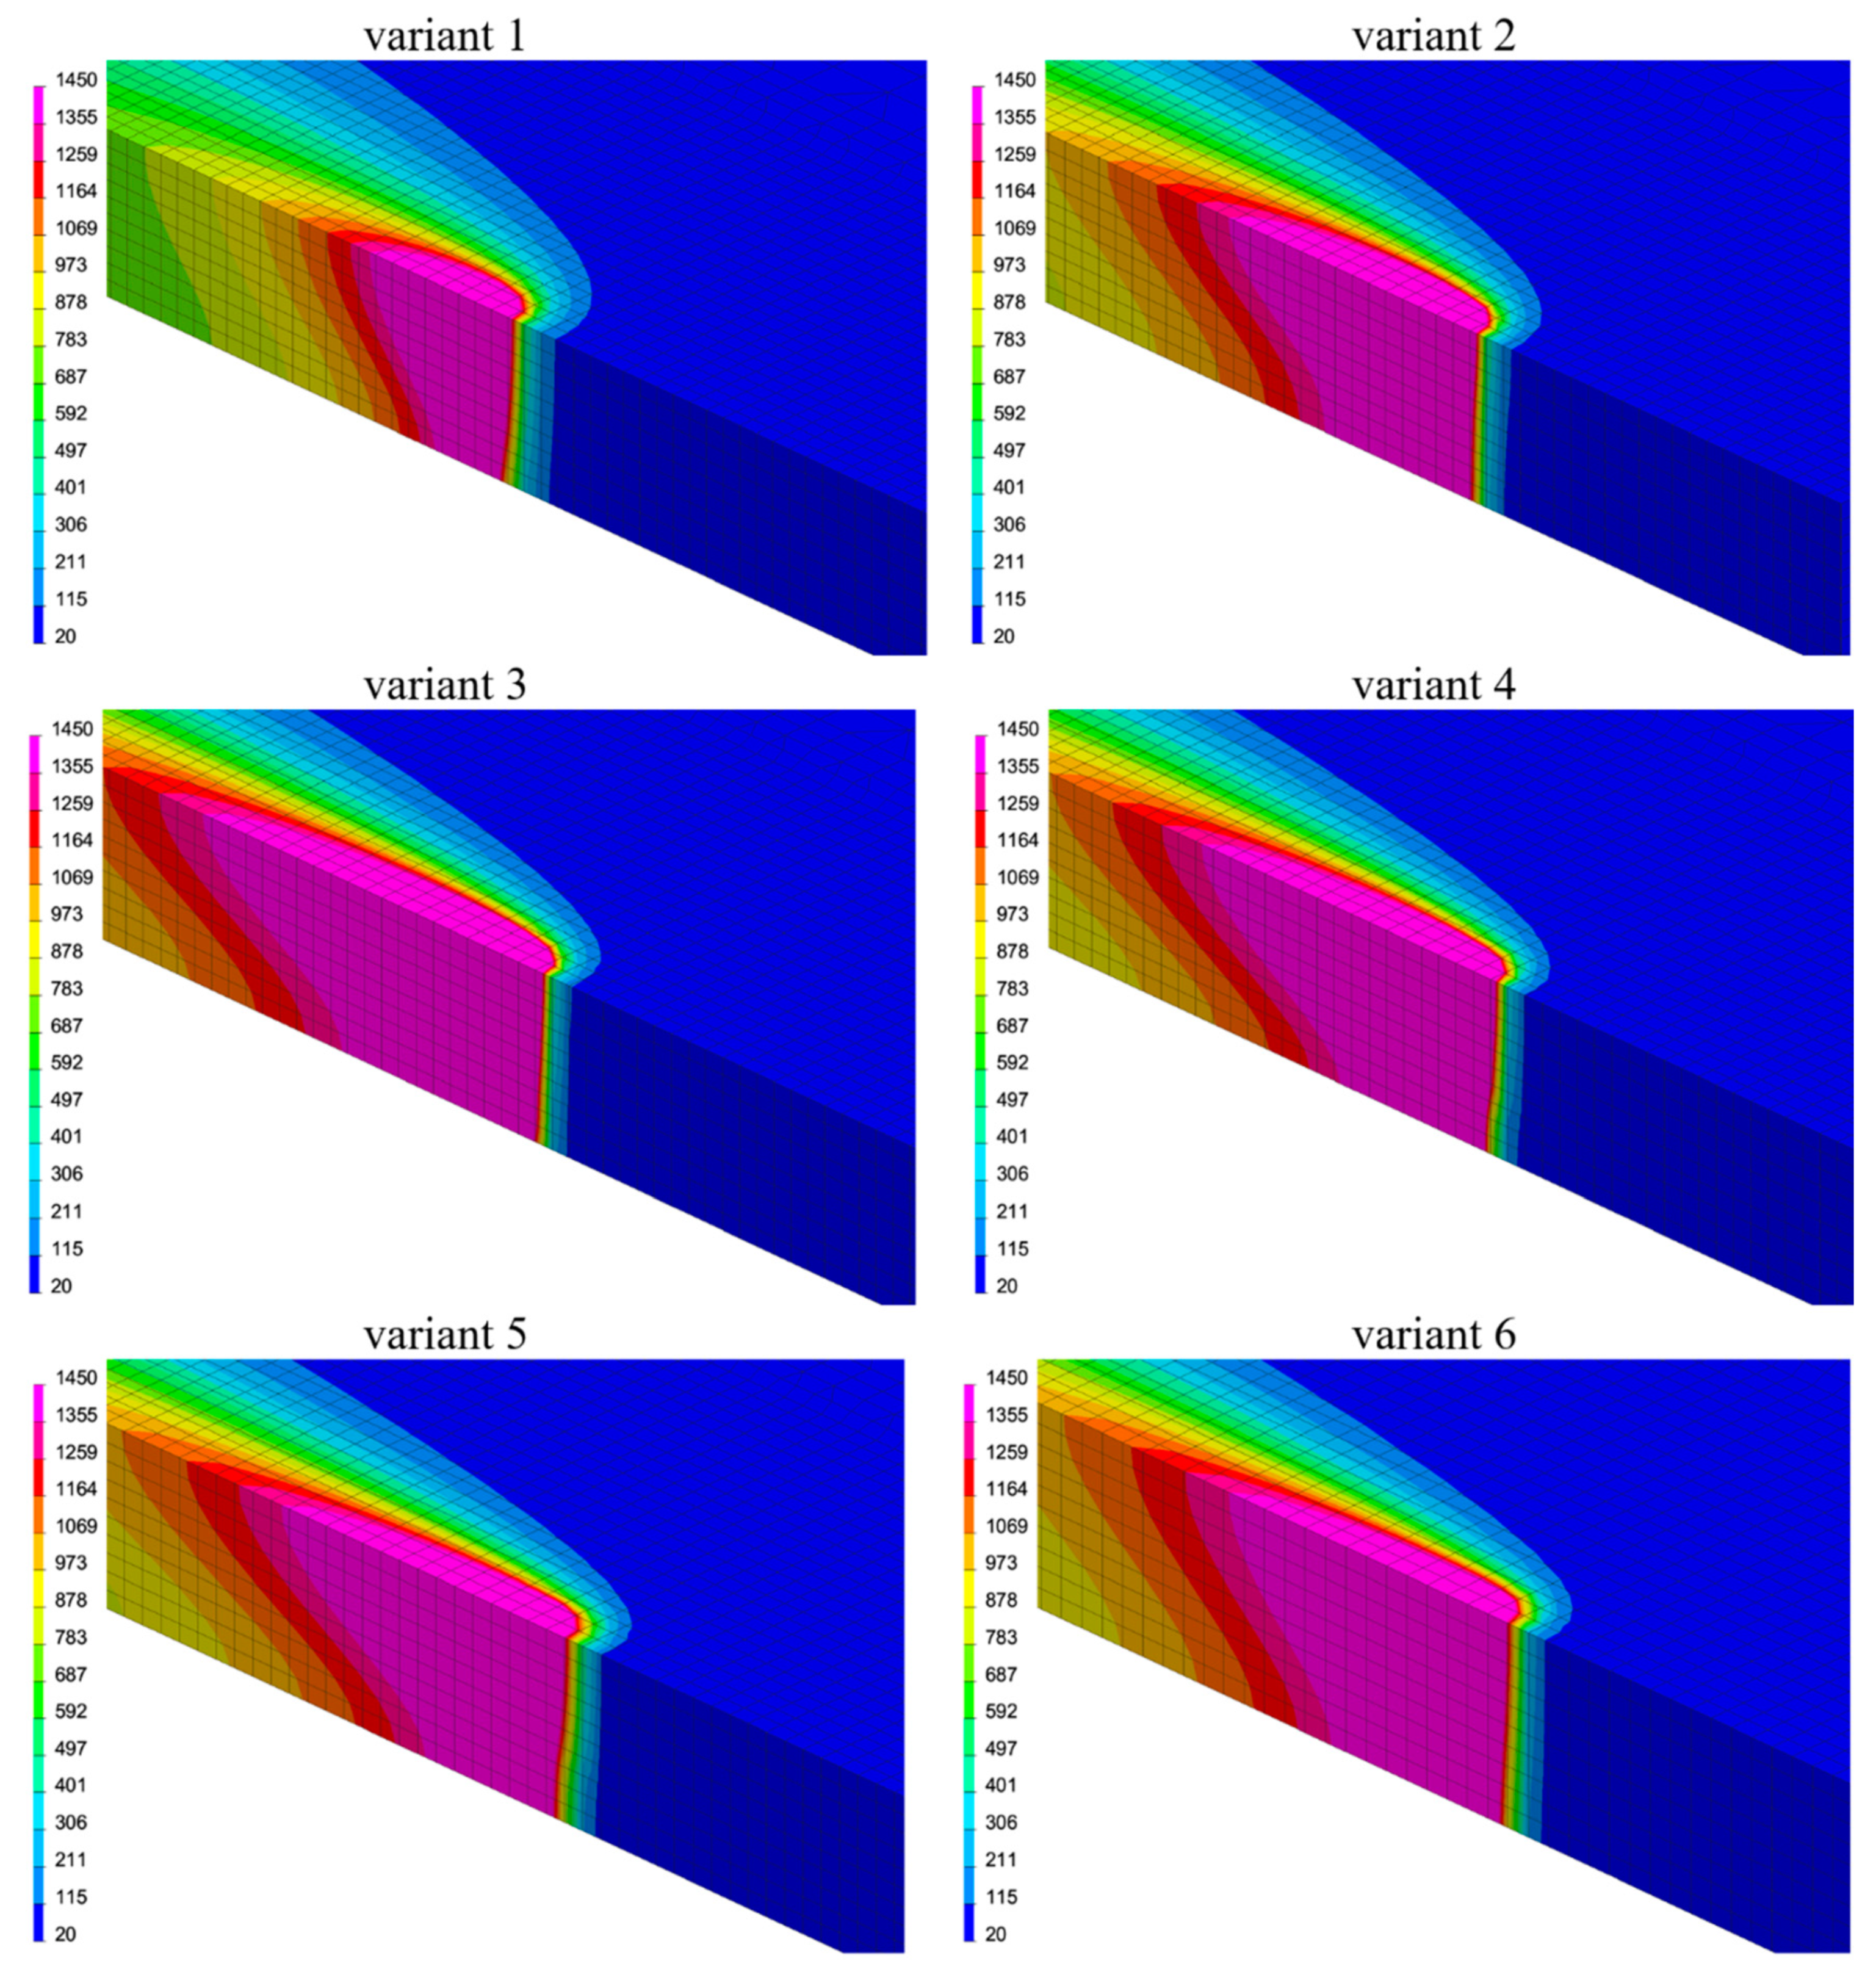
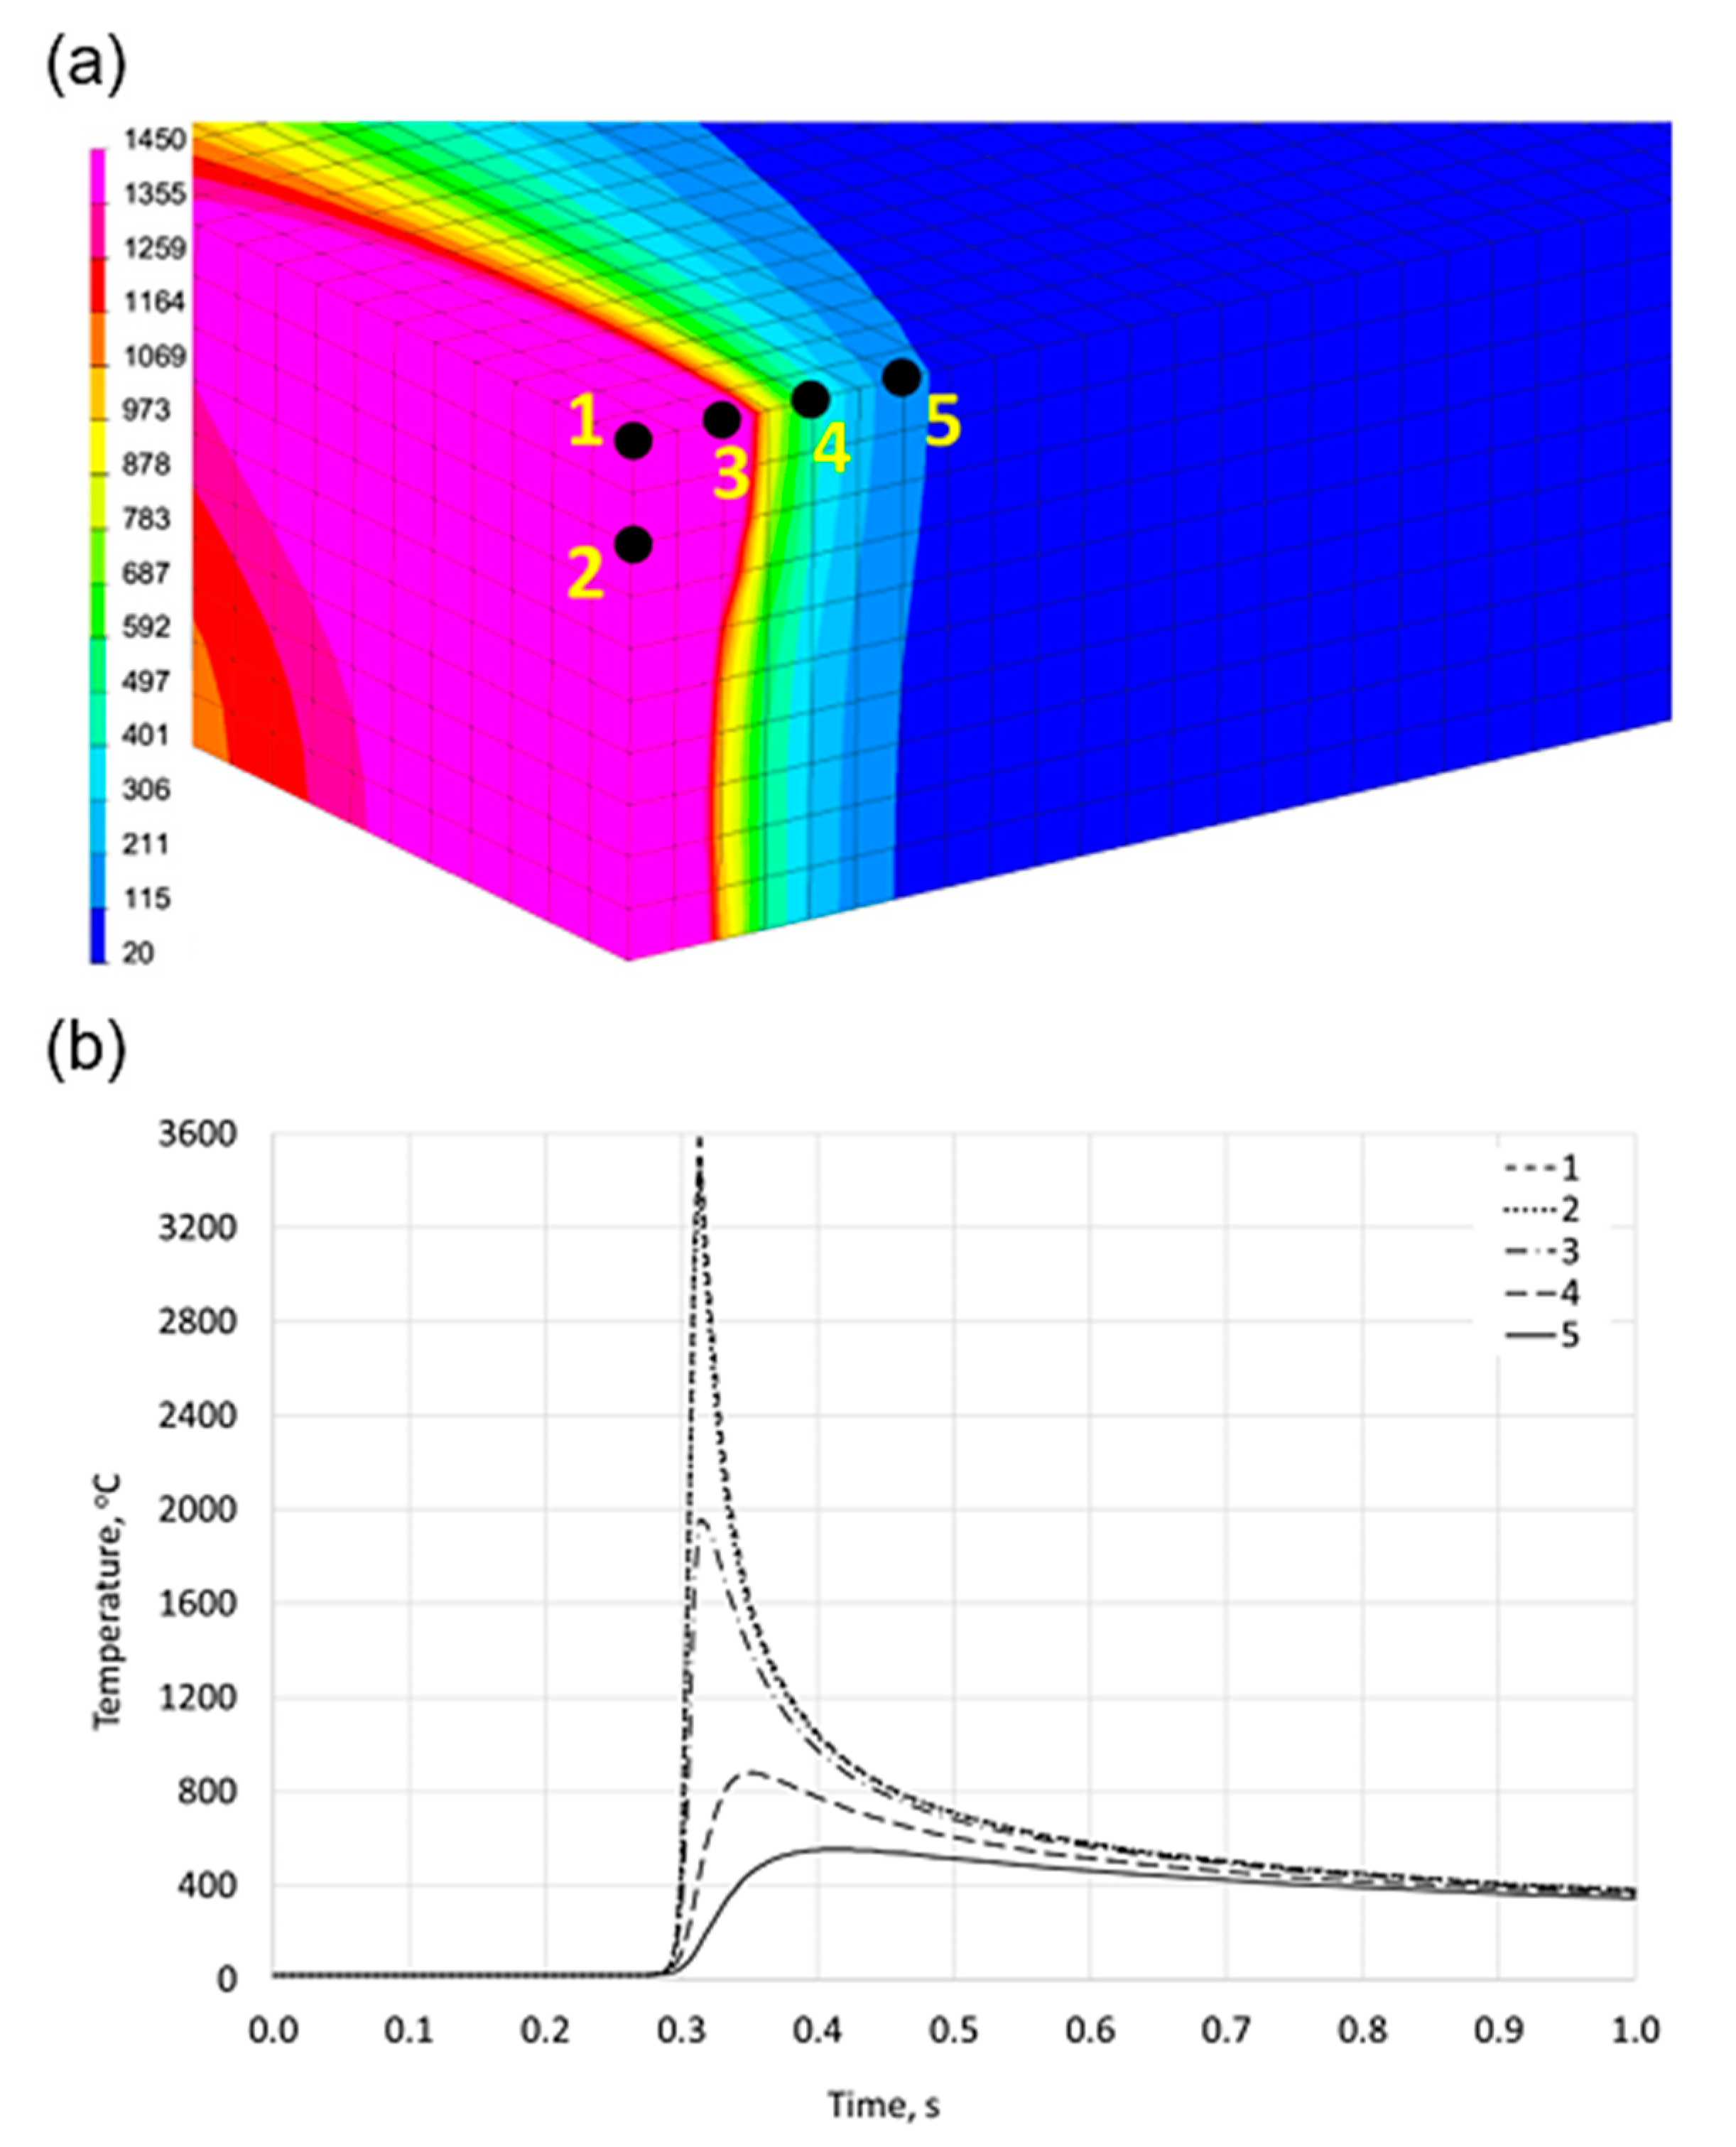
3.1. Simulation of the Laser Welding Cycles

The first step of the analysis involved Sysweld simulations of the laser welding with different parameters. Figure 2 presents the molten pool shapes for all welding variants listed in Table 1. In most cases, the weld pools have the symmetrical conical geometry.
However, in case of variants 2 and 3, the welds are wider and are goblet-shaped. Both of these variants have the highest heat input compared to the rest of the welding parameters (0.051 and 0.053 kJ/mm, respectively). This shows how much heat amount is distributed into material leading in more molten metal. Comparing the variant 3 with the variants 4–6 (having the same beam power but different welding rates), it can be seen that increasing the welding speed leads again to a conical shape of the pool. Moreover, the increase in welding speed does not affect a width of the molten pool significantly. However, looking at the HAZ some decrease in it is visible, when the welding speed was higher. In all cases, the welds were completed and the material was melted throughout its thickness. This means that all welding parameters ensure the complete welds. In case of longitudinal direction (Figure 3), it can be seen that the increase in heat input leads to the elongation of molten pool.
This results in longer cooling time, which has a direct impact on the microstructure. Similar as above, in case of the variants 3–6, the increase in welding speed (corresponding to the decrease in heat input) leads to a slight decrease in the molten pool length. At the same time, the weld pool width is narrower. In all cases, the molten pool temperature was 1450°C, which is higher than the melting point of the steel. Moreover, according to Song et al. [30], when the weld pool is of water-drop shape and its cross section is like the “nail head”, it means that there is the proper distribution coefficient of the surface and body heat source. As presented in Figure 4, martensite is a dominant phase in the FZ, as high cooling rates made by laser welding promote its formation.
The amount of this hard phase decreases with an increasing distance from the FZ. The heat-affected zone contains ~80% martensite. This amount drops to 50% in the middle of it and is equal to 13% near the base material (BM). This is an expected result, as the martensite formation depends on the hardenability of the steel and the cooling rate. The greater the distance from the FZ, the lower cooling rate of material after the LW. Slowing down the cooling rate leads to formation of phases such as bainite or at very slow cooling rates, ferrite. At the same time, it is important to note that the closer to the base material, the lower is the maximum temperature generated during welding process. In some cases, it could be lower than Ac1, so there is no austenite that can transform into martensite upon cooling.
The prediction of the hardness of the weld at its different parts is shown in Figure 5. As expected, the hardness of the weld increases together with the smaller distance to the axis of the fusion zone. From the base material of the 280 HV, the hardness increases to ~540 HV. The significant increase in hardness is the result of gradually increasing martensite fraction in the weld. The more martensite in the microstructure, the higher is the hardness. Looking at the different parts of the weld, it can be seen that the tendency of the hardness change is similar. The only difference is a width of the zones, but this is an effect of the conical geometry of the weld.
The different phase composition of the weld in its different zones, resulting from different cooling rates, influences also residual stresses in the weld. According to Figure 6, which presents the von Mises distribution of residual stresses, the highest stresses of 645 MPa are present in the middle part of the weld in HAZ (near the fusion line). The general level of the stresses in the HAZ for the whole weld is approximately 516–559 MPa. The stress distribution of the TRIP steel is typical like for other high-strength steels with the maximum values in the HAZ [31]. With increasing a distance from the weld, the residual stresses decrease due to lesser microstructural changes. According to Kik et al. [31], the level of residual stresses is influenced by the maximum cycle temperature as well as a cooling speed. In case of slow cooling the level of residual stresses is lower, as the material has longer time for the stress relaxation during cooling.

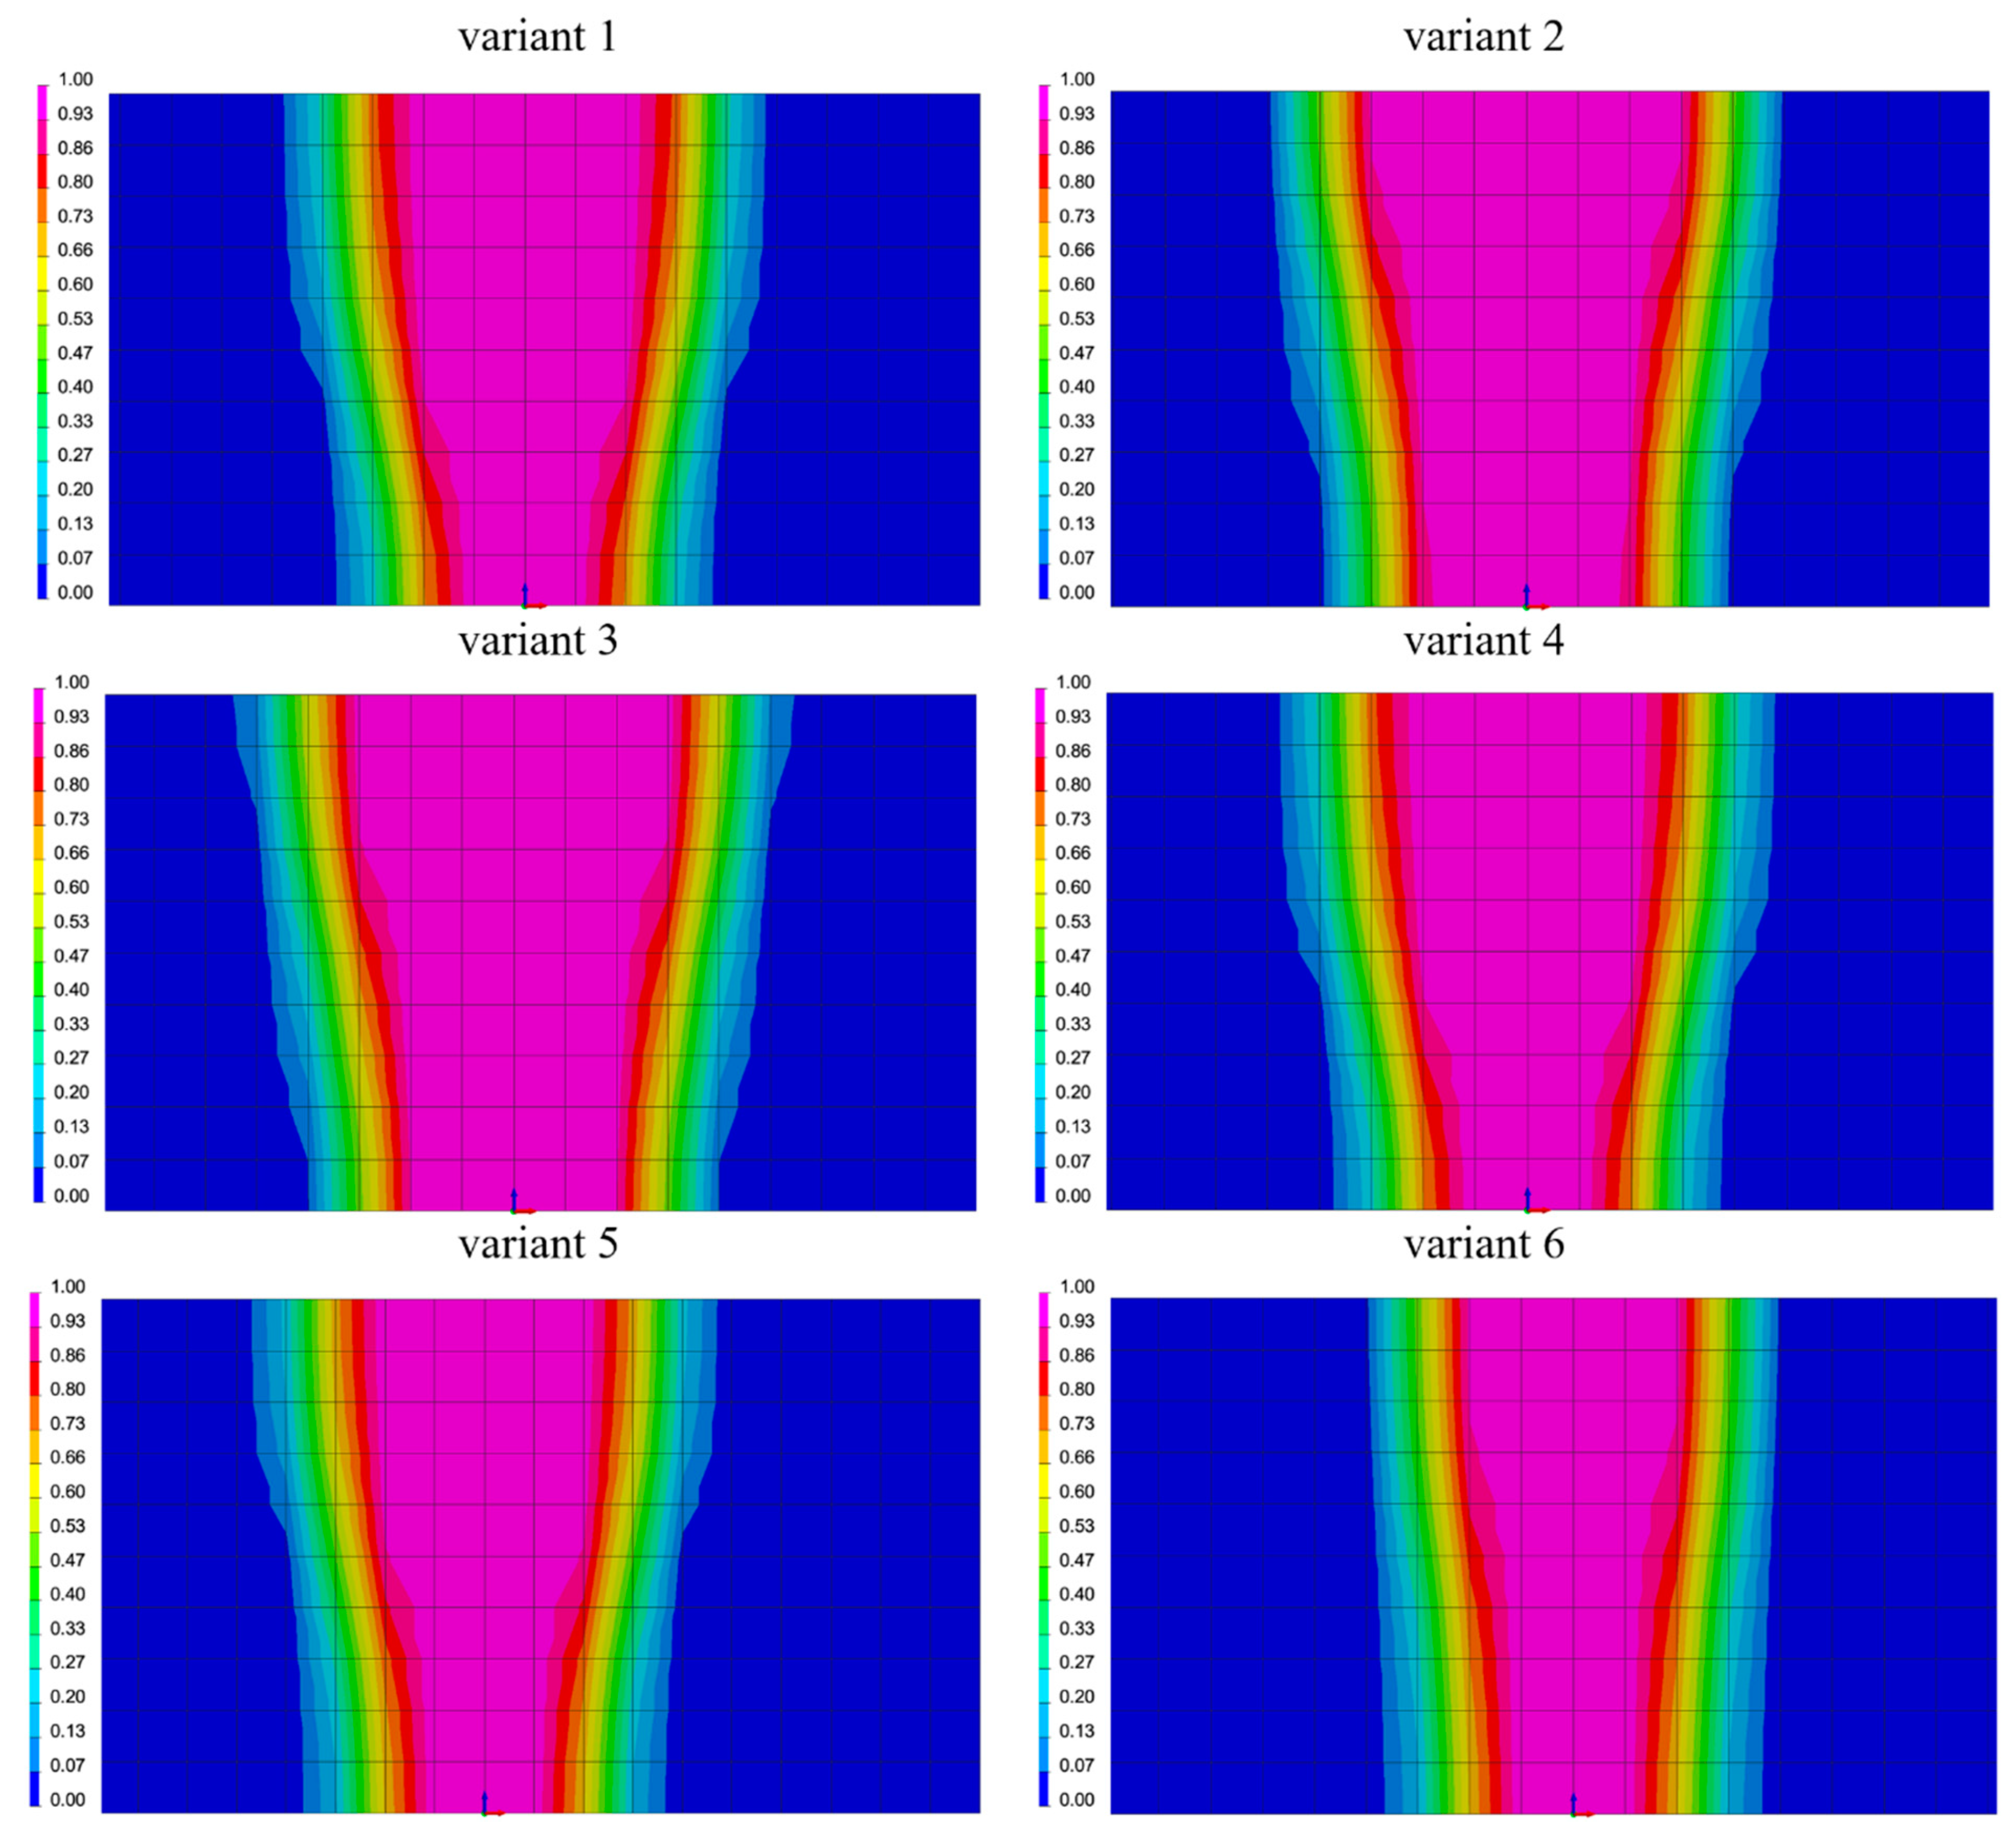
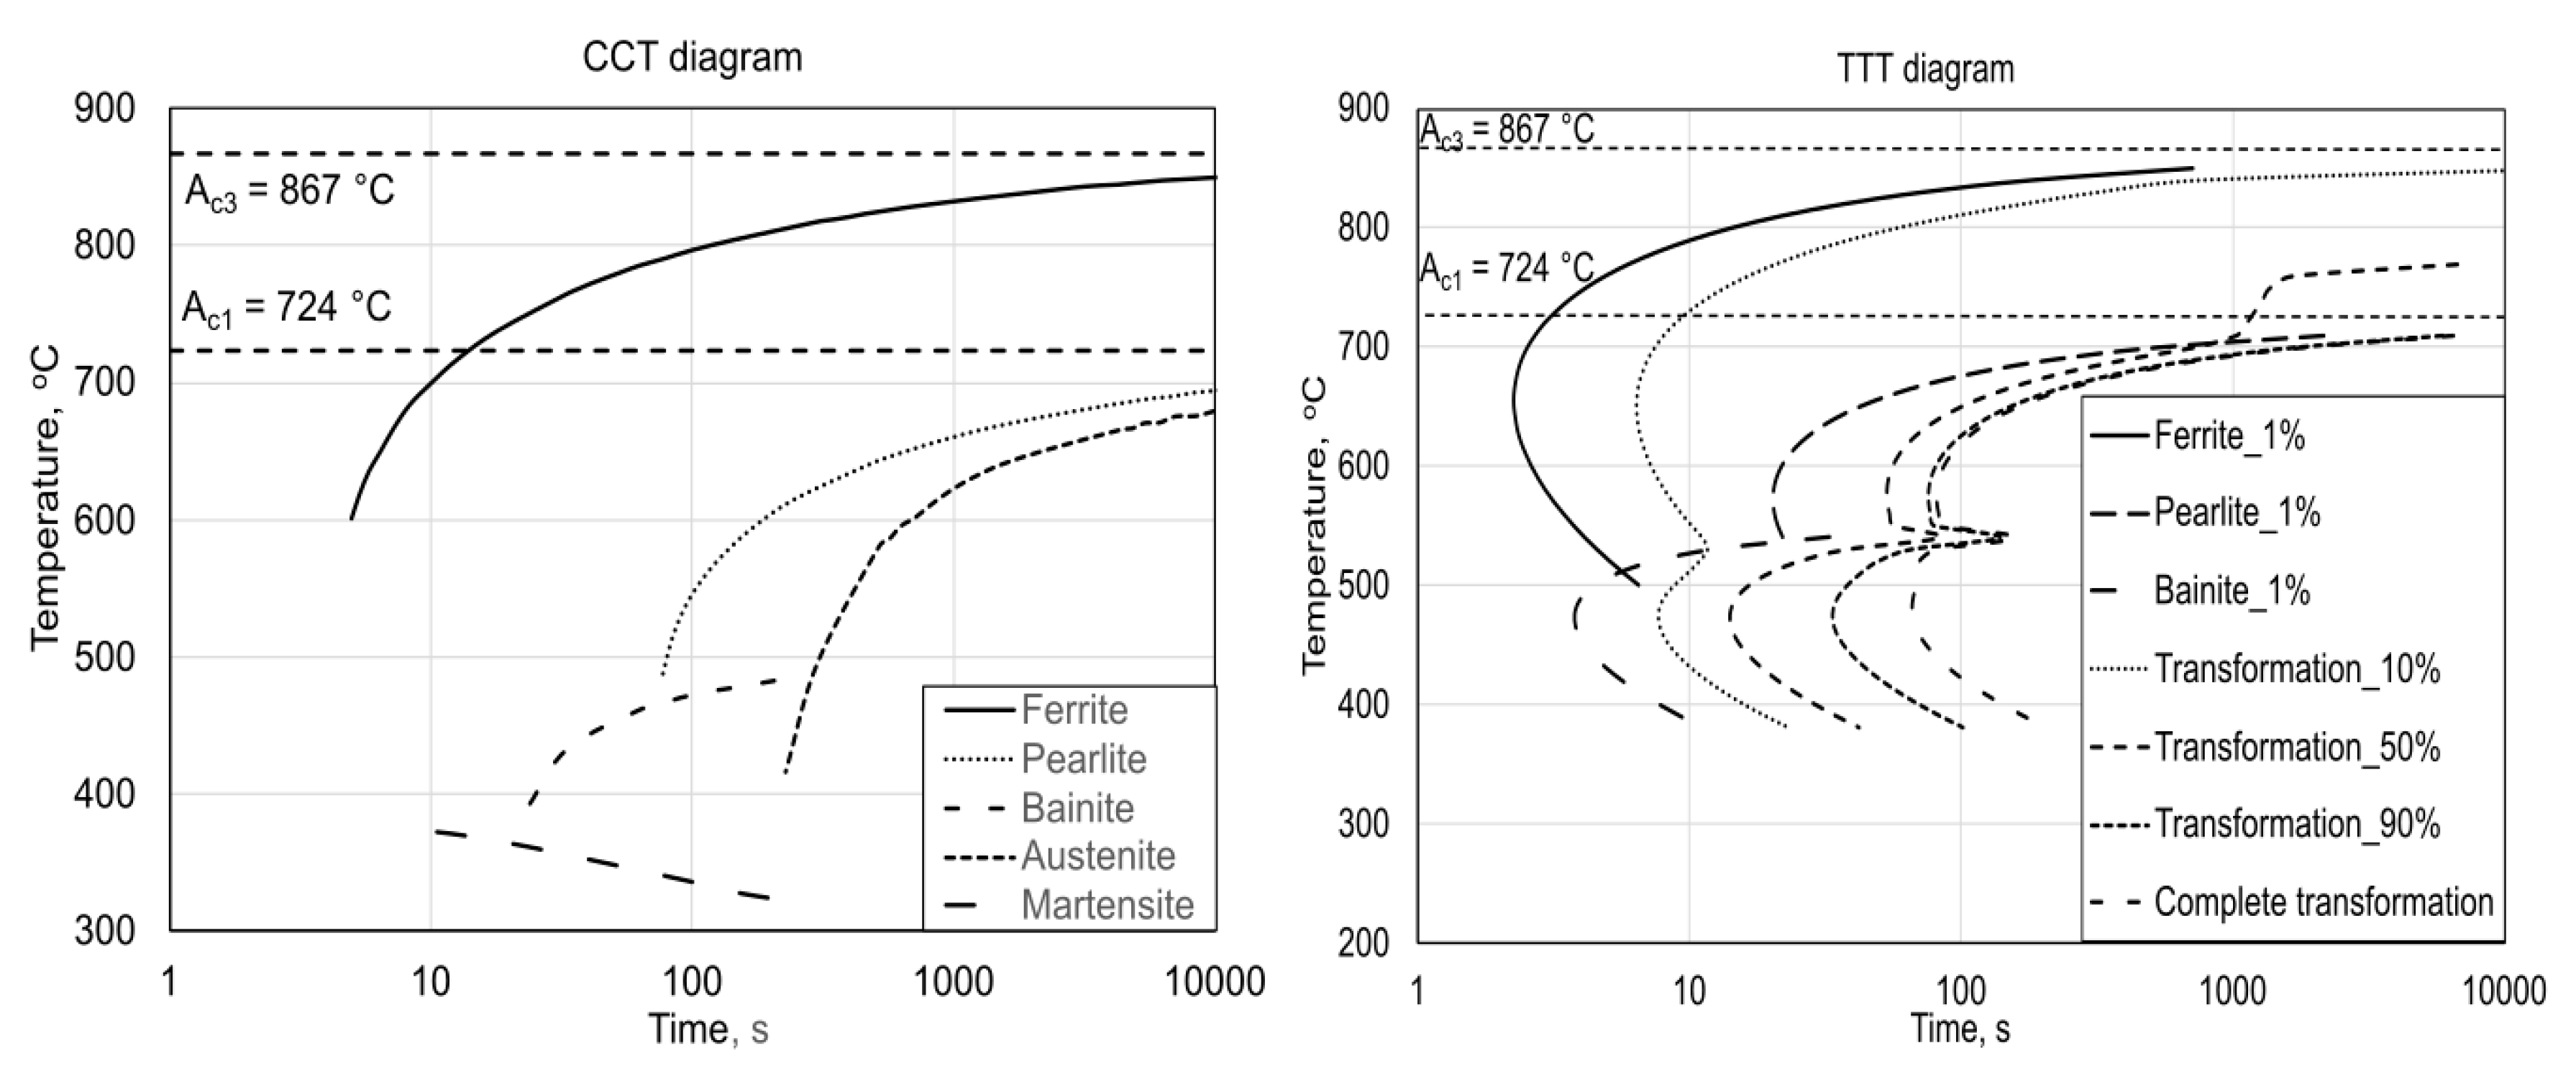
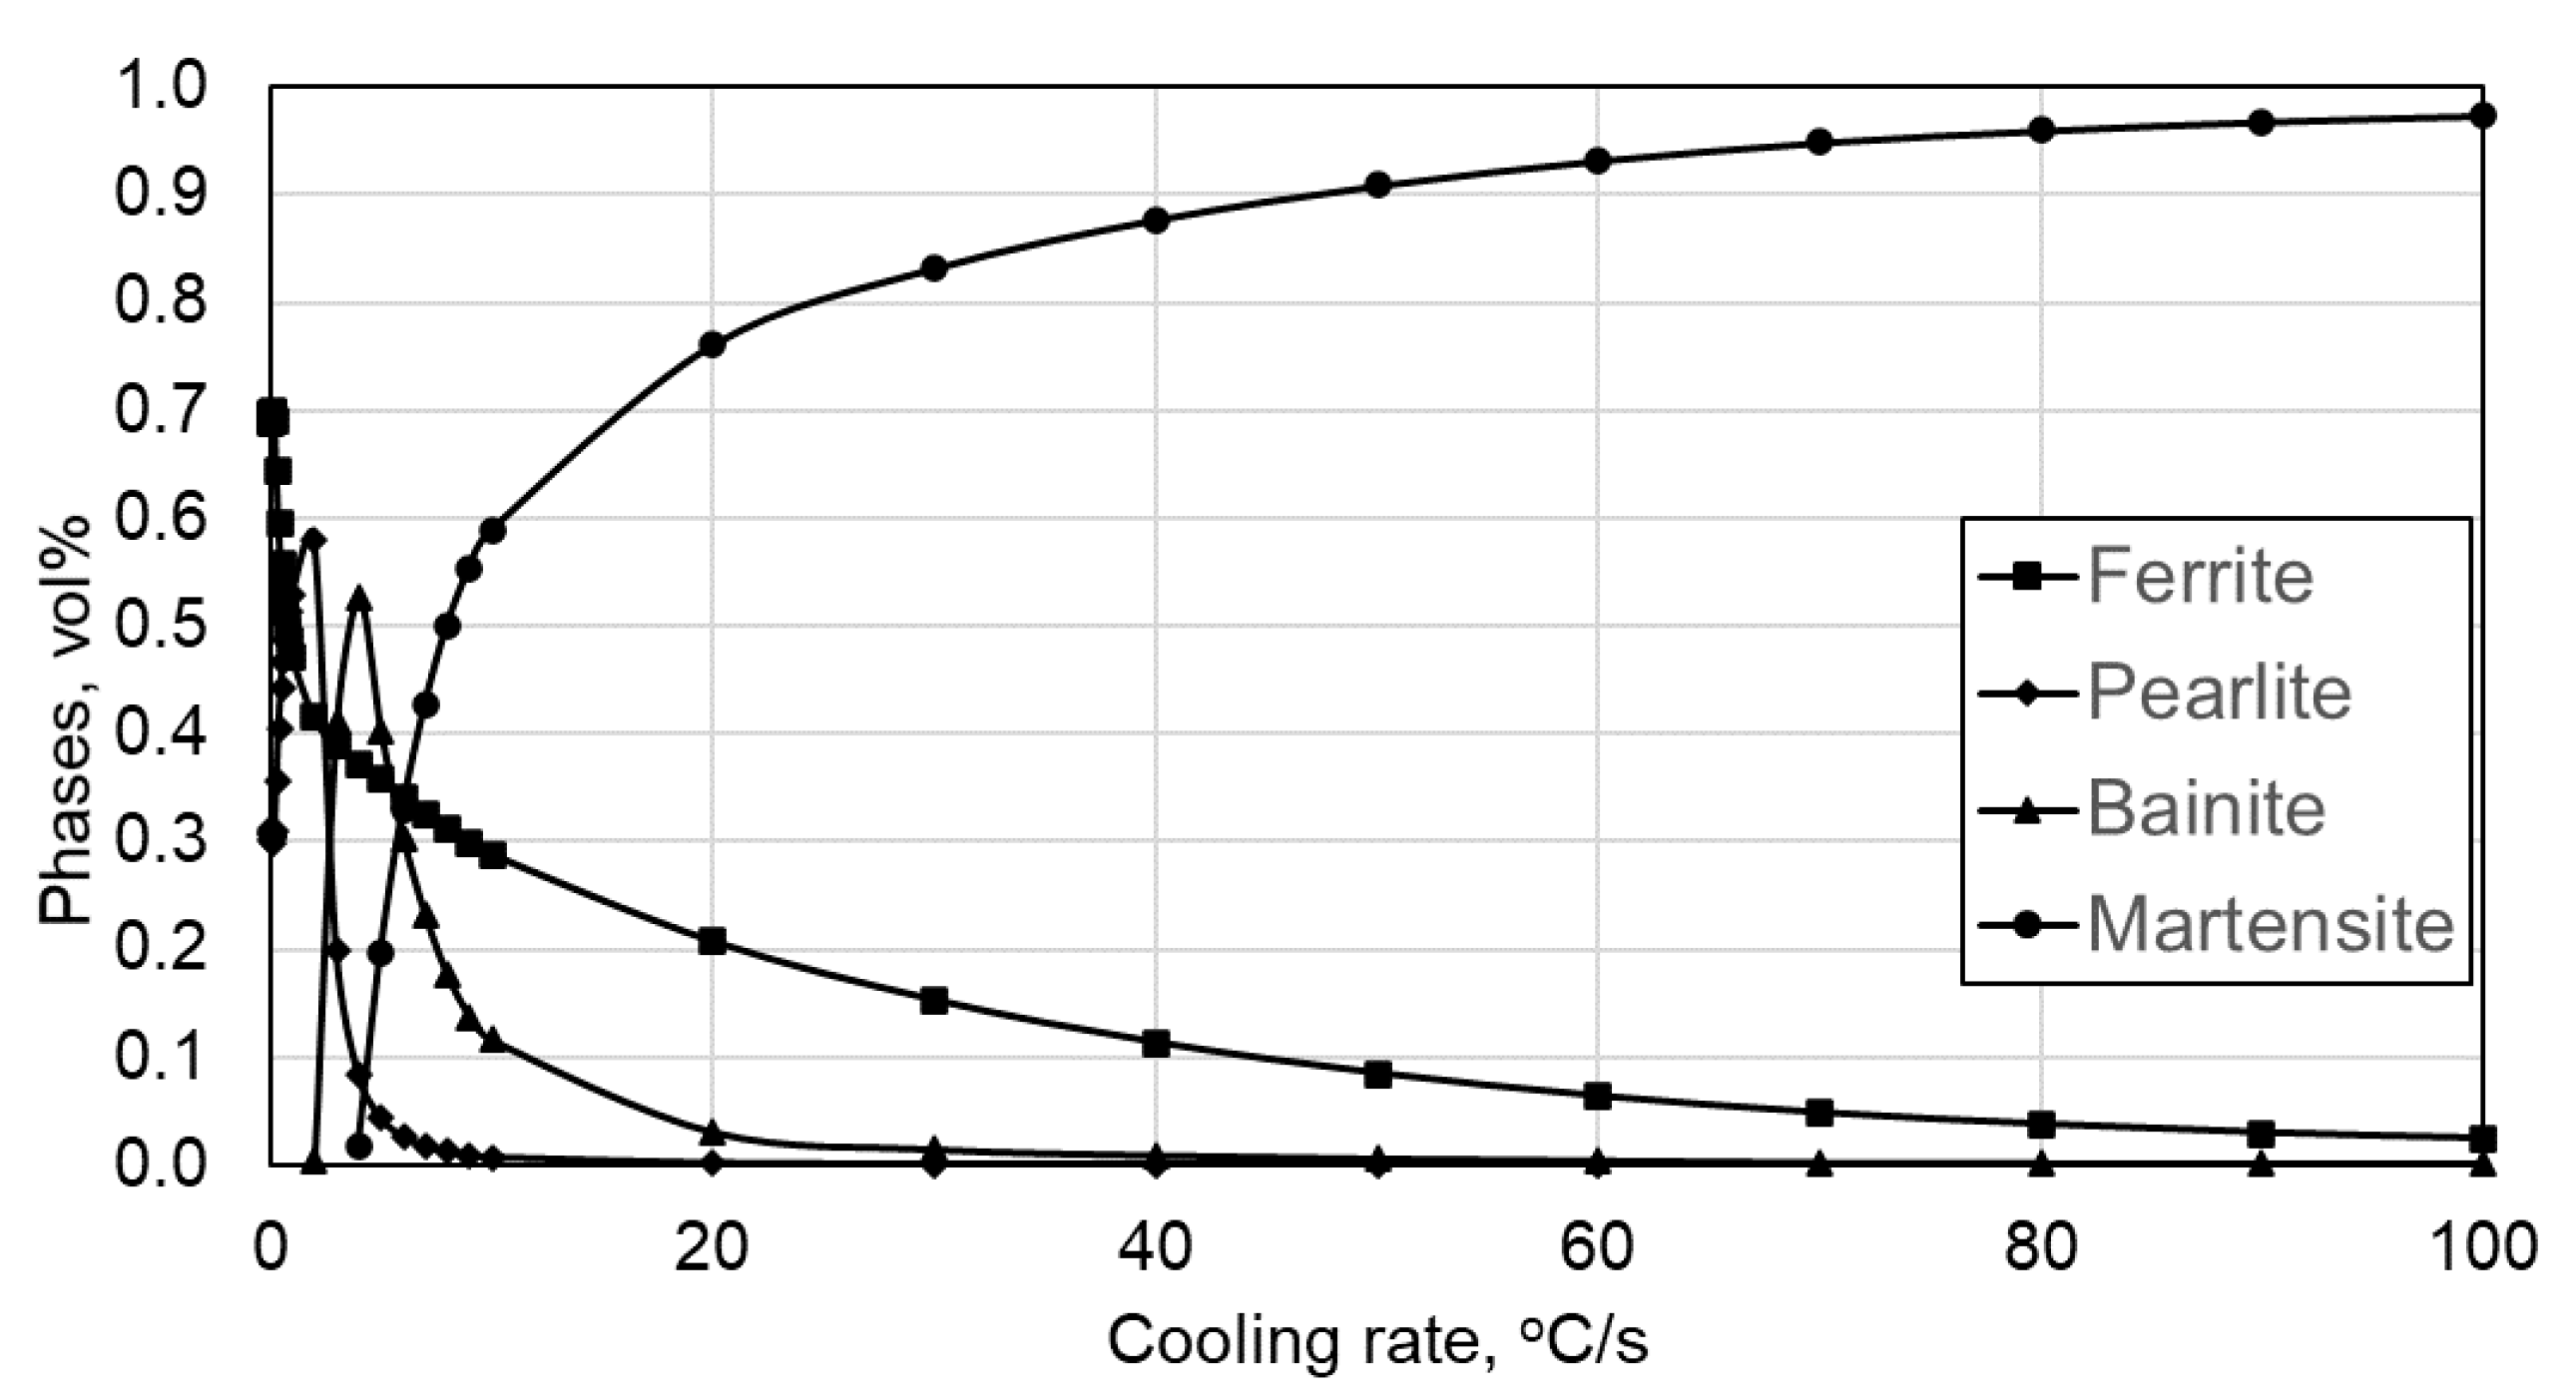
3.2. Phase Transformation Kinetics during Welding

One of the most important aspects of the welding process is the change of the microstructure because of the base material melting. This process leads to formation of new phases in the weld resulting in the change of mechanical properties. That is why it is important to predict how the welding process influences the microstructure. Depending on the welding method, the thermal cycles can be less or more dynamic. The latter situation takes place during laser welding, as the laser generates a lot of thermal energy in a short time.
The thermal cycles at different points of weld were determined using the Sysweld (Figure 7). Five points were selected: two in the fusion zone, one in the heat affected zone, and one in the transition zone between the HAZ and BM. Based on the selected points, the thermal cycles were determined to analyze the phase transformation kinetics during welding. The information taken out from the thermal cycles was a maximum temperature obtained during the welding cycle and a cooling rate. These results are presented in Table 2.
The highest temperature at different points were firstly analyzed. These values give important information; mainly if the temperature was high enough to form the austenite. If the austenite was present during heating, then it can be transformed to different phases during cooling. Based on the analysis, only the point near the BM does not cross the Ac1 temperature. This means that in other cases the formation of the austenite takes place. With this knowledge, the cooling rate was determined next. As the reference, a temperature after 1 s was selected. After 1 s the temperature of the material is ~400 °C, which is near to martensite start temperature of the steel (Ms) [32]. Crossing the Ms temperature of 380 °C means that only martensite will be formed in the microstructure. Hence, it was possible to calculate the cooling rates at different temperatures. As expected the highest temperatures and cooling rates were obtained in the fusion zone (point 1–3) and heat affected zone (point 4). In both cases the temperatures were much higher than the Ac1 temperature. Much lower temperature (that was lower than the Ac1) was a temperature in the TZ near the base material (point 5). The continuous cooling transformation (CCT) and temperature–time transformation (TTT) diagrams were calculated using the JMatPro software (Figure 8). According to the CCT diagram (Figure 8, left), the 1 s cooling to the temperature of 400 °C means that no ferrite could be formed during welding. The same situation is in case of the bainite and pearlite. At the same time the temperature of the weld after 10 s according to the Sysweld simulation is equal to 100°C. According to the TTT diagram (Figure 8, right), this means that no transformation under isothermal conditions could occur. The conclusion is that only martensite could be present in the microstructure of the FZ and HAZ. In the case of the point near the base material the Ac1 temperature was not exceeded. This means that no austenite was formed during heating. Therefore, there should be no change of phase composition. The microstructure is expected to be very similar as before the LW process.
As presented in Figure 9, when the cooling rate increases the amount of martensite increases too. When the cooling rate is equal to or higher than 100 °C/s, only martensite should be present in the microstructure. Taking into account the dynamic thermal cycles of laser welding, in case of the FZ and HAZ only martensite should occur in final microstructures of the weld.

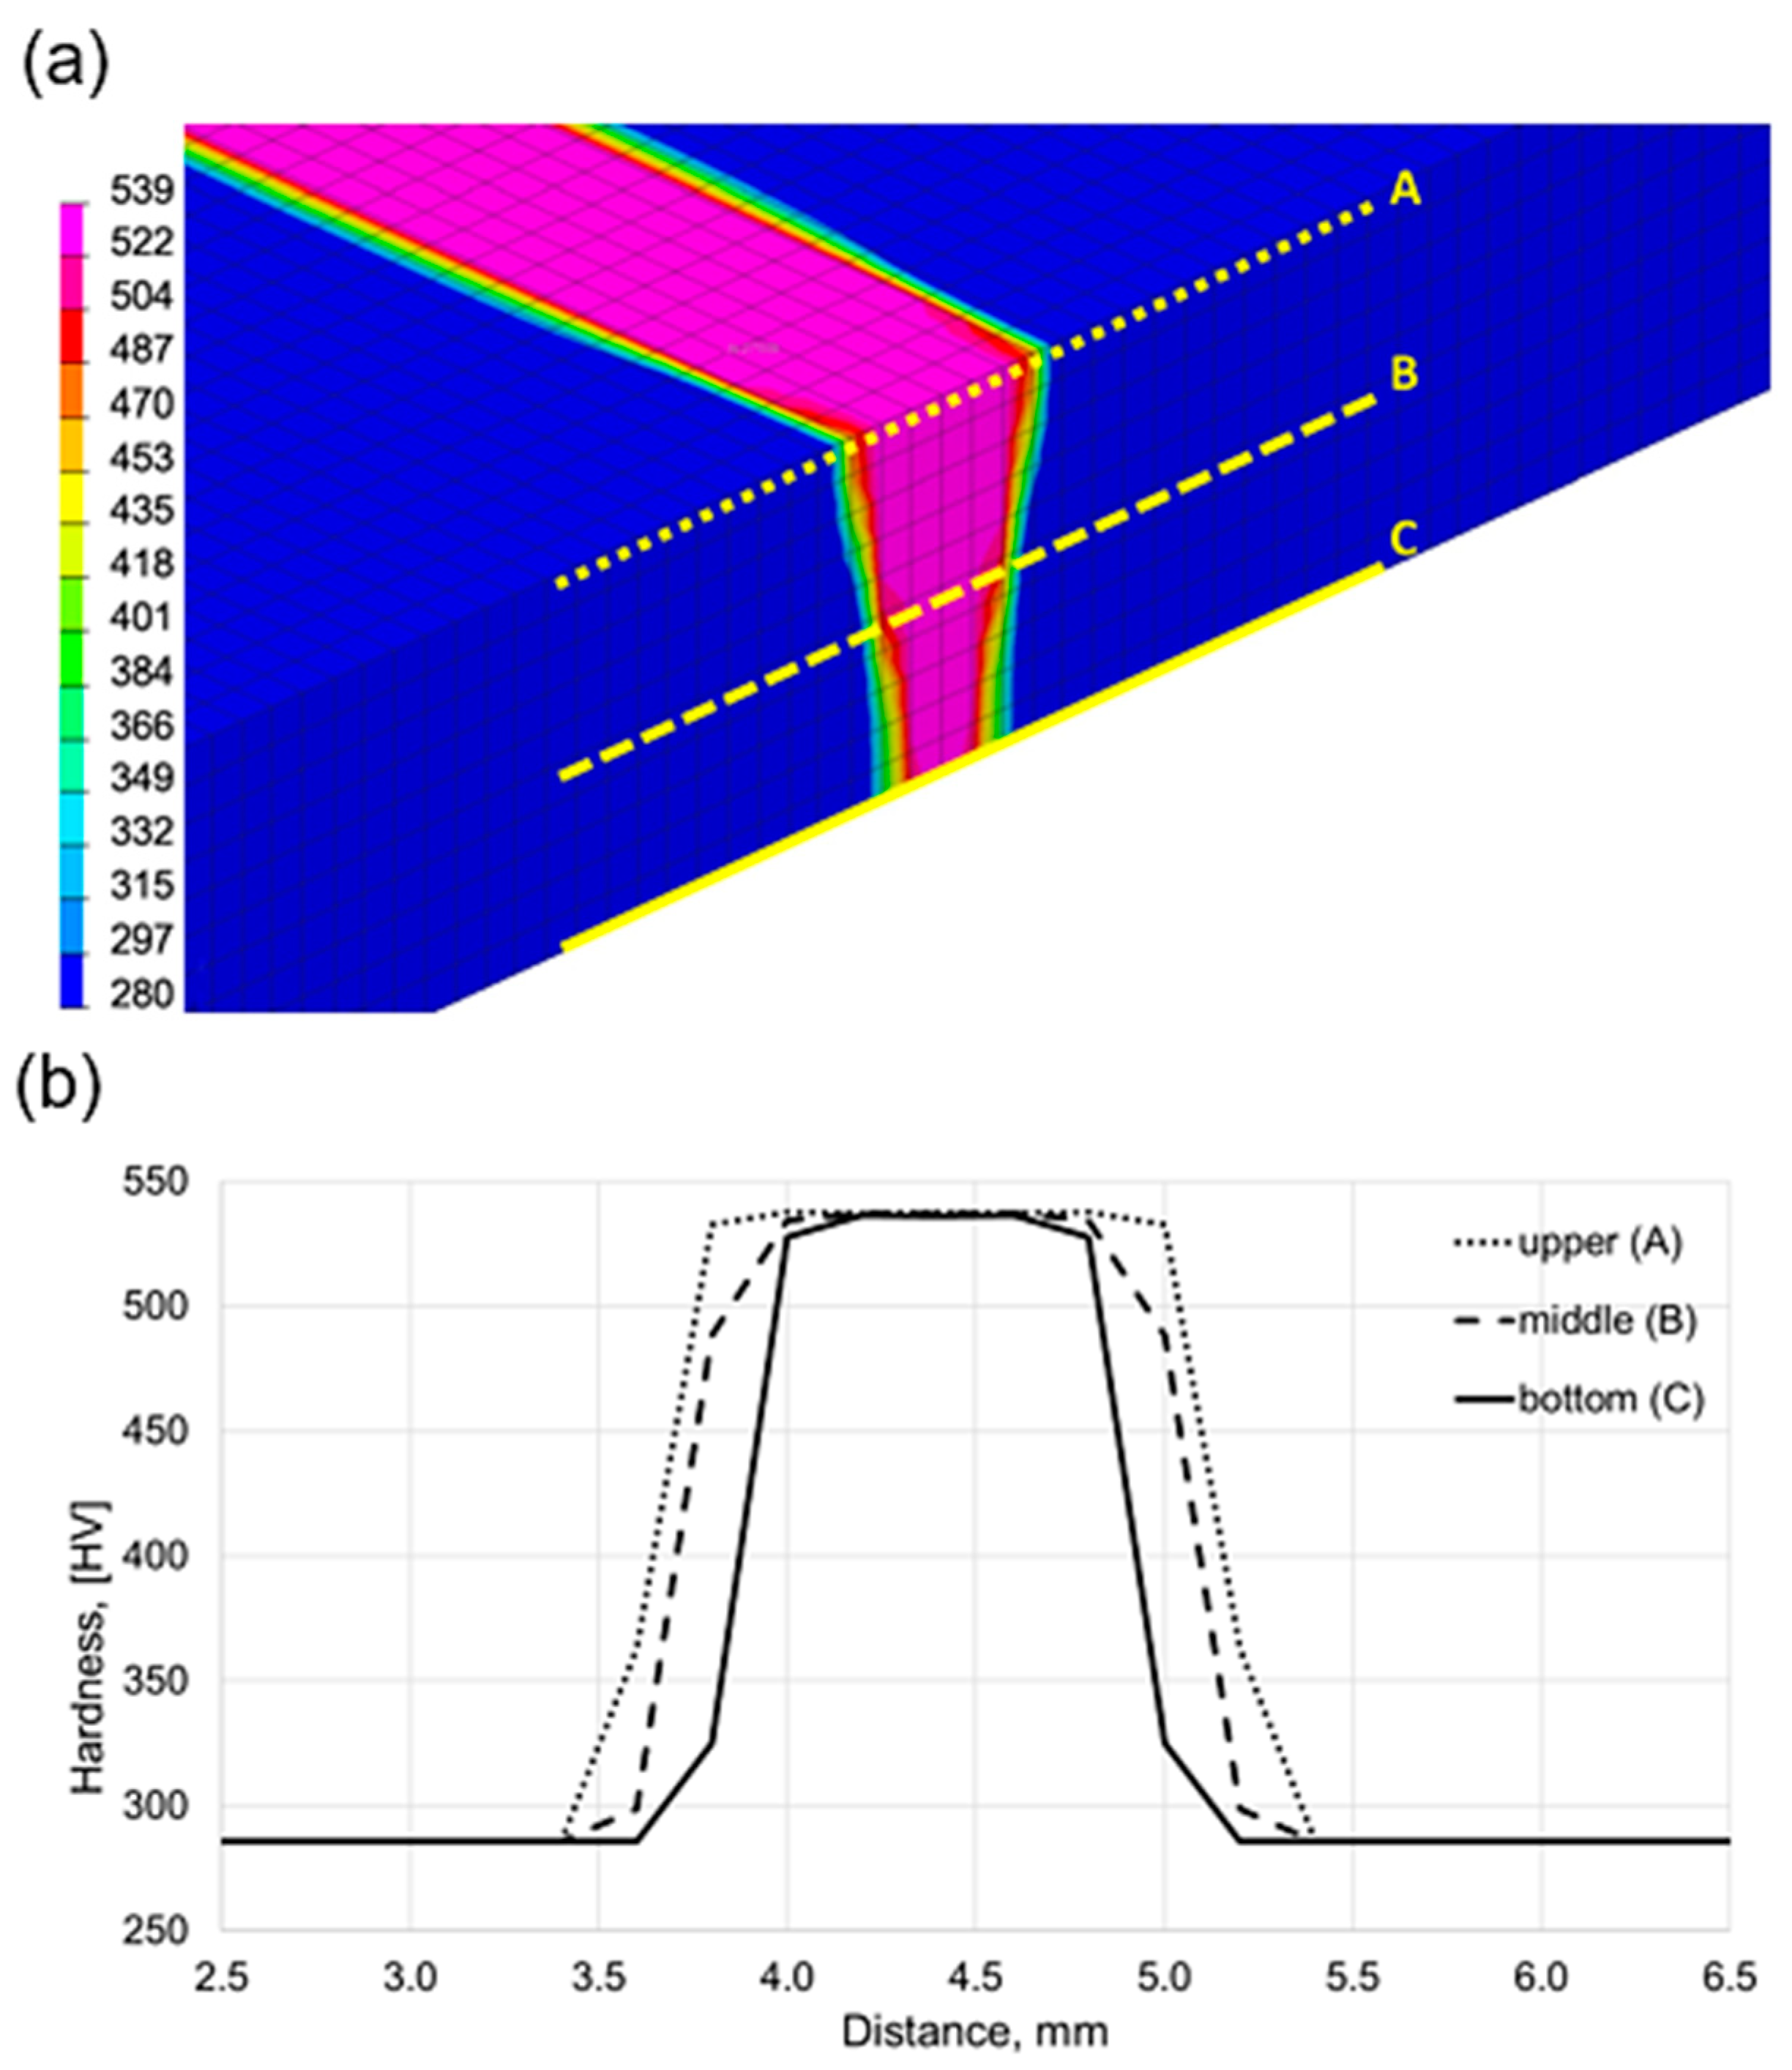
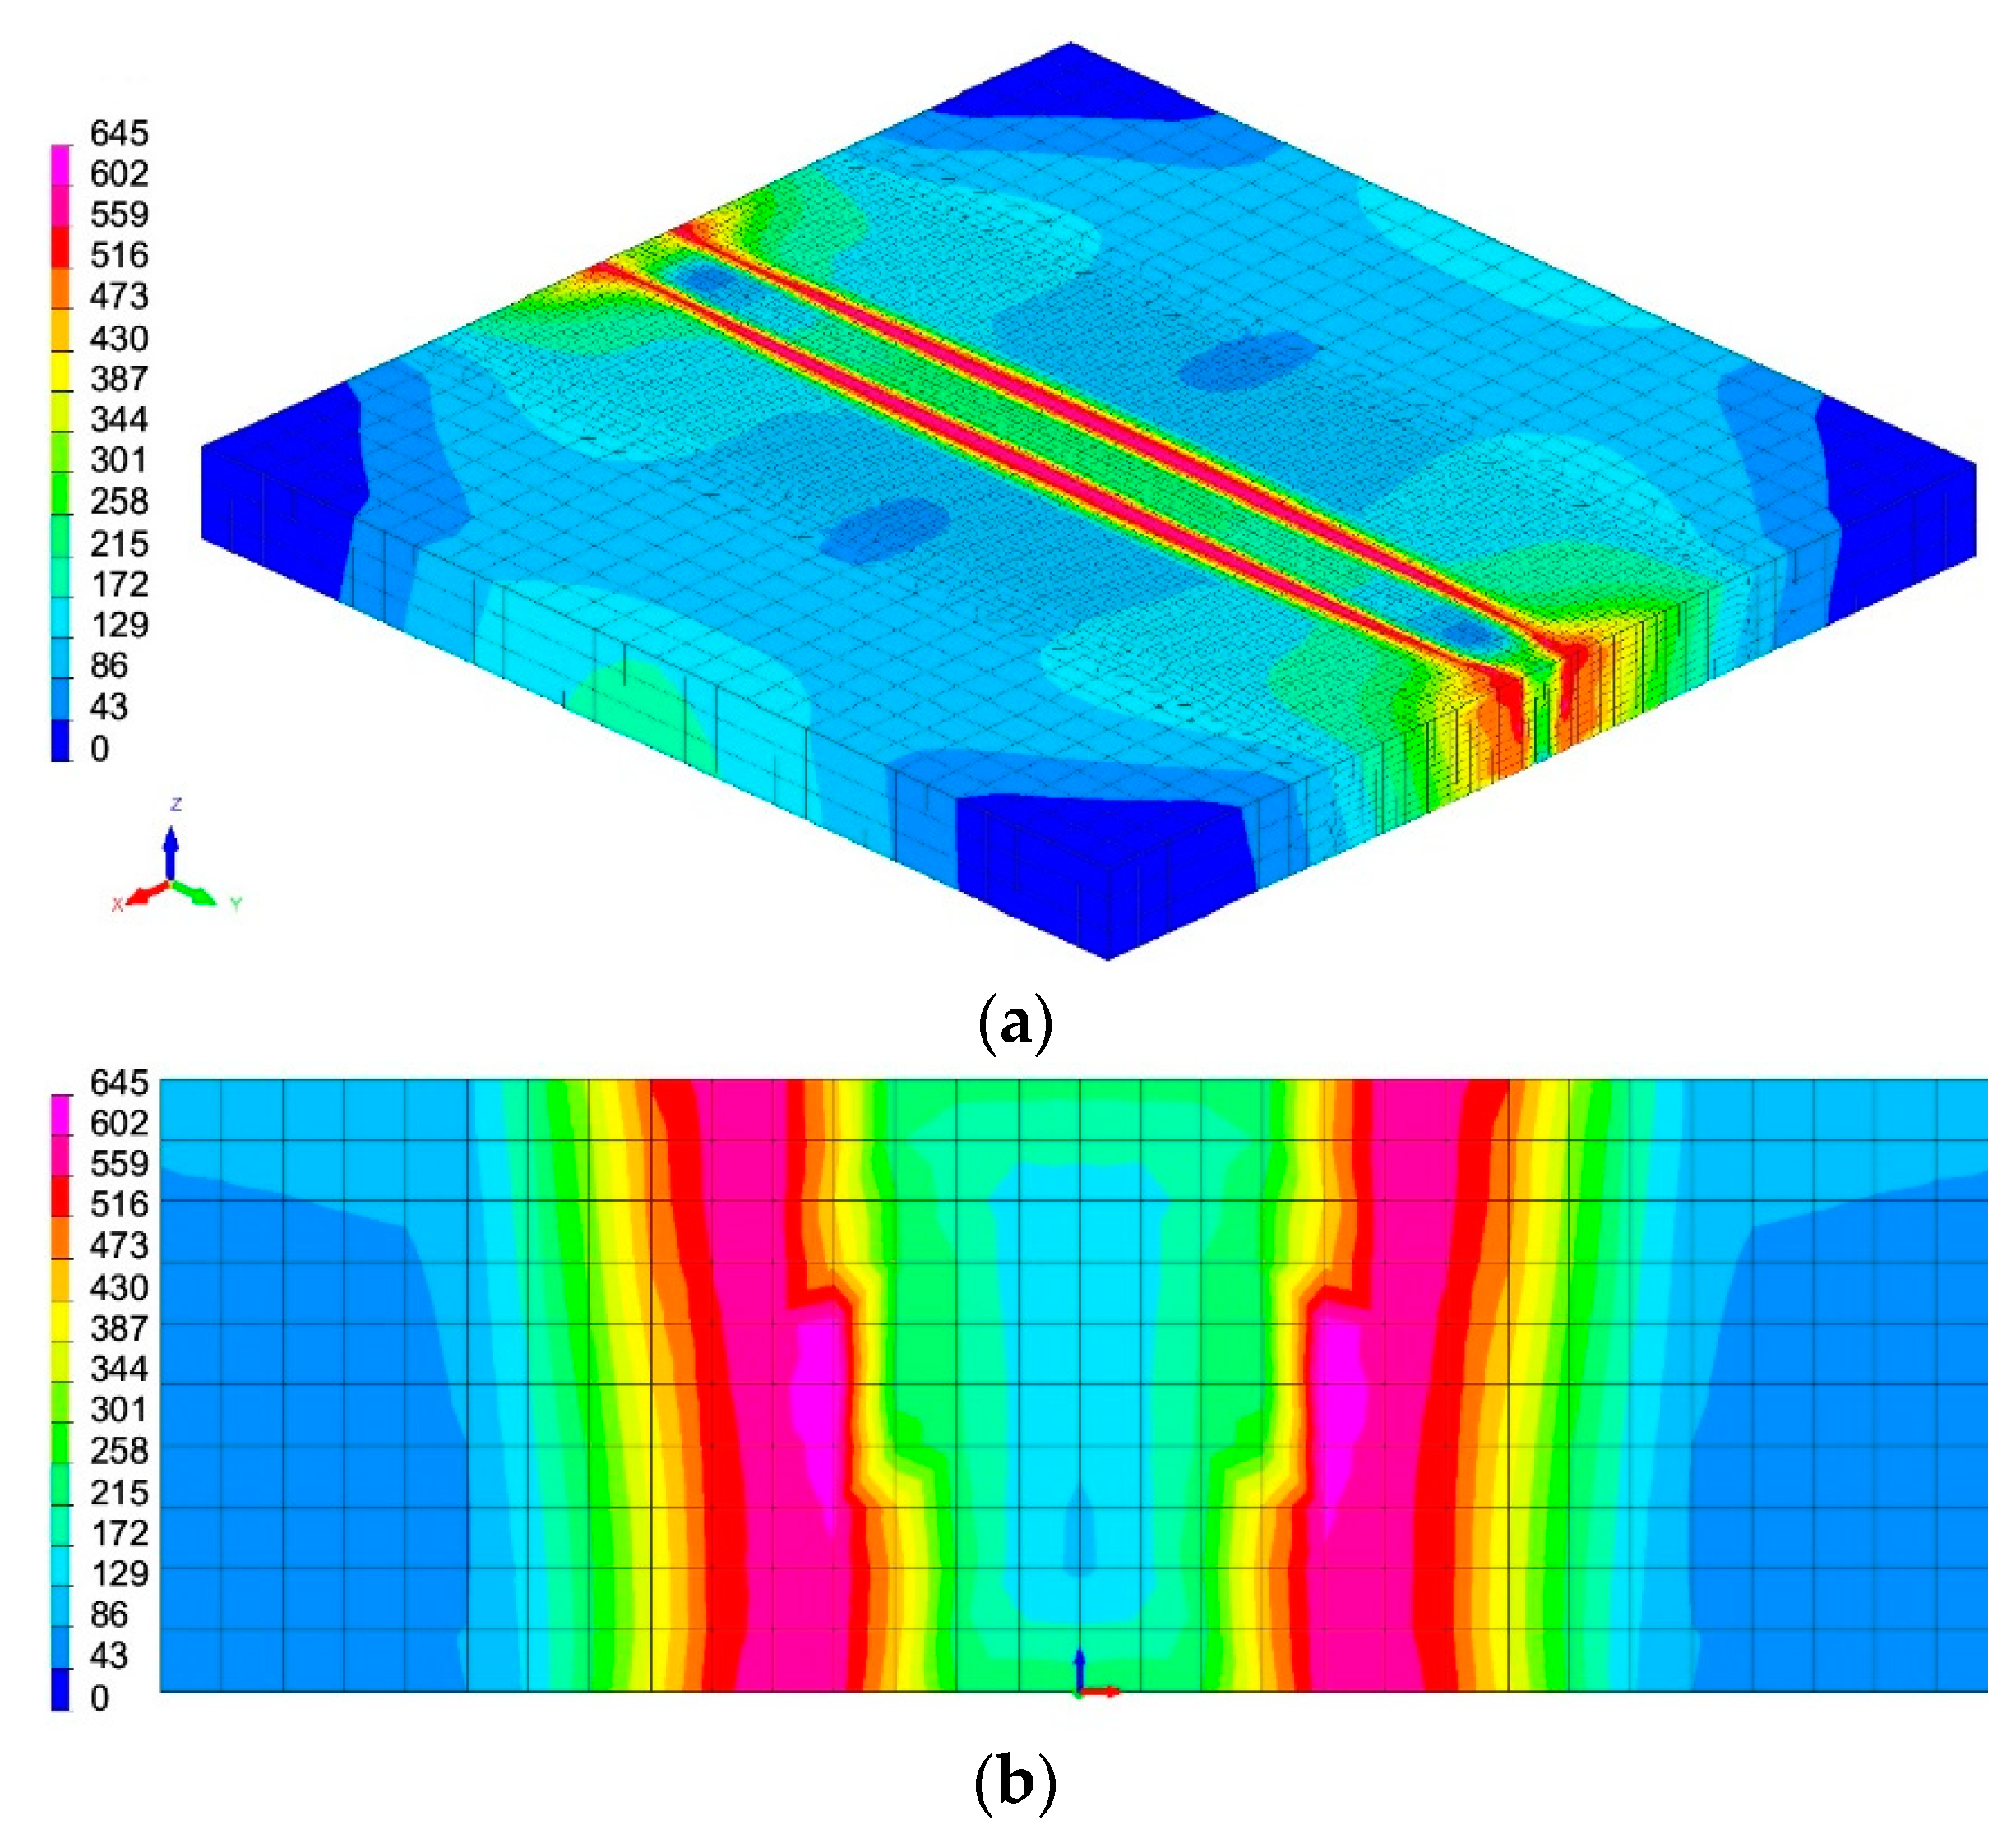
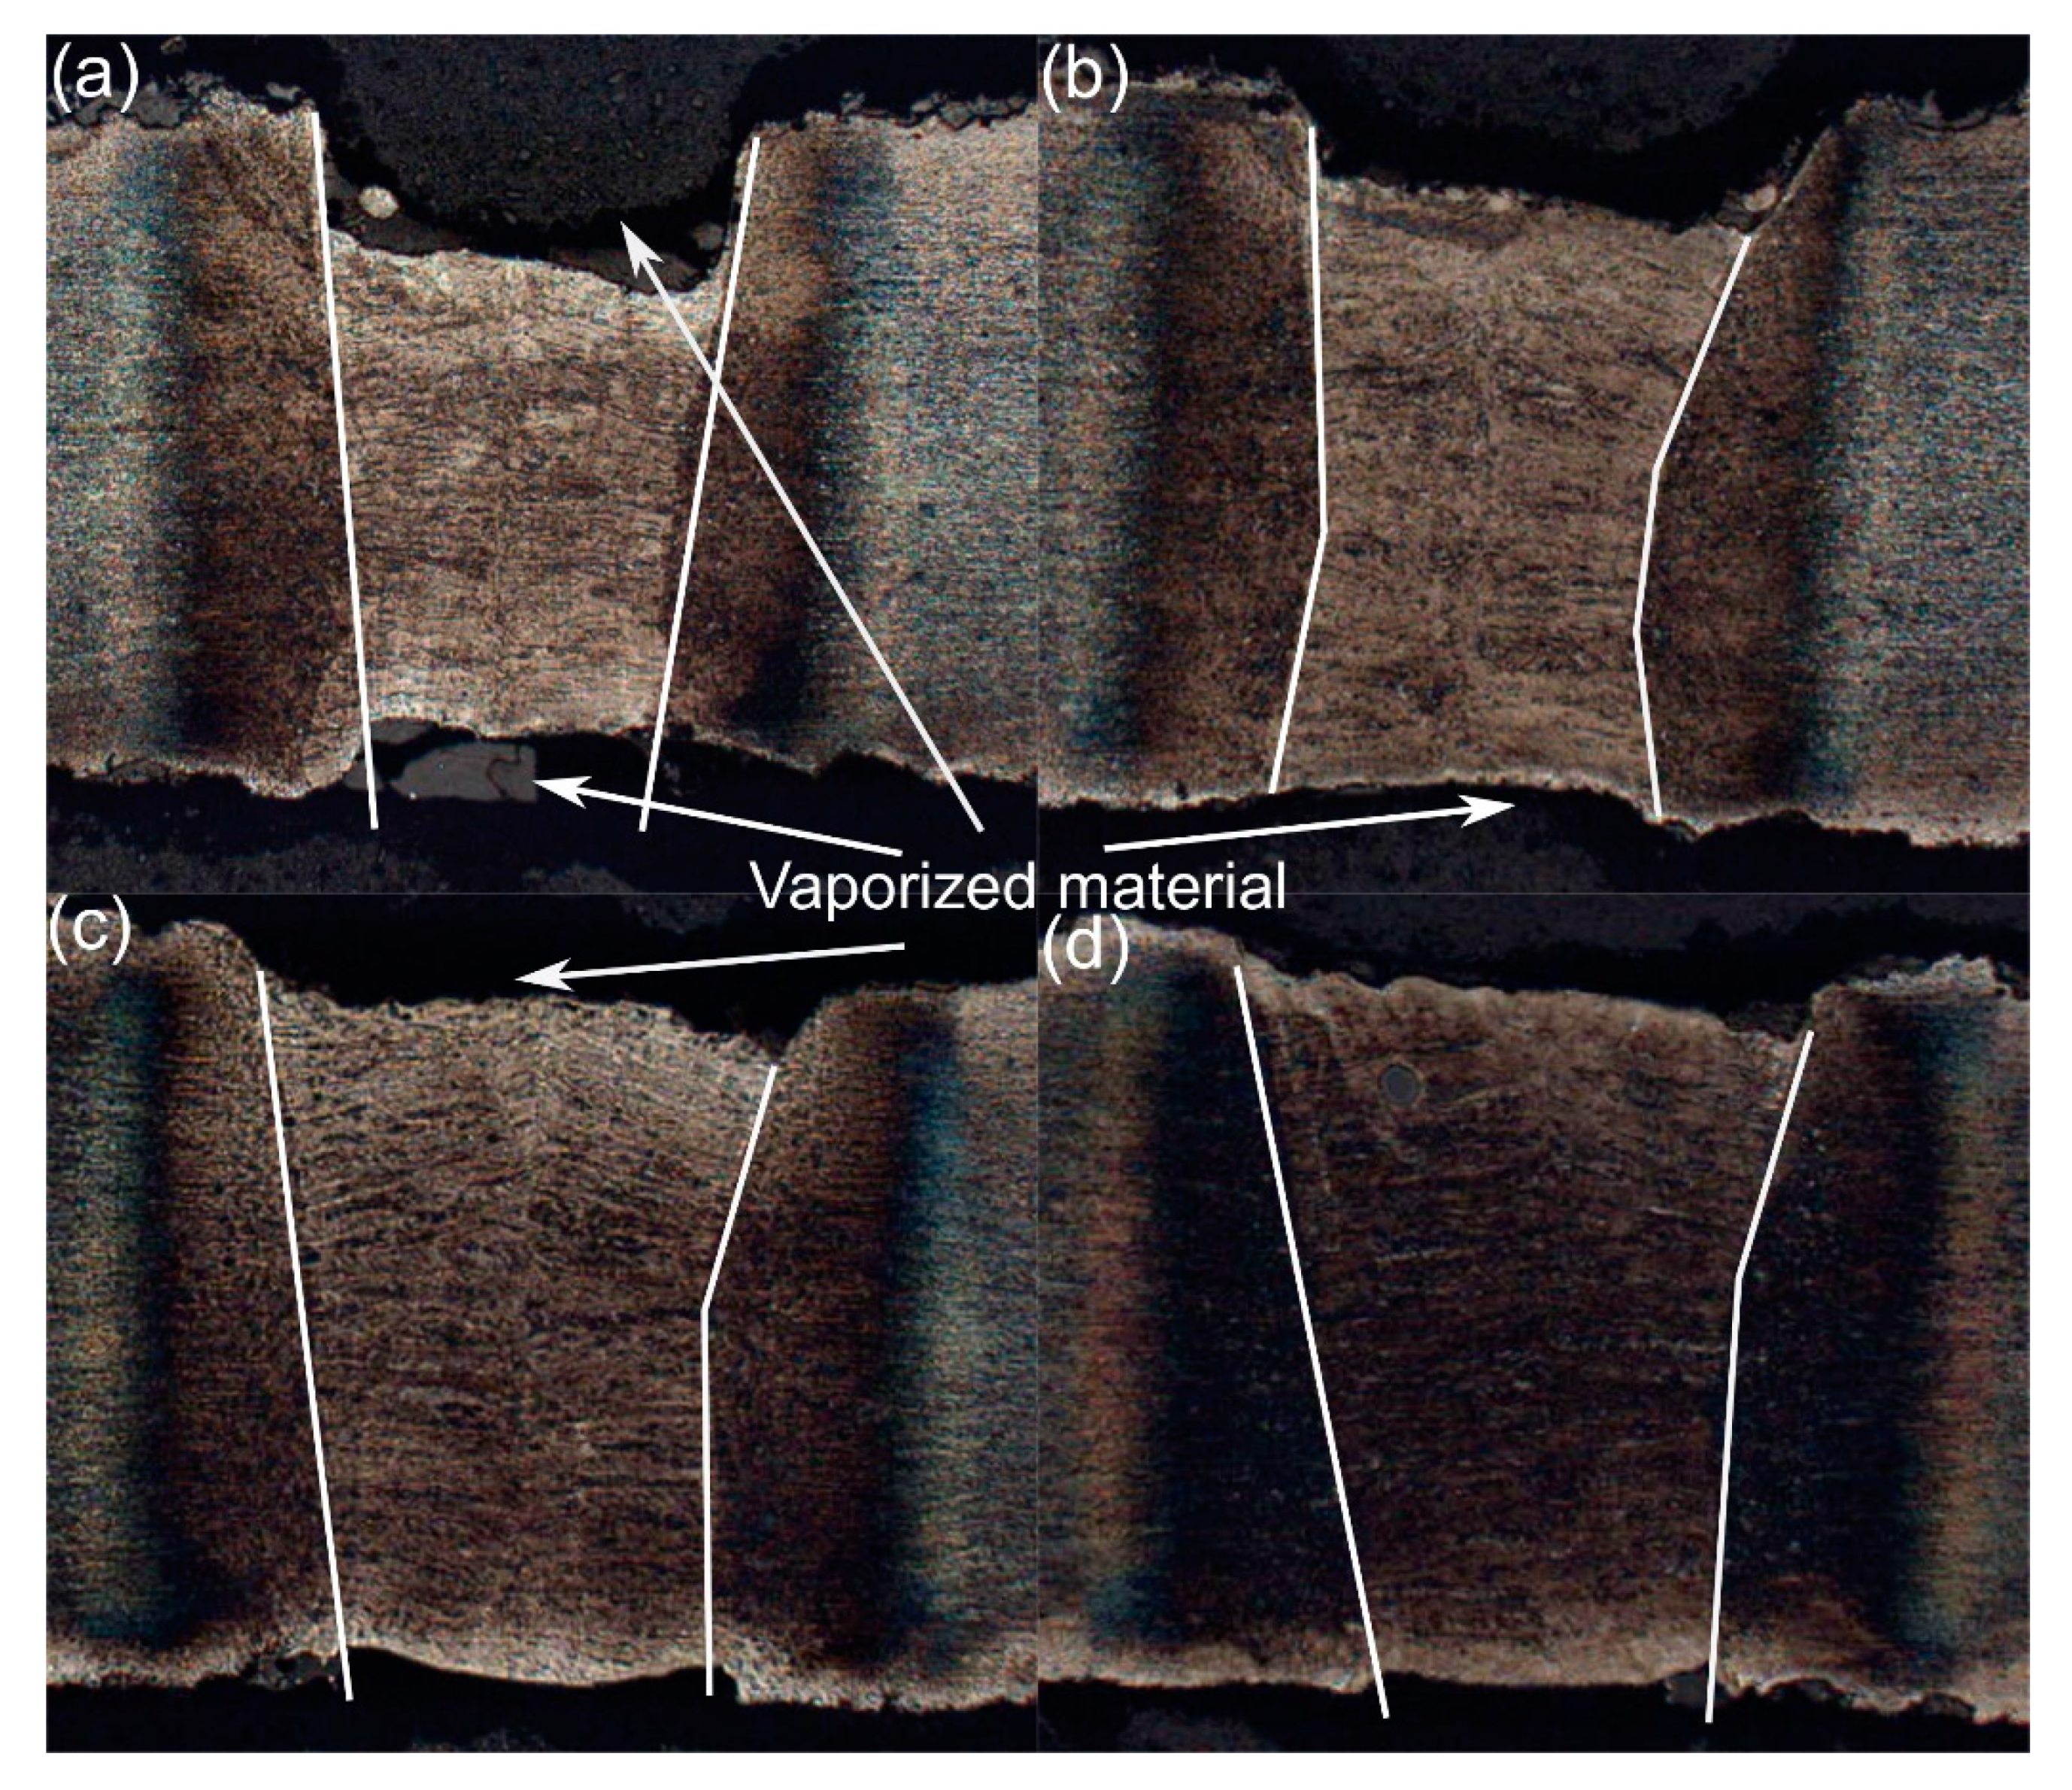
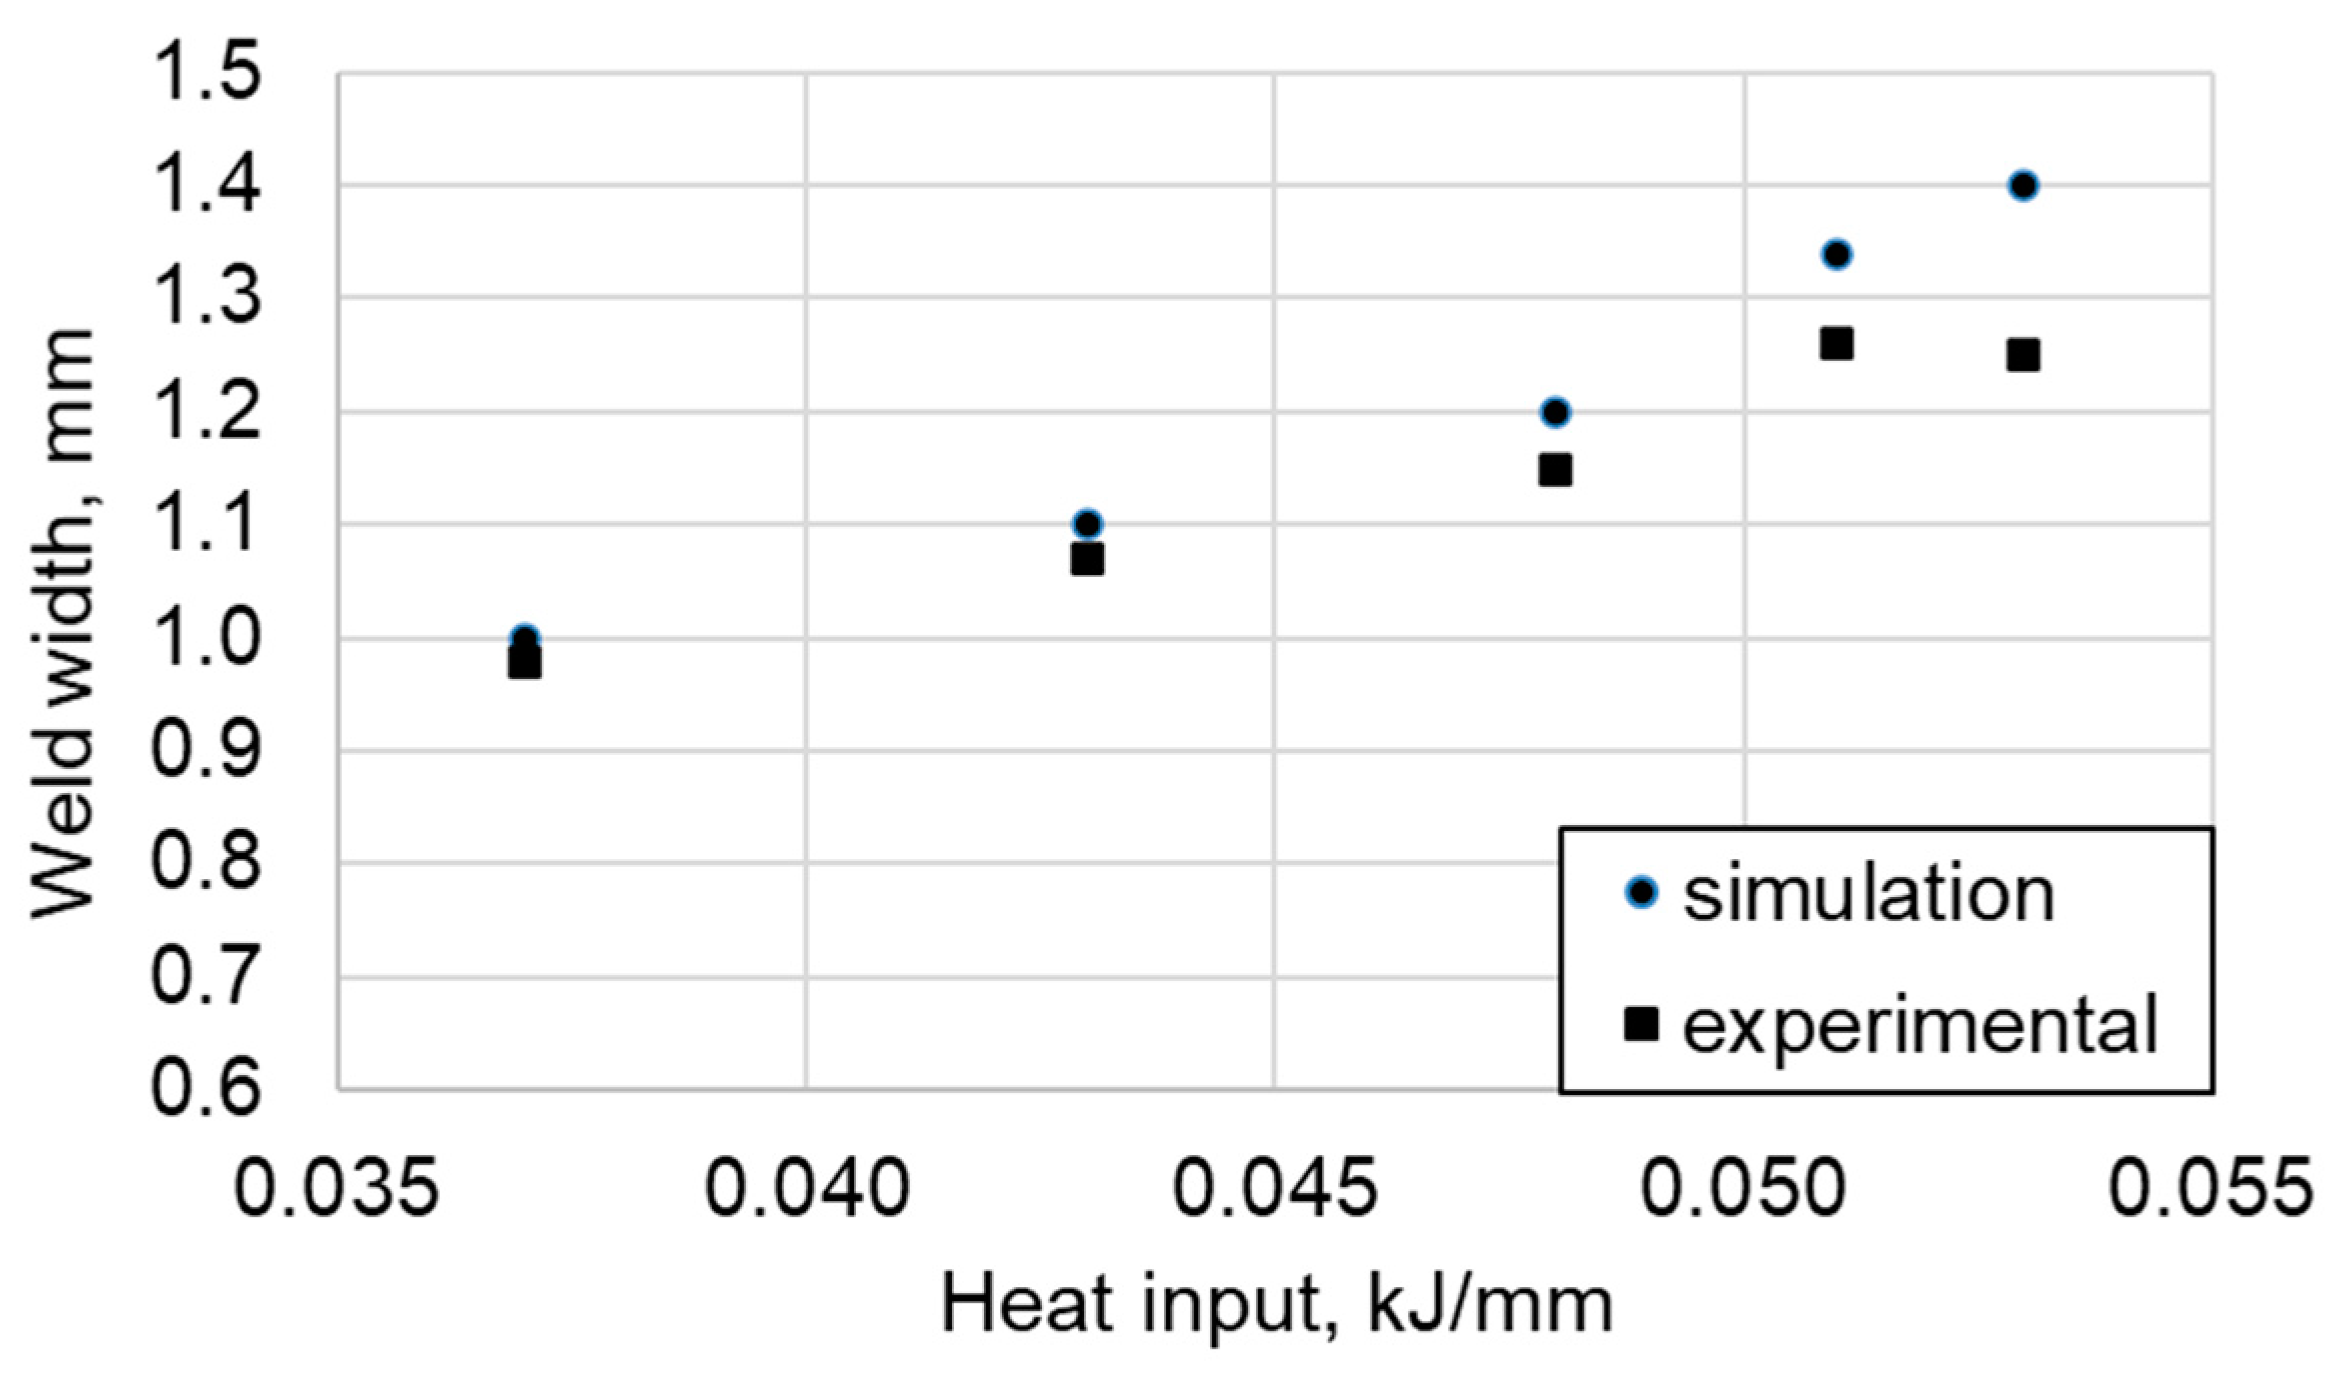
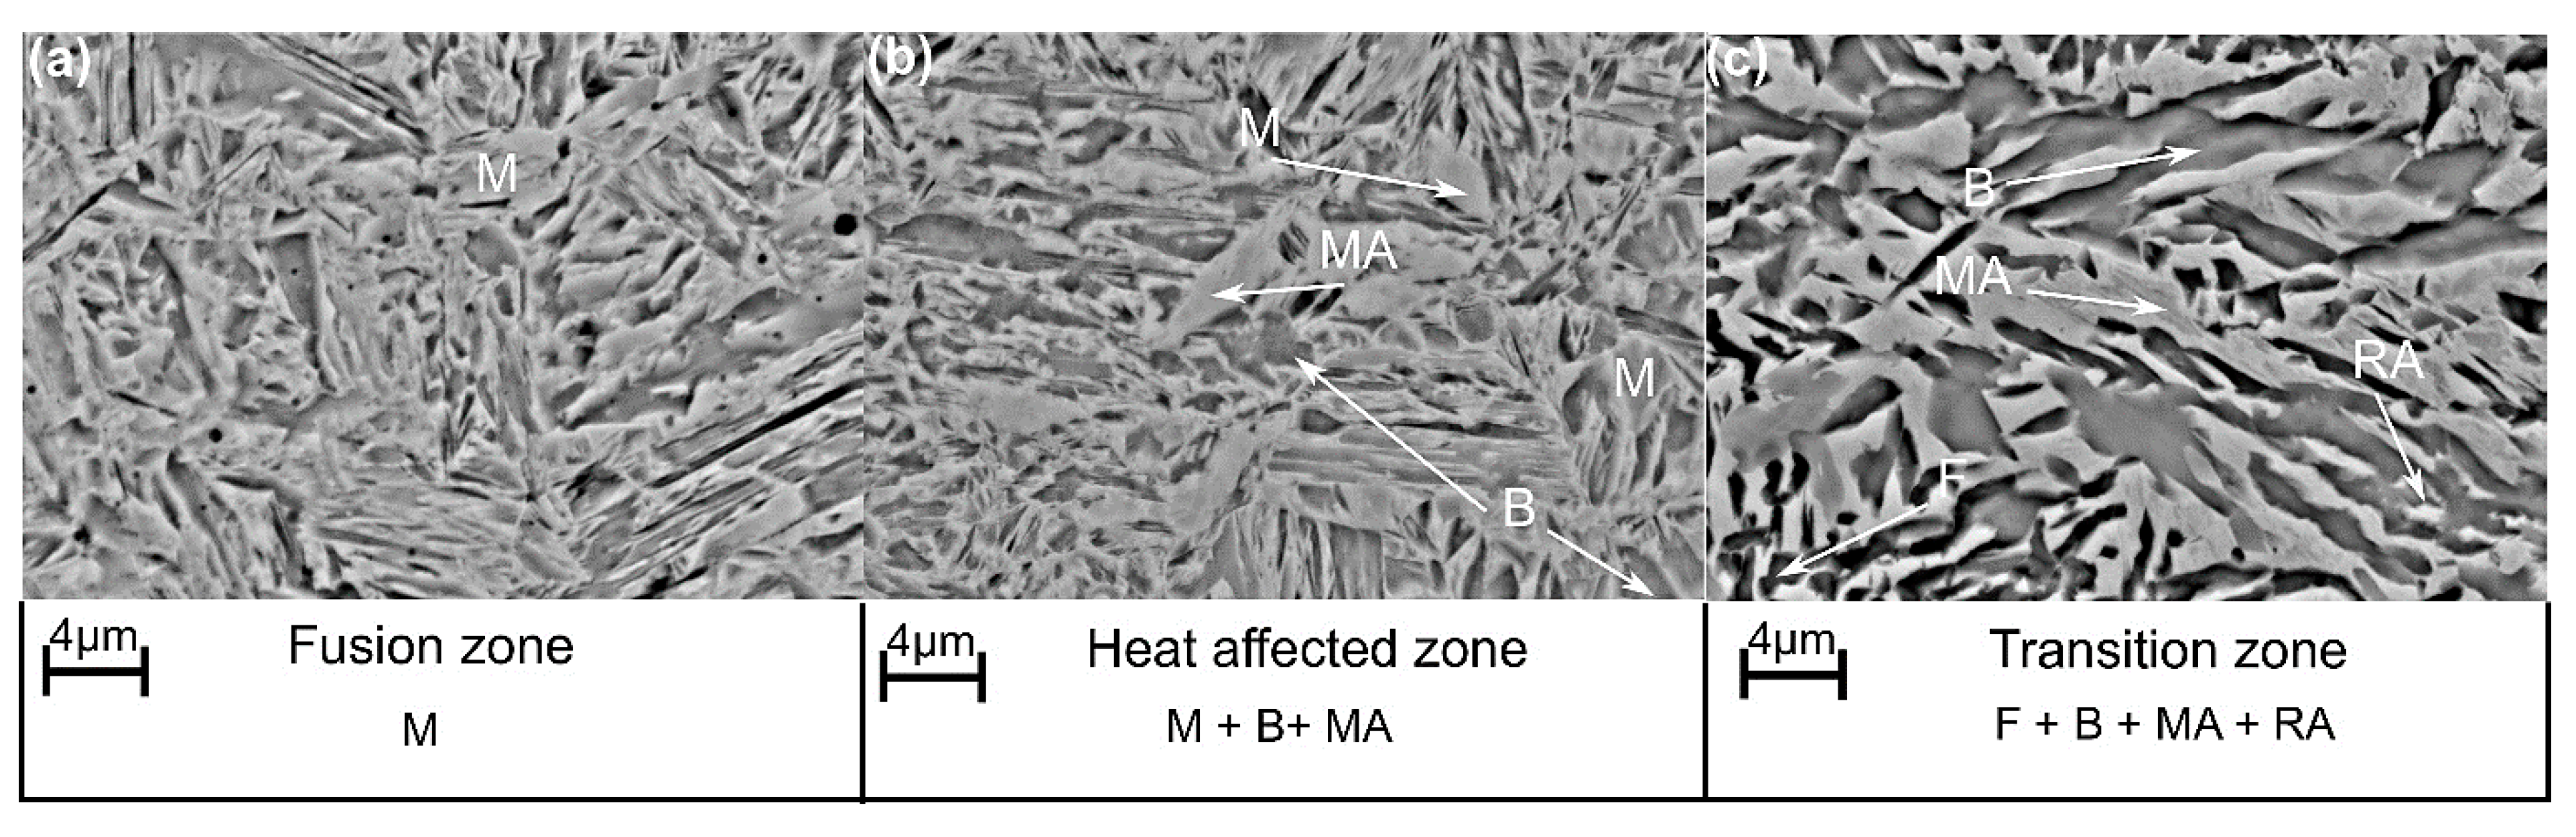
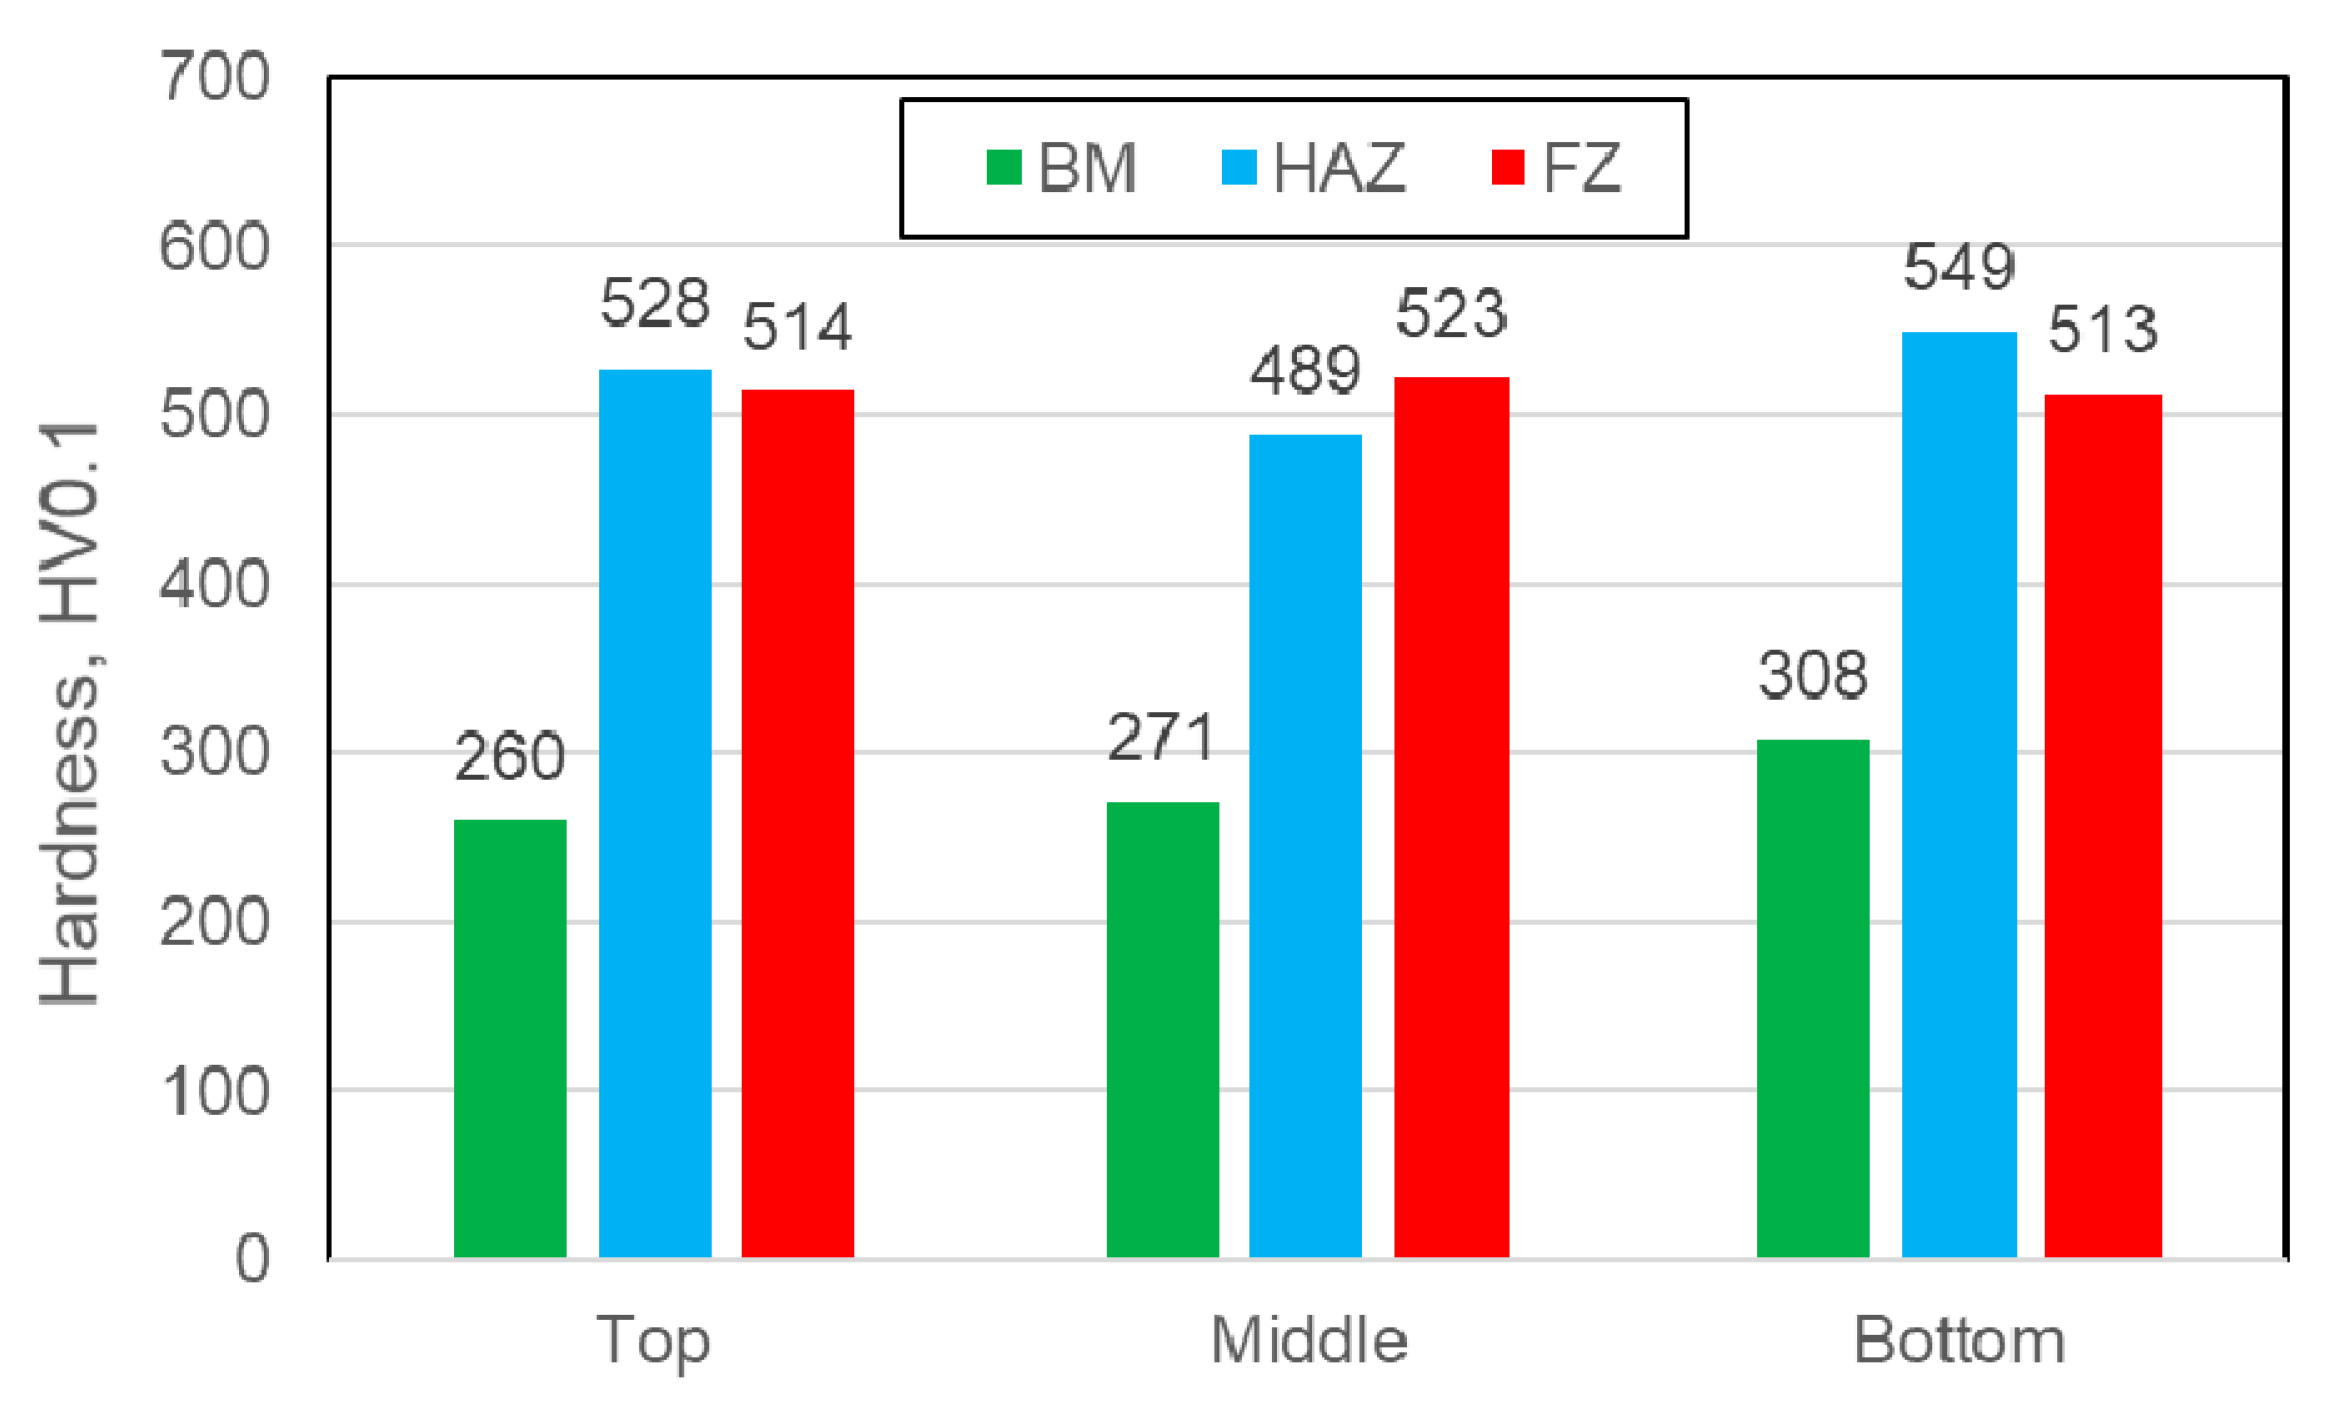
3.3. Experimental Results of Laser Welding

The macrographs of the welds are presented in Figure 10. It can be seen that the macrostructures are of columnar shape formed in the direction of the fastest cooling rate. Some asymmetry of the welds can be seen due to the dynamic nature of the process.
Figure 10 shows that some material was evaporated from the top and bottom parts of the weld. This is the result of the very high speed of heating and very high temperature of the process. According to He et al. [12], the vaporization of the material is due to very high temperatures occurring in it. The high temperature, together with the presence of iron that is the dominant vaporizing elements, result in the missing material. It can be seen that the evaporation of the steel occurs at top part of the weld especially in case of variant 1 (Figure 10a), which is characterized by the lowest welding speed. Even at a lower beam power, the welding speed has a big influence on the evaporation of the metal. When the welding speed was increased, the amount of evaporated material was lower. This is visible for the rest of the welding variants (Figure 10b–d). They show the evaporation too; however, it is not as big, as in case of the variant 1. According to Grajcar et al. [32], the vaporizing of material during laser welding is increased in case of steels containing Mn, Si and Al. As the steel contains the mentioned elements, the evaporation of the metal is stronger. This situation results in the decrease of mechanical properties of the obtained TRIP steel welds [33]. The geometry of the welds was also analyzed. The width of the weld increases together with increasing heat input values, as presented in Figure 11. For lower heat inputs, the width of the weld in its central part is similar comparing to the simulations. However, for the higher heat inputs a small misfit can be seen. For the highest heat input, it reaches ~8%.
Analyzing the microstructures of selected welds, the 3 areas could be distinguished in the weld (Figure 12). The central part, which is the fusion zone (FZ), next is the heat-affected zone (HAZ) and then the transition zone (TZ). It is the same for all the welding variants.
In all cases, the FZ is composed of mixture of lath and block martensite (Figure 12a) because of high cooling rate during the welding. As presented in the CCT diagram, the cooling rate of ~5 °C/s is enough to ensure fully martensite structure in the FZ. According to the thermal profiles, the cooling rates were more than enough to quench the material in the FZ. The heat-affected zone is composed of the mixture of martensite and small amount of bainite (Figure 12b). The martensite has a regular shape and smooth surface. However, the martensitic-austenitic islands (MA) can be of blocky-type or lath-type morphology. This structural constituent is a result of the martensitic transformation limited only to the central part of the initial austenite grain. This provides smooth grains at their edges and textured grains in the central part (martensite). The darker grains, which are located lower (more etched) compared to the martensite, are bainite [5,6,7]. When the welding speed is increased, the microstructure of the HAZ is more refined. This is due to shorter time of the temperature influence on the weld. Faster welding rates provide shorter exposition at high temperatures on the microstructure during welding (lower heat input). The same conclusion was made by Li et al. [34]. They analyzed the influence of the heat input on a grain size of the HAZ. They found that the higher heat input results in a larger grain size of the HAZ. This prevents the growth of the phases in the microstructure [35]. The transition zone (Figure 12c) is characterized by the presence of retained austenite in the microstructure, confirmed also in our earlier work [36]. The temperature in this zone, according to the simulation presented in Figure 9, is slightly higher than Ac3 from the HAZ site, and much lower than the Ac1 near the BM. This indicates that depending on a part of the weld nor or some retained austenite should be present in the microstructure. The material near the HAZ, where the temperature is higher than Ac3, should be composed mostly of martensite. The closer to the base material, the lower is the temperature of TZ. At some point it will be in an intercritical region, where the austenite and ferrite are present. In this region it is possible to stabilize the austenite to room temperature. Finally, near the BM the temperature is lower than Ac1; therefore, no changes in the microstructure should occur. The microstructure of this zone is composed of ferrite, bainite, retained austenite and martensitic-austenitic islands (MA). The formation of ferrite and bainite is the result of lower austenite thermal stability [37]. As the temperature is close to Ac3, the austenite cannot be significantly enriched in carbon. During the process of ferrite and bainite formation, the excess carbon goes into the austenite increasing its thermal stability. Moreover, the higher contents of Si and Al in the steel prevent the formation of cementite, that further stabilizes the austenite [38]. This results in martensitic transformation in the central point of the austenite grains. These results are in accordance with the simulations of martensite distribution in the welds (Figure 4). The highest amount of martensite is in the FZ, and it decreases in the HAZ and the TZ gradually.
After the microstructure analysis, it can be seen that there is some discrepancy between the cooling profiles, JMatPro simulations, and real microstructures. According to the simulations (CCT and TTT diagrams), the whole weld should be composed of martensite. This could be from the overestimated temperatures during welding simulations. However, it may also be due to the fact that during welding the FZ is melted and the microstructure is formed from the liquid metal. The other reason is that the JMatPro software does not take into account changes in a chemical composition of the phases. In TRIP steels, the change in the carbon concentration of the phases has a big influence on the shape of the CCT and TTT diagrams [39]. Therefore, during the welding carbon diffusion occurred and a carbon concentration of the austenite was continuously changing.
The results are proven by the hardness measurements (Figure 13). According to the results, the highest hardness is in the FZ. The lath martensite microstructure results in the maximum hardness of 523 HV for the welding with the linear energies of 0.053 kJ/mm. The obtained hardness is lower compared to the one obtained (540 HV) from the simulations. At the HAZ the measured hardness is equal to 549, similarly to the simulations. Then, the hardness decreases to around 300 HV, which is the hardness of the base material. The decrease of the hardness from the HAZ to the base material is the result of gradually decreasing martensite fraction.

4. Conclusions

The performed numerical simulations of thermal cycles and phase transformations for the new-developed TRIP steel are in good agreement with the experimental LW results. The shape of the real weld was in good accordance with the simulation predictions. The welds have two symmetrical shapes: typically conical and goblet for the two highest heat inputs. The real welding resulted in some vaporization of the welded material decreasing the quality of the weld.
The amount of martensite is highest in the FZ and decreases in the HAZ. The lowest level of martensite is in the TZ, which also contains some fraction of retained austenite and martensitic-austenitic islands. Some discrepancy is present as the simulated cooling profiles show only martensite in the TZ. The hardness of FZ was 523 HV and increases to 549 HV in the HAZ. The level of hardness is in good agreement with the computational simulations. According to them, the hardness was near the same in the FZ and HAZ. The Von Misses stress analysis showed that the highest stress is present in the HAZ.
The welding-dedicated Sysweld software can be satisfactory used for the welding simulation of high strength multiphase steels. The simulation results are in good agreement with the experimental ones. This approach can be used to determine the welding parameters of TRIP-assisted steels. However, when applying the computational approach, it should be noted that the simulation does not take into account changes in chemical composition of the individual phases, as well as the present database has some limitations in predicting the phase transformation kinetics.

Author Contributions

Conceptualization, M.M., T.K. and A.G.; Data curation, A.G.; Funding acquisition, T.K. and A.G.; Investigation, M.M., T.K., S.S. and M.R.; Methodology, M.M., T.K. and S.S.; Visualization, M.R.; Writing—original draft, M.M. and T.K.; Writing—review and editing, A.G.; All authors have read and agreed to the published version of the manuscript.

Funding

M. Morawiec acknowledges the financial support through the 10/010/BKM22 project, Faculty of Mechanical Engineering, Silesian University of Technology.

Conflicts of Interest

The authors declare no conflict of interest.

References

  1. Suh, W.D.; Kim, S.J. Medium Mn transformation-induced plasticity steels: Recent progress and challenges. Scr. Mater. 2017, 126, 63–67. [Google Scholar] [CrossRef]
  2. Gramlich, A.; Emmrich, R.; Bleck, W. Austenite Reversion Tempering-Annealing of 4 wt.% Manganese Steels for Automotive Forging Application. Metals 2019, 9, 575. [Google Scholar] [CrossRef] [Green Version]
  3. Li, Z.C.; Ding, H.; Misra, R.D.K.; Cai, Z.H. Microstructure-mechanical property relationship and austenite stability in medium-Mn TRIP steels: The effect of austenite-reverted transformation and quenching-tempering treatments. Mater. Sci. Eng. A 2017, 682, 211–219. [Google Scholar] [CrossRef] [Green Version]
  4. Jabłońska, M.B.; Kowalczyk, K. Microstructural aspects of energy absorption of high manganese steels. Procedia Manuf. 2019, 27, 91–97. [Google Scholar] [CrossRef]
  5. Korpała, G.; Hisker, F.; Hammer, B.; Heller, T.; Kawalla, R.; Prahl, U. The influence of hot-rolling conditions on the content and morphology of retained austenite in ultra-high strength bainitic steel and its mechanical properties. Steel Res. Int. 2019, 90, 1800386. [Google Scholar] [CrossRef]
  6. Chen, S.; Cao, Z.; Wang, C.; Huang, C.; Ponge, D.; Cao, W. Effect of volume fraction and mechanical stability of austenite on ductility of medium Mn steel. J. Iron Steel Res. Int. 2019, 26, 1209–1218. [Google Scholar] [CrossRef]
  7. Pereloma, E.V.; Gazder, A.A.; Timokhina, I.B. Addressing Retained Austenite Stability in Advanced High Strength Steels. Mater. Sci. Forum 2013, 738–739, 212–216. [Google Scholar] [CrossRef] [Green Version]
  8. Sun, B.; Fazeli, F.; Scott, C.; Guo, B.; Aranas, C., Jr.; Chu, X.; Jahazi, M.; Yue, S. Microstructural characteristics and tensile behavior of medium manganese steels with different manganese additions. Mater. Sci. Eng. A 2018, 729, 496–507. [Google Scholar] [CrossRef]
  9. Gronostajski, Z.; Pater, Z.; Madej, L.; Gontarz, A.; Lisiecki, L.; Lukaszek-Solek, A.; Łuksza, J.; Mróz, S.; Muskalski, Z.; Muzykiewicz, W.; et al. Recent development trends in metal forming. Arch. Civ. Mech. Eng. 2019, 19, 898–941. [Google Scholar] [CrossRef]
  10. Hu, B.; Cheng, G.J.; Wei, H.; Ming, Y.; Huang, X.; Luo, H.W. Super-high-strength and formable medium Mn steel manufactured by warm rolling process. Acta Mater. 2019, 174, 131–141. [Google Scholar] [CrossRef]
  11. Zhang, W.; Tao, W.; Yang, S. Mechanical properties and fracture behaviors in remote laser spot welding of quenching and partitioning 980 steel. Opt. Laser Technol. 2021, 140, 107053. [Google Scholar] [CrossRef]
  12. He, X.; DebRoy, T.; Fuerschbach, P.W. Alloying element vaporization during laser spot welding of stainless steel. J. Phys. D Appl. Phys. 2003, 36, 3079–3088. [Google Scholar] [CrossRef]
  13. Górka, J. Assessment of the Effect of Laser Welding on the Properties and Structure of TMCP Steel Butt Joints. Materials 2020, 13, 1312. [Google Scholar] [CrossRef] [PubMed] [Green Version]
  14. Lisiecki, A.; Ślizak, D. Hybrid Laser Deposition of Fe-Based Metallic Powder under Cryogenic Conditions. Metals 2020, 10, 190. [Google Scholar] [CrossRef] [Green Version]
  15. Rahul, K.S.; Venkateshwara, R.T.; Natu, H.; Girish, H.N.; Ishigaki, T.; Madhusudan, P. An investigation on laser welding parameters on the strength of TRIP steel. J. Mech. Eng. 2021, 67, 45–52. [Google Scholar] [CrossRef]
  16. Han, T.K.; Park, S.S.; Kim, K.H.; Kang, C.Y.; Woo, I.S.; Lee, J.B. CO2 Laser Welding Characteristics of 800 MPa Class TRIP Steel. ISIJ Int. 2005, 45, 60–65. [Google Scholar] [CrossRef] [Green Version]
  17. Xia, M.; Tian, Z.; Zhao, L.; Zhou, Y.N. Metallurgical and Mechanical Properties of Fusion Zones of TRIP Steels in Laser Welding. ISIJ Int. 2008, 48, 483–488. [Google Scholar] [CrossRef] [Green Version]
  18. Vaněk, M.; Slováček, M.; Tejc, J.; Moravec, J.; Kik, T. Numerical simulation of welding processes and their validation. In Proceedings of the 3rd Organizers South-East European Welding Congress “Welding and Joining Technologies for a Sustainable Development and Environment”, Timişoara, Romania, 3–4 June 2015. [Google Scholar]
  19. Kong, F.; Ma, J.; Kovacevic, R. Numerical and experimental study of thermally induced residual stress in the hybrid laser-GMA welding process. J. Mater. Processing Technol. 2011, 211, 1102–1111. [Google Scholar] [CrossRef]
  20. Mičian, M.; Harmaniak, D.; Nový, F.; Winczek, J.; Moravec, J.; Trško, L. Effect of the t8/5 Cooling Time on the Properties of S960MC Steel in the HAZ of Welded Joints Evaluated by Thermal Physical Simulation. Metals 2020, 10, 229. [Google Scholar] [CrossRef] [Green Version]
  21. Kuppuswamy, N.; Schmidt, R.; Seeger, F.; Zhang, S. Finite element modeling of impact strength of laser welds for automotive applications. WIT Trans. Built Environ. 2007, 94, 10. [Google Scholar] [CrossRef] [Green Version]
  22. Youmin, R.; Jiajun, X.; Yu, H.; Guojun, Z. Review on finite element analysis of welding deformation and residual stress. Sci. Technol. Weld. Join. 2017, 23, 1–11. [Google Scholar]
  23. Kik, T.; Gorka, J.; Kotarska, A.; Poloczek, T. Numerical Verification of Tests on the Influence of the Imposed Thermal Cy-cles on the Structure and Properties of the S700MC Heat-Affected Zone. Metals 2020, 10, 974. [Google Scholar] [CrossRef]
  24. Sajek, A. Welding Thermal Cycles of Joints Made of S1100QL Steel by Saw and Hybrid Plasma-Mag Processes. Adv. Mater. Sci. 2020, 20, 75–86. [Google Scholar] [CrossRef]
  25. Sajek, A. Application of FEM simulation method in area of the dynamics of cooling AHSS steel with a complex hybrid welding process. Weld. World 2019, 63, 1065–1073. [Google Scholar] [CrossRef] [Green Version]
  26. He, X. Finite Element Analysis of Laser Welding: A State of Art Review. Mater. Manuf. Process. 2012, 27, 1354–1365. [Google Scholar] [CrossRef]
  27. Tuz, L. Determination of the causes of low service life of the air fan impeller made of high-strength steel. Eng. Fail. Anal. 2021, 127, 105502. [Google Scholar] [CrossRef]
  28. Sente Software Ltd. A Collection of Free Downloadable Papers on the Development and Application of JMatPro. 2005. Available online: http://www.sentesoftware.co.uk/biblio.html (accessed on 1 February 2022).
  29. Grajcar, A.; Rozanski, M.; Stano, S.; Kowalski, A.; Grzegorczyk, B. Effect of Heat Input on Microstructure and Hardness Distribution of Laser Welded Si-Al TRIP-Type Steel. Adv. Mater. Sci. Eng. 2014, 2014, 658947. [Google Scholar] [CrossRef] [Green Version]
  30. Song, Y.; Wang, Y.; Zhang, M. Experimental and Numerical Simulation on Laser welding of High Manganese TWIP980 Steel. Procedia Manuf. 2019, 37, 385–393. [Google Scholar] [CrossRef]
  31. Kik, T.; Moravec, J.; Švec, M. Experiments and Numerical Simulations of the Annealing Temperature Influence on the Residual Stresses Level in S700MC Steel Welded Elements. Materials 2020, 13, 5289. [Google Scholar] [CrossRef]
  32. Grajcar, A.; Różański, M.; Kamińska, M.; Grzegorczyk, B. Effect of gas atmosphere on the non-metallic inclusions in laser-welded TRIP steel with Al and Si additions. Mater. Technol. 2016, 50, 945–950. [Google Scholar] [CrossRef]
  33. Zhang, W.; Yang, S.; Lin, Z.; Tao, W. Weld morphology and mechanical properties in laser spot welding of quenching and partitioning 980 steel. J. Manuf. Process. 2020, 56, 1136–1145. [Google Scholar] [CrossRef]
  34. Li, L.; Chai, M.; Li, Y.; Bai, W.; Duan, Q. Effect of Welding Heat Input on Grain Size and Microstructure of 316L Stainless Steel Welded Joint. Appl. Mech. Mater. 2013, 331, 578–582. [Google Scholar] [CrossRef]
  35. Quazi, M.M.; Ishak, M.; Fazal, M.A.; Arslan, A.; Rubaiee, S.; Qaban, A.; Aiman, M.H.; Sultan, T.; Ali, M.M.; Manladan, S.M. Current research and developments status of dissimilar materials laser welding of titanium and its alloys. Opt. Laser Technol. 2020, 126, 106090. [Google Scholar] [CrossRef]
  36. Grajcar, A.; Grzegorczyk, B.; Rozanski, M.; Stano, S.; Morawiec, M. Microstructural Aspects of Bifocal Laser Welding of Trip Steels. Arch. Met. Mater. 2017, 62, 611–618. [Google Scholar] [CrossRef] [Green Version]
  37. Timokhina, I.B.; Hodghson, P.D.; Pereloma, E.V. Effect of alloying elements on the microstructure-property relationship in thermomechanically processed C-Mn-Si TRIP steels. Steel Res. 2002, 73, 274–279. [Google Scholar] [CrossRef]
  38. Traint, S.; Pichler, A.; Sierlinger, R.; Pauli, H.; Werner, E.A. Low-alloyed TRIP-Steels with Optimized Strength, Forming and Welding Properties. Steel Res. 2006, 77, 641–649. [Google Scholar] [CrossRef]
  39. Suzuki, H.; Kobayashi, T.; Takamura, K.; Nakata, T.; Kasugi, T. Effects of carbon on continuous cooling transformation behavior and heat treatment characteristic of flake graphite cast iron. J. Jpn. Foundry Eng. Soc. 2007, 79, 579–586. [Google Scholar]
Figure 1. Numerical model of laser welding in Sysweld: (a) 3D solid mesh of TRIP steel sheet 2.0 mm thick butt joint, (b) volumetric 3D conical moving heat source model, (c) standard clamping conditions.
Symmetry 14 00477 g001
Figure 2. Molten pool shape comparisons for the variants listed in Table 1.
Symmetry 14 00477 g002
Figure 3. Molten pool shape comparisons in the longitudinal direction for the variants listed in Table 1.
Symmetry 14 00477 g003
Figure 4. Martensite distribution comparison on the weld cross section (in the middle of the weld length) for the variants listed in Table 1.
Symmetry 14 00477 g004
Figure 5. Predictions of the hardness changes at the cross section of the variant 3 weld: (a) hardness lines on the model cross section and (b) the symmetrical hardness distribution at upper, middle, and bottom parts of the weld.
Symmetry 14 00477 g005
Figure 6. Von Mises stress distribution in weld no. 3 at (a) the top surface of the model and (b) the cross section in the middle length of welded joint.
Symmetry 14 00477 g006
Figure 7. Analysis of the welding thermal cycles at different parts of weld no. 3: (a) welding model with measurement points marked, (b) calculated thermal cycles at different parts of the weld.
Symmetry 14 00477 g007
Figure 8. The JMatPro calculations of analyzed steel.
Symmetry 14 00477 g008
Figure 9. The evolution of the phases as a function of cooling rate.
Symmetry 14 00477 g009
Figure 10. Macrographs of the selected welds after laser welding: (a) variant 1, (b) variant 3, (c) variant 6, (d) variant 7.
Symmetry 14 00477 g010
Figure 11. The weld width comparison between the simulation and the experiment.
Symmetry 14 00477 g011
Figure 12. Scanning electron microstructures of variant 3 weld at: (a) fusion zone, (b) heat affected zone, (c) transition zone; M—martensite, B—bainite, MA—martensitic-austenitic constituents, RA—retained austenite.
Symmetry 14 00477 g012
Figure 13. Hardness measurements of the variant 3 weld at its top, middle and bottom parts.
Symmetry 14 00477 g013
Table 1. Welding parameters used in the simulation.
Variant No.123456
Beam power, kW234444
Welding speed, mm/s41.758.37583.391.7100
Heat input, kJ/mm0.0480.0510.0530.0480.0430.037
Table 2. Maximum temperatures and cooling rates at various parts of the model weld.
Measuring PointMax.
Temperature, °C
Higher than
Ac1
The
Temperature
after 1 s, °C
ΔT, °CCooling Rate, °C/s
13600Yes40032003200
23600Yes40032003200
31950Yes40015501550
4880Yes400480480
5550No400150150
Publisher’s Note: MDPI stays neutral with regard to jurisdictional claims in published maps and institutional affiliations.

