Article

Spontaneous Symmetry Breaking: The Case of Crazy Clock and Beyond

1
Center for Catalysis and Chemical Engineering, Institute of Chemistry, Technology and Metallurgy, University of Belgrade, Njegoševa 12, 11000 Belgrade, Serbia
2
Faculty of Physical Chemistry, University of Belgrade, Studentski Trg 12, 11158 Belgrade, Serbia
3
Center for Photonics, Institute of Physics, University of Belgrade, Pregrevica 118, 11080 Belgrade, Serbia
4
Department of Physics & Namur Institute of Structured Matter (NISM), University of Namur, Rue de Bruxelles 61, 5000 Namur, Belgium
5
School of Physics, University of Exeter, Stocker Road, Exeter EX4 4QL, UK
6
Department of Chemistry, Molecular Imaging and Photonics, KU Leuven, 3001 Heverlee, Belgium
7
Department of Physics & Namur Institute of Structured Matter (NISM) & Namur Institute for Complex Systems (naXys), University of Namur, Rue de Bruxelles 61, 5000 Namur, Belgium
8
Micro- and Nanophotonic Materials Group, University of Mons, Place du Parc 20, 7000 Mons, Belgium
*
Authors to whom correspondence should be addressed.
Symmetry 2022, 14(2), 413; https://doi.org/10.3390/sym14020413
Submission received: 10 January 2022 / Revised: 10 February 2022 / Accepted: 14 February 2022 / Published: 19 February 2022
(This article belongs to the Special Issue Symmetry in Many-Body Physics)

Abstract

:
In this work, we describe the crazy-clock phenomenon involving the state I (low iodide and iodine concentration) to state II (high iodide and iodine concentration with new iodine phase) transition after a Briggs–Rauscher (BR) oscillatory process. While the BR crazy-clock phenomenon is known, this is the first time that crazy-clock behavior is linked and explained with the symmetry-breaking phenomenon, highlighting the entire process in a novel way. The presented phenomenon has been thoroughly investigated by running more than 60 experiments, and evaluated by using statistical cluster K-means analysis. The mixing rate, as well as the magnetic bar shape and dimensions, have a strong influence on the transition appearance. Although the transition for both mixing and no-mixing conditions are taking place completely randomly, by using statistical cluster analysis we obtain different numbers of clusters (showing the time-domains where the transition is more likely to occur). In the case of stirring, clusters are more compact and separated, revealed new hidden details regarding the chemical dynamics of nonlinear processes. The significance of the presented results is beyond oscillatory reaction kinetics since the described example belongs to the small class of chemical systems that shows intrinsic randomness in their response and it might be considered as a real example of a classical liquid random number generator.

1. Introduction

The presence of symmetry around us inspired many scientists to search for beauty, harmony, order, and regularity in nature and her fundamental laws [1,2]. Additionally, phase transitions with and without spontaneously broken symmetries are widespread concepts through different areas of physics and physical chemistry. The applications of spontaneously broken symmetries cover a wide range of condensed matter science topics, such as superconductivity, super-fluidity, Bose–Einstein condensation, nucleation physics, self-assembly processes, morphogenesis, and chemical kinetics. In this account, we describe spontaneous symmetry breaking in the case of the nonlinear Briggs–Rauscher reaction. We highlight the importance of symmetry breaking, in non-equilibrium and pattern formation processes, which is of vital meaning to the understanding of the morphogenesis process and for applications in several areas of biomimetics and nanoscience.
The Briggs–Rauscher (BR) [3] reaction is a hybrid oscillating reaction formed by coupling two chemical oscillators, Bray–Liebhafsky [4,5] and Belousov–Zhabotinskii [6]. Since its discovery in 1973, the Briggs–Rauscher oscillating reaction has been one of the most investigated oscillatory systems. It is probably due to its simplicity and exciting colour alternation caused by changes in reaction kinetics (when starch is used as an indicator) [7].
BR reaction typically occurs within mixtures of H2O2, H2SO4, and KIO3. Additionally, Mn(II) ions are added as a metal catalyst and malonic acid (H2MA) as an organic substrate. Substitutions of chemicals are possible; different acids, organic substrates, and ions, such as Ce(III) instead of Mn(II) catalyst, can be used to generate BR oscillations [7,8,9,10]. However, the oscillatory behavior is not the only one that attracted the attention of non-linear scientists in the Briggs–Rauscher reaction [11,12,13,14,15].
Indeed, as described elsewhere [16], after the well-controlled initial oscillatory behavior, the reaction becomes chaotic. Depending on the initial conditions, particularly on the ratio [H2MA]0/[IO3]0 [16,17], the reaction exhibits a sudden and unpredictable phase transition. This transition, from state I (low concentration of iodide and iodine) to state II (high concentration of iodide and iodine), happens randomly in practice, as the time spent by the system in the state I is irreproducible (see Figure 1). The transition is characterized by a “sharp and sudden” increase of iodine and iodide concentration, followed by the formation of solid iodine. The observed stochastic feature, called a crazy clock (due to the unpredictable time needed to provoke the transition), is linked to imperfect mixing that affects convection and diffusion dynamics. The imperfect mixing results in extremely complicated phenomena, which occur on multiple length and time scales [18]. Possible kinetical consequences are the appearance of bifurcation, chaos, intermittent behavior, and symmetry-breaking [18,19]. In the experiments of our previous paper [16], the mixing was stopped after an intensive homogenization (stirring at 900 rpm) of the Briggs–Rauscher solution in the oscillatory period. Herein, the experiments carried out with or without specific mixing were maintained all the time. Additionally, we apply the statistical cluster K-means analysis for the first time, by processing more than 60 experiments. Therefore, this paper further studies the mixing effects in connection to the crazy-clock phenomenon in the Briggs–Rauscher oscillatory reaction. It compares and processes statistically more than #60 experiments obtained under identical initial concentrations of all reactants. Although the BR crazy-clock phenomenon was previously detected [16], this behavior is linked for the first time to symmetry-breaking, highlighting the entire process in a novel way. Furthermore, the investigated crazy clock exhibits a truly random behavior that might be considered as an example of a classical, liquid random number generator. Additionally, the investigated system also belongs to the particular class of classical systems that shows intrinsic randomness in their response (as also observed in colloid particles placed on an oscillating surface) [20,21].

2. Materials and Methods

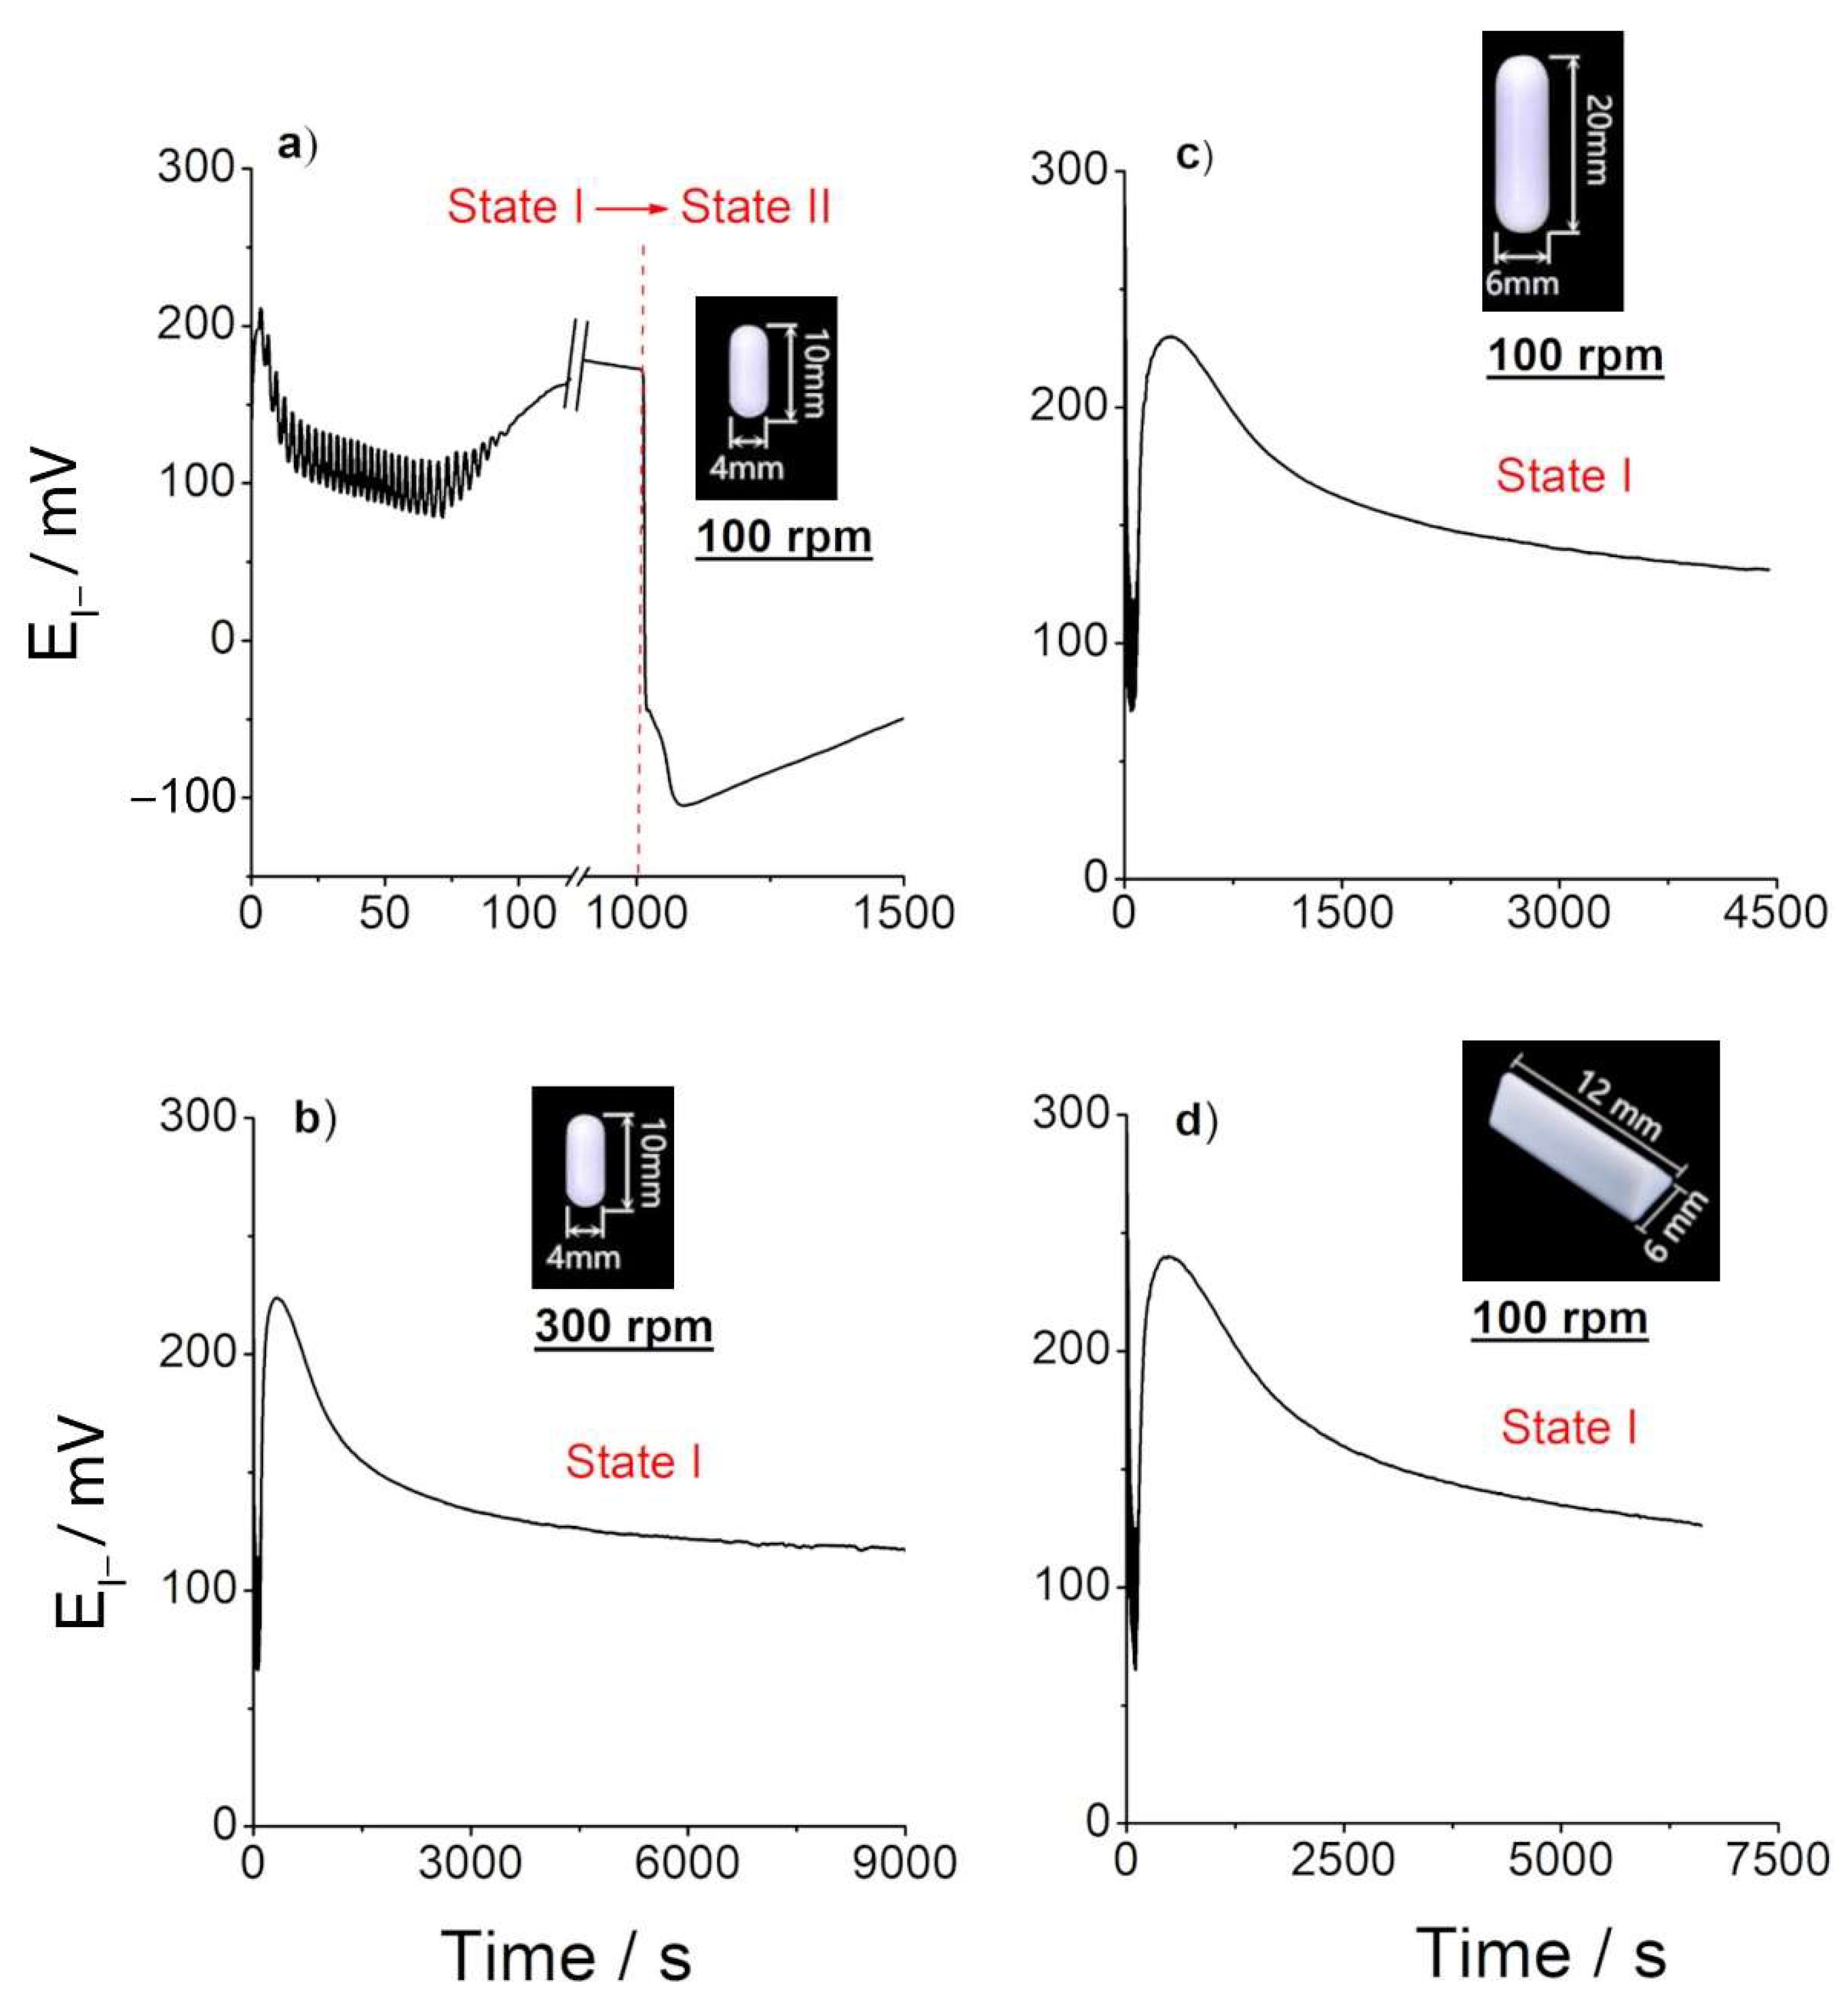
2.1. Briggs–Rauscher Experimental Setup

Since the time of the transition between state I and II is unpredictable, great attention must be paid to the experimental procedure. Only analytically graded reagents without further purification were used for preparing the solutions. Malonic acid was obtained from Acrōs Organics (Geel, Belgium), manganese sulphate from Fluka (Buchs, Switzerland), perchloric acid, potassium iodate, and hydrogen peroxide from Merck (Darmstadt, Germany). The solutions were prepared in deionized water with specific resistance 18 MΩ/cm (Milli-Q, Millipore, Bedford, MA, USA).
All experiments were done in a container not protected from light. Reactions were monitored electrochemically (unless specified in the text). An I-ion-sensitive electrode (Metrohm 6.0502.160) was used as the working electrode and an Ag/AgCl electrode (Metrohm 6.0726.100), as the reference. During the experiments, the temperature of the reaction container was regulated by a circulating thermostat (JULABO GmbH, Seelbach, Germany) and maintained constant at 37 °C. The reaction mixture was stirred by magnetic stirrer (Ingenieurbüro, M. Zipperrer GmbH, Cat-ECM5, Staufen, Denmark).
Five independent series of measurements were carried (they differed in stirring bar size and shape, as well as mixing rate) with the identical solution composition [H2MA]0 = 0.0789 mol/dm3, [MnSO4]0 = 0.00752 mol/dm3, [HClO4]0 = 0.03 mol/dm3, [KIO3]0 = 0.0752 mol/dm3 and [H2O2]0 = 1.176 mol/dm3 in 25 mL volume:
(1)
without mixing (number of conducted experiments #30);
(2)
with mixing 100 rpm using cylindrical stirring bar 10 mm length, 4 mm diameter (BRAND magnetic stirring bar, PTFE-coated cylindrical), (number of conducted experiments #30);
(3)
with mixing 300 rpm using cylindrical stirring bar 10 mm length, 4 mm diameter (BRAND magnetic stirring bar, PTFE-coated cylindrical), (in triplicate);
(4)
with mixing 100 rpm using cylindrical stirring bar 20 mm length, 6 mm diameter (BRAND magnetic stirring bar, PTFE-coated cylindrical) (in triplicate);
(5)
with mixing 100 rpm using triangular stirring bar 12 mm length, 6 mm diameter (BRAND magnetic stirring bar, PTFE-coated triangular) (in triplicate).

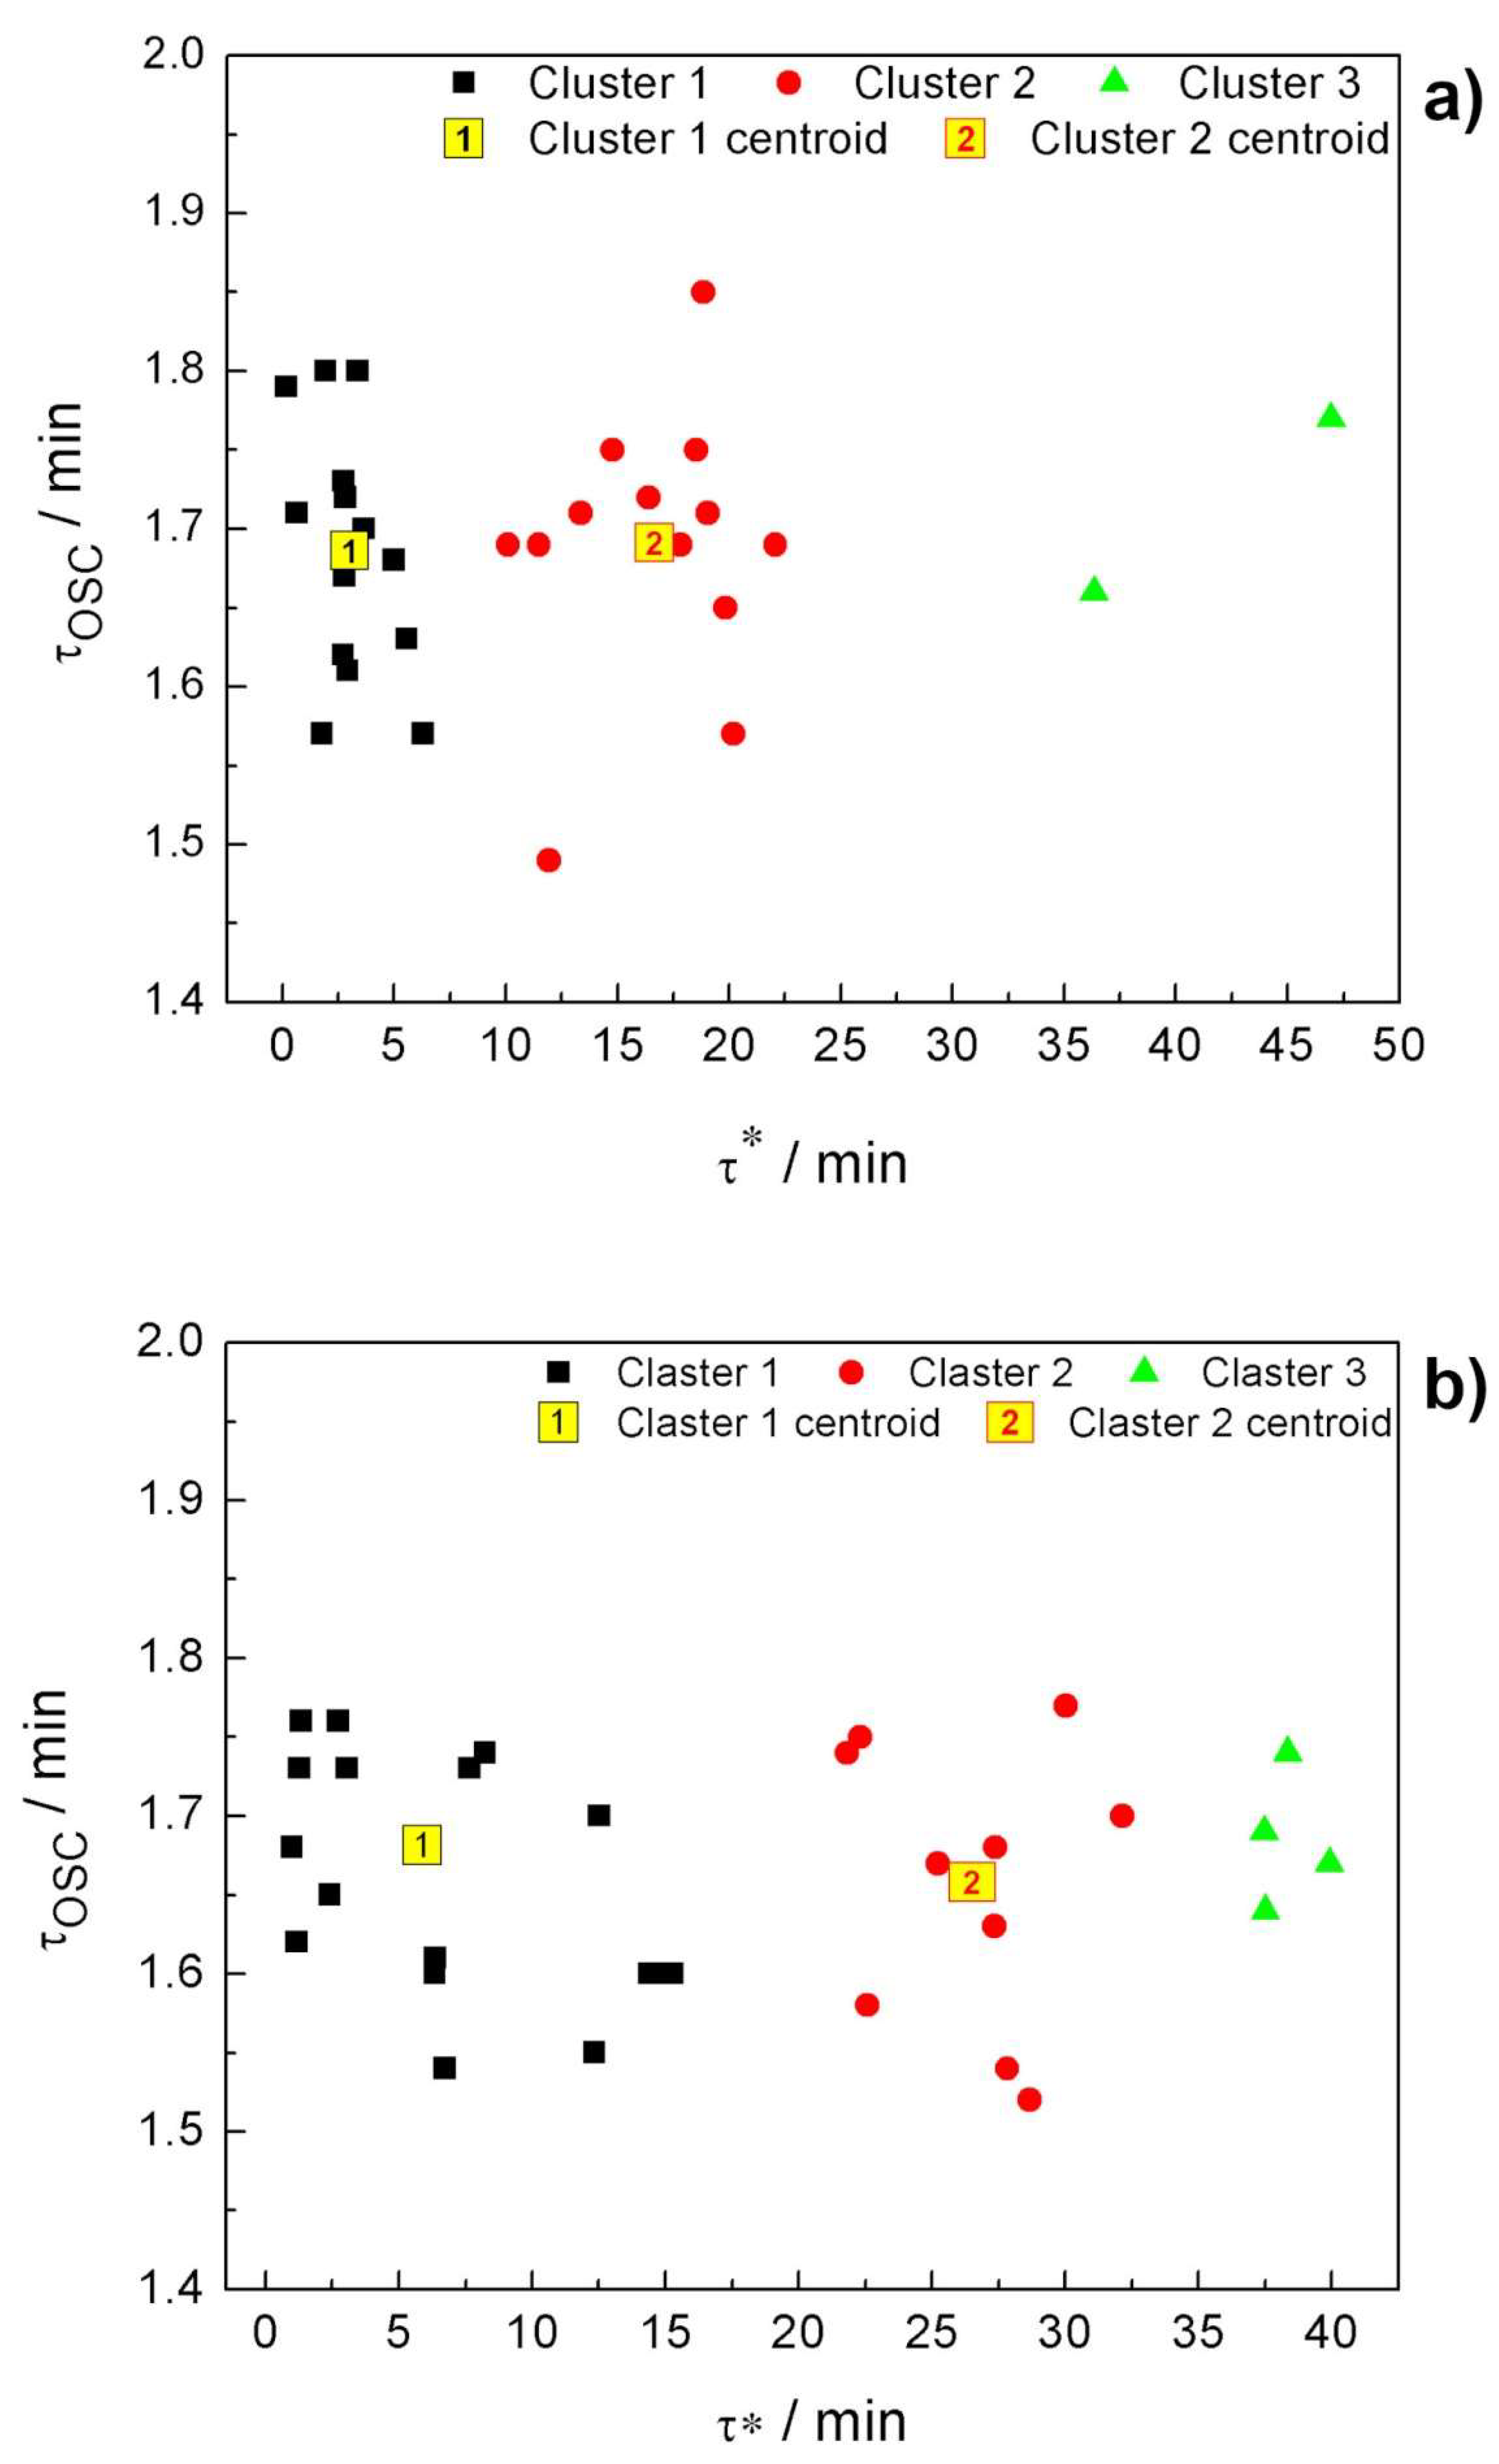
2.2. Statistical Processing and Cluster Analysis

The obtained experimental results were analyzed in the open-source statistic software “R” using “hclust” algorithm for the hierarchical cluster analysis (HCA) [22,23].

3. Results and Discussion

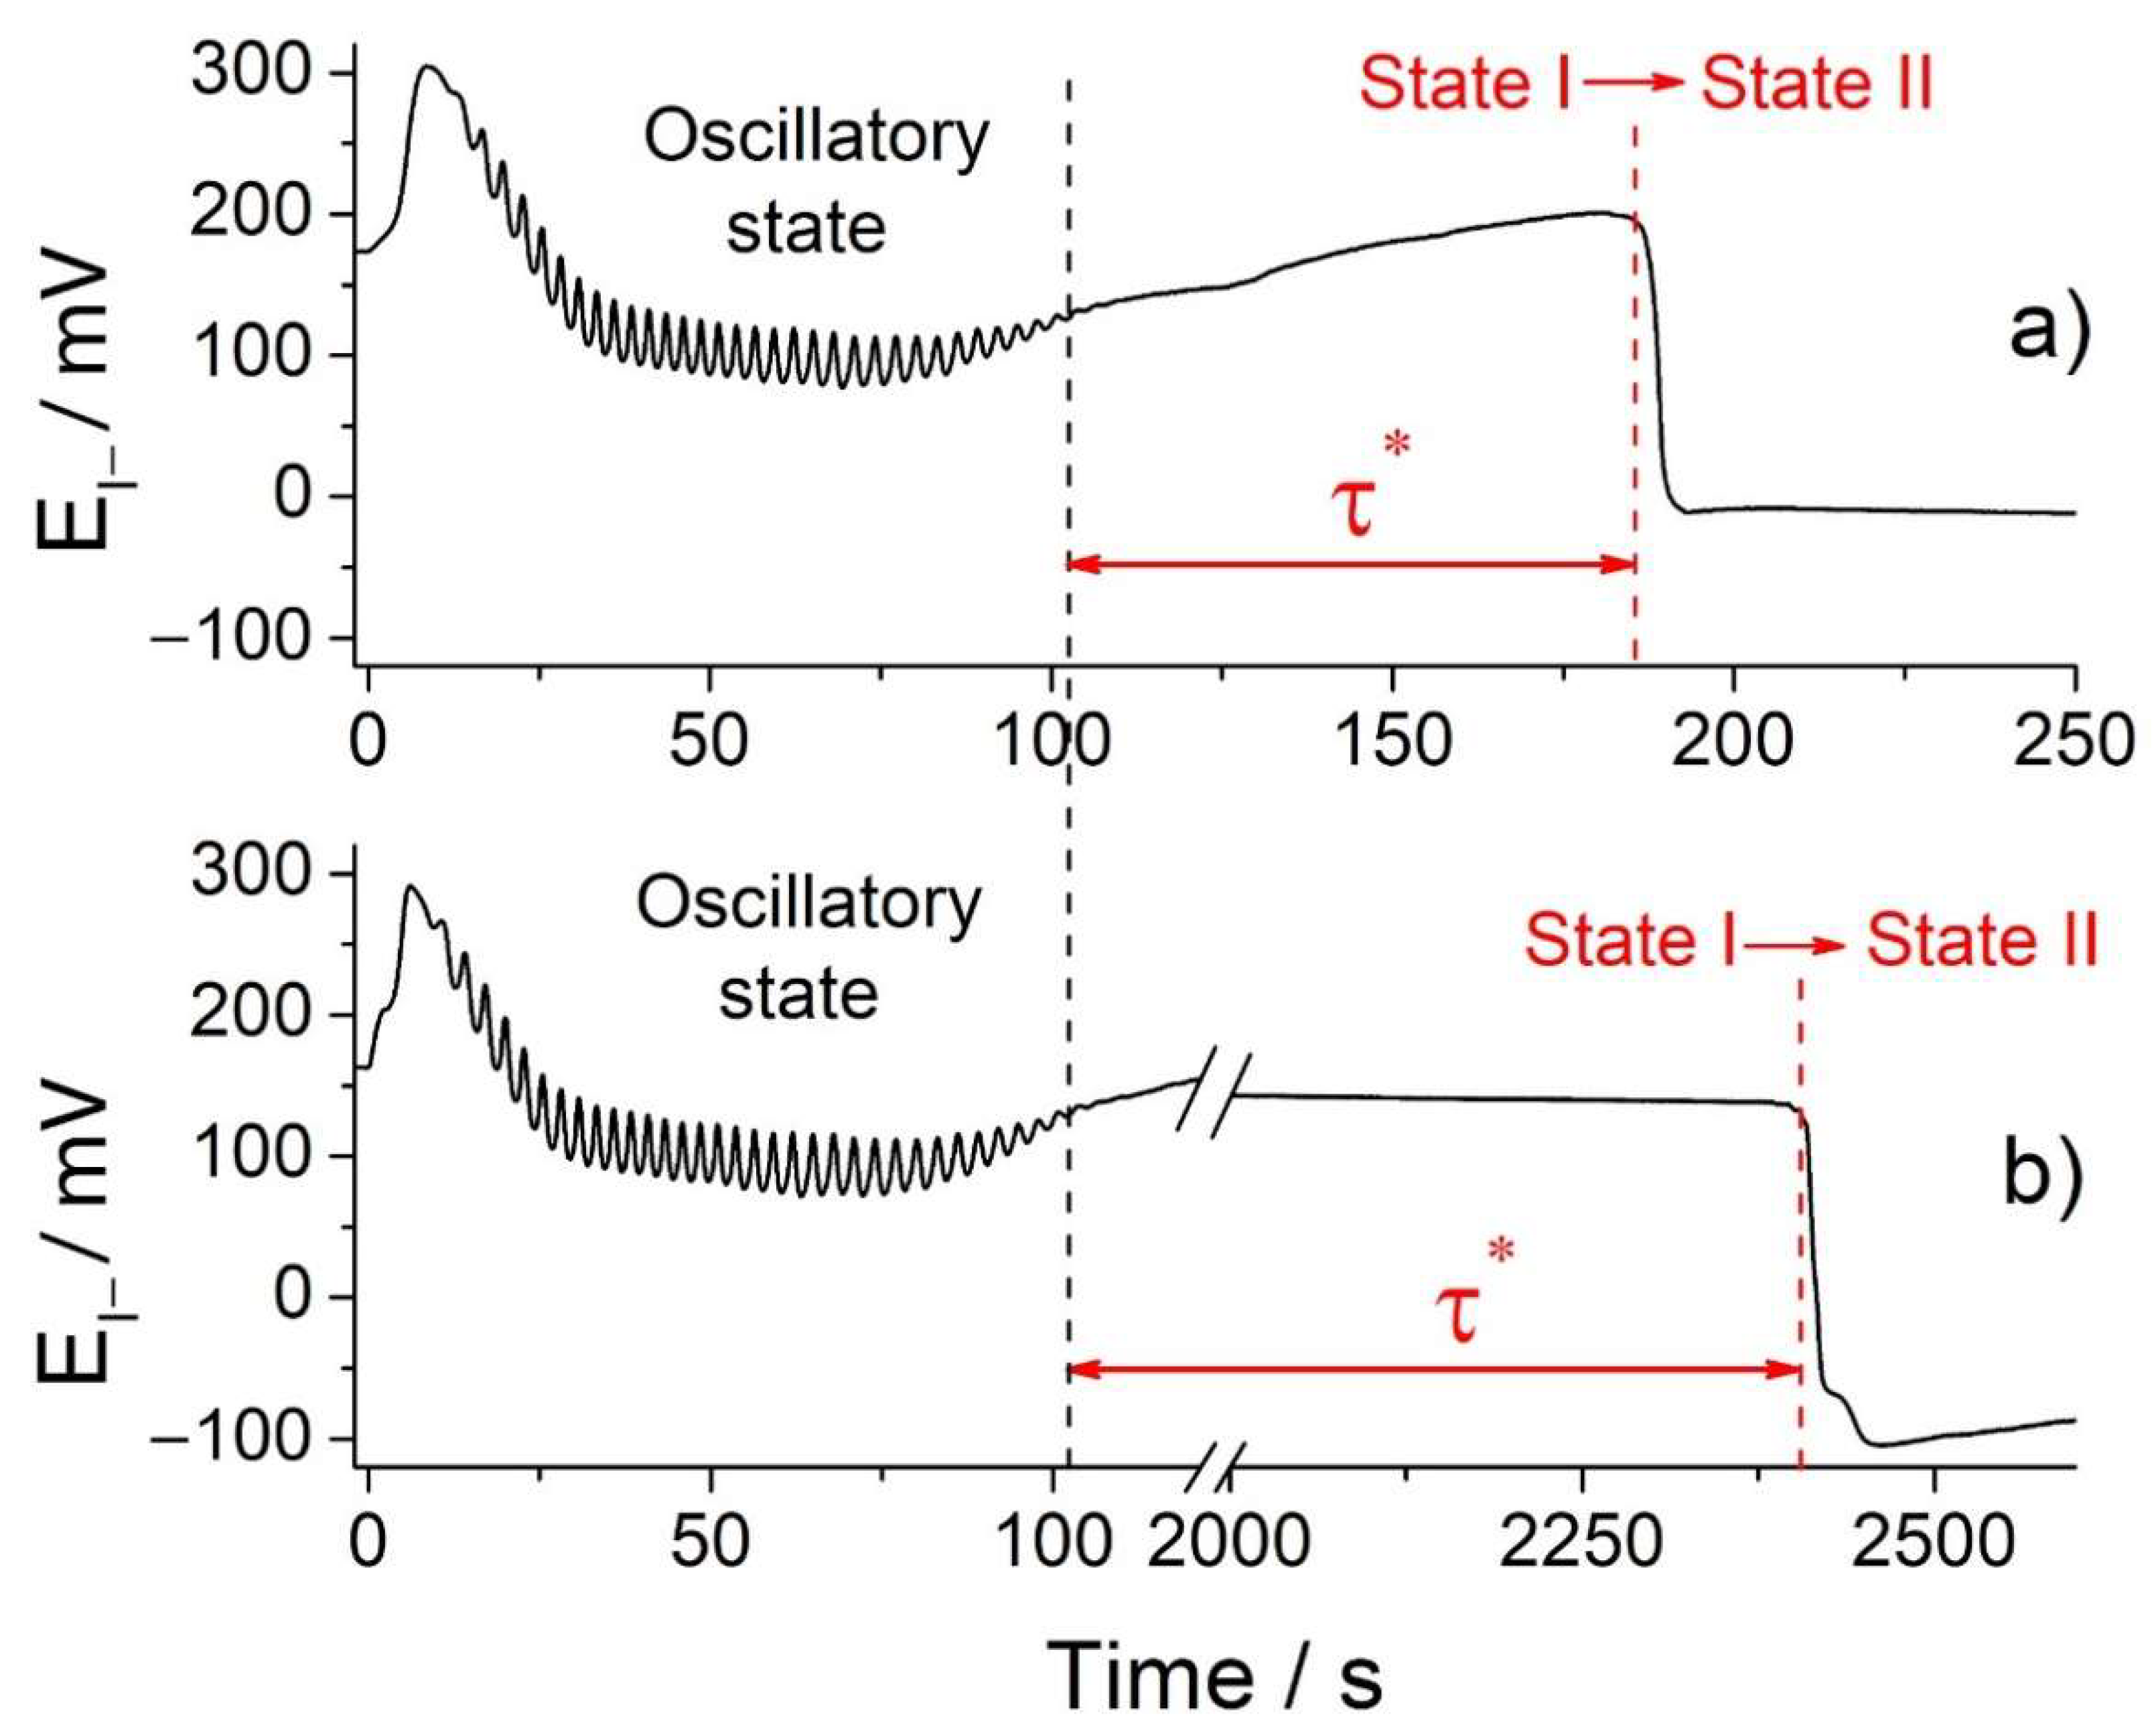
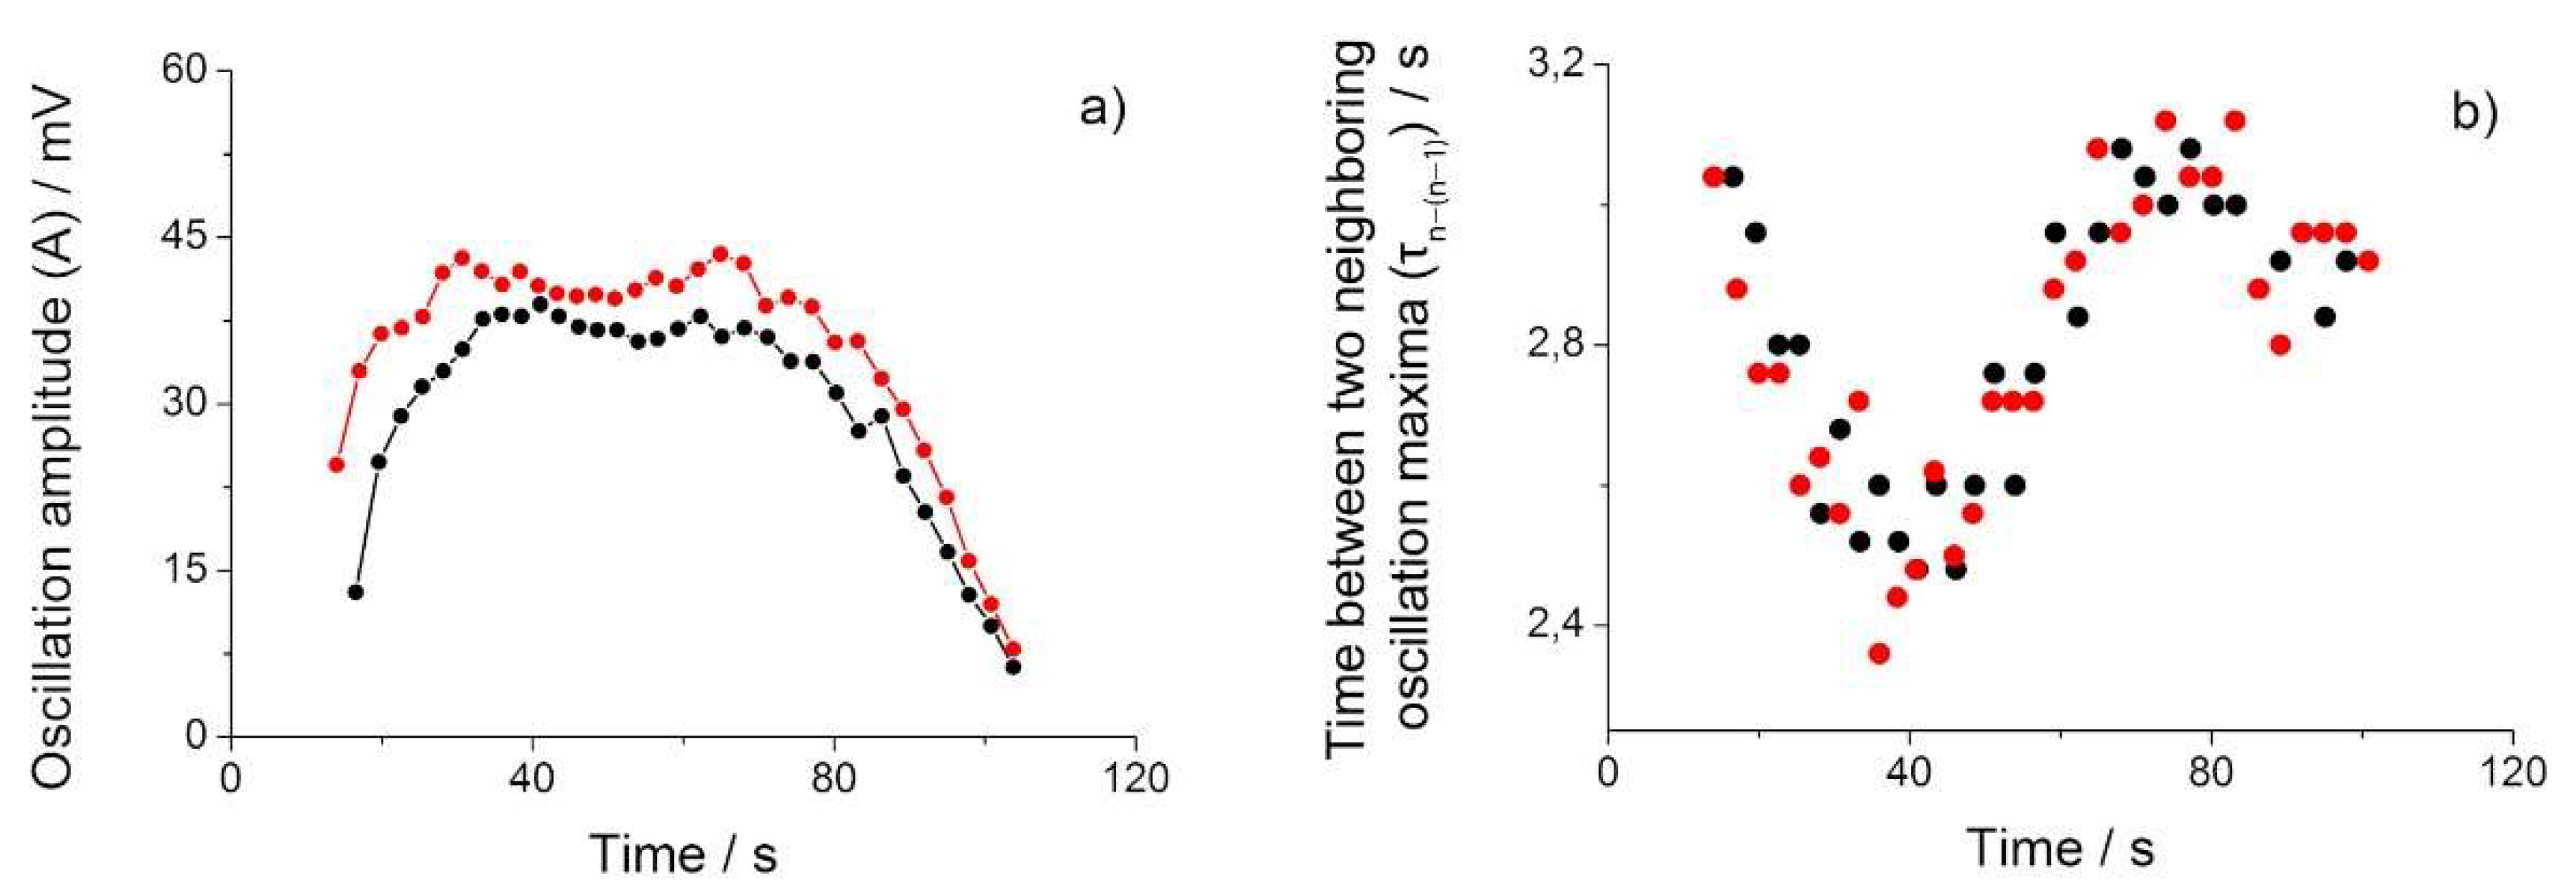
3.1. Effects of the Stirring Bar Shape and Dimensions on the State I→State II Transition

The BR oscillatory period is strongly reproducible, while the transition from state I to state II occurred practically randomly (Figure 1), as previously reported by our research group [16].
It is imperative to emphasize that in our measurements (Figure 1), unlike in other crazy-clock reactions found in the literature [18,19,24], large time fluctuations (the order of magnitude could be more than two hours) occur after a highly reproducible oscillatory period. Two independent measurements and consequently obtained BR oscillograms exhibit identical trends in oscillation amplitude and time between two neighboring oscillation maxima τn−(n−1) = tntn−1, as it can be observed in Figure 1 and Figure 2a,b. Conversion from higher to lower potential of iodine electrode (or from low to high iodide concentration) marks the transition from state I to state II (state I→state II). Furthermore, the choice of the working electrode affects only the transition shape. However, the transition itself is very noticeable due to the intense color change of the system from colorless to yellow accompanied by solid iodine formation. This allows monitoring the state I→state II transition with the naked eye.
The cause of this unexpected transition is still unknown. Previous work highlighted the significance of mixing conditions for the appearance of state I→state II transition and crazy-clock behavior [13,16]. Therefore, we want to reveal in detail the effect of mixing on the transition, by using stirring bars of different sizes and shapes and applying various mixing rates (Figure 3).
The transition from the state I to state II occurs only with a low stirring rate and a stirring bar of small dimensions (namely, 100 rpm and a magnetic stirring bar made of PTFE-coated cylindrical with a length of 10 mm and a diameter of 4 mm, Figure 3a). The results also underline the importance of the particular magnetic bar shape and mixing rate that was used (Figure 3a–d). Even with a low stirring rate (100 rpm), the transition does not occur with a bar exhibiting a triangular section (bar 12 mm length, 6 mm diameter) (Figure 3d). This result implies that the transition is strongly connected a particular diffusion conditions and vortex type behavior created by using specific stirring rods. Furthermore, we perform a detailed statistical analysis to reveal the connection between the state I→state II transition and the mixing rate (using the 10-mm long and 4-mm large cylindrical stirring bar). A set of 60 experiments were performed without stirring and with stirring at a 100-rpm mixing rate (30 experiments, each). The results (τosc and τ*) are tabulated (Tables S1 and S2) and presented in Supplementary Materials. The τ* mean value with 95% confidence limit is for no-mixing τ*no mix = (12 ± 4) min and for mixing conditions, τ*mix = (17 ± 5) min.

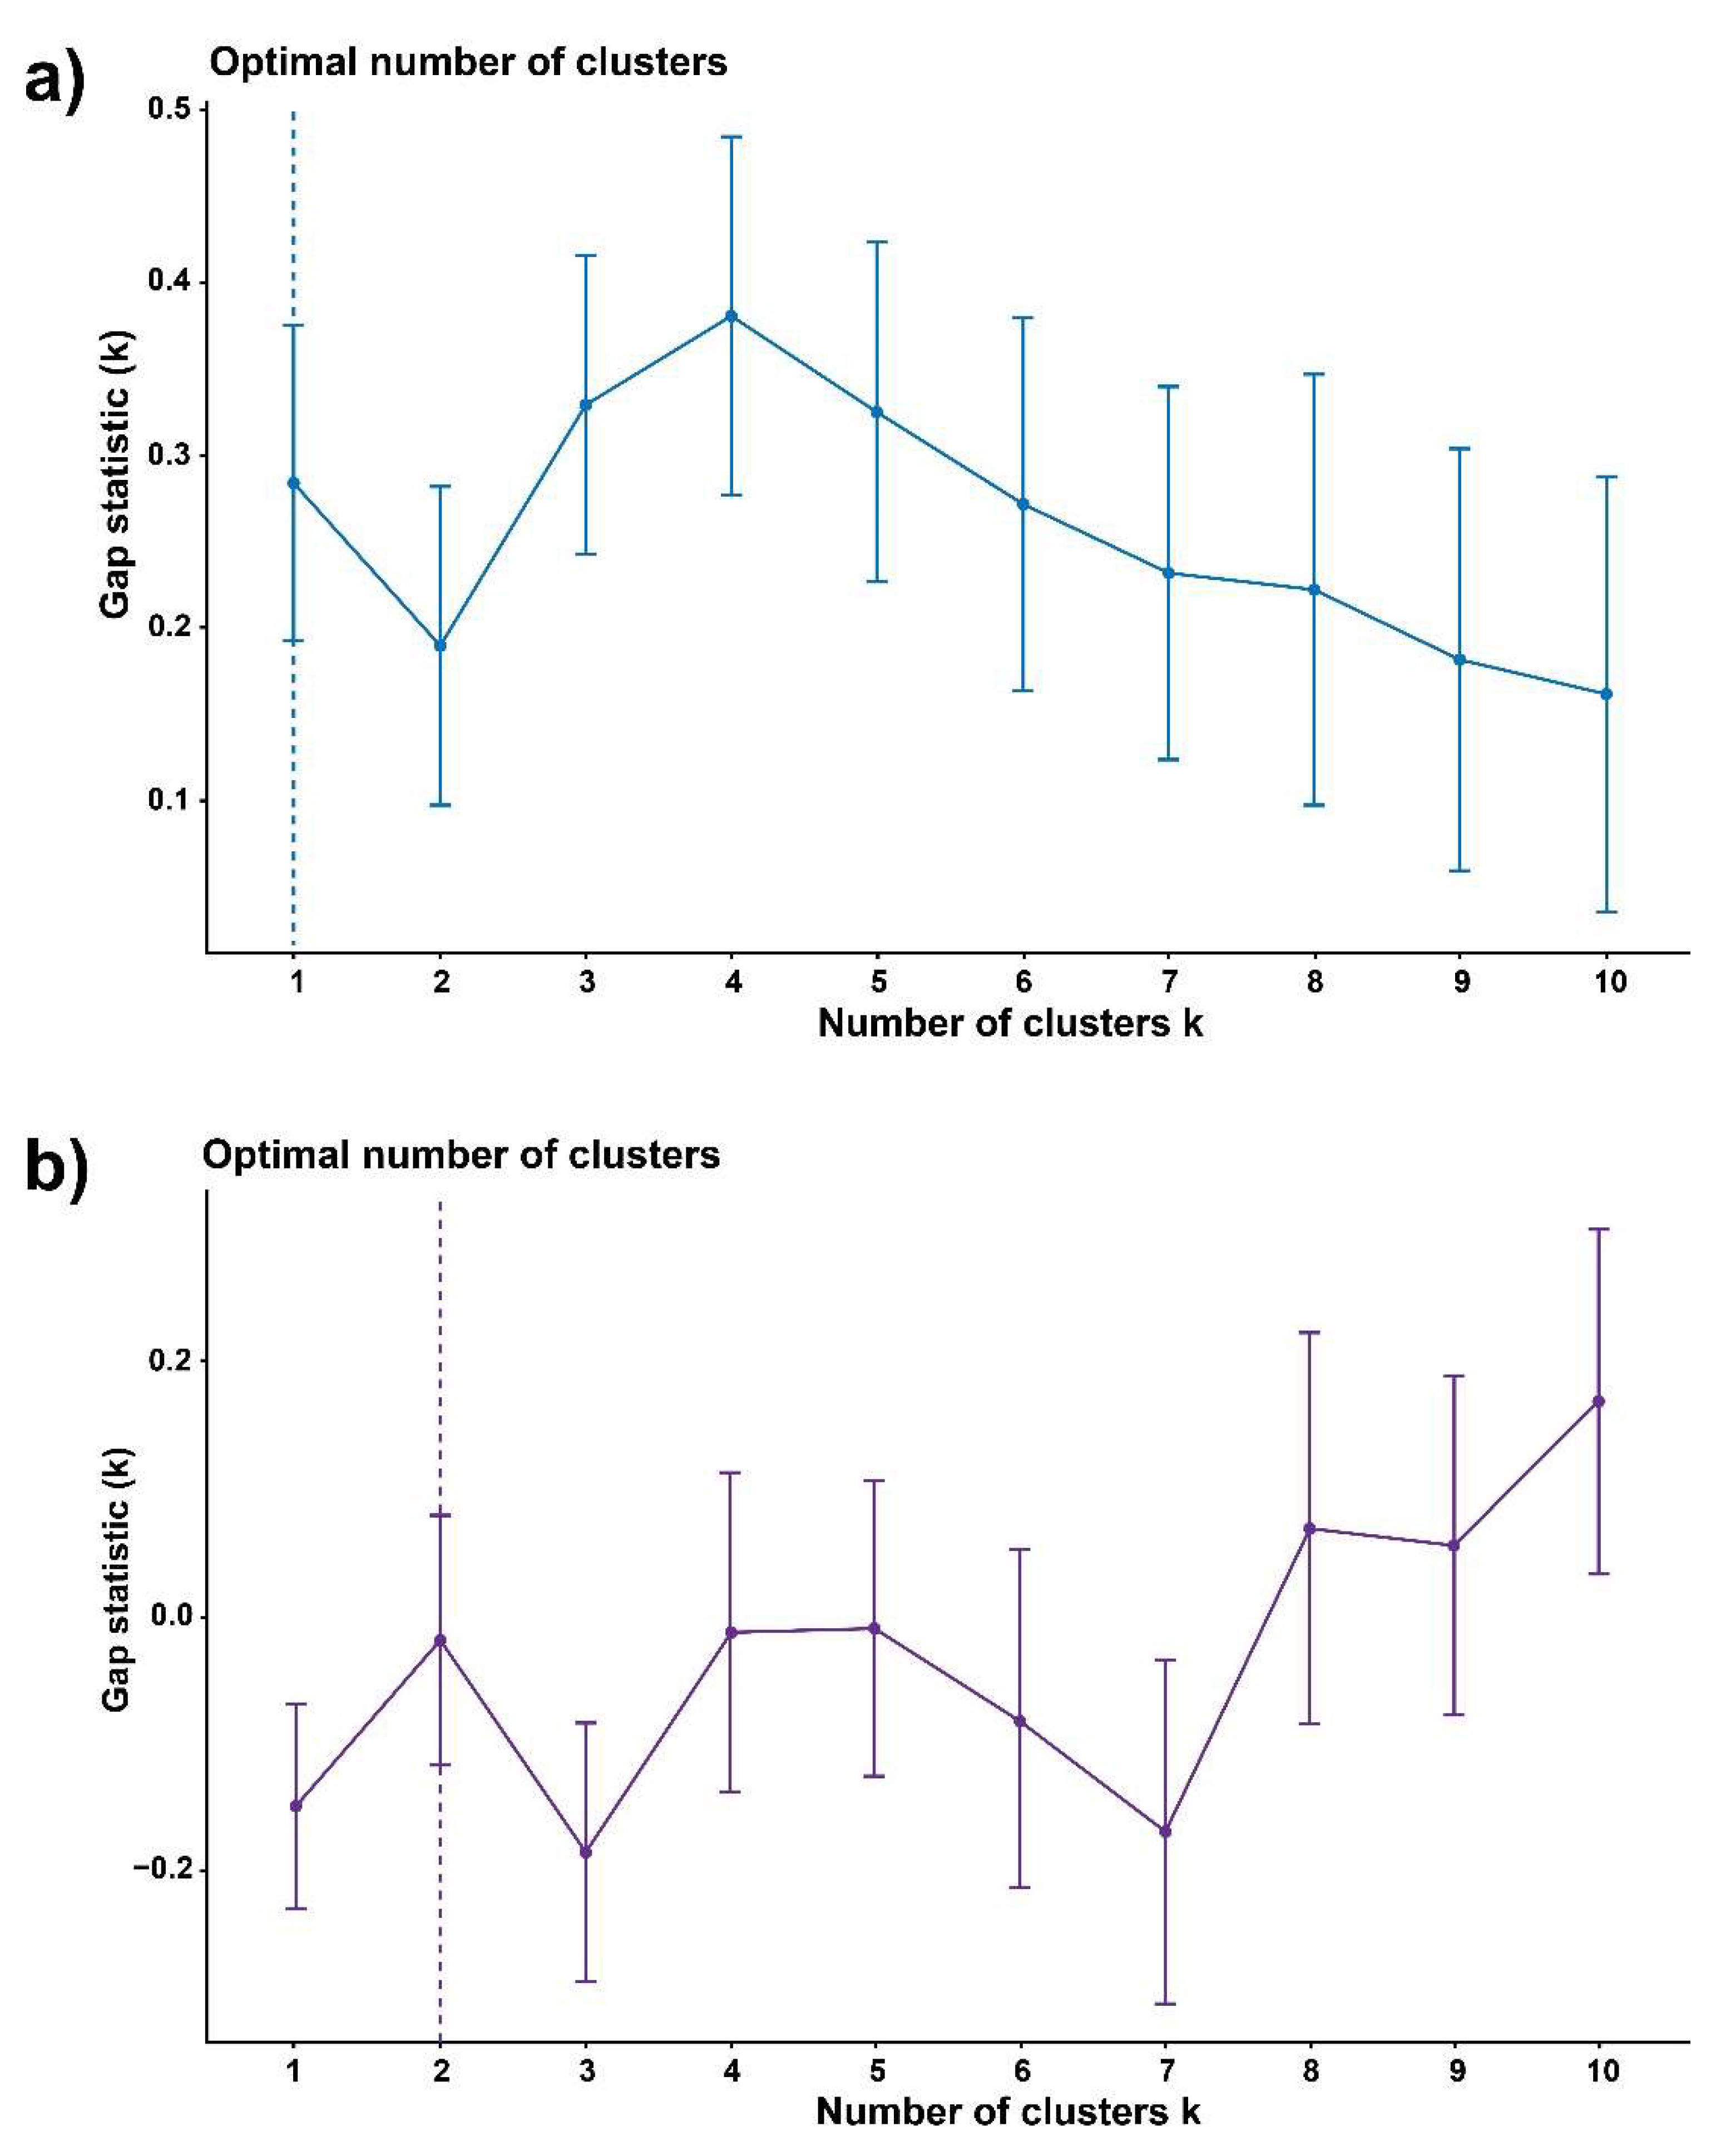
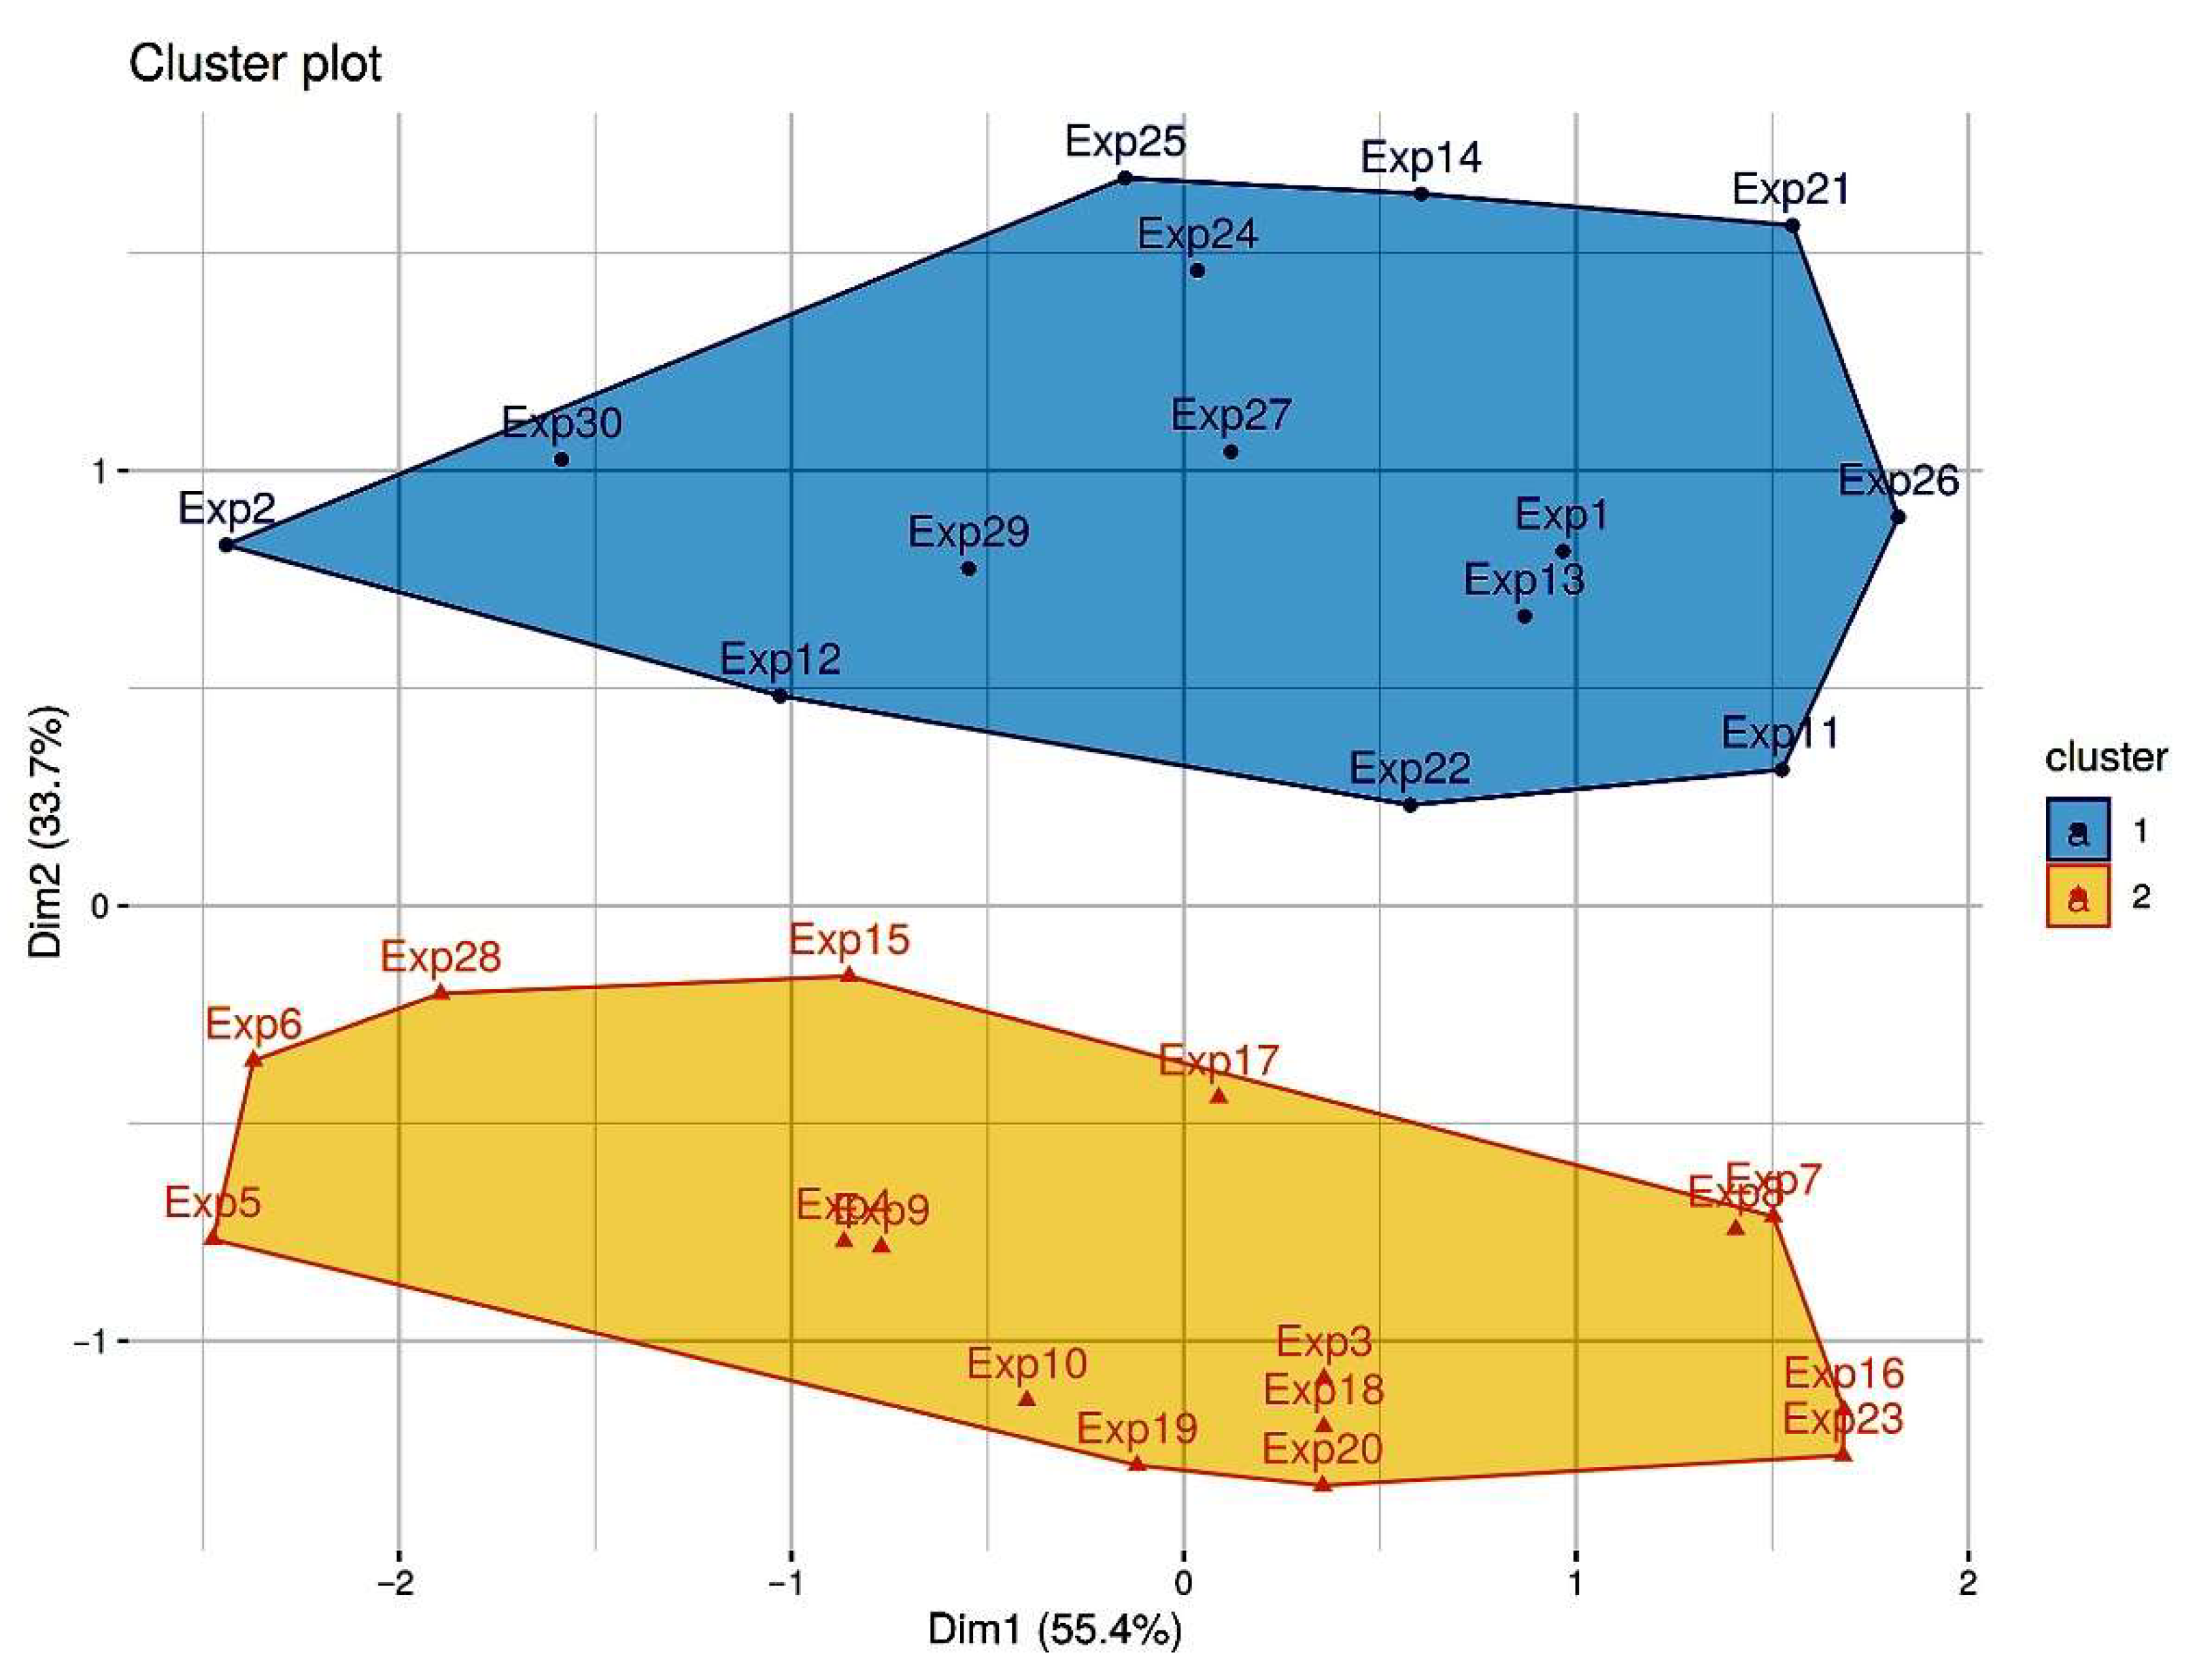
3.2. Statistical Analysis of Experimental Results and Evidence of Clustering

Is there a connection between the time that the system spends in the oscillatory regime (τosc) and the time when the state I to state II transition occurs (τ*)? Or, in other words, are the minor differences in oscillatory period duration responsible for a significant deviation in transition appearance? The detailed exploration of the relation between BR oscillatory time, τosc, and the time τ* of the occurrence of the state I→state II transition (Figure 1), with and without stirring of the solutions, was performed by statistical cluster analysis (CA). Cluster analysis performs subdivision of datasets based on the relationships among their members (in our case datasets of τosc and τ*). The application of CA allows the separation of data in clusters (namely, in groups) based on mutual distances, which reflect a degree of similarity among data [25]. The greater the similarity in the cluster, the higher the distance between the clusters, and hence the better the clustering. Our results combine a total of 60 experiments, obtained with no-mixing conditions (30 experiments) and with a mixing rate of 100 rpm (30 experiments). They were analyzed in the open-source statistic software “R” using “hclust” algorithm for the hierarchical cluster analysis (HCA) [22,23]. The HCA divided the ratios τosc/τ* into three clusters for both mixing and no-mixing measurements (Figure 4a,b). It can be noticed that the number of members of a particular cluster slightly changes upon alteration of experimental conditions (Table 1).
It appears that the stirring effect causes an increase in the members of Cluster 1 and Cluster 3, as well as decreasing in members in Cluster 2. The increase of members in Cluster 3 suggested that stirring has prolonged time for the state I→state II transition taking place (Figure 4b.). It can be also seen from the τ* mean value for no-mixing τ*no mix = (12 ± 4) min and mixing conditions, τ*mix = (17 ± 5) min. Furthermore, all clusters are more compact and separated, in the case of stirring (if compared with those obtained without stirring).
The results presented in Table 1 clearly indicate that the investigated crazy-clock exhibits a truly random behavior. The shift (Figure 4a,b, Table 1) in the position of the cluster centroids towards higher τ* values (i.e., a delaying time to transition to happen) can be observed for the case of applied stirring conditions. Due to a small number of members, the centroid of Cluster 3, in both cases, was not calculated. Furthermore, there is no significant change in the cluster’s centroid position regarding τosc oscillatory coordinate for clusters. That leads to the conclusion that the transition from state I to state II is independent of oscillatory time duration or, in other words, that the minor differences in oscillatory period duration are not responsible for a significant deviation in transition appearance. Therefore, we calculated the optimal number of clusters by a one parameter (by parameter τ*) K-means analysis, for no-mixing and mixing conditions (Figure 5a,b, respectively). The determination of optimal numbers of clusters was performed using gap method in fviz_nbclust alghoritm [26]. In brief, the gap statistic compares the total within intra-cluster variation for different values of k with their expected values under null reference distribution of the data. The estimate of the optimal clusters will be value that maximizes the gap statistic (i.e., that yields the largest gap statistic) [27].
As it can be seen from the Figure 5 the optimal number of clusters obtained by using one parameter K-means analysis is changed. The BR system which is not stirred has one cluster (Figure 5a), while the stirring induces differentiation of two clusters (see Figure 5b and Figure 6). The dimensions refer to the first two components. The fitviz_cluster function has been used to analyze the main components, after which the cluster is represented in the dimensions of the first two Principal Component Analysis (PCA) components. The clusters are well separated. This indicates that mixing introduced additional effects responsible for a significant cluster separation revealing the existence of time domains where the state I to state II transition is more likely to occur.

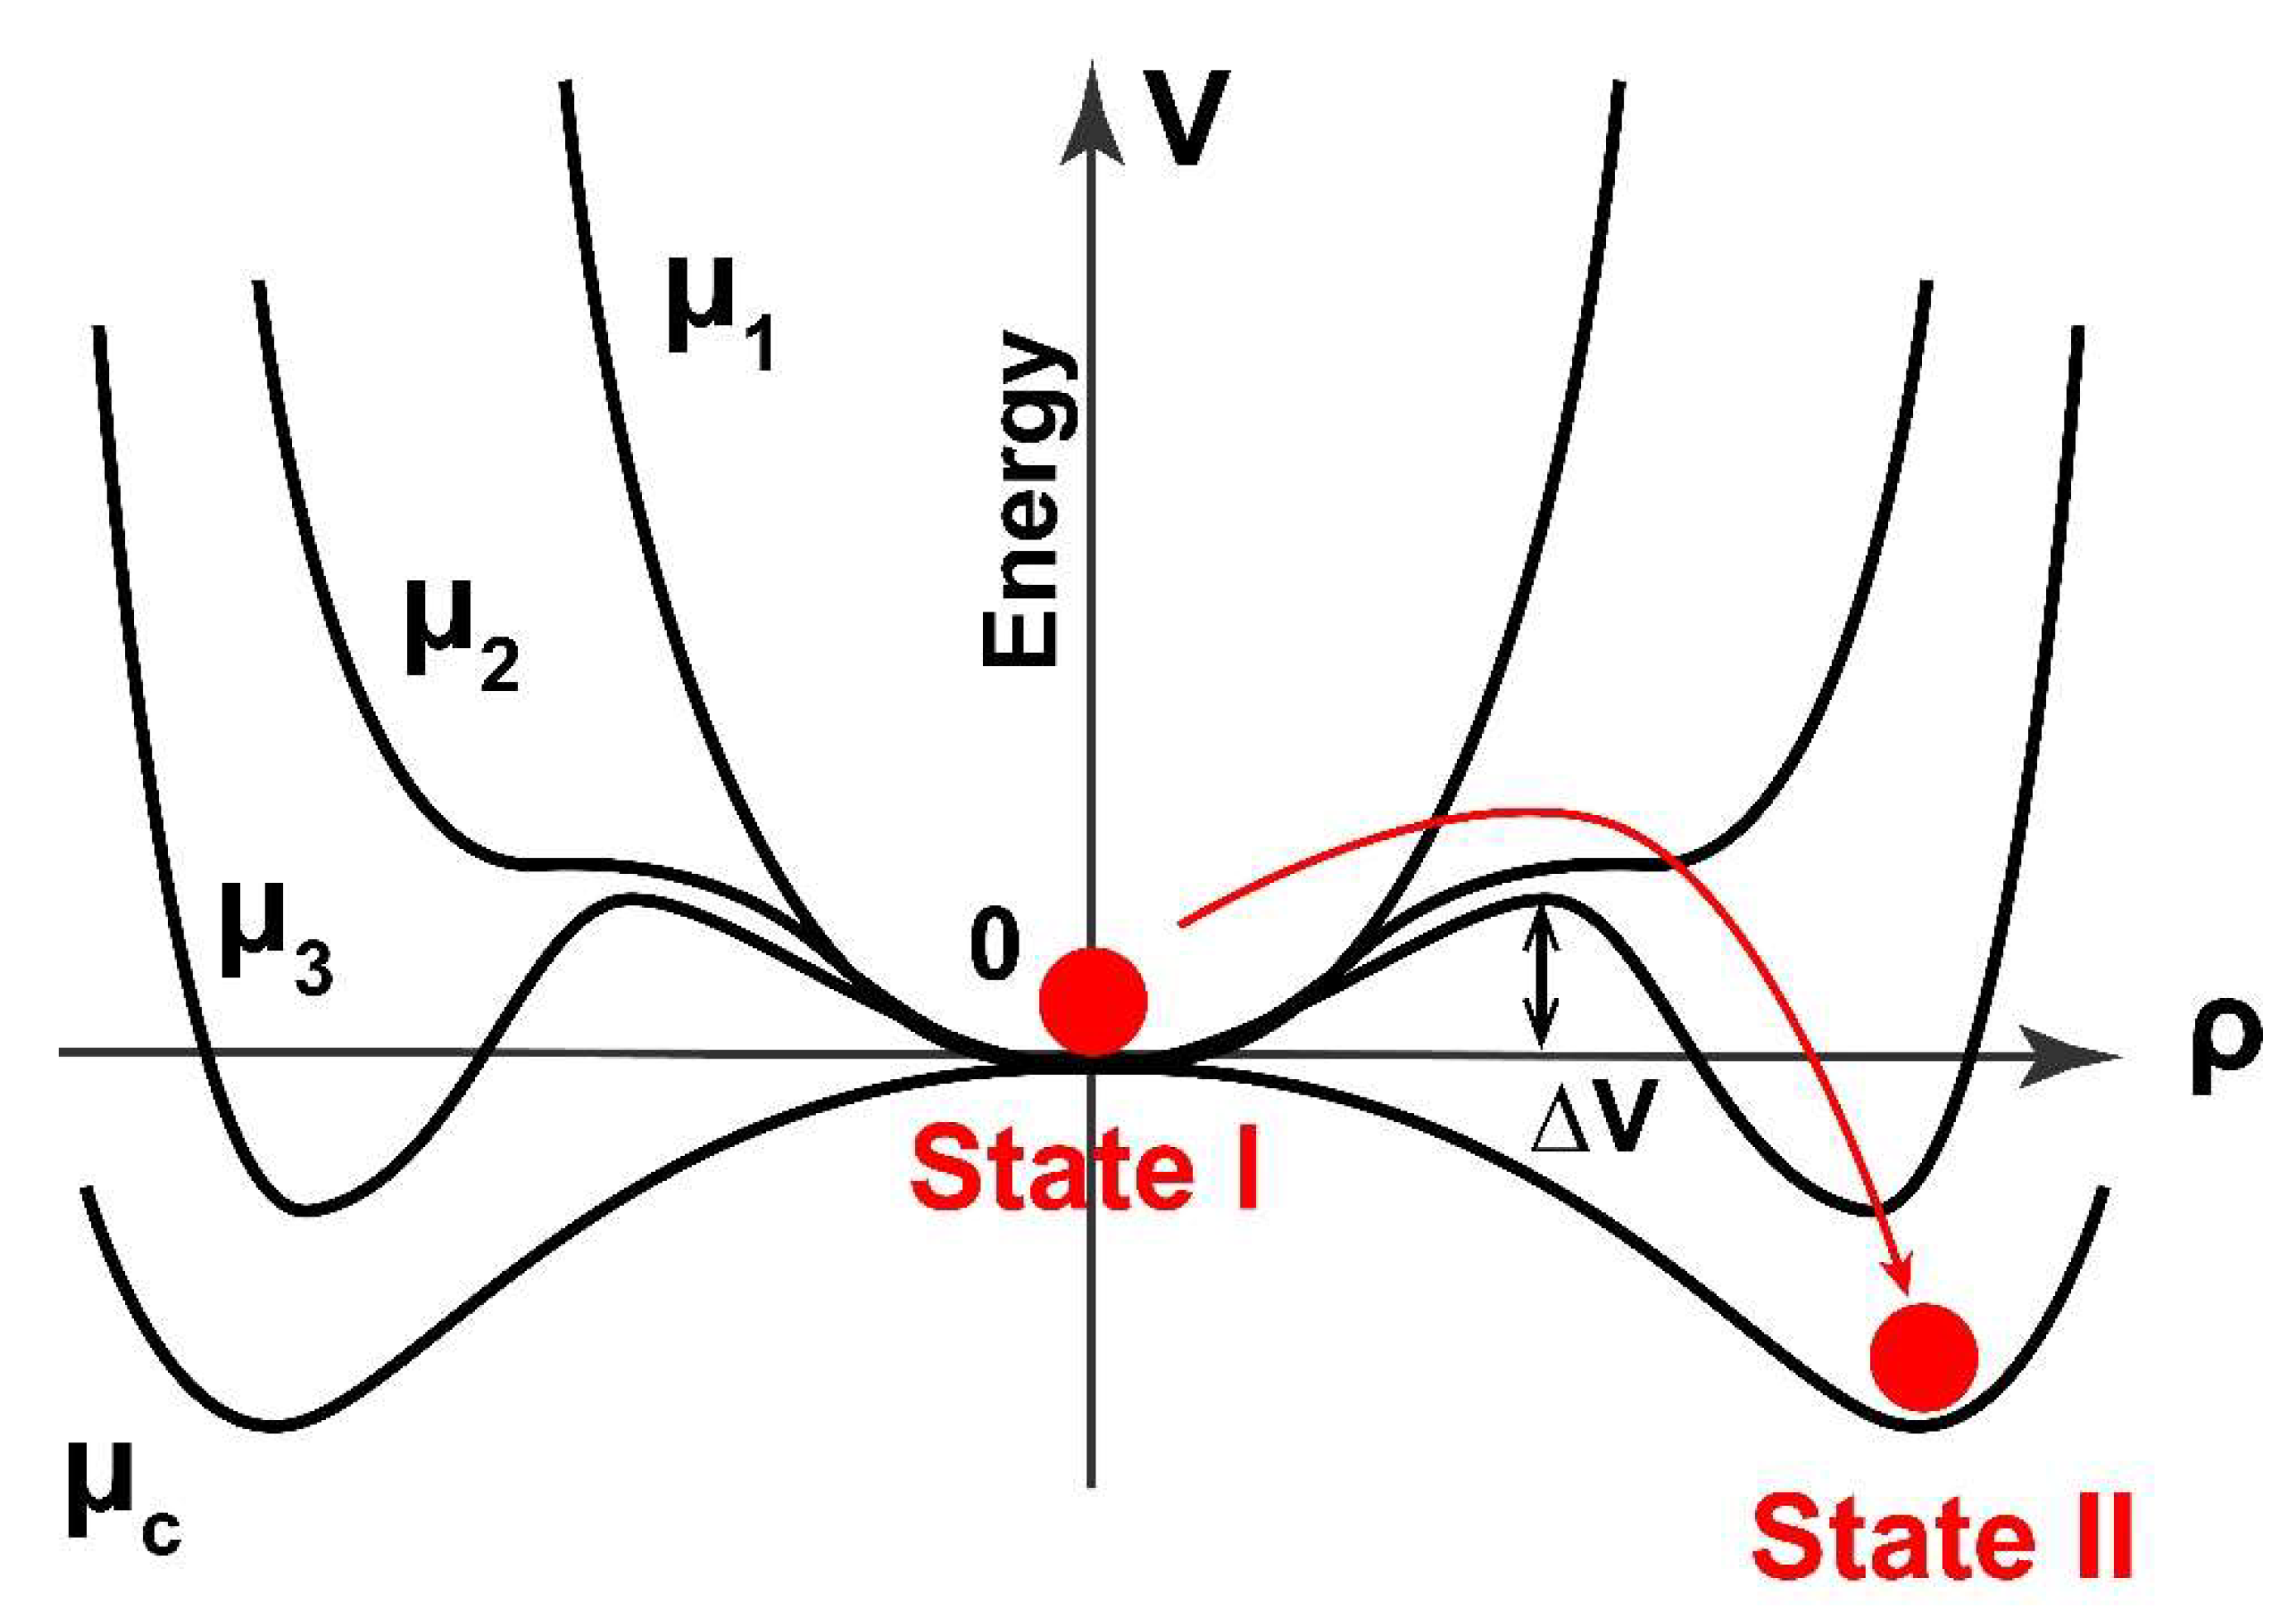
3.3. The State I→State II Phenomenon and Its Relation to (Spontaneous) Symmetry Breaking

The appearance of clusters indicates the existence of time domains where the state I to state II transition is more likely to occur. The stirring of the reaction mixture has a strong indirect influence on the state Istate II transition, delaying the crazy-clock behavior, shifting cluster centroids toward higher τ* values, and increasing the cluster separation (i.e., time domain separation), as well. The existence of clusters could be connected to different nucleation and growth mechanisms of iodine crystals in the case of mixing [28], and further examination of solid iodine products would be the subject of future work.
However, if we assumed that state I (low iodide and iodine concentration) is the symmetric state, which under some conditions becomes absolutely unstable, then, reaching the state II (high iodide and iodine concentration, with a new I2 solid phase) could be considered as spontaneous symmetry breaking [29], see Figure 7. Such an observation of state I to state II transition could also explain the persistence of the BR system “indefinitely” in the state I, as obtained for strong mixing condition (see Figure 3).
Namely, in the case of the symmetry-breaking process, the system must overcome a sufficiently large energy barrier (as shown in Figure 7). Therefore, the system’s state (state I, low iodide and iodine concentration) will remain unchanged until a sufficiently large perturbation throws it over the energy barrier, ∆V, which separates the states. We assume that ∆V corresponds to the energy threshold of the formation of solid iodine from chemical reactions that principally occur in the BR solution after the oscillatory period. It is well-known that the post-oscillatory period could be excitable [30,31], meaning that a nonlinear system can be shifted (perturbed) from one state to another. It is usually achieved by the addition of some stable intermediate or reactants, playing the role of an external perturbation, to the reaction mixture [32]. Since, in our case, there is no external perturbants/stimulus (all experiments are conducted under identical conditions, and the system remained under constant temperature), the BR system should find an internal stimulus to overcome the energy barrier. The mixing itself should not influence activation energies of chemical reactions responsible for state I to state II transition. In other words, the energy threshold (∆V) should be identical for mixing and no-mixing condition. However, the system has behaved differently, and the state I to state II transition strongly depends on the mixing conditions. Therefore, some phenomena related to mixing are accountable for the obtained behavior. Figure 7 is a cartoon view that links thermodynamics (far from equilibrium) with kinetic processes driven by the gradient of diffusion/concentration. The changes in time of these local gradients are probably a source of fluctuations. When fluctuations reach a certain threshold (such as a critical number of interacted dissipative structures), a new order/phase spontaneously appears. Cluster analysis (Figure 4, Figure 5 and Figure 6) allows us to group different dissipation architectures as a function of time.
The diffusion-driven instability combined with nonlinear chemical reactions (with autocatalytic steps and radical reactions) is a broad concept and it could be responsible for the “internal stimulus” necessary for passing the energy barrier. The diffusion-driven instability is intensified by gaseous oxygen and carbon dioxide/carbon monoxide, which are released in the BR solution during the oscillatory period [33]. Additionally, the possible energetic coupling between physical and chemical processes, such as the nucleation of gaseous phase (O2 and/or CO2), nucleation of solid iodine and particular chemical reactions, could also be considered as an “internal stimulus” necessary for overcoming the energy barrier and breaking symmetry [34,35,36].
This proposal is actually a reformulated original idea of Turing [37], where the interplay of chemical reactions and diffusion are responsible for pattern formation in living systems. As suggested by Prigogine, the spontaneous appearance of a spatial organization via diffusion-driven instability can be considered as a spontaneous symmetry-breaking transition [38]. In the presented work, we deal with a bulk solution and there is no visible spatial organization, but the spatial organization (spatiotemporal patterns) of the identical process (state I→state II transition in Briggs–Rauscher reaction) in a thin layer, is very recently found by Li and coworkers [15]. Therefore, this work indirectly links spontaneous symmetry breaking and crazy-clock behavior (stochastic nature) in the bulk. The stochastic nature of state I to state II transition and its relation to symmetry breaking (and pattern formation), introduced a new approach in the investigation of crazy-clock behavior. On the other hand, the investigation of chemical systems with stochastic nature and symmetry breaking could improve our understanding of more complex phenomena in living organisms, such as morphogenesis.
Additionally, this paper nominates state I→state II transition as an easily available chemical system for intrinsic random number generator and thus, expands the potential application of this crazy-clock reaction.

4. Conclusions

In this work, we further investigated the crazy-clock phenomenon (state I to state II transition) which occurs after a strongly reproducible Briggs–Rauscher oscillatory reaction. The mixing rate, as well as the magnetic bar shape and dimensions, have a strong influence on the transition appearance. In order to better understand the stochasticity of the mentioned process, we ran more than 60 experiments (30 experiments with mixing and 30 experiments with no-mixing conditions), and we applied the statistical cluster K-means analysis. Although the transition for both mixing and no-mixing conditions are taking place completely randomly, by using statistical cluster analysis, we obtained different number of clusters pointing to different time-domains where the transition is more likely to occur. Two-parameter analysis (by oscillatory time duration, τosc and by the moment when the transition occurs, τ*) suggests that the state I→state II is independent of the oscillatory time duration. Therefore, we performed a one parameter analysis (by τ*). In the case of no-mixing, we found one cluster, while the statistical analysis of the results for mixing conditions revealed two compact and well-separated clusters. The clustering method reveals new hidden details regarding the chemical dynamics of nonlinear processes. The state I to state II transition could be explained through a symmetry breaking approach, and the necessity of the BR system to overcome a sufficiently large energy barrier. This is the first link of the crazy-clock behavior to the symmetry breaking phenomenon. The investigation of chemical systems with stochastic nature and symmetry breaking could improve our understanding of more complex phenomena in living organisms and therefore the scope of the presented results goes beyond oscillatory reaction kinetics. Furthermore, the described example belongs to the small class of chemical systems that shows intrinsic randomness in their response and it might be considered as a real example of a classical liquid random number generator.

Supplementary Materials

The following supporting information can be downloaded at: https://www.mdpi.com/article/10.3390/sym14020413/s1, Table S1: The Briggs-Rauscher oscillogram duration (τosc), the numbers of oscillations, and state I to state II transition time (τ*) when no-mixing conditions is applied: [Malonic acid]0 = 0.0789 M, [MnSO4]0 = 0.00752 M, [HClO4]0 = 0.03 M, [KIO3]0 = 0.0752 M, [H2O2]0 = 1.176 M, T= 37.0 °C, reaction volume 25 mL, Table S2: The Briggs-Rauscher oscillogram duration (τosc), the numbers of oscillations, and state I to state II transition time (τ*) when 100 rpm mixing conditions is applied: [Malonic acid]0 = 0.0789 M, [MnSO4]0 = 0.00752 M, [HClO4]0 = 0.03 M, [KIO3]0 = 0.0752 M, [H2O2]0 = 1.176 M, T= 37.0 °C, reaction volume 25 mL.

Author Contributions

Conceptualization, M.C.P. and B.K.; methodology, M.C.P., J.P.M., Y.C., and B.K.; statistical K-means analysis M.D.; investigation, M.C.P. and J.P.M.; writing—original draft preparation, M.C.P. and B.K.; writing—review and editing, M.C.P., B.K., Y.C., S.R.M. and T.V.; visualization, J.P.M. and B.B. All authors have read and agreed to the published version of the manuscript.

Funding

This research was funded by the Ministry of Education, Science and Technological Development of the Republic of Serbia, Contract numbers: 451-03-68/2022-14/200026 and 451-03-68/2022-14/200146; BEWARE Fellowship of the Walloon Region (Convention n°2110034); the Fund for Scientific Research F.R.S.-FNRS; the Ministry of Education, Science and Technological Development of the Republic of Serbia (grant III 45016); the Office of Naval Research Global (Research Grant N62902-22-1-2024).

Institutional Review Board Statement

Not applicable.

Informed Consent Statement

Not applicable.

Data Availability Statement

Data underlying the results presented in this paper are not publicly available at this time but may be obtained from the authors upon reasonable request. Please contact for this corresponding authors.

Acknowledgments

This work was supported by the Ministry of Education, Science and Technological Development of the Republic of Serbia Contract numbers: 451-03-68/2022-14/200026 and 451-03-68/2022-14/200146. S.R.M. was supported by a BEWARE Fellowship of the Walloon Region (Convention n°2110034), as a postdoctoral researcher. Y.C. is a research associate of the Fund for Scientific Research F.R.S.-FNRS. B.K. and B.B. acknowledge financial support of the Ministry of Education, Science and Technological Development of the Republic of Serbia (grant III 45016). Additionally, B.K. acknowledges support from F.R.S.-FNRS. M.P., B.B., and B.K. acknowledge the support of the Office of Naval Research Global through the Research Grant N62902-22-1-2024.

Conflicts of Interest

The authors declare no conflict of interest.

References

  1. Gross, D.J. The role of symmetry in fundamental physics. Proc. Natl. Acad. Sci. USA 1996, 93, 14256–14259. [Google Scholar] [CrossRef] [PubMed] [Green Version]
  2. Smits, J.; Stoof, H.T.C.; Straten, P.V.D. Spontaneous symmetry breaking in a driven-dissipative system. Phys. Rev. A 2021, 104, 023318. [Google Scholar] [CrossRef]
  3. Briggs, T.S.; Rauscher, W.C. An oscillating iodine clock. J. Chem. Educ. 1973, 50, 496. [Google Scholar] [CrossRef]
  4. Bray, W.C. A periodic reaction in homogeneous solution and its relation to catalysis. J. Am. Chem. Soc. 1921, 43, 1262–1267. [Google Scholar] [CrossRef] [Green Version]
  5. Bray, W.C.; Liebhafsky, H.A. Reaction involving hydrogen peroxide, iodine and iodate ion. I. Introd. J. Am. Chem. Soc. 1931, 53, 38–43. [Google Scholar] [CrossRef]
  6. Belousov, B.P. A periodic reaction and its mechanism, in collection of short papers on radiation medicine for 1958. Medgiz 1959, 145–147. [Google Scholar]
  7. Furrow, S.D. A modified recipe and variations for the briggs–rauscher oscillating reaction. J. Chem. Educ. 2012, 89, 1421–1424. [Google Scholar] [CrossRef]
  8. Furrow, S.D.; Noyes, R.M. The oscillatory Briggs-Rauscher reaction. 1. Examination of subsystems. J. Am. Chem. Soc. 1982, 104, 38–42. [Google Scholar] [CrossRef]
  9. Noyes, R.M.; Furrow, S.D. The oscillatory Briggs-Rauscher reaction. 3. A skeleton mechanism for oscillations. J. Am. Chem. Soc. 1982, 104, 45–48. [Google Scholar] [CrossRef]
  10. Schmitz, G.; Furrow, S. Kinetics of the iodate reduction by hydrogen peroxide and relation with the Briggs–Rauscher and Bray–Liebhafsky oscillating reactions. Phys. Chem. Chem. Phys. 2012, 14, 5711–5717. [Google Scholar] [CrossRef]
  11. Furrow, S.D.; Cervellati, R.; Greco, E. A study of the cerium-catalyzed briggs-rauscher oscillating reaction. Z. Nat. B 2012, 67, 89–97. [Google Scholar]
  12. Vanag, V.K.; Alfimov, M.V. Light-induced nonequilibrium phase transition between quasistationary states of the Briggs-Rauscher reaction under batch conditions. J. Phys. Chem. 1993, 97, 1878–1883. [Google Scholar] [CrossRef]
  13. Vanag, V.K.; Alfimov, M.V. Effects of stirring on photoinduced phase transition in a batch-mode Briggs-Rauscher reaction. J. Phys. Chem. 1993, 97, 1884–1890. [Google Scholar] [CrossRef]
  14. Pagnacco, M.C.; Mojović, M.D.; Popović-Bijelić, A.D.; Horváth, A.K. Investigation of the halogenate–hydrogen peroxide reactions using the electron paramagnetic resonance spin trapping technique. J. Phys. Chem. A 2017, 121, 3207–3212. [Google Scholar] [CrossRef] [PubMed]
  15. Li, Z.; Yuan, L.; Liu, M.; Cheng, Z.; Zheng, J.; Epstein, I.R.; Gao, Q. The briggs–rauscher reaction: A demonstration of sequential spatiotemporal patterns. J. Chem. Educ. 2021, 98, 665–668. [Google Scholar] [CrossRef]
  16. Pagnacco, M.C.; Maksimović, J.P.; Potkonjak, N.I.; Božić, B.; Horváth, A.K. The transition from low to high iodide and iodine concentration state in the briggs rauscher reaction-evidence on crazy clock behavior. J. Phys. Chem. A 2018, 122, 482–491. [Google Scholar] [CrossRef]
  17. Furrow, S.D.; Cervellati, R.; Greco, E. Study of the transition to higher iodide in the malonic acid Briggs–Rauscher oscillator. React. Kinet. Mech. Catal. 2015, 118, 59–71. [Google Scholar] [CrossRef]
  18. Epstein, I.R. The consequences of imperfect mixing in autocatalytic chemical and biological systems. Nature 1995, 374, 321–327. [Google Scholar] [CrossRef]
  19. Valkai, L.; Cseko, G.; Horvath, A.K. Initial Inhomogeneity-induced crazy-clock behavior in the iodate-arsenous acid reaction in a buffered medium under stirred batch conditions. Phys. Chem. Chem. Phys. 2015, 17, 22187–22194. [Google Scholar] [CrossRef]
  20. Andersen, A.; Madsen, J.; Reichelt, C.; Ahl, S.R.; Lautrup, B.; Ellegaard, C.; Levinsen, M.T.; Bohr, T. Double-slit experiment with single wave-driven particles and its relation to quantum mechanics. Phys. Rev. E 2015, 92, 013006. [Google Scholar] [CrossRef] [Green Version]
  21. Ellegaard, C.; Levinsen, M.T. Interaction of wave-driven particles with slit structures. Phys. Rev. E 2020, 102, 023115. [Google Scholar] [CrossRef] [PubMed]
  22. Murtagh, F. Multidimensional Clustering Algorithms in COMPSTAT Lectures 4; Physica-Verlag: Wuerzburg, Germany, 1985. [Google Scholar]
  23. R Core Team. R: A Language and Environment for Statistical Computing; R Foundation for Statistical Computing: Vienna, Austria, 2018; Available online: https://www.R-project.org/ (accessed on 20 November 2021).
  24. Horváth, A.K.; Nagypál, I. Classification of Clock Reactions. ChemPhysChem 2014, 16, 588–594. [Google Scholar] [CrossRef] [PubMed]
  25. Kaufman, L.; Rousseeuw, P.J. Finding Groups in Data: An Introduction to Cluster Analysis; John Wiley & Sons: New York, NY, USA, 2009. [Google Scholar]
  26. Available online: https://cran.r-project.org/web/packages/factoextra/factoextra.pdf (accessed on 20 November 2021).
  27. Tibshirani, R.; Walther, G.; Hastiee, T. Estimating the number of clusters in a data set via the gap statistic. J. R. Stat. Soc. Ser. B (Stat. Methodol.) 2001, 63, 411–423. [Google Scholar] [CrossRef]
  28. Pagnacco, M.C.; Maksimovic, J.P.; Jankovic, B.Z. Analysis of transition from low to high iodide and iodine state in the briggs–rauscher oscillatory reaction containing malonic acid using kolmogorov–johnson–mehl–avrami (kjma) theory. React. Kinet. Mech. Catal. 2018, 123, 61–80. [Google Scholar] [CrossRef]
  29. Genz, H. Symmetry and symmetry breaking in nature. Interdiscip. Sci. Rev. 1999, 24, 129–138. [Google Scholar] [CrossRef]
  30. Ruoff, P. Excitability in a closed stirred Belousov—Zhabotinskii system. Chem. Phys. Lett. 1982, 90, 76–80. [Google Scholar] [CrossRef]
  31. Rouff, P. Excitability created by oxygen inhibition in the stirred malonic acid belousov-zabotinskii system. Chem. Phys. Lett. 1982, 92, 239–244. [Google Scholar] [CrossRef]
  32. Vukojevic, V.; Anic, S.; Kolar-Anic, L. Investigation of dynamic behavior of the bray–liebhafsky reaction in the CSTR. Properties of the system examined by pulsed perturbations with I. Phys. Chem. Chem. Phys. 2002, 4, 1276–1283. [Google Scholar] [CrossRef]
  33. Muntean, N.; Szabo, G.; Wittmann, M.; Lawson, T.; Fulop, J.; Noszticzius, Z.; Onel, L. Reaction routes leading to CO2 and CO in the briggs−rauscher oscillator: Analogies between the oscillatory br and bz reactions. J. Phys. Chem. A 2009, 113, 9102–9108. [Google Scholar] [CrossRef]
  34. Bowers, P.G.; Noyes, R.M. Chemical oscillations and instabilities. 51. Gas evolution oscillators. 1. Some new experimental examples. J. Am. Chem. Soc. 1983, 105, 2572–2574. [Google Scholar] [CrossRef]
  35. Sevcik, P.; Kissimonova, K.; Adamcikova, L. Oxygen Production in the oscillatory bray−liebhafsky reaction. J. Phys. Chem. A 2000, 104, 3958–3963. [Google Scholar] [CrossRef]
  36. Stevanovic, K.Z.; Bubanja, I.N.M.; Stanisavljev, D.R. Is iodine oxidation with hydrogen peroxide coupled with nucleation processes? J. Phys. Chem. C 2019, 123, 16671–16680. [Google Scholar] [CrossRef]
  37. Turing, A.M. The chemical basis of morphogenesis. Philos. Trans. R. Soc. B Biol. Sci. 1952, 237, 37–72. [Google Scholar]
  38. Prigogine, I.; Nicolis, G. On symmetry-breaking instabilities in dissipative systems. J. Chem. Phys. 1967, 46, 3542–3550. [Google Scholar] [CrossRef]
Figure 1. Two independent measurements (a,b) of iodide potential vs. time obtained for BR reaction under experimental conditions: [H2MA]0 = 0.0789 mol/dm3, [MnSO4]0 = 0.00752 mol/dm3, [HClO4]0 = 0.03 mol/dm3, [KIO3]0 = 0.0752 mol/dm3, [H2O2]0 = 1.176 mol/dm3, T = 37.0 °C. The experiments were performed without stirring and without protection from light. τ* denotes the time from the end of the oscillatory mode to the occurrence of state I→state II transition.
Symmetry 14 00413 g001
Figure 2. Briggs–Rauscher oscillation amplitude (a) and time between two neighboring oscillation maxima τn−(n−1) = tntn−1 (b) in the two independent measurements presented at Figure 1. The resulting BR oscillograms have the same number of oscillations (Nosc = 33) and identical oscillation period, however the time of state I→state II transition differs more than 10 times (as shown at Figure 1).
Symmetry 14 00413 g002
Figure 3. Typical measurements with iodide-sensing and reference electrodes with different mixing rates and different shapes of magnetic bar: (a) 100 rpm with magnetic stirring bar, PTFE-coated cylindrical, 10 mm length, 4 mm diameter (in inset), (b) 300 rpm with magnetic stirring bar, PTFE-coated cylindrical, 10 mm length, 4 mm diameter (in inset), (c) 100 rpm with magnetic stirring bar, PTFE-coated cylindrical, 20 mm length, 6 mm diameter (in inset), and (d) 100 rpm with magnetic stirring bar, PTFE-coated triangular, 12 mm length, 6 mm diameter (in inset). The reactant concentrations are identical as in Figure 1.
Symmetry 14 00413 g003
Figure 4. Clusters obtained for thirty experiments run without stirring of the reaction mixture (a) and clusters obtained for thirty experiments run with stirring of reaction mixture in the vessel, stirring rate was 100 rpm (b). τosc is the BR oscillatory time, while τ* denotes the time from the end of the oscillatory mode to the occurrence of state I→state II transition (see Figure 1).
Symmetry 14 00413 g004
Figure 5. The optimal number of clusters for one parameter analysis by parameter τ* (time when state I to state II transition occurs) for non-mixing conditions (a) and mixing conditions 100 rpm (b).
Symmetry 14 00413 g005
Figure 6. The evidence of two clusters for state Istate II transition obtained for mixing condition in BR system. Clusters are plotted in two dimensions (Dim1 and Dim2).
Symmetry 14 00413 g006
Figure 7. Possible symmetry breaking during the transition from the state I (low iodide and iodine concentration) to state II (high iodide and iodine, with segregation of solid iodine) in Briggs–Rauscher oscillatory reaction after an oscillatory period. Energetic consideration and symmetry breaking depending on control parameter, μ and ordering parameter, ρ. ∆V corresponds to the energy threshold of the formation of solid iodine from chemical reactions that occur in the BR solution after oscillatory period.
Symmetry 14 00413 g007
Table 1. Clusters and Cluster centroids.
Exp. ConditionClusterNumber of Cluster MembersCluster Centroids in Minute
τoscτ*
1151.6863.036
without stirring2131.69116.672
32//
1161.6815.893
with stirring2101.65826.536
34//
Publisher’s Note: MDPI stays neutral with regard to jurisdictional claims in published maps and institutional affiliations.

