Article

Conformer Selection by Electrostatic Hexapoles: A Theoretical Study on 1-Chloroethanol and 2-Chloroethanol

1
Dipartimento di Chimica, Biologia e Biotecnologie, Università degli Studi di Perugia, 06123 Perugia, Italy
2
Dipartimento di Medicina, Università degli Studi di Perugia, 06123 Perugia, Italy
3
Department of Chemistry, School of Science, Tokyo Institute of Technology, Meguro, Tokyo 152-8550, Japan
4
Department of Chemistry, Graduate School of Science, Osaka University, Toyonaka, Osaka 560-0043, Japan
5
Department of Chemistry, National Chung Hsing University, Taichung 402, Taiwan
*
Author to whom correspondence should be addressed.
Symmetry 2022, 14(2), 317; https://doi.org/10.3390/sym14020317
Submission received: 29 December 2021 / Revised: 24 January 2022 / Accepted: 1 February 2022 / Published: 4 February 2022

Abstract

:
The electrostatic hexapole is a versatile device that has been used for many years in gas-phase experiments. Its inhomogeneous electric field has been employed for many purposes such as the selection of rotational states, the selection of clusters, the focusing of molecular beams, and molecular alignment as a precursor for molecular orientation. In the last few years, the hexapolar electric field has been demonstrated to be able to control the conformer composition of molecular beams. The key point is that conformers, where the component of the permanent electric dipole moment with respect to the largest of the principal axes of inertia is close to zero, require more intense hexapolar electric fields to be focused with respect to the other conformers. Here, we simulated the focusing curves of the conformers of 1-chloroethanol and 2-chloroethanol under hypothetical beam conditions, identical for all conformers, in a hypothetical and realistic experimental setup with three different hexapole lengths: 0.5, 1, and 2 m. The objective was to characterize this selection process to set up collision experiments on conformer-selected beams that provide information on the van der Waals clusters formed in collision processes.

Graphical Abstract

1. Introduction

Electrostatic hexapoles are devices formed by six rods in metal of a length commonly included in the range of 0.5–2 m. They have been employed in gas phase experiments combined with molecular beams to study stereodynamics effects in photodissociation and collision processes [1,2]. The six rods generate a non-uniform electric field, the intensity of which is 0 along its axis, that coincides with the axis of propagation of the molecular beam and increases by approaching the rods. Such a field works as a lens by focusing the molecular beam. Additionally, the hexapolar field acts as a rotational state-selector: for symmetric-top molecules, the rule is that only those states with KM < 0 are focused and the remaining states are deflected. The quantum numbers K and M are the components of the total angular momentum J with respect to the molecular axis and the quantization axis, respectively. For hexapoles, the quantization axis is the electric field, the direction of which is perpendicular to the beam propagation axis. In addition to the sign of the KM product, a more general requisite for a rotational state to be selected is to exhibit a positive Stark energy. This firstly implies that molecules must possess an appreciable permanent dipole moment, commonly higher than 0.6 D. Hexapoles have been employed to select rotational states in linear and symmetric-top molecules [3,4,5,6,7]. In the 21st century, the hexapolar technique has been extended to asymmetric-top molecules, initially to CH2F2 [8] and later to molecules of increasing complexity such as propylene oxide [9,10] and 2-butanol [11], where the increasing molecular weight made the rotational state manifold much denser and more congested than that of the previously investigated molecules, thus making it impossible to select a single rotational state. Nevertheless, the hexapole turned out to be an excellent cluster selector since the formation of clusters normally leads to the cancellation of the dipole moment [12]. Most of all, the hexapolar field produces molecular alignment, i.e., molecular rotation occurs not randomly but around a preferential axis under the effect of the hexapolar field. Aligned molecules can be easily oriented by applying a homogeneous field to hexapole aligned molecules. Unlike alignment, molecular rotation is established around a preferential axis with a preferential sense. Alignment and orientation are important operative conditions in stereodynamics experiments since they allow researchers to observe the geometrical features of a system that would be inevitably concealed by random rotation [13]. The weak and stationary electric fields obtained by the combination of hexapolar and homogeneous direct current fields allow for the obtainment of polarized beams suitable for single or crossed molecular beam experiments [12]. Applications of this technique have gained considerable success in the stereodynamic studies of inelastic collisions [13], reactive scattering [14,15], gas–surface reactions, electron transfer collisions [16,17], and photodissociation [18,19,20,21,22]. For the control of molecular collisions by external fields, see also [23].
One of the most recent applications of hexapoles is conformer selection, since it has been observed that hexapolar fields are capable of changing the conformer composition of molecular beams [11]. Focusing curves, i.e., the transmitted molecular beam intensity as a function of the hexapole voltage, can drastically change depending on the components of the permanent electric dipole moment, even if their module is globally similar. Chang et al. [24,25] studied the specific chemical reactivity on the spatially separated rotamers of 3-aminophenol by electrostatic deflection, and the two cis and trans conformers were characterized by significantly different electric dipole moments of 0.77 and 2.33 D, respectively. Separation by electrostatic deflection was also performed on methyl vinyl ketone [26] and various diene conformers [27]. Very recently, the Diels–Alder cycloaddition mechanism in dibromobutane was investigated with a conformationally controlled molecular beam with trapped ions [28].
With resonant photoelectron spectroscopy, Huang et al. [29,30] developed a method to obtain information on conformation-selection regarding dipolar molecular radicals by dipole-bound excited states of the corresponding anions cooled in a cryogenic ion trap. Brand et al. [31] proposed a technique for conformer selection independent of the dipole moment and the spin based on matter-wave diffraction.
In this work, we simulated the focusing curves of the two rotamers of 1-chloroethanol, CH3–CHCl(OH), and the five conformers of 2-chloroethanol, CH2Cl–CH2(OH) (Figure 1). We considered identical hypothetical experimental conditions for both molecules. The focusing curves were simulated for different values of the hexapole length—0.5, 1, and 2 m—in order to evaluate possible effects to the focusing of the various conformers. Additionally, we calculated the focusing curves while considering three different values of the vibrational temperatures (100, 200, and 300 K), which allowed us to define the relative population of conformers according to the Boltzmann distribution. This work represents a preliminary investigation to establish the best conditions for future collisional experiments on selected conformers by crossed molecular beams or scattering experiments, which arguably provide information about the intermolecular interactions on the formation of van der Waals clusters formed by the colliding particles and, in the case of differential cross-section measurements, information about their angular distribution (e.g., [32,33,34]).
We conclude this section providing definition of rotamers and conformers according to the IUPAC: conformational isomers (or conformers) can be interconverted by rotations about single bonds; when only one specific bond is involved, they are called rotamers [35].

2. Background

2.1. Conformers and ab Initio Calculations

The molecules we considered in this work were 1-chloroethanol and 2-chloroethanol (Figure 1). The 1-chloroethanol molecule presented two stable rotamers that we identified as A and S and that were interconverted by torsion around the C–O bond. In the A rotamer, the dihedral angle between the OH and the CH3 groups was approximately 180°, while in the S rotamer, the dihedral angle between these two groups was about 60°. Regarding 2-chloroethanol, we optimized five stable conformers that were interconverted by torsion around the C–O and C–C bonds. We have denoted the five conformers by Aa, As, Sa, Ss+, and Ss (in Figures S1–S7 of Supplementary Materials, we report the structures of the conformers with the direction of the dipole moments). The uppercase letters A and S are related to the torsion around the C–O bond and indicate the approximate value of the dihedral angle between the H and CH2Cl groups; A is related to the dihedral angle of ca. 180°, while S corresponds to ca. 60°. The lowercase letters refer to the torsion around the C–O bond and specifically the mutual position between H (bounded to O) and the CH2Cl group. The index a corresponds to a dihedral angle of about 180 °C, while s+ and s− correspond to a dihedral angle of 60°. The signs + and − identify the sense of the torsion; + is a clockwise torsion from the conformation with H and CH2Cl eclipsed (dihedral angle of 0°), while − corresponds to an anti-clockwise torsion.
The molecular geometries of the various conformers and rotamers of 1-chloroethanol and 2-chloroethanol [36,37] were optimized with the Gaussian 09 software package (Gaussian, Inc., Wallingford, CT, USA) [38] at the MP2 level of theory with the aug-cc-pVTZ basis set (Tables S1–S7). The same software with the same level of theory and basis set was also used to calculate the permanent dipole moments μ [39] and their components with respect the principal axes of inertia μA, μB, and μC; the rotational constants A, B, and C; and the relative energies E for the various conformers or rotamers.

2.2. Asymmetric-Top Molecules

Rotors are classified as linear-, symmetric-, and asymmetric-top, depending on the relation among the components of their moments of inertia along the three principal axes, a, b, and c, respectively [40]. Linear-top molecules are characterized by having two identical components and a third much smaller one (almost 0); symmetric-tops have two identical components and one smaller (prolate-tops, cigar-shaped) or larger (oblate-tops, disk-shaped) component; finally, asymmetric-top molecules have three unequal components. The rotational states of symmetric-tops are described by three quantum numbers: the total angular momentum J (J is 0 or a positive integer number) and its components with respect to the principal axis of the body-fixed frame (molecular frame), K (−JKJ), and with respect to a quantization axis of space-fixed frame (laboratory frame), M (−JMJ). In free-field conditions, states that share the same M quantum number are degenerate, though such degeneracy can be partially or completely removed by external fields. The rotational states of asymmetric-tops can be expressed in terms of the linear combination of symmetric-top wavefunctions, either prolate or oblate types. For this reason, K is no longer a good quantum number and can be replaced by the pseudo quantum number τ, given by the combination of K−1 and K+1 that represent the K quantum number of the rotor at the prolate- and oblate-top limits, respectively.
Rotational wave functions of asymmetric-top molecules are given as a linear combination of symmetric-top molecules according to the following scheme:
A J τ M = K a K J τ M Ψ J K M
where the energy of the rotational states is given by
W J τ M = 1 2 ( A + C ) J ( J + 1 ) + 1 2 ( A C ) W J τ M ( k )
where a K J τ M and W J τ M ( k ) are the eigenvectors and the eigenvalues, respectively, obtained from the diagonalization of the rotational Hamiltonian matrix that is represented in either prolate or oblate symmetric-top basis. A, B, and C are the rotational constants of the principal axes (a, b, and c), while k is the Ray’s parameter, k = (AC)/(2BAC), that indicates the “asymmetry” of the rotor, being −1 for prolate-tops and +1 for oblate-tops [9].

2.3. The Stark Effect

Herein, we only consider polar molecules in electric fields not intense enough to polarize non-polar molecules. The exertion of an electric field to a molecule with non-zero permanent dipole moment can alter the eigenvalues of molecular rotational levels and cause the removal of the degeneracy for what concerns the M quantum number. In the hexapole electric field, the 2J + 1 degeneracy of states with the same J but different M is reduced to J + 1 manifolds with different |M|, where 0 ≤ |M| ≤ J [9]. The change in energy of the rotational states is known as Stark energy and depends on the applied electric field. In addition, electric fields with higher strength can further mix the rotational levels with different J in each |M| manifold, which is the so-called higher-order Stark effect that makes J a no-longer-good quantum number. The field dependence of Stark energy is usually linear for symmetric-top molecules and quadratic for asymmetric-top molecules. Such a behavior is commonly respected in case of small molecules with weak electric fields, and it is usually treated in the ansatz of first order perturbation. To incorporate the complete Stark effect, we applied a more rigorous approach based on the diagonalization of the full Hamiltonian matrices of Stark interaction, where the dependence on the electric field is explicit (see [10]). This approach was necessary for the electric field strength and molecules we considered in this work.
As seen for free-field asymmetric-top molecules, field-dependent rotational energy levels and related wave functions, W J τ M ( E ) and the C J τ M ( E ) , respectively, are calculated as eigenvalues and eigenvectors obtained from the matrix diagonalization of the Stark Hamiltonian, HS [8]. The Hamiltonian matrix is diagonalized according to the following equation, to provide the related eigenvalues as a function of the electric field,
W S ( E ) = C H S C T
where C is the orthogonal matrix of the eigenvectors and CT is its transposed from.
The hexapole electric field, E, is given by the following equation:
E = 3 V r 2 R 3
where V is the hexapole voltage, R is the radius of the hexapole, and r is the distance of the molecule from the axis of the hexapole. The magnitude of the force in such a field is obtained by deriving the energy of the rotational states depending on the electric field with respect to r
J τ M ( r ) = d W J T M ( E ) d r = d W J T M ( E ) d E d E d r
The negative sign of the force is indicative of focusing trajectories; it corresponds to positive values of the Stark energy, W J T M ( E ) . On the contrary, positive values of the force corresponding to negative values of the Stark energy indicate the divergence of the trajectories from the axis region of the hexapole state selector. The force, J τ M ( r ) , is calculated by analytically deriving dE/dr
d E d r = 6 V 0 r R 3
The analytic value of d W J τ M / d E is obtained by generalizing the Hellmann–Feynman theorem [10]:
d W J τ M d E = [ C d H S d E C T ]
where d H S / d E = ( g = a , b , c ) μ g Φ Z g , in which μ g   and   Φ Z g are the dipole moment components in molecular frame and elements of the direction cosine matrix, respectively, that are analytically known. Derivatives d W J τ M d E   were calculated in the electric field range of 0–80 kV/cm in steps of 0.5 kV/cm, sufficiently closed for linear interpolation.

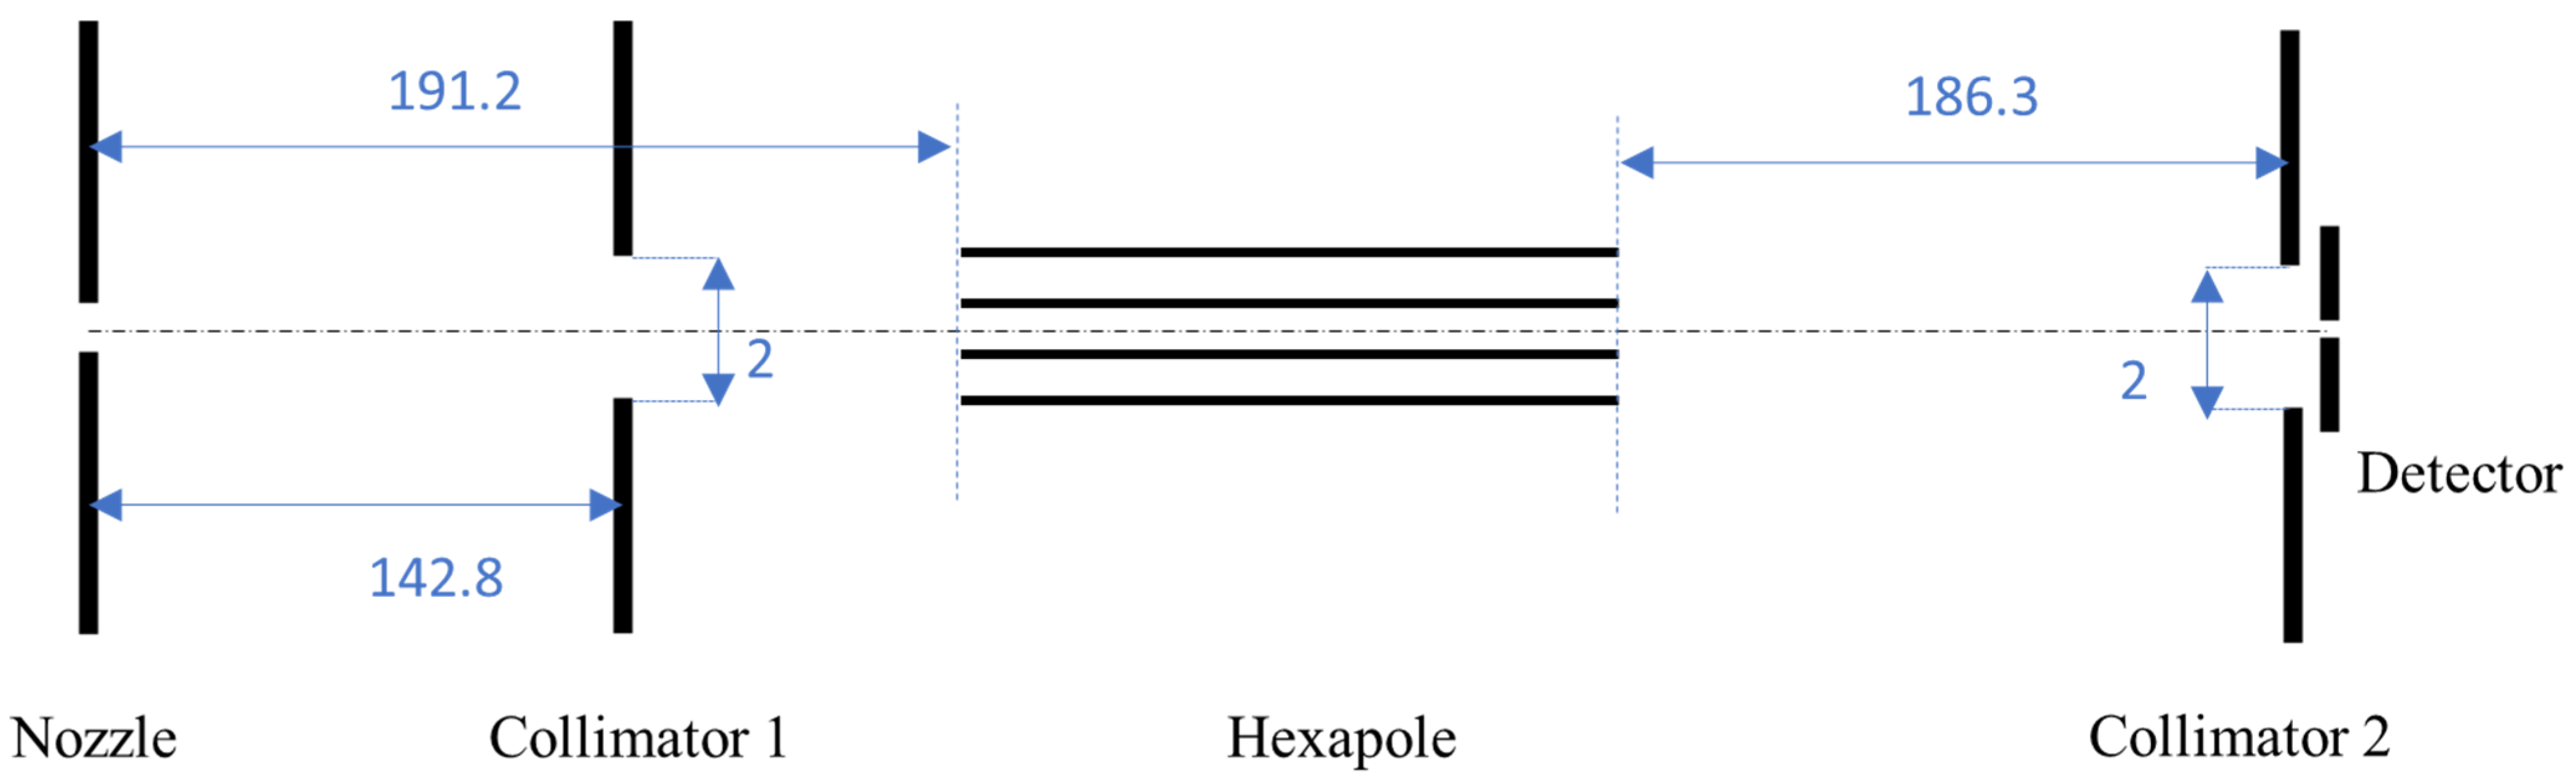
2.4. Focusing Curves and Trajectory Simulations

In Figure 2, we report the scheme of a typical single molecular beam apparatus with an electrostatic hexapole. The gas is expanded from the nozzle and selected in direction by two collimators when entering and exiting from the hexapole before reaching the detector that measures the beam intensity. In Figure 2, we also report the geometric characteristics of the hypothetical experimental apparatus considered in the trajectory simulations. The lengths of the hexapole were set to 0.5, 1, and 2 m, and the radius (i.e., the minimum distance between the axis of the hexapole and the surface of the rods) was set to 6 mm. The section of the rods was assumed to be cylindrical.
The performance of state-selection and beam-focusing of a specific setting of hexapole apparatus is characterized by focusing curves that reports the variation of the molecular beam intensity as a function of the hexapole voltage. The assignment and interpretation of experimental focusing curves rely on the forward convolution of a state-resolved theoretical counterpart obtained by conducting classical trajectory simulations. The typical procedure of such simulations requires the detailed knowledge of the molecule-field interactions and geometrical features of the experimental apparatus, as well as the characteristics of the molecular beam such as molecular velocity, spatial, and internal state distributions.
Trajectory simulation was performed by a code implemented in our laboratory. The algorithm adopted the Euler method [41] to integrate the Newton equations of motion using a Cartesian coordinate reference frame transversal to the hexapole axis. The initial position refers to a point source from the nozzle, while the initial velocity distribution is given by
f ( v ) = v 3 e x p ( v v m α ) 2
where v is the initial velocity, vm is the maximum velocity, and α is the half-maximum full-width of the velocity distribution. We considered a hypothetical supersonic molecular beam with vm = 500 m/s and α = 30 m/s. The initial velocity distribution was sampled by choosing equally spaced intervals (201 intervals). The time-step size for the integration was set to 10−5 s, similarly to previous works, and the convergence of the outcome was checked.
Trajectories were simulated for each rotational state, according to the Boltzmann distribution of the rotational states, assuming a rotational temperature of 20 K. The maximum value of J, JMAX = 23, was established after convergency tests. For each conformer and hexapole length, we simulated 9500 rotational states on 23 values of hexapole voltage that were equally spaced from 0 to 14,665.2 V.
The amount of molecules that converged toward the detector can be used to determine the beam intensity, and a focusing curve can be obtained by plotting beam intensity as a function of the hexapole voltage. Here, we shifted the minimum value of the beam intensity to 0. Since the trajectories are strongly dependent on the dipole moment, one expects that molecular structures with different dipole moments, or different components of the dipole moment, exhibit different focusing curves (as shown in [11]).

3. Results and Discussion

In Table 1, we report the molecular properties of the two conformers of 1-chloroethanol and the five conformers of 2-chloroethanol: the permanent dipole moments μ and their components with respect the principal axes of inertia μA, μB, and μC; the rotational constants A, B, and C; and the relative energies E. We also report the relative populations of the conformers in the context of different vibrational temperature values. In [11], for 2-butanol, the vibrational temperature of a mixture of conformers was estimated by the best fit between experimental and theoretical focusing curve while considering spectroscopic information [42,43,44]. Howard et al. found that Ar is much more efficient in the vibrational relaxation of 2-butanol than He. In [11], the authors estimated vibrational temperatures of 200 and 50 K for 2-butanol-He and 2-butanol-Ar, respectively. Here, we calculated the relative populations for hypothetical vibrational temperature values of 100, 200, and 300 K. Vibrational temperatures lower than 100 K were excluded since they would only select the most stable conformer and not allow for any consideration of the effects of the hexapole voltage, which was the main target of this work.
In Figure 3, we report the focusing curves of 1-chloroethanol under the electric field of a 0.5 m hexapole at vibrational temperatures, ΘV, of 200 and 300 K. According to the Boltzmann distribution, at 300 K, the beam comprised 71% A and 29% S, while a decreasing of the temperature led to the enrichment in the A conformer: 79% at 200 K, 94% at 100 K, and 99.5% at 50 K. This aspect is obvious, but the employment of the seeding effect to select the conformers, i.e., the molecular beam is expanded in a mixture with a lighter gas (e.g., helium or argon) determining rotational and vibrational relaxation, was already discussed in [11]. It is remarkable to observe that the composition of the beam could be modulated by varying the hexapole voltage. At 200 K, the composition of the beam could be varied from 49% of A and 51% of S at 3.3 kV up to 83% of A and 17% of S from 8 to 15 kV. At 300 K, the composition of the beam was 37% of A and 63% of S at 3.3 kV and increased up to 75% of A at ca. 9 kV. He-focusing curves for the 1-chloroethanol in 1 m hexapole, ΘV = 300 and 200 K, are reported in Figure 4. Analogously to the case of the 0.5 m hexapole, the composition of the beam could be varied within a certain range depending on the hexapole voltage. The amount of A was about the 73% for ΘV = 300 K and about 82% for ΘV = 200 K. However, we want to draw the reader’s attention on the focusing curve for ΘV = 300 K at low voltages (see the inset in the upper panel of Figure 4); the composition of the beam was 35% A and 65% S at ca. 1.3 kV and even lower than the 35% of A in the range of 1–1.2 kV. Here, the response of the focused S conformer to the increase of the voltage was much higher than that of the A conformer, resulting in an enrichment in S in the beam composition, although in field-free conditions the population of A was about six times higher. A drawback was the reduced intensity of the beam, which was about twenty times lower than the highest intensity at 15 kV. This could be troublesome in case of weakly intense beams. For 1-chloroethanol in a 2 m hexapole (Figure 5), the A conformer was the most populated one in the whole range of hexapole voltages. The population of A was about the 70% for ΘV = 300 K, varying within a few percentage units from 0 to 15 kV, while for ΘV = 200 K, the population of A was about 80%, with small variations at low voltage.
The 2-chloroethanol molecule presented a complex manifold of conformers with respect to 1-chloroethanol. At ΘV = 300 K, the beam composition was 88.4% Ss+, 4.7% As, 4.7% Aa, 1.5% Sa, and 0.7% Ss−. The relative population of Ss+ was further increased as the vibrational temperature decreased. At ΘV = 200 K, the beam comprised 97.3% Ss+; at ΘV = 100 K, this value became 99.9%; at ΘV = 50 K, this value almost 1. In Figure 6, we report the focusing curve for the hexapole length l = 0.5 m. The focusing curve of Ss+ required a high hexapole voltage, but for a voltage lower than 10 kV, this conformer was almost absent in the beam. The beam itself required more than 2 kV to enhance its intensity. For ΘV = 300 K, at 4 kV, the most populated conformers were Sa (54.9%) and Aa (35.4%) and As, Ss−, and Ss+ comprised 4.5%, 4.1%, and 1.1%, respectively. At 8 kV, the composition was as follows: 39.9% Aa, 35.8% Sa, 12.0% Ss−, 11.0% As, and 1.3% Ss+. At 12 kV, the composition of the beam became more equilibrated: 38.7% Aa, 26.2% Sa, 17.4% As, 12.2% Ss−, and 5.5% Ss+. At 15 kV, the population of Ss+ remarkably increased to 23.0%, while the population of all the other conformers decreased: 31.5% Aa, 16.7% As, 19.8% Sa, and 9.0% Ss−. For ΘV = 200 K, the Aa conformer was the most populated for hexapole voltage until 8 kV, at 49%, while Sa reached 39.9% at 4 kV and 24.5% at 8 kV. Concerning the other conformers, As increased from 5.9% at 4 kV to 13.5% at 8 kV, while Ss+ and S− were lower than 10% until 8 kV. At 12 kV, Aa was still the most populated conformer at 38.8%, while Ss+ increased by up to 24.1%; As increased to 17.6%, Sa decreased to 14.7%, and the relative population of Ss- became 4.8%. At the highest value of hexapole voltage, ca. 15 kV, Ss+ became the most populated conformer at 61.5%, Aa decreased to 19.3%, As decreased to 10.3%, Sa decreased to 6.8% and Ss− decreased to 2.2%. Following further decreases in the vibrational temperature, ΘV = 100 K, the Ss+ conformer became predominant even at low voltages, ca. from 90% at 3 kV up to 99% at 15 kV.
In Figure 7, we show 2-chloroethanol in a 1 m hexapole at ΘV = 300 K and ΘV = 200 K. At 4 kV, the populations were as follows: 43.2% Aa, 28.2% Sa, 15.6% As, 13.0% Ss−, and a negligeable amount of. At 8 kV, the composition of beam drastically changed: Ss+ became the most populated conformer at 65.9%, Aa comprised 10.8%, As comprised 10.4%, Sa comprised 5.4%, and Ss− comprised 3.0%. Further increases in the hexapole voltage did not significantly alter the composition of the beam. Insets in Figure 7 show details of the focusing curve in the ranges of 1–6 kV for ΘV = 300 K and 2–6 kV for ΘV = 200 K. The conformers could be classified into two categories according to the dependence of the beam intensity on the hexapole voltage. The focusing curve of the Aa conformer showed an increasing beam intensity at low values of the hexapole voltage, just after zero volt, then gradually increased up to the maximum voltage applied; this is the behavior of a σ-type focusing curve (see [11]). This kind of focusing curve is typical of molecules with a strong component of the dipole moment on the A-axis of inertia (see Table 1). It must also be considered that Aa was a near prolate-top molecule, k = 0.99. The conformers Sa and Ss−, similarly to Aa, presented quick increases in the focusing curve even at low voltages, although the focusing curve became flatter with the increases in the hexapole voltage.
These focusing curves were σ-type too, since the conformers possessed a strong component of the dipole moment, μA, even if the charge distribution was more equilibrated on the three principal axes of inertia with respect to Aa in this case. Finally, As and Ss+ presented a “late response” to the increasing of the hexapole voltage, so the focusing curves could be classified as λ-type. This behavior was very pronounced for Ss+, where μA was almost zero. In Figure 8, we report the focusing curves of 2-chloroethanol and its conformers, simulated with a hexapole of 2 m in length. At both ΘV = 300 K and ΘV = 200 K and low voltages, the most populated conformer was Aa, thus confirming our interpretation given above. It is interesting to see how the Aa conformer, at a voltage lower than 1 kV, comprised about 72% at ΘV = 300 K and 82% at ΘV = 200 K, while Sa comprised 23% at ΘV = 300 K and 14% at ΘV = 200 K. Here, analogously to the other case at low hexapole voltage, the drawback was the weak beam intensity, especially for the case of ΘV = 200 K, for the enhancement of the beam intensity cannot be appreciated from the plot, though the situation was better for ΘV = 300 K. Increasing of the voltage drastically changed the composition of the beam. At ΘV = 300 K, 4 kV, Ss+ is the most populated conformer at 62.5%, Aa comprised 18.6%, As comprised 9.9%, Sa comprised 6.3%, and Ss− comprised 2.7%. At 8 kV, the amount of Ss+ increased to 73.8%, As comprised 13.0%, As comprised 7.1%, Sa comprised 4.2%, and Ss− comprised 1.9%. At 12 kV, the population of Ss+ reached 81.1%, Aa reached 8.8%, As reached 5.7%, Sa reached 3.0%, and Ss− reached 1.5%. Finally, at ca. 15 kV, the population of Ss+ reached 82.6%, As reached 8.0%, As reached 5.4%, Sa reached 2.6%, and Ss− reached 1.3%. Decreasing of the vibrational temperature to 200 K led to a further selection in favor of Ss+, the relative population of which increased to 89.1% at 4 kV, 93.3% at 8 kV, 95.5% at 12 kV, and 95.9% at 15 kV. The steep increasing of the focusing of the Ss+ conformer led to a gradual decrease in the relative populations of the other conformers. The Aa conformer changed from an initial 82.2% at 1 kV to 6.1% at 4 kV, 3.8% at 8 kV, 2.4% at 12 kV, and 2.1% at 15 kV. Similarly, Sa changed from an initial 14% at 1 kV to 1.2% at 4 kV, 0.6% at 8 kV, 0.4% at 12 kV, and 0.4% at 15 kV. Regarding As and Ss−, the relative populations remained constantly low, a few percent units for As and less than 1% for Ss−, along the whole range of hexapole voltage. In Tables S8–S29 of Supplementary Materials, we report the populations of the selected rotational states and those of the selected conformers for the 23 hexapole voltage grid points from 0 to 14,665.2 kV at vibrational temperatures 100, 200, and 300 K.

4. Conclusions

We have reported a theoretical study on conformer selection by electrostatic hexapole of the 1-chloroethanol and 2-chloroethanol molecules, preliminary regarding the application of the conformer selection in photodissociation and collision experiments of molecular beams. We simulated the focusing curves of two conformers of 1-chloroethanol and five conformers of 2-chloroethanol by calculating nearly 100,000 trajectories under hypothetical supersonic beam conditions for three different values of vibrational temperatures (100, 200, and 300 K) and three different hexapole lengths (0.5, 1, and 2 m). The 1-chloroethanol presented two conformers, A and S. The A conformer was stabler than S by 3.85 kJ/mol, and its relative population according to the Boltzmann distribution at 300 K, without the action of external fields, was 82%. One could change the beam conditions to decrease the vibrational temperature and select the A conformer. However, it was possible to change the beam composition by only varying the hexapole voltage. Both A and S presented σ-type focusing curves, although the different components of the dipole moment conferred a steeper increasing of the beam intensity at low hexapole voltage to the S conformer, allowing us to obtain a relative population of S of more than 50%. This was more evident at 300 K in the 1 m hexapole. High values of the hexapole voltage led to a better selection of the A conformer, increasing the relative population with respect to the free-field conditions by a few percent units.
The conformer manifold in 2-chloroethanol was more complex than the previous investigated molecule, although at 300 K, without the action of external fields, Ss+ was the predominant component with 88% of relative population. The As and Aa conformers were the second and the third most populated ones, respectively, with relative populations of less than 5% and relative energies of ca. 7.3 kJ/mol. The Sa and Ss− conformers were the least stable (10.2 and 12.0 kJ/mol, respectively), and their relative populations were 1.5% and 0.7%, respectively. Decreasing the vibrational temperature led to a further selection in this case, enhancing the relative population of Ss+. The application of the hexapolar field allowed us to drastically change the beam compositions. At low voltages, it was possible to obtain beams with a strong contribution of Aa and generally significant contributions of the other conformers except for Ss+, the relative population of which was negligeable. The Ss+ conformer, with the μA component close to zero, needed high hexapole voltage and long hexapoles to be focused. On the contrary, short hexapoles allowed us to obtain beams with remarkable contribution from the conformers that would be almost negligeable without the application of external fields. At ΘV = 300 K, it was possible to obtain beams with a predominant contribution from the Aa conformer. The drawback of such operative conditions is a low beam intensity.
The realization of an experimental apparatus must provide intense transmitted molecular beam intensity and high duty cycles, as required by scattering experiments. An electrostatic hexapole is a suitable device for this kind of application because it works as an electrostatic lens, focusing the molecular beam along the axis of propagation. Additionally, a hexapole offers the advantage of working with aligned or oriented molecules. The beam selection in favor of a certain conformer can be influenced by the hexapole length. Conformers characterized by a σ-type focusing curve are best selected by short hexapoles, while conformers with λ-type focusing curves need long hexapoles for optimal focusing. As discussed in [11], the choice of the molecule to be investigated must include conformers that present remarkable differences of the dipole moment, especially that which concerns μA. Beam conditions, e.g., pure or seeded in rare gases (lighter than the investigated molecules), determine the supersonic or effusive conditions of a beam and consequently the vibrational temperature, the rotational temperature, and the velocity distribution. Here, we widely discussed the effect of the vibrational temperature; in [11] and in [42,43,44], the authors showed that Ar produced a stronger relaxation of the vibrational states of 2-butanol, if compared to He. The effects of velocity distribution and rotational temperature were not discussed here. Since these aspects are somewhat correlated, i.e., cannot be changed “independently” each other, they should be considered from an experimental point of view.
Developments of this technique should consider the realization of collision experiments, such a crossed molecular beams and scattering experiments, e.g., with rare gases. This kind of experiment, performed under high velocity and angular resolution, would allow for the measurement of differential cross-sections as a function of the angular distribution of the colliding species and the integral cross-section as a function of the velocity, providing information on the equilibrium and long-range interactions of the van der Waals clusters formed in the collision process.

Supplementary Materials

In Supplementary Information, we report the direction of the dipole moment vector in the optimized geometries (Figures S1–S7), the equilibrium structures of the two rotamers of 1-chloroethanol, and the five conformers of 2-chloroethanol in Cartesian coordinates (Tables S1–S7). We also report the population of rotational states (in arbitrary units) according to the quantum number M, calculated for the values of the hexapole voltage considered in the trajectory simulations (Tables S8–S29), and the population of conformers (in arbitrary units, with the minimum value shifted to zero, calculated for vibrational temperatures ΘV = 100, 200, and 300 K in correspondence with the values of the hexapole voltage considered in the trajectory simulations (Tables S30–S35).

Author Contributions

Conceptualization, F.P.; methodology, F.P., M.N. and D.-C.C.; validation, C.C., P.-Y.T., M.N., D.-C.C. and F.P.; formal analysis, C.C. and F.P.; investigation, C.C. and F.P.; resources, F.P.; data curation, F.P.; writing—original draft preparation, F.P.; writing—review and editing, P.-Y.T. and F.P.; supervision, F.P.; funding acquisition, F.P. All authors have read and agreed to the published version of the manuscript.

Funding

CC and FP acknowledge the Italian Ministry for Education, University and Research (MIUR) for financial support through SIR 2014, Scientific Independence of Young Researcher (RBSI14U3VF).

Institutional Review Board Statement

Not applicable.

Informed Consent Statement

Not applicable.

Data Availability Statement

Data supporting reported results are given in Supplementary Information.

Acknowledgments

The authors are grateful to Toshio Kasai and King-Chuen Lin for the many opportunities and the interesting discussions about this fascinating theme.

Conflicts of Interest

The authors declare no conflict of interest.

References

  1. Kramer, H.K.; Bernstein, R.B. Focusing and orientation of symmetric-top molecules with the electric six-pole field. J. Chem. Phys. 1965, 742, 767. [Google Scholar] [CrossRef]
  2. Brooks, P.R.; Jones, E.M.; Smith, K. Orienting polar molecules in molecular beams Symmetric tops. J. Chem. Phys. 1969, 51, 3073. [Google Scholar] [CrossRef]
  3. Hain, T.D.; Weibel, M.A.; Backstrand, K.M.; Curtiss, T.J. Rotational state selection and orientation of OH and OD radicals by electric hexapole beam-focusing. J. Phys. Chem. A 1997, 101, 7674–7683. [Google Scholar] [CrossRef]
  4. Hashinokuchi, M.; Che, D.C.; Watanabe, D.; Fukuyama, T.; Koyano, I.; Shimizu, Y.; Woelke, A.; Kasai, T. Single |JΩM > state-selection of OH radicals using an electrostatic hexapole field. Phys. Chem. Chem. Phys. 2003, 5, 3911–3915. [Google Scholar] [CrossRef]
  5. Ohoyama, H.; Ogawa, T.; Kasai, T. A single rotational state analysis of the state-selected CH3I beam: A new Monte Carlo simulation including the second-order stark effect. J. Phys. Chem. 1995, 99, 13606–13610. [Google Scholar] [CrossRef]
  6. Imura, K.; Ohoyama, H.; Kasai, T. Structures and its dipole moments of half-sandwich type metal–benzene (1:1) complexes determined by 2-m long electrostatic hexapole. Chem. Phys. 2004, 301, 183–187. [Google Scholar] [CrossRef]
  7. Tsai, P.Y. On the state selection of linear triatomic molecules by electrostatic hexapole fields. J. Chem. Phys. 2016, 145, 104311. [Google Scholar] [CrossRef]
  8. Hain, T.D.; Moision, R.M.; Curtiss, T.J. Hexapole state-selection and orientation of asymmetric top molecules: CH2F2. J. Chem. Phys. 1999, 111, 6797. [Google Scholar] [CrossRef]
  9. Che, D.C.; Palazzetti, F.; Okuno, Y.; Aquilanti, V.; Kasai, T. Electrostatic hexapole state-selection of the asymmetric-top molecule propylene oxide. J. Phys. Chem. A 2010, 114, 3280–3286. [Google Scholar] [CrossRef]
  10. Che, D.-C.; Kanda, K.; Palazzetti, F.; Aquilanti, V.; Kasai, T. Electrostatic hexapole state-selection of the asymmetric-top molecule propylene oxide: Rotational and orientational distributions. Chem. Phys. 2012, 399, 180–192. [Google Scholar] [CrossRef]
  11. Palazzetti, F.; Maciel, G.S.; Kanda, K.; Nakamura, M.; Che, D.C.; Kasai, T.; Aquilanti, V. Control of conformers combining cooling by supersonic expansion of seeded molecular beams with hexapole selection and alignment: Experiment and theory on 2-butanol. Phys. Chem. Chem. Phys. 2014, 16, 9866–9875. [Google Scholar] [CrossRef]
  12. Imura, K.; Kasai, T.; Ohoyama, H.; Naaman, R. Focusing of DCl and HCl dimers by an electrostatic hexapole field: The role of the tunneling motion. J. Chem. Phys. 1999, 110, 355–358. [Google Scholar] [CrossRef]
  13. Rakitzis, T.P.; van den Brom, A.J.; Janssen, M.H.M. Directional dynamics in the photodissociation of oriented molecules. Science 2004, 303, 1852–1854. [Google Scholar] [CrossRef] [PubMed]
  14. Van Leuken, J.J.; van Amerom, F.H.W.; Bulthuis, J.; Snijders, J.G.; Stolte, S. Parity-resolved rotationally inelastic collisions of hexapole state-selected NO (2Π1/2, J = 1/2) with Ar. J. Phys. Chem. 1995, 99, 15573–15579. [Google Scholar] [CrossRef]
  15. Nagamachi, Y.; Ohoyama, H.; Ikejiri, K.; Kasai, T. Rotational state-resolved reaction cross-section in the reactions of state-selected CH with NO and with O2. J. Chem. Phys. 2005, 122, 064307. [Google Scholar] [CrossRef] [PubMed]
  16. Ohoyama, H.; Nagamachi, Y.; Yamakawa, K.; Kasai, T. Collision energy dependence of the rotational-state-resolved cross section in the CH(v = 0, J, Fi) + O2 → OH(A) + CO reaction. Phys. Chem. Chem. Phys. 2009, 11, 10281–10285. [Google Scholar] [CrossRef]
  17. Tsai, P.Y.; Che, D.C.; Nakamura, M.; Lin, K.C.; Kasai, T. Orientation dependence in the four-atom reaction of OH + HBr using the single-state oriented OH radical beam. Phys. Chem. Chem. Phys. 2010, 12, 2532–2534. [Google Scholar] [CrossRef]
  18. Tsai, P.Y.; Che, D.C.; Nakamura, M.; Lin, K.C.; Kasai, T. Orientation dependence for Br formation in the reaction of oriented OH radical with HBr molecule. Phys. Chem. Chem. Phys. 2011, 13, 1419–1423. [Google Scholar] [CrossRef]
  19. Nakamura, M.; Yang, S., Jr.; Tsai, P.Y.; Kasai, T.; Lin, K.C.; Che, D.C.; Lombardi, A.; Palazzetti, F.; Aquilanti, V. Hexapole-oriented asymmetric-top molecules and their stereodirectional photodissociation dynamics. J. Phys. Chem. A 2016, 120, 5389–5398. [Google Scholar] [CrossRef] [Green Version]
  20. Nakamura, M.; Yang, S., Jr.; Lin, K.C.; Kasai, T.; Che, D.C.; Lombardi, A.; Palazzetti, F.; Aquilanti, V. Stereodirectional images of molecules oriented by a variable-voltage hexapolar field: Fragmentation channels of 2-bromobutane electronically excited at two photolysis wavelengths. J. Chem. Phys. 2017, 17, 012917. [Google Scholar] [CrossRef] [Green Version]
  21. Nakamura, M.; Palazzetti, F.; Tsai, P.Y.; Yang, S., Jr.; Lin, K.C.; Kasai, T.; Che, D.C.; Lombardi, A.; Aquilanti, V. Vectorial imaging of the photodissociation of 2-bromobutane oriented via hexapolar state selection. Phys. Chem. Chem. Phys. 2019, 21, 14164–14172. [Google Scholar] [CrossRef] [PubMed]
  22. Che, D.C.; Nakamura, M.; Chang, H.P.; Lin, K.C.; Kasai, T.; Aquilanti, V.; Palazzetti, F. UV Photodissociation of Halothane in a Focused Molecular Beam: Space-Speed Slice Imaging of Competitive Bond Breaking into Spin–Orbit-Selected Chlorine and Bromine Atoms. J. Phys. Chem. A 2020, 124, 5288–5296. [Google Scholar] [CrossRef] [PubMed]
  23. Brouard, M.; Parker, D.H.; van der Meerakker, S.Y.T. Taming molecular collisions using electric and magnetic fields. Chem. Soc. Rev. 2014, 43, 7279–7294. [Google Scholar] [CrossRef]
  24. Chang, Y.P.; Długołęcki, K.; Küpper, J.; Rösch, D.; Wild, D.; Willitsch, S. Specific chemical reactivities of spatially separated 3-aminophenol conformers with cold Ca+ ions. Science 2013, 342, 98–101. [Google Scholar] [CrossRef] [Green Version]
  25. Rösch, D.; Willitsch, S.; Chang, Y.-P.; Küpper, J. Chemical reactions of conformationally selected 3-aminophenol molecules in a beam with Coulomb-crystallized Ca+ ions. J. Chem. Phys. 2014, 140, 124202. [Google Scholar] [CrossRef] [Green Version]
  26. Wang, J.; Kilaj, A.; He, L.; Długołęcki, K.; Willitsch, S.; Küpper, J. Spatial separation of the conformers of methyl vinyl ketone. J. Phys. Chem. A 2020, 124, 8341–8345. [Google Scholar] [CrossRef]
  27. Kilaj, A.; Gao, H.; Tahchieva, D.; Ramakrishnan, R.; Bachmann, D.; Gillingham, D.; von Lilienfeld, O.A.; Küpper, J.; Willitsch, S. Quantum-chemistry-aided identification, synthesis and experimental validation of model systems for conformationally controlled reaction studies: Separation of the conformers of 2,3-dibromobuta-1,3-diene in the gas phase. Phys. Chem. Chem. Phys. 2020, 22, 13431–13439. [Google Scholar] [CrossRef] [PubMed]
  28. Kilaj, A.; Wang, A.; Straňàk, P.; Schwilk, M.; Rivero, U.; Xu, L.; von Lilienfeld, O.A.; Küpper, J.; Willitsch, S. Conformer-specific polar cycloaddition of dibromobutadiene with trapped propene ions. Nat. Commun. 2021, 12, 6047. [Google Scholar] [CrossRef] [PubMed]
  29. Huang, D.H.; Liu, H.T.; Ning, C.G.; Wang, L.S. Conformation-Selective Resonant Photoelectron Spectroscopy via Dipole-Bound States of Cold Anions. J. Phys. Chem. Lett. 2015, 6, 2153–2157. [Google Scholar] [CrossRef]
  30. Zhu, G.Z.; Huang, D.L.; Wang, L.S. Conformation-selective resonant photoelectron imaging from dipole-bound states of cold 3-hydroxyphenoxide. J. Chem. Phys. 2017, 147, 013910. [Google Scholar] [CrossRef] [Green Version]
  31. Brand, C.; Stickler, B.A.; Knobloch, C.; Shayegi, A.; Hornberg, K.; Arndt, M. Conformer Selection by Matter-Wave Interference. Phys. Rev. Lett. 2018, 121, 173002. [Google Scholar] [CrossRef] [Green Version]
  32. Lombardi, A.; Palazzetti, F. Chirality in molecular collision dynamics. J. Phys. Cond. Matter 2018, 30, 1–19. [Google Scholar] [CrossRef] [PubMed]
  33. Pan, H.; Liu, K.; Caracciolo, A.; Casavecchia, P. Crossed beam polyatomic reaction dynamics: Recent advances and new insights. Chem. Soc. Rev. 2017, 46, 7517–7547. [Google Scholar] [CrossRef] [PubMed]
  34. Cappelletti, D.; Cinti, A.; Nicoziani, A.; Falcinelli, S.; Pirani, F. Molecular Beam Scattering Experiments as a Sensitive Probe of the Interaction in Bromine–Noble Gas Complexes. Front. Chem. 2019, 7, 320. [Google Scholar] [CrossRef] [PubMed] [Green Version]
  35. IUPAC Gold Book. Available online: http://goldbook.iupac.org/ (accessed on 1 February 2022).
  36. Salta, Z.; Kosmas, A.M.; Ventura, O.N.; Barone, V. Computational Evidence Suggests That 1-Chloroethanol May Be an Intermediate in the Thermal Decomposition of 2-Chloroethanol into Acetaldehyde and HCl. J. Phys. Chem. A 2019, 123, 1983–1998. [Google Scholar] [CrossRef] [PubMed] [Green Version]
  37. Petsis, G.; Salta, Z.; Kosmas, A.M.; Ventura, O.N. Theoretical study of the microhydration of 1-chloro and 2-chloro ethanol as a clue for their relative propensity toward dehalogenation. Int. J. Quant. Chem. 2019, 119, e25931. [Google Scholar] [CrossRef]
  38. Frisch, M.J.; Trucks, G.W.; Schlegel, H.B.; Scuseria, G.E.; Robb, M.A.; Cheeseman, J.R.; Scalmani, G.; Barone, V.; Mennucci, B.; Petersson, G.A.; et al. Gaussian 09; Gaussian, Inc.: Wallingford, CT, USA, 2009. [Google Scholar]
  39. Azrak, R.G.; Wilson, E.B. Microwave Spectra and Intramolecular Hydrogen Bonding in the 2-Haloethanols: Molecular Structure and Quadrupole Coupling Constants for 2-Chloroethanol and 2-Bromoethanol. J. Chem. Phys. 1970, 52, 5299–5316. [Google Scholar] [CrossRef]
  40. Townes, C.H.; Schawlow, A.L. Microwave Spectroscopy; Dover Publications, Inc.: New York, NY, USA, 1975. [Google Scholar]
  41. Atkinson, K.A. An Introduction to Numerical Analysis, 2nd ed; John Wiley & Sons: New York, NY, USA, 1989. [Google Scholar]
  42. King, A.K.; Howard, B.J. Research articleFull text access A High-Resolution Microwave Study of the Conformations of Butan-2-ol in a Supersonic Expansion. J. Mol. Spectrosc. 2001, 205, 38–42. [Google Scholar] [CrossRef]
  43. King, A.K.; Howard, B.J. A High-Resolution Microwave Study of the Butan-2-ol Argon Complex. J. Mol. Spectrosc. 2002, 214, 97–102. [Google Scholar] [CrossRef]
  44. King, A.K.; Howard, B.J. An investigation into the relaxation of the conformers of butan-2-ol in a supersonic expansion. J. Mol. Spectrosc. 2009, 257, 25–212. [Google Scholar] [CrossRef]
Figure 1. 1-chloroethanol and 2-chloroethanol structures represented by ball-and-stick model: the hydrogens are in white, the carbons are in grey, the oxygen is in red, and the chlorine atom is in green. For 1-chloroethanol, we report the two conformers, A and S, represented by the Newman projections through the O–C bond. For 2-chloroethanol, we report the Newman projections through the O–C bond (A and S) and the C–C bond (a, s+ and s−), which results in Aa, As (As+ is equivalent to As−; we adopted the notation As for this conformer), Sa, Ss+, and Ss− conformers.
Symmetry 14 00317 g001
Figure 2. Schematic view of a basic molecular beam setup including an electrostatic hexapole. The molecular beam is expanded from the nozzle and selected in direction by a first collimator before entering the hexapole. After passing through the hexapole, the molecular beam is selected in direction by a second collimator. A detector is finally placed to measure the beam intensity. For crossed beam experiments, the second beam intersects the first beam in the region between the hexapole and the detector. In the scheme, we also report the distances (in mm) between the components of the set up and the diameters (in mm) of the collimators.
Symmetry 14 00317 g002
Figure 3. Focusing curves for the 1-chloroethanol molecular beam in a hexapole with a length, l, of 0.5 m and vibrational temperatures, ΘV, of 300 K (upper panel) and ΘV = 200 K (lower panel). The beam intensity is in arbitrary units (a.u.), and the hexapole voltage is in kV. The black dashed line represents the total focusing curve, the blue line represents the contribution of the A rotamer, and the red line represents the contribution of the S rotamer.
Symmetry 14 00317 g003
Figure 4. Focusing curves for the 1-chloroethanol molecular beam in hexapole with a length, l, of 1 m and vibrational temperatures, ΘV, of 300 K (upper panel) and ΘV = 200 K (lower panel). The beam intensity is in arbitrary units (a.u.), and the hexapole voltage is in kV. The black dashed line represents the total focusing curve, the blue line represents the contribution of the A rotamer, and the red line represents the contribution of the S rotamer.
Symmetry 14 00317 g004
Figure 5. Focusing curves for the 1-chloroethanol molecular beam in a hexapole with a length, l, of 2 m and vibrational temperatures, ΘV, of 300 K (upper panel) and ΘV = 200 K (lower panel). The beam intensity is in arbitrary units (a.u.), and the hexapole voltage is in kV. The black dashed line represents the total focusing curve, the blue line represents the contribution of the A rotamer, and the red line represents the contribution of the S rotamer.
Symmetry 14 00317 g005
Figure 6. Focusing curves for the 2-chloroethanol molecular beam in a hexapole with a length, l, of 0.5 m and vibrational temperatures, ΘV, of 300 K (upper panel) and ΘV = 200 K (lower panel). The beam intensity is in arbitrary units (a.u.), and the hexapole voltage is in kV. The black dashed line represents the total focusing curve, the dark blue line represents the contribution of the Aa conformer, the orange line represents the As contribution, the grey line represents the Sa contribution, the red line represents the Ss+ contribution, and the light blue line represents the Ss− contribution.
Symmetry 14 00317 g006
Figure 7. Focusing curves for the 2-chloroethanol molecular beam in a hexapole with a length, l, of 1 m and vibrational temperatures, ΘV, of 300 K (upper panel) and ΘV = 200 K (lower panel). The beam intensity is in arbitrary units (a.u.), and the hexapole voltage in kV. The black dashed line represents the total focusing curve, the dark blue line represents the contribution of the Aa conformer, the orange line represents the contribution of As, the grey line represents the contribution of Sa, the red line represents the contribution of Ss+, and the light blue line represents the contribution of Ss-. The insets report details of the focusing curves on the ranges of 1–6 kV (upper panel) and 2–6 kV (lower panel).
Symmetry 14 00317 g007
Figure 8. Focusing curves for the 2-chloroethanol molecular beam in a hexapole with a length, l, of 2 m and vibrational temperatures, ΘV, of 300 K (upper panel) and ΘV = 200 K (lower panel). The beam intensity is in arbitrary units (a.u.), and the hexapole voltage is in kV. The black dashed line represents the total focusing curve, the dark blue line represents the contribution of the Aa conformer, the orange line represents the contribution of As, the grey line represents the contribution of Sa, the red line represents the contribution of Ss+, and the light blue line represents the contribution of Ss−. The insets report details of the focusing curves in the range of 0–2 kV.
Symmetry 14 00317 g008
Table 1. Structural and spectroscopic properties of the conformers of 1-chloroethanol and 2-chloroethanol: the electric dipole moment μ and its components μA, μB, and μC are in Debye, D; the rotational constants A, B, and C are in GHz; the relative energies ΔE are in kJ/mol and Joule, J, in parenthesis.
ConformerμμAμBμCABCΔE
1-chloroethanolA1.92−1.190.171.499.0404.6193.3140
S2.331.911.22−0.538.8544.6423.3292.23 (3.707 × 10⁻²¹)
2-chloroethanolAa2.031.81−0.930.0029.4682.4762.3527.33 (1.217 × 10⁻²⁰)
As1.820.960.791.3228.9382.4432.3337.31 (1.214 × 10⁻²⁰)
Sa3.172.311.861.0913.4083.3732.9507.58 (1.700 × 10⁻²⁰)
Ss+1.80−0.011.770.3812.7433.5513.0140
Ss−3.291.392.671.3313.1003.3702.92912.01(1.995 × 10⁻²⁰)
Publisher’s Note: MDPI stays neutral with regard to jurisdictional claims in published maps and institutional affiliations.

