
Asymmetry Opinion Evolution Model Based on Dynamic Network Structure

School of Management, Hefei University of Technology, Hefei 230009, China
*
Author to whom correspondence should be addressed.
Symmetry 2022, 14(12), 2499; https://doi.org/10.3390/sym14122499
Submission received: 10 October 2022
/
Revised: 19 November 2022
/
Accepted: 21 November 2022
/
Published: 25 November 2022
(This article belongs to the Special Issue Asymmetrical Network Control for Complex Dynamic Services)
Abstract
:On social media platforms, users can not only unfollow others whose opinion excessively opposes their own, but they can also add new connections. To better reflect the evolution of opinions on social media, this paper proposes an opinion asymmetry evolution model based on a dynamic network structure, where the trusts between two individuals are not mutual and dynamic. First, the paper analyzes the general properties of the model. We prove that group opinion can converge to a steady state even if the connection is unidirectional. Second, we compare the evolution process of static and dynamic network structures. Computer simulation results show that a higher probability of new connections leads to less aggregation of group opinion, higher information entropy, lower HHI, and lower degrees of polarization.
1. Introduction
Various platforms on social networks, such as Twitter and Toutiao, provide a place for people to express their opinions. However, every netizen can also be influenced by others, such as opinion leaders or friends. Accordingly, the opinions of individuals can evolve with the passing of time, eventually forming the same or several opinion subgroups, and even forming opinion polarization.
To explain the above phenomenon, scholars have established the opinion dynamics model. An example is the Degroot model [1]. This model was initially used in group decision-making, the consensus of expert opinions, and has been widely applied to the research of opinion dynamics and collective intelligence, among others. In the model, the updated opinion value is the weighted average of the individual’s own opinion and the opinion of others. In certain conditions, group opinions can reach a consensus.
Based on the DeGroot model, Hegselmann and Krause [2] assumed that an individual interacts only with neighbors whose opinion is not larger than a bound; they then proposed a bounded confidence model. Each time, the individual’s opinion is averaged with the neighbors’ whose opinion falls within the parameter range. Unlike the DeGroot model, the model is nonlinear. The group may not reach a consensus even if group opinions converge, thus forming opinion clusters.
It can simulate the various complex behaviors of groups in reality, such as the consensus of group views and the split of group views. Thus, it has been widely used by scholars. Similar to the HK model, another widely used model based on bounded trust is the Deffaunt model [3].
Similar to the Degroot model, these two models are built on the bases of conformity psychology and compromise mechanisms among individuals. The update of opinions is the repeated averaging process. However, the HK model and the Deffaunt model are nonlinear, and an individual’s dynamic behaviors are more complex. Group opinions can reach a consensus or split, which can better reflect reality. Later research directions are generally divided into two categories: to study the qualitative properties of the model using a mathematical method and to extend the model to make it more consistent with reality. It considers opinion leaders and key individuals, heterogeneity, and opinion polarization, among others. For example, [4] demonstrated that when the trust level of all group members is consistent, the sufficient and necessary conditions for group views to be consistent are demonstrated. From an analytical perspective, [5] demonstrated that the HK model would eventually converge to a series of clusters and, within each cluster, individual views would be consistent. At the same time, the author provides an upper bound on the range of distance between opinion clusters. Jan Lorenz [6], using the matrix algebra method, proposed that if one meets the following three conditions: group members have a trusting relationship between each other, each individual has certain self-confidence, and mutual influence between individuals has a positive lower bound, then the group opinions will converge or achieve consistency; otherwise, the group is split into subgroups with no contact. Santo Fortuno [7] studied the threshold problem of the continuous opinion evolution model by numerical simulation. Gang Kou et al. [8] studied the evolution of opinions when members in a community have a heterogeneous trust threshold. Watts and Dodds [9], through a series of computer simulation studies, found that, in most cases, strong influence is not driven by opinion leaders, but by some key individuals who are easily influenced. Researchers in [10,11,12] also discuss the evolution law of opinions when opinion leaders are present in a group. [13,14,15] discuss the influence of stubborn individuals on the evolution of group views. For example, [16,17] discussed the role of special members of a group and [18,19,20,21,22,23,24] studied how network structures impacted opinion evolution.
Contributions of this paper:
Unlike the abovementioned studies, this paper not only considers individuals as being heterogeneous, but that the interactions between individuals are asymmetric and dynamic on social media. For example, when using Toutiao, one user can follow another user, but the latter may not follow them. Thus, the connection is asymmetric. Any user can also follow a new user at any time, thereby rendering the connection dynamic.
This paper establishes an opinion evolution model based on the dynamic and asymmetry network structure of heterogeneous individuals, and analyzes the general properties of the model. We prove that group opinion can converge to a steady state even if the connection is unidirectional. Secondly, we consider the influence of the way of establishing new neighbors on the evolution of opinions. To measure the process and result of evolution, we put forward measures of the dispersion degree of group opinions, the dominance of mainstream opinion, and the degree of polarization Finally, using computer simulation results, the influence of the new rules on the evolution of the group view is analyzed and the conclusion is drawn.
This paper is organized as follows. In Section 2, we establish a model of opinion evolution based on dynamic network structure. Using nonnegative matrix theory, we prove the basic properties of the model. In Section 3, we propose a measurement index of viewpoint evolution and use computer simulation to study the effect of new connection probability on the index. In Section 4, we summarize the paper and put forward suggestions according to the research results.
2. Model
2.1. Model Description
Let us consider a population with m individuals under a certain network structure. The relationship between individuals is represented by , where is the vertex set and is an edge set. If individual i is affected by j, it is represented by a directed edge .
An individual interacts with all the other people whose opinion value difference is less than their trust threshold, and has the edge relationship on the network. The individual’s opinion only depends on the previous round of opinion values of themselves and others (no memory). Thus, the set of neighbors of the individual at time t is:
denotes the number of elements in the neighbor set . On a social network platform, changing opinions is often not easy for individuals with extreme opinions; whereas individuals with neutral opinions are more likely to change their opinions. Therefore, the former has a generally smaller trust threshold , and the latter has a larger one.
Dynamic network structure: Social network structures are dynamic and evolutionary [25,26,27]. In our model, a user has a certain probability to create new connected edges at each time step. In other words, a user’s is dynamic. The phenomenon is thanks to recommendations from social networking platforms. Given that the user is also affected by themselves and the herd mentality mechanism, the updating rules of opinions are as follows:
Under the above assumptions, the evolution model of group opinion can be written as:
where . If individual i trusts j, then , otherwise is 0. Therefore, the 0–1 pattern of A is consistent with its adjacency matrix, and A is a row stochastic matrix with row sum 1.
2.2. Property of the Model
Property 1: Group opinions eventually tend to be stable, i.e., , where X is a constant vector.
Proof.
Let be the initial opinion vector and be the opinion vector at time t, the components of which denote members’ opinion. According to (4),
Denote . If Π (t) converges to a constant row stochastic matrix, then for a given initial point of vector, will be equal to X(t), as long as t is big enough. Now, we prove . The proof consists of two steps. Firstly, we show that when t is large enough, the rows in this matrix are equal. Secondly, a row stochastic matrix with equal rows is proven to remain unchanged when left multiplied by a row stochastic matrix.
Step 1: D (A) denotes the largest Euclidean distance between any two rows of an A-matrix. According to nonnegative matrix theory, for row random matrices A and B [6]:
For any matrix A, given that the entries on the diagonal are at least 1/n, and any non-zero entries in the matrix are at least 1/n; i.e.,
Thus, ,
As t goes to infinity, the right side goes to 0, so
Given enough time, is a row stochastic matrix with equal rows. In other words, has the following block form:
where is an n-dimensional row vector.
Step 2: Given that , we denote . It is a row stochastic matrix.
Thus,
Therefore, will keep constant after the time when the rows of are equal; i.e.,
□
Thus, the proposition that group opinions eventually tend to be a stable state has been proven. Even if the network structure is dynamically changing, the group opinion still converges. This result is general, but it goes beyond the conclusion obtained in the literature [6], because the latter believes that the convergence requires a condition of mutual trust. In this paper, through the above proof, we can see that the group opinion will still converge even if the trust is not mutual.
3. Evolution of Group Opinions under Asymmetric and Dynamic Network Structure
3.1. Measurement and Indices
Dispersion degree of group opinions:
Let each time an individual adds a new neighbor with probability p. Then, what effect does p have on the evolution of group opinions? Therefore, we should first put forward the corresponding evaluation index for the evolution process and result of the group opinions. One of the most common is the number of opinion clusters. However, this index still has flaws.
The integer value alone cannot distinguish the order degree of group opinions when the number of opinion clusters is the same. For example, for a group with 100 members, in the first case, the opinions of the group eventually converge to 0.1 and 0.95, and the number of people are 50 and 50, respectively, forming two groups. In the second phase, the group views also converge to 0.1 and 0.95, but the number of people are 10 and 90, respectively, which also forms two groups. However, the degree of consensus among the latter groups is clearly much higher than that of the former. Thus, here, we borrow the concept of information entropy to quantify the degree of order of group views. Given that opinions will eventually reach a steady state, assume that the sizes of opinion groups are , respectively. Then, the measurement index of the dispersion degree of group opinions is:
Obviously, this index can not only reflect the number of groups, but also the degree of dispersion caused by the size of the subgroup, which is actually a measure of the disorder degree of the macro state of the group. Initially, if group opinions are completely disordered, the information entropy is . If consensus is reached, the entropy is 0.
Dominance of mainstream opinion
To reflect the dominance of mainstream opinion, we borrow the HHI index from economics. Specifically, the HHI measures opinion concentration as the sum of the squares of “shares of all clusters” in the group, meaning that it considers all subgroup sizes. Therefore, for example, if the number of clusters is the same in two cases, but the largest cluster has more people in the first case, the HHI index will be higher than another case, which means that the first scene has a more dominant opinion.
Polarization index
A higher degree of polarization indicates that most opinions of individuals in the group are far away from the neutral opinion. Unlike in [28], we put the opinions in the range of [0, 1], and the neutral opinion is about 0.5. Therefore, we define polarization index PI as:
The higher the value of this index, the higher the degree of opinion polarization, and vice versa. From the formula of the above indicators, we can predict that a cyberspace where diversified opinions coexist must have a higher entropy, a lower HHI, and a lower PI. Given that dynamic interactions enhance the communications between group members, we can also predict that such dynamics may increase the number of final opinion clusters, which will also lead to an increase of entropy and a decrease of HHI and PI.
3.2. Evolution of Group Views under Dynamic Network Structure
To confirm these predictions, we use computer simulations to investigate the effects of asymmetric and dynamic interactions on the evolution. The constructed group size is 100, and 100 opinion values with uniform distribution are placed on the network node. Each node represents an individual or user. The openness of the individual (trust threshold) with extreme opinion (0 or 1) is set to 0.02, and the individual with a neutral view is set to 0.22. The openness of other individuals evenly varies between [0.02, 0.22].
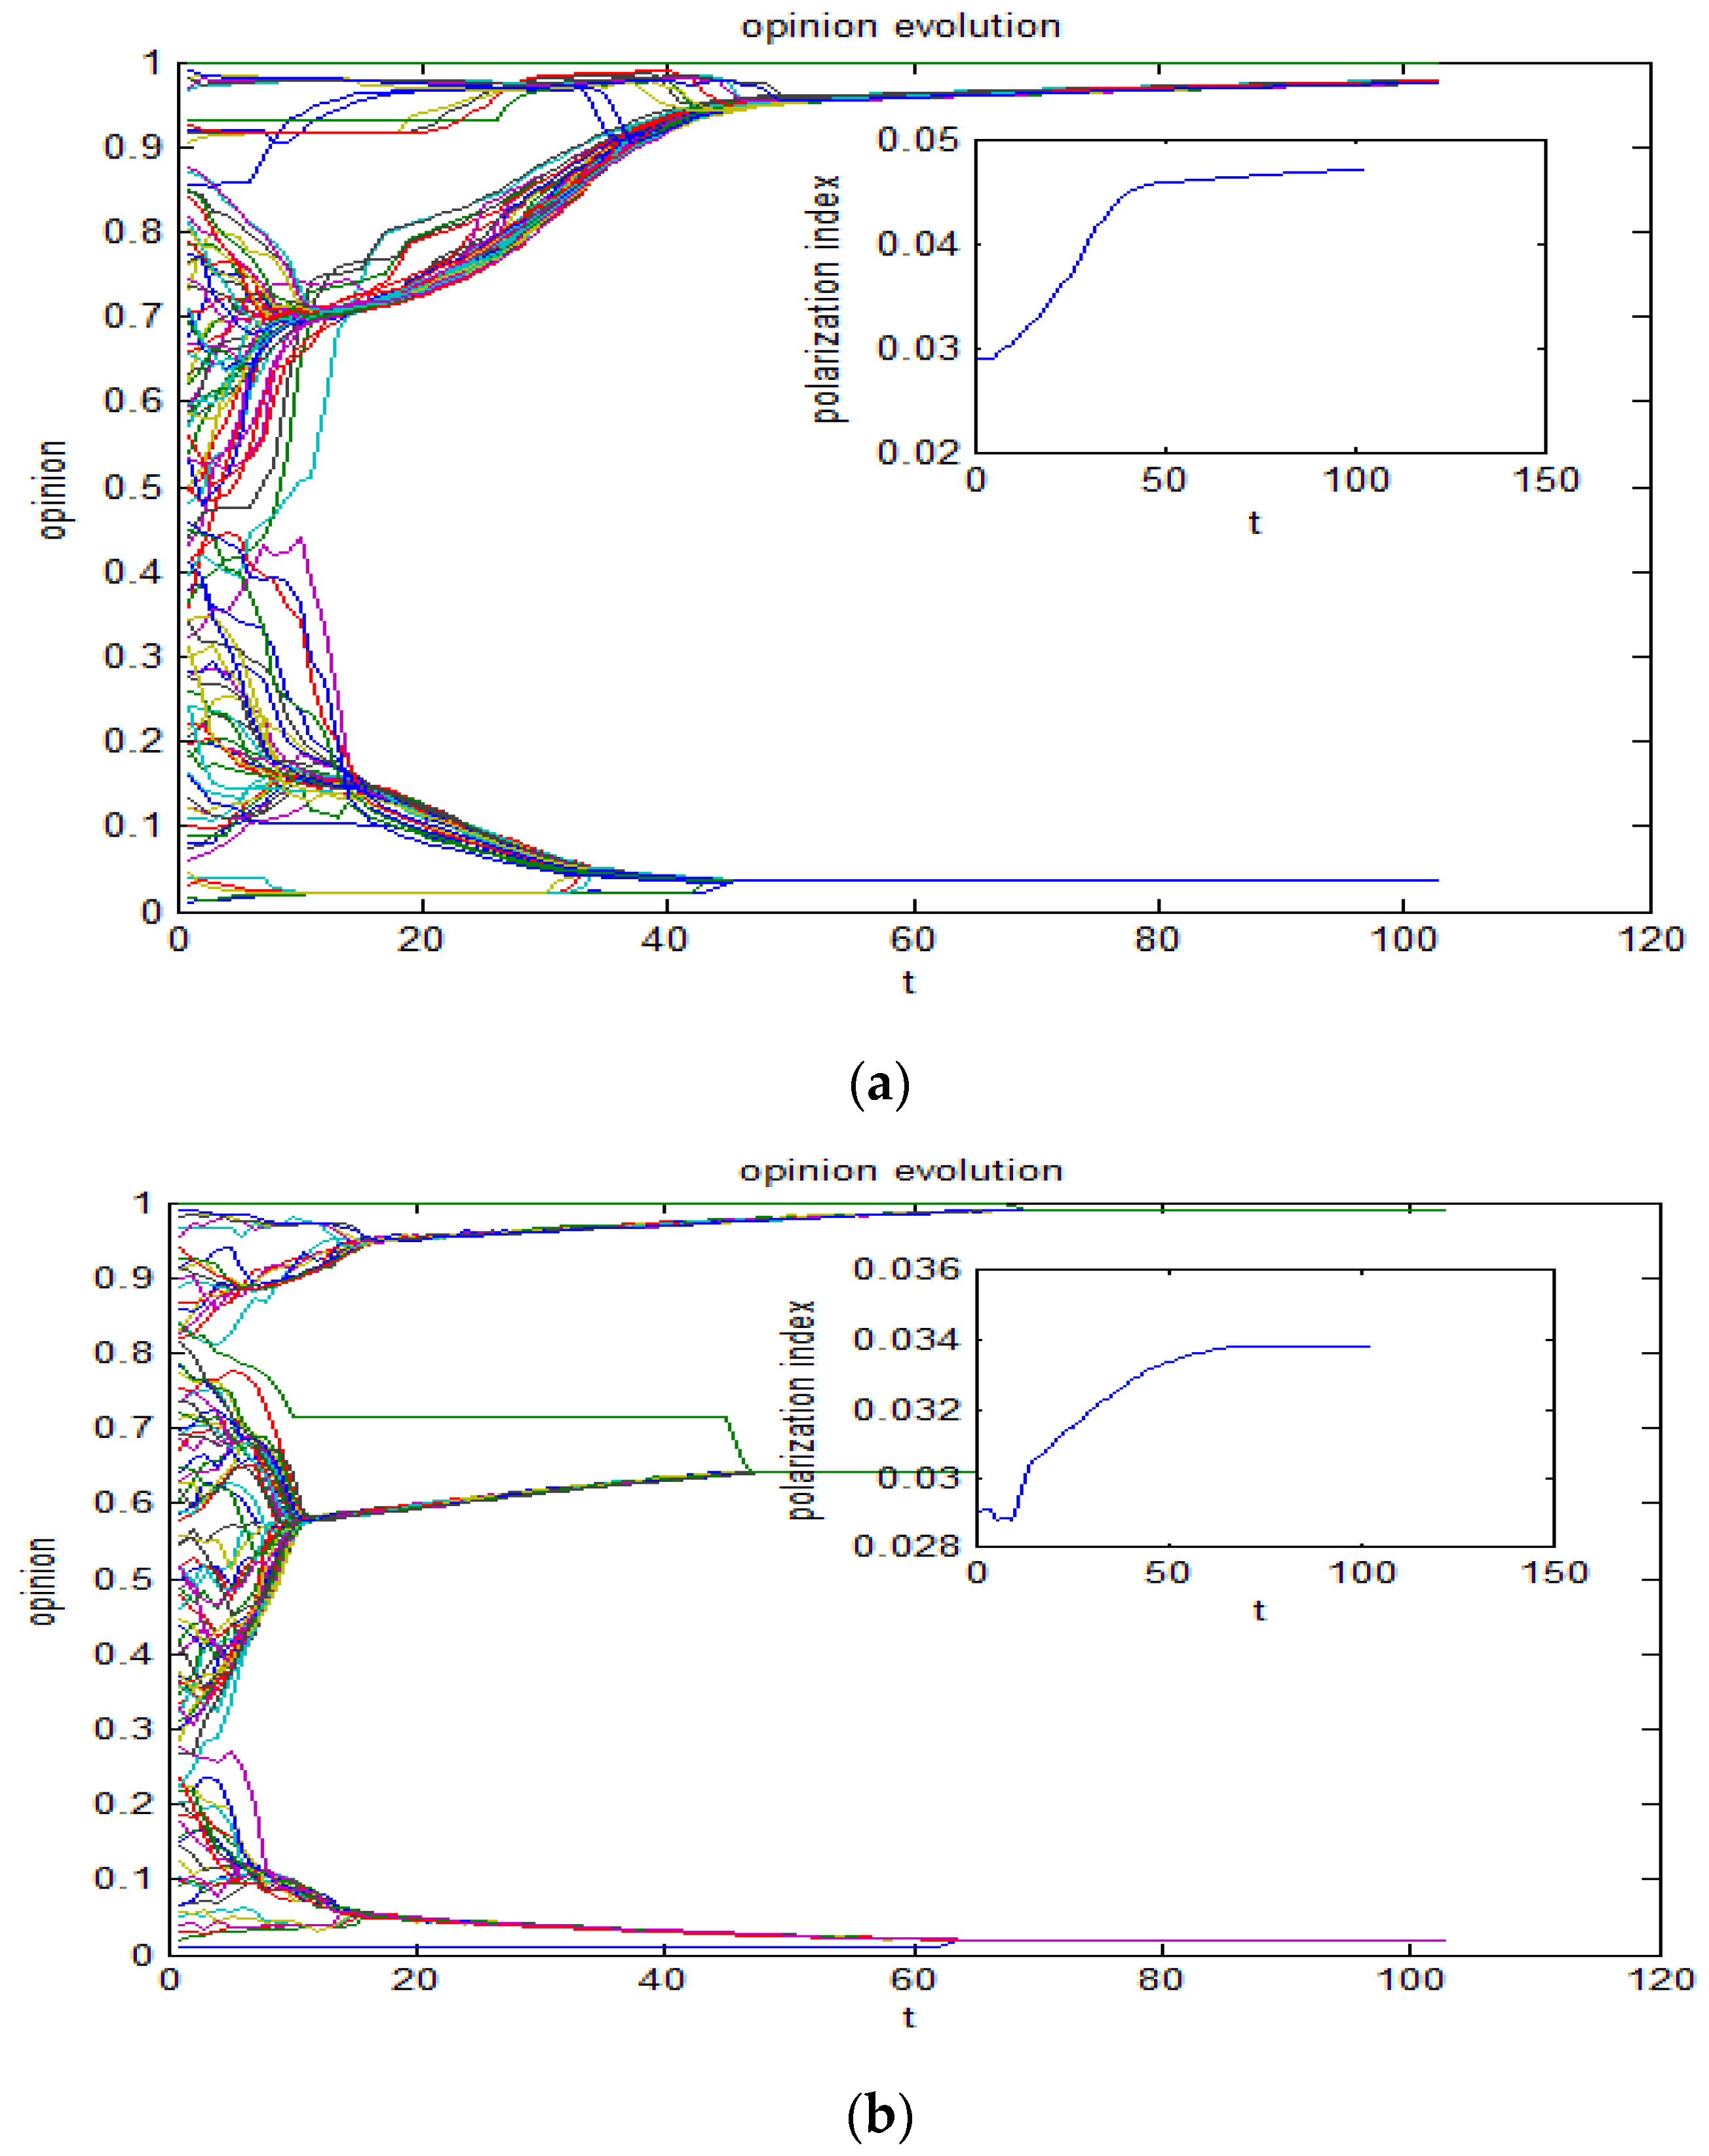
We examine two types of evolution: based on static network structure and dynamic network structure. Using Formula 2.4, we can calculate the evolution process of the group’s opinions. The result is shown in Figure 1, where the horizontal axis represents the time step and the vertical axis represents the view values of different individuals. Individuals have different connection patterns or openness, so the evolution caused by this asymmetric dynamics looks very complex. As a result, there is no opinion-order preservation as mentioned in the literature [29]. Figure 1a shows an example of the evolution of group opinions under a static network structure. Two extreme opinion subgroups are easily found to be eventually formed. Given that individuals with extreme opinions often lack openness, an asymmetric attraction exists between them and those with neutral opinions. Consequently, individuals in the middle attracted to individuals with extreme opinions will form a larger extreme opinion group. The polarization degree is shown in the subplot, and the final PI is approximately 0.047.
By contrast, Figure 1b shows an example of the evolution of group opinions under a dynamic network structure. The number of clusters is easily seen to be three. It forms a new subgroup with a neutral opinion. The final PI is only 0.034, which is significantly lower than that of the static network. This finding suggests that creating new connections between static network nodes may reduce the degree of polarization and increase the number of clusters.
To further compare and quantify the evolution results of static and dynamic network structures, we investigate the change in the probability of adding a new edge p from 0 to 0.9. Here, p is the probability that an individual will create a directed edge with another non-neighbor individual during the evolutionary process. Notably, even if a connection does occur, interaction depends on whether the other’s opinion is within the individual’s threshold range.
In order to make the simulation results more robust, we choose the initial network structure as the control variable. The initial networks are set as random networks (ER network), small-world networks (WS model), and real network (including the Karate Club network, BKHAM network, and a topic network that we captured in Toutiao). Take the new connection probability p as the independent variable, and observe the influence of p on the evolution result (PI, entropy, and HHI). The value of p ranges from 0 to 1, where p = 0 represents a static network.
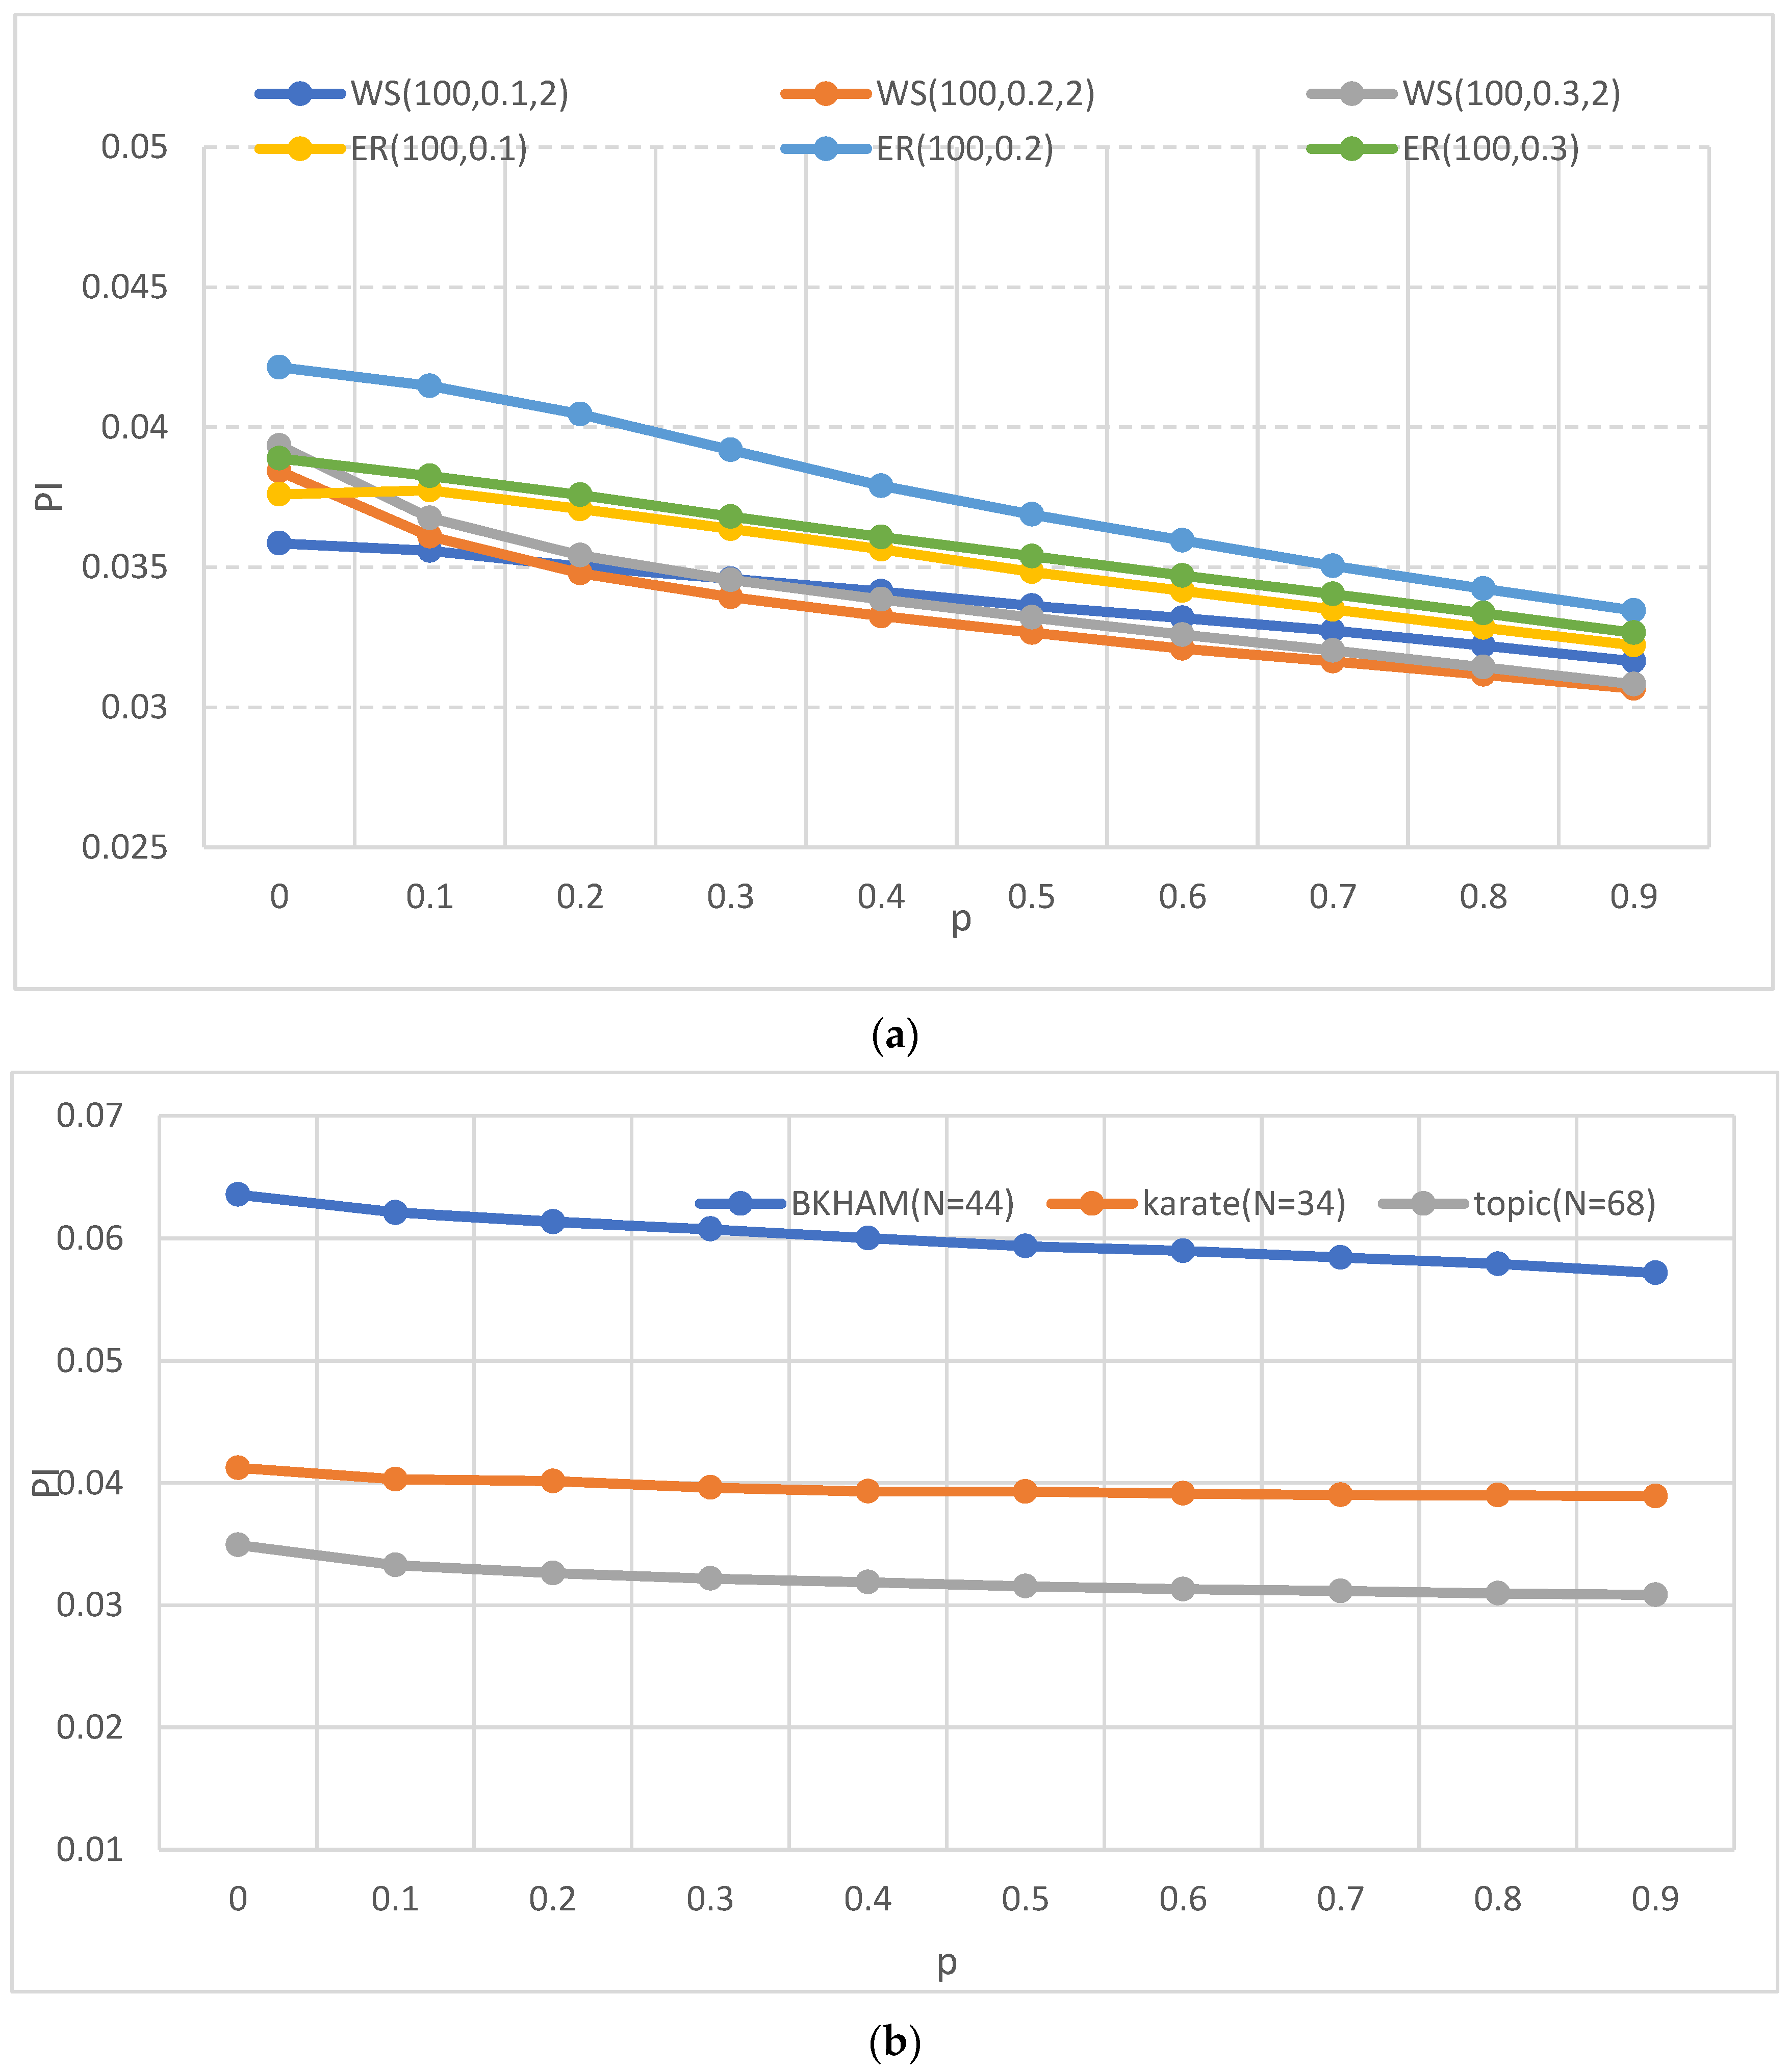
Figure 2 shows that, compared with the static network (p = 0), the dynamic network will bring about a weakening of polarization. With the increase of p, the polarization of group opinion tends to weaken. That is, no matter what the network structure is, the dynamics often weaken the polarization phenomenon. This also means that there will be more neutral individuals during the dynamic evolution, which causes the size of the extreme opinion clusters to become smaller.
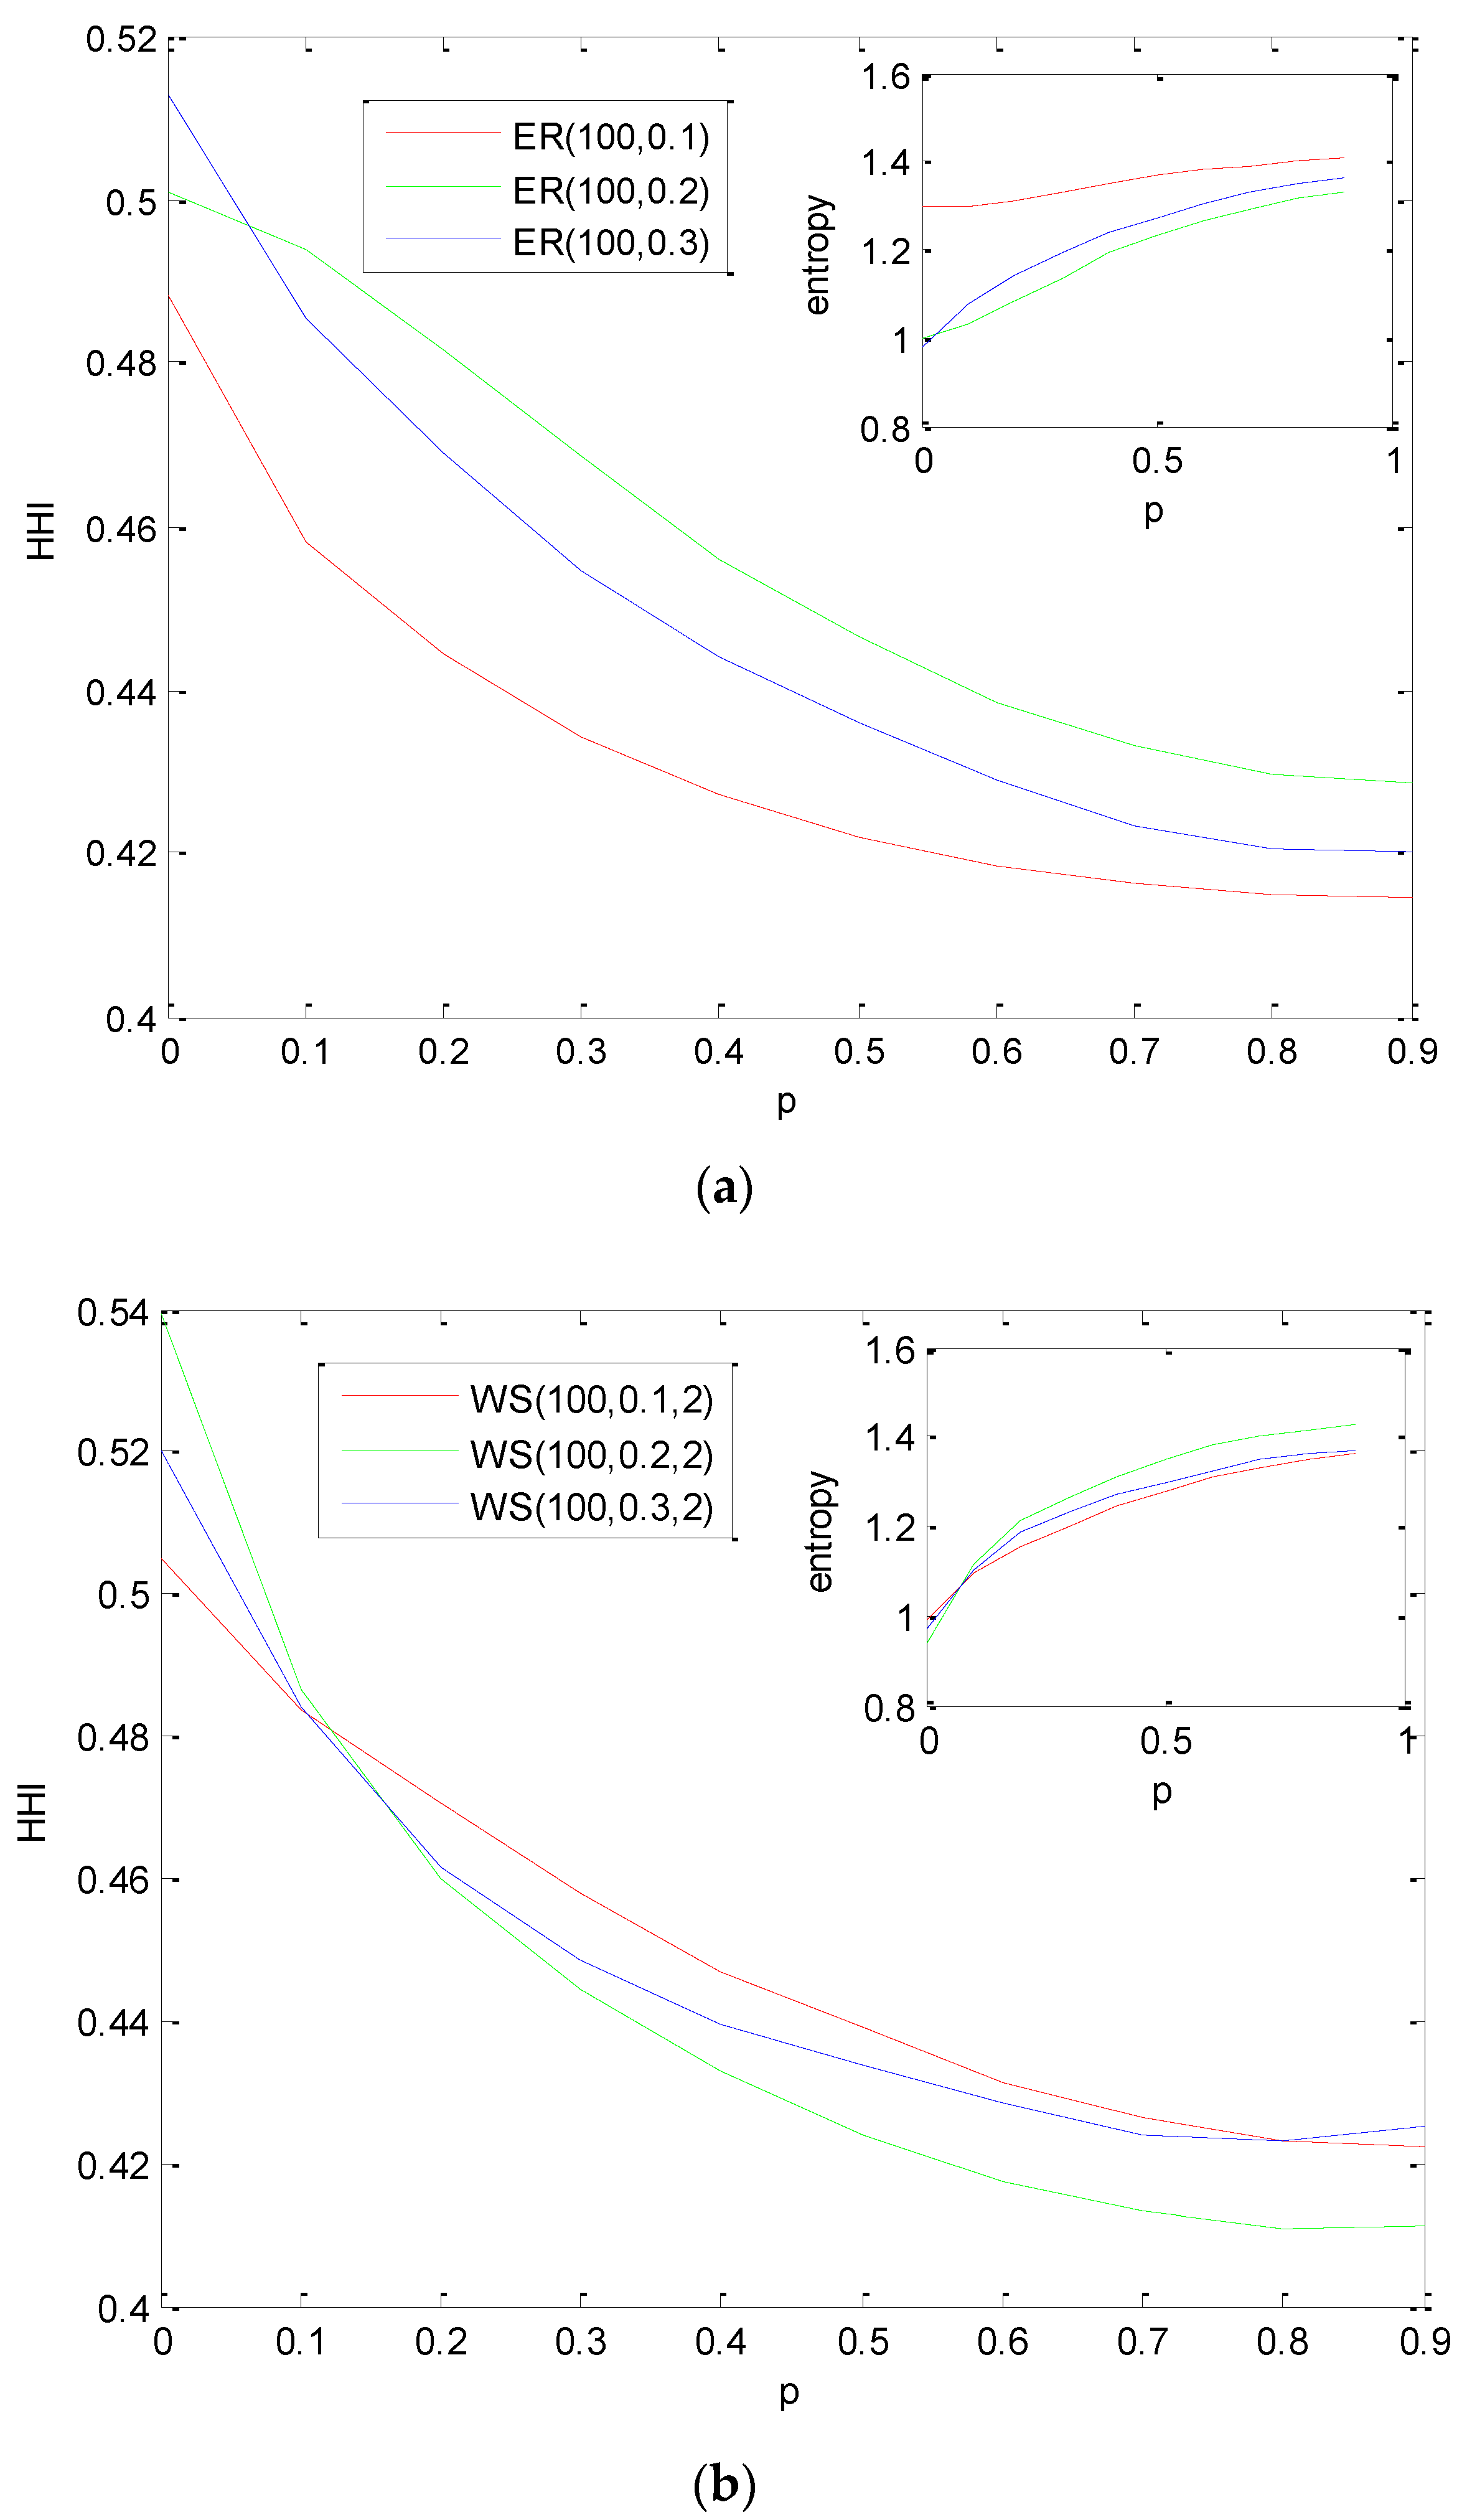
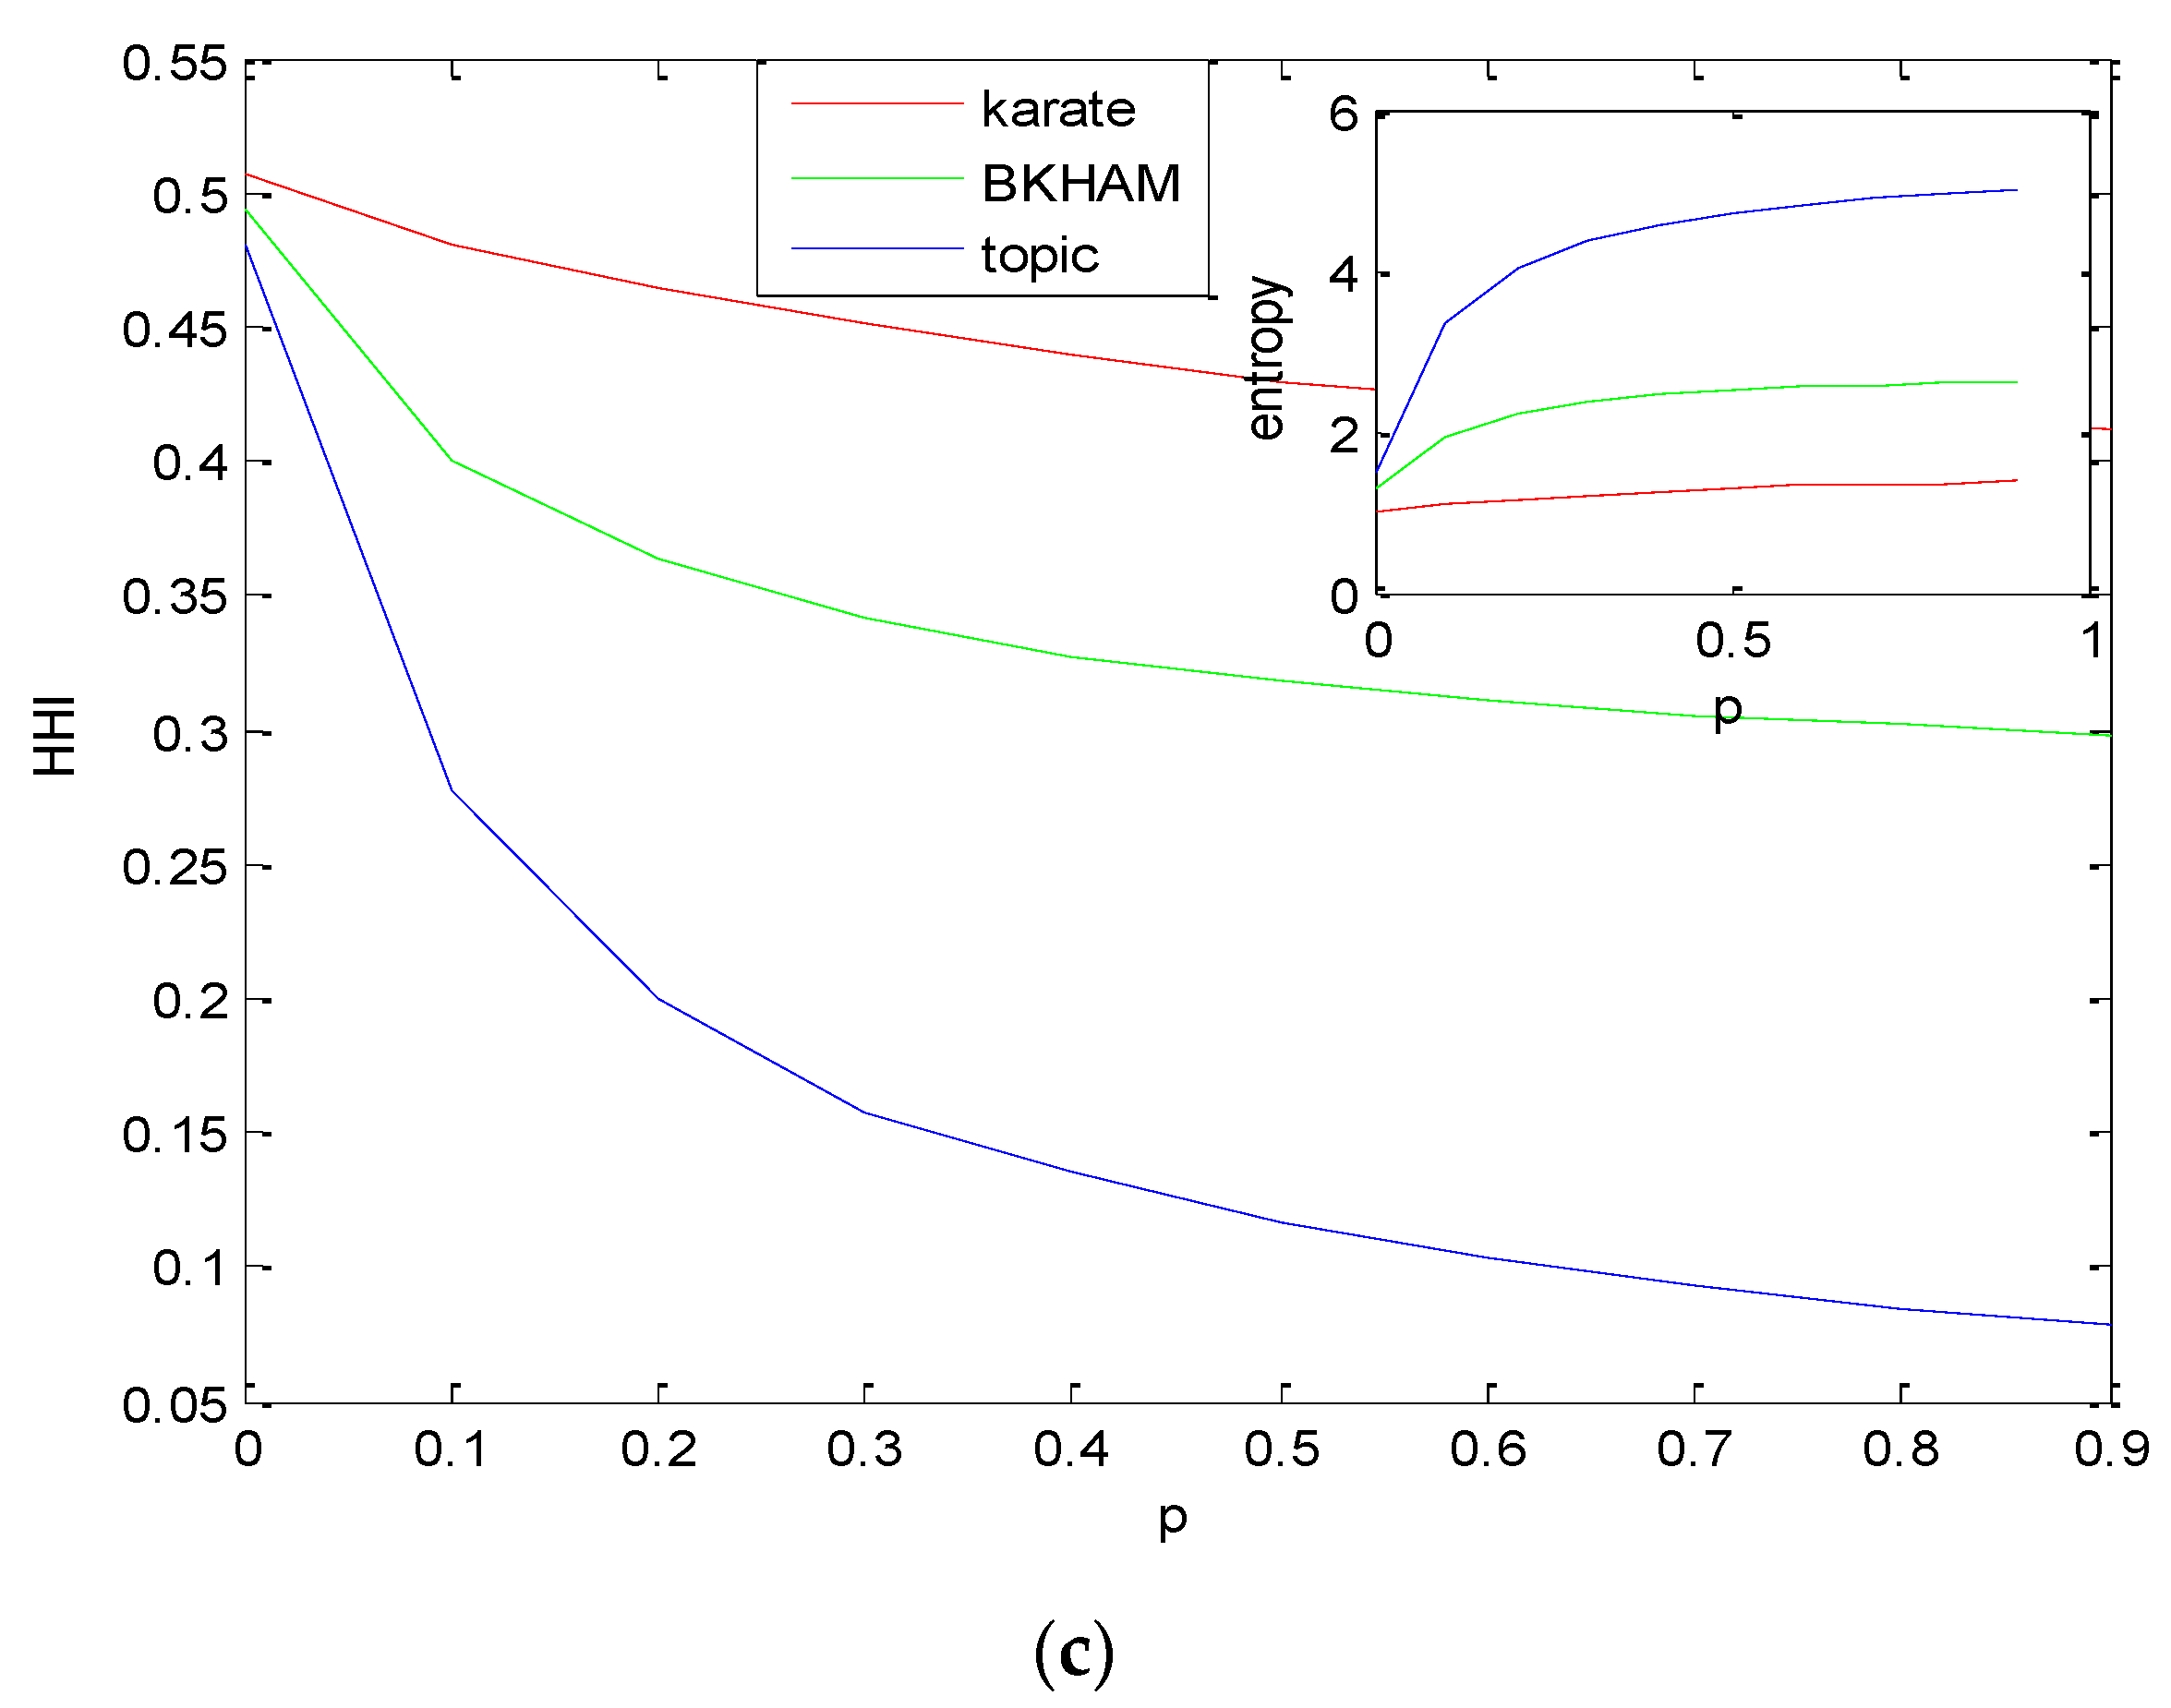
Figure 3 shows that, compared with static networks, opinion evolution under different dynamic network structures tends to form a lower HHI. This finding means that as the new connection probability increases, mainstream opinion usually weakens and group opinion tends to be increasingly leaderless.
With the increase in new connection probability, the final opinion information entropy increases. Given that the information entropy reflects the disorder degree of an opinion, it can be seen that with the increase in the probability of adding new edges, the disorder degree becomes increasingly higher.
It is important to note that our results are only on average. Therefore, we carefully checked to see if they were statistically significant. We compare the mean values based on t-test, the results of which are shown in Table 1. According to Table 1, all dynamic cases are significantly higher than p = 0, where the p-value is 0. For relatively close probabilities, most of the mean differences are significant, and only a few are not very significant.
From the above data, we can obtain a relatively consistent outcome: Compared to static interaction, the asymmetric and dynamic interaction will bring lower PI, HHI, and a higher entropy; the stronger this dynamic interaction, the more obvious the change. During the process of evolution, new connections will make group opinions more difficult to aggregate and more diverse.
This phenomenon occurs due to individual heterogeneity and biased selection. In our model, individuals with extreme opinions are given smaller thresholds, whereas those with neutral opinions are given a larger threshold. Therefore, when individuals are allowed to add new connections during the evolution of opinions, such connections are rare for extreme individuals and many for individuals with neutral opinions. Therefore, in the process of interaction, both the extreme individuals’ own opinions and link patterns will scarcely change. However, for neutral individuals, establishing new interaction relations is easier due to its larger openness. Thus, forming a subgroup between the two extreme opinion clusters is also easier. Consequently, aggregating group opinions is harder, and mainstream opinions are less dominant.
Notably, our results are on average. Therefore, the above conclusions are not absolute. The final evolutionary outcome also depends on other factors (e.g., initial opinion distribution and random factors).
4. Conclusions and Implications
4.1. Conclusions
In this paper, we established an opinion evolution model under an asymmetric and dynamic network structure. Compared with the static model, it was closer to the reality of social media. We proved that opinion evolution under an asymmetric and dynamic network structure can also yield a stable convergence result. To compare with a static network structure, this paper put forward indices such as entropy, HHI, and PI. Experiments showed that with the increase in the probability of adding edges, the evolution of ideas under the dynamic network structure eventually leads to lower HHI, higher information entropy, and larger opinion polarization results.
For the quantification of group opinions, the indices proposed in this paper have very important application value. Unlike AOC and convergence time, the above indexes are sensitive to data and can clearly reflect the whole appearance of group opinion.
4.2. Implications
The above results have important implications for social media. The recommendation and follow mechanisms of social media are not conducive to the aggregation of group opinions, but promote the diversification of opinions; particularly, individuals with neutral opinions are prone to form subgroups. Therefore, the recommendation and follow mechanisms are more likely to lead to an information cocoon and reinforce the echo chamber effect. Therefore, to reduce this information cocoon and echo chamber effect, we should reduce the number of such recommendations (reduce the probability of new edges). If we want to reduce the polarization of opposing views, we should increase the number of recommendations (increase the probability of new edges), which can provide a basis for the policy maker in the new media age.
The research in this paper has many shortcomings. In view of the complexity of the network and its dynamics, many factors can only be used as control variables. More extensive datasets should be used to validate the research. We are currently working on these challenging subjects.
Author Contributions
Conceptualization, A.L. and Y.G.; methodology, A.L.; software, Y.G.; validation, A.L. and Y.G.; formal analysis, A.L.; investigation, A.L. and Y.G.; resources, Y.G.; data curation, A.L.; writing—original draft preparation, A.L.; writing—review and editing, A.L.; visualization, Y.G.; supervision, A.L. and Y.G.; project administration, A.L.; funding acquisition, Y.G. All authors have read and agreed to the published version of the manuscript.
Funding
This work has been supported by Social Science Project of Hefei (project number: JS2018HFQT0098) and Doctoral Program Foundation of Institutions of Higher Education of China (project number: JZ2019HGBZ0138).
Data Availability Statement
All the data in this paper come from (1) computer simulation; (2) ucinet6.0 database; (3) www.toutiao.com (accessed on 9 October 2022).
Conflicts of Interest
The authors declare no conflict of interest.
References
- Degroot, M.H. Reaching a consensus. J. Am. Stat. Assoc. 1974, 69, 118–121. [Google Scholar] [CrossRef]
- Hegselmann, R.; Krause, U. Opinion dynamics and bounded confidence models, analysis and simulation. J. Artif. Soc. Soc. Simul. 2002, 5, 2. [Google Scholar]
- Weisbuch, G.; Deffuant, G.; Amblard, F.; Nadal, J.-P. Meet, discuss, and segregate! Complexity 2002, 7, 55–63. [Google Scholar] [CrossRef] [Green Version]
- Dittmer, J.C. Consensus formation under bounded confidence. Nonlinear Anal. 2001, 47, 4615–4621. [Google Scholar] [CrossRef]
- Blondel, V.D.; Hendrickx, J.M.; Tsitsiklis, J.N. Continuous-Time Average-Preserving opinion dynamics with Opinion-Dependent communications. SIAM J. Control. Optim. 2010, 48, 5214–5240. [Google Scholar] [CrossRef] [Green Version]
- Lorenz, J. A stabilization theorem for dynamics of continuous opinions. Phys. A Stat. Mech. Its Appl. 2005, 355, 217–223. [Google Scholar] [CrossRef] [Green Version]
- Fortunato, S. On the consensus threshold for the opinion dynamics of krause–hegselmann. Int. J. Mod. Phys. C 2004, 16, 259–270. [Google Scholar] [CrossRef] [Green Version]
- Gang, K.; Zhao, Y.; Yi, P.; Shi, Y. Multi-Level opinion dynamics under bounded confidence. PLoS ONE 2012, 7, e43507. [Google Scholar]
- Watts, D.J.; Strogatz, S.H. Collective dynamics of ‘small-world’ networks. Nature 1998, 393, 440–442. [Google Scholar] [CrossRef]
- Boccara, N. Models of opinion formation: Influence of opinion leaders. Int. J. Mod. Phys. C 2008, 19, 93–109. [Google Scholar] [CrossRef] [Green Version]
- Zhao, Y.; Kou, G. Bounded Confidence-based opinion formation for opinion leaders and opinion followers on social networks. Stud. Inform. Control 2014, 23, 153–162. [Google Scholar] [CrossRef]
- Fagnani, F. Heterogeneity, Minorities, and Leaders in Opinion Formation. Available online: http://calvino.polito.it/~fagnani/conferenze/Ki-net.pdf (accessed on 9 October 2022).
- Mukhopadhyay, A.; Mazumdar, R.R.; Roy, R. Majority rule based opinion dynamics with biased and stubborn agents. In Proceedings of the 2016 ACM SIGMETRICS International Conference on Measurement and Modeling of Computer Science, Antibes Juan-les-Pins, France, 14–18 June 2016; pp. 385–386. [Google Scholar]
- Stella, L.; Bagagiolo, F.; Bauso, D.; Como, G. Opinion dynamics and stubbornness through mean-field games. In Proceedings of the 52nd IEEE Conference on Decision and Control, Firenze, Italy, 10–13 December 2013; pp. 2519–2524. [Google Scholar]
- Ghaderi, J.; Srikant, R. Opinion Dynamics in Social Networks with Stubborn Agents; Pergamon Press, Inc.: New York, NY, USA, 2014. [Google Scholar]
- Meadows, M.; Cliff, D. The Relative Disagreement Model of Opinion Dynamics: Where Do Extremists Come From? Springer: Berlin/Heidelberg, Germany, 2016. [Google Scholar]
- Fan, K.; Pedrycz, W. Opinion evolution influenced by informed agents. Phys. A Stat. Mech. Its Appl. 2016, 462, 431–441. [Google Scholar] [CrossRef]
- Stauffer, D.; Ortmanns, H.M. Simulation of consensus model of deffuant ET al. on a BARABu00c1SIu2013ALBERT network. Int. J. Mod. Phys. C 2003, 15, 241–246. [Google Scholar] [CrossRef] [Green Version]
- Amblard, F.; Deffuant, G. The role of network topology on extremism propagation with the relative agreement opinion dynamics. Phys. A Stat. Mech. Its Appl. 2004, 343, 725–738. [Google Scholar] [CrossRef] [Green Version]
- Zhao, Y. Public opinion evolution based on complex networks. Cybern. Inf. Technol. 2015, 15, 55–68. [Google Scholar] [CrossRef] [Green Version]
- Holme, P.; Kim, B.J. Growing scale-free networks with tunable clustering. Phys. Rev. E 2002, 65, 026107. [Google Scholar] [CrossRef] [Green Version]
- Si, X.; Liu, Y.; Zhang, Z. Opinion dynamics in populations with implicit community structure. Int. J. Mod. Phys. C 2009, 20, 2013–2026. [Google Scholar] [CrossRef]
- Hammer, R.J.; Moore, T.W.; Finley, P.D.; Como, G. The Role of Community Structure in Opinion Cluster Formation; Springer International Publishing: Cham, Switzerland, 2012. [Google Scholar]
- Lu, A.; Sun, C.; Liu, Y. The impact of community structure on the convergence time of opinion dynamics. Discret. Dyn. Nat. Soc. 2017, 1–7. [Google Scholar] [CrossRef] [Green Version]
- Ye, M.; Liu, J.; Anderson, B.D.O.; Yu, C.; Başar, T. Evolution of social power in social networks with dynamic topology. IEEE Trans. Autom. Control 2018, 63, 3793–3808. [Google Scholar] [CrossRef] [Green Version]
- Tabassum, S.; Pereira, F.S.F.; Fernandes, S.; Gama, J. Social network analysis: An overview. Wiley Interdiscip. Rev. Data Min. Knowl. Discov. 2018, 8, e1256. [Google Scholar] [CrossRef]
- Zaheer, A.; Soda, G. Network evolution: The origins of structural holes. Adm. Sci. Q. 2009, 54, 1–31. [Google Scholar] [CrossRef]
- Matakos, A.; Terzi, E.; Tsaparas, P. Measuring and moderating opinion polarization in social networks. Data Min. Knowl. Discov. 2017, 31, 1480–1505. [Google Scholar] [CrossRef]
- Ceragioli, F.; Frasca, P. Continuous and discontinuous opinion dynamics with bounded confidence. Nonlinear Anal. Real World Appl. 2012, 13, 1239–1251. [Google Scholar] [CrossRef]
Figure 1.
Comparison of group opinion evolution under static and dynamic network structures. (a) Represents the static network structure, and (b) represents the dynamic one. The horizontal axis represents the moment, and the vertical axis represents the different individual’s opinion. The subplot reflects the trend of polarization index during the evolution process.

Figure 2.
The influence of new connection probability on PI. Figure 2 shows the influence of new connection probability on PI under small-world network, random network (a), and real network structures (b). The horizontal axis represents the probability of a new connection, and the vertical axis represents PI.

Figure 3.
The influence of new connection probability on HHI and entropy. Figure 3 shows the influence of new connection probability on HHI under different network structures. The horizontal axis represents the probability of a new connection, and the vertical axis represents HHI. In the subplots, the vertical axis represents entropy. Figure 3 (a) shows that the initial networks are small-world and (b) are random, whereas (c) are real.


Table 1.
t-test results (take ER(N,0.2) as example).
| PI | p = 0.1 | p = 0.2 | p = 0.3 | p = 0.4 | p = 0.5 | p = 0.6 | p = 0.7 | p = 0.8 | p = 0.9 | |
|---|---|---|---|---|---|---|---|---|---|---|
| p-value | compare with p = 0 | 0.00 | 0.00 | 0.00 | 0.00 | 0.00 | 0.00 | 0.00 | 0.00 | 0.00 |
| compare with p-0.1 | 0.00 | 0.00 | 0.00 | 0.00 | 0.00 | 0.00 | 0.00 | 0.00 | 0.00 | |
| HHI | p = 0.1 | p = 0.2 | p = 0.3 | p = 0.4 | p = 0.5 | p = 0.6 | p = 0.7 | p = 0.8 | p = 0.9 | |
| p-value | compare with p = 0 | 0.00 | 0.00 | 0.00 | 0.00 | 0.00 | 0.00 | 0.00 | 0.00 | 0.00 |
| compare with p-0.1 | 0.00 | 0.00 | 0.00 | 0.00 | 0.20 | 0.05 | 0.07 | 0.53 | 0.00 | |
| entropy | p = 0.1 | p = 0.2 | p = 0.3 | p = 0.4 | p = 0.5 | p = 0.6 | p = 0.7 | p = 0.8 | p = 0.9 | |
| p-value | compare with p = 0 | 0.00 | 0.00 | 0.00 | 0.00 | 0.00 | 0.00 | 0.00 | 0.00 | 0.00 |
| compare with p-0.1 | 0.00 | 0.00 | 0.00 | 0.00 | 0.14 | 0.00 | 0.76 | 0.73 | 0.09 |
Publisher’s Note: MDPI stays neutral with regard to jurisdictional claims in published maps and institutional affiliations. |
© 2022 by the authors. Licensee MDPI, Basel, Switzerland. This article is an open access article distributed under the terms and conditions of the Creative Commons Attribution (CC BY) license (https://creativecommons.org/licenses/by/4.0/).
Share and Cite
MDPI and ACS Style
Lu, A.; Guo, Y. Asymmetry Opinion Evolution Model Based on Dynamic Network Structure. Symmetry 2022, 14, 2499. https://doi.org/10.3390/sym14122499
AMA Style
Lu A, Guo Y. Asymmetry Opinion Evolution Model Based on Dynamic Network Structure. Symmetry. 2022; 14(12):2499. https://doi.org/10.3390/sym14122499
Chicago/Turabian StyleLu, An, and Yaguang Guo. 2022. "Asymmetry Opinion Evolution Model Based on Dynamic Network Structure" Symmetry 14, no. 12: 2499. https://doi.org/10.3390/sym14122499
Note that from the first issue of 2016, this journal uses article numbers instead of page numbers. See further details here.