Article

Analysis of Rheological Factors of Soft Rock Tunnel Based on Constitutive Model of Rock Parameters Attenuation with Equivalent Effect

1
Key Laboratory of Transportation Tunnel Engineering, Ministry of Education, Southwest Jiaotong University, Chengdu 610031, China
2
China 19th Metallurgical Corporation, Chengdu 611730, China
3
Guangxi Communications Investment Group Corporation Ltd., Nanning 530022, China
4
Department of Road and Bridge Engineering, Sichuan Vocational and Technical College of Communications, Chengdu 611130, China
*
Author to whom correspondence should be addressed.
Symmetry 2022, 14(11), 2432; https://doi.org/10.3390/sym14112432
Submission received: 12 October 2022 / Revised: 4 November 2022 / Accepted: 9 November 2022 / Published: 16 November 2022

Abstract

:
Rock mass deformation is a time related process, especially for soft rock. Its deformation usually has a certain timeliness. Moreover, the deformation of surrounding rock is typically asymmetric. Therefore, it is of great significance to reasonably describe the time-dependent mechanical properties and behaviors of rock mass for practical engineering, especially when the actual engineering is a symmetric structure. Taking the chlorite schist section at the west end of the diversion tunnel of Jinping II Hydropower Station as the research object and introducing the characteristic that creep parameters attenuate with equal effect change into Burgers constitutive model used for numerical calculation, an improved Burgers model is proposed. Then, according to the actual situation of the project, the improved three-parameter H-K model, which is suitable for this study, is proposed by using the fractional calculus method. The effects of different factors on the rheological properties of soft rock tunnels are discussed. The results show that When K is equal to 1, creep is positively correlated with burial depth; When the burial depth H is 1500 m, the creep deformation is positively correlated with the horizontal geostress; The farther away from the working face, the greater the instantaneous elastic deformation release and the later creep displacement; After the tunnel excavation is stopped, the earlier the support is, the smaller the later creep deformation is; After excavation and support of the upper bench, the longer the stagnation time is, the more unfavorable the rheological deformation of the tunnel is.

1. Introduction

Engineering materials all have certain rheological properties, and rock mass materials are no exception [1,2,3,4,5]. The rheology of rock mass mainly refers to the time-related deformation and failure of the rock under the action of external loads, which are mainly manifested in creep, elastic aftereffect, stress relaxation, aging strength, and rheological damage fracture [6,7,8]. In particular, the rheology of soft rock and loose rock mass containing fillers and fracture zones is more obvious. Rock rheology is an important reason for the deformation and instability of geotechnical engineering. Taking tunnels and underground projects as an example, the stress and deformation of surrounding rock of caverns can only be reasonably explained from the perspective of rheology, such phenomena as instability or even collapse during the construction of rough tunnels, non-convergence of surrounding rock deformation, the continuous growth of deformation pressure on supporting structures, and the time effect of lining and surrounding rock, etc. Rheology has timeliness, so it can explain the problem that creep deformation and fracture still occur in underground tunnels decades after completion [9].
Although the tunnel is a symmetrical structure, its stress deformation characteristics are often asymmetric after excavation and support under complex geological environment conditions, which are closely related to the surrounding rock conditions [10,11]. When excavating tunnels in the soft surrounding rock stratum, the surrounding rock deformation, support failure, and other problems caused by rheological reasons have brought great difficulties to the construction. For example: When the Austrian Taoen Tunnel passes through schist and phyllite with chlorite stratum, great convergence deformation occurs during the construction period, with a maximum deformation of 1200 mm, a maximum deformation speed of 200 mm/d, and a deformation convergence time of 300–500 d. The tunnel deformation tends to be stable by taking measures such as increasing the length of the anchor bolt, adopting longitudinal expansion joint, adopting compressible support, and increasing the anchor bolt at the tunnel bottom; Jiazhuqing Tunnel on the Nanning Kunming Railway in China is located in schist, phyllite and other significantly metamorphic rock strata. During construction, the maximum convergence is 1200 mm, the deformation speed is 50–100 mm/d, and the deformation convergence time is 300–400 d. Measures such as increasing the reserved deformation, improving the secondary lining strength, and strengthening the inverted arch are adopted to control the deformation. Therefore, it is of great practical significance and application value in geotechnical engineering, even civil buildings, road traffic, and other fields to research rock rheological properties and deeply understand rock rheological laws.
The constitutive models of rock rheology are mainly divided into two categories: the empirical rheological model and the element combination model. The empirical rheological model is based on the rheological test of rock mass and regression fitting of test data to establish the functional equation of stress and strain of rock mass with time. Although the empirical rheological model formula can achieve a good fitting effect for specific tests, it is not universal and difficult to popularize. The element combination model uses idealized basic elements, such as Hooke body (elastic element H), Newtonian body (viscous element N), Saint Venant body (plastic element S), etc., to form a combination model in series or parallel, and derives the corresponding stress–strain relationship equation to describe the rheological characteristics of rock mass. According to the constitutive equation, the creep equation, relaxation equation, etc., can be solved. The concept is intuitive and simple and provides a clear meaning. It can comprehensively reflect the rheological characteristics of rock mass and is suitable for numerical engineering analysis of rock mass rheology [12,13,14]. Many scholars also introduced damage fracture mechanics theory and endochronic theory to form new rheological theoretical models when combining components in different ways [15,16,17]. Some scholars introduced unsteady model parameters or damage factors on the basis of the classical model to form a new constitutive model [18,19,20]. Liu et al. [21] introduced the attenuation equation of rock elastic modulus in the process of triaxial compression into the three-dimensional creep constitutive equation and obtained a three-dimensional nonlinear viscoelastic plastic creep constitutive model that can reflect the characteristics of the whole process of rock creep. It can fully reflect the constant velocity creep characteristics of soft rock and also well describe the attenuation and accelerated creep laws of soft rock. The model has few elements and a simple combination form. It provides a new reference for the study of the nonlinear creep constitutive model of soft rock. Based on the traditional Burgers model, Huang et al. [22], based on the traditional Burgers model, introduced a nonlinear viscoplastic body and determined the model parameters based on the creep test curve identified by the S-M algorithm and the general global optimization method. By comparing the test curve, fitting curve, and analysis model parameters, it is proved that the improved Burgers model can accurately describe the creep characteristics of schist. Under the background of actual highway tunnel engineering, Xu et al. [23] used numerical simulation to determine specific construction parameters. They then used the depth learning method to predict the deformation during tunnel construction. The best excavation sequence obtained through numerical simulation was symmetric excavation and used numerical simulation based on Long Short Memory (LSTM) algorithm to predict tunnel deformation. The results show that the prediction results of the LSTM algorithm are more consistent with the actual monitoring data.
In general, both rheological parameters and rheological constitutive models are important research subjects for the application of rheological theory in engineering. Rheological parameters vary greatly from one constitutive model to another [24,25]. Based on Burgers constitutive model, an improved three-parameter H-K (generalized Kelvin) constitutive model suitable for simulating soft rock is proposed in this paper, which is extended to the finite difference program FLAC3D and the rheological characteristics of deep-buried soft rock tunnels are analyzed with engineering examples.
This paper is organized as follows: The first section gives a detailed introduction to the improvement of the Burgers model and the introduction of unsteady parameters. Based on the Burgers creep damage model, an improved three-parameter H-K (generalized Kelvin) constitutive model is proposed; The second section carries out numerical simulation and establishes a three-dimensional model; The third section discusses the creep deformation characteristics of soft rock tunnels at different buried depths and side pressure coefficients, the influence of palm face on tunnel rheology, the influence of construction stop time on tunnel rheology and the influence of step method excavation on tunnel rheology. Finally, the fourth section summarizes the current research.

2. Burgers Creep Damage Model

The FLAC3D (Fast Lagrangian Analysis of Continua in 3 Dimensions) program developed by Itasca in 1997 can be used to simulate the mechanical properties of three-dimensional soil, rock mass, or other materials, especially the plastic rheological properties when reaching the yield limit and is widely used in slope stability engineering, tunnel engineering, mining engineering, and other fields. FLAC3D can be used to simulate the creep properties of materials, mainly including eight creep models, namely: classical viscoelastic model (Maxwell model), Burgers viscoelastic model, power rate model, Wipp model, Burgers viscoelastic plastic model, Power law viscoplastic model, Wipp viscoplastic creep model, and Cwipp model. In FLAC3D, the models commonly used for rock rheology analysis include the classical viscoelastic model, Burgers viscoelastic model, and Burgers viscoelastic plastic model. However, the elastic modulus and viscosity coefficient of the model parameters of the above model is constant. That is, their values remain unchanged with time. In fact, many material physical and mechanical parameters (such as strength, elastic modulus, viscosity, etc.) change with time under the action of external forces. The paper starts from the analysis of Burgers viscoelastic plastic model and introduces the equation that the parameters attenuate with the equivalent effect change. However, Burgers viscoelastic plastic model can only reflect the elastic deformation and the deformation of the first and second stages of creep and cannot describe the accelerated creep deformation process, nor can it reflect the characteristics of deformation convergence when the stress level is less than the long-term strength. By adjusting the combined elements and parameters of the improved Burgers viscoelastic plastic damage model, it can be degenerated into other rheological models, and different rheological models can be used to respond to different test requirements, thus expanding the application scope of Burgers viscoelastic plastic damage model. Among other rheological models degenerated, the parameter H-K (generalized Kelvin) viscoelastic model can better reflect the elastic deformation and the first and second stages of creep deformation under different stress levels. Introducing the parameter damage improved three parameters of the H-K viscoelastic model and can also reflect the characteristics of accelerated creep.

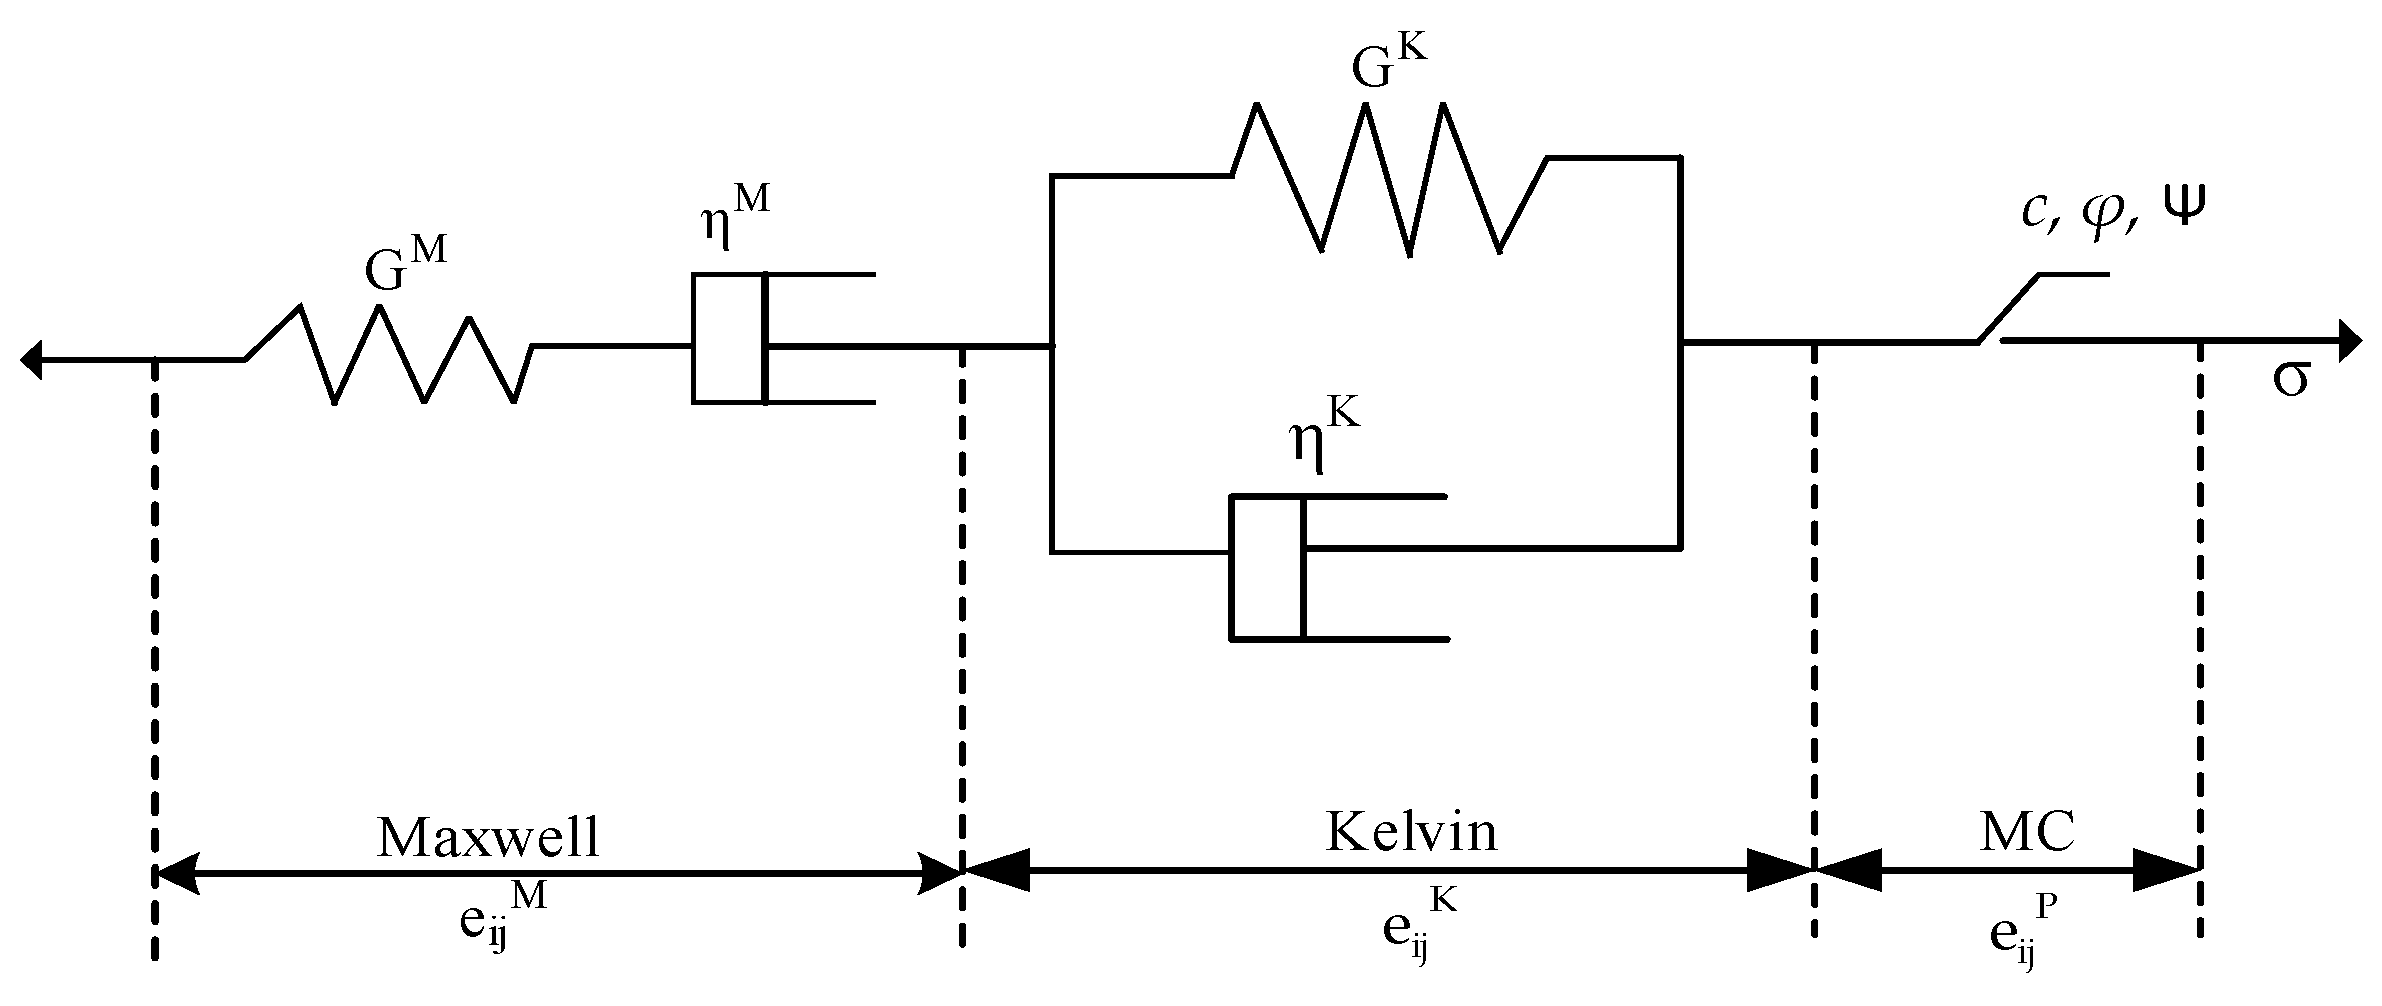
2.1. Burgers Viscoelastic Plastic Model

As shown in Figure 1. Burgers viscoelastic plastic model is composed of the Maxwell body, Kelvin body, and plastic element (MC) in series. The model includes elastoplastic volumetric stress–strain behavior and viscoelastic plastic deviatoric stress–strain behavior. The deviatoric stress–strain behavior is described by the following formula:
e ˙ i j = e ˙ i j M + e ˙ i j K + e ˙ i j P
wherein the constitutive equations of deviatoric stress and strain for the Maxwell body, Kelvin body, and plastic element (MC) are:
e ˙ i j M = S ˙ i j 2 G M + S i j 2 η M
S i j = 2 η K e ˙ i j K + 2 G K e i j K
{ e ˙ i j P = λ g σ i j 1 3 e ˙ v o l P δ i j e ˙ v o l P = λ [ g σ 11 + g σ 22 + g σ 33 ]
The constitutive equation of volume stress and strain is:
σ ˙ v o l = K ( e ˙ v o l e ˙ v o l P )
In the formula, e i j and S i j are partial strain tensors and partial stress tensors, respectively. e v o l and S v o l are volume strain tensors and volume stress tensors, respectively. M , K and P indicate that the parameter variables belong to the Maxwell body, Kelvin body, and plastic element (MC), respectively. The variable with a dot represents the first-order differential of time, g is the plastic potential function of the MC element, λ is the undetermined coefficient, K and G are the bulk modulus and shear modulus of rock, respectively, and η is the viscosity coefficient.
The failure envelope of the MC element obeys the Mohr–Coulomb criterion, and its expression is:
f = σ 1 σ 3 1 + sin φ 1 sin φ + 2 c 1 + sin φ 1 sin φ
g = σ 1 σ 3 1 + sin ψ 1 sin ψ
In the formula, σ1 and σ3 are the maximum and minimum principal stresses, respectively, and c φ and ψ are the cohesion, internal friction angle, and shear expansion angle, respectively.

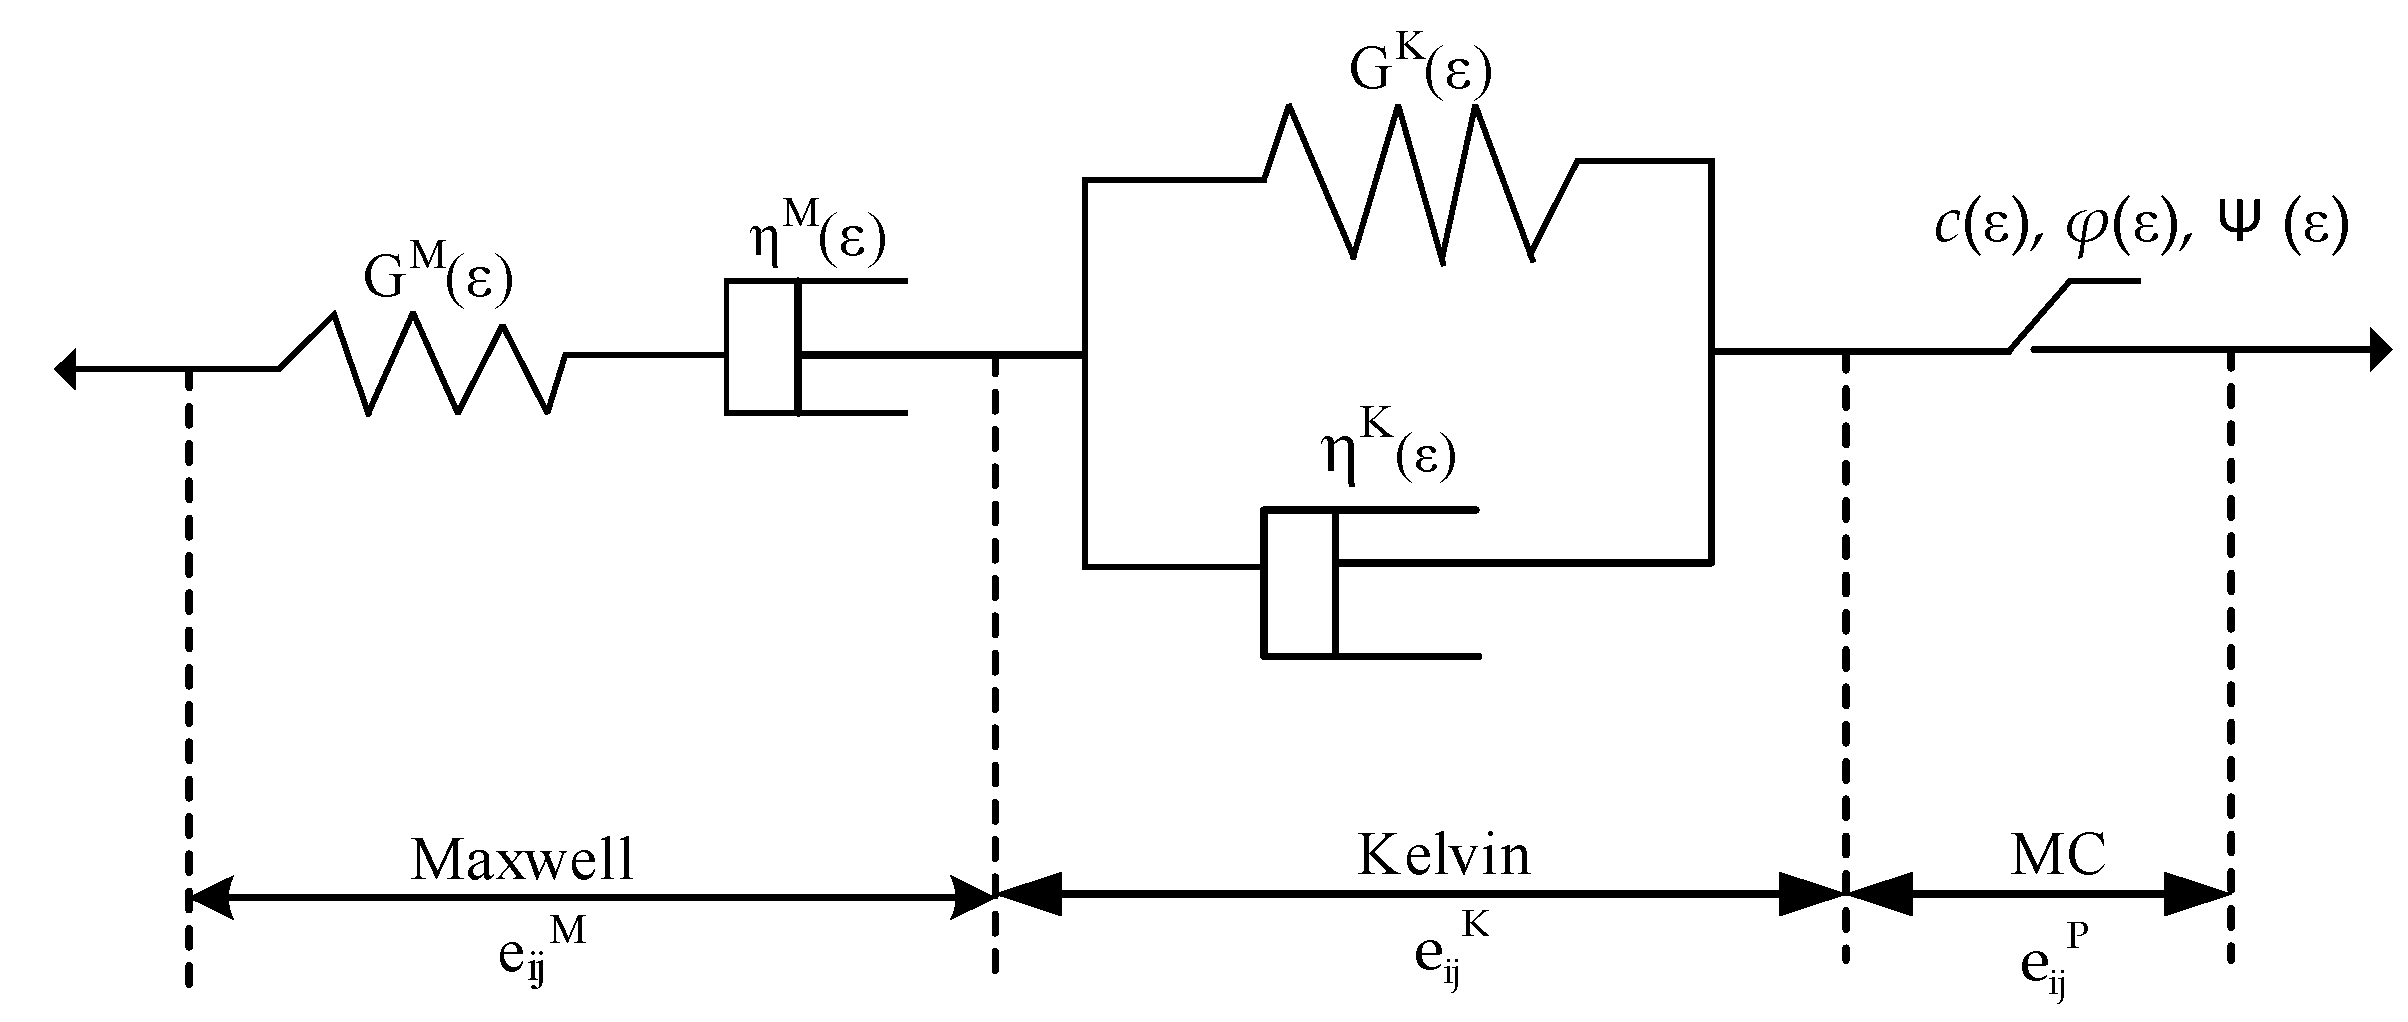
2.2. Improved Burgers Creep Loss Model

Even though FLAC3D can be used to simulate the creep properties of materials, the Burgers visco-elastoplastic model with FLAC3D does not consider the effect that the creep parameters attenuate with time or strain. However, Yang et al. [15,26] proposed a Burgers viscoelastic plastic model that takes into account the parameter deterioration effect of rock materials in the creep process. Xu [27] conducted a uniaxial compression creep test on an argillaceous slate. It was found that the strength and elastic modulus of the soft rock decreased with time. The long-term strength and long-term elastic modulus of the soft rock were obtained through regression analysis. At the same time, regression analysis also showed that the ratio of strength and elastic modulus changes with time was similar.
E ( t 0 ) σ c ( t 0 ) E ( t 1 ) σ c ( t 1 ) E ( t ) σ c ( t )
In the formula, E is the elastic modulus, and σ represents strength.
Based on Burgers viscoelastic plastic model, an improved Burgers creep damage model can be obtained by introducing unsteady parameters to reflect the creep characteristics of rock mass. Figure 2 shows the modified Burgers creep damage model, composed of the Maxwell damage body, Kelvin damage body, and plastic body (MC element) in series.
The definitions of unsteady creep parameters can be divided into two categories: the first category is that creep parameters change with time, and the other category is that creep parameters change with strain.
However, in the actual project, taking the tunnel as an example, the surrounding rock larger than five times the tunnel diameter is basically in the original stress state, and its parameters do not show obvious attenuation over time. Therefore, it is more reasonable that the creep parameters attenuate with strain. Based on the research of Xu et al. [27], it is believed that under constant loading (not exceeding the long-term strength of the rock), the parameters of the rock (such as elastic modulus, etc.) will decay over time after transient elastic deformation, and eventually tend to a stable value (i.e., long-term elastic modulus, etc.). Taking elastic modulus as an example, this paper defines the formula that creep parameters change with strain as follows:
E 1 ( ε ) = E + ( E 0 E ) e w 1 ( ε ε 0 ) = E 0 [ k + ( 1 k ) e w 1 ( ε ε 0 ) ]
E 2 ( ε ) = E 1 ( ε 1 ) [ 2 e w 2 ( ε ε 1 ) v ]
In the formula, ε0 is the strain generated by elastic deformation, and ε1 is the strain after the first and second stages of creep.
When σ < σs, the improved creep model is Burgers viscoelastic damage model, and its creep equation is:
ε = σ [ 1 E M ( ε ) + t η M ( ε ) + 1 e E K η K t E K ( ε ) ]
In the case of σσs, the improved creep model is Burgers viscoelastic plastic damage model, which obeys the Mohr–Coulomb plastic flow rule. The deviatoric stress–strain behavior is described by the following relationship.
Total strain rate:
e . i j = e . i j M + e . i j K + e . i j P
The constitutive relation of the Maxwell damage body under deviatoric stress and strain:
e . i j M = S i j . 2 G M ( ε ) + S . i j 2 η M ( ε )
Partial stress–strain constitutive relation of Kelvin damage body:
S i j = 2 η K ( ε ) e . i j K + 2 G K ( ε ) e . i j K
Mohr–Coulomb plastic flow rule:
{ e ˙ i j P = λ g σ i j 1 3 e ˙ v o l P δ i j e ˙ v o l P = λ [ g σ 11 + g σ 22 + g σ 33 ]
The volume stress–strain relationship is:
σ . v o l = k ( ε ) ( e . v o l e . v o l P )
In the calculation of FLAC3D, the tensile stress is positive, and the compressive stress is negative, In the principal stress space σ1σ2σ3.
The Mohr–Coulomb yield envelope contains shear failure and tensile failure. Considering that c, φ, and ψ also decay with strain, the formula in the principal axis stress space is:
Shear failure:
f = σ 1 σ 3 N φ ( z ) + 2 c N φ ( z )
Tensile failure:
f = σ 2 σ 3
N φ ( z ) = 1 + sin φ ( ε ) 1 sin φ ( ε )
In the formula, st is the tensile strength.
The form of potential function g is:
Shear failure:
g = σ 1 σ 3 N ψ ( δ )
Tensile failure:
g = σ 3
N ψ ( δ ) = 1 + sin ψ ( ε ) 1 sin ψ ( ε )
The model parameters in the above formula are calculated according to Equation (9), where ε is replaced by equivalent strain (ε equivalent), and ε0 is the initial equivalent strain. In the calculation process, the damage threshold (ε threshold) will be defined from the perspective of equivalent strain (ε equivalent), that is, the damage parameters in the first and second stages of creep will be calculated by Equation (9). In the first and second stages of creep, Equation (9) is used to calculate the damage parameters. With the development of creep deformation, when the equivalent change of the unit is greater than or equal to the damage threshold, the rock parameters begin to decay at an accelerated rate and enter the third stage of creep [16,17]. At this time, Equation (9) is used to calculate the damage parameters. While the equivalent change is recorded as:
ε equivalent = 2 9 [ ( ε 1 ε 2 ) 2 + ( ε 2 ε 3 ) 2 + ( ε 3 ε 1 ) 2 ] = 2 3 ( ε 1 2 + ε 2 2 + ε 3 2 )
FLAC3D does not give the principal strain, which can be calculated with the following formula:
ε equivalent = 2 3 ( ε x ε y ) 2 + ( ε y ε z ) 2 + ( ε x ε z ) 2 + 6 ( γ x y 2 + γ x z 2 + γ y z 2 )
In the formula, εequivalent is the equivalent strain. Six strain components are equivalent to the strain in a uniaxial tension, and the main strains are ε1, ε2, and ε3. εx, εy, εz, γxy, γxz, and γyz are the strains of the deformed body in six directions, respectively.
The typical Burgers viscoelastic plastic model can reflect the characteristics of rock instantaneous elastic deformation, plastic deformation, deceleration creep, and constant velocity creep and can also reflect the properties of accelerated creep by considering parameter damage. After considering the attenuation of rock parameters c, φ, and ψ, it can also reflect the characteristics of the plastic zone range changing with time and failure.

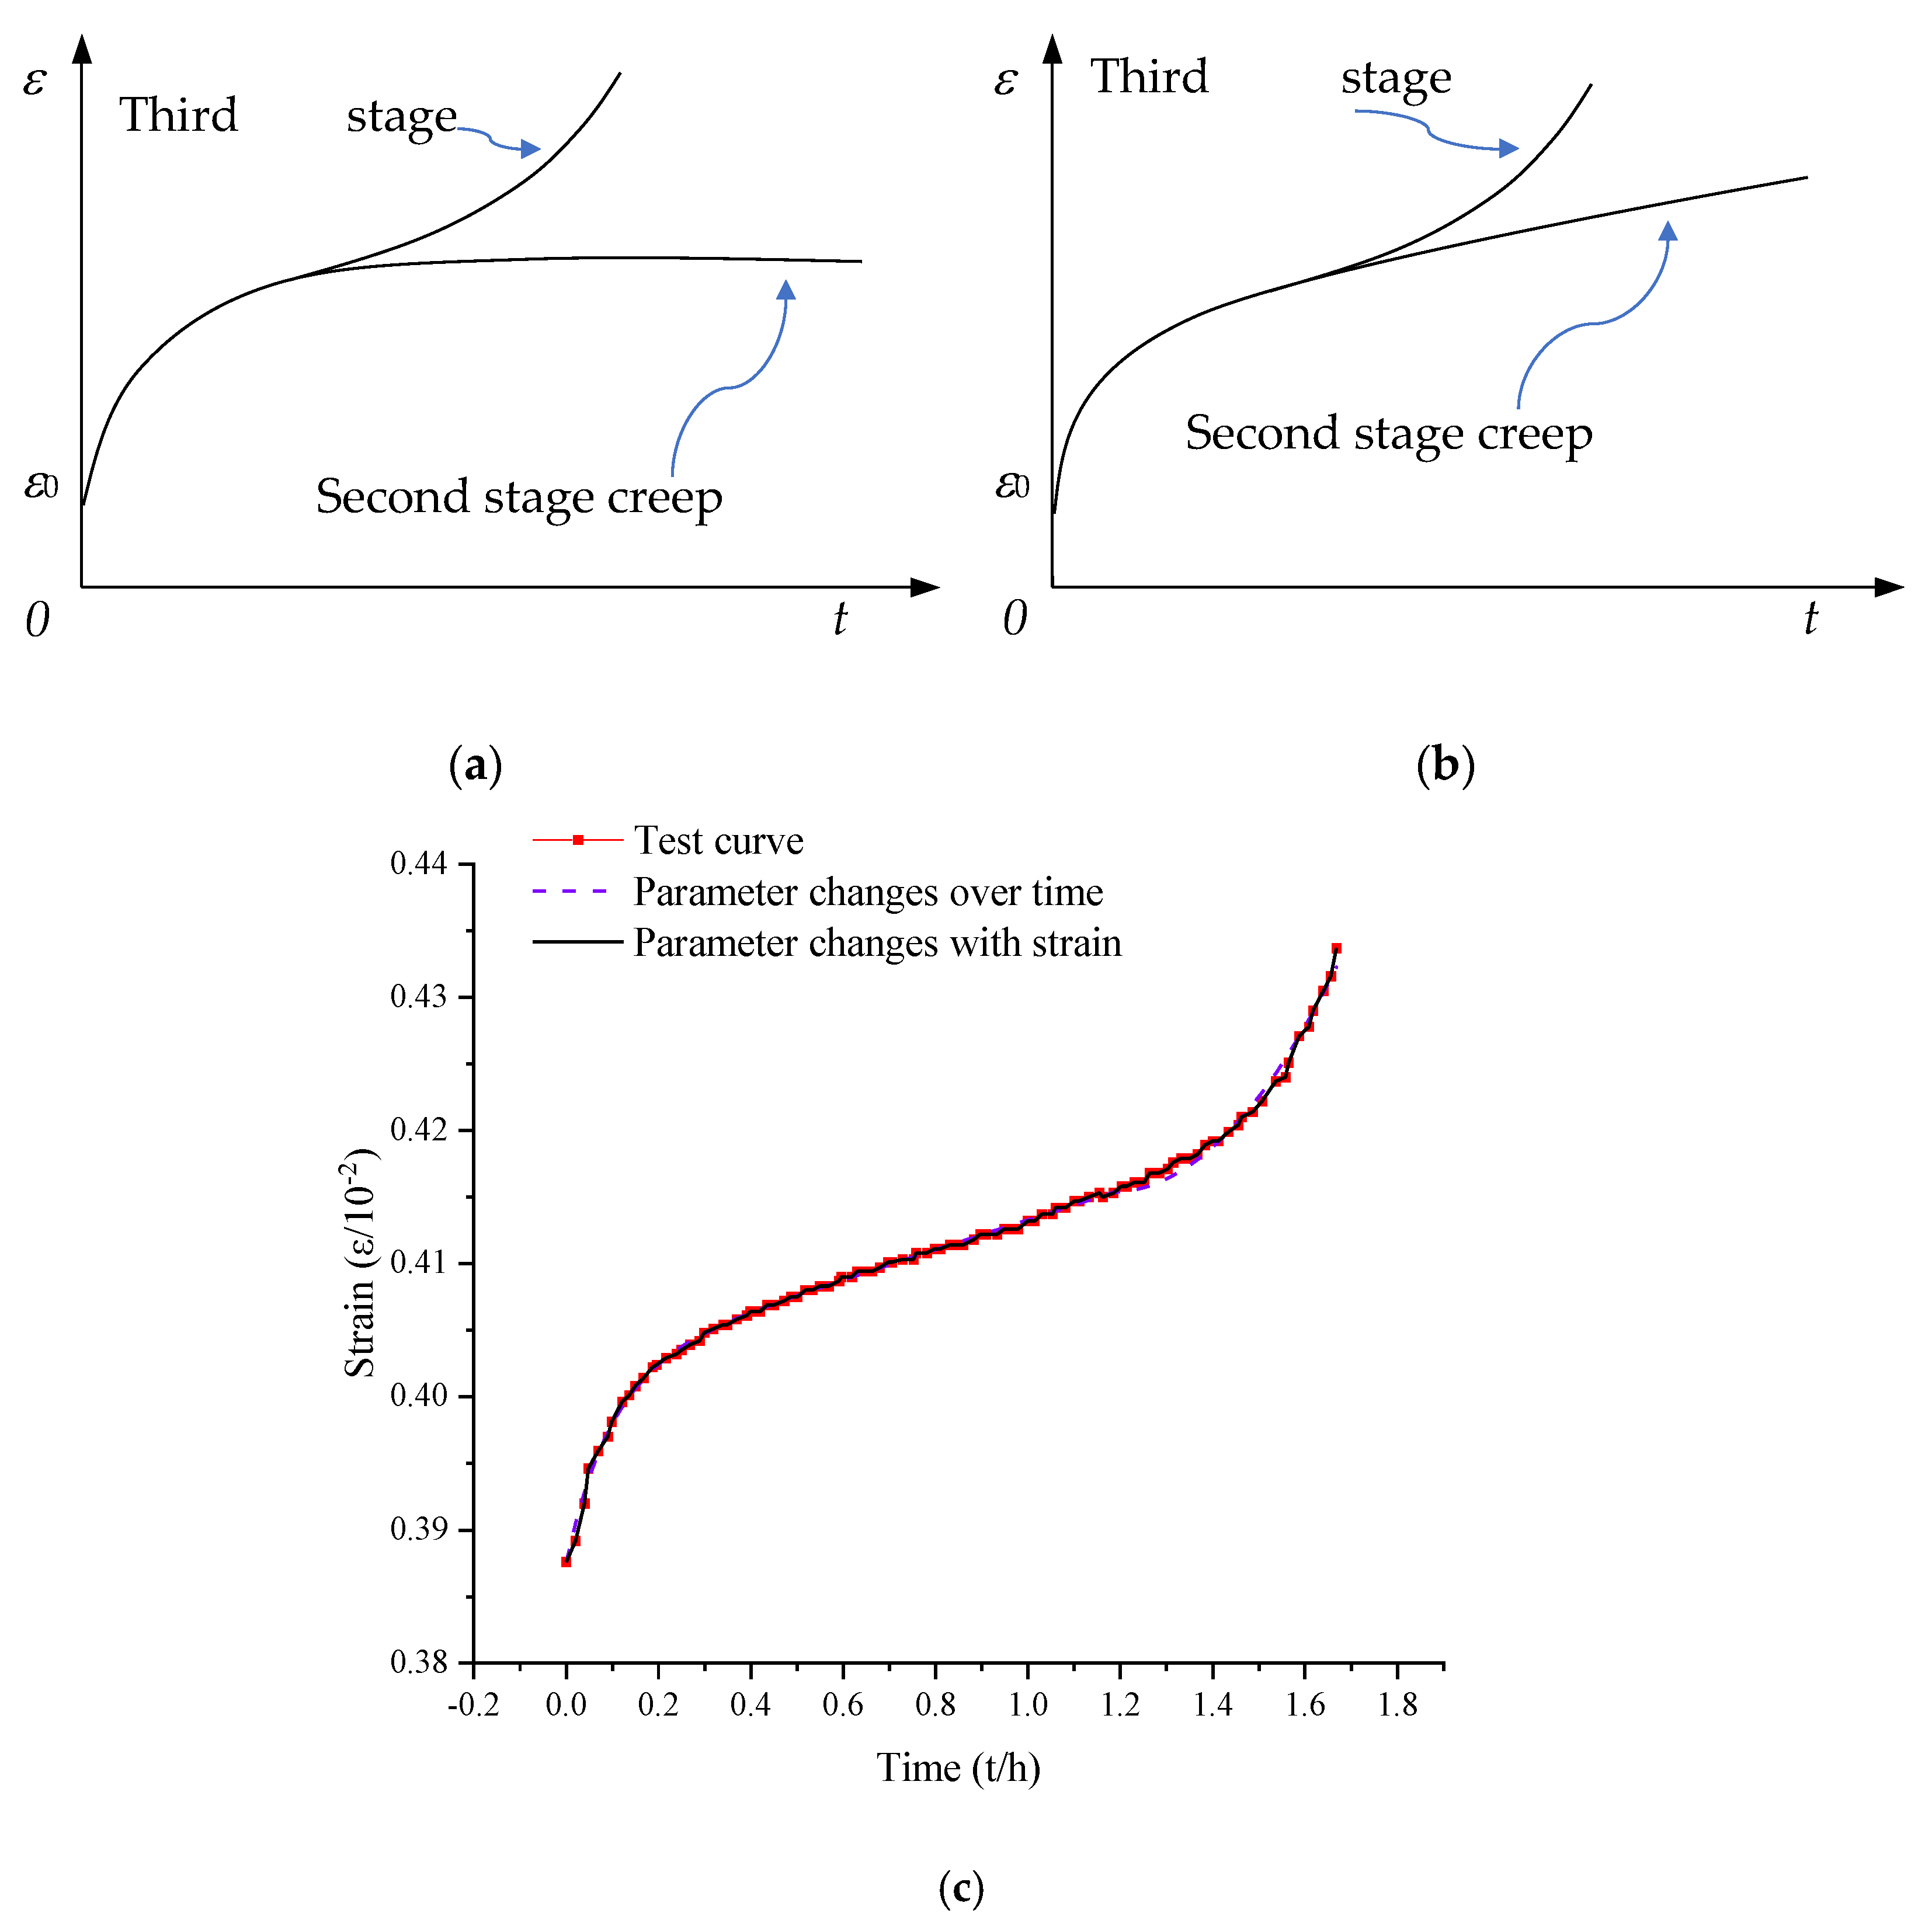
2.3. Example of Improved Model

The Burgers viscoelastic model is improved, and the plastic deformation is not considered. During the creep calculation, the parameters attenuate with the increase of equivalent strain, and the attenuation principle follows the formula (9). The viscoelastic mechanical characteristics of the circular tunnel after excavation are discussed in the form of plane strain. The calculation model is shown in Figure 3.
1/4 of the tunnel size is selected as the calculation model. The tunnel radius is 7 m, the horizontal coordinate range of the model is x = 0−60 m, the vertical coordinate range is z = 0−60 m, and the longitudinal coordinate range is y = 0−1 m. The model is divided into 1556 nodes and 740 units. Constraints are imposed around the model, the initial geostress is 40 MPa, and the lateral pressure coefficient is 1, simulating a deeply buried tunnel.
The surrounding rock parameters are shown in Table 1, and the undetermined coefficients related to parameter attenuation are shown in Table 2 The influence of the support function and the bulk strain is not considered in the calculation process. Therefore, the bulk modulus is taken as zero, the plane strain mode is adopted, and the full stress is released without considering the influence of the working face.
Calculate the parameter attenuation during the first and second stages of creep deformation according to Equation (9), and obtain the change curve of tunnel side wall displacement with time as shown in Figure 4, when k = 0 and w1 = 0, it is a typical Burgers viscoelastic solution; when k = 0.5, in order to improve the Burgers viscoelastic damage model solution, it can be seen that the displacement increases significantly with the increase of w1 value, but the displacement increase speed is the same for different w1 values; when w1 = 50, the displacement increases rapidly with the decrease of k value, and the smaller the k value is, the faster the displacement increases. According to the above calculation results, it can be seen that under certain parameters, the calculation results after considering damage (k and w1 values are not zero) are greater than those without considering the damage.

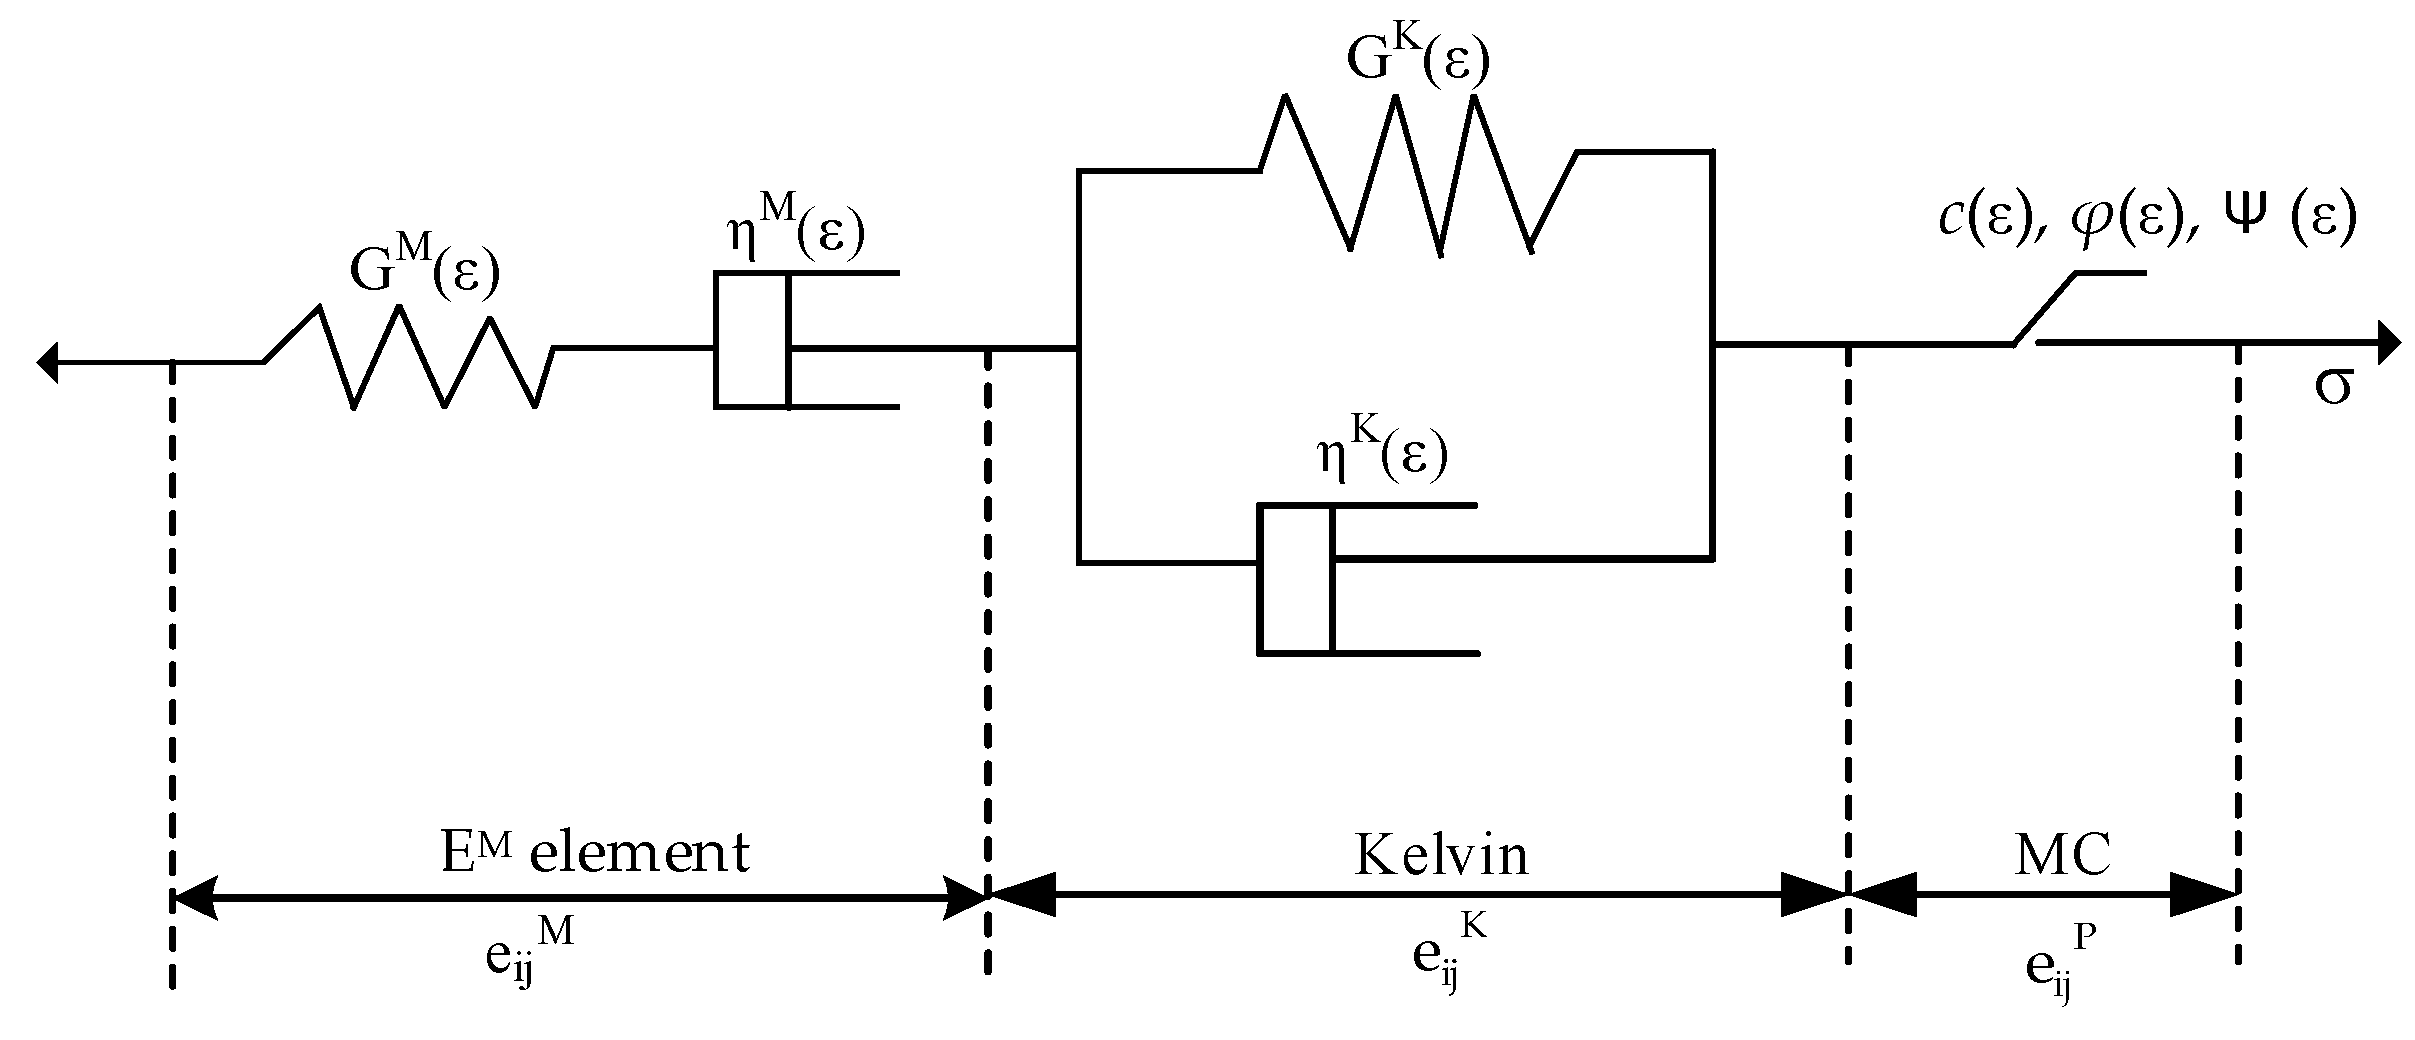
2.4. Improved H-K Model

Since Burgers viscoelastic plastic model can only reflect the elastic deformation and the deformation of the first and second stages of creep, it cannot describe the accelerated deformation process of creep, nor can it reflect the characteristics of deformation convergence when the stress level is less than the long-term strength, By adjusting the combined elements and parameters of the improved Burgers viscoelastic plastic damage model, it can be degenerated into other rheological models, such as the modified three parameters H-K viscoelastic model without considering the plastic deformation after removing the viscous components of the Maxwell body. The improved parameter H-K (generalized Kelvin) viscoelastic model can better reflect the first and second stages of elastic deformation and creep deformation under different stress levels, making the model more widely used.
On the basis of the three-parameter (H-K) model (or the generalized Kelvin model), assuming that the creep parameters E, E′, h are variable, and considering that they vary with strain, E(e), E′(e), h(e) are calculated by Equation (9). The improved H-K model is shown in Figure 5, and the relevant creep model equations are as follows:
ε = σ 0 [ 1 E ( t ) + 1 E ( t ) 1 E ( t ) e E ( t ) η ( t ) t ]
ε = σ 0 [ 1 E ( ε ) + 1 E ( ε ) 1 E ( ε ) e E ( z ) η ( z ) t ]
Characteristics of improved three-parameter (H-K) damage model: during the decay of rock parameters to long-term values, if the loading is less than the long-term strength of rock after decay, the creep deformation will tend to be stable over time, that is, only the first and second stages of creep deformation occur, and the parameters decay to less than or equal to long-term values; if the loading is greater than the strength of the rock after attenuation (it may not have attenuated to the long-term strength), the creep will enter the third stage of accelerated deformation, the parameters will attenuate to zero, and the rock will be damaged, as shown in Figure 6. The curve control parameters of the typical three-parameter model in the first and second stages of creep are E0 and h0. The application scope of the curve shown by the changes in the two parameters is limited. The introduction of attenuation-related parameters (w1, w2, and v) makes the model more widely used. Under the condition that the initial elastic modulus E0 and attenuation ratio k are known, the parameters to be determined in the fitting of the first and second stages of creep are E0, η0, and w1, and the parameters to be determined in the fitting of the third stage of creep are w2 and v. The fitting curve is obtained by fitting the data with particle swarm optimization algorithm, as shown in Figure 6. It can be seen from the figure that the two kinds of unsteady parameter models can better reflect the test results.

3. Numerical Model

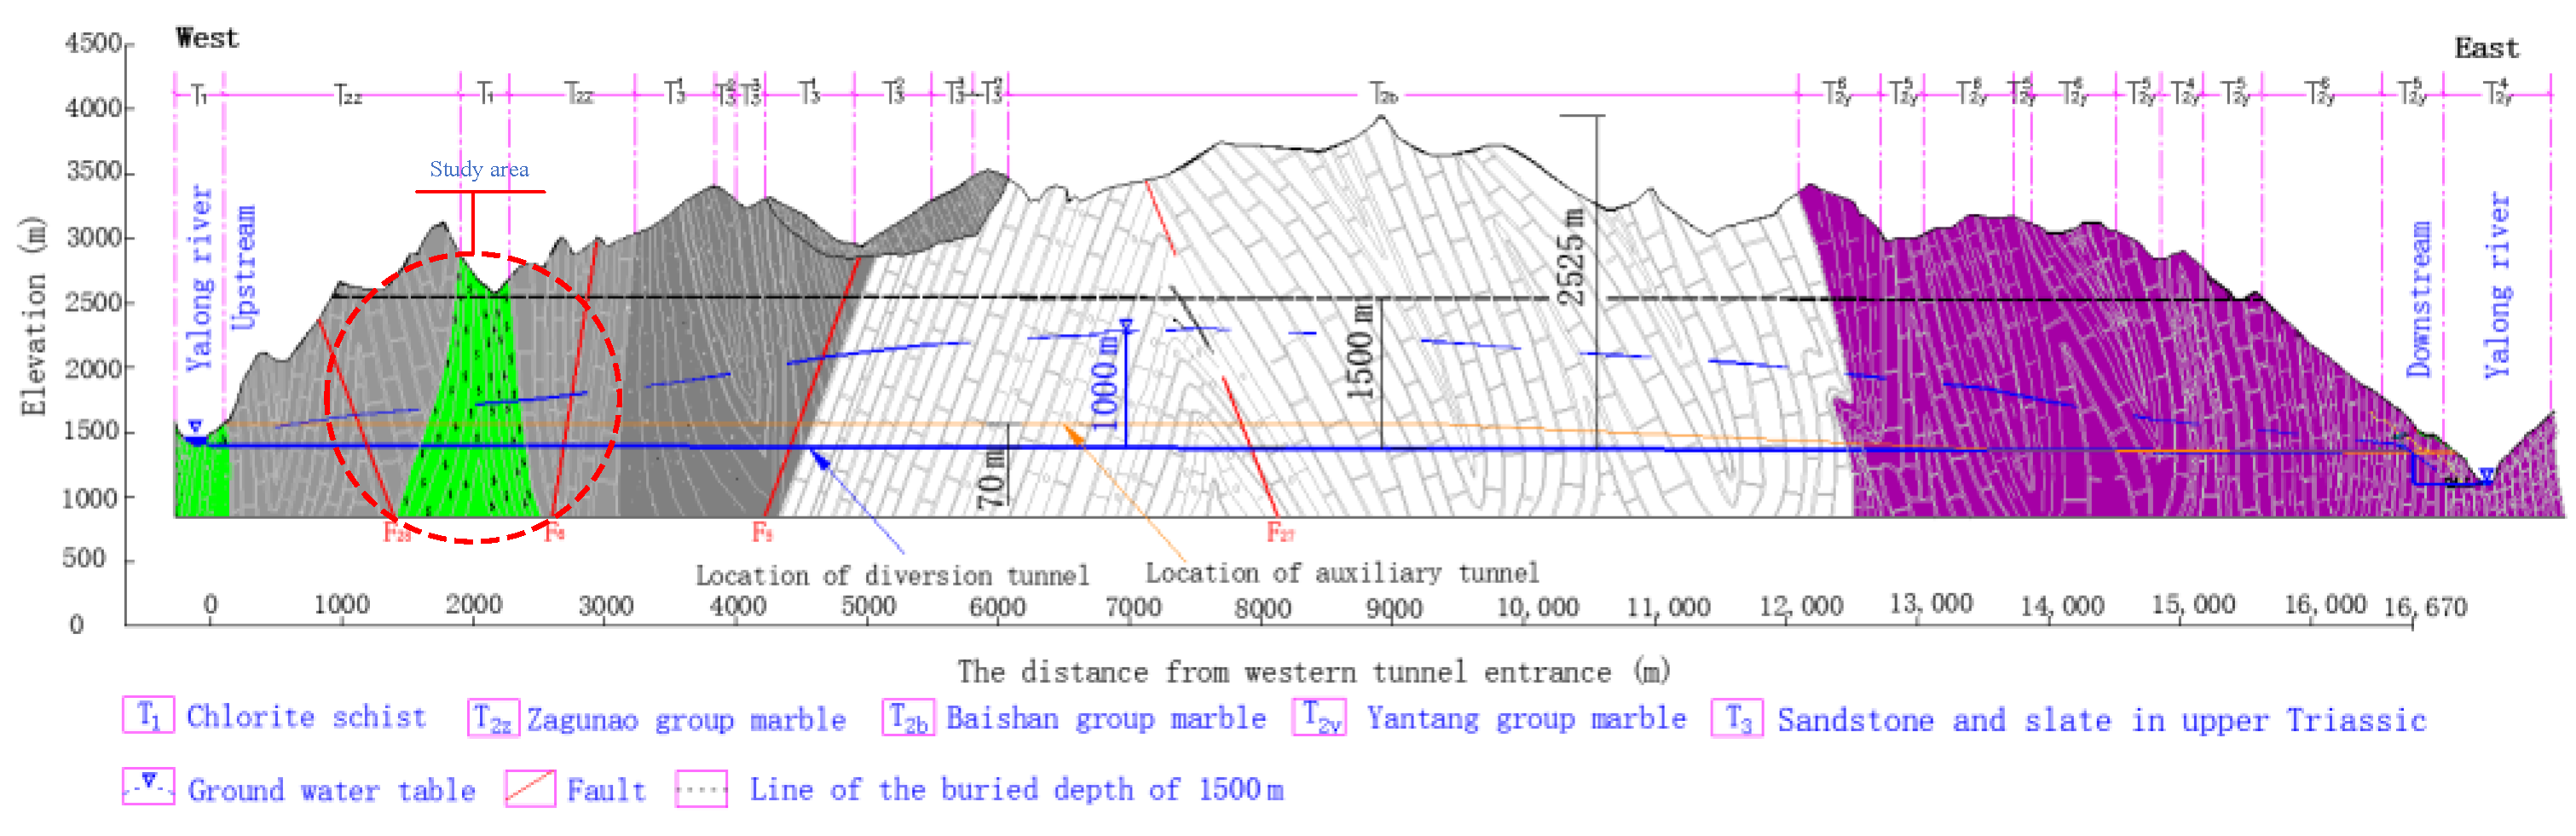
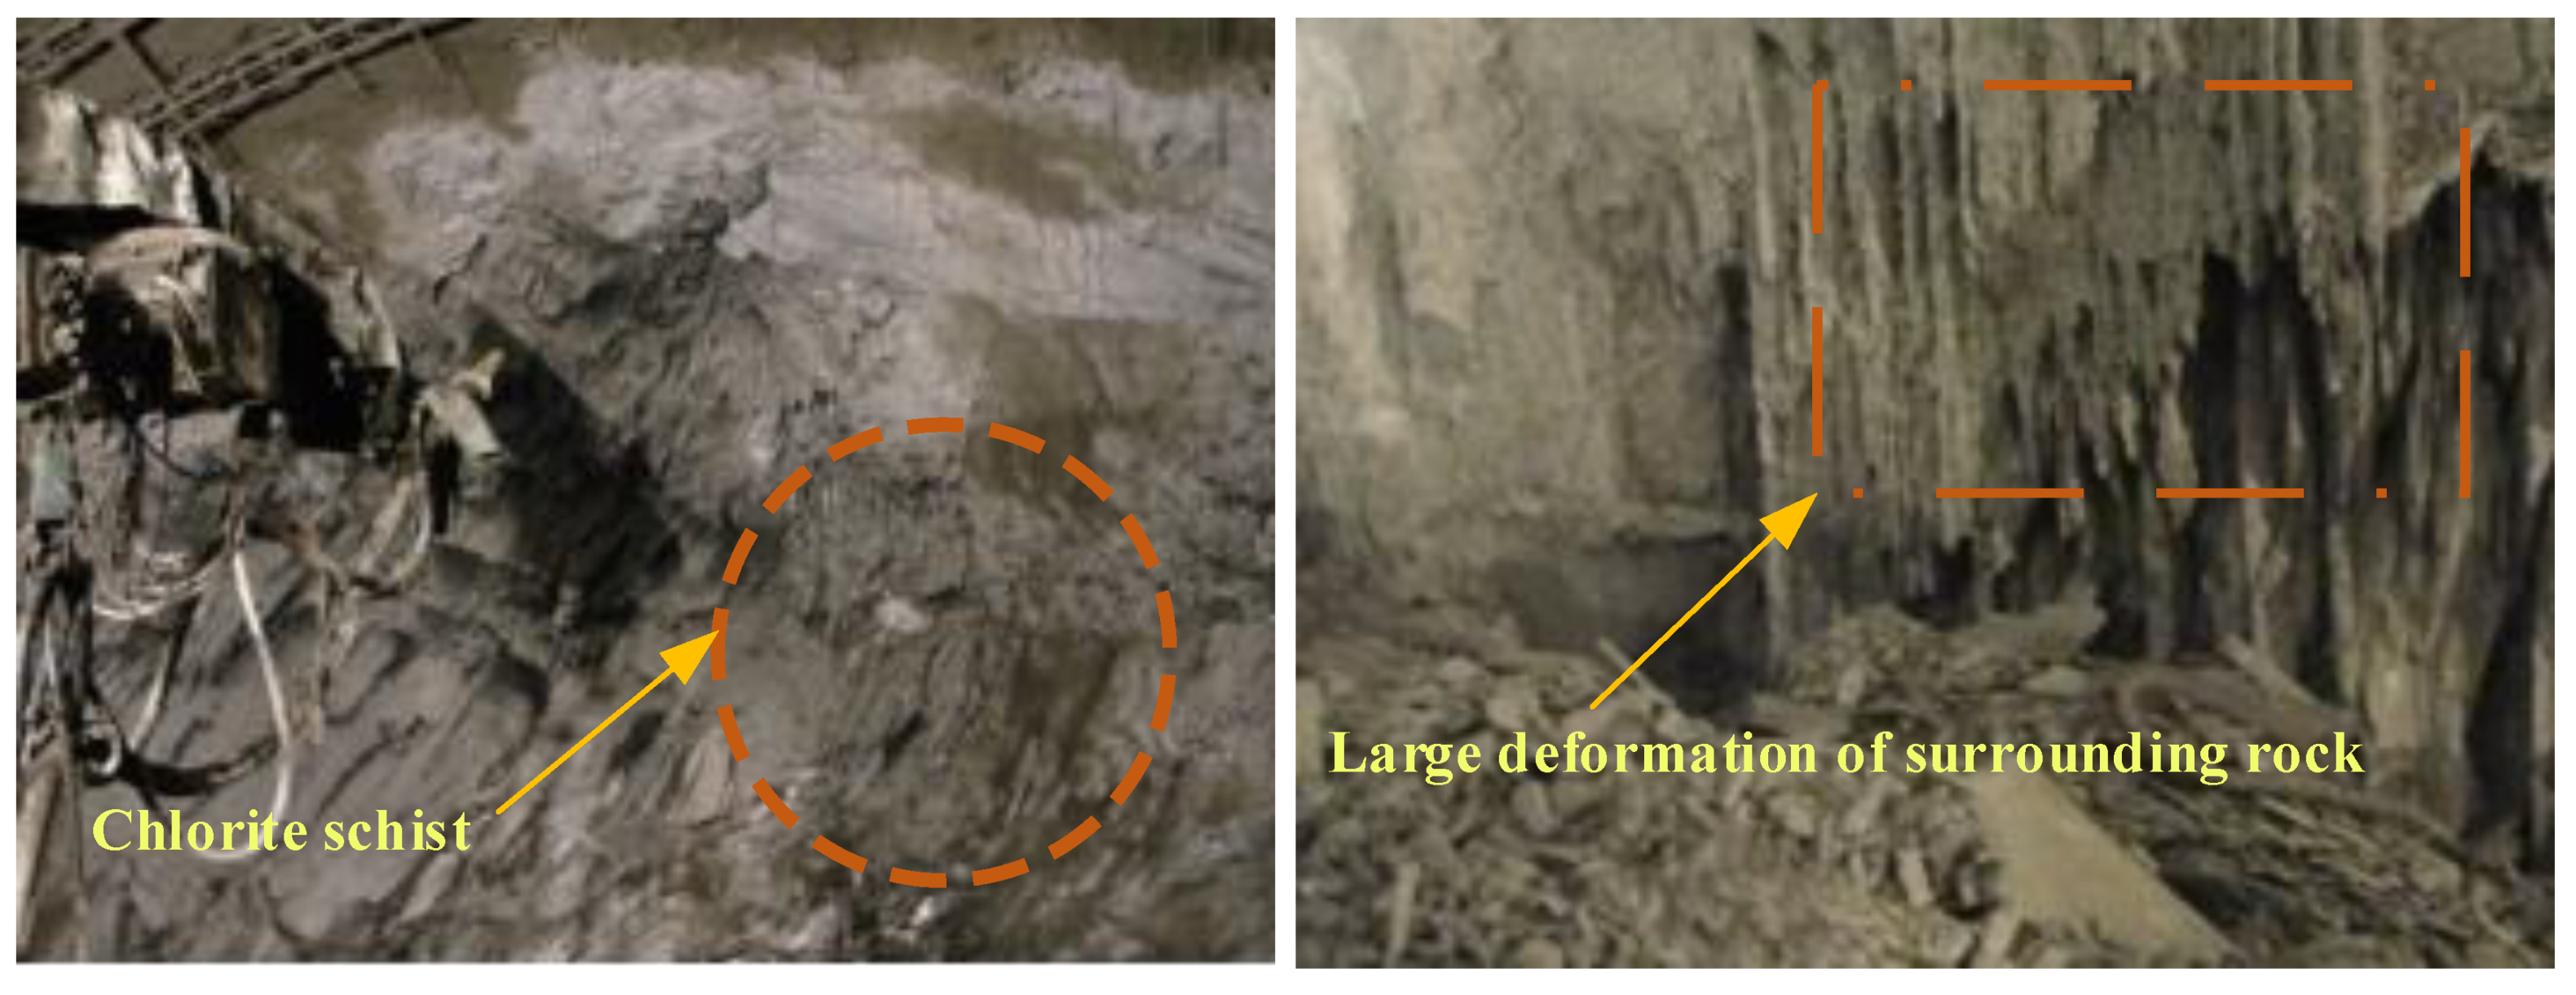
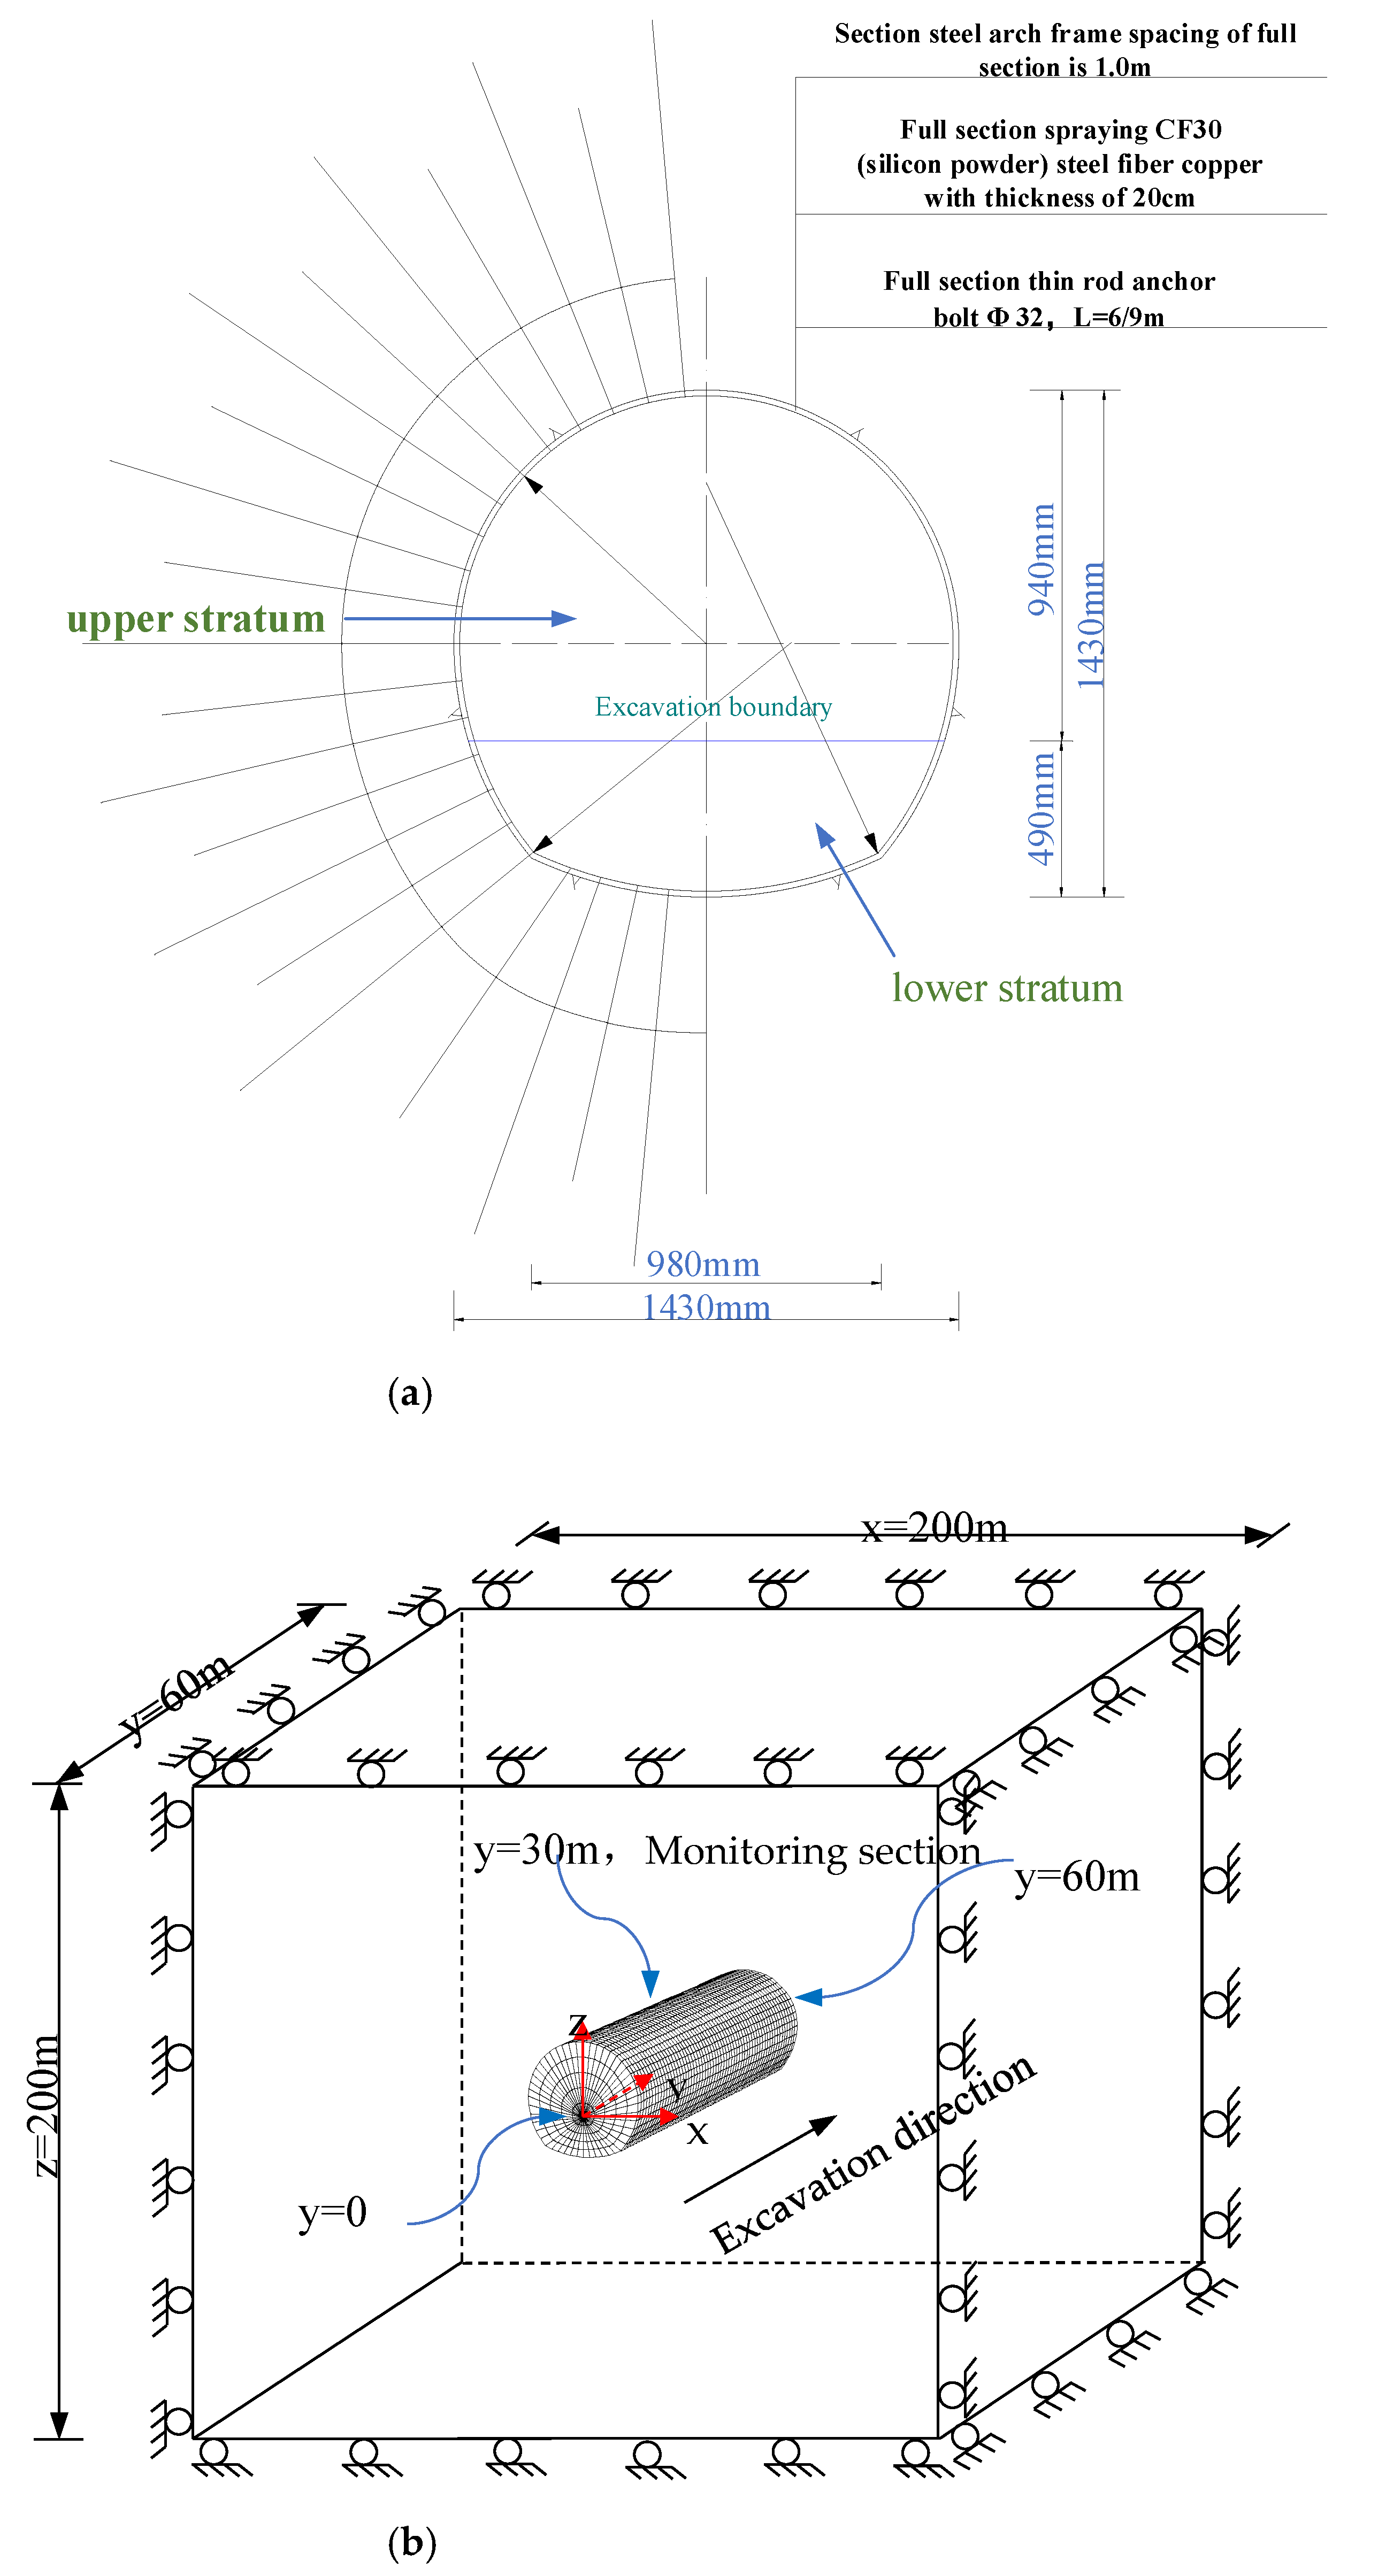
3.1. Project Overview

The diversion tunnel of Jinping II Hydropower Station is located at the junction of Yanyuan, Mianning, and Jiulong counties in Liangshan Prefecture, Sichuan Province, China, with an average length of 16.67 km. The tunnel is excavated by drilling and blasting method, with a diameter of 13.4–13.8 m and a buried depth of 1500–1850 m. According to the data of the exposed headrace tunnel and the exposed tunnel section of the Jinping Mountain Tunnel excavation, the lithological distribution of the stratum along the headrace tunnel line is shown in Figure 7 and Figure 8. The stratum is dominated by Class IV surrounding rock, with low rock mass strength and softening characteristics when encountering water. The lithology is mainly chlorite schist and carbonaceous phyllite. The average uniaxial compressive strength of the measured saturated chlorite schist is only 19.7 MPa. When the headrace tunnel is constructed to this stratum, the surrounding rock deformation is generally large. Under the condition of conventional support, the tunnel surrounding rock deformation encroaches on the design lining clearance, generally more than 20 cm, most of which are between 20–60 cm, and some of which are more than 1 m. It is a typical example of rheological deformation of soft rock tunnels, and serious engineering phenomena such as arch distortion, shotcrete cracking, and non-convergence of surrounding rock deformation have occurred.

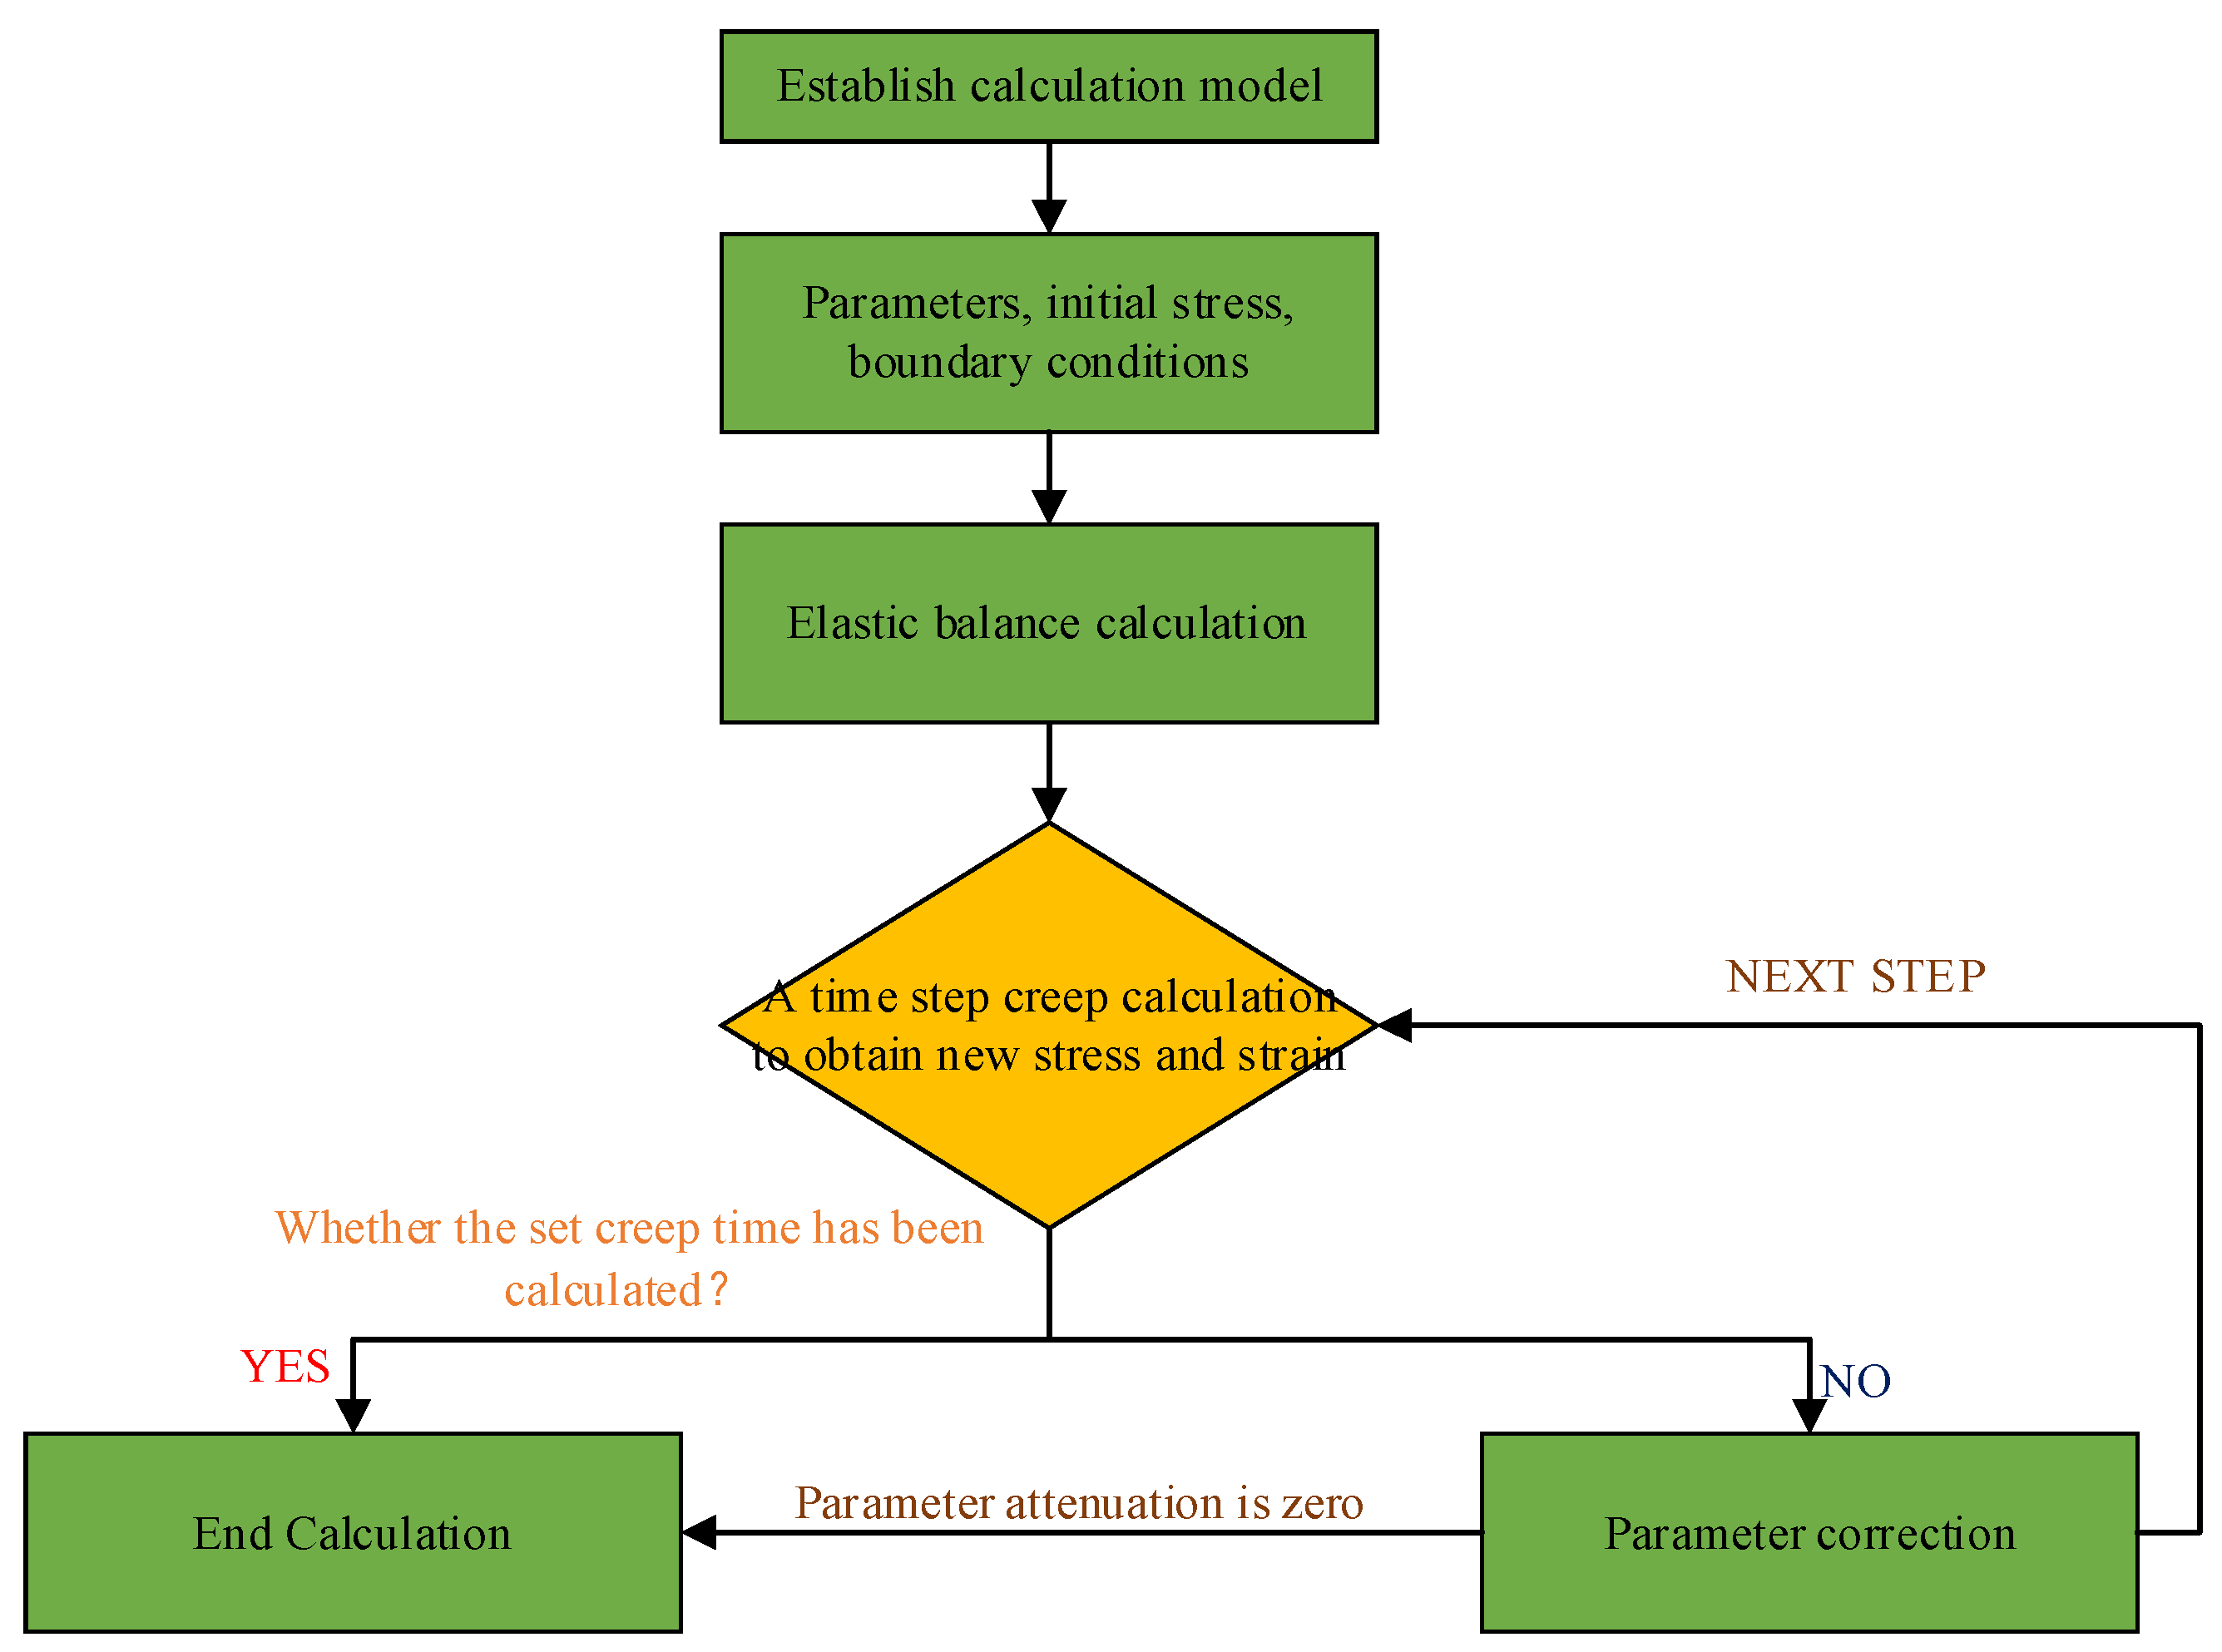
3.2. Selection and Realization of Constitutive Model for Soft Rock Tunnel

The selection of the constitutive model needs to be based on the relevant test data. Sun [1], Xu [27], and others have conducted a lot of rheological test research on various rock specimens and summarized the characteristics of the test creep e-t curve: Instantaneous application of stress σ will produce instantaneous elastic deformation, ε0 = σ/E; when the stress level is less than the long-term strength (σ < σs), the strain growth rate gradually decreases to zero, while t→∞, the strain will tend to a fixed value. The material will not yield and fail, and only the first stage (deceleration) and the second stage (stability) of creep will occur; when the stress level is greater than or equal to the long-term strength (σ ≥ σs), the strain will increase infinitely with time and will not converge to a fixed value. The material will yield and fail. After the first and second stages of creep, it will enter the third stage (acceleration).
According to the above characteristics, it can be seen that the creep deformation is generally divided into three stages, as shown in Figure 9, which is a nonlinear process. For hard rock, the three stages of deformation are not obvious, especially when the stress on the material exceeds the long-term strength. The deformation development time of the third stage is relatively short. The rock will be destroyed quickly; soft rock has obvious three-stage deformation characteristics. The three stages of creep can be described by viscoelastic mechanics or viscoplastic mechanics. When viscoelastic description is adopted, yield and plastic deformation are not considered. As shown in Figure 10, the OA section is elastic deformation, and the AD section is creep deformation in three stages; when the viscoplastic description is used, if the stress value exceeds the yield strength, the OA section contains elastic deformation and plastic deformation. If the yield strength is not exceeded, only elastic deformation is available.
According to the above characteristics, the existing viscoelastic and viscoelastic plastic models can only reflect the elastic deformation and the deformation of the first and second stages of creep, such as the Burgers model and Xiyuan model, which can better reflect the elastic deformation, deceleration creep and steady speed creep when the stress level is greater than the long-term strength, but cannot describe the accelerated deformation process of creep, and cannot reflect the characteristics of deformation convergence when the stress level is less than the long-term strength; the improved three-parameter H-K (generalized Kelvin) viscoelastic model can better reflect the elastic deformation and the first and second stages of creep deformation under different stress levels. By introducing parameter damage, it can also reflect the characteristics of accelerated creep, as shown in Figure 11. The stress–strain constitutive equation of the model can refer to Equations (10)–(23).
The three-parameter H-K model is not directly provided in FLAC3D, which can be modified on the basis of the existing Burgers viscoelastic model through FISH language. The specific implementation process is shown in Figure 11.
At the beginning of the calculation, it is necessary to shield the viscous element of the Maxwell body and conduct creep calculation at every time step (to avoid too long calculation time, the calculation time step is set to the automatic adjustment mode). Judge whether to conduct an accelerated creep stage according to the equivalent strain threshold and use the corresponding damage formula to calculate and adjust the parameters. When the calculation time is reached, or the parameter attenuation is zero, the calculation stops. The original unbalanced state of the system (such as excavation) is used to determine the unbalanced force of each node in the model (i.e., node force); according to the nodal force, the nodal velocity component is calculated by the equation of motion.

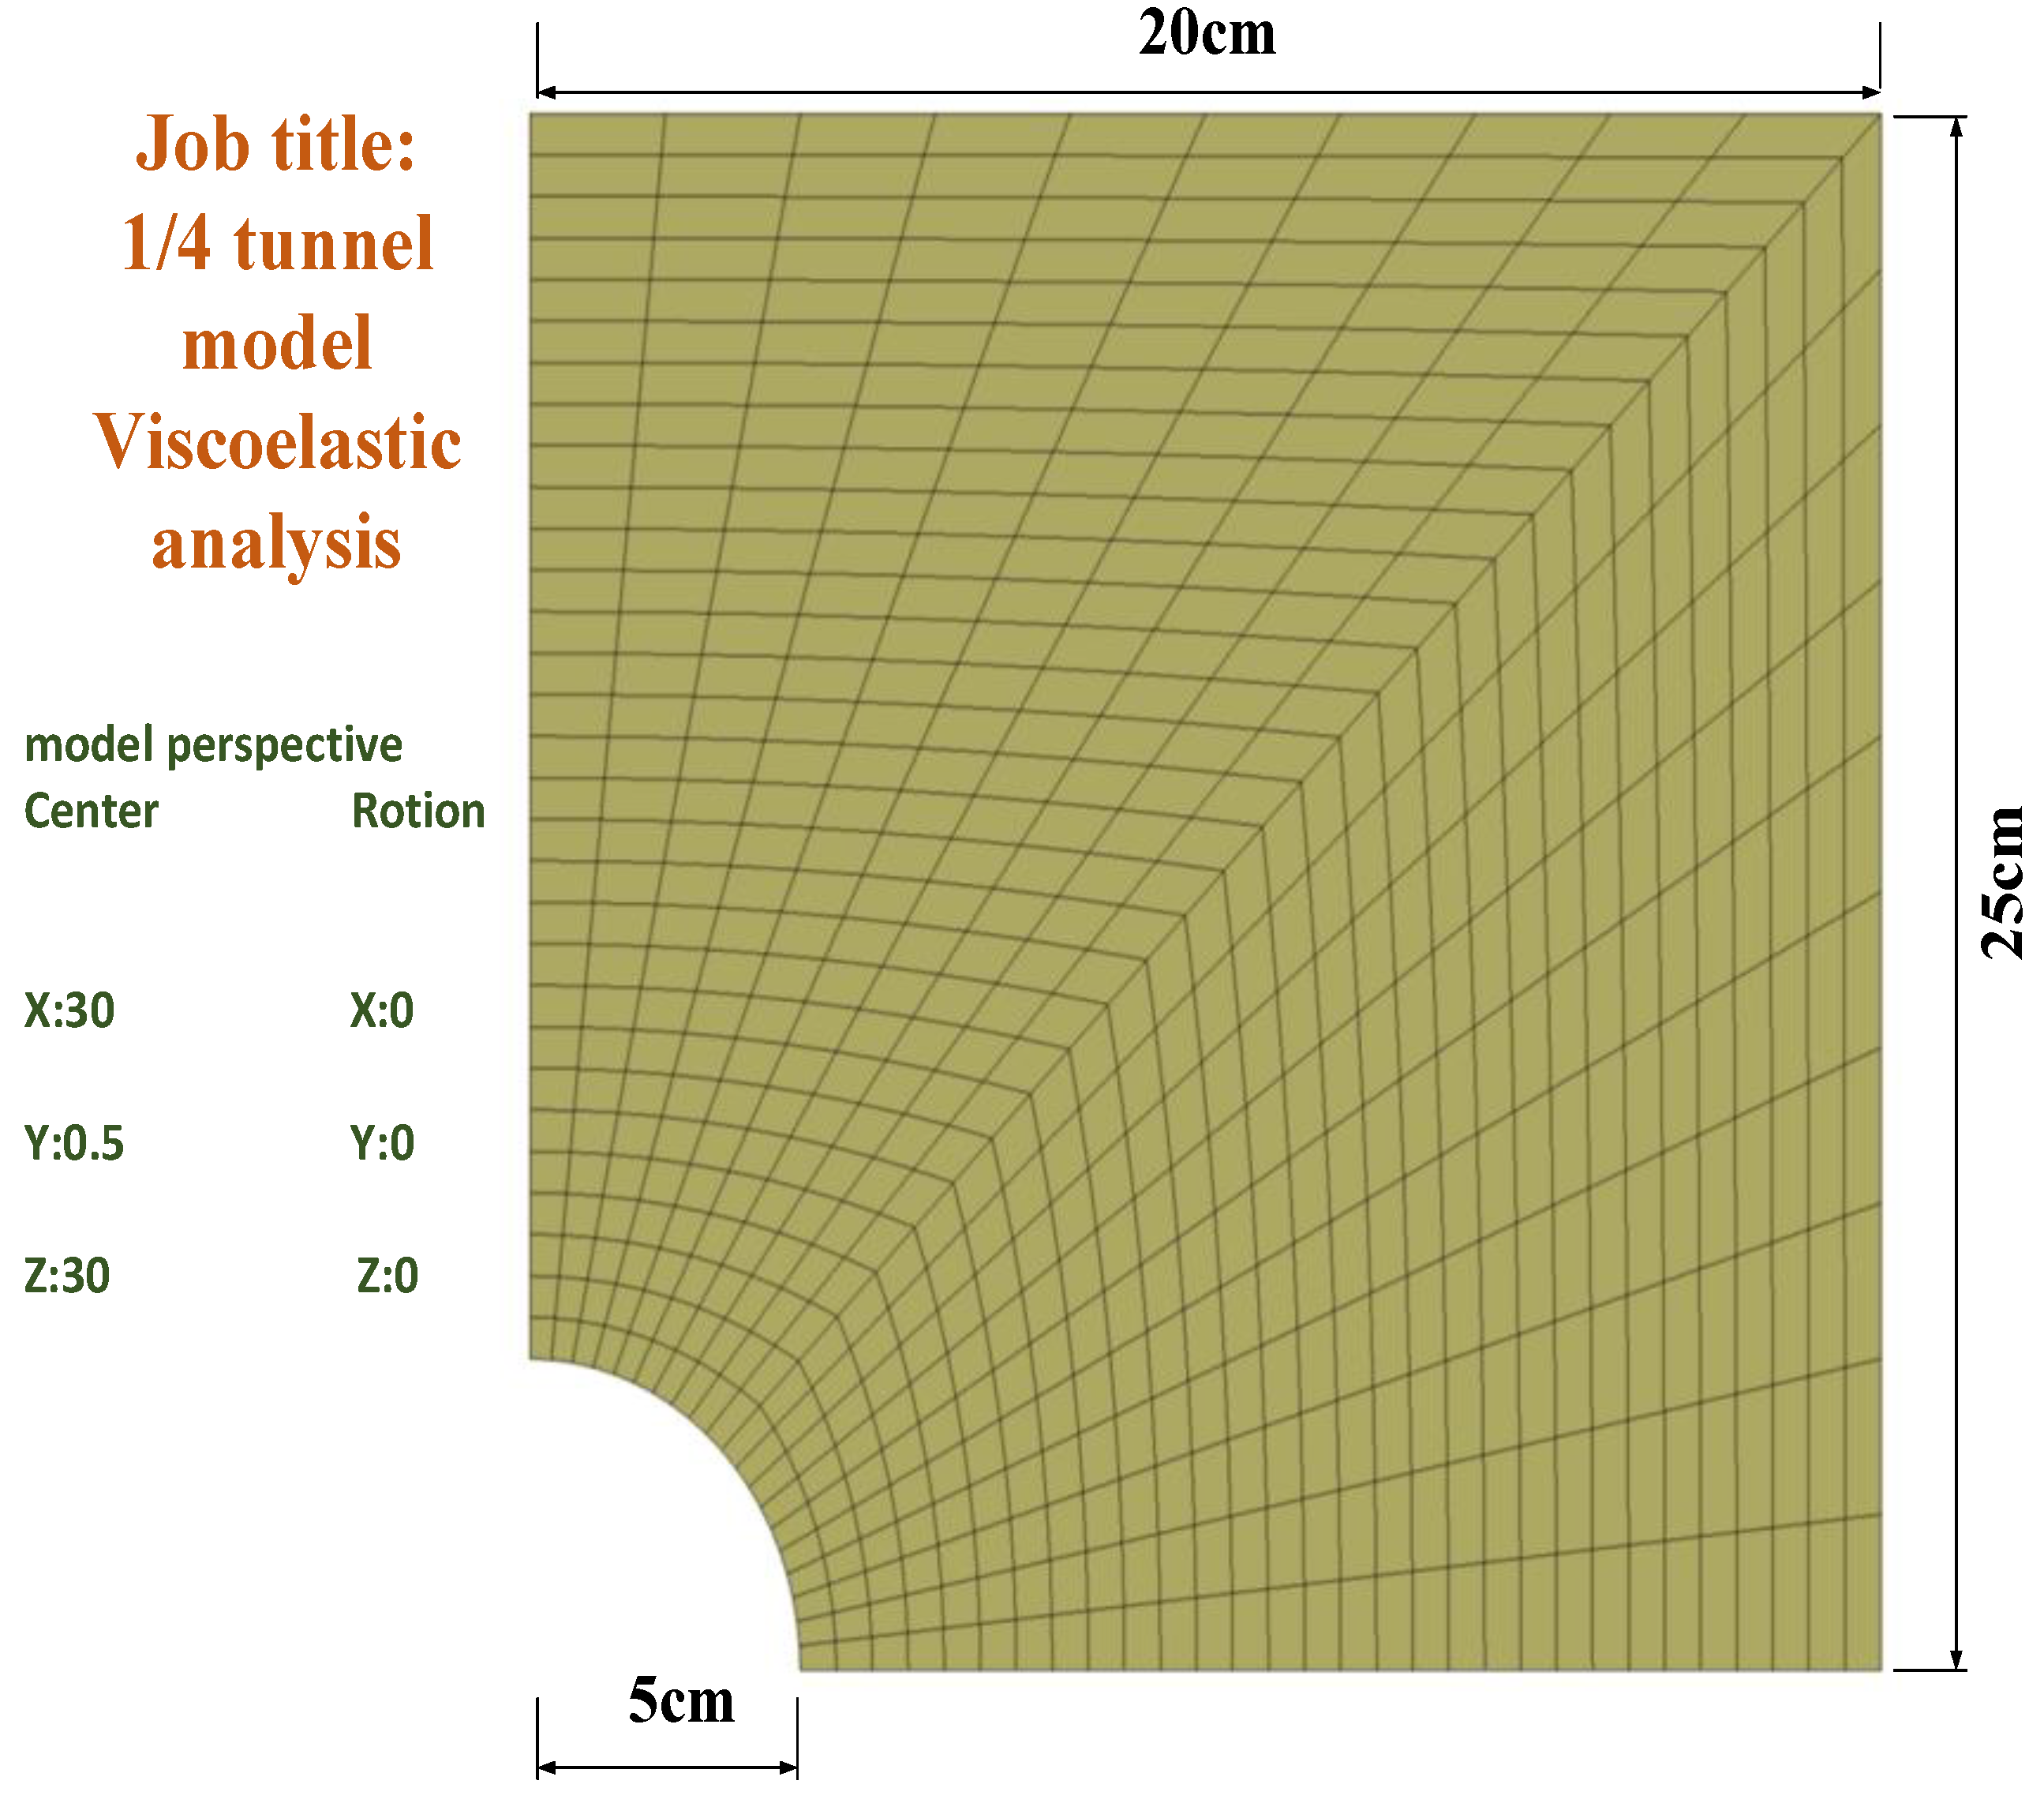
3.3. Establishment of 3D Grid

Tunnel excavation is a dynamic three-dimensional problem that the plane strain model cannot effectively analyze. The influence of tunnel face and excavation speed on the creep deformation of surrounding rock still needs to be analyzed through three-dimensional calculation. Based on the actual situation of the diversion tunnel of Jinping II Hydropower Station, the tunnel section is a three-centered circular tunnel with a tunnel diameter of 14.3 m, as shown in Figure 12a; the tunnel stratum is mainly chlorite schist, with a burial depth of about 1500–1800 m. Due to different burial depth, the stress level is different, so this paper selects three different depths (H = 1000, 1500, 2000 m) to simulate different working conditions; the tunnel support adopts the comprehensive support of profiled steel arch frame, long and short prestressed anchor bolts and shotcrete, and the support layout is shown in Figure 12c.
In order to consider the influence of boundary effect, the three-dimensional size of the calculation model is set as: Horizontal direction x = −100–100 m, vertical direction z = −100–100 m, longitudinal direction y = 0–60 m, and y direction is the direction of tunnel excavation. Considering the factors of burial depth, the number of grids, calculation time, etc., the fixed displacement method is adopted to simulate the deep burial, and the normal displacement constraint is applied to all six sides of the model, as shown in Figure 12b. Different initial geostress is applied at different burial depths; among them, the eight-node hexahedral element is used to simulate surrounding rock, a beam element is used to simulate profiled steel arch, a shell element is used to simulate shotcrete, and an anchor cable element is used to simulate full length bonded long and short system anchor. The support model is shown in Figure 12c.The simulated H20 steel arch is 1 m apart, and the system anchor bolts are 1 m apart and arranged in a combination of length and length. The modified three-parameter H-K (generalized Kelvin) viscoelastic model is used to simulate the creep deformation of surrounding rock.
The calculation assumes that the excavation footage is 1 m, the excavation and support are completed instantaneously, independent of time, and the support damage is not considered in the calculation process.

3.4. Model Parameters

The mechanical calculation parameters of the surrounding rock are determined according to the field geological exploration data and the strength test of the surrounding rock(Table 1). At the same time, according to the H20 steel arch frame, F32 system anchor bolt, and CF30 (silicon powder steel fiber) shotcrete support adopted on the site, the calculation parameters of the proposed support structure are shown in Table 3 after finding the relevant material parameters.

4. Research on Rheological Factors of Soft Rock Tunnel

In order to discuss the influence of factors such as different burial depths, lateral pressure coefficient, different distance (D) from the face, time to stop construction (without support), bench excavation, and other factors on the rheology of soft rock tunnel, the creep calculation will be carried out by improving the three-parameter H-K model through the corresponding simulation process. The surrounding rock parameters and support parameters are shown in Table 4.

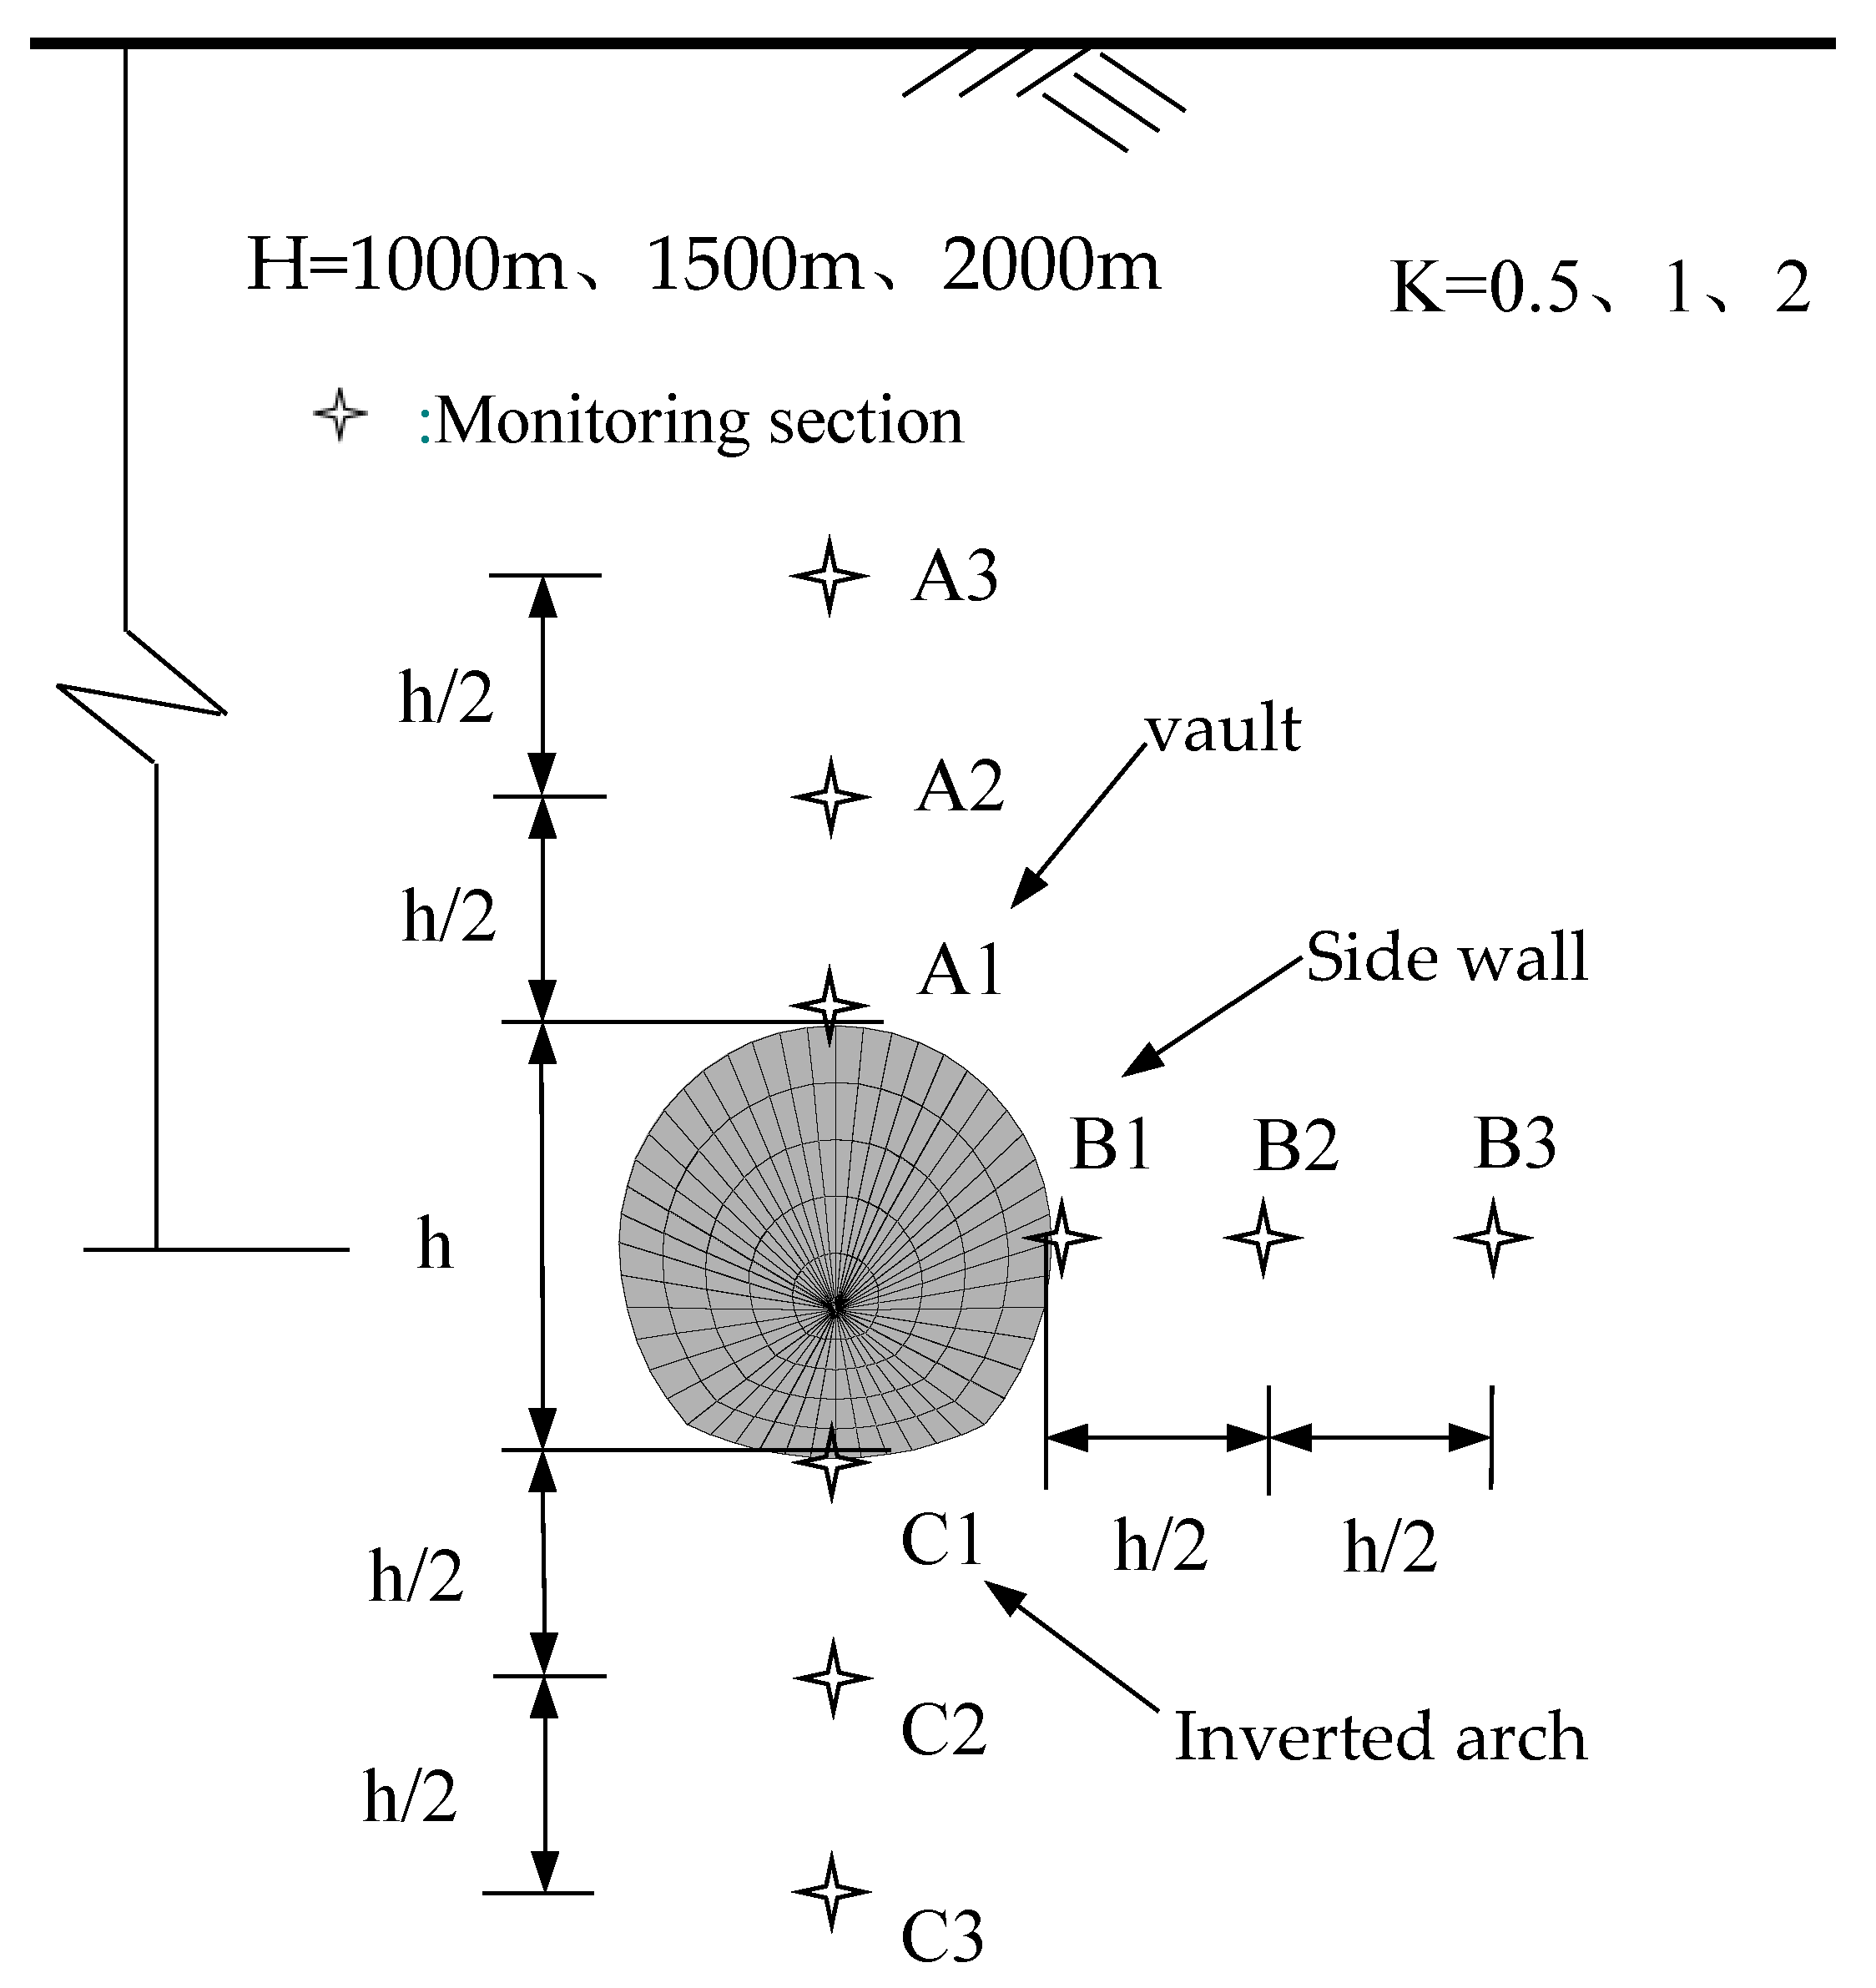
4.1. Influence of Buried Depth and Lateral Pressure Coefficient on Tunnel Rheology

In order to consider the influence of burial depth and lateral pressure coefficient on the rheology of the tunnel, the following simulation will be carried out: the tunnel will be excavated at one time, the elastic balance calculation will be carried out, and then the support will be applied (the support is completed instantaneously, without considering the creep deformation during the application of support).
During calculation, three working conditions are selected for buried depth: H = 1000 m, 1500 m, and 2000 m, and three working conditions are selected for lateral pressure coefficient: K = 0.5, 1, and 2. The layout of monitoring points is shown in Figure 13, where A1, A2, and A3 are the monitoring points of the arch crown, B1, B2, and B3 are the monitoring points of a side wall, and C1, C2, and C3 are the monitoring points of the inverted arch. The creep period is set as 0–120 days.

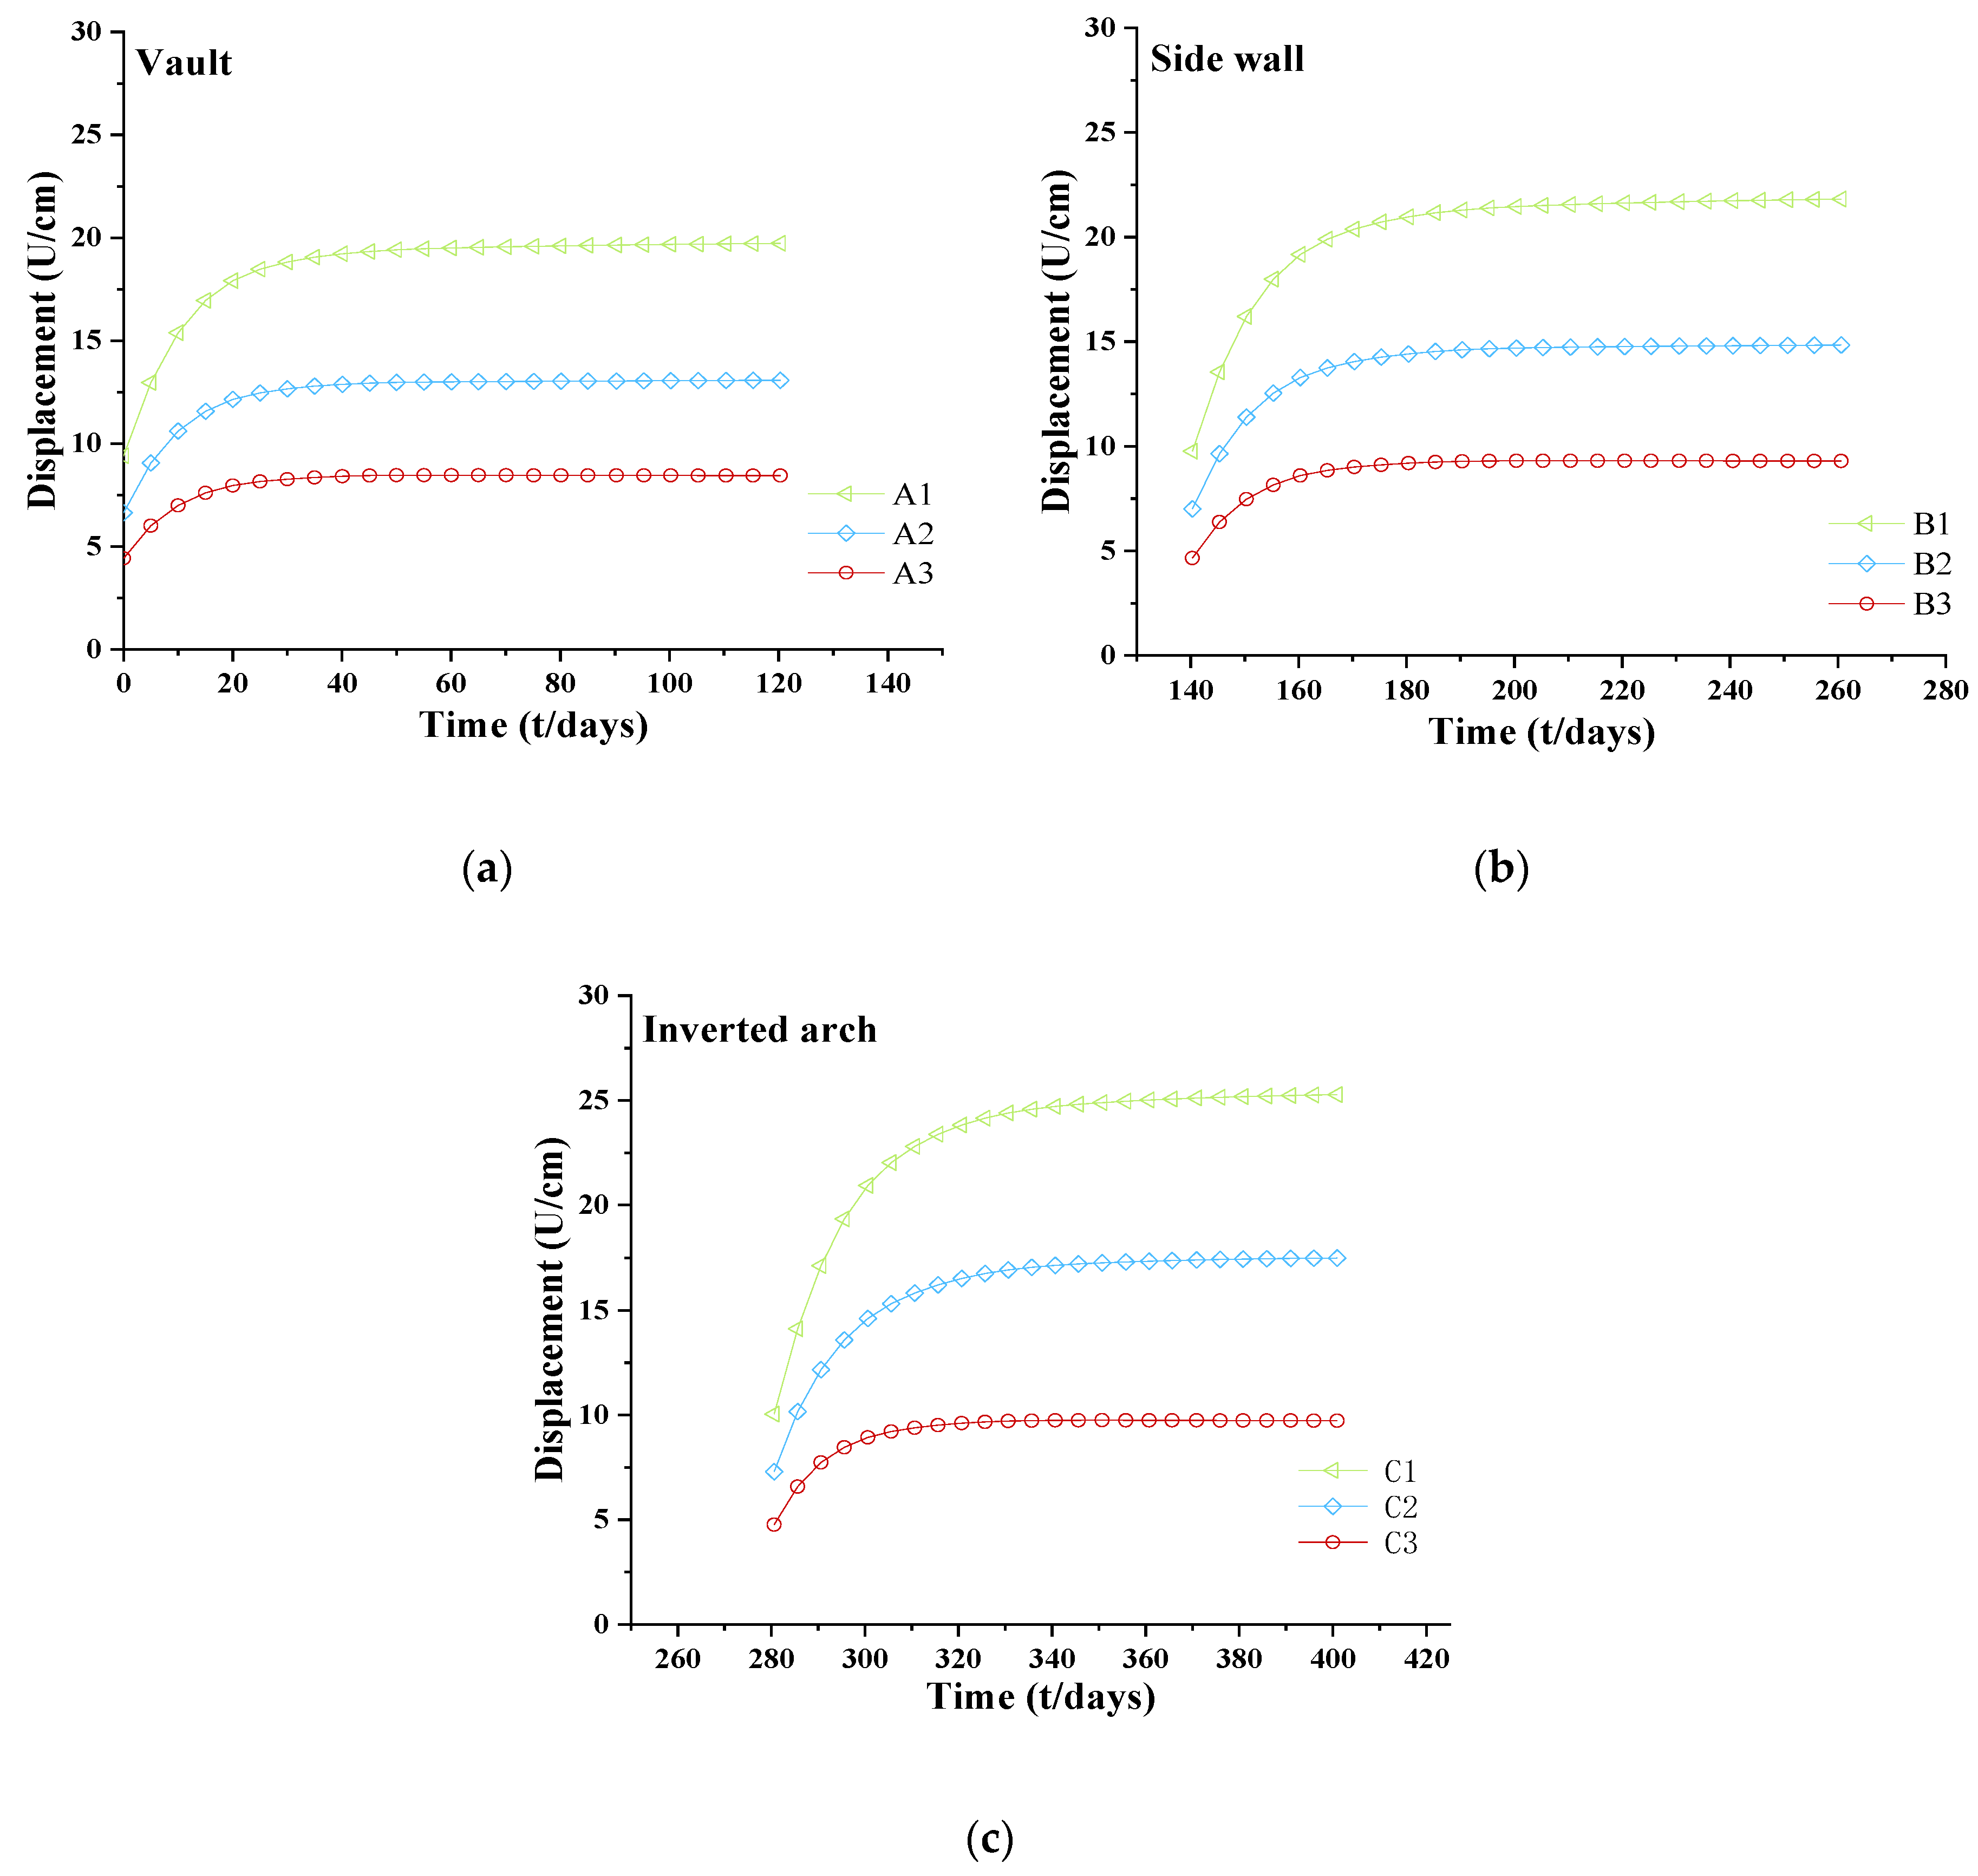
4.1.1. Impact of Different Burial Depth (K = 1)

When the lateral pressure coefficient K = 1 and the burial depth H = 1000 m, 1500 m, and 2000 m, respectively, the creep deformation characteristics around the tunnel are shown in Figure 14.
As shown in Figure 14, when t = 0, instantaneous elastic deformation occurs. As the burial depth increases, the elastic displacement of each monitoring point also increases. When the burial depth is H = 1000 m, the displacement is about 6 cm. When H = 1500 m, the displacement is about 9 cm. Finally, when H = 2000 m, the displacement is about 12 cm. That is, the increase in elastic displacement is proportional to the increase in burial depth. Creep deformation occurs after the instantaneous elastic deformation. It can be seen from the figure that the greater the burial depth is, the longer the time it takes for the tunnel creep deformation to become stable. Although the elastic displacement around the tunnel at a certain burial depth is the same, there are obvious differences in the creep deformation (mainly reflected in the first stage of creep, also known as the deceleration creep stage). The arch crown, side wall, and inverted arch all have large creep deformation displacement, of which the inverted arch displacement increases the most, followed by the side wall, and the arch crown displacement increases the least. This phenomenon is mainly caused by the initial geostress and influence of the tunnel section size and shape. It can be seen that the creep displacement around the tunnel increases with the increase in burial depth, and the increase of displacement around the tunnel is proportional to the increase in burial depth.

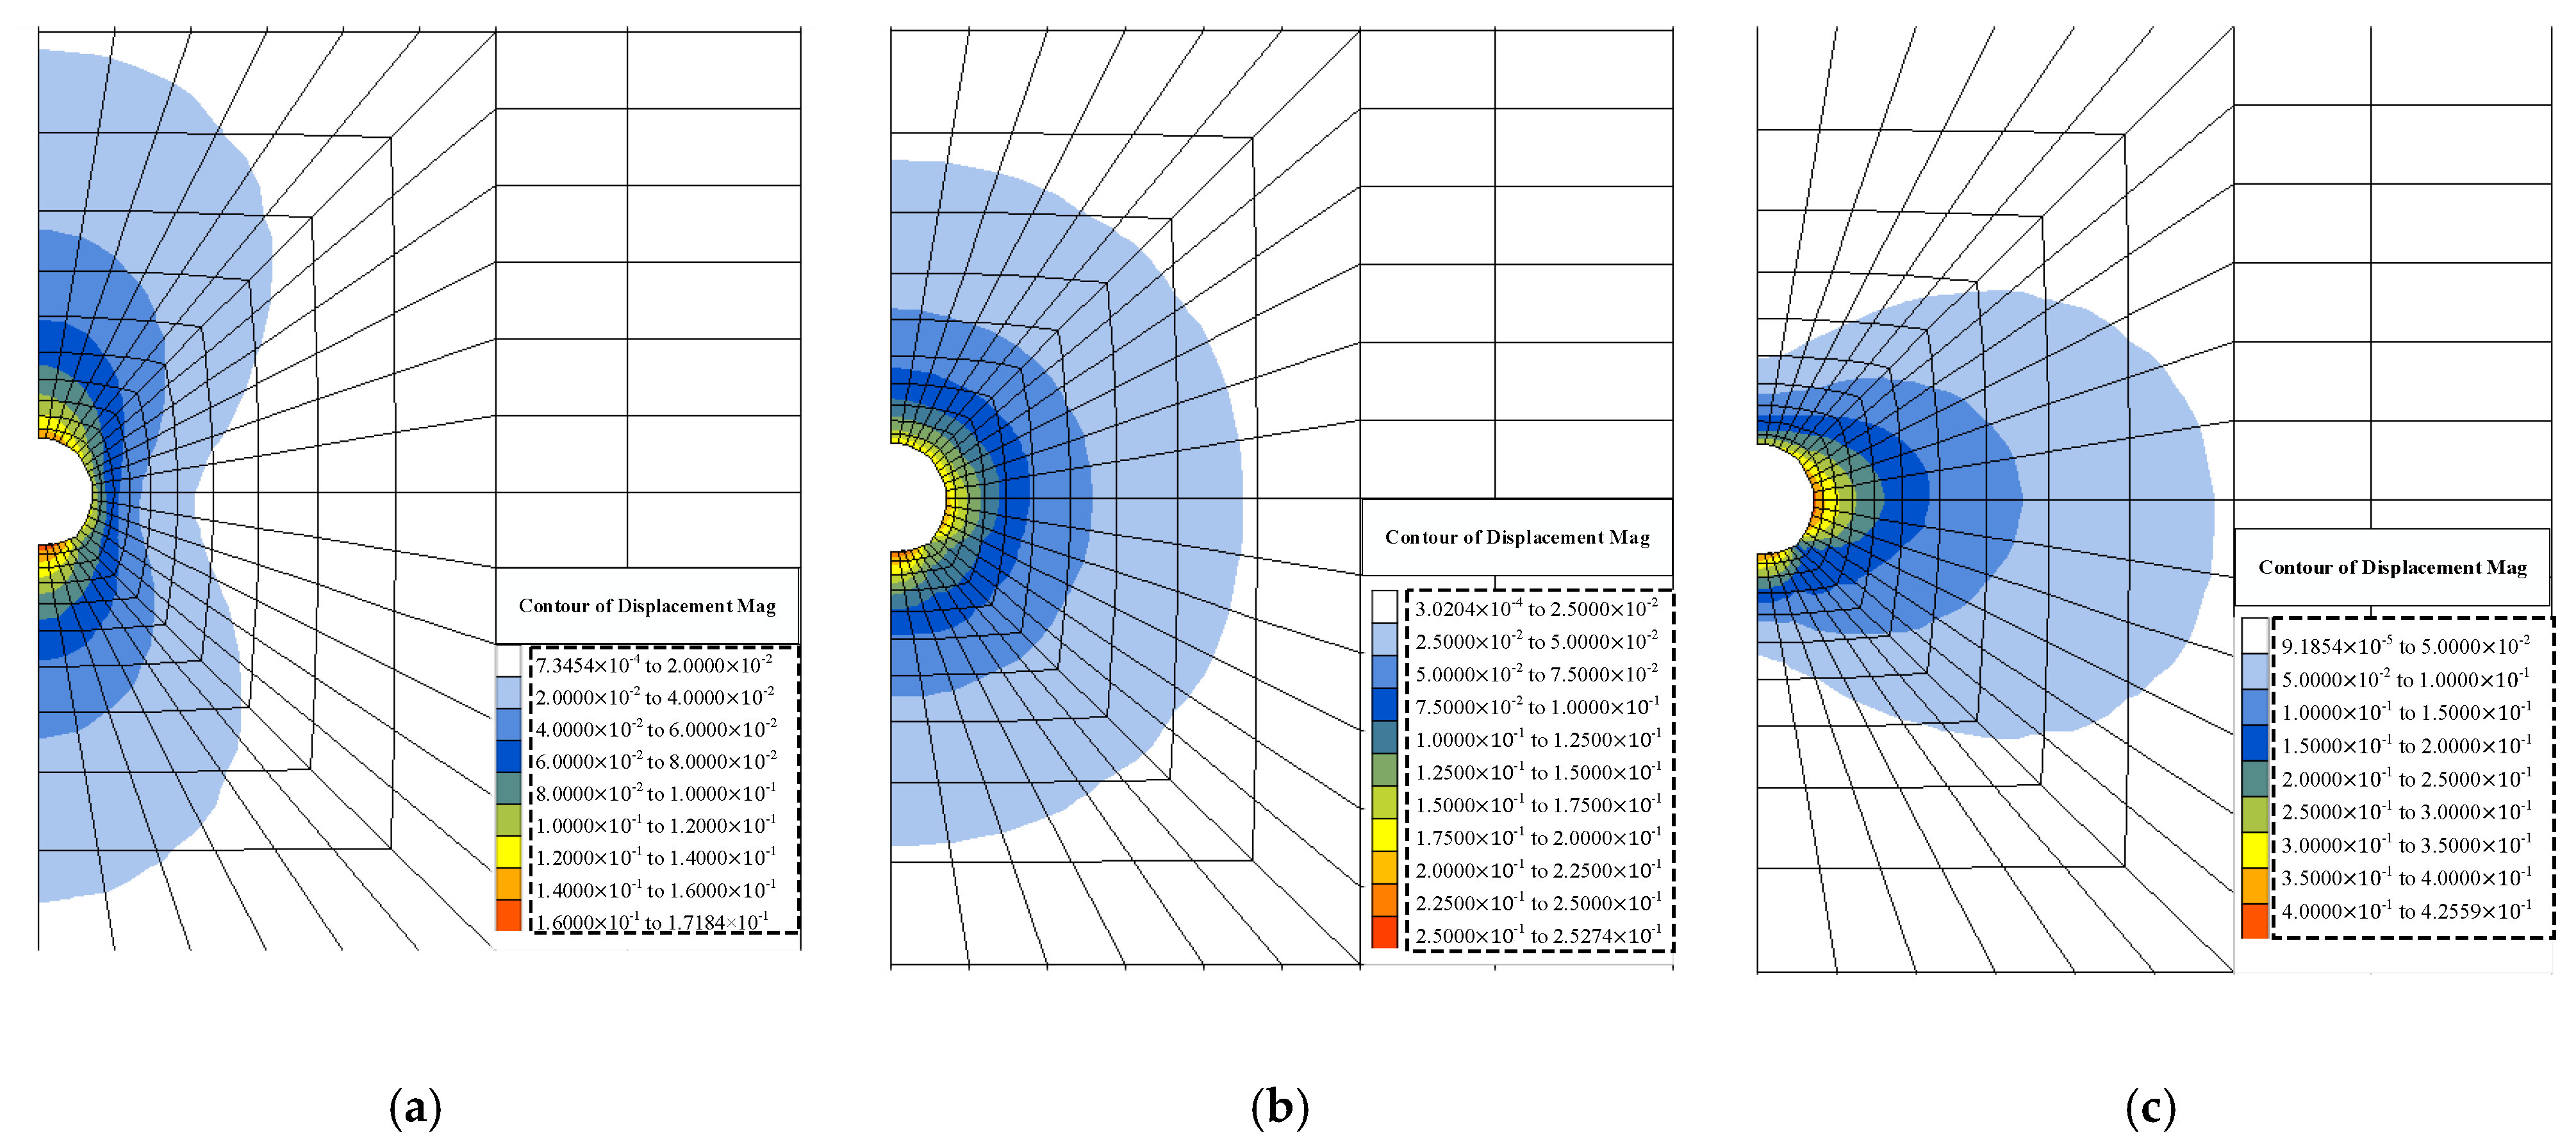
4.1.2. Effect of Different Side Pressure Coefficients (H = 1500 m)

When the burial depth is H = 1500 m, and the lateral pressure coefficient is K = 0.5, 1, and 2, respectively, the creep deformation characteristics around the tunnel are shown in Figure 15 and Figure 16.
It can be seen from Figure 15 and Figure 16 that when the value of the lateral pressure coefficient is different, the elastic displacement of monitoring points around the tunnel is different. That is, the greater the horizontal ground stress, the greater the tunnel side wall’s elastic displacement.
Creep deformation occurs after the instantaneous elastic deformation. According to the diagram analysis, the greater the horizontal geostress is, the stronger the creep deformation is. The inverted arch is the location of the maximum creep deformation.

4.1.3. Deformation Characteristics of Surrounding Rock in Radial Direction of Tunnel (H = 1500 m, K = 1)

When the burial depth is H = 1500 m and the lateral pressure coefficient is K = 1, the displacement change in the radial direction of the tunnel is shown in Figure 17, and the layout of monitoring points is shown in Figure 13.

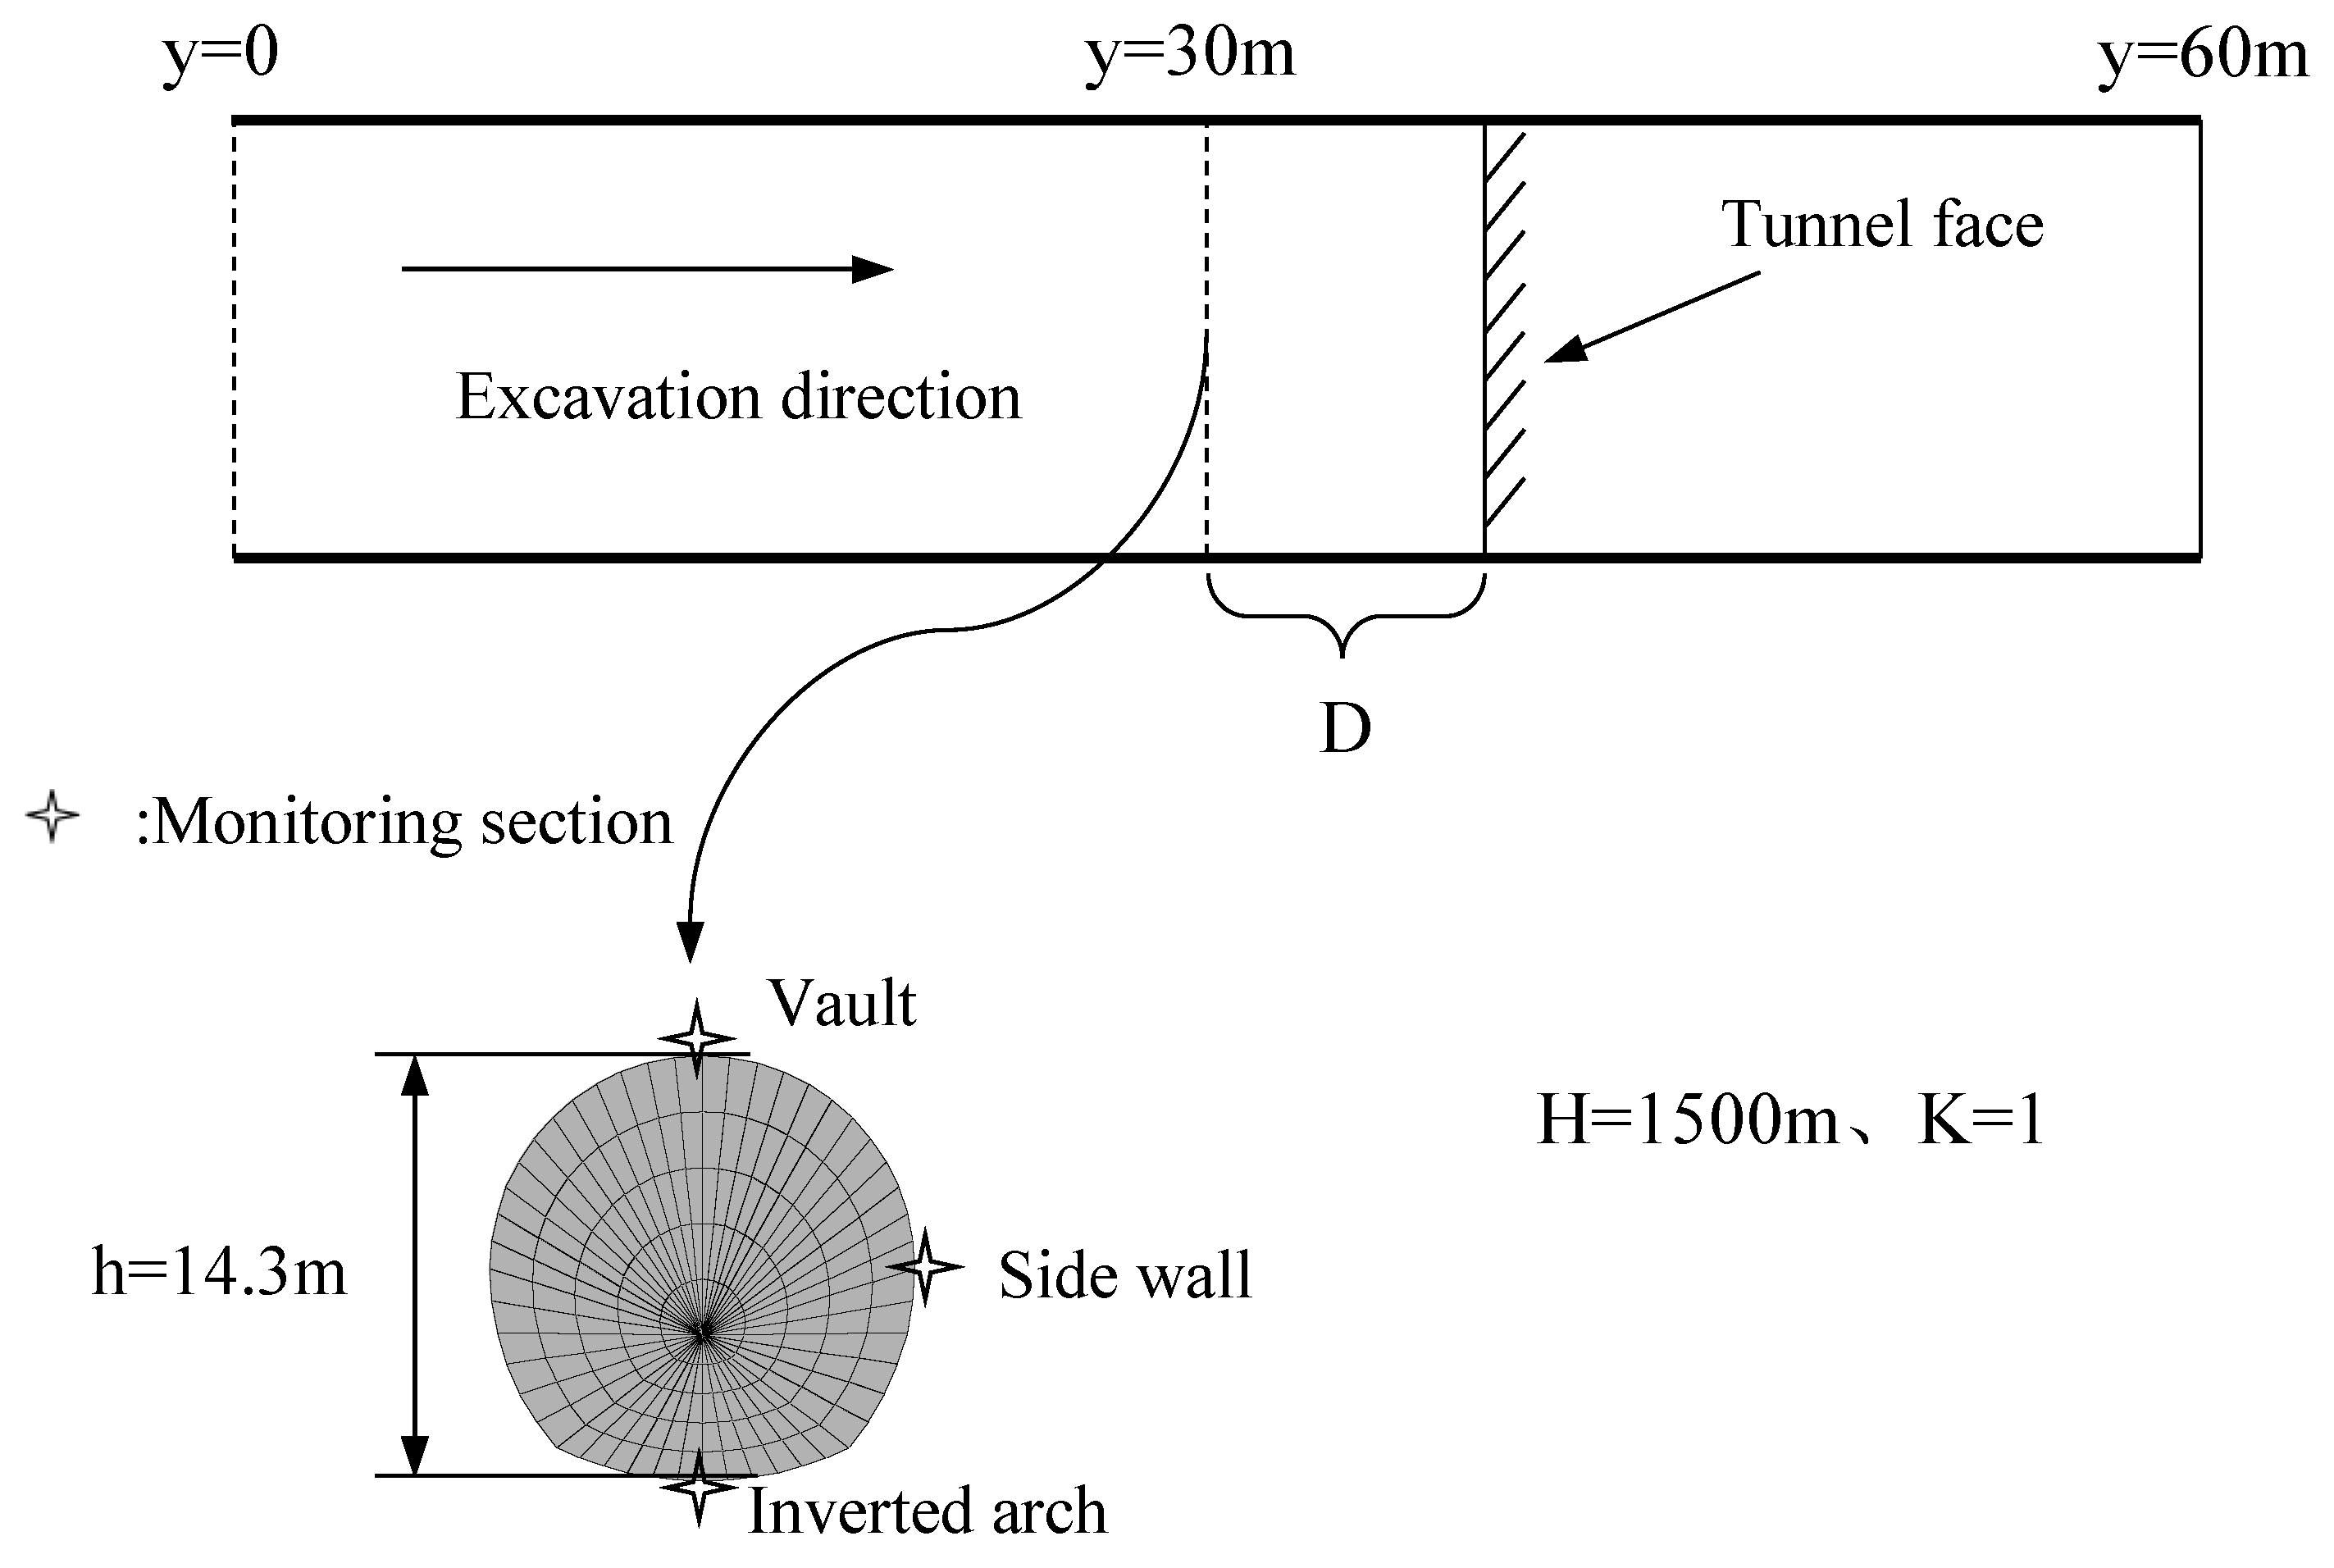
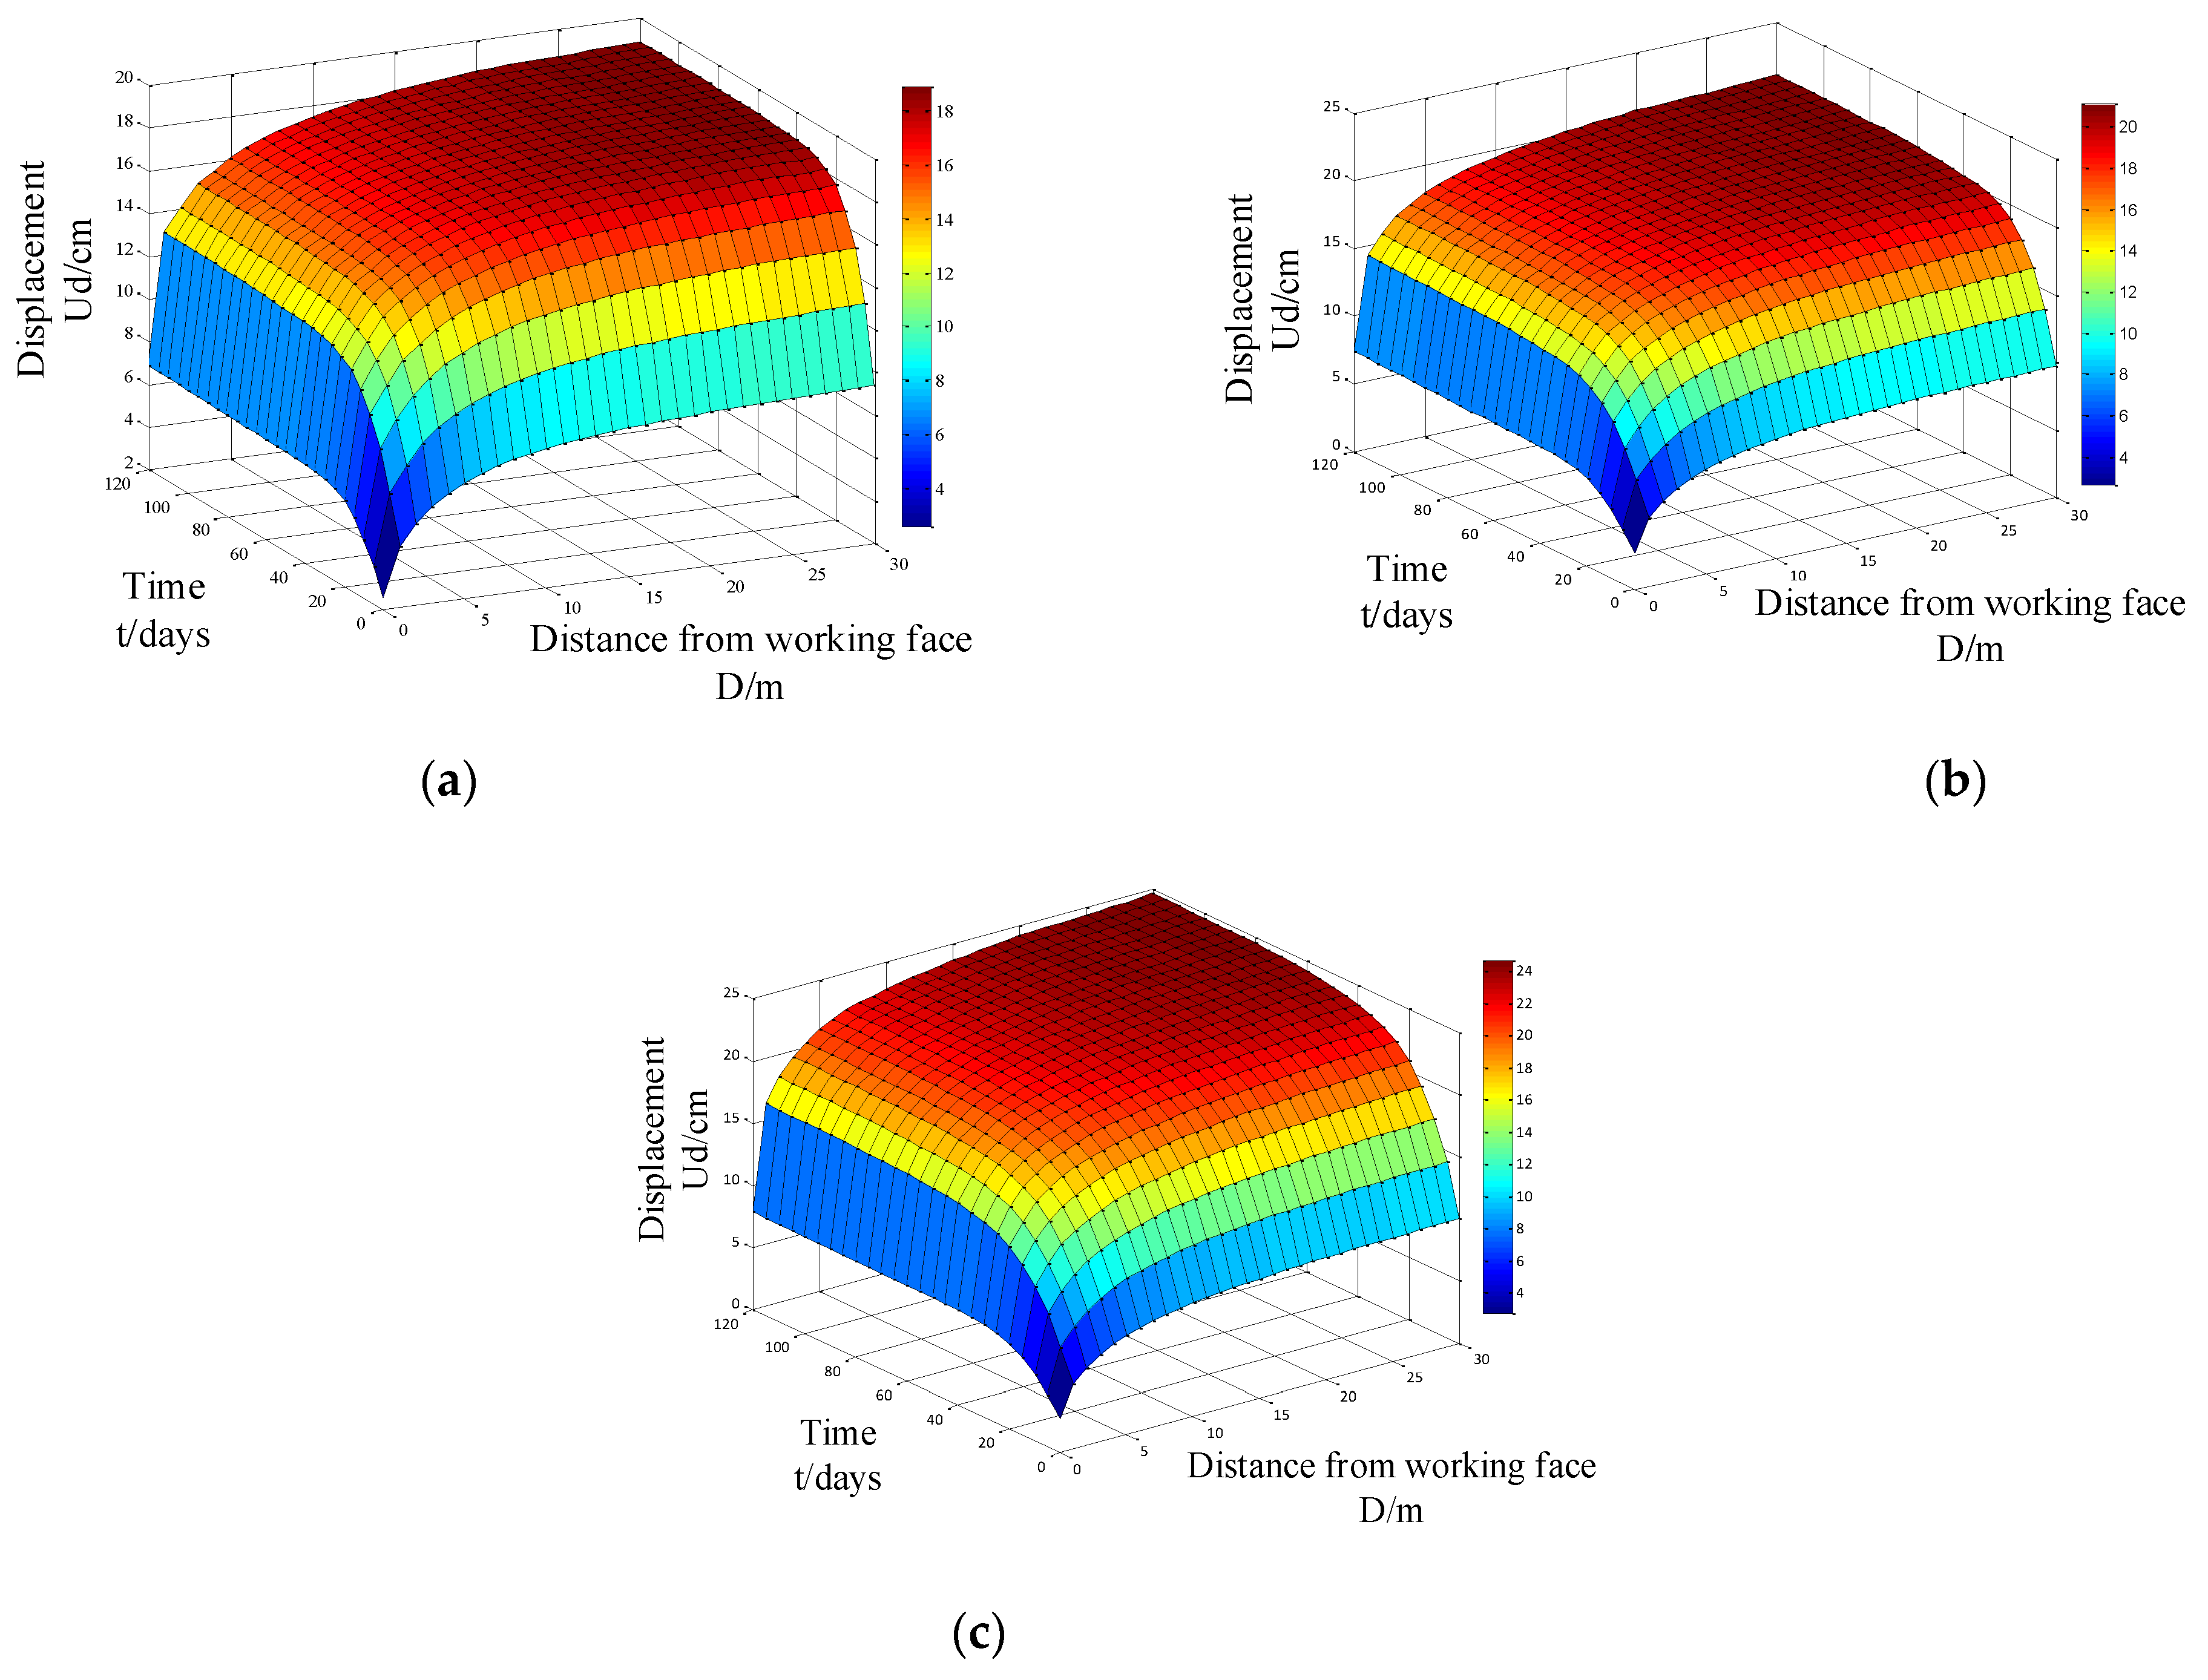
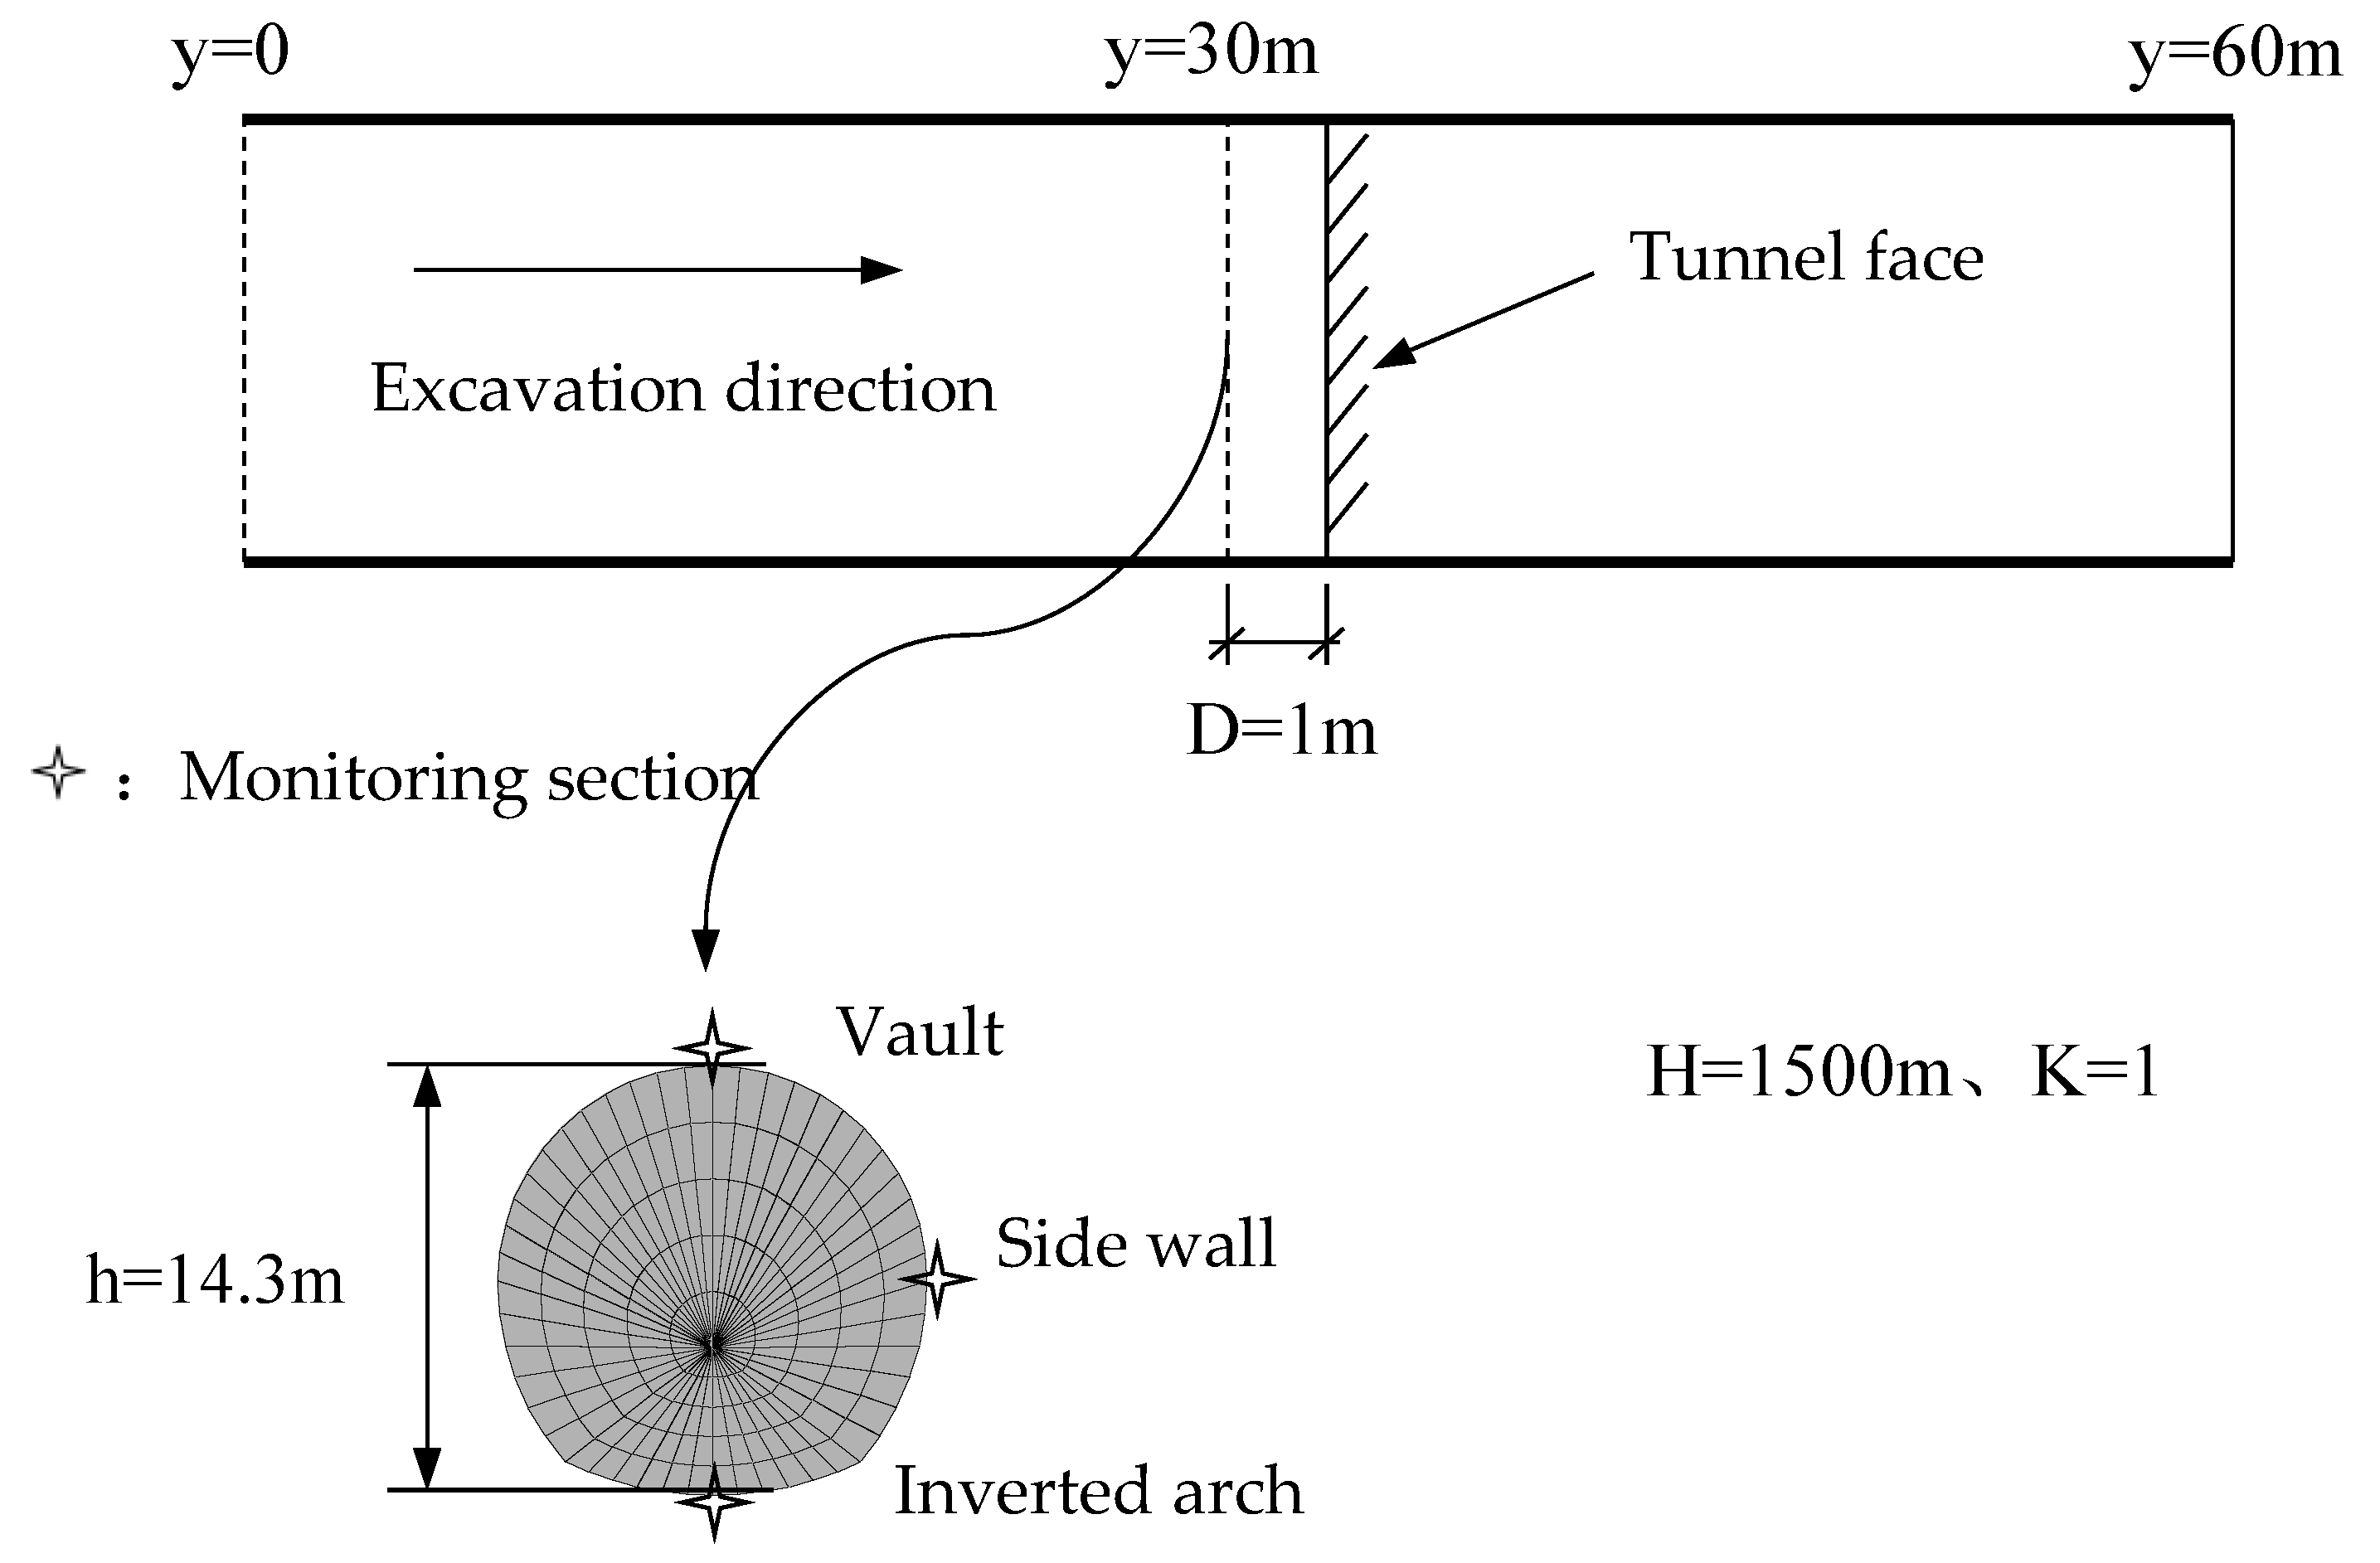
4.2. Influence of the Face on Rheology

In order to consider the influence of the face on the rheology, the simulation process is as follows: The tunnel is excavated once, the elastic balance is calculated, and then the support is applied (the support is completed instantaneously, without considering the creep deformation during the application of support). During the calculation, the buried depth is taken as H = 1500 m, and the lateral pressure coefficient is taken as K = 1. The layout of monitoring sections and monitoring points are shown in Figure 18.The creep period is set as 0−120 days.
As shown in Figure 19, it can be seen that the displacement change trend of each monitoring point is basically the same. The farther away from the tunnel face, the greater the instantaneous elastic deformation release. At the same time, large creep displacement also occurs in the later stage; when it is close to the tunnel face, due to the influence of the tunnel face support (similar to the virtual support), the elastic displacement of the monitoring point is small, the creep deformation in the later stage is relatively gentle, and the displacement is small when the creep is stable. When t = 40–50 days, the creep deformation reaches a stable state.

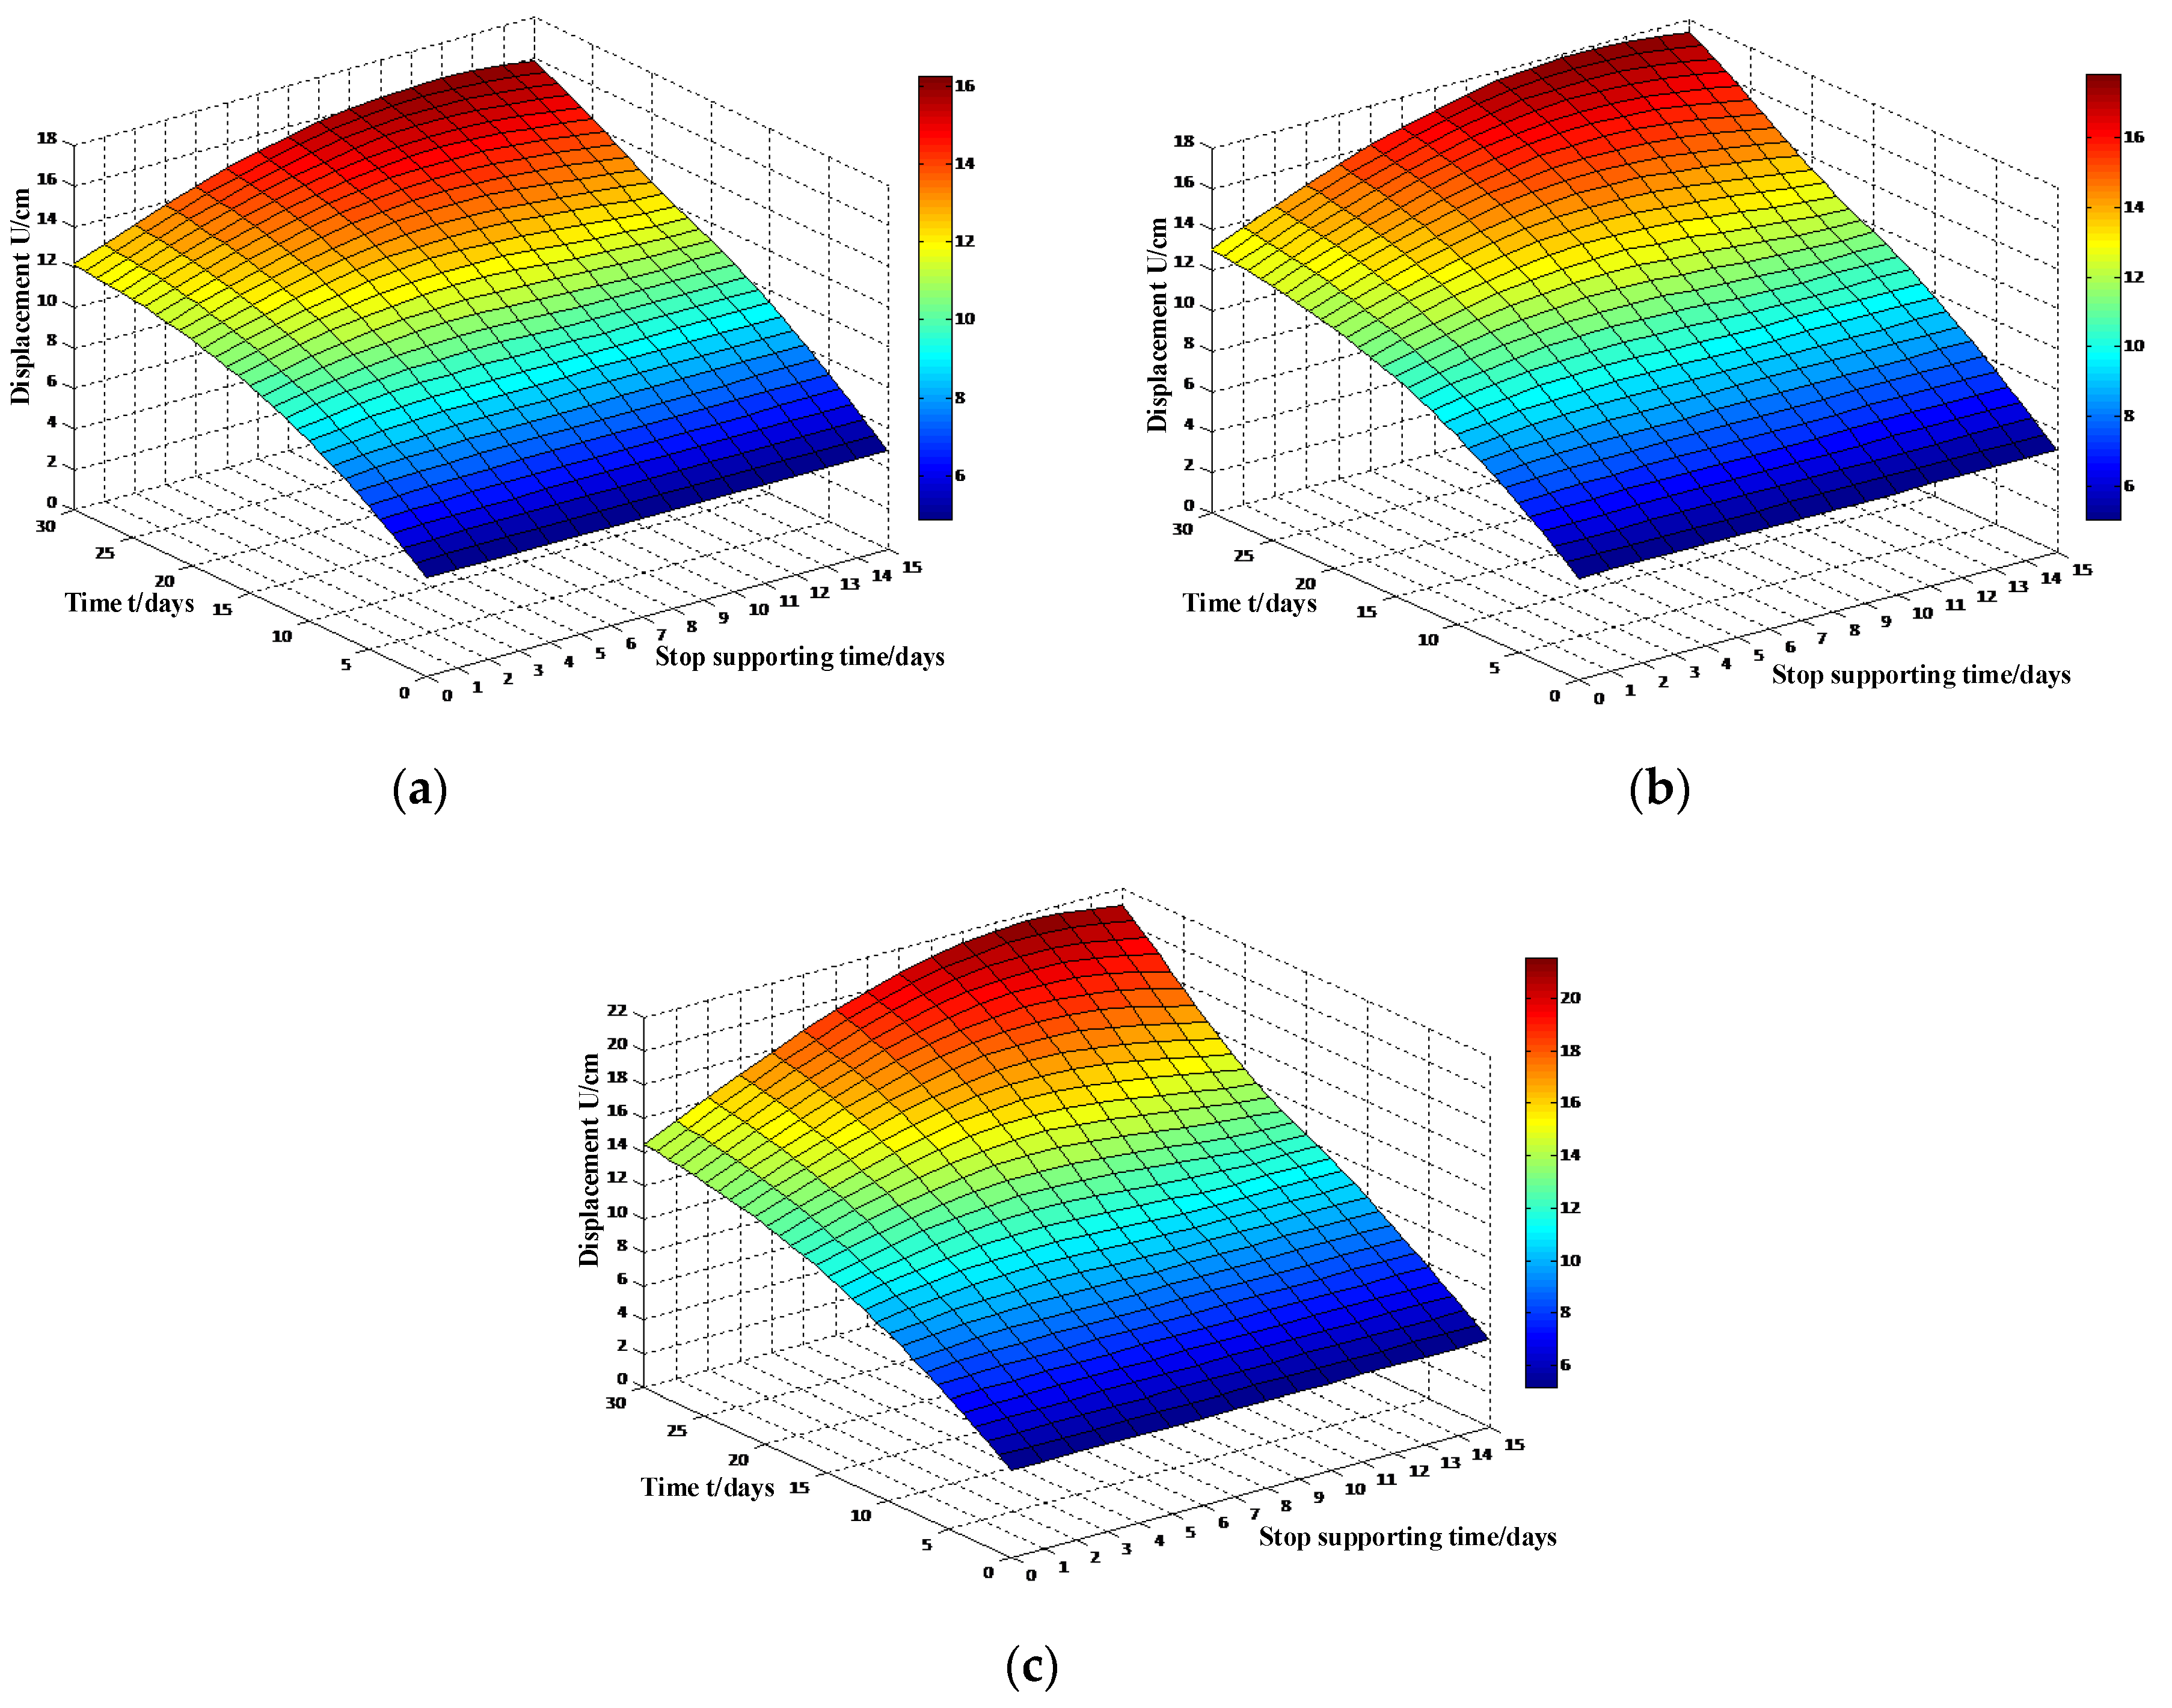
4.3. Effect of Support Stop Time on Rheology

In order to consider the influence of the stop support time on the rheology, the simulation process is as follows: The tunnel is excavated and supported to y = 30 m, the next cycle of excavation is carried out, the footage is 1 m, the support is stopped after the excavation, and creep deformation occurs during the stop, then the support is carried out (completed instantaneously, without considering the creep deformation during the application of support), and then the creep deformation after the support is calculated. The total creep time is set as 0–30 days (including the number of days to stop and the time of creep deformation after support). During the calculation, the buried depth is taken as H = 1500 m, and the lateral pressure coefficient is taken as K = 1. The layout of monitoring sections and monitoring points is shown in Figure 20.
It can be seen from Figure 21 that since the total creep time is set as 0~30 days, the longer the stop (support) days, the shorter the creep time after support. If the excavation is stopped for 2 days, the creep time after support is 28 days. It can be seen from the figure that the displacement change trend of each monitoring point around the tunnel is consistent, in which the displacement increase of the inverted arch is the largest and that of the arch crown is the smallest.
From the time displacement curve in the figure, it can be seen that the earlier the tunnel is supported after the excavation is stopped, the smaller, the later creep deformation is; the longer the support is stopped, although the calculated creep time after setting the support is relatively short, the greater the creep deformation is generated in the later period. At the same time, it can be seen from the figure that the number of days of stopping (support) has little effect on the creep deformation within the range of 0−10 days, that is, the effect of stopping support on the rheology of the tunnel is mainly reflected in the creep deformation after 10 days.

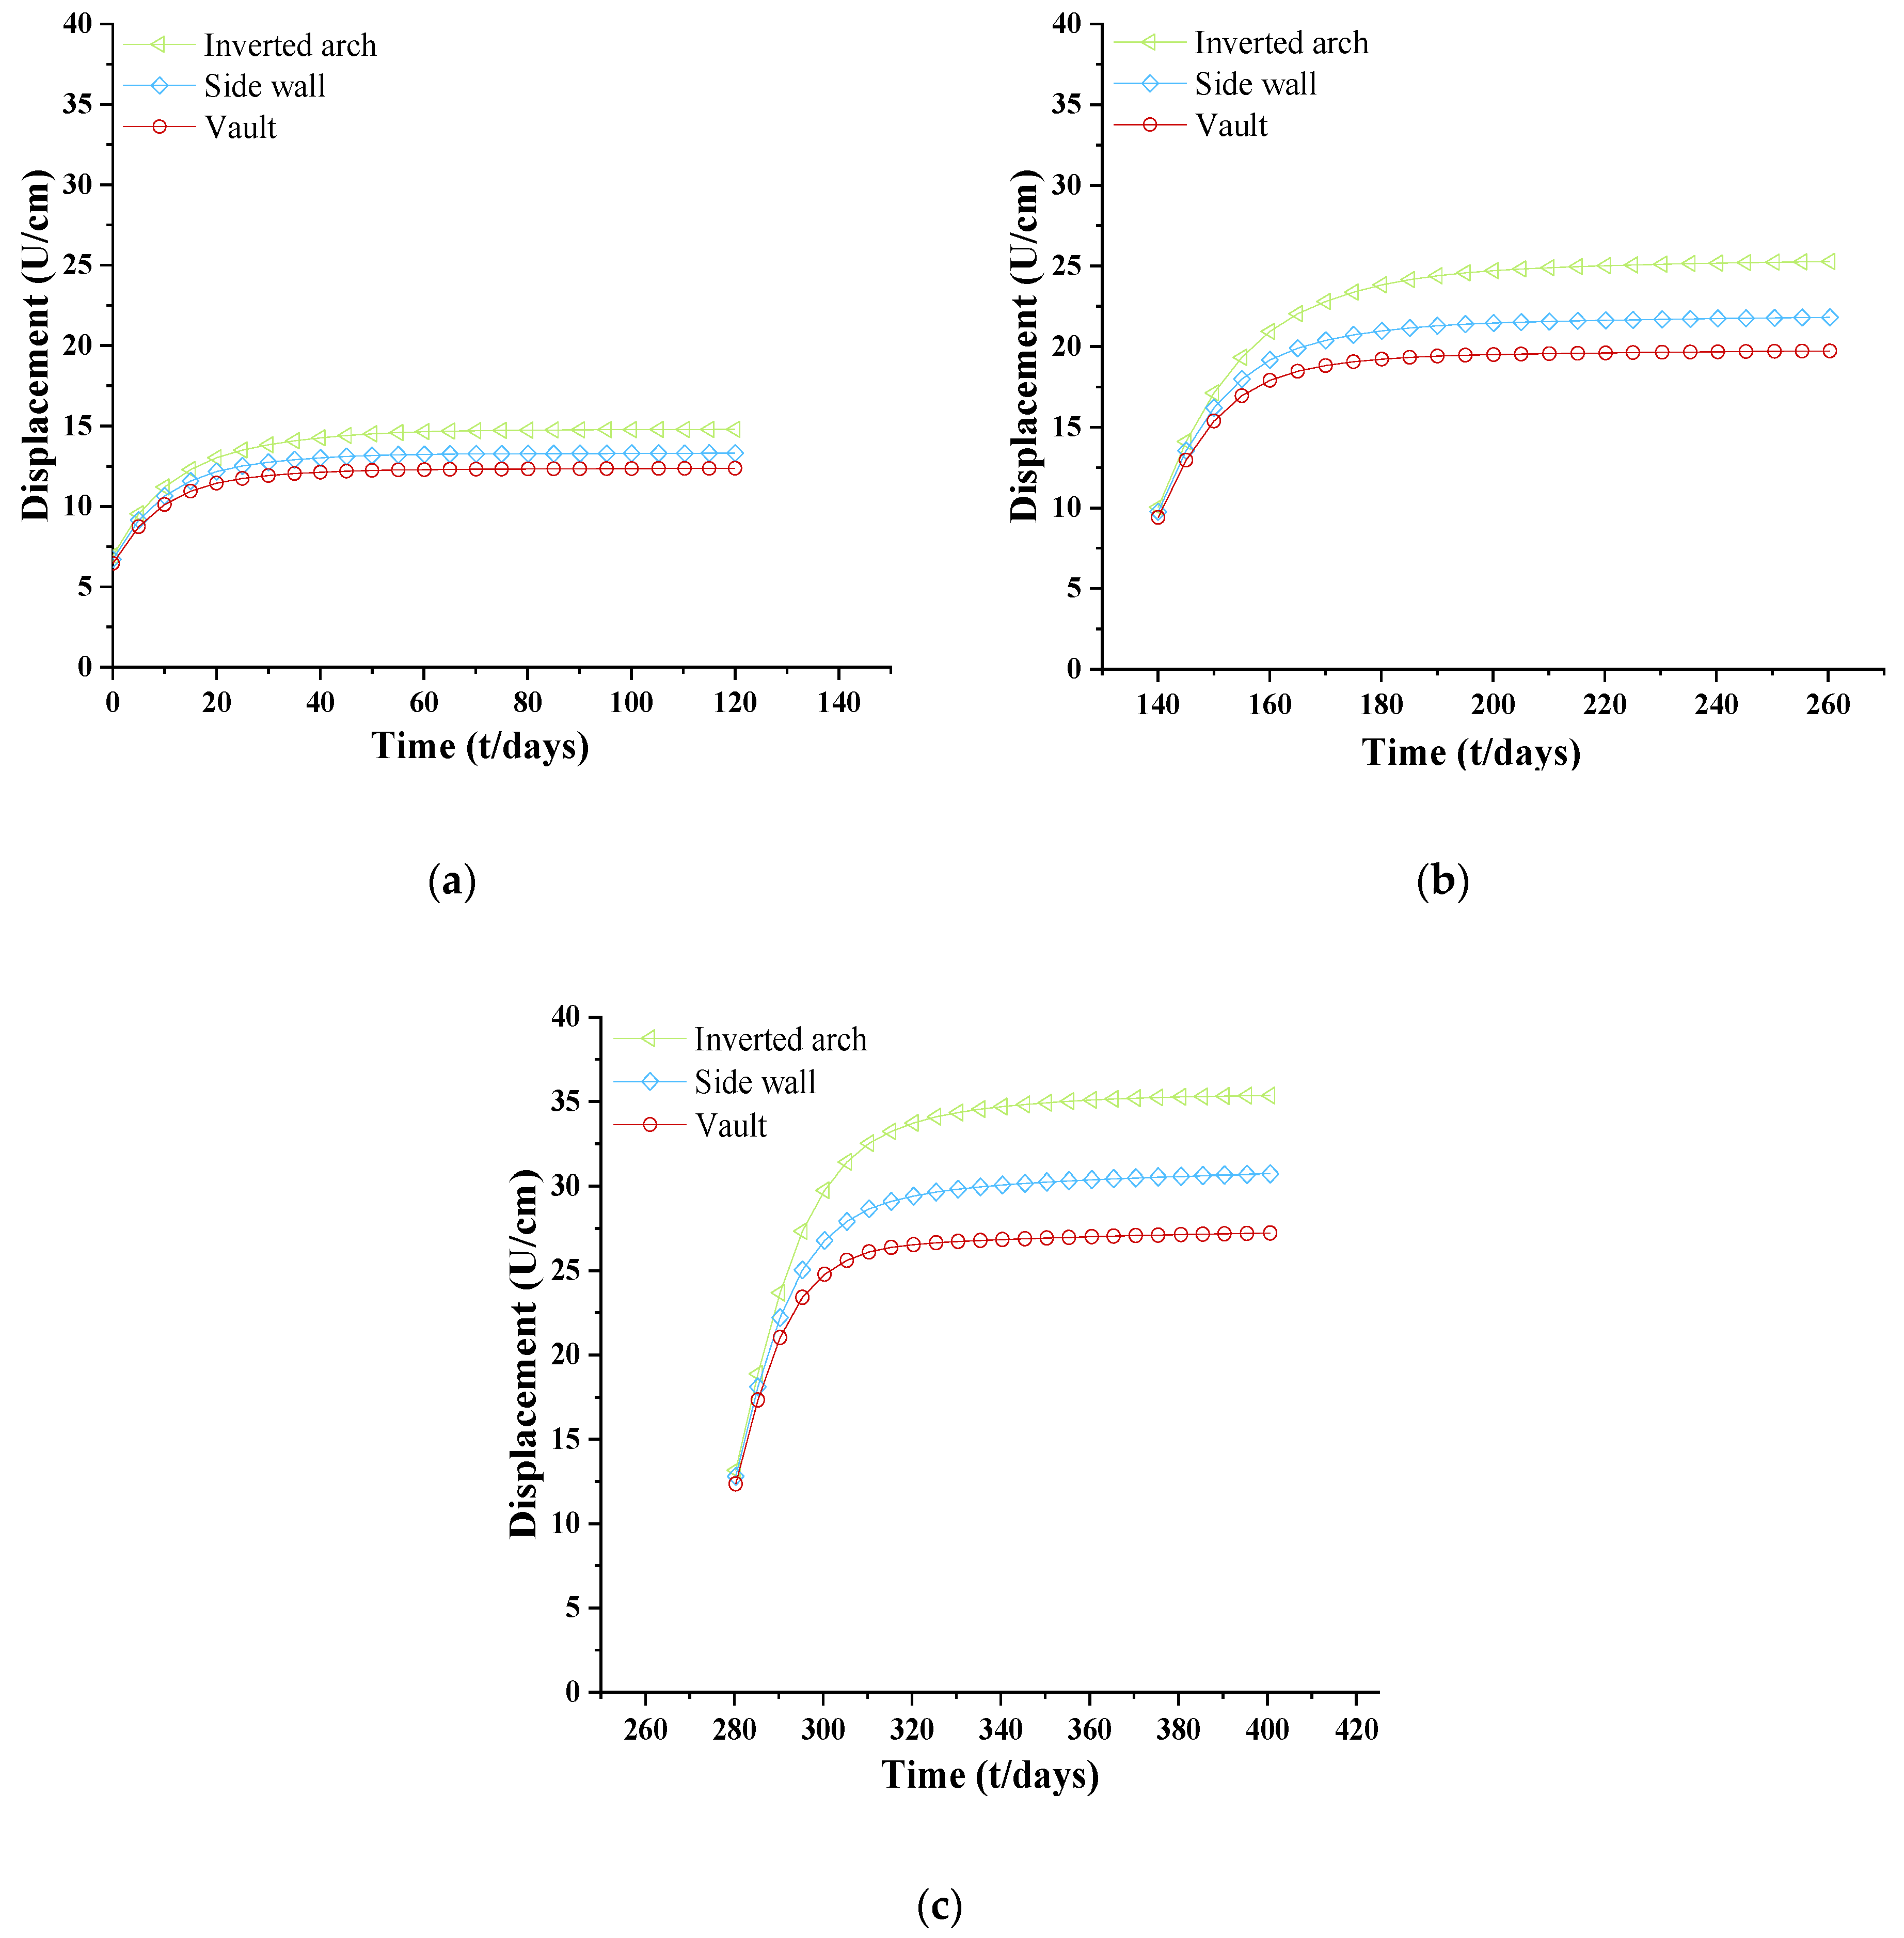
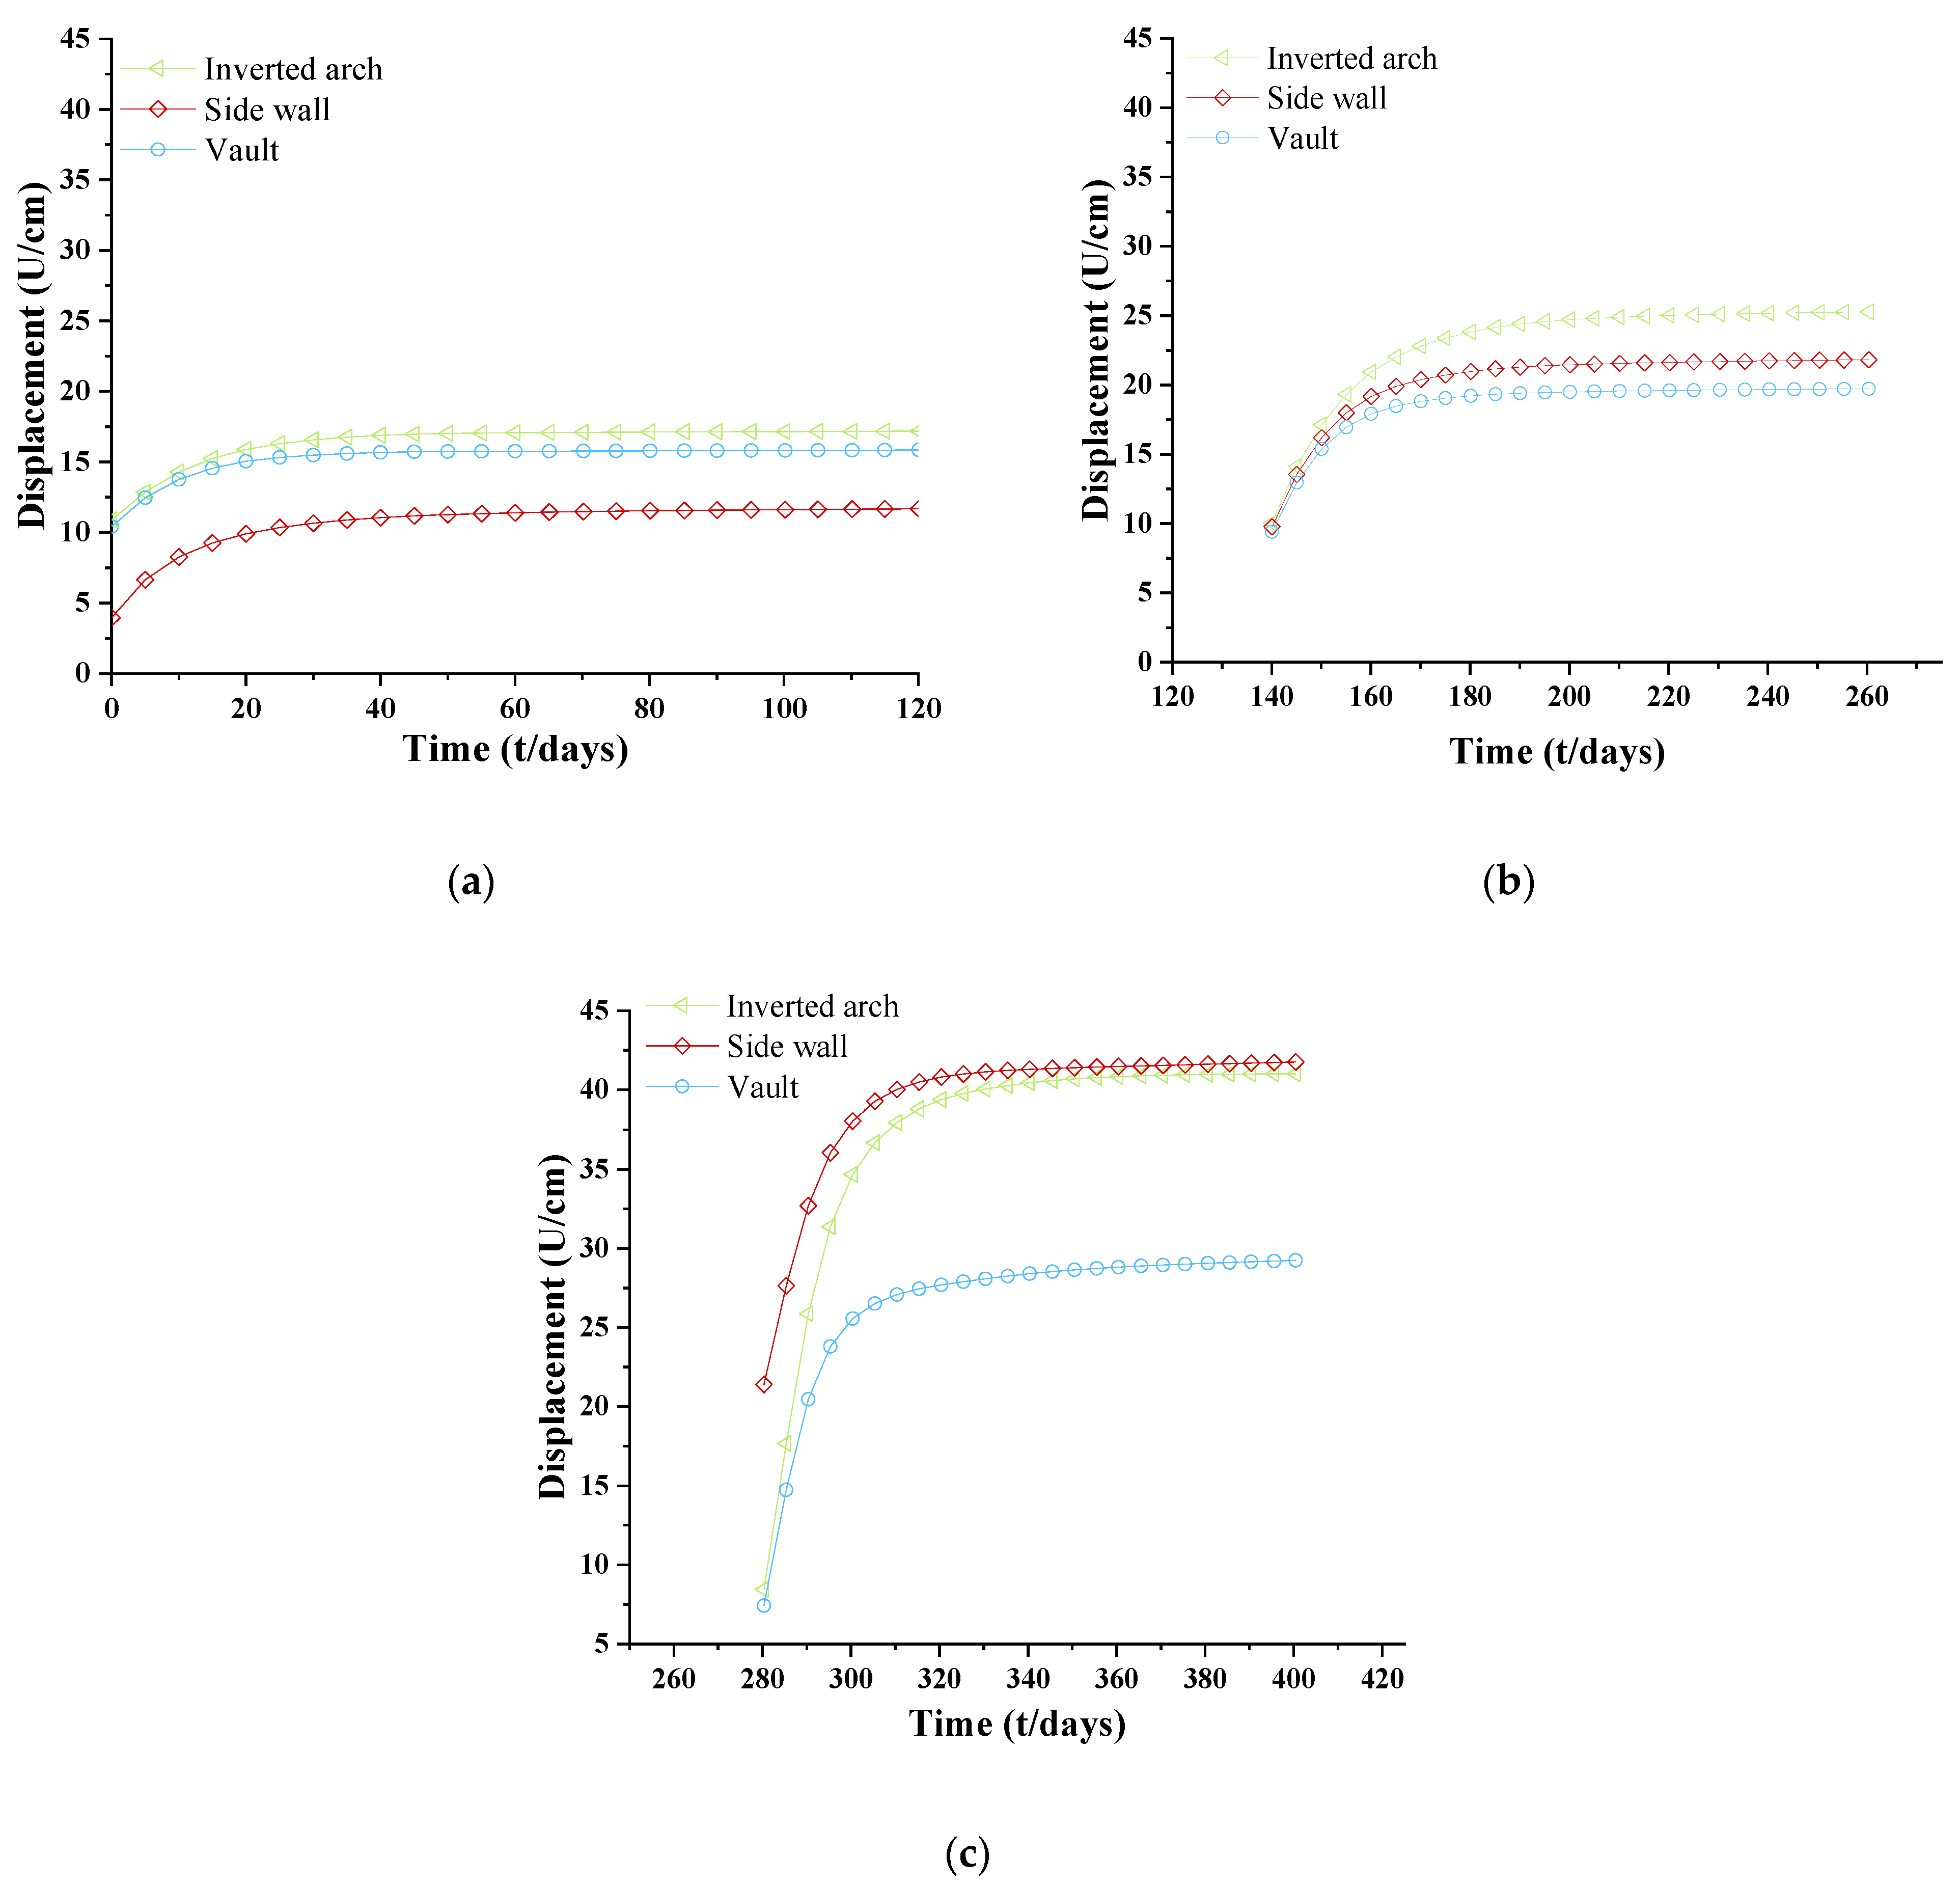
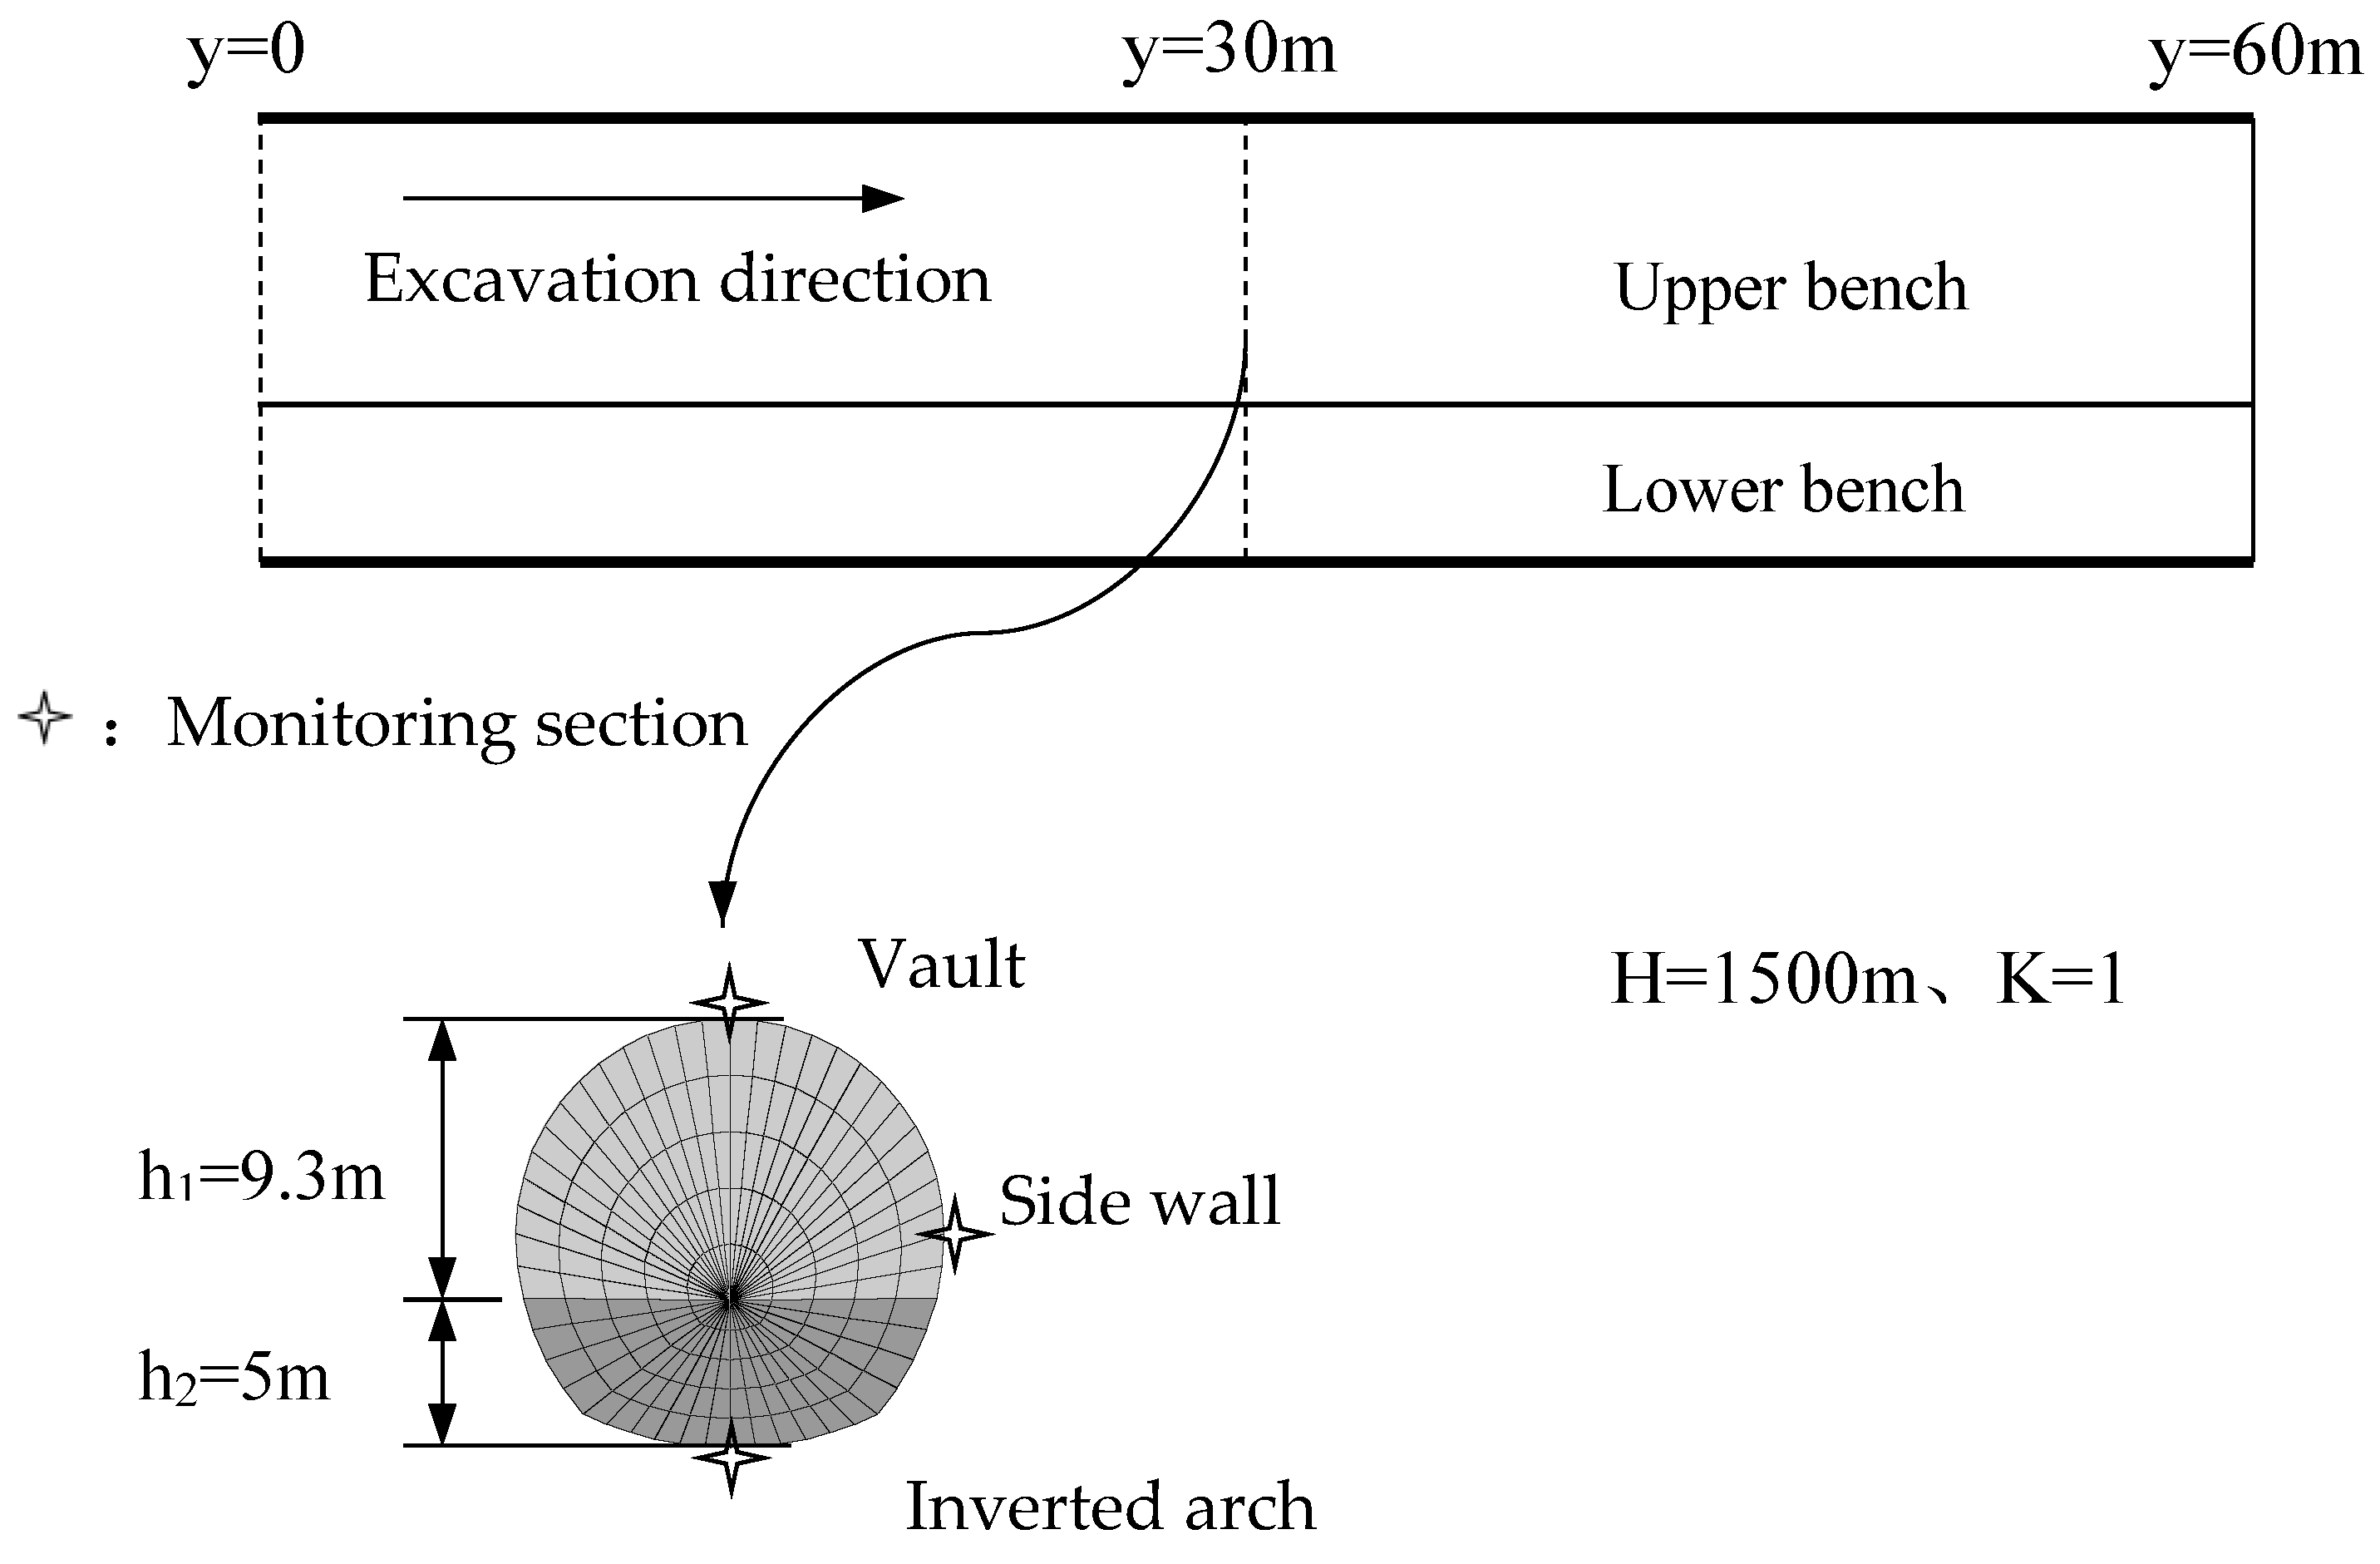
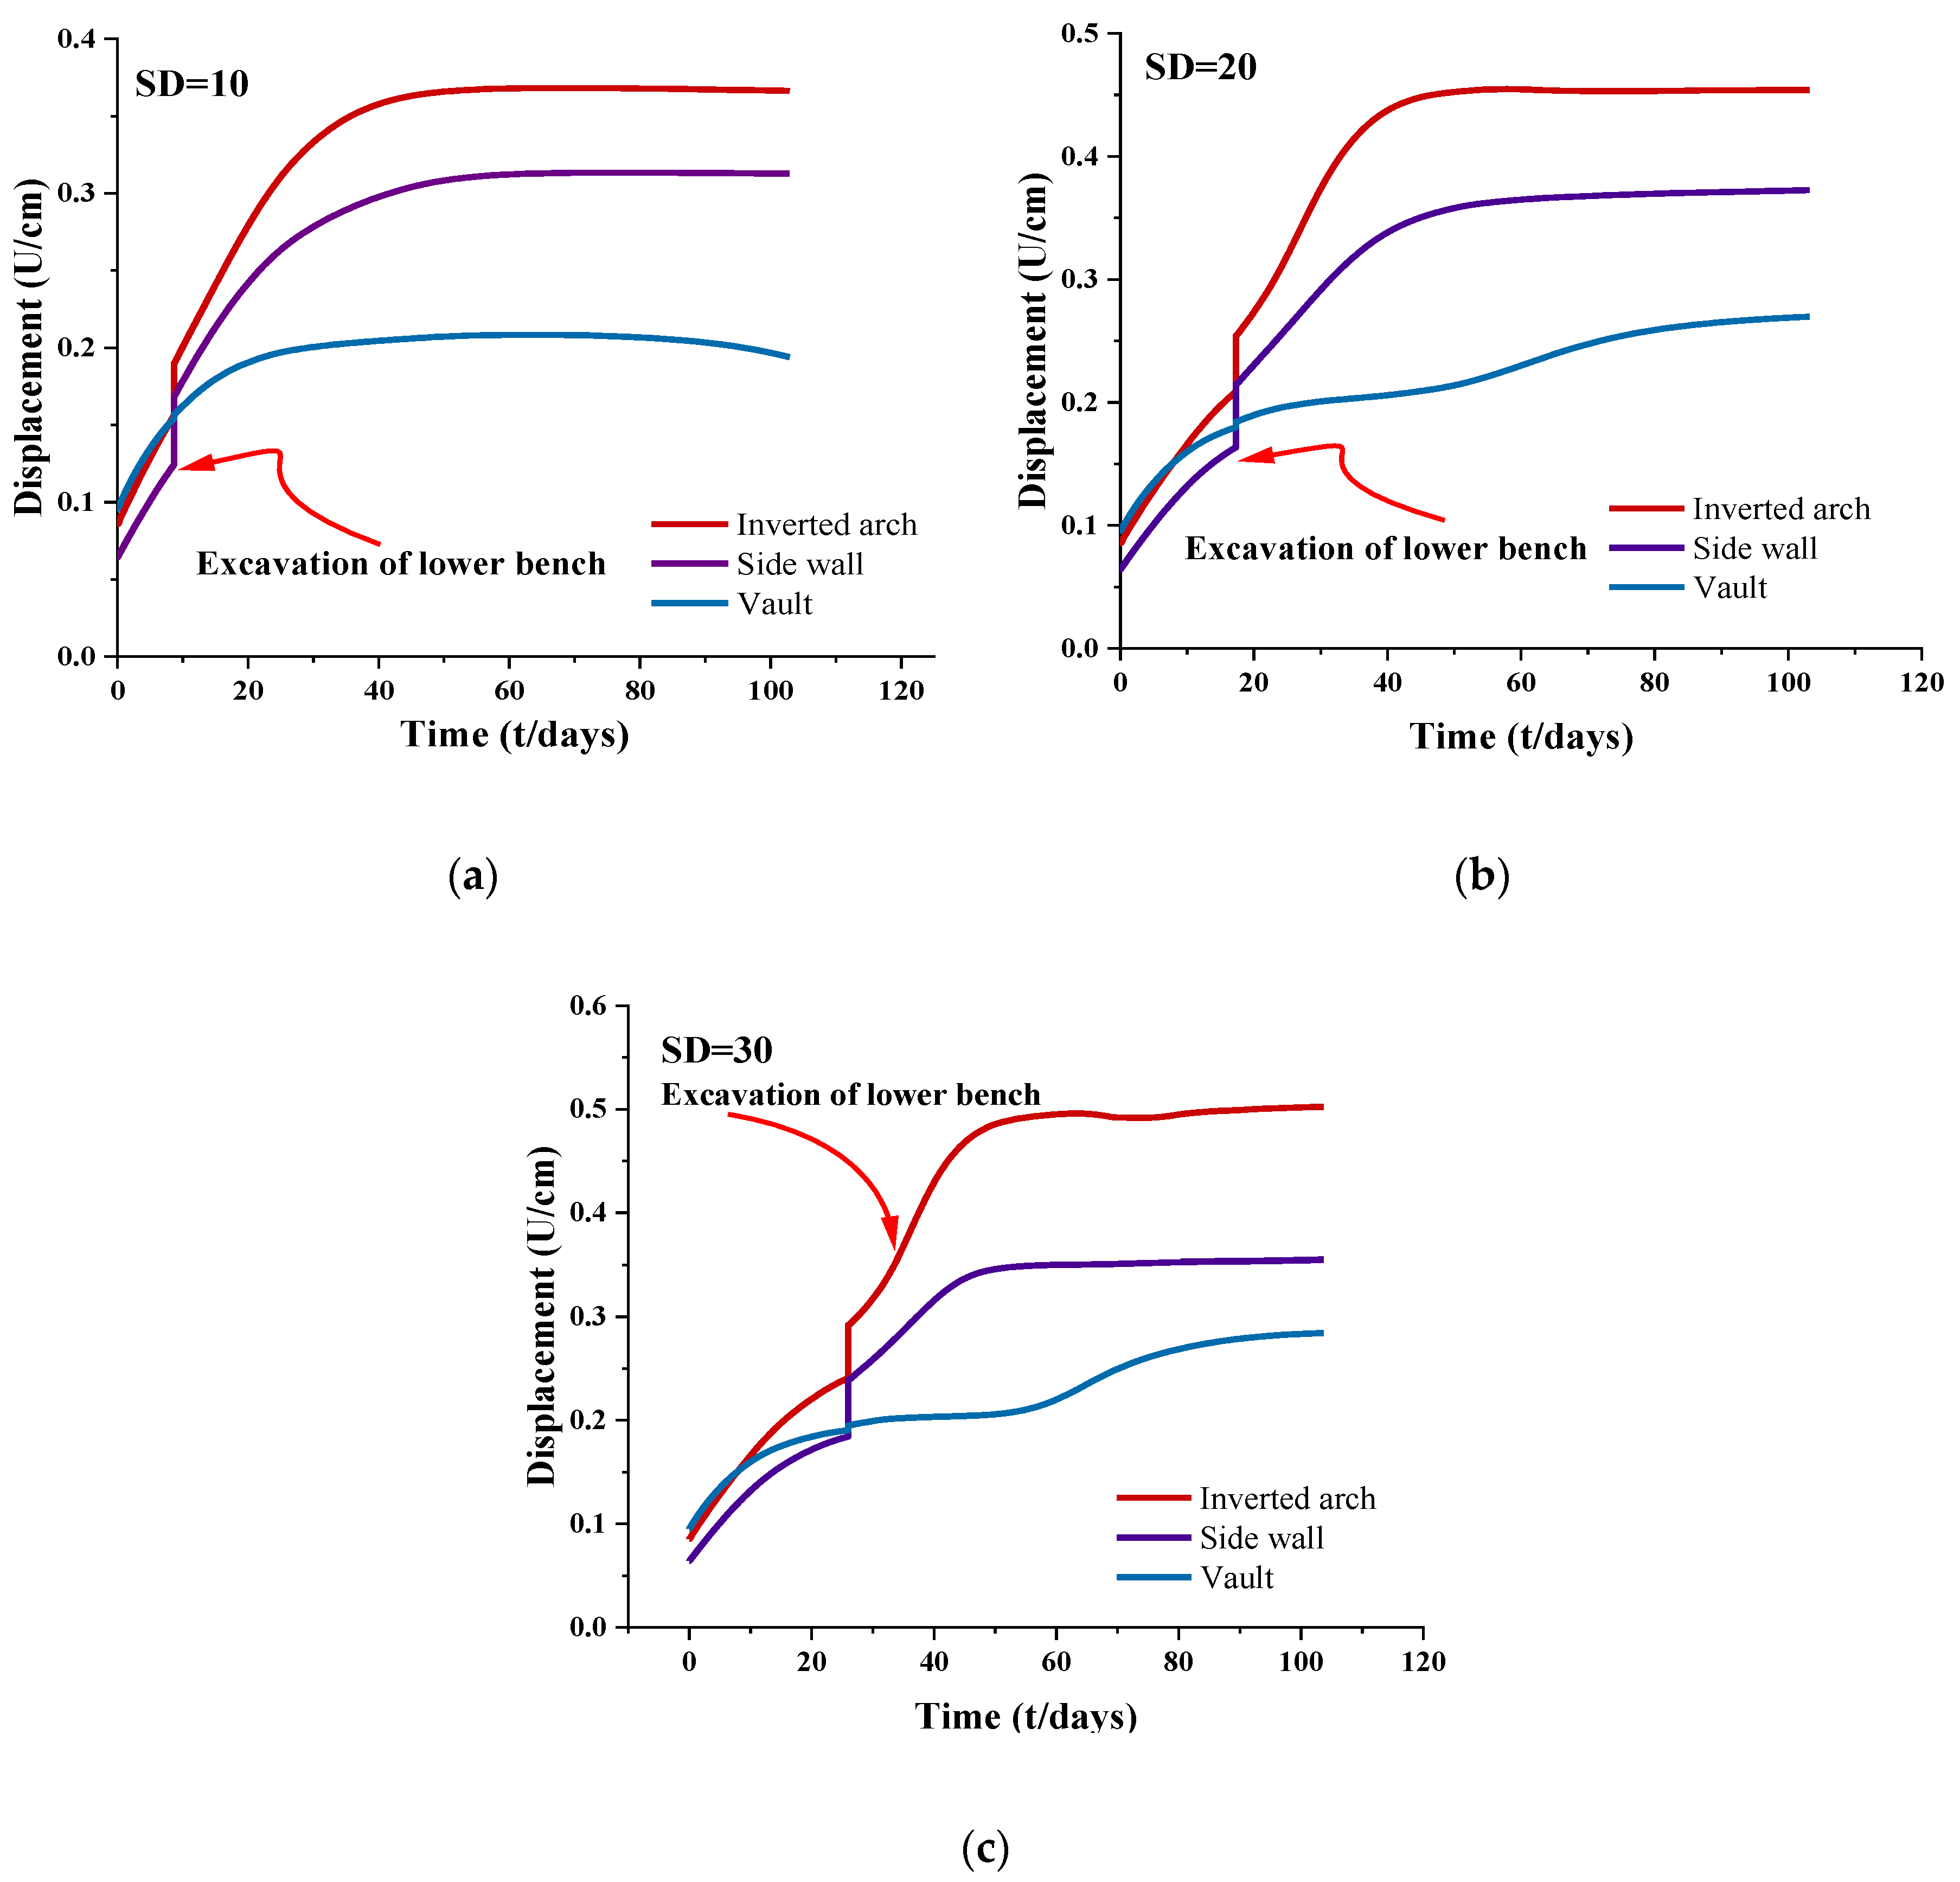
4.4. Impact of Bench Excavation on Rheology

In order to consider the influence of bench excavation on rheology, the simulation process is as follows: excavate the upper bench, calculate the elastic balance, and apply the support (the support is completed instantaneously, without considering the creep deformation in the process of applying the support, and no temporary inverted arch is set) to improve the three-parameter H-K model for creep calculation; then excavate the lower bench, carry out elastic equilibrium calculation, and then apply support to improve the three-parameter H-K model for creep calculation. The total creep time is set as 0–120 days (including the creep time after the upper bench support and the creep time after the lower bench support). During the calculation, the buried depth is taken as H = 1500 m, and the lateral pressure coefficient is taken as K = 1. The layout of monitoring sections and monitoring points is shown in Figure 22.
As shown in Figure 23 and can be seen from the displacement curve of the monitoring point that the longer the time of stagnation after the excavation and support of the upper bench, the more adverse the rheological deformation of the tunnel, especially the inverted arch position, there is a large displacement increase in the later creep process. Before the excavation of the lower bench, the displacement of the invert and the side wall increases at a large rate. When the upper bench stagnates for 30 days after the excavation, the displacement of the invert is significantly greater than that of the arch crown and the side wall. The main reason is that the invert is not supported, the arch crown is not greatly affected, and the displacement growth rate tends to decrease. After the excavation of the lower bench, the instantaneous elastic deformation occurs, and the displacement of the inverted arch and side wall increases sharply. In contrast, the arch crown only produces a small elastic deformation. After the lower bench is supported, the creep deformation around the tunnel increases to a certain extent due to the influence of the stagnation time, and the inverted arch displacement is the largest, which is stable at 50 cm after 30 days of stagnation. At the same time, the stagnation time after the excavation of the upper bench is different. The time from the change of tunnel peripheral displacement to the stable stage is 0−60 days, but the displacement of the arch crown increases after 70 days.

5. Conclusions

The stress deformation of rock mass is a time-dependent process, especially for weak surrounding rock. Its deformation usually has a certain timeliness; even after the surrounding rock is excavated for a period of time, failure and collapse occur. The widely used elastic-plastic theory cannot describe and predict this process, and the rheological theory can better overcome this shortcoming. However, due to the variety of rheological constitutive models, it is not easy to choose, and the parameters are not easy to determine. It is difficult to popularize and apply. In combination with the Jinping headrace tunnel project, this paper takes the chlorite schist section at the west end of the headrace tunnel as the research area, proposes an improved three-parameter H-K (generalized Kelvin) constitutive model suitable for simulating soft rock, analyzes the rheological factors of soft rock tunnel, and draws the following conclusions:
(1)
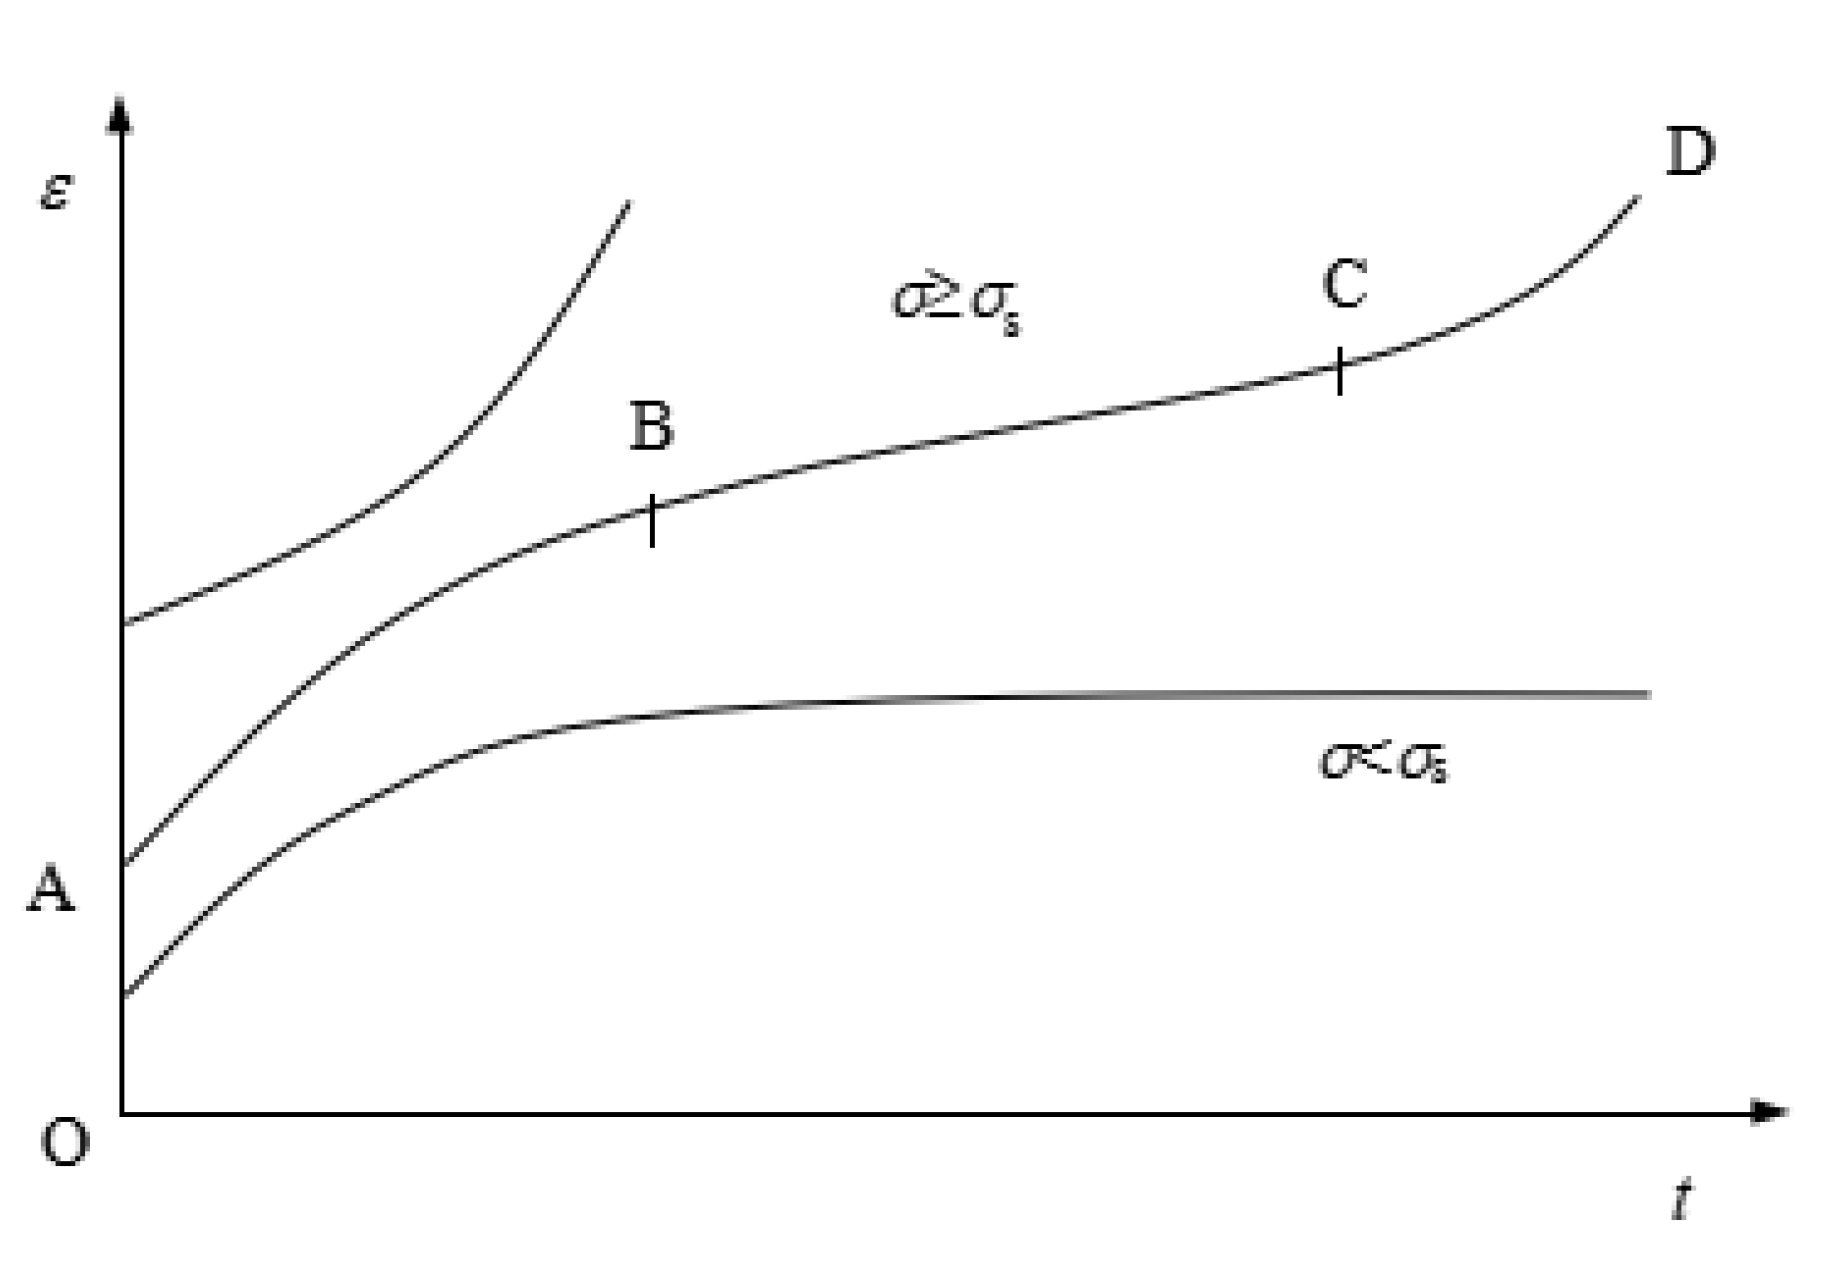
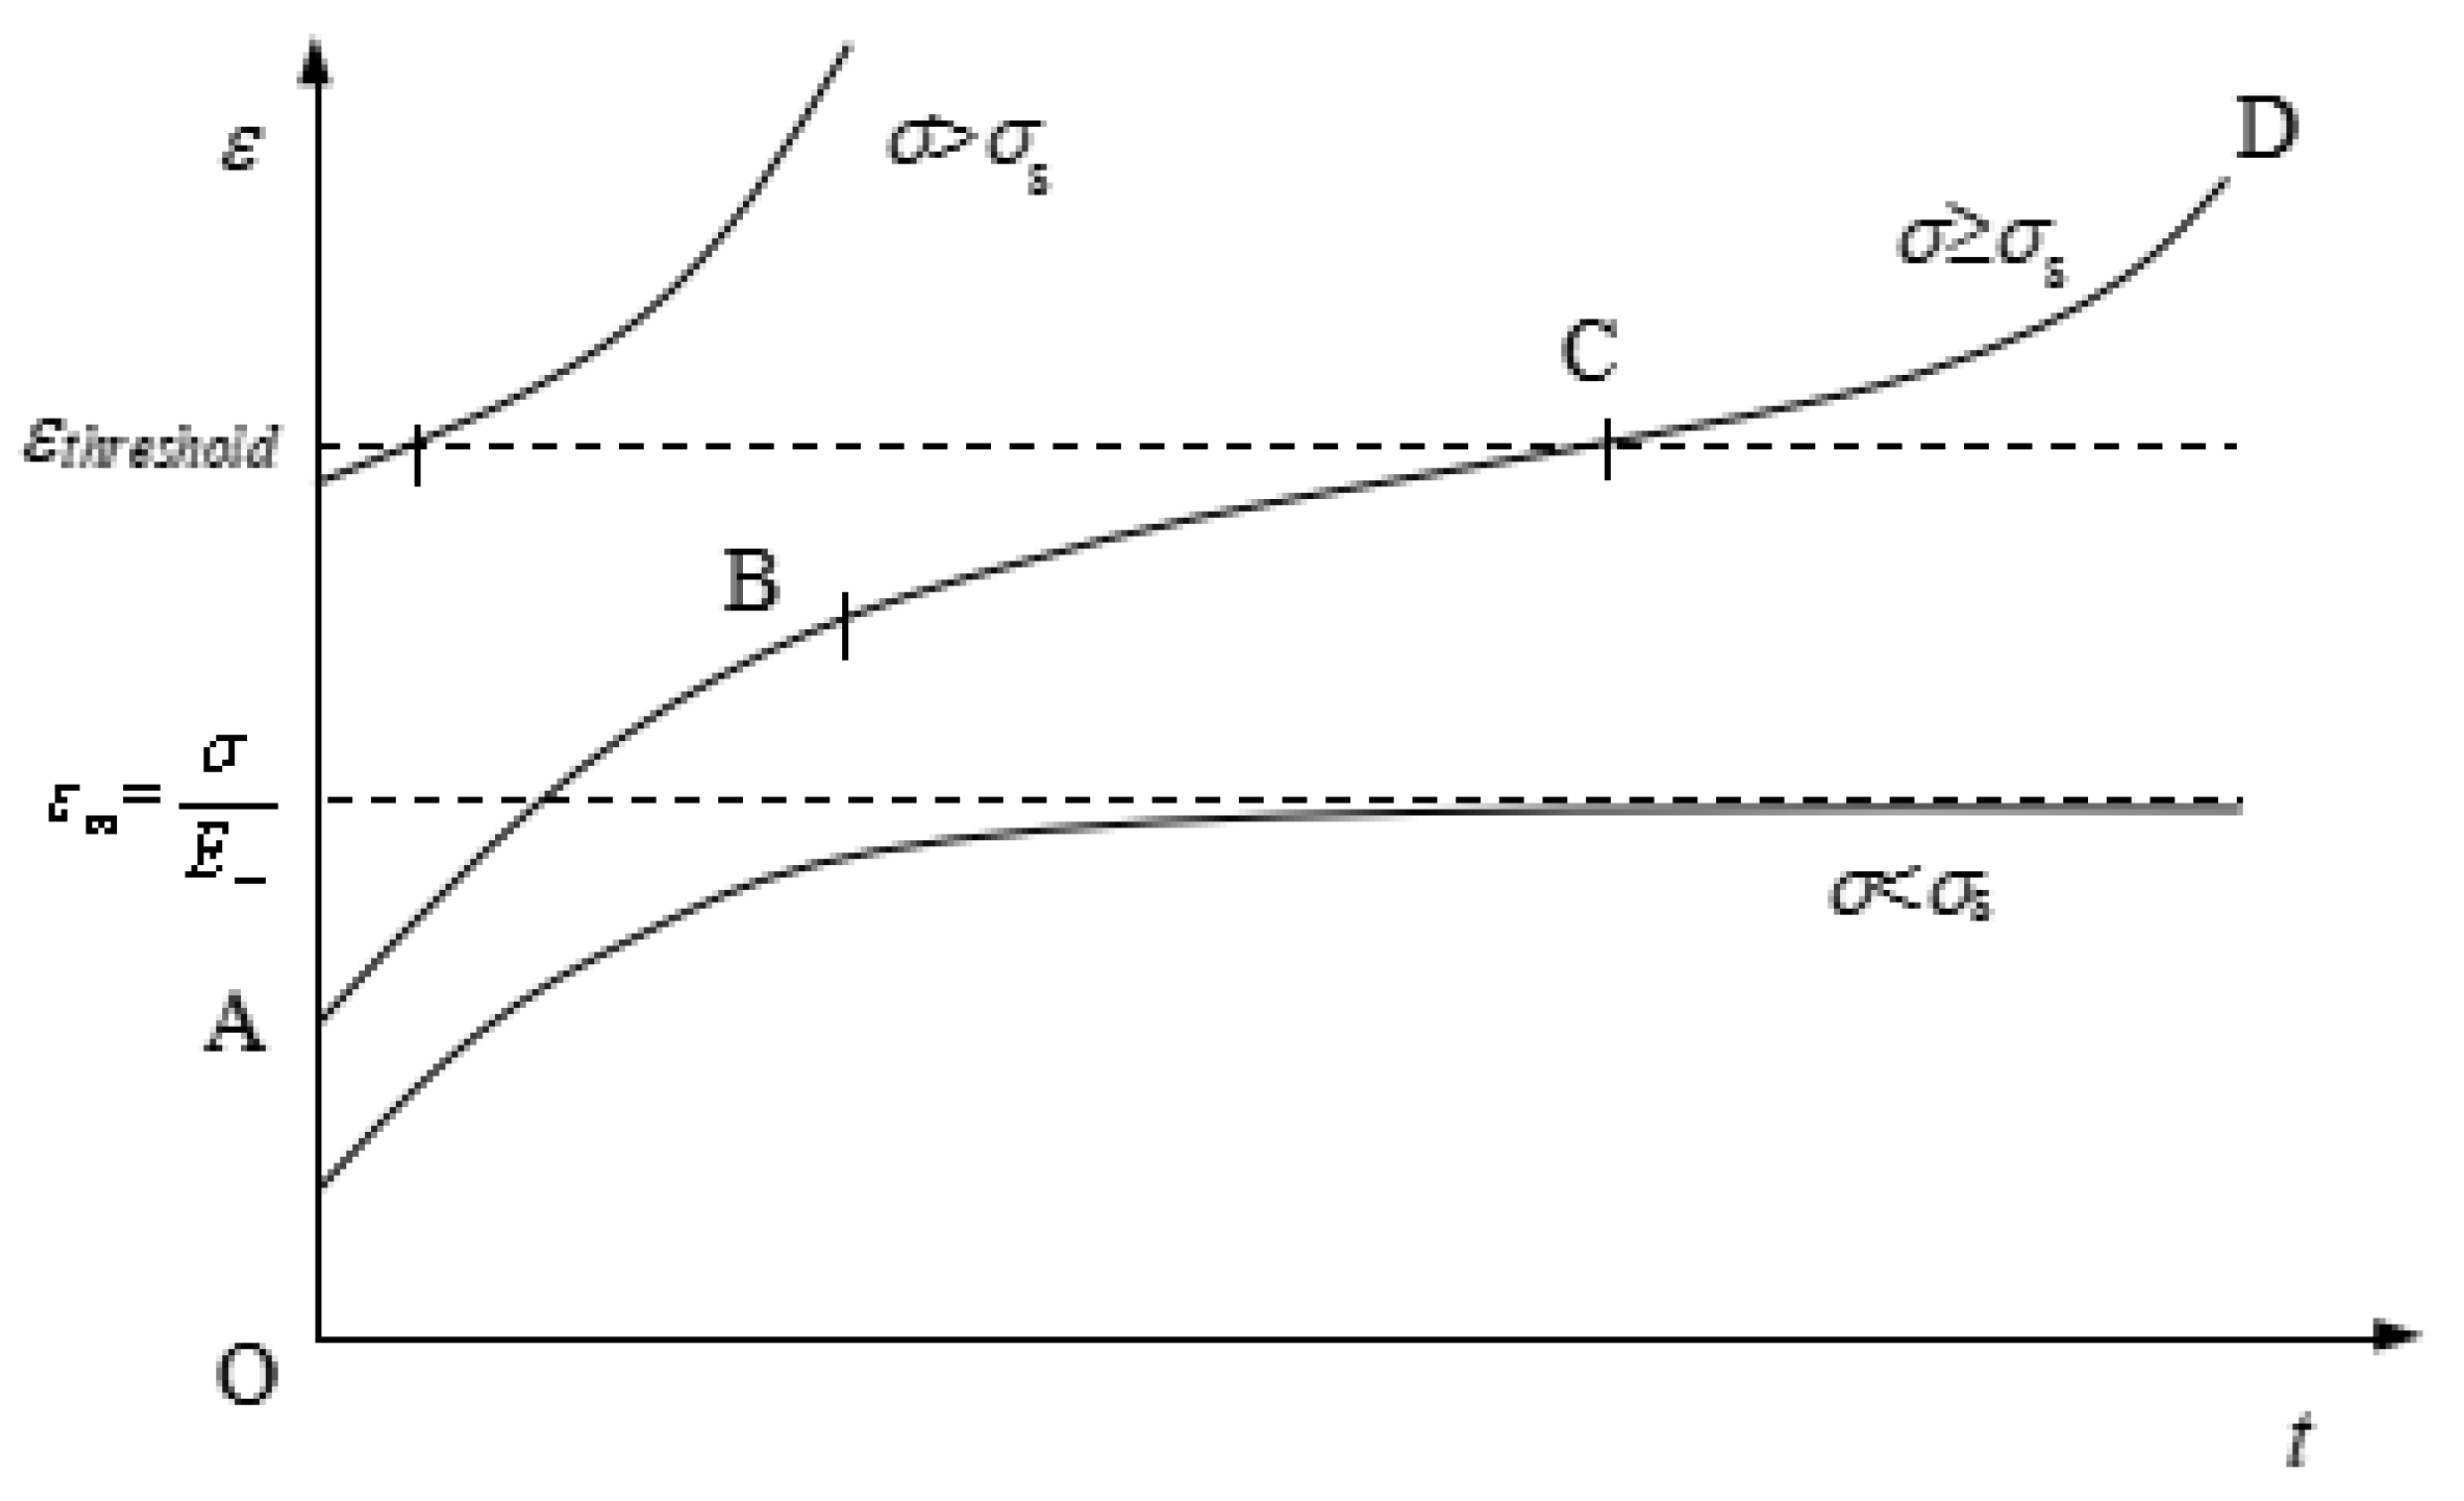
According to the characteristics of the three stages of rock creep, the improved three-parameter H-K (generalized Kelvin viscoelastic model) can reflect the elastic deformation and creep deformation under different stress levels; when the stress level is less than the long-term strength (σ < σs), the growth rate of strain gradually decreases to zero. When t→∞ is less than the long-term strength, the strain will tend to a fixed value, and only the first stage (deceleration) and the second stage (stability) of creep will occur; when the stress level is greater than or equal to the long-term strength (σσs), the strain will increase infinitely with time, will not converge to a fixed value, the material will yield and fail, and the creep will enter the third stage (acceleration);
(2)
When the lateral pressure coefficient K = 1, the greater the burial depth, the longer the time it takes for the tunnel creep deformation to become stable, and the creep displacement around the tunnel also increases; when the buried depth H = 1500 m, the greater the horizontal geostress is, the stronger the creep deformation is, and the inverted arch is the location of the maximum creep deformation; when the buried depth H = 1500 m and the lateral pressure coefficient K = 1, the displacement amplitude of surrounding rock decreases with the increase of radial distance, and the displacement difference becomes smaller when the deformation is stable. Therefore, in the actual tunnel project, when the local horizontal ground stress is relatively large, the prestressed anchor cable can be added on the section with large local deformation of the upper step, which plays a role in restraining the deformation;
(3)
After the excavation of the tunnel is stopped, the earlier the support is, the smaller the later creep deformation is; the longer the support is stopped, although the calculated creep time after setting the support is relatively short, and the greater the creep deformation is generated in the later period. The influence of the number of days to stop (support) on the rheology of the tunnel is mainly reflected in the later creep deformation;
(4)
The farther away from the palm, the greater the release of instantaneous elastic deformation, and the larger creep displacement will occur at the later stage. When it is close to the palm face, due to the influence of the support of the palm face (similar to providing virtual support), the elastic displacement of the monitoring point is small, and the creep deformation is relatively flat at the later stage, and the displacement is small at creep stability.
(5)
After excavation and support of the upper step, the longer the stagnation time, the more disadvantageous the rheological deformation of the tunnel, especially the position of the inverted arch, and the larger the displacement increase in the later creep process. After excavation of the lower step, instantaneous elastic deformation occurs, and the displacement of the inverted arch and side wall increases sharply, while the vault only produces small elastic deformation. After the lower step support, the creep deformation around the tunnel increases to a certain extent due to the influence of stagnation time, and the inverted arch displacement is the largest. According to the actual construction on site, anchor bar piles can be applied at the upper step arch angle to prevent large area uplift of the bottom of the arch after excavation of the lower step and provide support for the systematic support of the upper step. In the later creep process, anchor bar piles can restrain the deformation of surrounding rock around the tunnel to a certain extent. It is more advantageous to excavate the lower step when anchor bar piles are applied.

Author Contributions

Z.Z. analyzed the test results and wrote the article; Y.Z. processed the data; H.Z. carried out the simulation; S.C. provided the information about the construction site; L.C. and L.W. offered useful suggestions for the preparation and writing of the paper. All authors have read and agreed to the published version of the manuscript.

Funding

The study was supported by the National Natural Science Foundation of China (NSFC) under Grant No. 51508037.

Institutional Review Board Statement

Not applicable.

Informed Consent Statement

Not applicable.

Data Availability Statement

Not applicable.

Acknowledgments

We also highly appreciate the data collection work provided by the Second Engineering Co., Ltd. of China Railway Second Bureau and Ertan Hydropower Development Co., Ltd. and East China Investigation and Design Institution. Finally, the authors would like to thank the reviewers for their useful comments and the editors for improving the manuscript.

Conflicts of Interest

The authors declare no conflict of interest.

References

  1. Sun, J. Rock rheological mechanics and its advance in engineering applications. Chin. J. Rock Mech. Eng. 2007, 26, 1081–1106. [Google Scholar]
  2. Xu, W.Y.; Yang, S.Q. Reply to “Discussion on ‘Nonlinear visco elastoplastic rheological model (Hohal model) of rock and its engineering appli-cation’”. Chin. J. Rock Mech. Eng. 2007, 641–646. [Google Scholar]
  3. Lv, A.Z. Some situation and progress in rock mechanics study in China. Rock Soil Mech. 2004, 25, 1–9. [Google Scholar] [CrossRef]
  4. Yang, G.S. On the present state and development of rock mechanics in China. J. Xian Min. Inst. 1999, 19, 5–11. [Google Scholar] [CrossRef]
  5. Yang, G.S.; Sun, J. On the Present State and Development of Rock Mechanics in China. J. Xian Highw. Univ. 2001, 21, 5–9. [Google Scholar] [CrossRef]
  6. Fan, Q.Z.; Wang, S.H.; Gao, Y.F. Progress in studies on the rheological test and model identification of rock. J. Shandong Agric. Univ. 2006, 37, 136–140. [Google Scholar]
  7. Cheng, X.F.; Zhuang, D.Y. A Finite-Strain Viscoelastic-Damage Numerical Model for Time-Dependent Failure and Instability of Rocks. Comput. Geotech. 2022, 143, 104596. [Google Scholar] [CrossRef]
  8. Hamiel, Y.; Lyakhovsky, V.; Agnon, A. Poroelastic Damage Rheology: Dilation, Compaction, and Failure of Rocks: Poroelastic Damage Rheology. Geochem. Geophys. Geosyst. 2005, 6, 9. [Google Scholar] [CrossRef]
  9. Chen, G.Q.; Tang, H.M.; Hu, K.Y.; Li, C.D. Evolution characteristics and early warning of landslides based on heterogeneous rheological properties. Chin. J. Rock Mech. Eng. 2022, 41, 1795–1809. [Google Scholar] [CrossRef]
  10. Wei, Z.; Wang, Y.; Weng, W.; Zhou, Z.; Li, Z. Research on Tunnel Construction Monitoring Method Based on 3D Laser Scanning Technology. Symmetry 2022, 14, 2065. [Google Scholar] [CrossRef]
  11. Long, W.; Chen, W.; Huang, C.; Li, D.; Su, D. Study on Transverse Deformation Characteristics of a Shield Tunnel under Earth Pressure by Refined Finite Element Analyses. Symmetry 2022, 14, 2030. [Google Scholar] [CrossRef]
  12. Jin, L.; Xia, C.C. Study Methods for creep damage in theoretical rheological models and some problems. Chin. J. Rock Mech. Eng. 2012, 31, 3006–3014. [Google Scholar]
  13. Xia, C.C.; Xu, C.B.; Wang, H.N.; Zhang, C.S. Method for parameters determination with unified rheological mechanical model. Chin. J. Rock Mech. Eng. 2009, 28, 425–432. [Google Scholar]
  14. Yang, C.; Xu, X. Relationship between creep characteristics of intact rock and single-flawed sandstone under different critical stress intervals. Chin. J. Rock Mech. Eng. 2022, 41, 1347–1357. [Google Scholar] [CrossRef]
  15. Yang, W.D.; Zhang, Q.Y.; Chen, F.; Li, S.C.; Li, W.G.; Wang, J.H.; He, R.P.; Zeng, J.Q. Rheological parameters inversion by theoretical analysis of compressive creep tests. Chin. J. Rock Mech. Eng. 2012, 44, 638–642. [Google Scholar]
  16. Fang, H.C.; Zhang, D.L.; Wen, M.; Hu, X.Y. A non-iterative analytical method for mechanical analysis of surrounding rock with arbitrary shape holes. Chin. J. Rock Mech. Eng. 2020, 39, 2204–2212. [Google Scholar] [CrossRef]
  17. Huang, H.F.; Ju, N.P.; Zhou, X.; Zhang, C.Q.; Xie, M.L. Creep Properties of Schist Based on Improved Burgers Model. Water Resour. Power 2017, 35, 119–122. [Google Scholar]
  18. Yang, S.Q.; Xu, P. A new nonlinear rheological damage model for rock. Chin. J. Geotech. Eng. 2014, 36, 1846–1854. [Google Scholar]
  19. Cao, P.; Liu, Y.K.; Pu, C.Z.; Chen, R.; Wang, Y.X. An improved accelerated creep mechanical model of viscoelasto-plastic rock. J. Cent. South Univ. (Sci. Technol.) 2011, 42, 142–146. [Google Scholar]
  20. Liu, W. Modified Non-Stationary Bingham Creep Model of Rock and Its Parameter Identification. Chin. Q. Mech. 2022, 43, 651–658. [Google Scholar] [CrossRef]
  21. Liu, K.Y.; Xue, Y.T.; Zhou, H. Study on 3D nonlinear visco-elastic -plastic creep constitutive model with parameter unsteady of soft rock based on improved Bingham model. Rock Soil Mech. 2018, 39, 4157–4164. [Google Scholar] [CrossRef]
  22. Huang, X.; Liu, Q.S.; Bo, Y.; Liu, B.; Ding, Z.W.; Zhang, Q.T. An elasto-plastic and viscoplastic damage constitutive model for dilatancy and fracturing behavior of soft rock squeezing deformation. J. Mt. Sci. 2022, 19, 826–848. [Google Scholar] [CrossRef]
  23. Xu, W.; Cheng, M.; Xu, X.; Chen, C.; Liu, W. Deep Learning Method on Deformation Prediction for Large-Section Tunnels. Symmetry 2022, 14, 2019. [Google Scholar] [CrossRef]
  24. Zhuang, W.Y.; Hou, S.K.; Liu, Y.R. Back Analysis of Mechanical Parameters of Rock Masses Based on Multi-Point Time-Dependent Monitoring Data. IOP Conf. Ser. Earth Environ. Sci. 2021, 861, 032021. [Google Scholar] [CrossRef]
  25. Liu, B.; Sun, J. Identification of Rheological Constitutive Model of Rock Mass and Its Application. J. North. Jiaotong Univ. 1998, 22, 10–14. [Google Scholar]
  26. Yang, W.D.; Zhang, Q.Y.; Zhang, J.G.; He, R.P.; Zeng, J.Q. Second development of improved Burgers creep damage constitutive model of rock based on FLAC3D. Rock Soil Mech. 2010, 31, 1956–1964. [Google Scholar] [CrossRef]
  27. Xu, H.F. Time dependent behaviours of strength and elasticity modulus of weak rock. Chin. J. Rock Mech. Eng. 1997, 16, 47–52. [Google Scholar]
Figure 1. Burgers viscoelastic plastic model.
Symmetry 14 02432 g001
Figure 2. Improved Burgers damage model.
Symmetry 14 02432 g002
Figure 3. Viscoelastic creep calculation model.
Symmetry 14 02432 g003
Figure 4. Calculation Results of Tunnel Side Wall Displacement. (a): Calculation results of tunnel side wall displacement (different w1 values); (b): Calculation results of tunnel side wall displacement (different k values).
Symmetry 14 02432 g004
Figure 5. Improved three-parameter H-K viscoelastic model.
Symmetry 14 02432 g005
Figure 6. (a): Creep characteristics of improved H-K viscoelastic model; (b): Creep characteristics of modified Burgers viscoelastic model; (c): Improved H-K model fitting results.
Symmetry 14 02432 g006
Figure 7. Geological Profile of Headrace Tunnel.
Symmetry 14 02432 g007
Figure 8. Exposed chlorite schist.
Symmetry 14 02432 g008
Figure 9. Schematic Diagram of Three Stages of Creep.
Symmetry 14 02432 g009
Figure 10. Creep characteristic curve of improved three-parameter H-K model.
Symmetry 14 02432 g010
Figure 11. FLAC3D implementation flow of the improved three-parameter H-K model.
Symmetry 14 02432 g011
Figure 12. Model Layout. (a): Typical section; (b): Model boundary; (c): Support model.
Symmetry 14 02432 g012aSymmetry 14 02432 g012b
Figure 13. Layout of Monitoring Points.
Symmetry 14 02432 g013
Figure 14. Time displacement change curve of measuring points around the tunnel (H = 1500 m, (a) K = 0.5, (b) K = 1, (c) K = 2).
Symmetry 14 02432 g014
Figure 15. Time displacement change curve of measuring points around the tunnel (H = 1500 m, (a) K = 0.5, (b) K = 1, (c) K = 2).
Symmetry 14 02432 g015
Figure 16. Cloud Chart of Displacement Distribution around the Tunnel (H = 1500 m, t = 120 days, (a) K = 0.5, (b) K = 1, (c) K = 2).
Symmetry 14 02432 g016
Figure 17. Displacement Change Curve of Measuring Points around the Tunnel with Time (H = 1500 m, K = 1, (a) arch crown, (b) side wall, (c) inverted arch).
Symmetry 14 02432 g017
Figure 18. Layout of Monitoring Points.
Symmetry 14 02432 g018
Figure 19. Surface diagram of monitoring point displacement change; (a): vault; (b): side wall; (c): Inverted arch.
Symmetry 14 02432 g019
Figure 20. Layout of Monitoring Points.
Symmetry 14 02432 g020
Figure 21. Surface diagram of monitoring point displacement change; (a): vault; (b): side wall; (c): Inverted arch.
Symmetry 14 02432 g021
Figure 22. Layout of Monitoring Points.
Symmetry 14 02432 g022
Figure 23. Displacement Change Curve of Monitoring Point; (a): 10 days after upper bench excavation; (b): 20 days after upper bench excavation; (c): 30 days after upper bench excavation.
Symmetry 14 02432 g023
Table 1. Creep Calculation Parameters of Burgers Model.
Parameter GroupTunnel Radius b (m)Initial Geostress s0 (MPa)GK (MPa)GM (MPa)hK
(MPa Day)
hM
(MPa Day)
7401781.3530007077.233.34 × 105
7401078.05300043,188.052.04 × 106
740807.433000128,316.256.06 × 106
Table 2. Viscoelastic Creep Calculation Parameters.
GK (MPa)GM (MPa)ηK
(MPa Day)
ηM
(MPa Day)
kw1w2v
1781.3530007077.233.34 × 1050.25050.6
0.510060.6
0.820070.6
Table 3. Surrounding Rock Parameters.
ρ (kg/m3)B (MPa)GK (MPa)GM (MPa)ηK
(MPa Day)
kw1
261060001781.35150012,857.220.2200
Note: the failure of surrounding rock is not considered, and v, w2, and εthreshold are not assigned.
Table 4. Simulation Parameters of Support Structure.
H20 Section SteelSystem AnchorCF30 Shotcrete
Elastic modulus E (GPa)200Elastic modulus
E (GPa)
200Elastic modulus E (GPa)21.44
Poisson’s ratio μ0.29Sectional area A (cm2)8.042Density Ρ (kg/m3)2500
Sectional area A (cm2)64.28tensile strength Ft (KN)241.3Poisson’s ratio μ0.2
Moment of inertia Iy (cm4)1600Bonding force of anchorage agent Cg (KN/m)200Thickness t (cm)20
Moment of inertia Iz (cm4)4770Anchoring agent stiffness kg (MPa/m)17.5
Polar moment of inertia J (cm4)6370Perimeter of anchor agent outer ring (m)0.1507
Publisher’s Note: MDPI stays neutral with regard to jurisdictional claims in published maps and institutional affiliations.

