Article

Location Selection of Metro-Based Distribution Nodes for Underground Logistics System with Bi-Level Programming Model

College of Civil and Transportation Engineering, Hohai University, Nanjing 210098, China
*
Author to whom correspondence should be addressed.
Symmetry 2022, 14(11), 2411; https://doi.org/10.3390/sym14112411
Submission received: 19 October 2022 / Revised: 7 November 2022 / Accepted: 11 November 2022 / Published: 14 November 2022

Abstract

:
The main purpose of the study was to apply symmetry principles to general mathematical modeling based on a bi-level programming model in order to select the optimal nodes of the underground metro-based logistics system (M-ULS). The first step was to select the metro stations as alternative logistics distribution nodes based on the existing metro network. Secondly, given the requirements of suppliers and demanders, a bi-level programming model was built based on symmetry principles to minimize the total cost of logistics distribution nodes, including construction cost, transport cost, and fixed cost. The third objective was to use an efficient heuristic algorithm to solve the model to obtain the optimal location of the nodes of the logistics distribution. Lastly, Nanjing’s Metro Line 2 was used as an example to validate the efficacy of the proposed model. The results of the case indicate that it is possible to deliver goods from logistics distribution nodes to demanders using the excess capacity of the metro, and the proposed bi-level programming model for M-ULS can be used to select suitable metro stations as distribution nodes and achieve the lowest cost on both the supply and demand sides of logistics while still ensuring the green and efficient transport of logistics services. References and suggestions for planning and selecting the location of logistics distribution nodes based on the metro network in the future can be found in this article.

1. Introduction

The rapid development of the social economy has led to an approximate 16.5 times increase in China’s total logistics volume compared to 20 years ago. The 2021 China Post Express industry report published by the State Post Bureau of China found that in 2021 China’s express service companies completed a total of 108.30 billion business items, a year-on-year growth of 29.9%, and the urban business volume completed a total of 14.11 billion pieces, a year-on-year growth of 16.0% [1]. The demand for e-commerce and urban logistics has surged, so convenient and efficient logistics transportation mode has become a key factor in improving the service level of the logistics industry and the quality of life in the city. Currently, electric vehicles, motorcycles, and small vans have become the primary means of transportation. However, internal urban traffic congestion on the ground is increasing due to accelerated urbanization across China. The speed of transport and distribution of urban logistics could not be guaranteed. One implication is that a reduction in the pressure that urban logistics places on urban areas are highly desirable [2]. One way to mitigate these issues is to use the underground logistics system (ULS) to mitigate the negative impacts of ground transportation [3,4].
Urban underground space in China has grown rapidly in recent years, and the development of underground spaces such as underground and underground complexes is being widely built [5]. The metro system is an important and common component of urban underground transportation, and as such, it has the characteristics of accessibility, punctuality, convenience, economy, and high passenger carrying capacity of most major cities. Integrating ULS into the modern subway system is seen as an attractive and innovative solution for improving the efficiency of urban logistics transportation and improving logistics reliability [6]. The underground metro logistics system (M-ULS) is based on the excess capacity of the metro system to deliver cargo, which is made up of suppliers, distribution nodes, and requesters; the sketch map is shown in Figure 1. During off-peak periods, the metro system often has a considerable excess capacity, which is used for freight delivery. This can, on the one hand, ensure the security and timeliness of logistics distribution. Conversely, it can improve the level of logistics service and customer satisfaction.
The choice of the appropriate station as a logistics distribution node is very important in the underground logistics system based on the metro. The location of the system directly affects the total cost of the system and the level of service to customers [7].
In summary, the main contributions of this paper are as follows:
(1)
This paper proposes a new bi-level programming model from the supplier and demander perspectives to select optimal nodes from alternative logistics distribution nodes;
(2)
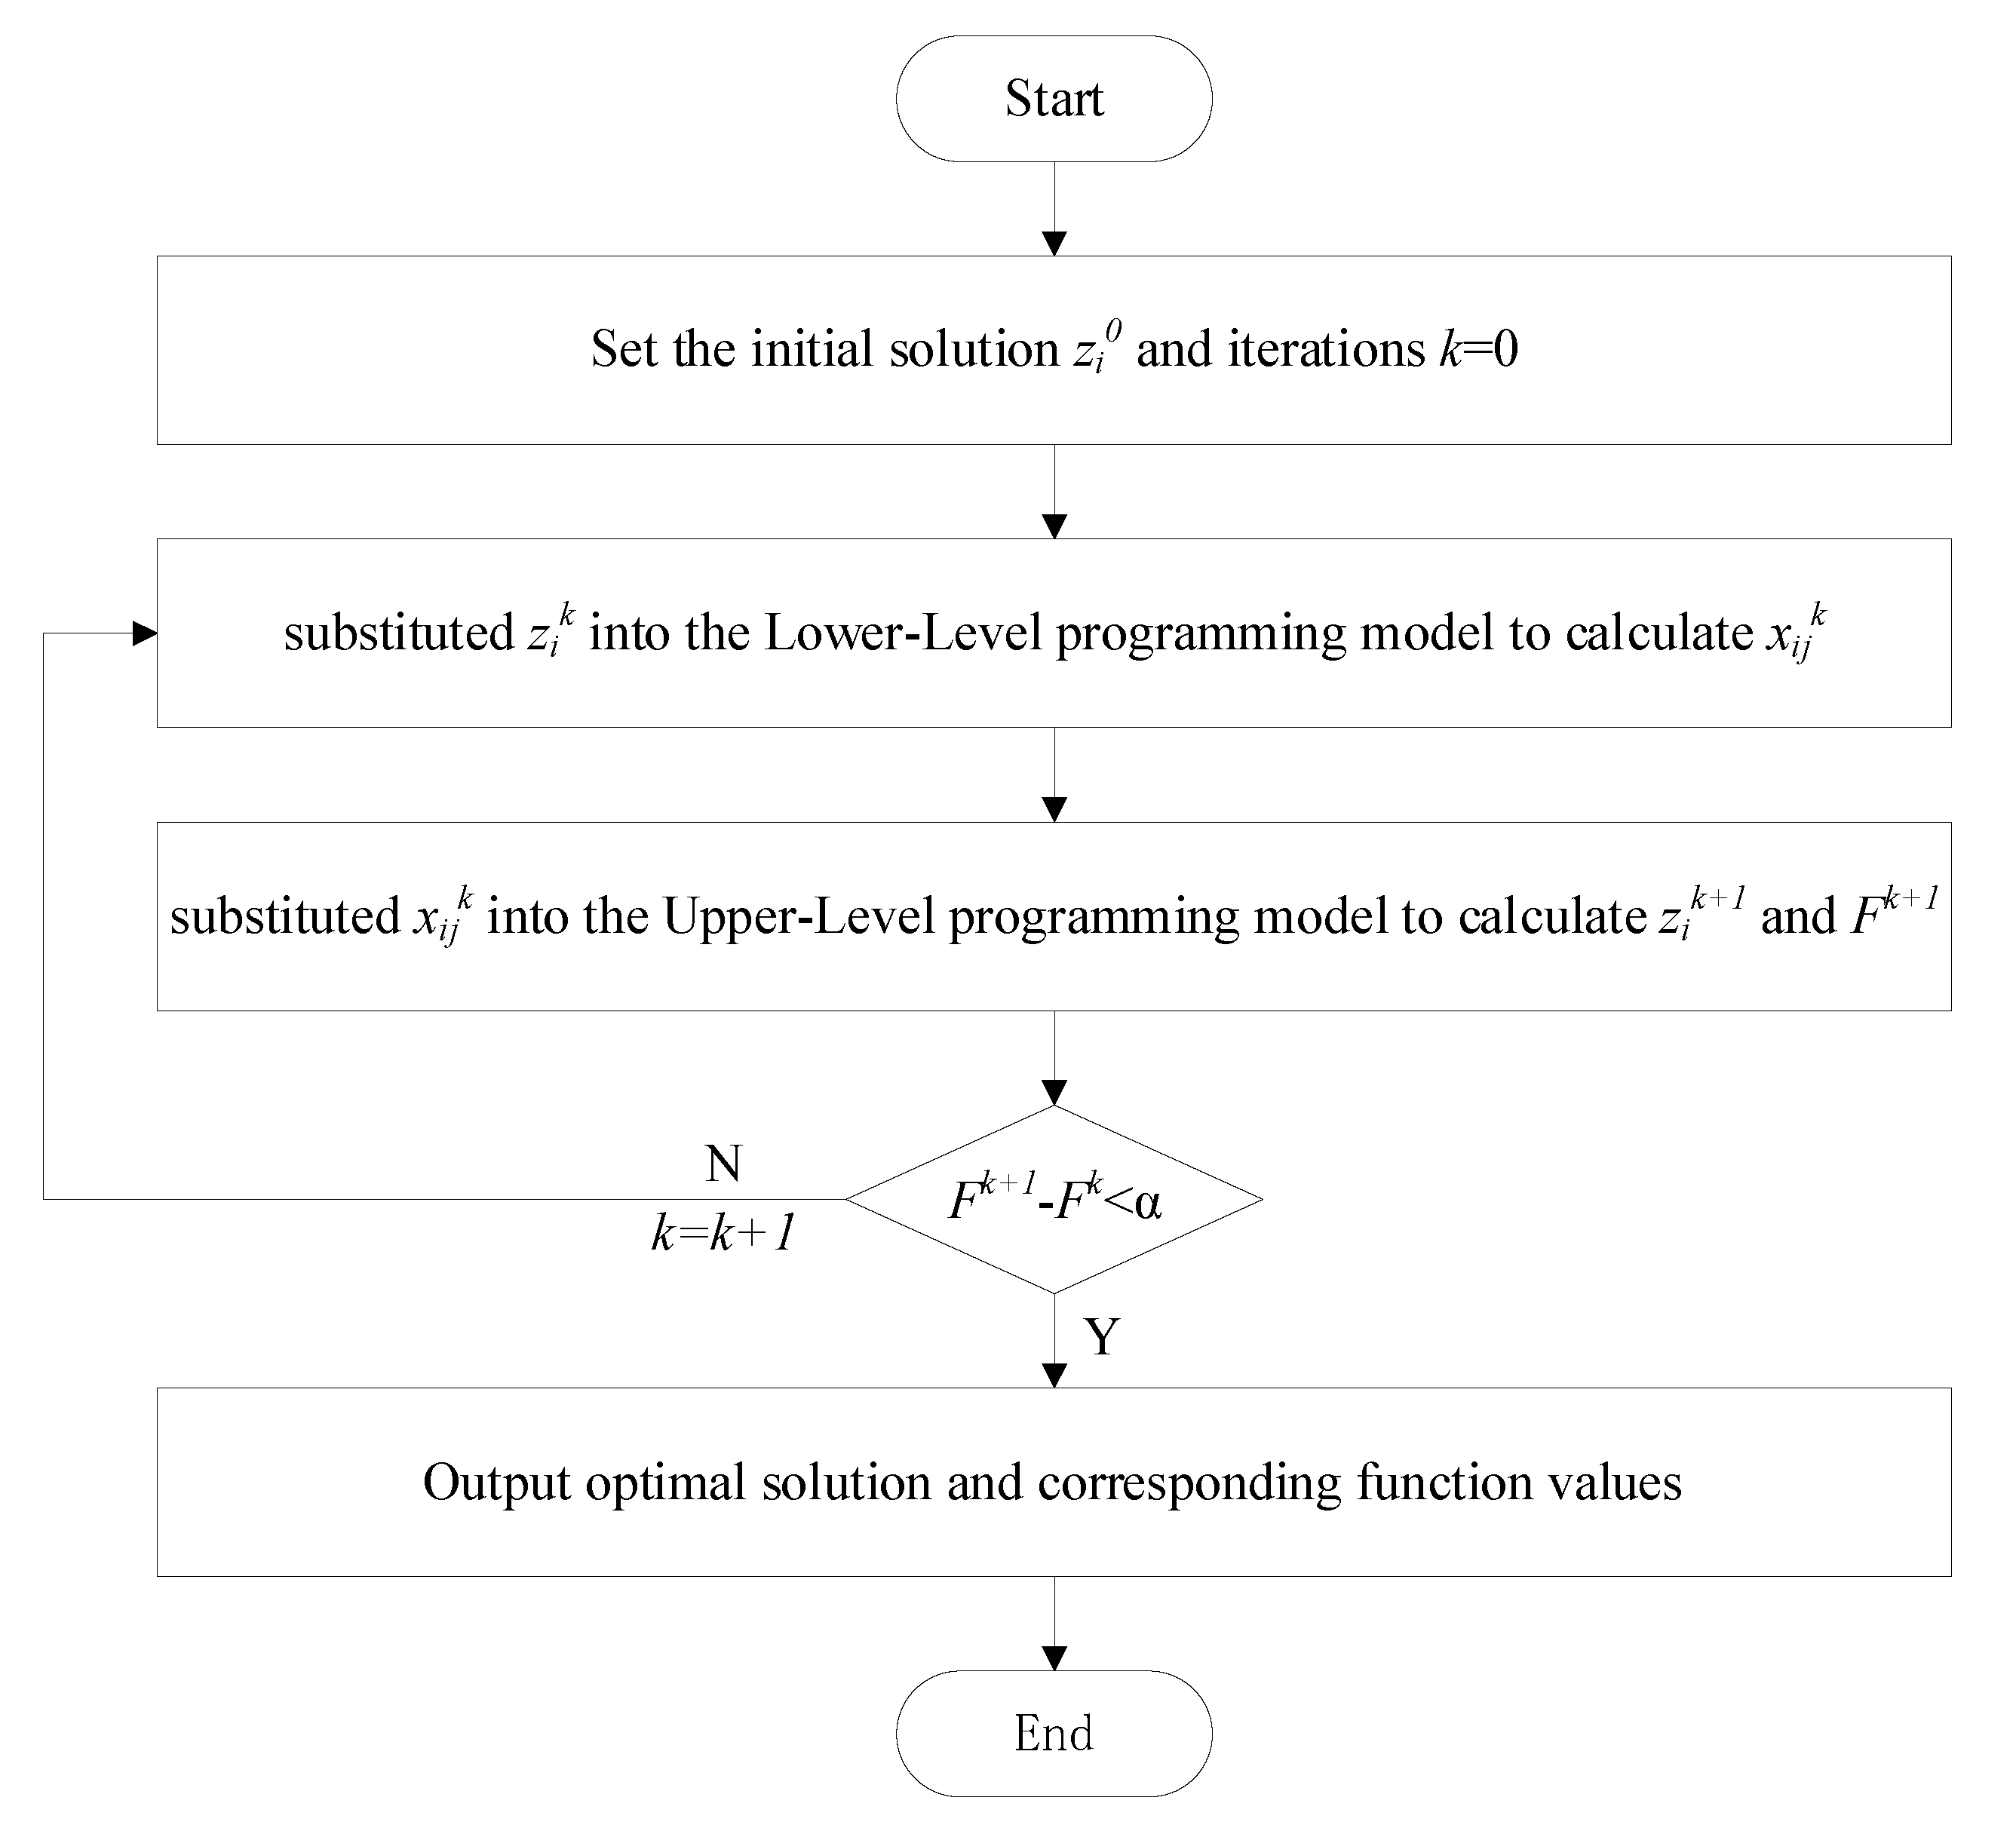
We programmed a heuristic algorithm in MATLAB to solve the logistic distribution node location selection model;
(3)
Case analysis proves the practicality and feasibility of the proposed model and the efficacy of the methods adopted.
The rest of this paper is organized as follows. Section 2 introduces related work from M-ULS. The third section introduces the search methods, which include model assumption, objective function, and parameter tuning. Then, in Section 4, Nanjing’s Metro Line 2 is used as a case study, the optimal logistics distribution nodes are calculated and selected, and insightful analysis and discussion of the results are presented. Section 5 concludes with a summary of the main results and a proposal for the limitation of this study.

2. Literature Review

The modern urban ULS is seen as a vital means of addressing the negative impacts of ground transportation, providing efficient solutions for the delivery of goods in congested urban areas. Numerous innovative concepts and technologies have been proposed, such as applications of drones, package lockers, and mobile depots in local logistics distribution and the development of last-mile delivery [8,9,10,11]; electric vehicles (EVs) and urban cluster centers (UCC) in third party logistics operations [12,13]; and buses, taxis, and cargo-bikes in crowd-sourced and shared logistics [14,15]. Most of these measures, however, either rely heavily on roads and labor (e.g., EVs) or suffer from poor system capacity and applicability (e.g., drones and cargo bikes), and there is a consensus that all of the behaviors of road transport use are difficult to substantially ameliorate the negative externalities of freight transport [16]. ULS has important implications for alleviating urban traffic congestion and promoting urban sustainability [17], and the M-ULS is an important way to solve urban traffic problems with unique benefits [6,18,19,20,21].
Currently, the relevant research on M-ULS stays in the theoretical research stage, mainly focusing on system concept and planning, traffic organization, and network operation [22]. Sun et al. proposed an entropy-based fuzzy TOPSIS evaluation model and combined the multi-objective PSO algorithm and A* algorithm, which were developed to optimize the location-allocation-routing (LAR) decisions of the M-ULS network [18]. The feasibility of using the metro system for freight transport is being investigated, and three models of collaborative transport of passengers and goods are proposed by Amsterdam [23]. Dampier and Marinov discussed the feasibility of using a metropolitan rail network to transport goods directly to a city center from surrounding businesses and used the Tyne and Wear metro system as an example of this [24]. Cochrane et al. investigated that passenger train cars were used for the overnight loading of specialized garbage containers in the New York subway system [25]. Kelly and Marinov proposed a new interior design for subway trains, which were used to deliver goods to city centers from surrounding companies [26]. Serafini et al. discussed the feasibility of using the metro to transport e-commerce based on the preferences of the public [27]. Hu et al. proposed innovative concepts for M-ULS prototypes, which made use of knowledge from engineering practice, emergent initiatives, the literature, and experts’ views [28].
From the point of view of node layout planning, Masson et al. proposed a mathematical model and adaptive search of large neighborhoods to solve a two-level transportation problem [29]. Dong et al. proposed a set of mixed-integer programming models for solving the optimal node’s location allocation (LAP) problem in the M-ULS network. A hybrid algorithm was then designed with a combination of E-TOPSIS, the exact algorithm, and the heuristic algorithm for solving the mixed-integer programming model [6]. Zhao et al. evaluated the importance of each metro station using the TOPSIS model and determined the candidate metro distribution hubs for the location model. Then, considering logistics demand, the final metro distribution hubs were determined from the candidate metro distribution hubs [30]. For example, He et al. constructed a 0–1 mixed integer programming model to minimize the total logistics cost that includes construction, fixed costs, and distribution costs and used the Bat-inspired improved algorithm to find the optimal solution [7]. Zheng et al. adopted the Voronoi diagram to optimize the locations of candidate metro stations and to re-derive the scope of logistics services by adding weighted terms, and the Nanjing subway was selected as a case study to validate the efficacy of the method developed [31].
Screening the previous literature work on M-ULS feasibility and layout planning suggests that further research into feasibility is still needed, and researchers are testing the use of urban metro freight as an effective supplement to the underground logistics transport mode from different perspectives. In the area of node layout planning, researchers propose the optimization model of location selection of logistics nodes by considering different factors for different scales and complexity of the metro network. In contrast to previous studies, however, this paper proposes a bi-level programming model to determine the optimal layout of logistics distribution nodes and minimize the total cost of the provider and requesters in M-ULS. Metro line 2 in Nanjing was chosen as a case study to test the efficacy of the model.

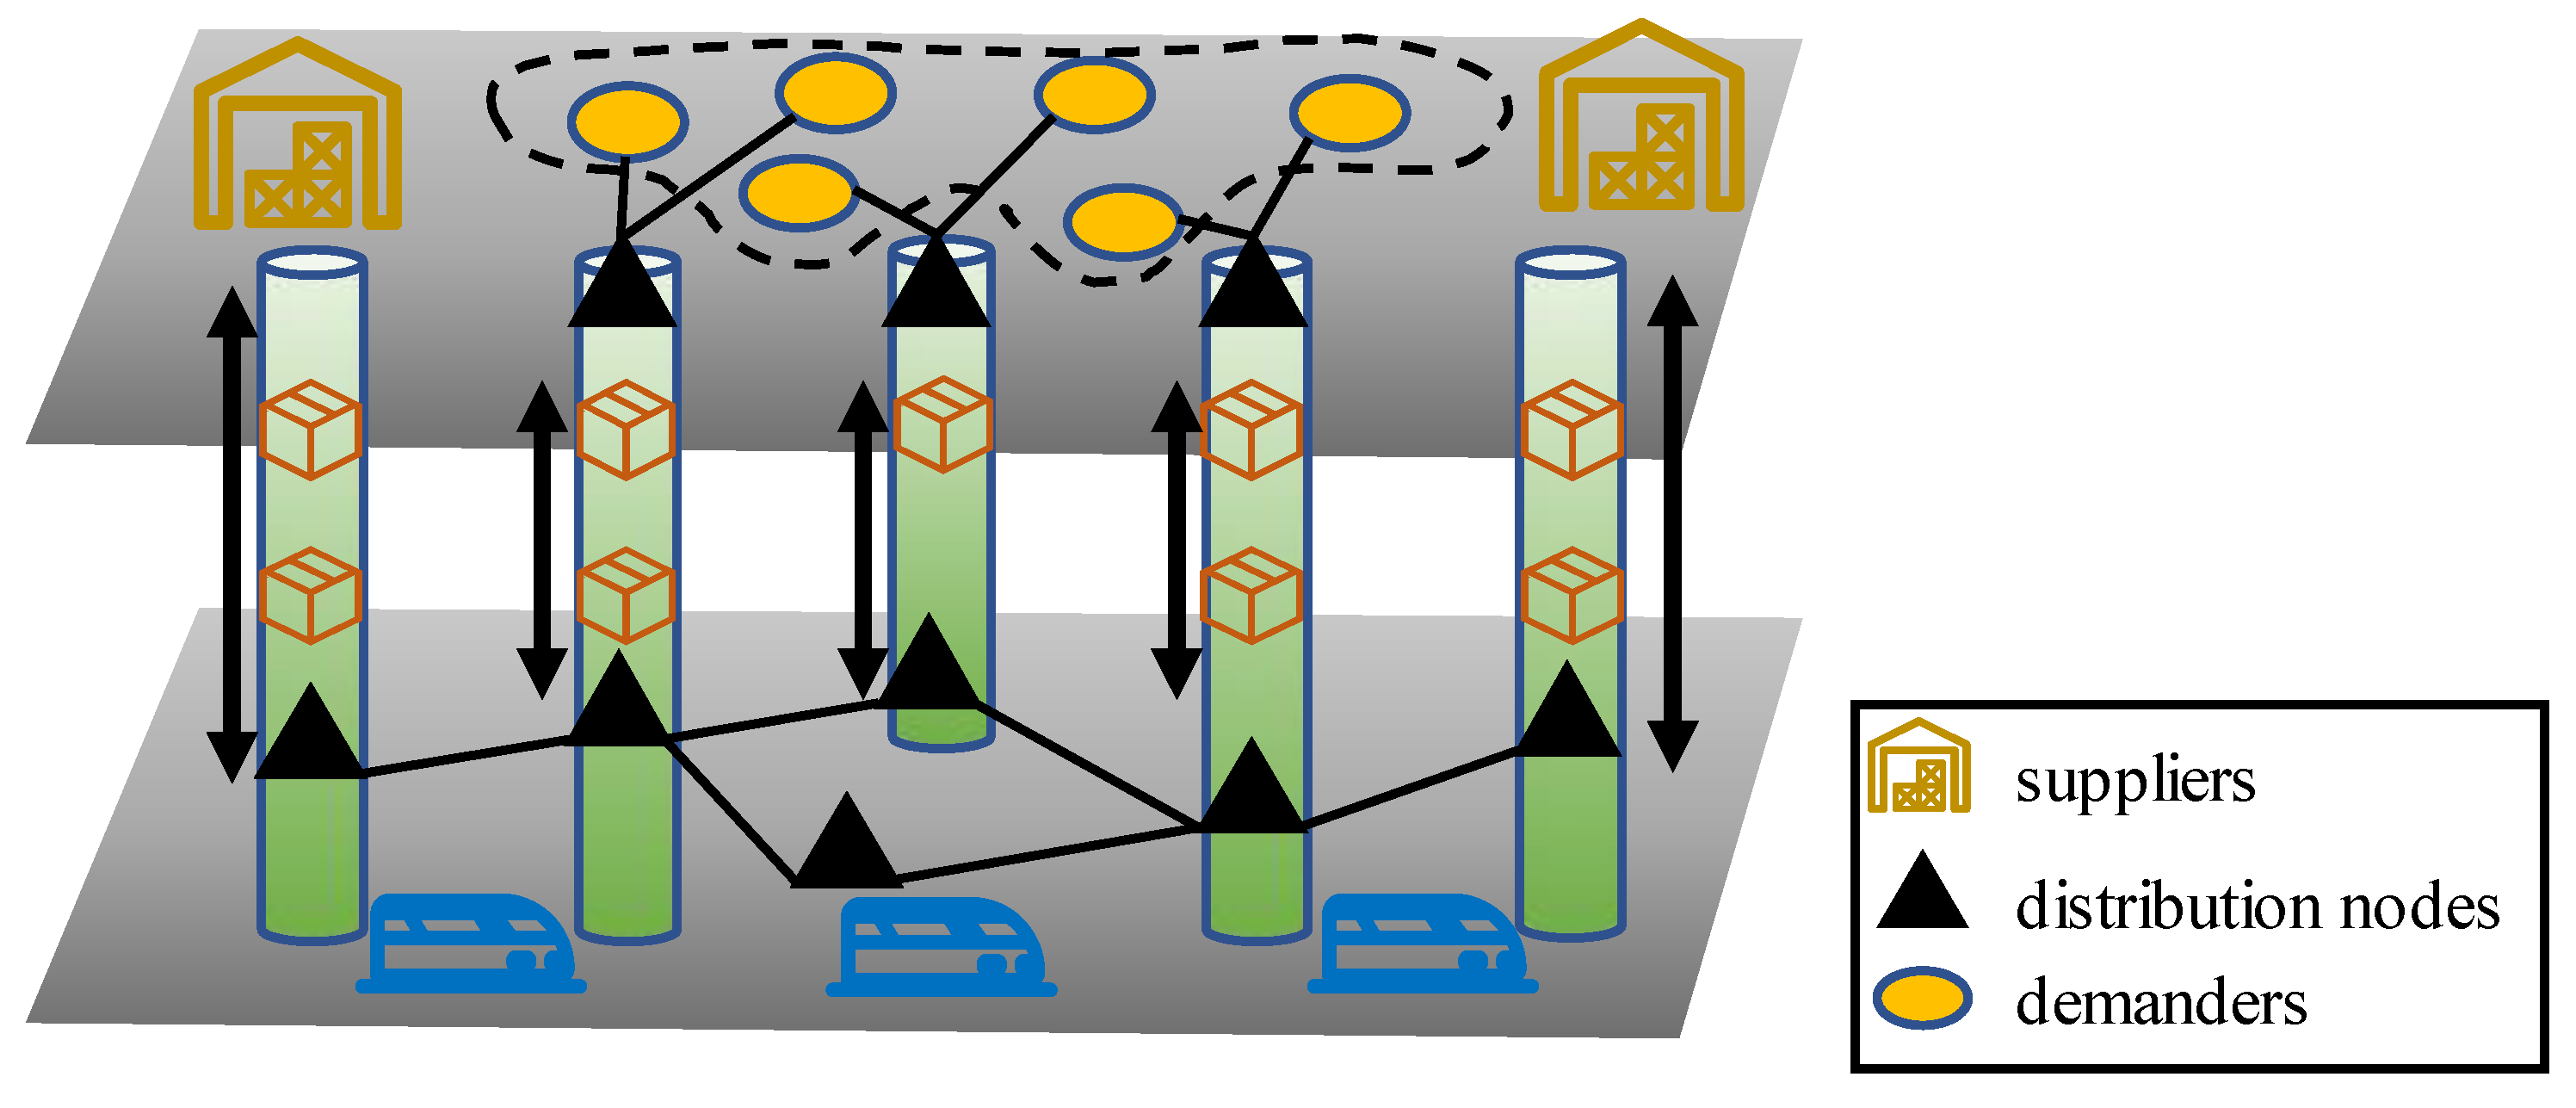
3. Bi-Level Programming Model for M-ULS

3.1. Model Assumptions

In order to ensure that the real abstract problem was transformed into a mathematical model, certain assumptions were made as follows:
  • The same distribution node can undertake the logistics requirements of different demanders;
  • The competition and influence between the new and old logistic distribution nodes were not considered. M-ULS goods were undertaken only by new logistics distribution nodes;
  • The distance and maximum cargo volume from each logistics distribution node to different demanders were known;
  • The construction cost of logistics distribution nodes and the cost of managing goods were known.

3.2. Upper-Level Model Construction

The goal of building the Upper-Level programming model was to help providers design an optimal location scheme of logistics distribution nodes with the lowest total cost and the highest quality of service under fixed investment cost.

3.2.1. Variables Definition

The relevant variables of the Upper-Level programming model are defined in Table 1.

3.2.2. Objective Function

The mathematical formulation of the Upper-Level programming model for the logistics distribution node is defined by the objective function as Equation (1), and it is an objective function designed to minimize the sum cost from the point of view of the decision makers. This includes the cost of transport from supplier to logistics distribution nodes; the cost of delivering logistics distribution nodes to demanders; and the cost of constructing, managing, and storing logistics distribution nodes [32].
U : min F = k = 1 l i = 1 n x k i p k i d k i Z i + i = 1 n j = 1 m x i j p i j d i j Y j + i = 1 n f i Z i + k = 1 l i = 1 n c i x k i

3.2.3. Constraints

The constraints for the Upper-Level programming model are summarized below:
i = 1 n f i Z i B
k = 1 l x k i S i i = 1 , 2 , , n
i = 1 n x k i A k k = 1 , 2 , , l
Z i { 0 , 1 } , i
Y j { 0 , 1 } , j
Equation (2) represents the construction cost of the logistics distribution node does not exceed the budget;
Equation (3) guarantees that the accumulation of goods in the logistics distribution node i will not exceed its capacity;
Equation (4) ensures that the volume of goods supplied by the supplier to the logistics distribution node does not exceed its maximum capacity;
Equations (5) and (6) define the binary decision variables.

3.3. Lower-Level Model Construction

When applying the principle of symmetry, the Lower-Level programming model is symmetrical with the Upper-Level programming model. The goal of building the Lower-Level programming model was to minimize the cost of the requestors. The model reflects demanders’ selection behavior for logistics distribution nodes and provides a scientific basis for determining the location and scale of logistics distribution nodes.

3.3.1. Variables Definition

The relevant variables of the Lower-Level programming model are defined in Table 2:

3.3.2. Objective Function

In the Lower-Level programming model, the demand function Equation (7) is usually in the form of an exponential function [34], and its inverse function is introduced to describe the impact of logistics requirements on the location of logistics distribution nodes. The objective function is Equation (8) as follows:
x i j = Q i j ( u i j ) = A w exp ( u i j / B w ) A w = exp ( v i Z i / β ) B w = β
L : min T = i = 1 n j = 1 m 0 x i j Q 1 ( ω ) d ω
Q 1 ( ) = β ln x i j v i Z i

3.3.3. Constraints

The constraints for Lower-Level programming model are summarized below:
i = 1 n x i j W j j = 1 , 2 , , m
j = 1 m x i j S i i = 1 , 2 , , n
Q 1 ( x i j ) 0
ε Z i x i j M Z i
x i j 0
Equation (10) represents the requirement of demander j can be satisfied in any case;
Equation (11) ensures that the accumulation of goods at logistics distribution node i will not exceed its capacity;
Equation (12) shows that the minimum cost to demander j of selecting logistics distribution node i is nonzero;
Equations (13) and (14) specify the extent of the volume of goods from logistics distribution node i to demander j.

3.4. Model Calculation

For solving the layout models of logistics distribution nodes presented in the previous section, in this paper, we adopted a heuristic algorithm with relatively fast convergence and optimality. The basic rules of the algorithm are:
Based on the analysis of the Lower-Level programming model, the decision variable Zi ensures that Equation (13) satisfies the condition in all cases. Hence, Equation (13) is transformed to the following form to yield the reaction function.
x i j = M Z i e i j i = 1 , 2 , , n j = 1 , 2 , , m
where eij is the slack variable.
The transport volume x*ij can be obtained from the alternative logistics distribution nodes to the demanders in equilibrium by computing the Lower-Level programming model. We then substituted x*ij into Equation (15) in order to compute the slack variable e*ij.
The reaction function is simultaneous:
x i j * = M Z i e i j * i = 1 , 2 , , n j = 1 , 2 , , m
Given the two steps above, Equation (16) is substituted into the Upper-Level programming model, and the optimal solution is found. The volume of goods allocated by the alternative logistics distribution nodes can then be obtained by re-computing the Lower-Level programming model.
The calculation process of the logistics distribution nodes selection is as follows:
Step 1: In the Lower-Level programming model, the inverse of the demand function is transformed into a non-linear polynomial:
L : min T = i = 1 n j = 1 m 0 x i j Q 1 ( ω ) d ω = i = 1 n j = 1 m 0 x i j β ln ω v i Z i d ω = i = 1 n j = 1 m [ x i j ( β ln x i j v i Z i ) β ]
Define zik = (Z1, Z2, Z3, Z4, Z5, Z6, Z7, Z8, Z9), when the logistics distribution node i is selected, Zi = 1; otherwise, Zi = 0, and k is a counter;
Step2: Model initialization and setting zi0 = (1,1,1,1,1,1,1,1,1), k = 0;
Step3: zik is substituted into the Lower-Level programming model to solve the volume of the goods allocated xijk by each node of the alternative logistics distribution;
Step4: xijk is substituted into the Upper-Level programming model in order to solve for the location of the new logistics distribution node zik+1, and the objective function of the Upper-Level programming model is min F, so the corresponding total cost for the k + 1 time is Fk+1.
Step5: Verify outcomes. If F k + 1 F k α are not satisfied, let k = k + 1 and replace it in Step3. The iteration is complete until the result is stable, α for iterative accuracy is set to 0.1 [33].
The specific calculation steps are shown in Figure 2.

4. Case Study: Logistics Distribution Nodes Selection Based on Nanjing Metro Network

In order to test the effectiveness and practicality of the model, Nanjing’s Metro Line 2 was selected as a case study that selects optimal logistics distribution nodes [35].
Metro Line 2 bisects the east–west axis of Nanjing’s main urban area, with an overall length of 37.93 km. The spatial distribution of Metro Line 2 stations and the logistics park within the study area is shown in Figure 3.
This line has 26 stations. By taking into account the influences of geographic location, development, and cost, nine stations were selected as alternative logistics distribution nodes, which include Jingtianlu station (No.1), Xianlinzhongxin station (No.2), Zhonglingjie station (No.3), Muxuyuan station (No.4), Xinjiekou station (No.5), Mochouhu station (No.6), Xinglongdajie station (No.7), Yuantong station (No.8) and Youfangqiao station (No.9), as shown in Figure 3. The basic information on alternative logistics distribution nodes is shown in Table 3.
The impact of each alternative logistics distribution node on the transportation cost of delivered goods, construction costs, unit storage, and management costs should be taken into account in order to achieve the ultimate objective of the lowest total cost. The unit transport cost from the alternative logistics distribution nodes to the demanders is shown in Table 4. Table 5 shows the distance from each alternative logistics distribution node to the demanders. The capacity, utility coefficient, and cost of alternative logistics distribution nodes are shown in Table 6. In addition, considering the residential groups, geographical conditions, economic conditions, and ground transportation in the vicinity of metro line 2; combined with the actual situation in Nanjing, China, 1 provider and 19 requesters were also selected. The Maqun logistics park is responsible for the provision of goods; it is located in the middle section of Metro Line 2 and covers an area of 45,000 km2. Provider details are shown in Table 7.

Calculation Results and Discussion

Table 8 and Figure 4 can be used to see the iterative process of solving the model; we conclude that the selection of logistics distribution nodes is more prone to node reduction. The total cost at the beginning of the model iteration decreases rapidly as the number of iterations increases. Since the number of logistics distribution nodes is decreasing and the model quickly selects unfavorable nodes with too high a transport cost to each requester.
On the other hand, when the number of logistic distribution nodes is six and the iterations are 135th generation, the cost of construction and operation of logistics distribution nodes starts to level off and eventually reaches the minimum. The location of the logistic distribution node after the 135th iteration is zi135 = zi136 = (0,1,0,1,1,1,1,1,0). Thus, the optimal logistics distribution node is whichever satisfies the demands of each requester and minimizes the cost of M-ULS. Lastly, z2, z4, z5, z6, z7, and z8 were chosen as the nodes of the optimal logistics distribution among the nine alternative nodes, and the corresponding stations are Xianlinzhongxin station, Muxuyuan station, Xinjiekou station, Mochouhu station, Xinglongdajie station and Yuantong station, as shown in Figure 5. The total cost of the project amounts to 473,012,580 yuan. Similarly, Table 9 shows that the volume of goods allocated by each node of the optimal logistics distribution is 550,000, 650,000, 870,000, 500,000, 470,000, and 350,000 tonnes, respectively. This can be seen in Table 9; the logistics load capacity of some of the logistics distribution nodes is much larger than that of the others. This is mainly due to the fact that these nodes have a significant operating cost advantage; although their construction cost is higher than the other nodes, the lower unit cost of freight and storage still makes them better than other alternative nodes.

5. Conclusions

In this paper, we innovatively considered using the metro’s excess capacity to perform logistics transport by selecting suitable metro station points to act as distribution nodes in order to achieve more economical and efficient freight transport. Based on the symmetry principle, this paper constructed a novel bi-level programming model in which the objective function takes into account the minimum total investment cost of logistics operation of logistics suppliers and the minimum cost of personal services on the demand side of logistics. The location model of the logistics distribution nodes with the lowest total cost was then built, using the fmincon function in MATLAB software to solve the model results in the optimal model output. Finally, by using Nanjing’s Metro Line 2 as a case study for selecting optimal logistics distribution nodes, the results of the case indicate that it is possible to deliver goods from logistics distribution nodes to demanders using the excess capacity of the metro, and the proposed bi-level programming model for M-ULS can be used to select suitable metro stations as distribution nodes and achieve the lowest cost on both the supply and demand sides of logistics while still ensuring the green and efficient transport of logistics services.
There are, however, several limitations to the present study. The first step was to select a single metro line. Further investigation of the complex metro system with multiple lines is required to further verify the applicability and reliability of the model. Secondly, this paper did not consider the competitive relationship between the new and old logistics distribution nodes. Competitiveness can have some impact on the service level of logistics distribution nodes. Thus, there is also a need to focus on this problem in the future.

Author Contributions

Conceptualization, C.Z. (Changjiang Zheng) and C.Z. (Chen Zhang); methodology, C.Z. (Chen Zhang); software, J.M. and K.S.; validation, F.W.; formal analysis, F.W.; investigation, J.M; resources, C.Z. (Chen Zhang); data curation, K.S.; writing—original draft preparation, C.Z. (Chen Zhang) and J.M.; writing—review and editing, C.Z. (Changjiang Zheng); visualization, C.Z. (Changjiang Zheng) and J.M.; supervision, C.Z. (Changjiang Zheng); project administration, C.Z. (Changjiang Zheng); funding acquisition, C.Z. (Changjiang Zheng). All authors have read and agreed to the published version of the manuscript.

Funding

This research was funded by National Natural Science Foundation of China: 51808187; Natural Science Foundation of Jiangsu Province: BK20170879; Fundamental Research Funds for the Central Universities: 2019B13514; Jiangsu Planned Projects for Postdoctoral Research Funds: 1701086B.

Data Availability Statement

Not applicable.

Conflicts of Interest

The authors declare no conflict of interest.

References

  1. China Federation of Logistics and Purchasing, National Logistics Operation Status Report. Available online: http://www.gov.cn/shuju/2022-01/15/content_5668333.htm (accessed on 15 January 2022).
  2. Combes, F. Equilibrium and Optimal Location of Warehouses in Urban Areas: A Theoretical Analysis with Implications for Urban Logistics. Transp. Res. Rec. 2019, 2673, 262–271. [Google Scholar] [CrossRef]
  3. Chen, Z.L.; Dong, J.J.; Ren, R. Urban underground logistics system in China: Opportunities or challenges? Undergr. Space 2017, 2, 195–208. [Google Scholar] [CrossRef]
  4. Guo, D.J.; Chen, Y.C.; Yang, J.S.; Tan, Y.H.; Zhang, C.H.; Chen, Z.L. Planning and application of underground logistics systems in new cities and districts in China. Tunn. Undergr. Space Technol. 2021, 113, 103947. [Google Scholar] [CrossRef]
  5. Chen, Z.L.; Chen, J.Y.; Liu, H.; Zhang, Z.F. Present status and development trends of underground space in Chinese cities: Evaluation and analysis. Tunn. Undergr. Space Technol. 2018, 71, 253–270. [Google Scholar] [CrossRef]
  6. Dong, J.J.; Hu, W.J.; Yan, S.; Ren, R.; Zhao, X.J. Network Planning Method for Capacitated Metro-Based Underground Logistics System. Adv. Civ. Eng. 2018, 2018, 1–14. [Google Scholar] [CrossRef] [Green Version]
  7. He, M.X.; Sun, L.; Zeng, X.F.; Liu, W.; Tao, S. Node layout plans for urban underground logistics systems based on heuristic Bat algorithm. Comput. Commun. 2020, 154, 465–480. [Google Scholar] [CrossRef]
  8. Kunze, O. Replicators, Ground Drones and Crowd Logistics A Vision of Urban Logistics in the Year 2030. In Proceedings of the International Scientific Conference on Mobility and Transport Transforming Urban Mobility (TUM), Munich, Germany, 6–7 June 2016; pp. 286–299. [Google Scholar]
  9. Vakulenko, Y.; Hellstrom, D.; Hjort, K. What's in the parcel locker? Exploring customer value in e-commerce last mile delivery. J. Bus. Res. 2018, 88, 421–427. [Google Scholar] [CrossRef]
  10. Behiri, W.; Belmokhtar-Berraf, S.; Chu, C.B. Urban freight transport using passenger rail network: Scientific issues and quantitative analysis. Transp. Res. Part E Logist. Transp. Rev. 2018, 115, 227–245. [Google Scholar] [CrossRef]
  11. Cleophas, C.; Cottrill, C.; Ehmke, J.F.; Tierney, K. Collaborative urban transportation: Recent advances in theory and practice. Eur. J. Oper. Res. 2019, 273, 801–816. [Google Scholar] [CrossRef]
  12. Allen, J.; Browne, M.; Woodburn, A.; Leonardi, J. The Role of Urban Consolidation Centres in Sustainable Freight Transport. Transp. Rev. 2012, 32, 473–490. [Google Scholar] [CrossRef]
  13. Lee, D.Y.; Thomas, V.M.; Brown, M.A. Electric Urban Delivery Trucks: Energy Use, Greenhouse Gas Emissions, and Cost-Effectiveness. Environ. Sci. Technol. 2013, 47, 8022–8030. [Google Scholar] [CrossRef]
  14. Fatnassi, E.; Chaouachi, J.; Klibi, W. Planning and operating a shared goods and passengers on-demand rapid transit system for sustainable city-logistics. Transp. Res. Part B Methodol. 2015, 81, 440–460. [Google Scholar] [CrossRef]
  15. Gruber, J.; Kihm, A.; Lenz, B. A new vehicle for urban freight? An ex-ante evaluation of electric cargo bikes in courier services. Res. Transp. Bus. Manag. 2014, 11, 53–62. [Google Scholar] [CrossRef] [Green Version]
  16. Hu, W.J.; Dong, J.J.; Hwang, B.G.; Ren, R.; Chen, Y.C.; Chen, Z.L. Using system dynamics to analyze the development of urban freight transportation system based on rail transit: A case study of Beijing. Sustain. Cities Soc. 2020, 53, 101923. [Google Scholar] [CrossRef]
  17. Yang, T.; Dong, J.; Guo, Z. Research on the Impacts of Underground Logistic System on Urban Development Based on System Dynamics. Chin. J. Undergr. Space Eng. 2020, 16, 1. [Google Scholar]
  18. Sun, X.L.; Hu, W.J.; Xue, X.L.; Dong, J.J. Multi-Objective Optimization Model for Planning Metro-Based Underground Logistics System Network: Nanjing Case Study. J. Ind. Manag. Optim. 2021, 19, 170–196. [Google Scholar] [CrossRef]
  19. Di, Z.; Yang, L.X.; Shi, J.G.; Zhou, H.S.; Yang, K.; Gao, Z.Y. Joint optimization of carriage arrangement and flow control in a metro-based. Transp. Res. Part B-Methodol. 2022, 159, 1–23. [Google Scholar] [CrossRef]
  20. Villa, R.; Monzon, A. A Metro-Based System as Sustainable Alternative for Urban Logistics in the Era of E-Commerce. Sustainability 2021, 13, 4479. [Google Scholar] [CrossRef]
  21. Xu, Y.X.; Dong, J.J.; Ren, R.; Yang, K.; Chen, Z.L. The impact of metro-based underground logistics system on city logistics performance under COVID-19 epidemic: A case study of Wuhan, China. Transp. Policy 2022, 116, 81–95. [Google Scholar] [CrossRef]
  22. Zhang, H.; Lv, Y.B.; Guo, J.W. New Development Direction of Underground Logistics from the Perspective of Public Transport: A Systematic Review Based on Scientometrics. Sustainability 2022, 14, 3179. [Google Scholar] [CrossRef]
  23. Strale, M. The Cargo Tram: Current Status and Perspectives, the Example of Brussels. Transp. Sustain. 2014, 6, 245–263. [Google Scholar] [CrossRef]
  24. Dampier, A.; Marinov, M. A Study of the Feasibility and Potential Implementation of Metro-Based Freight Transportation in Newcastle upon Tyne. Urban Rail Transit 2015, 1, 164–182. [Google Scholar] [CrossRef] [Green Version]
  25. Cochrane, K.; Saxe, S.; Roorda, M.J.; Shalaby, A. Moving freight on public transit: Best practices, challenges, and opportunities. Int. J. Sustain. Transp. 2017, 11, 120–132. [Google Scholar] [CrossRef]
  26. Kelly, J.; Marinov, M. Innovative Interior Designs for Urban Freight Distribution Using Light Rail Systems. Urban Rail Transit 2017, 3, 238–254. [Google Scholar] [CrossRef] [Green Version]
  27. Serafini, S.; Nigro, M.; Gatta, V. Sustainable crowdshipping using public transport: A case study evaluation in Rome. Transp. Res. Procedia 2018, 30, 101–110. [Google Scholar] [CrossRef]
  28. Hu, W.; Dong, J.; Hwang, B.-G.; Ren, R.; Chen, Z. A preliminary prototyping approach for emerging metro-based underground logistics systems: Operation mechanism and facility layout. Int. J. Prod. Res. Ahead-of-print. 2020. [Google Scholar] [CrossRef]
  29. Masson, R.; Trentini, A.; Lehuédé, F.; Malhene, N.; Péton, O.; Houda, T. Optimization of a city Logistics Transportation System With Mixed Passengers and Goods. EURO J. Transp. Logist. 2015, 6, 1–29. [Google Scholar] [CrossRef] [Green Version]
  30. Zhao, L.; Li, H.; Li, M.; Sun, Y.; Hu, Q.; Mao, S.; Li, J.; Xue, J. Location selection of intra-city distribution hubs in the metro-integrated logistics system. Tunn. Undergr. Space Technol. 2018, 80, 246–256. [Google Scholar] [CrossRef]
  31. Zheng, C.; Zhao, X.; Shen, J. Research on Location Optimization of Metro-Based Underground Logistics System With Voronoi Diagram. IEEE Access 2020, 8, 34407–34417. [Google Scholar] [CrossRef]
  32. Yan, W.; Qin, Y. Research on Bi-level Programming Model and Algorithm of Underground Logistics Node Location. Chin. J. Undergr. Space Eng. 2016, 12, 870–874. [Google Scholar]
  33. Sheffi, Y. Urban Transportation Networks: Equilibrium Analysis With Mathematical Programming Methods.; Prentice-Hall: Upper Saddle River, NJ, USA, 1985. [Google Scholar]
  34. Yang, H.; Bell, M.G.H. Traffic restraint, road pricing and network equilibrium. Transp. Res. Part B Methodol. 1997, 31, 303–314. [Google Scholar] [CrossRef]
  35. Nanjing Municipal Postal Administration, Annual Report of Nanjing Urban Traffic. Available online: http://jsnj.spb.gov.cn/xytj_3323/tjxx/202005/t20200527_2248042.html (accessed on 27 May 2020).
Figure 1. The sketch map of the metro-based underground logistics system.
Symmetry 14 02411 g001
Figure 2. Flow chart of calculating bi-level programming model.
Symmetry 14 02411 g002
Figure 3. The spatial distribution of metro line 2 stations, alternative distribution nodes, and logistics park.
Symmetry 14 02411 g003
Figure 4. The iterative process of solving the model.
Symmetry 14 02411 g004
Figure 5. The iterative process of solving the model.
Symmetry 14 02411 g005
Table 1. The definition of Upper-Level Model variables.
ParametersDefinition
lthe number of suppliers
nthe number of alternative logistics distribution nodes
mthe number of demanders
xkithe volume of the goods from supplier k to logistics distribution node i
pkithe unit transportation cost of goods from supplier k to logistics distribution node i
dkithe distance from supplier k to logistics distribution node i
xijThe volume of the goods from logistics distribution node i to demander j
pijthe unit transportation cost of goods from logistics distribution node i to demander j
dijthe distance from logistics distribution node i to demander j
fithe fixed construction cost of the logistics distribution node i
cithe management and storage cost of logistics distribution node i
Bthe total investment budget of the logistics distribution nodes, set to 20 million yuan
Sithe maximum capacity of the logistics distribution node i
Akthe maximum supply capacity of the supplier k
Decision VariablesDefinition
Zi1 when the logistics distribution node i is selected, or 0 otherwise.
Yj1 when the requirement of demander j is selected, or 0 otherwise
Table 2. The definition of Lower-Level Model variables.
ParametersDefinition
uijthe minimum cost for demander j to select the logistics distribution node i
nthe number of alternative logistics distribution nodes
mthe number of demanders
xijthe volume of goods from logistics distribution node i to demander j
Wjthe sum requirements of demander j
Sithe maximum capacity of the logistics distribution node i
ε Enough small positive numbers, set to 0.1
MEnough big positive numbers, set to 800
β The correction coefficient, set to 1 [33]
viThe utility coefficient of distribution node i
Decision VariablesDefinition
Zi1 when the logistics distribution node i is selected, or 0 otherwise.
Table 3. The Basic Information of Alternative Logistics Distribution Nodes.
Node NumberStationStation CoordinateStation Scale (m2)
1Jingtianlu118.9714802, 32.118265585162
2Xianlinzhongxin118.9253611, 32.100873125111
3Zhonglingjie118.8643526, 32.0413405810,455
4Muxuyuan118.8302058, 32.0423786611,015.5
5Xinjiekou118.7789346, 32.0438602539,508.27
6Mochouhu118.7537415, 32.0393398612,745
7Xinglongdajie118.7307263, 32.017314412,377
8Yuantong118.716248, 31.997509412,982.12
9Youfangqiao118.7161628, 31.968485785686
Table 4. The Unit Transportation Cost from Alternative Logistics Distribution Nodes to Demanders (yuan/km/ton).
Demander NumberNode Number
123456789
1888.591010.5111110.5
2788.59.51010.51111.510.5
387.58.59.511111110.510
48689.510.510.511.51110
577.591011111110.510
677.51010111211109.5
7871010111210.5109.5
8871010.5111110.59.59
9771010.5111110.599.5
1088111110.510.5109.58.5
118.5811111110.5109.58.5
1298.5111111101098
13881010.511101098
1498.5111111101098
159.5810.511109.598.58.5
16108.510.510.51098.588
171091099.58.57.577
18119.58.5888777
19101088887.577
Table 5. The Distance from Alternative Logistics Distribution Nodes to Demanders (km).
Demander NumberNode Number
123456789
134382118107.54.336.6
235392219107.43.41.56.4
33640221963.32.35.58.9
4364123208.45.41.53.58.4
5303414114.81.72.86.510
6293212103.41.24.38.112
7303313114.21.758.812
83032119.82.33.77.91215
927311191.92.26.19.913
10242875.646.7111517
1123276.84.83.46.1101416
1221254.31.16.28.6131718
1329276.27.65.78131719
1420233.32.66.79.1131719
1517215.359.912151919
16141857.61316192224
172.41413181820343839
1811318212527333738
193.7717202426323637
Table 6. Description of Related Information for Alternative Logistics Distribution Nodes.
ItemsThe Maximum Loading CapacityThe Utility CoefficientDefault Investment FeesUnit Storage and Management Fees
Symbol S i v i f i c i
Unit10,000 tons/10,000 yuanyuan/ton
Logistics Distribution Nodes Number1601.22001
26021001
312031500.85
41501.52500.8
520022500.65
61501.32500.75
71501.52500.75
810022000.8
96021500.9
Table 7. Description of Related Information for Supplier.
ItemsThe Supply CapacityThe Volume from Supplier to Logistics Distribution NodesThe Distance from Supplier to Logistics Distribution NodesThe Unit Transportation Costs from Supplier to Logistics Distribution Nodes
Symbol A k x k i d k i p k i
Unit10,000 tons10,000 tonskmyuan/km/ton
Values600///
Logistics Distribution Nodes Number15010.25.5
2605.46
3506.67
465106.5
510014.86.5
66617.46
75521.55.5
86024.15.5
94528.45
Table 8. Iterative Process of Model Solving.
IterationsGoods Volume of Logistics Distribution Nodes xijLocation of Logistics Distribution Nodes zi
1(15,40,20,35,72,50,47,35,0)(1,1,1,1,1,1,1,1,0)
2(0,40,45,40,82,50,47,35,0)(0,1,1,1,1,1,1,1,0)
3(0,55,40,30,82,50,45,35,0)(0,1,1,1,1,1,1,1,0)
4(35,40,35,51,0,66,52,60,0)(1,1,0,1,1,1,1,1,0)
5(35,40,35,25,92,0,52,60,0)(1,1,0,1,1,1,1,1,0)
······
135(0,55,0,65,87,50,47,35,0)(0,1,0,1,1,1,1,1,0)
136(0,55,0,65,87,50,47,35,0)(0,1,0,1,1,1,1,1,0)
Table 9. The Optimal Logistics Distribution Nodes in M-ULS.
Node NumberOptimal Logistics Distribution NodeGoods Delivered Volume/10,000 tons
2Xianlinzhongxin station55
4Muxuyuan station65
5Xinjiekou station87
6Mochouhu station50
7Xinglongdajie station47
8Yuntong station35
Publisher’s Note: MDPI stays neutral with regard to jurisdictional claims in published maps and institutional affiliations.

