Article

Building a Fuzzy Classifier Based on Whale Optimization Algorithm to Detect Network Intrusions

by
Nikolay Koryshev
*,
Ilya Hodashinsky
and
Alexander Shelupanov
Faculty of Security, Tomsk State University of Control Systems and Radioelectronics, 40 Lenina Prospect, 634050 Tomsk, Russia
*
Author to whom correspondence should be addressed.
Symmetry 2021, 13(7), 1211; https://doi.org/10.3390/sym13071211
Submission received: 4 June 2021 / Revised: 24 June 2021 / Accepted: 27 June 2021 / Published: 6 July 2021
(This article belongs to the Special Issue Information Technologies and Electronics Ⅱ)

Abstract

:
The quantity of network attacks and the harm from them is constantly increasing, so the detection of these attacks is an urgent task in the information security field. In this paper, we investigate an approach to building intrusion detection systems using a classifier based on fuzzy rules. The process of creating a fuzzy classifier based on a given set of input and output data can be presented as a solution to the problems of clustering, informative features selection, and the parameters of the rule antecedents optimization. To solve these problems, the whale optimization algorithm is used. The performance of algorithms for constructing a fuzzy classifier based on this metaheuristic is estimated using the KDD Cup 1999 intrusion detection dataset. On average, the resulting classifiers have a type I error of 0.92% and a type II error of 1.07%. The obtained results are also compared with the results of other classifiers. The comparison shows the competitiveness of the proposed method.

1. Introduction

Along with the rapid development of information and communication technologies, the number of attacks on systems is growing dramatically. Preventing attacks on systems and ensuring data security has become one of the most critical requirements for both individuals and various organizations [1]. An aggravating factor for network security is an increase in the number of connected computers, which leads to more traffic, more security attacks, more security breaches (by users and/or network administrators), and so on. Intrusion Detection System (IDS) is one way to provide protection against network attacks.
IDS—software or hardware designed to detect the facts of unauthorized access to a computer system or network or unauthorized management of them, mainly via the Internet. IDS checks network traffic data in computer networks to detect malicious activities and is required to notify if such activities are detected. Strategies for classifying network behavior generally come in two categories: misuse detection and anomaly detection [2].
Misuse detection systems investigate network and system activity for known misuse cases of computing resources using signature analysis algorithms. These methods are designed to detect known attacks and are based on the monitoring of programs and data in the information system and the reference verification of the sequence of symbols and events in the network with the database of attack signatures. The advantage of these methods is the negligible requirements for the computing resources of the information system, the maintenance of high efficiency of the technological cycle of management, and the reliability of the detection and analysis of attacks. The disadvantage of methods for detecting incorrect behavior is the inability to detect new (modified) attacks without strict formalization of network traffic keywords and updating the attack signature database.
Anomaly detection systems are based on building a model of user behavior that is considered normal. This is achieved by using a combination of statistical methods or machine learning techniques to study network traffic. Detection of new attacks is more successful with this approach: any detected deviant behavior is classified as a network intrusion. However, normal behavior in a large and dynamic system is not well defined, and it changes over time. This often leads to a considerable number of false positives.
Effectively detecting and separating anomalous data from normal data is a basic requirement of modern intrusion detection systems [3]. The main task of any IDS is the classification of network connections. This task is the most important and requires the most computational resources compared to other IDS tasks, such as the data collection, feature extraction, and report generation [4]. Therefore, the main component of IDS is the classifier. However, datasets on network connections are usually imbalanced (for example, the KDD Cup 1999 set). This complicates the process of constructing the classifier [5].
Today, various machine learning algorithms for constructing classifiers are gaining popularity. Machine learning methods are widely used in various branches of science and technology as the computing power of equipment increases, as well as the ability to collect and store data. These methods enable systems to improve their efficiency with experience [6].
There are a large number of classification algorithms from the machine learning field. For example, the authors of [7] use a modified Support Vector Machine (SVM) method to construct IDS. They use this method together with the SVM Principal Component Analysis (KPCA) for feature selection and a Genetic Algorithm (GA) for optimizing the parameters of the SVM classifier. Osareh and Shadgar [8] consider the application of Artificial Neural Networks (ANN) and SVM separately for creating IDS. Kaja, Shaout, and Ma [9] built IDS in two stages. The first stage corresponded to the decomposition of data into two clusters using the K-means algorithm. This helped to predetermine the set of all attacks and the set of all normal connections. In the second stage, various classifiers were used to adjust the resulting clusters, such as Decision Trees (C 4.5 and Random Forest) and Naive Bayes (NB).
Haghnegahdar and Wang [10] proposed an intrusion detection model based on an artificial neural network, which is trained with the Whale Optimization Algorithm (WOA). WOA is applied to initialize and adjust the weight vector of the ANN to achieve the minimum mean square error. Feature selection is integrated in the WOA-ANN classification process. WOA-ANN performance is assessed using various standard metrics such as accuracy, precision, recall, and F1 score.
One of the methods of machine learning is fuzzy systems, which is based on fuzzy logic and fuzzy set theory. The purpose of this work is to develop a method for creating IDS based on a fuzzy classifier with using whale optimization algorithm and to test the performance of the resulting classifiers. The novelty of the work is the using of WOA to create a fuzzy classifier for detecting network intrusions
The main contributions of this paper are as follows.
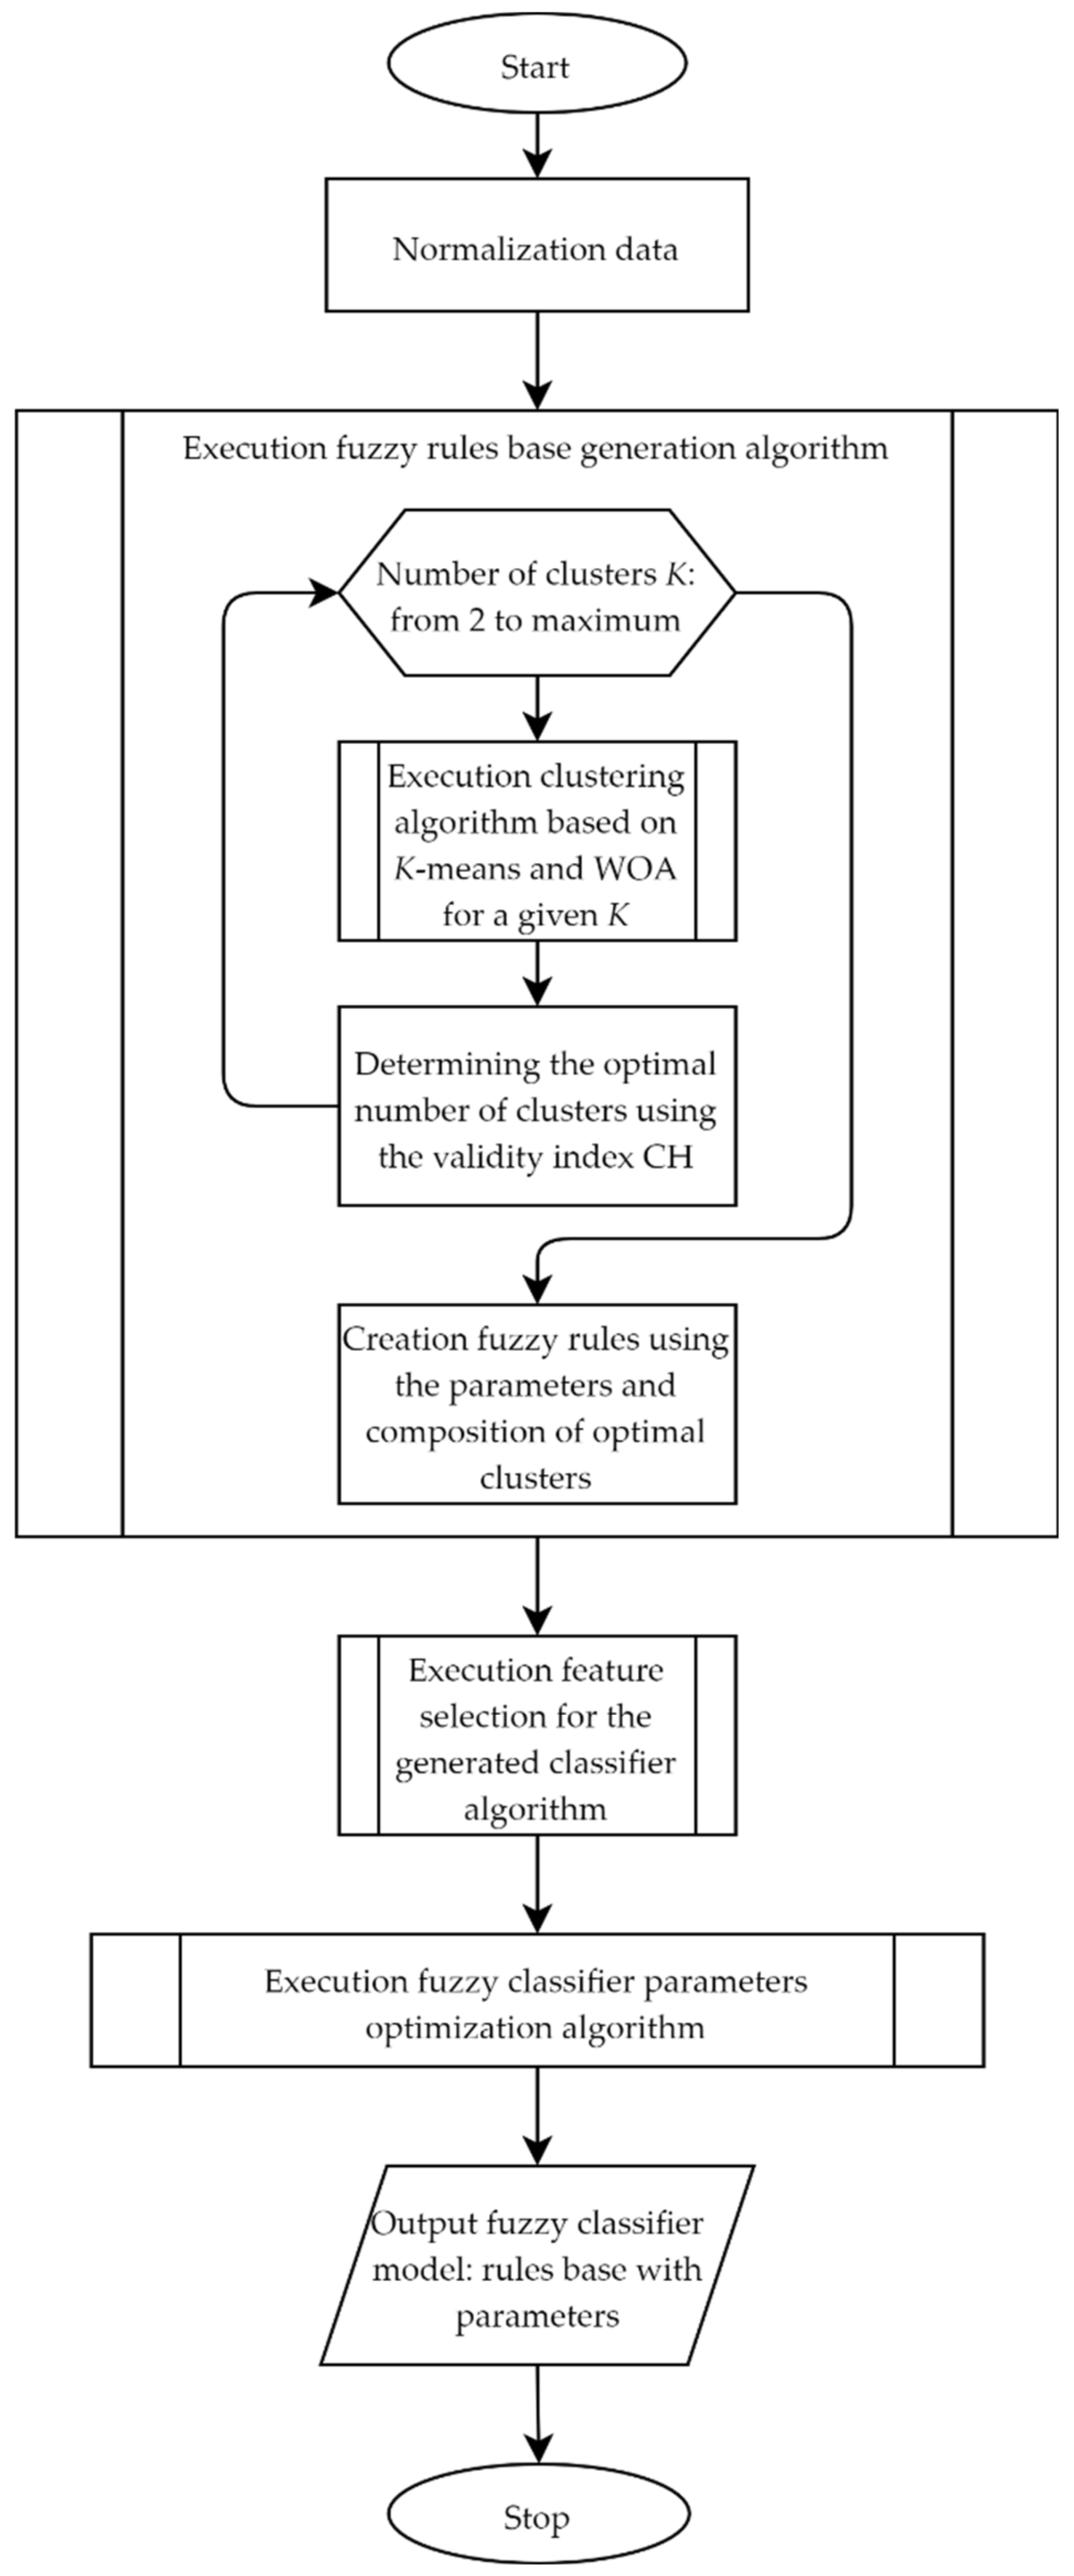
  • Algorithms for performing the stages of constructing a fuzzy classifier based on WOA are presented:
    • An algorithm for generating fuzzy rules of classifier using the K-means algorithm, WOA, cluster validity index, and symmetric Gaussian membership function;
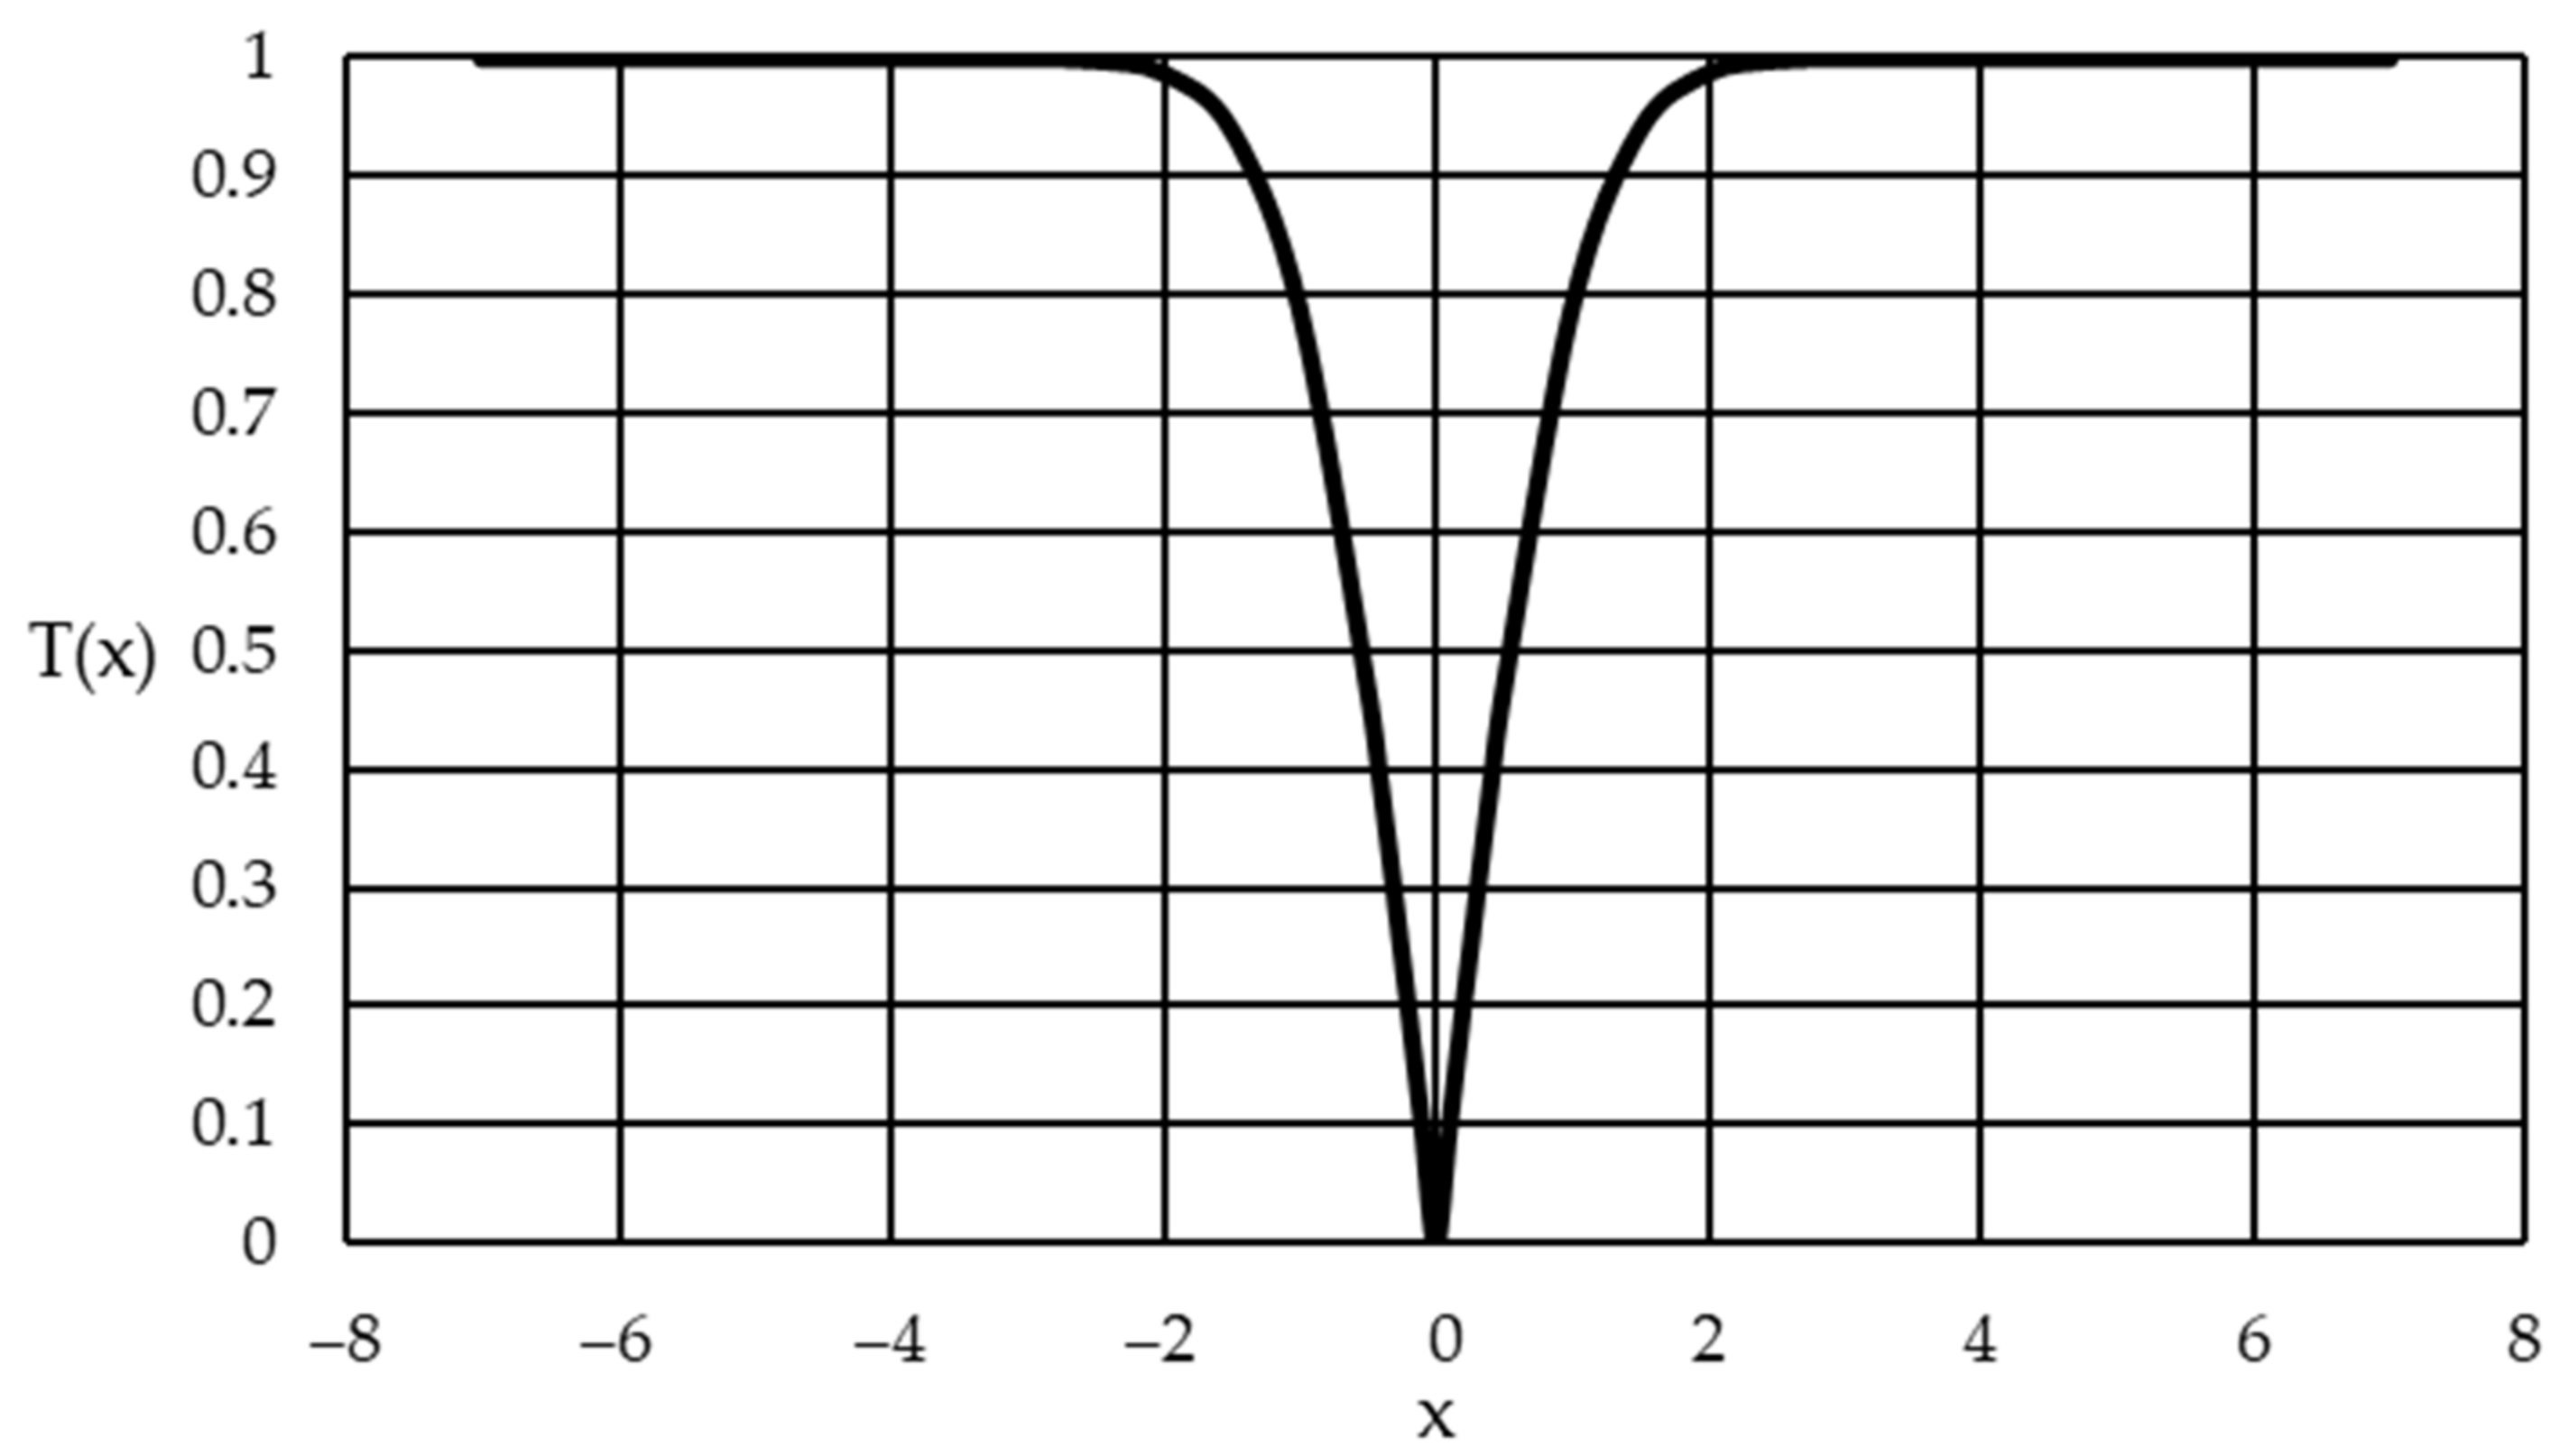
    • An algorithm for selecting informative features for a fuzzy classifier using WOA and a symmetric transformation function;
    • An algorithm for tuning the parameters of a fuzzy classifier using a WOA algorithm.
  • The results of testing the performance of algorithms for constructing a fuzzy classifier on the KDD Cup 1999 dataset are presented. This dataset contains information about normal network connections and network attacks.
The article is organized as follows. Section 2 provides information about the problems in constructing a fuzzy classifier and some methods for solving them from the literature. Section 3 describes the methods and algorithms used in this paper to construct a fuzzy classifier. Section 4 presents the results of experiments on the construction of a classifier for detecting network attacks. Section 5 is devoted to the analysis of these results. In the final Section 6, the main conclusions of this work are presented.

2. Related Works

2.1. Fuzzy Classifier

In the feature space, fuzzy logic allows an object to belong to different classes at the same time with some degree of belonging. This makes fuzzy logic an excellent choice for modeling IDS, since the boundary between normal and abnormal network behavior is not rigid.
The main advantage of the fuzzy classifier is the high interpretability of the created rules, which increases the reliability of the classification and makes it easier to understand the structure of the classifier. Therefore, the main component of the fuzzy classifier model is the fuzzy rule base.
Using the approach of building on the basis of a table of input/output data, we can form rules by using the algorithm for class extremes [11]. The number of rules generated by this fuzzy algorithm is equal to the number of classes in the classified dataset. This property is both an advantage and a disadvantage of the algorithm. The minimum number of rules in a fuzzy classifier contributes to a better understanding of its operation and reduces computational costs for its training. However, it is not always possible to obtain the necessary classification accuracy based on the minimum number of rules. The second approach to creating a rule base uses clustering methods (in particular, K-means), when all instances of data from the observation table are grouped into clusters of arbitrary shape. The number of rules generated by this method is equal to the number of clusters, that is why such an algorithm should be able to build the (sub)optimal number of clusters.
A fuzzy IDS will use a hybrid strategy for determining network behavior. The fuzzy classifier model is built on the basis of the table of input/output data (in our case, the table contains a database of known connection signatures), and the fuzzy rules will correspond to known classes. Nevertheless, due to the high interpretability of the fuzzy rules, the classifier is able to detect unknown attacks without updating the information about the attack signatures.
Alcala-Fdez et al. [12] propose a Fuzzy Association Rule-based Classification method for High-Dimensional problems (FARC-HD). The method is used to obtain an accurate and compact classifier based on fuzzy rules, and it maintains low computational costs at the same time. This method is based on an improved weighted measure of relative accuracy, which pre-selects the most suitable rules before the genetic post-processing procedure for selecting rules and setting parameters.
Fazzolari et al. [13] present an evolutionary algorithm D-MOFARC, which performs two processes: selection of rules from the original knowledge base of fuzzy classifiers and tuning of the parameters of the selected rules. A fuzzy discretization algorithm was designed to extract suitable granularities from the data (authors call “granularity” the parameters that describe the partitions and the number of fuzzy sets of each variable) and to create the fuzzy partitions that consist of the original database. To create an associative knowledge base, the FARC-HD methods described in [12] were used. D-MOFARC allows to obtain a set of solutions with different trade-offs between the accuracy and the compactness of models.
The authors of [14] propose the integration of Multi-Objective Evolutionary Algorithm (MOEA), i.e., the Pareto optimization algorithm, within a linguistic mining of the fuzzy association rules of the FARC-HD algorithm, taken from [12]. The advantage of using MOEA is related to the one-time optimization of various performance criteria of IDS (for example, classification accuracy and F-measure). The purpose of this procedure is to expand the search space and get some set of exact solutions, as in [13]. This way, the IDS user can choose the most appropriate classification system for the current work context.
The authors of [5,15,16] propose a method for constructing a fuzzy-rule-based classifier using the Gravity Search Algorithm (GSA). This article highlights three main stages of building a classifier: creation of a base of fuzzy rules, features selection, and optimization of the rules’ parameters. At the first stage, the structure of the classifier is formed using an algorithm based on class extremes. At the second stage, several subsets of features are obtained according to the wrapper scheme based on the binary version of the GSA. At the third stage, the parameters from the fuzzy rules are optimized using continuous GSA. The performance of the classifier was tested on 26 real datasets from the KEEL repository (knowledge extraction based on evolutionary learning). The results showed that high-precision classifiers can be constructed with relatively few fuzzy rules and features.
The authors of [17] present the construction of a fuzzy classifier for detecting network attacks on the KDD Cup 1999 dataset. Similar to the previous example [15], the construction was performed using three algorithms: an algorithm based on class extremes for generating rules, a Binary Harmonic Search (BHS) algorithm for selecting features for the classifier, and a Differential Evolution (DE) algorithm for optimizing the rule parameters. The optimal classifier obtained by this method gives a type I error of 1.21% and a type II error of 0.39%. However, as in [15], it would be possible to achieve higher efficiency of the classifier here if the clustering algorithm was used to generate the rules.

2.2. Clustering

Clustering (cluster analysis) is the task of grouping a set of objects into subsets (clusters) in such a way that objects from one cluster are more similar to each other than to objects from other clusters by some criterion. Let X be the set of objects, and Y be the set of cluster identifiers (labels). On the set X, the function of the distance between objects ρ (x, x′) is given. It is necessary to divide the set X into subsets (clusters), that is, to assign a label y j Y to each object x i X in such a way that the objects within each cluster are close relative to the metric ρ, and the objects from different clusters differ significantly [18].
It is possible to cluster not only the data “object-label”, but also structures, which are represented as a network or graph. The topology of such a network is characterized by the clustering coefficient. The authors of [19] investigate the properties of the clustering coefficient of various networks types. Shang [20] considers hybrid dynamic networks, which are consisting of agents with discrete and continuous time.
In contrast to classification, the clustering task refers to “learning without a teacher”: the system is spontaneously trained to perform the task without intervention from the experimenter and without knowledge of the output data. However, the solution to the clustering problem is objectively ambiguous: firstly, there is no unambiguous criterion for the quality of clustering, secondly, the result of clustering significantly depends on the metric that determines the distance between objects, and thirdly, the number of clusters is unknown in advance and is selected according to subjective criteria [21].
Clustering algorithms are classified into three main categories: hierarchical, fuzzy, and partitioned (crisp) [22]. Hierarchical algorithms represent clusters as a tree structure. However, they show low performance when they separate overlapping clusters: if already assigned to a given cluster, elements cannot move to other clusters during the clustering procedure. In the fuzzy approach, each element of the dataset belongs to each cluster with some degree of membership; it is convenient if the clusters overlap with each other, but gives low-quality results if the clusters have different variance over different dimensions of the elements. An example of a fuzzy clustering algorithm is Fuzzy C-Means (FCM) [23]. Crisp clustering algorithm divides a dataset into several groups using a certain criterion. These algorithms are the most common, because they perform clustering of large datasets faster than others do [24].
Clustering methods can be used when data groups (classes) are unknown in advance. Since the number of types of network attacks is growing and information about all possible attacks is not available, the clustering approach is used to create a primary IDS model of the anomaly detection type. With respect to the fuzzy classifier, we are talking about the generation of a base of fuzzy rules using clustering.
Wang et al. [25] use a new clustering algorithm called Affinity Propagation (AP) and its extension in streaming environments to build IDS on KDD Cup 1999 dataset. AP does not require prior determination of the number of clusters, and this is an important advantage for autonomous intrusion detection.
Porto-Dıaz et al. [26] present an approach FVQIT (Frontier Vector Quantization using Information Theory), which is based on the information theory. It uses a modified clustering algorithm to divide the feature space into several clusters; the classification task is performed independently in each cluster. The FVQIT method is used in combination with discretization algorithms such as Proportional K-Interval Discretization (PKID) and Entropy Minimization of Discretization (EMD), and feature selection methods such as consistency-based filter and INTERACT.

2.3. Feature Selection

Usually, while constructing classifiers, the quality of features is additionally reduced. This is required to reduce the risk of overfitting and improve the quality of classification. One of the procedures for reducing the features of objects is the procedure for selecting informative features. The task of feature selection is to search for a given set of significant features. That means it is necessary to find a subset of features that does not lead to a significant loss of information about the object that allows it to be classified. The solution is represented as a vector S = s 1 , s 2 , . . . s d , where d is the initial number of features in the dataset; if s i = 0, that means feature i is not used when classifying the object, and if s i = 1, that means the classifier uses feature i [5].
There are two main feature selection schemes. The filter type scheme is universal and has less computational complexity, because it is applied to dataset and does not use any intelligent analysis algorithm (in particular, a classifier) [27]. The selection algorithm “filters” a set of features by certain metrics, such as entropy or mutual information. “Filter” uses only the data from the input/output data table, and then provides the classifier with the found solution. The consistency-based filter and INTERACT methods mentioned in Section 2.2 are executed according to this scheme.
The wrapper-type scheme implies the participation of the classifier in the selection process [28]. The feature selection algorithm, during its execution, defines a subset of features for the classifier at each iteration and adjusts it depending on the accuracy of the classifier. This scheme is computationally expensive, but it is more efficient, because the set of features is selected to a specific classifier model, rather than to the dataset.
Vijayanand and Devaraj [29] proposed a wrapper-based feature selection approach for IDS using the modified WOA. It was enhanced by the crossover and mutation operators from the GA. The SVM was used as a classifier that helps to select the informative features of IDS. Unfortunately, the authors did not indicate how specifically WOA was applied to feature selection.

3. Materials and Methods

3.1. Description of Fuzzy Classifier

The basic idea of a fuzzy classifier is to describe each intended class with a fuzzy “IF–THEN” rule. The dimension of the rule is determined by the dimension of the data space under study. Each rule contains a statement about the values of the input variables and defines the value of the output variable as a class label. Class k is defined by a fuzzy rule of the following form [15]:
IF s 1 x 1 = A 1 k AND s 2 x 2 = A 2 k AND . . . AND s d x d = A d k THENclass = c k ,
where S = s 1 , s 2 , . . . s d is the binary vector whose elements indicate the presence or absence of the l-th feature of objects for the classifier; x = x 1 , x 2 , . . . , x d is the feature vector of some classified object x; A l k is the fuzzy term that characterizes the l-th feature in the k-th rule, k = 1 , K ¯ ; K is the number of rules that match the number of classes in the system under consideration; c k is the label of the k-th class . During the fuzzy classification process, an object belongs to each class with a certain degree of membership; it is calculated as follows:
β k = l = 1 d A l k x l .
In the present paper, the class label is assigned to an object according to the “winner-takes-all” principle, so the output of the classifier is the class label, which is defined as follows:
class = c k * , k * = arg max β k .
Thus, a fuzzy classifier can be represented as a function c = f x i , P * , where x i is the feature vector of the i-th object, and P * is the vector of parameters of a fuzzy classifier. P * is composed of all parameters of all fuzzy rules.
A single function is defined on a set of data instances x i , c i , i = 1 , N ¯ :
d e l t a i , P * = 1 , i f c i = f x i , P * 0 , else .
The numerical criterion of classification quality (classification accuracy) is expressed as follows:
A c c P * = i = 1 N d e l t a i , P * N .
The process of building a fuzzy classifier in this paper is similar to the one used in [15]. It consists of three sequential stages. The first step is to generate a database of fuzzy rules. The goal of the first step is to create a model of the classifier in the first (rude) approximation. The second step is the informative features selection for the classifier. The goal of the second step is to get rid of superfluous and insignificant features. The third step is to optimize the parameters of the fuzzy classifier. The goal of the third step is to fine-tune the classifier to achieve even greater classification accuracy.
The implementation of each step in the building of a fuzzy classifier is reduced to solving the optimization problem. Thus, metaheuristic algorithms can be used to perform these steps. These are stochastic optimization algorithms based on any natural phenomena [30]. In this paper, we consider the use of the whale optimization algorithm.

3.2. Description of WOA

WOA is a swarm intelligence algorithm based on the swarm behavior of humpback whales. Two behavioral mechanisms are used to simulate the movement of individuals (whales) in space. They update the individual position vector for each iteration. One mechanism is the narrowing of the prey environment. The other is the construction of a spiral bubble network to attack the prey. The first mechanism is the implementation of the stage of diversification. The second is the stage of intensification, in which the individuals tend to the optimum, moving along a spiral trajectory [30].
WOA execution sequence consists of the following steps. At the beginning, the population of individuals (i.e., solutions) is randomly initialized, and the best of them is determined. Then, at each iteration, all available solutions are adjusted according to behavioral mechanisms. The first mechanism is mainly used at the initial iterations. The second mechanism is used at the latest iterations. The best solution is determined at the end of the iterations. The result of the metaheuristics is the best solution found for the entire worktime of the algorithm. In addition, metaheuristics give a corresponding value of the fitness function.

3.3. Algorithms for Constructing a Fuzzy Classifier Based on WOA

3.3.1. Fuzzy Rules Generation Algorithm

As shown in Section 2.2, clustering algorithms are used to build IDS models that can detect unknown types of attacks. So, in this paper, the first stage of constructing a fuzzy classifier is performed using a clustering algorithm. In order for a metaheuristic such as WOA to solve a clustering problem, we need to combine metaheuristic execution with the execution of some clustering algorithm.
The K-means algorithm is the most common clustering algorithm [31]. This algorithm groups objects based on the values of their features into K disjoint clusters; they are represented in the algorithm by their centroids (points in the feature space near which data instances are grouped) [32,33].
The algorithm seeks to minimize the total dispersion of clusters points relative to clusters centroids:
k = 1 K x i C k x i C k 2 min , i = 1 , N ¯ , k = 1 , K ¯ ,
where x i = x i 1 , . . . , x i d is the i-th data instance (from the observation table), which is represented by a point in the d-dimensional real feature space; C k is centroid coordinates of k-th cluster; ‖•‖ denotes the metric, which is used to determine the distance between the instance and the centroid (usually the Euclidean distance is used as the metric); N is the number of instances in the dataset; K is the number of clusters.
The main idea of the algorithm is as follows: at each iteration, the instances are divided into clusters according to which of the new centroids was closer by the chosen metric (at the first iteration, the coordinates of the centroids are randomly generated). Then, the coordinates of the centroids are recalculated for each cluster, whose composition was determined in the previous step:
C k = x i C k x i / C k ,
where C k is the number of instances in k-th cluster. After executing (3), the iteration of the K-means algorithm ends. The algorithm terminates when there is no change in the distance in the current iteration.
The K-means algorithm is simple to implement and efficient for large datasets in terms of runtime. However, the algorithm has a few disadvantages: firstly, the number of clusters must be determined in advance; secondly, the result depends on the choice of the initial cluster centers, and their optimal choice is unknown; thirdly, it is not guaranteed to achieve the global minimum of the fitness function, but only one of the local minima.
To overcome the last two disadvantages of the K-means algorithm and to improve the clustering process itself, researchers create hybrid algorithms: they combine K-means with metaheuristics [34]. The first method is called “object–cluster association” [35]. Each solution to the clustering problem is shown through a matrix N × K whose elements contain integer or binary values; representation of the integer values depends on the metaheuristics and the optimization criterion. This approach was used in clustering based on evolutionary algorithms (in particular, genetic). However, it leads to two major drawbacks: the high cost of storage data and computation (especially for clustering large datasets) and the redundancy of information that the solution has.
The second method is the most common and better than the first one in terms of computational complexity: the solution is represented as a real vector, which contains the coordinates of the cluster centroids [36]. The solution P j , j = 1 , J ¯ , where J is the population size (the number of individuals), will represent the following vector:
P j = C 1 j , . . . , C K j , C k j = C k 1 j , . . . , C k d j ,
where C k l j is the l-th coordinate of k-th centroid in d-dimensional feature space as part of the j-th vector of the individual position, l = 1 , d ¯ .
The third method also uses centroids. However, here the solution to the clustering problem consists of all the individuals (rather than one individual): each individual is represented as one cluster centroid. The size of individual position vector P j coincides with the number of dimensions d, and the population size is equal to the number of clusters [37]. This method requires less memory and less calculation time compared to the first one. Its potential problem is that it cannot take full advantage, which is provided by the second method, namely, the parallel search for a solution by several agents. Therefore, in this paper, we use the second method of presenting the solution to the clustering problem in our hybrid clustering algorithm.
The original K-means algorithm does not allow working with empty clusters [33]. To ensure that clustering by K-means, which is combined with metaheuristic algorithm, does not break down, we can use various methods to determine the cluster artificially. For example, it is possible to regenerate the corresponding centroid randomly, or to replace it with a point corresponding to the data instance.
In this paper, the hybrid clustering algorithm is a combination of K-means and WOA. The iteration of such an algorithm consists of execution one iteration of the WOA, and then one iteration of the K-means. The fitness function will be the variance (2), and the solution P j will be represented as a vector (4).
The developed clustering algorithm based on K-means and WOA is presented as the following sequence of steps:
Step 1. Initialize the individuals position vectors P j in the representation format (4) randomly in the feature space.
Step 2. For each j-th solution, calculate the distance using the Euclidean metric between each data instance x i and each centroid C k extracted from the solution vector P j and assign each data instance to the nearest center.
Step 3. For each j-th solution, adjust the coordinates of the cluster centroids according to the Equation (3), then calculate the value of the fitness function (2) and save the best solution.
Step 4. Execute one iteration of the WOA over the entire population P of individuals.
Step 5. Perform Step 2.
Step 6. Perform Step 3.
Step 7. If the maximum number of iterations of the WOA is reached, go to step 8; otherwise, increase the value of the iteration counter t by one and go to step 4.
Step 8. Output the best solution found during the operation of the algorithm.
A pseudo-code of the developed clustering algorithm is shown in Algorithm 1.
Algorithm 1 The clustering algorithm based on K-means and WOA
Input: X (the set of objects); K; J; MaxIter (maximum number of iterations)
Output :   the   coordinates   of   K   centroids   C k   taken   from   the   best   solution   P c l u s t e r i n g
begin
Randomly   initialize   the   individuals   positions   P j , j = 1 , J ¯ , as the vector (4)
begin K-means iteration
for   j 1 to J do
for   i 1 to N do
for   k 1 to K do
Calculate   the   distance   using   the   Euclidean   metric   between   x i   and   centroid   C k j
end for
Assign   x i   to   the   nearest   cluster   center   C k j
end for
for   k 1 to K do
if ( C k j is not empty)
Adjust   the   coordinates   of   the   centroids   C k j according to the Equation (3)
else
Define   C k j   as   a   randomly   selected   data   instance   x i from X
end if
end for
Calculate   the   fitness   of   P j using Equation (2)
end for
end K-means iteration
Determine   and   memorize   the   best   solution   P c l u s t e r i n g   among   all   individuals   P j
while (t < MaxIter)
Execute one iteration of the WOA over the entire population P
Execute K-means iteration (given above)
Update   P c l u s t e r i n g if there is a better solution
t= t + 1
end while
end
The obtained coordinates of the centroids make it possible to determine the composition of the clusters. Each formed cluster corresponds to one fuzzy rule. The parameters of the resulting clusters become the parameters of the fuzzy rules; these parameters make up the vector P * . In this paper, the fuzzy classifier uses the symmetric Gaussian function as the membership function A l k , so the parameters of the rules are the mathematical expectation of the cluster (cluster centroid) and the standard deviation of the cluster instances for each feature.
However, the first disadvantage of the K-means algorithm (the number of clusters must be determined in advance) does not allow it to split the data into the optimal number of clusters: before applying the K-means algorithm, the parameter K is arbitrarily set from the outside by the experimenter. Here, optimal means the number of clusters are equal to the number of classes, into which the data instances are actually divided. The formed clusters correspond to the original classes in the case where K is optimal. The disadvantage becomes more important in real-world applications of clustering algorithms, when it is necessary to divide data instances into clusters and original classes are unknown (their number is unknown). In such cases, it is not always clear which value of K should be chosen in order to allow the resulting clusters (fuzzy rules) to classify objects with high accuracy. Therefore, this algorithm cannot determine the number of fuzzy classifier rules.
To determine the optimal number of clusters, we can calculate the value of the cluster validity index (or criterion) using the clustering results. The index is quality assessment of the clustering, which was executed at a given K: indexes are used not only to implement the clustering process, but also to determine the optimal number of clusters based on the results of clustering. The variance (1), in fact, is also one of the validity indices.
Since there is no best criterion for the quality of clustering, the construction of the optimal number of clusters and, as a result, the efficiency of the algorithm for forming the fuzzy rule base will depend on the validity index. Therefore, before implementing and testing the fuzzy rules base generation algorithm, it is necessary to determine the index, which will be used in it.
The validity criteria are divided into external and internal. The external indexes use preliminary information about the dataset to evaluate the result: the number of classes and what class the data instances belong to actually; they are used to select the best clustering results for a particular dataset [38]. The internal indexes use only information about the centroids and the composition of the found clusters; using this information, the indexes define the compactness of the clusters and the separability of the clusters from each other [39]. This advantage allows the algorithm to use them to determine the optimal number of fuzzy classifier rules.
In this paper, the Calinski–Harabasz index (CH) serves as a criterion of clustering quality [40]. The compactness value is based on the distance from the cluster points to their centroids, and the separability value is based on the distance from the cluster centroids to the global centroid:
CH = N K K 1 k = 1 K C k C k X k = 1 K x i C k x i C k 2 ,
where N is the number of instances in the dataset, and X is the centroid coordinates, which are calculated for the instances of the entire dataset. The maximum index value indicates the optimal number of clusters.
The solution to the problem of forming the fuzzy classifier rule base is reduced to the solution to the problem of constructing the (sub)optimal number of clusters. In order to solve this problem using the K-means algorithm, the following algorithm is proposed, based on the work of [41].
Step 1. Perform dataset preprocessing: normalize the features values of the data instances.
Step 2. Set the parameter K = 2—the number of clusters to divide the data into.
Step 3. Perform the previously described data clustering algorithm based on the K-means and WOA algorithms.
Step 4. Using the information about the formed clusters (such as the composition of the clusters and the coordinates of the cluster centroids), define the value of the validity index to assess the quality of the performed clustering; in this paper, the criterion (5) is used.
Step 5. After calculating the criterion, check whether K is equal to the maximum value. The maximum value of the parameter K is selected based on the characteristics of the classified dataset. If yes, go to step 6. Otherwise, increase the value of K by 1, and then go to step 3.
Step 6. After evaluating the clustering quality at the maximum K, compare the index values obtained at different values of the parameter K. The best value of the clustering quality index corresponds to the value of the K, which shows the optimal number of clusters.
Step 7. Generate fuzzy rules in an amount equal to the optimal number of built clusters (this number was found in the previous step). Each rule must correspond to one of the optimal clusters. The cluster parameters (mathematical expectation and standard deviation) become the rule parameters. The class label in the rule is determined by the majority principle: which class has the largest number of instances in the cluster corresponding to this rule, this class is set.
A pseudo-code of the developed fuzzy rule base generation algorithm is shown in Algorithm 2.
Algorithm 2 The fuzzy rules generation algorithm
Input: X; Y (set of labels); MaxClass (maximum number of classes)
Output: base, which are consisting of K fuzzy rules
begin
Normalize the features values of the data instances from X
for   K 2 to MaxClass do
Perform the clustering algorithm based on the K-means and WOA: Algorithm 1
Define the value of the validity index CH(K) using the equation (5)
Memorize the received index value CH(K) and the found centroids
end for
Determine the best found value of the quality index CH(K) (the maximum value of CH)
Define the optimal number of clusters K that is corresponding to the best CH(K) value
for   k 1 to K do
Define the mathematical expectation and stand. dev. of the k-th optimal cluster
Determine class label from Y set for the k-th optimal cluster by the majority principle
Generate the k-th fuzzy “IF-THEN” type rule using the found antecedents and consequent
end for
end

3.3.2. Feature Selection Algorithm

The next stage of the construction consists in informative features selection for the fuzzy classifier, whose structure was obtained at the previous stage. The original WOA searches for the optimum of the fitness function in the continuous search space; the solutions of the WOA are represented by a vector of real numbers. In order to get a solution in the form of a binary vector S, it is necessary to force metaheuristic to search for the optimum in the binary space, i.e., to perform binarization of the metaheuristic.
The authors of [42] investigate the performance of three versions of the binary WOA for feature selection using the wrapper scheme for the k Nearest Neighbor (k-NN) classifier. These algorithms use WOA in conjunction with mechanisms taken from GA: “Tournament” (WOA-T), “Roulette” (WOA-R), and Crossover and Mutation operators (WOA-CM). All of these approaches allow the metaheuristic algorithm to move from continuous values to binary values.
However, the application of the transfer function is a simpler approach to WOA binarization. The simplicity of using this approach is that the metaheuristic’s progress changes minimally. Such feature selection algorithm will be performed according to the wrapper scheme: the fitness function will be the classification accuracy (1) for a given set of features. The authors of [43,44] propose works about the WOA binarization for the feature selection using asymmetric and symmetric transfer functions and test their performance for k-NN classifier.
In this paper, the transfer function T(x) is the modulus of the error function [45]:
T ( x ) = e r f π 2 x .
Function (6) has a symmetric V-shape (Figure 1). This function has a narrower transition region (in other words, steeper descents) compared to other V-shaped functions, such as the hyperbolic tangent modulus [44] and the arctangent modulus [15].
If the binary optimization algorithm uses a V-shaped function T(x), then the update of the binary position vector of the j-th particle S j at iteration t + 1 should be as follows:
S j i t + 1 = 1 S j i t , if   r a n d < T P j i t + 1 S j i t , if   r a n d T P j i t + 1 , j = 1 , J ¯ , i = 1 , d ¯ ,
where S j i ( t ) is the i-th element of the binary position vector of the j-th individual in the previous iteration t; rand is a random number from the interval [0;1); P j i ( t + 1 ) is the i-th element of the real position vector of the j-th individual at the current iteration t + 1; d is the number of the feature space dimension.
In Equation (7), the element of the real position vector is used as the real argument of the transfer function. However, there is no contradiction here, since the following approach is adopted in this paper: after finding the value of the fitness function (classification accuracy) on a certain solution S j , the values of all elements of the binary vector S j (which is consisting of zeros and ones) are transferred to the corresponding vectors P j . Thus, binary values are interpreted as real values, and the operations of the WOA are executed on the real elements of vectors P j . After performing the WOA procedures, the real values of the vectors P j according to Equations (6) and (7) are used to obtain the binary elements of the vectors S j . This approach is used to force the elements of the position vector to take values that are in the transition zone of the transfer function.
As can be seen from formula (7), the V-shaped function for each binary element determines the condition under which its value will change to the opposite. If the real element value of the position vector P j i , that corresponds to the binary element S j i , is small enough, then S j i does not change its value. At the same time, if the value P j i is high enough, then the individual must make a “significant” movement in the space, changing the value of the S j i to the opposite. The S-shaped function, in contrast to the V-shaped, defines the conditions for the element S j i to accept the zero and one values [46].
In the traditional version of the transfer functions, the argument of these functions is the real value of the velocity vector element [46] instead of the position vector, as described in (7). The use of the position vector is acceptable [45] and is justified by the fact that the WOA does not have an operation for calculating the velocity vector.
Therefore, the feature selection algorithm for a fuzzy classifier based on WOA is reduced to the following sequence of steps:
Step 1. Initialize the binary position vectors S j of population’s individuals randomly.
Step 2. On each j-th solution, find the value of the fitness function, i.e., the classification accuracy (specify to a fuzzy classifier with an already formed database the features, which are used for classification, from j-th solution), and determine the best solution among all individuals of the population.
Step 3. Determine the real position vectors P j by copying the elements from S j to P j . Ones and zeros as part of the solution vectors P j become real numbers.
Step 4. Update the position vectors P j of the population’s individuals by executing one iteration of the continuous WOA.
Step 5. For each position vector P j , check whether any real element P j i t + 1 of this vector does not extend beyond the transfer function domain, which must correspond to the transition zone of the function. To indicate the limits of the transition zone, accept the following domain of the transfer function: P j i t + 1 6 ; 6 . If such an element is found, it is necessary to replace it with the value of the nearest boundary of the domain (minus six or six).
Step 6. Using the real values of the vectors P j elements, determine the new binary values of the vectors S j elements in accordance with the rule of changing the value of the binary element (7). After determining the vectors S j , find the best binary solution (to do this, check the accuracy of the classification for all solutions S j ).
Step 7. If the number of iterations t of the algorithm has not reached the maximum, go to step 3, otherwise go to step 8.
Step 8. Output the best binary solution, which was found during the execution of the algorithm, and the corresponding value of the fitness function (classification accuracy).
A pseudo-code of the developed feature selection algorithm for fuzzy classifier is shown in Algorithm 3.
Algorithm 3 The feature selection algorithm based on WOA
Input: train data; J; MaxIter (maximum number of iterations)
Output :   the   best   solution   vector   S that indicates the subset of informative features
begin
Initialize   the   binary   individuals   positions   vectors   S j = s j 1 , s j 2 , . . . s j d , j = 1 , J ¯ randomly
Calculate   the   fitness   ( 1 )   of   each   binary   solution   S j
Determine   and   memorize   the   best   solution   S   among   all   individuals   S j
while (t < MaxIter)
Determine   the   real   position   vectors   P j   by   copying   the   elements   from   S j to P j
Update   the   position   vectors   P j by executing one iteration of the continuous WOA
Check   if   any   solution   P j goes beyond the search space and amend it if necessary
Determine   the   new   binary   values   of   the   vectors   S j elements using the Equations (7) and (6)
Calculate   the   fitness   ( 1 )   of   each   update   binary   solution   S j
Update S if there is a better solution
t = t + 1
end while
end

3.3.3. Algorithm for Optimizing Parameters of Fuzzy Classifier

At the last stage of building, a fine-tuning of the classifier is performed: the values of the fuzzy rules’ parameters (mathematical expectations and standard deviations of clusters) related only to the selected features are adjusted to achieve even greater classification accuracy. The solution is represented as a vector P * , which contains all the parameters for the selected features from all the fuzzy rules. To optimize the parameter values (the vector P * elements), we can apply WOA without any changes.
Thus, the three stages of constructing a fuzzy classifier, which is the main component of IDS, correspond to the implementation of three algorithms based on WOA: the optimal number of clusters construction algorithm, a features selection algorithm according to the wrapper scheme, and a continuous algorithm for optimizing parameters of fuzzy classifier. Figure 2 explains the workflow of a fuzzy classifier building process, which is considered in this article.

4. Results

The performance of the fuzzy classifier constructed using the three above-described algorithms was evaluated on a dataset KDD Cup 1999. This dataset contains information about different network connections; the dataset was taken from the KEEL repository (the reference is provided at the end of the article). The choice of this dataset is conditioned by the fact that it is a generally recognized means of testing various approaches to the construction of IDS, and this dataset is often used to compare the effectiveness of classifiers of various types.
Table 1 describes the features that are defined in the original KDD Cup 1999 dataset. Forty-one features describe each instance (network connections) of the original dataset, and the instances are divided into twenty-two classes of network attacks and one class of normal connections. There are 494,020 instances in the KDD Cup 1999 dataset. It was decided to truncate the second (protocol_type, Atr-1), third (service, Atr-2), and fourth (flag, Atr-3) categorical features from original dataset to facilitate the process of calculations during the experiment. In addition, only two classes were defined in this dataset: network attacks and normal connections. These simplifications are acceptable because the KDD Cup 1999 is characterized by an imbalance (the quantity of data instances of one class is not comparable to the quantity of instances of another).
The maximum number of clusters in the experiment was equal to the actual number of clusters multiplied by five (i.e., ten clusters). The experiment was performed according to the fivefold cross-validation scheme; the number of runs was three.
The experiments was conducted using the Microsoft Visual Studio 2017 on a single personal computer with the Windows 10 operating system (1.8 GHz Intel Core i7-4500U CPU and 6 GB RAM).
Table 2 shows the results of constructing the fuzzy classifier on subsamples of the KDD Cup 1999 dataset as an example of a gradually improvement of classification accuracy. In addition, here are the values of the type I and II errors (false positives and false negatives) and execution time of classifier construction algorithms.
Table 3 contains the average performance of the fuzzy classifier, which was built using the proposed algorithms, in comparison to the following classification methods: the fuzzy classifier based on BHS and DE algorithms [17]; the Gaussian Process method (GP-mt) [47]; the Multi-Layer Perceptron (MLP) neural network method [48]; the combination of Classification based on Predictive Association Rules method (CPAR) and MLP neural network (CPAR/MLP) [48]; the methods PKID + Cons + FVQIT and EMD + Cons + FVQIT based on information theory (“Cons” means Consistency-based filter) [26]; the k-NN method [25]; the AP clustering method [25]. Each of these classifiers was built on the KDD Cup 1999 dataset. The Table 2 shows average results only obtained on the test samples.

5. Discussion

The results of building the fuzzy classifier for detecting network attacks using the developed algorithms on the KDD Cup dataset, such as classification accuracy and type I and II errors, show that the created classifiers can be used in IDS to determine the legitimacy of network traffic, and their performance is at the level of known analogs. High classification accuracy is achieved mainly due to the first and second stages of construction, namely, due to the use of symmetric functions: the membership Gaussian function and the V-shaped transfer function.
The number of rules according to the results of the fuzzy rules generation algorithm based on WOA is more than the original number of classes (there were two classes in total: attacks and normal connections). Increasing the number of rules is related to the used dataset: uneven distribution of this data and the difficulty of defining the boundaries of decision-making between normal and abnormal behavior in the network bowed to the formation of the fuzzy rules with the same class labels and different interpretation at the same time. At the second stage of construction, the feature selection algorithm significantly reduces the set of used features: on average, the algorithm leaves eight-and-four-tenths features instead of thirty-eight. The fuzzy classifier parameters optimization algorithm at the third stage of building does not significantly affect the increase of classification accuracy: it is difficult for the WOA to find the optimum in the search space with a relatively large dimension and a small number of iterations.
The building of a fuzzy classifier using the KDD Cup 1999 dataset shows the computational time of the WOA-based fuzzy classifier parameters optimization algorithm is natural. The more complex the fuzzy system turns out to be (the more rules and selected features), the longer the execution of this algorithm takes. The computational time values of the other two WOA-based algorithms (fuzzy rules generation and feature selection) do not form any regularity. These algorithms always run in the original d-dimensional search space. Therefore, their execution time depends on how quickly they converged to the optimum and how close they were to it. The computational time of the feature selection algorithm does not exceed two minutes. The computational execution time of the fuzzy rule generation algorithm can reach approximately two and a half hours.

6. Conclusions

In this work, an approach based on a fuzzy classifier to the creation of network intrusion detection systems was proposed. The fuzzy classifier construction procedure is the sequential execution of three algorithms: a fuzzy rules generation algorithm, which uses the Calinski–Harabasz cluster validity index and a hybrid clustering algorithm based on the whale optimization algorithm/K-means algorithm; an informative feature selection algorithm using the binary WOA; a fuzzy classifier parameters optimization algorithm based on the continuous WOA. An experimental building of a fuzzy classifier for detecting network intrusions was implemented using the KDD Cup 1999 dataset. The results of the experiment confirm the effectiveness of the proposed method. In this work, changes in the parameters of the algorithms for building a fuzzy classifier are permissible if these changes entail a decrease of the type I and II errors.
In the future, it is planned to conduct a study that consists in the construction of a fuzzy classifier using a more up-to-date dataset, for example, UNSW-NB15 [49], ISCX 2012 [50], CSE-CIC-IDS2018 [50], or ADFA-LD [51].

Author Contributions

Conceptualization, I.H. and N.K.; methodology, I.H.; software, N.K.; validation, I.H. and N.K.; formal analysis, I.H.; investigation, N.K.; resources, A.S.; data curation, N.K.; writing—original draft preparation, N.K.; writing—review and editing, I.H.; visualization, I.H.; supervision, A.S.; project administration, A.S. All authors have read and agreed to the published version of the manuscript.

Funding

This research was funded by the Ministry of Science and Higher Education of the Russian Federation within the framework of scientific projects carried out by teams of research laboratories of educational institutions of higher education subordinate to the Ministry of Science and Higher Education of the Russian Federation, project no. FEWM-2020-0042.

Institutional Review Board Statement

Not applicable.

Informed Consent Statement

Not applicable.

Data Availability Statement

The KDD Cup 1999 dataset was taken from the KEEL repository: https://sci2s.ugr.es/keel/dataset.php?cod=196 (accessed on 17 May 2021).

Conflicts of Interest

The authors declare no conflict of interest.

References

  1. Cavusoglu, U. A new hybrid approach for intrusion detection using machine learning methods. Appl. Intell. 2019, 49, 2735–2761. [Google Scholar] [CrossRef]
  2. Zamani, M.; Movahedi, M. Machine Learning Techniques for Intrusion Detection. arXiv, 2013; arXiv:1312.2177. [Google Scholar]
  3. Elhag, S.; Fernandez, A.; Bawakid, A.; Alshomrani, S.; Herrera, F. On the combination of genetic fuzzy systems and pairwise learning for improving detection rates on intrusion detection systems. Expert Syst. Appl. 2015, 42, 193–202. [Google Scholar] [CrossRef]
  4. Azad, C.; Jha, V.K. Fuzzy min–max neural network and particle swarm optimization based intrusion detection system. Microsyst. Technol. 2017, 23, 907–918. [Google Scholar] [CrossRef]
  5. Bardamova, M.; Konev, A.; Hodashinsky, I.; Shelupanov, A. Application of the Gravitational Search Algorithm for Constructing Fuzzy Classifiers of Imbalanced Data. Symmetry 2019, 11, 1458. [Google Scholar] [CrossRef] [Green Version]
  6. Al-Akhras, M.; Alawairdhi, M.; Alkoudari, A.; Atawneh, S. Using machine learning to build a classification model for iot networks to detect attack signatures. Int. J. Comput. Netw. Commun. (IJCNC) 2020, 12, 99–116. [Google Scholar] [CrossRef]
  7. Kuang, F.; Xu, W.; Zhang, S. A novel hybrid KPCA and SVM with GA model for intrusion detection. Appl. Soft Comput. 2014, 18, 178–184. [Google Scholar] [CrossRef]
  8. Osareh, A.; Shadgar, B. Intrusion Detection in Computer Networks based on Machine Learning Algorithms. Int. J. Comput. Sci. Netw. Secur. (IJCSNS) 2008, 8, 15–23. [Google Scholar]
  9. Kaja, N.; Shaout, A.; Ma, D. An intelligent intrusion detection system. Appl. Intell. 2019, 49, 3235–3247. [Google Scholar] [CrossRef]
  10. Haghnegahdar, L.; Wang, Y. A whale optimization algorithm-trained artificial neural network for smart grid cyber intrusion detection. Neural Comput. Appl. 2020, 32, 9427–9441. [Google Scholar] [CrossRef]
  11. Mekh, M.A.; Hodashinsky, I.A. Comparative analysis of differential evolution methods to optimize parameters of fuzzy classifiers. J. Comput. Syst. Sci. Int. 2017, 56, 616–626. [Google Scholar] [CrossRef]
  12. Alcala-Fdez, J.; Alcala, R.; Herrera, F. A fuzzy association rule-based classification model for high-dimensional problems with genetic rule selection and lateral tuning. IEEE Trans. Fuzzy Syst. 2011, 19, 857–872. [Google Scholar] [CrossRef] [Green Version]
  13. Fazzolari, M.; Alcala, R.; Herrera, F. A multi-objective evolutionary method for learning granularities based on fuzzy discretization to improve the accuracy-complexity trade-off of fuzzy rule-based classification systems: D-MOFARC algorithm. Appl. Soft Comput. 2014, 24, 470–481. [Google Scholar] [CrossRef]
  14. Elhag, S.; Fernandez, A.; Altalhi, A.; Alshomrani, S.; Herrera, F. A multi-objective evolutionary fuzzy system to obtain a broad and accurate set of solutions in intrusion detection systems. Soft Comput. 2019, 23, 1321–1336. [Google Scholar] [CrossRef]
  15. Bardamova, M.; Konev, A.; Hodashinsky, I.; Shelupanov, A. A Fuzzy Classifier with Feature Selection Based on the Gravitational Search Algorithm. Symmetry 2018, 10, 609. [Google Scholar] [CrossRef] [Green Version]
  16. Bardamova, M.; Konev, A.; Hodashinsky, I.; Shelupanov, A. Gravitational search for designing a fuzzy rule-based classifiers for handwritten signature verification. J. Commun. Softw. Syst. 2019, 15, 254–261. [Google Scholar] [CrossRef]
  17. Hodashinsky, I.A.; Mech, M.A. Constructing a fuzzy network intrusion classifier based on differential evolution and harmonic search. Int. J. Comput. Netw. Commun. (IJCNC) 2018, 10, 85–91. [Google Scholar]
  18. Abraham, A.; Das, S.; Roy, S. Swarm intelligence algorithms for data clustering. In Soft Computing for Knowledge Discovery and Data Mining, 1st ed.; Maimon, O., Rokach, L., Eds.; Springer: Boston, MA, USA, 2008; pp. 279–313. [Google Scholar]
  19. Li, Y.; Shang, Y.; Yang, Y. Clustering coefficients of large networks. Inf. Sci. 2017, 350–358, 382–383. [Google Scholar] [CrossRef]
  20. Shang, Y. Resilient group consensus in heterogeneously robust networks with hybrid dynamics. Math. Methods Appl. Sci. 2021, 44, 1456–1469. [Google Scholar] [CrossRef]
  21. Shafiq, A.; Gillian, D.; Saeed, U.R. Analysis of particle swarm optimization based hierarchical data clustering approaches. Swarm Evol. Comput. 2015, 25, 36–51. [Google Scholar]
  22. Xu, R.; Wunsch, D.C., II. Clustering, 1st ed.; John Wiley & Sons, Inc.: Hoboken, NJ, USA, 2009; p. 357. [Google Scholar]
  23. Gupta, R.; Muttoo, S.K.; Pal, S.K. Fuzzy C-Means Clustering and Particle Swarm Optimization based scheme for Common Service Center location allocation. Appl. Intell. 2017, 47, 624–643. [Google Scholar] [CrossRef]
  24. Jagannath, N.S.; Ganapati, P. A survey on nature inspired metaheuristic algorithms for partitional clustering. Swarm Evol. Comput. 2014, 16, 1–18. [Google Scholar]
  25. Wang, W.; Guyet, A.T.; Quiniou, R.; Cordier, M.O.; Masseglia, F.; Zhang, X. Autonomic intrusion detection: Adaptively detecting anomalies over unlabeled audit data streams in computer networks. Knowl. Based Syst. 2014, 70, 103–117. [Google Scholar] [CrossRef] [Green Version]
  26. Porto-Dıaz, L.; Martınez-Rego, D.; Alonso-Betanzos, A.; Fontenla-Romero, O. Combining Feature Selection and Local Modelling in the KDD Cup 99 Dataset. In Artificial Neural Networks—ICANN 2009; Lecture Notes in Computer Science; Alippi, C., Polycarpou, M., Panayiotou, C., Ellinas, G., Eds.; Springer: Berlin/Heidelberg, Germany, 2009; Volume 5768, pp. 824–833. [Google Scholar]
  27. Liu, H.; Yu, L. Toward Integrating Feature Selection Algorithms for Classification and Clustering. IEEE Trans. Knowl. Data Eng. 2005, 17, 491–502. [Google Scholar]
  28. Kohavi, R.; John, G.H. Wrappers for feature subset selection. Artif. Intell. 1997, 97, 273–324. [Google Scholar] [CrossRef] [Green Version]
  29. Vijayanand, R.; Devaraj, D. A Novel Feature Selection Method Using Whale Optimization Algorithm and Genetic Operators for Intrusion Detection System in Wireless Mesh Network. IEEE Access 2020, 8, 56847–56854. [Google Scholar] [CrossRef]
  30. Mirjalili, S.; Lewis, A. The Whale Optimization Algorithm. Adv. Eng. Softw. 2016, 95, 51–67. [Google Scholar] [CrossRef]
  31. Deb, S.; Tian, Z.; Fong, S.; Wong, R.; Millham, R.; Wong, K.K.L. Elephant search algorithm applied to data clustering. Soft Comput. 2018, 22, 6035–6046. [Google Scholar] [CrossRef]
  32. Lloyd, S.P. Least Squares Quantization in PCM. IEEE Trans. Inf. Theory 1982, 28, 129–137. [Google Scholar] [CrossRef]
  33. MacQueen, J. Some methods for classification and analysis of multivariate observations. In Proceedings of the Fifth Berkeley Symposium on Mathematical Statistics and Probability, Davis, CA, USA, 21 June–18 July 1965; Le Cam, L.M., Neyman, J., Eds.; University of California Press: Berkeley, CA, USA, 1967; Volume 1, pp. 281–296. [Google Scholar]
  34. Niu, B.; Duan, Q.; Liu, J.; Tan, L.; Liu, Y. A population-based clustering technique using particle swarm optimization and k-means. Nat. Comput. 2017, 16, 45–59. [Google Scholar] [CrossRef]
  35. Das, S.; Abraham, A.; Konar, A. Automatic clustering using an improved differential evolution algorithm. IEEE Trans. Syst. Man Cybern. 2008, 38, 218–237. [Google Scholar] [CrossRef]
  36. Chen, C.Y.; Fun, Y. Particle swarm optimization algorithm and its application to clustering analysis. In Proceedings of the 2004 IEEE International Conference on Networking, Sensing & Control, Taipei, Taiwan, 21–23 March 2004; pp. 789–794. [Google Scholar]
  37. Merwe, D.W.; Engelbrecht, A.P. Data clustering using particle swarm optimization. In Proceedings of the 2003 Congress on Evolutionary Computation, 2003. CEC’03, Canberra, ACT, Australia, 8–12 December 2003; Volume 1, pp. 215–220. [Google Scholar]
  38. Alok, A.K.; Saha, S.; Ekbal, A. Development of An External Cluster Validity Index using Probabilistic Approach and Min-max Distance. Int. J. Comput. Inf. Syst. Ind. Manag. Appl. 2014, 6, 494–504. [Google Scholar]
  39. Charrad, M.; Ghazzali, N.; Boiteau, V.; Niknafs, A. NbClust: An R Package for Determining the Relevant Number of Clusters in a Data Set. J. Stat. Softw. 2014, 61, 1–36. [Google Scholar] [CrossRef] [Green Version]
  40. Arbelaitz, O.; Gurrutxaga, I.; Muguerza, J.; Perez, J.M.; Perona, I. An extensive comparative study of cluster validity indices. Pattern Recognit. 2013, 46, 243–256. [Google Scholar] [CrossRef]
  41. Yaru, W.; Shihong, Y.; Zhenhua, H.; Mingliang, D.; Jia, L. An unsupervised and robust validity index for clustering analysis. Soft Comput. 2019, 23, 10303–10319. [Google Scholar]
  42. Mafarja, M.; Mirjalili, S. Whale optimization approaches for wrapper feature selection. Appl. Soft Comput. 2018, 62, 441–453. [Google Scholar] [CrossRef]
  43. Hussien, A.G.; Hassanien, A.E.; Houssein, E.H.; Bhattacharyya, S.; Amin, M. S-shaped Binary Whale Optimization Algorithm for Feature Selection. Adv. Intell. Syst. Comput. 2019, 727, 79–87. [Google Scholar]
  44. Hussien, A.G.; Houssein, E.H.; Hassanien, A.E. A binary whale optimization algorithm with hyperbolic tangent fitness function for feature selection. In Proceedings of the 2017 Eighth International Conference on Intelligent Computing and Information Systems (ICICIS), Cairo, Egypt, 5–7 December 2017; pp. 166–172. [Google Scholar]
  45. Mirjalili, S.; Lewis, A. S-shaped versus V-shaped transfer functions for binary particle swarm optimization. Swarm Evol. Comput. 2013, 9, 1–14. [Google Scholar] [CrossRef]
  46. Saremi, S.; Mirjalili, S.; Lewis, A. How important is a transfer function in discrete heuristic algorithms. Neural Comput. Appl. 2014, 26, 625–640. [Google Scholar] [CrossRef] [Green Version]
  47. Faraoun, K.M.; Boukelif, A. Genetic Programming Approach for Multi-category Pattern Classification Applied to Network Intrusions Detection. Int. J. Comput. Electr. Autom. Control. Inf. Eng. 2007, 1, 3098–3109. [Google Scholar] [CrossRef] [Green Version]
  48. Sheikhan, M.; Jadidi, Z. Misuse Detection Using Hybrid of Association Rule Mining and Connectionist Modeling. World Appl. Sci. J. 2009, 7, 31–37. [Google Scholar]
  49. UNSW Sydney. Available online: https://research.unsw.edu.au/projects/unsw-nb15-dataset (accessed on 3 June 2021).
  50. University of New Brunswick. Canadian Institute for Cybersecurity. Available online: https://www.unb.ca/cic/datasets/ids.html (accessed on 3 June 2021).
  51. GitHub. Available online: https://github.com/verazuo/a-labelled-version-of-the-ADFA-LD-dataset (accessed on 3 June 2021).
Figure 1. Graph of the V-shaped symmetric transfer function (6).
Symmetry 13 01211 g001
Figure 2. The flowchart of creating a fuzzy classifier process.
Symmetry 13 01211 g002
Table 1. Features defined in KDD Cup 1999 dataset.
Feature GroupFeature Names and Numbers (the Number Is Shown in Round Brackets)
TCP featuresduration (1), protocol_type (2), service (3), flag (4), src_bytes (5), dst_bytes (6), land (7), wrong_fragment (8), urgent (9)
Features of connecting to a domainhot (10), num _failed_logins (11), logged_in (12), num_compromised (13), root_shell (14), su_attempted (15), num_root (16), num_file_creations (17), num_shells (18), num_access_files (19), num_outbound_cmds (20), is_hot_login (21), is_guest_login (22)
Features received in the two-second intervalcount(23), srv_count (24), serror_rate (25), srv_serror_rate (26), rerror_rate (27), srv_rerror_rate (28), same_srv_rate (29), diff_srv_rate (30), srv_diff_host_rate (31), dst_host_count (32), dst_host_srv_count (33), dst_host_same_srv_rate (34), dst_host_diff_srv_rate (35),dst_host_same_src_port_rate (36), dst_host_srv_diff_host_rate (37),
dst_host_serror_rate (38), dst_host_srv_serror_rate (39),
dst_host_rerror_rate (40), dst_host_srv_rerror_rate (41)
Table 2. Examples of gradually construction of the fuzzy classifier based on KDD Cup 1999 dataset using WOA.
Creating Fuzzy RulesMembership Function: Gaussian Function (Two Parameters: the Expected Value and Standard Deviation); Population Size: 50; Number of Iterations: 250; Generated up to 10 Clusters; Actual Number of Classes: 2 (Attacks and Normal Connections).
Number of generated rules764397
Accuracy (tran.), %98.75098.60098.10091.97598.82597.950
Accuracy (test.), %98.20098.40098.00092.50098.30097.600
Computational time, s827586288832845383448918
Feature SelectionPopulation size: 30; quantity of iterations: 100.
Number of selected features979563
Solution vector (feature numbers according to KEEL)5, 6, 8, 11, 13, 16, 28, 34, 386, 7, 22, 25, 34, 40, 411, 11, 13, 21, 29, 31, 32, 36, 371, 5, 18, 32, 366, 14, 23, 26, 37, 406, 29, 36
Accuracy (tran.), %99.15099.30098.82598.55099.12599.050
Accuracy (test.), %99.20099.50098.50098.40099.00098.700
Type I errors(tran.), %1.5250.7620.5081.5250.2541.525
Type I errors(test.), %0.0000.0001.5231.5230.0002.030
Type II errors(tran.), %0.6850.6851.3381.4321.0270.809
Type II errors(test.), %0.9960.6231.4941.6191.2451.121
Computational time, s119108941069192
Fine-tuning the fuzzy classifierPopulation size: 30; quantity of iterations: 500.
Accuracy (tran.), %99.32599.30098.87598.72599.40099.050
Accuracy (test.), %99.10099.50098.60098.50099.30098.700
Type I errors(tran.), %0.7620.7620.5080.2540.2541.525
Type I errors(test.), %0.0000.0001.0150.5080.0002.030
Type II errors(tran.), %0.6560.6851.2761.5250.6850.809
Type II errors(test.), %1.1210.6231.4941.7430.8721.121
Computational time, s817763590364841658
Table 3. Average performance values of analogs of network attack classifiers.
ClassifierType I Errors (Test), %Type II Errors (Test), %Number of Selected Features
Fuzzy Classifier + WOA (proposed method)0.921.078.4
Fuzzy Classifier + BHS + DE1.210.3910
GP-mt2.000.0741
MLP1.495.2916
CPAR/MLP1.584.8616
PKID + Cons + FVQIT7.270.486
EMD + Cons + FVQIT5.51.547
k-NN1.221.641
AP1.011.641
Publisher’s Note: MDPI stays neutral with regard to jurisdictional claims in published maps and institutional affiliations.

