Article

Route Configuration Method for Highway Passenger Hubs from the Perspective of Transportation Integration: A Case Study of Nanjing, China

1
School of Transportation, Southeast University, No. 2 Dongnandaxue Road, Nanjing 211189, China
2
College of Automobile and Traffic Engineering, Nanjing Forestry University, No.159 Longpan Road, Nanjing 210037, China
*
Author to whom correspondence should be addressed.
Symmetry 2020, 12(7), 1194; https://doi.org/10.3390/sym12071194
Submission received: 17 June 2020 / Revised: 9 July 2020 / Accepted: 15 July 2020 / Published: 19 July 2020
(This article belongs to the Section Computer)

Abstract

:
As a result of transportation integration, the role of highway passenger transport hubs has changed dramatically; these nodes act as important links to construct a seamless regional comprehensive passenger transport system which reflects the coordination and symmetry of public transportation and the integrated transportation system. In order to optimise the efficiency of transportation organisation and improve the quality of passenger transport services, in this study we developed an optimisation method for the allocation of passenger transport hubs based on the analysis of passenger flow demand and spatial distribution. Configuration models of the departure sites of single-station and multi-station hub lines were established according to the service scope of the stations and the relative generalised travel cost, respectively. The overall optimisation method of the route allocation scheme was proposed by checking and optimising the passenger volume of each station. The developed methodology was successfully validated by applying it to the highway passenger transport hub system of Nanjing, China. The proposed methodology is expected to help management agencies and business operators to optimise existing highway passenger bus lines, thereby improving the quality of their services.

1. Introduction

The propulsion of urbanisation and urban modernisation has strengthened the interaction of urban agglomeration within and between regions. With the rapid development of intercity economic exchanges and the gradual deepening of economic interdependence, significant amounts of external passenger flow and traffic have emerged. Integrated transportation promotes the reconstruction of hub systems and forms the integrated transportation pattern of comprehensive hubs, while the integrated transportation system coordinates well with the public transportation and shows a high symmetry. The role of highway transport has changed dramatically; the effective improvement of the design and distribution of urban highway passenger transportation systems has become an important problem in the process of economic and social development [1].
Highway transportation, which presents the advantages of wide network coverage, flexibility, simplicity, convenience, and door-to-door characteristics, is increasingly becoming the main alternative for commuting within and between regions. Highway passenger transport is an important part of China’s comprehensive transportation system, which has long occupied a leading position in the passenger transport market. In 2019, China had a total road length and density of 5.0125 million km and 52.21 km/100 km2, respectively; moreover, the highway passenger traffic volume for business purposes reached 13.012 billion, and the highway passenger traffic turnover was 885.708 billion person-kilometres [2]. As important node of the highway transportation network, highway passenger transport hubs, plays an important role in passenger travel organisation, transfer, transportation service, etc. Within the highway passenger transport hub, passenger transport lines are important components that run through the road passenger transport network, which acts as the link between the various elements [3].
Highway passenger lines are the legal basis for the operation of passenger transport vehicles and are important resources and intangible assets of passenger transport enterprises. Highway passenger line allocation refers to the appropriate allocation of line resources between passenger stations, considering the scope of the service, which renders the line convenient for passenger travel; the operation organisation of transportation enterprises; and cost reduction for the whole society. The allocation of routes is related to the operation efficiency of passenger transport hubs and passenger transport enterprises. In order to optimise the efficiency of transportation organisation and improve the quality of passenger transport services, it is necessary to develop an optimisation method for the allocation of passenger transport hubs. In addition, the excellent configuration of highway passenger transport hubs promotes the exploitation and development of the surrounding areas, strengthens the economic radiation of cities to such areas, and improves the region’s competitiveness and cooperation intensity.

2. Literature Review

The rapid development of highway infrastructure has promoted the large-scale construction of passenger hubs. Hub systems have been planned and constructed in developed countries for a long time; moreover, the intercity passenger transport system has been studied since the 1930s. Therefore, the available research on the transfer efficiency of transportation hubs [4], the optimisation of the layout of building facilities [5], and the reasonable allocation of transportation equipment [6] is increasing rapidly. In China, highway planning and construction have been performed since the 1980s, in which the study of passenger flow, macro hub selection, and transfer organisation plays an important role. With rapid urbanisation, the constituent of integrated urban and rural passenger transportation has been proposed, and contributes to increasing the amount of relevant research on the layout of integrated hubs [7,8].
Route optimisation has been an important part of the planning and design of passenger hubs. Many studies have been conducted to the optimise passenger routes and networks; four passenger transport types have been investigated in these studies: integrated, urban, suburban, and a type related to electric vehicles and big data. The route configuration models proposed in comprehensive transportation network design research works are based on the minimum cost theory, the large-scale city line allocation method, and the micro-optimisation method [9,10,11,12]. Abramović et al. [9] presented a possible solution for integrated passenger transport organisation on the Zagreb–Velika Gorica route, with the emphasis on connecting the Velika Gorica railway station to the town of Velika Gorica. A simple but sparse network of direct and frequent services was designed in Melbourne, Australia [10]. Narayan et al. [11] proposed a multimodal route choice and assignment model that allows users to combine fixed and flexible public transport or to use them as individual modes, while the demand for these services is endogenously determined.
Considering the natural resource areal limitations when developing an urban public transport route network, abundant studies have focused on improving the efficiency of public transportation using mathematical statistical methods [12]. Wang et al. [13] proposed a mixed-integer second-order cone program to assign bus routes to different boarding locations, thereby avoiding the bus route clustering problem in the city of Hong Kong. Two mathematical models were proposed to optimise the route network redesign without a major overhaul of the existing network in Delhi, India [14]. An algorithm for designing an optimal suburban route network was applied to the existing suburban route network of Chernihiv–Horodnya [15]. The abundant research on the optimisation of integrated and urban passenger transit networks indicates that studies focusing on the suburban route network, digital infrastructure, and electric vehicles constitute a new trend and present diverse research results [16,17,18,19,20,21].
Based on the high demand of highway passenger transport in China, further studies have been conducted regarding the operation organisation of the routes with highway passenger hubs. Some scholars analysed the benefits and shortages of highway passenger lines when operated by public transport companies with intensive management [22,23]. Existing studies focus on the optimisation of traditional highway passenger hub organisation and route configuration; however, they do not provide an adequate response to the transportation organisation needs and capacity allocation methods originating from the new situations of multipoint distribution organisation, public rail combined transport, the internet, and other new situations. To fill these important research gaps, this study focused on the planning of passenger lines against the background of comprehensive passenger hub construction and the integrated development of urban and rural passenger transportation. Specifically, a route configuration method for highway passenger hubs was proposed to perform systematic capacity allocation and transportation organisation optimisation. Finally, the proposed methodology was applied to the city of Nanjing, China.

3. Methodology

3.1. Configuration Model of the Departure Site of Single-Station Hub Lines

3.1.1. Configuration Process of the Departure Site of the Line

In the configuration of urban highway passenger transport hubs, the first step is to select a reasonable departure station in the hub system—that is, to configure the departure station. During this step, the following four goals need to be achieved: to meet the travel demand of road passengers, to reduce passengers’ relative generalised travel cost, to control the impact of road passenger transport on urban traffic operation, and to make intensive and efficient use of various resources and energy.
The overall process of passenger transport hub allocation is shown in Figure 1. Firstly, the operation status of the hub is analysed according to the passenger flow demand and transportation system supply. Secondly, the passenger flow demand and passenger flow distribution characteristics of the line type are predicted based on the historical passenger flow data, future transport conditions and the changes in passenger choice intention. Thirdly, according to the number of departure stations required by the line, the line is categorised as a single-station hub line or a multi-station hub line; for multi-station hub lines, the starting point selection is based on two steps: preliminary station selection and micro-optimisation. Fourthly, the final operation scheme of the station is determined according to the two types of passenger flow service areas. Finally, after obtaining the starting point locations of all the lines, the overall optimisation is performed according to the operational objectives to ensure the coordination of the system.
Considering the characteristics of passenger flow demand and its spatial distribution, the lines are divided into two categories, as mentioned previously (Table 1). Then, the starting sites are determined for the different types of lines. When the passenger flow demand is high and the spatial distribution is scattered, the multi-station hub mode is adopted; if the passenger flow distribution is concentrated or the passenger flow demand is low, the single-station hub mode is adopted.

3.1.2. Configuration Method of Single-Station Hub Line Departure Stations

In the determination of the departure site of single-station hub lines, the service scope of the hub and the line type need to be considered. This process is performed as follows.
(1) 
Determine the scope of hub’s services:
The different modes of transportation adopted by the passengers arriving at the station correspond to the different service radii of the station. The weighted average of the maximum service radius of the different connection modes is calculated to obtain the service range of the hub. The travel distance affects the passenger’s choice of travel mode; as the passenger connection distance between highway passenger terminals is generally long, a significant number of passengers choose to use public transport. The calculation method of service radius is as follows.
Step 1: Calculate the initial value of the radius of service using Equation (1).
R 0 = i = 1 n p i 0 · v i · t b ,
where R 0 is the initial value of the radius of service (m). p i 0 is the initial proportion of travel mode i , which was adopted by passengers arriving at highway passenger terminals. It is usually obtained by travel survey or travel demand forecasts of people going to highway passenger terminals. v i is the velocity of travel mode i   (m/min). t b is the acceptable maximum time to connect traffic from the origin to highway passenger terminals (min), which is usually obtained by travel surveys.
Step 2: Amend the mode of transport ratio using Equation (2).
p ik = 0 R k 1 2 π x · f i ( x ) dx i = 1 n 0 R k 1 2 π x · f i ( x ) dx ,
where p ik is the share ratio of transport connection mode i obtained after the kth amendment, f i ( x ) is the value of the share ratio function of connected traffic mode i when the distance is x , and R k 1 is the value of the service radius obtained after the k 1 th amendment (m).
Step 3: Calculate the radius kth amendment using Equation (3).
R k = i 1 n p ik · v i · t b , .
Step 4: Test the calculation precision. To this end, firstly set the value of ε : if | R k R k 1 | ε , R k is the service radius of the station; if | R k R k 1 | ε , return to step 2 and continue with the calculations until the accuracy criterion defined in this step is satisfied. The recommended value for ε is 10 m.
(2) 
Determine the departure site of the single-station hub line:
For a specific line class, if the service scope of a hub station completely covers the passenger flow demand, the hub station can be directly selected as the departure station of the line class. If the spatial distribution of passenger demand is relatively dispersed, a high-level comprehensive passenger terminal is usually selected as the departure station. If the passenger demand distribution is significantly dispersed, a single-station hub line can be adjusted to a multiple-station hub line, or the stowage mode could be considered.

3.2. Configuration Model of Multi-Station Hub Line Departure Stations

3.2.1. Relative Generalised Travel Cost

The generalised travel cost refers to the sum of the passenger’s economic and time costs during travel. For its calculation, the long-distance travel time on the highway and the coach ticket price are taken as the main costs of highway travel. The relative generalised travel cost is determined as the ratio of the generalised travel cost to the main cost of highway travel. The lower this ratio, the shorter the time passengers spend in the transfer system, the shorter the travel within the city. The relative generalised travel cost is defined as a measure of the departure station configuration.
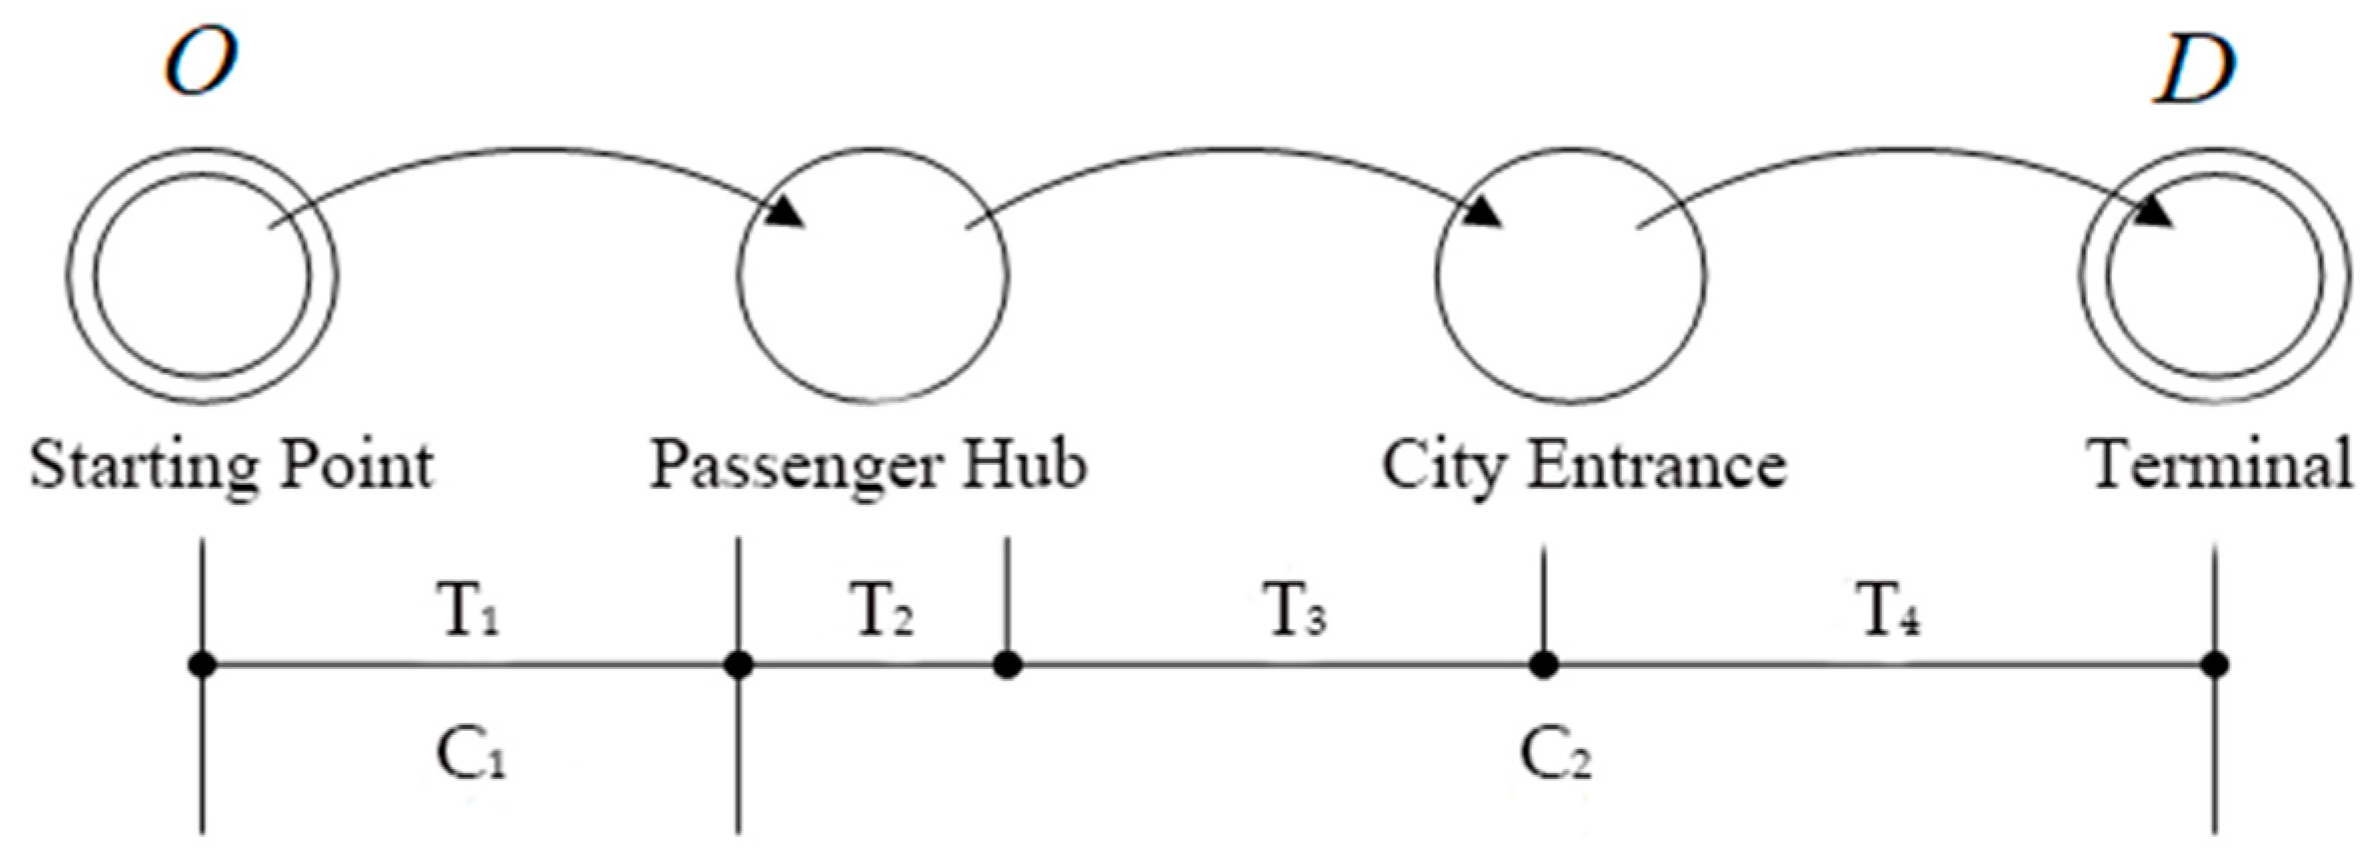
As shown in Figure 2, the expenses of passengers are segmented according to the travel itinerary, which includes four stages: travelling from the starting point to the passenger station, from the passenger station to the entrance of the city, from the entrance to the exit of the city through the urban road network, and from the exit of the city to the target city through the highway network. The respective travel times are T 1 , T 2 , T 3 and T 4 . The economic cost mainly includes the transportation cost from the starting point to the station ( C 1 ) and the coach ticket cost ( C 2 ). The calculation formula for the generalised travel cost is:
T GTC = ( T 1 + T 2 + T 3 + T 4 ) + δ ( C 1 + C 2 ) ,
where T GTC is the generalised travel cost (min), T 1 is the travel time within the city (min), T 2 is the time spent in the station (min), T 3 is the travel time from the station to the exit of the city (min), T 4 is the travel time on the highway (min), C 1 is the cost of urban travel (CYN), C 2 is the cost of the coach ticket (CYN), and δ is a scale parameter which represents the attitude to one minute increased in travel time equal to the one cost in travel expense. The scale parameter reflects the traveller’s attitude towards risk, where a higher value of “δ” means the decision-maker takes more cost consideration than time consideration when choosing the route.
The average value of T 1 in a specific traffic zone to a specific passenger terminal can be calculated according to the weighted calculation of the proportion of the different travel modes that passengers choose to arrive at the passenger terminal of each traffic area. T 2 refers to the time passengers spend entering the station, buying tickets, and waiting for the train. The value of T 2 is related to the scale, streamline organisation, and flow of the passenger terminal, as well as to the individual attributes of the passengers. In the model proposed herein, the average time spent by passengers in each stage could be obtained by investigation and is shown in Equation (5).
T 2 = t ticket + t wait + t board ,
where t ticket is the time employed buying tickets (min), t wait is the waiting time (min), and t board is the boarding time (min).
T 3 refers to the travel time from the passenger hub to the city entrance, which is mainly related to the location of the hub, the size of the city, and the urban traffic conditions. The formula of T 3 is shown in Equation (6).
T 3 = 60 · l CCJL / v ¯ CCSD ,
where l CCJL is the distance travelled in the urban road network (km) and v ¯ CCSD is the average travel speed of the coach in the city (km/h).
T 4 refers to the time the passenger spends travelling on the highway before reaching the terminal, after leaving the city. Since the travel speed depends on the highway grade, the actual travel speed is substituted by the average travel speed, and the actual mileage is substituted by the line mileage. The formula to calculate T 4 is shown in Equation (7).
T 4 = 60 · l JL / v ¯ SD ,
where l JL is the line mileage (km) and v ¯ SD is the average travel speed of the coach (km/h).
C 1 refers to the cost incurred by the passengers arriving at the hub from the starting point; its value is calculated according to the prices set by the different transport companies operating in the traffic area. The calculation formula for C 1 is shown in Equation (8).   C 2 is the passengers’ purchase tickets cost, and the value of C 2 is proportional to the value of T 4 .
C 1 = i = 1 n α i · c i ,
where α i is the proportion to the distance travelled with travel chain i , i = 1 n α i = 1 , and c i is the price set by travel chain i (CYN).
Based on the city’s per capita income, the time devoted to generate income by each individual can be calculated using the eight-hour working system. Then, the relative generalised travel cost ( R ) is calculated according to Equation (9). The smaller the R-value, the higher the social and economic benefits of the line and the less resources are wasted.
R = ( T 1 + T 2 + T 3 + T 4 ) + δ ( C 1 + C 2 ) T 4 + δ · C 2 = 1 + ( T 1 + T 2 + T 3 ) + δ C 1 T 4 + δ · C 2 .

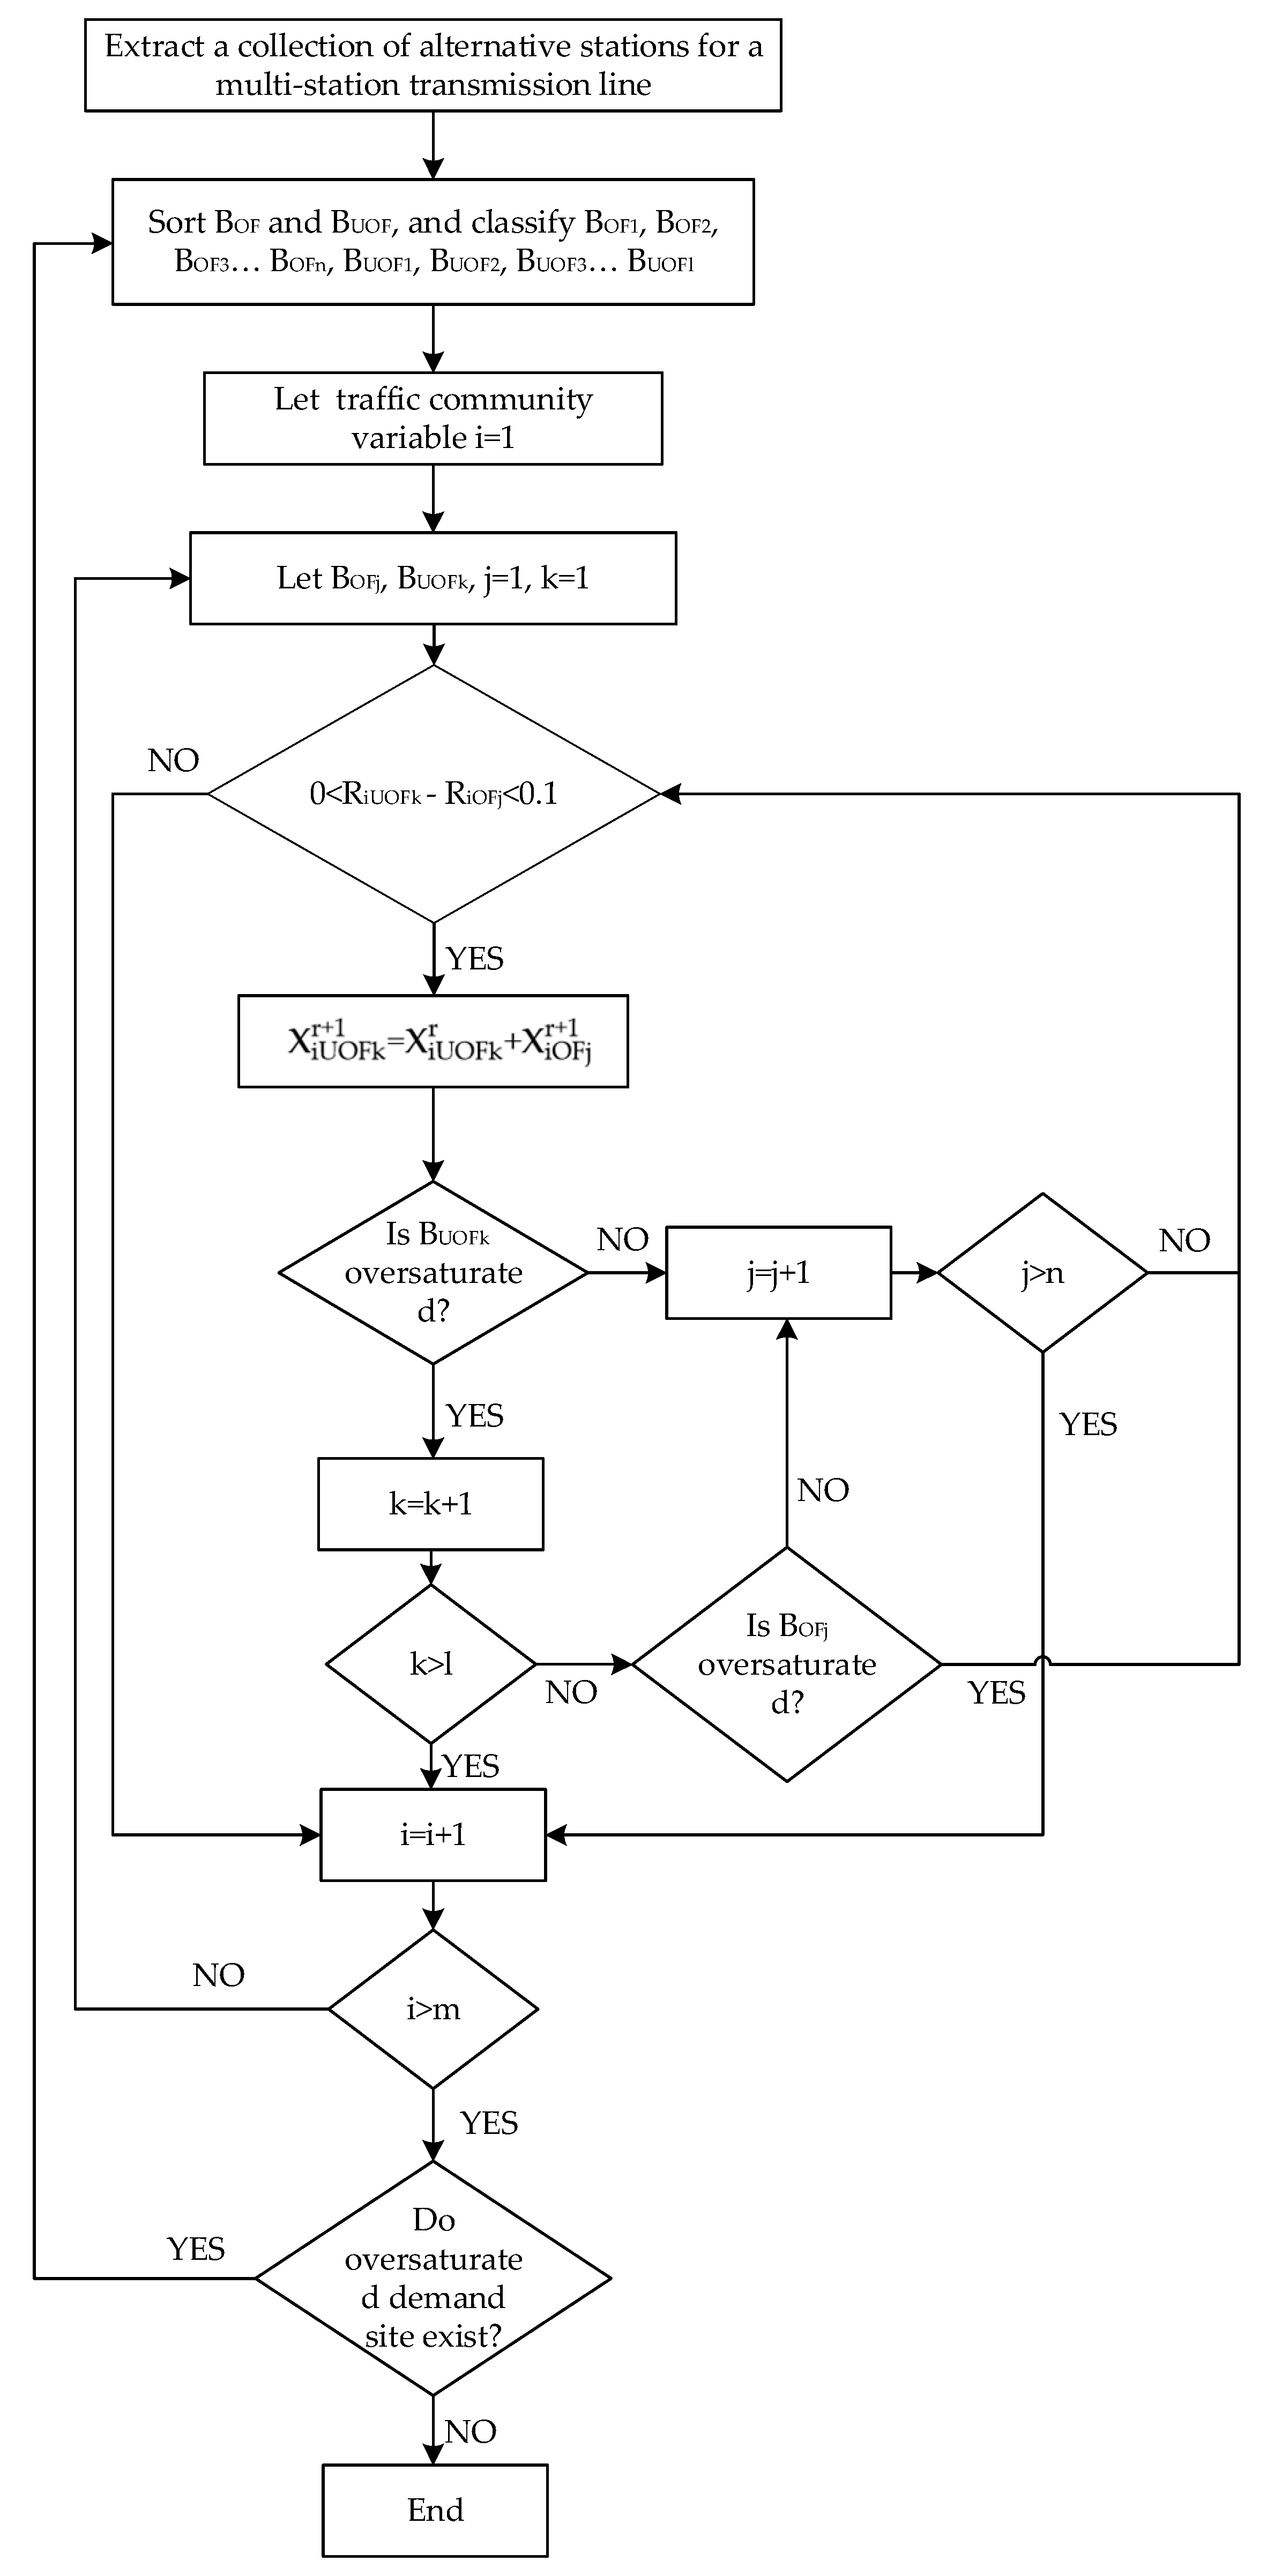
3.2.2. Distribution Model of Passenger Flow in Multi-Station Hub Lines

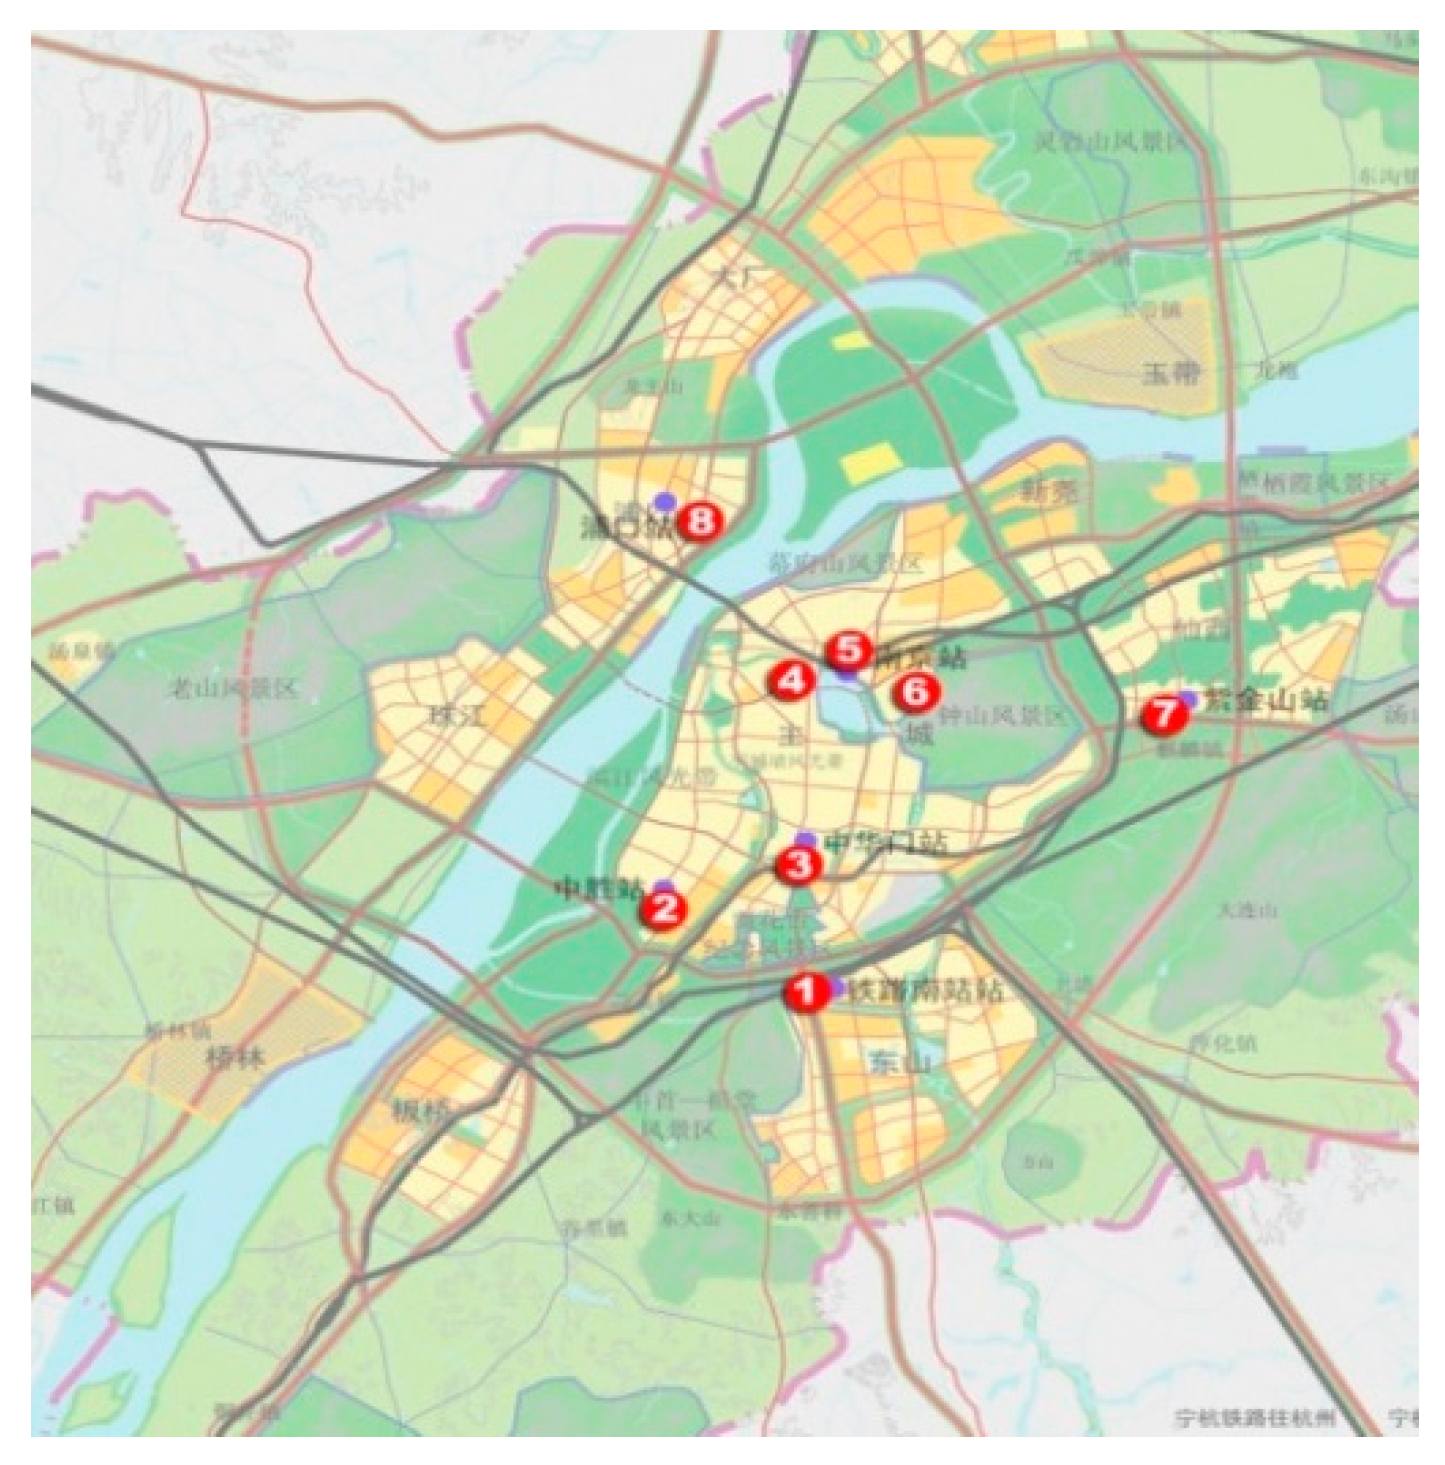
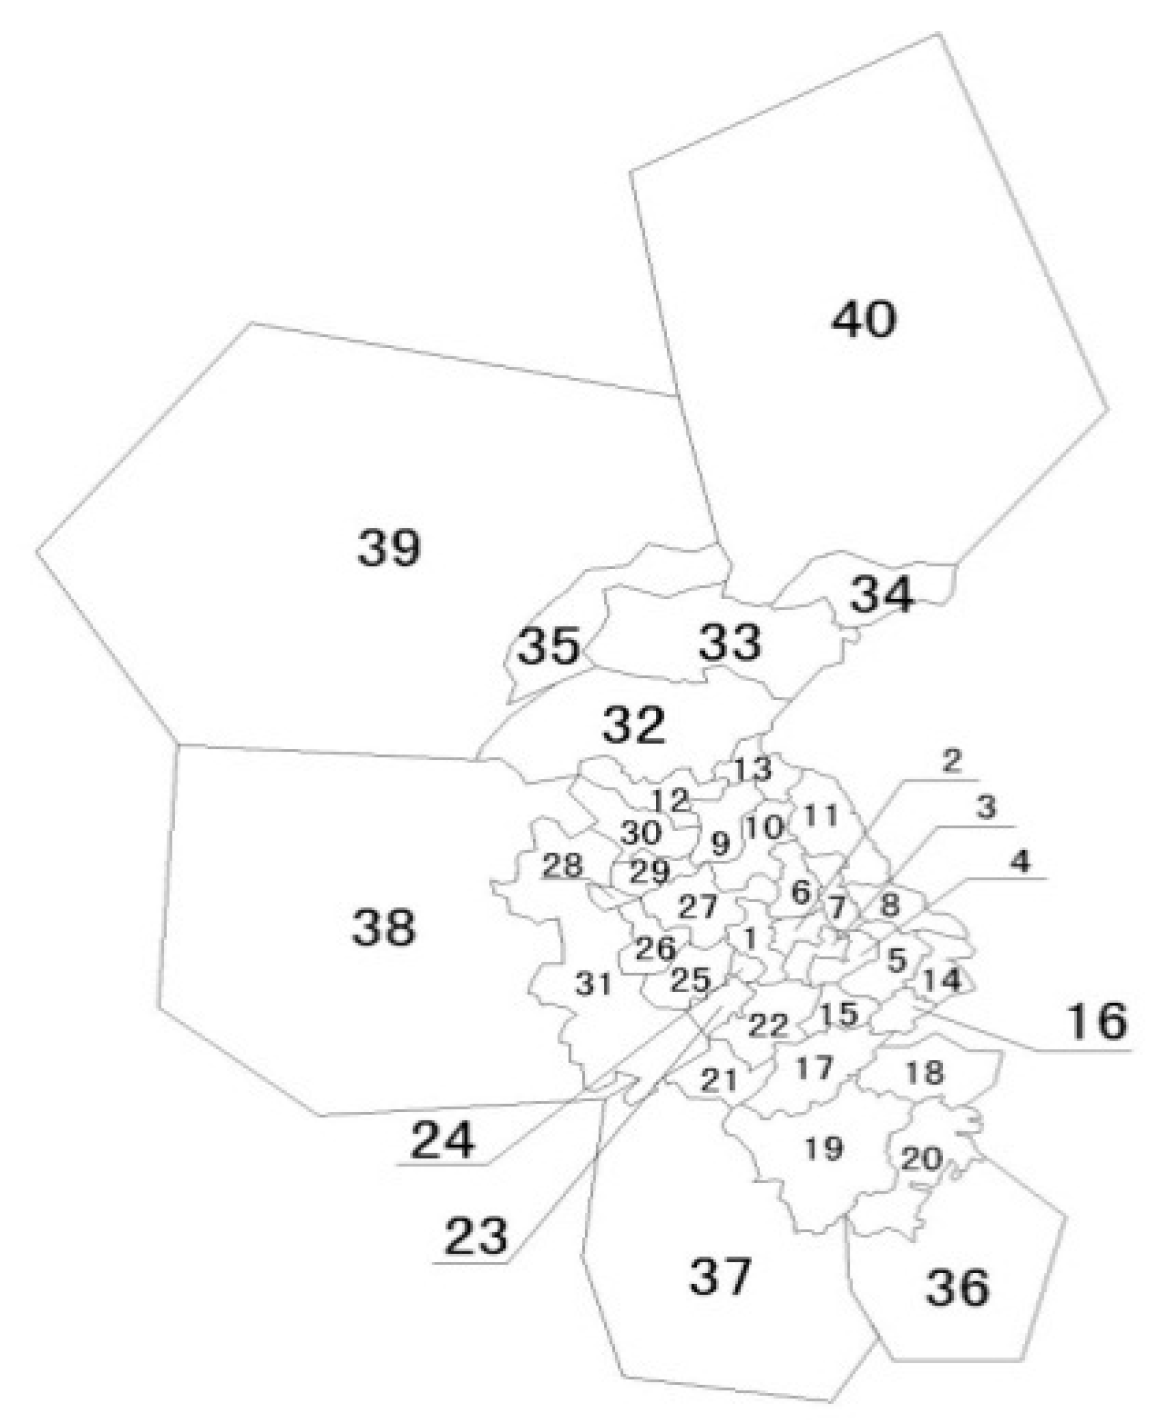
For multi-station hub lines, the objective is to estimate the minimum relative generalised travel cost. The line traffic volume of each hub can be calculated from the passenger demand of the road passenger transport hub corresponding to each traffic area. The problem could be defined as: calculating the demand for road passenger transportation a i in traffic area A i , calculating the relative generalised travel cost R ij from traffic zone A i to hub station B j (where B j ⊆ {alternative station set}), and estimating passenger traffic x ij with the restriction of minimum generalised travel cost (Table 2).
The objective function and the constraints are as shown in Equation (10).
min   Z = i = 1 m j = 1 n R ij · x ij s . t . { j = 1 n x ij = a i ,   i = 1 , 2 , , m i = 1 m x ij = b j < C j ,   j = 1 , 2 , , n x ij 0 ,   i = 1 , 2 , , m ,   j = 1 , 2 , , n ,
where b j is the total passenger volume of the line at highway passenger terminal j , C j is the designed maximum passenger volume for highway passenger station j , m is the total number of traffic zones, and n is the number of stations in {alternative station set}. The values of a i and C j are known, and b j is the value obtained after determining the passenger flow distribution and i = 1 m a i = j = 1 n b j < j = 1 n C j (   i = 1 , 2 , , m ,   j = 1 , 2 , , n ). Then, the model is solved by equivalent transformation.
The total passenger volume of traffic zone A m + 1 is a m + 1 = j = 1 n C j i = 1 m a i , and the demand from zone m + 1 to passenger hub j is x m + 1 , j . R m + 1 , j = 0 ( j = 1 ,   2 ,   ,   n ) is the relative generalised travel cost from zone m + 1 to passenger hub j 
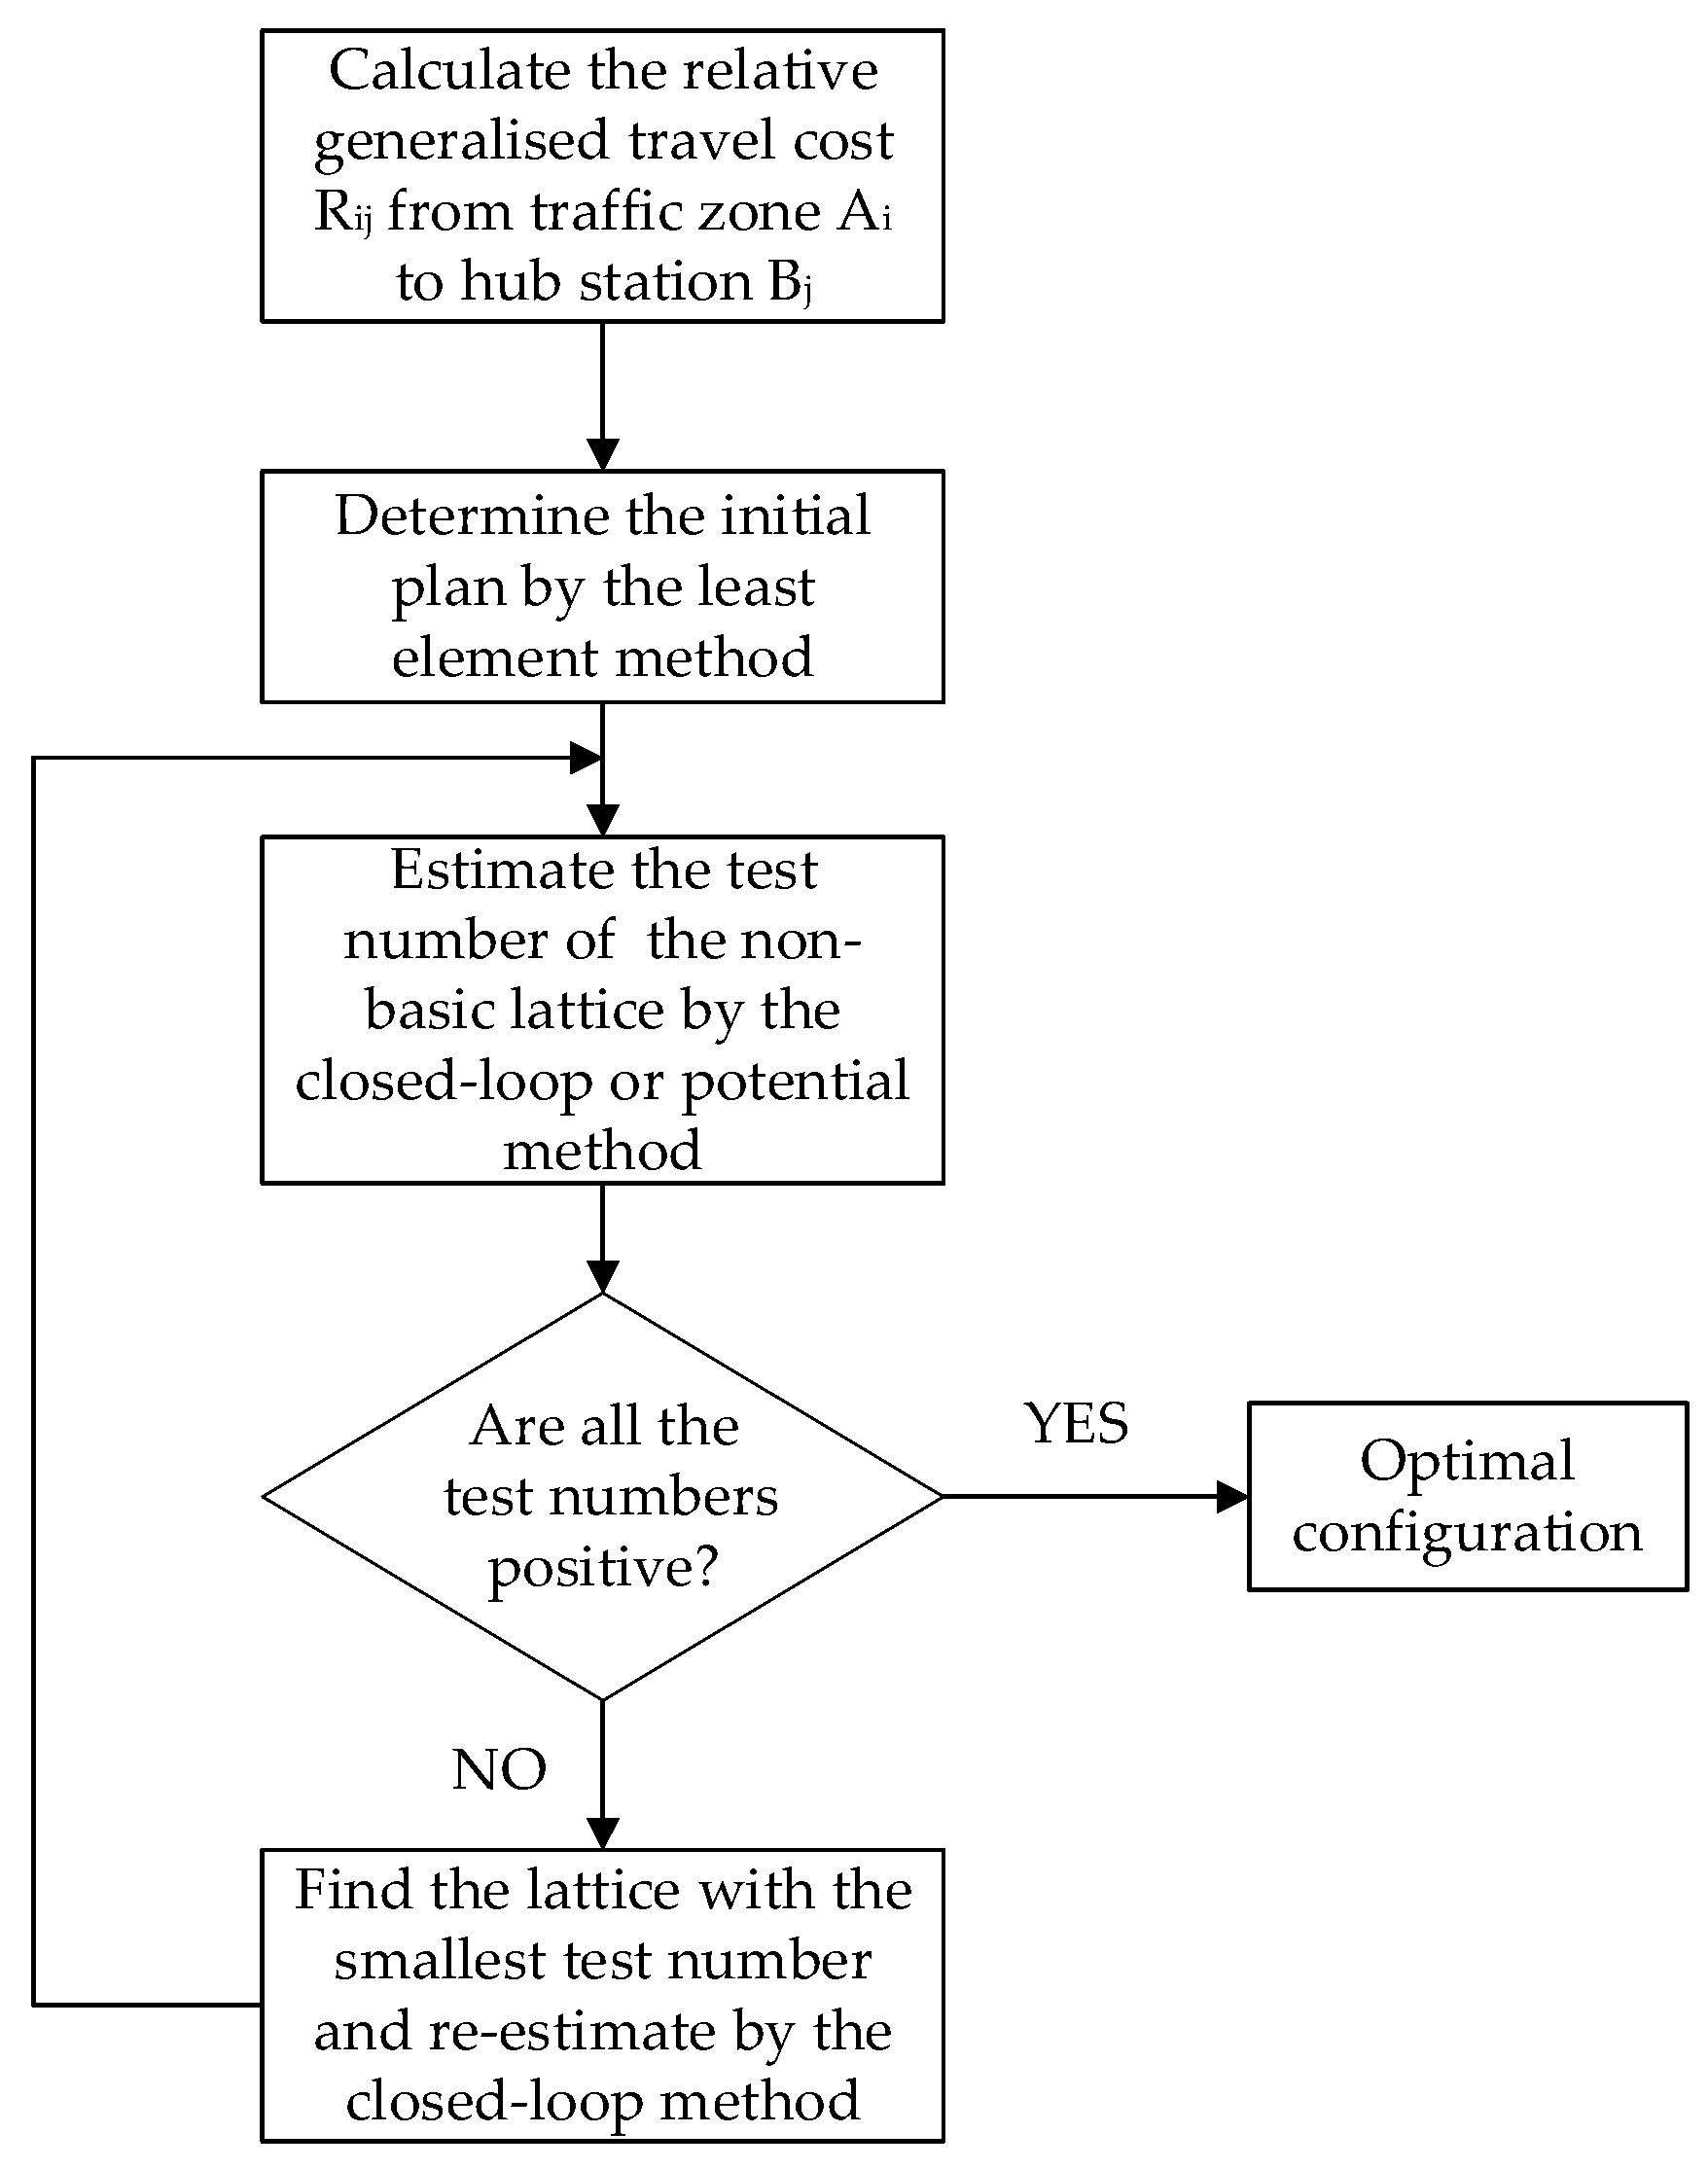
. Thus, the distribution problem of the line is equivalent to the model presented in Equation (11). The on-table method is used to solve the model; the flow of the algorithm is shown in Figure 3.
min   Z = i = 1 m + 1 j = 1 n R ij · x ij s . t . { j = 1 n x ij = a i ,   i = 1 , 2 , , m + 1 i = 1 m + 1 x ij = C j ,   j = 1 , 2 , , n x ij 0 ,   i = 1 , 2 , , m + 1 ,   j = 1 , 2 , , n .

3.3. Configuration Optimisation for Passenger Transport Hubs on Highways

The one-by-one selection of line departure sites may lead to the problem of the total number of passengers departing from the site exceeding the site’s designed maximum passenger volume. Therefore, it is necessary to check and optimise the departing volume of each site; the specific adjustment calculation method is shown in Figure 4.
In Figure 4, { B OF } is the set of sites with oversaturated demand, which is sorted according to the proportion of excess to design capacity, denoted as { B OF 1 } , { B OF 2 } , etc. { B UOF } is the set of sites with no saturated requirements, which is sorted according to the proportion of the remaining capacity to the designed capacity, denoted as { B UOF 1 } , { B UOF 2 } , etc. { B iOFj } is the travel cost from the traffic community i to the oversaturated site j , { B iUOFk } is the travel cost from the traffic community i to the unsaturated station k , { X iOFj } is the passenger demand from the traffic community i to { B OFj } , and { X iUOFj } is the passenger demand from traffic community i to { B UOFj } .

4. Case Study

A case study was conducted in Nanjing, China, to confirm the validity of the proposed methodology. As shown in Figure 5, the future planned highway passenger transport hub system of Nanjing comprises a total of eight highway passenger stations, which are denoted as S1–S8. The planning indicators and service areas of each station are shown in Table 3. The service area of the highway passenger transport hub system is divided into 40 traffic zones; its distribution is shown in Figure 6.
According to the passenger flow forecast and the planning scheme, the total number of bus lines in the highway passenger transport hub system of Nanjing is approximately 800. Herein, some representative bus lines were selected to obtain their configuration schemes using the proposed methodology, as follows.
(1) 
Single-station hub line scheme:
According to the analysis of passenger flow demands and the hub service radii of the lines, the obtained single-station hub line scheme is shown in Table 4.
(2) 
Multiple-station hub line scheme:
The preliminary multi-station hub line site configuration scheme is shown in Table 5.
Taking ML1, which is the name of the intercity transit line, as an example, the passenger demand of this line is 2200 passengers per day; the calculated relative generalised travel costs and their corresponding passenger flow distributions are shown in Table 6 and Table 7, respectively.
Based on the passenger flow distribution of the multiple-station hub line, the preliminary station scheduling scheme is obtained, as shown in Table 8.
(3) 
Overall Optimisation of the Scheme for the Departure Station of the Passenger Transport Hub:
After obtaining the configuration schemes of all the lines, which contain single- and multiple-stations, the average daily passenger volume of each passenger hub should be checked. If the traffic distribution of the hub exceeds the designed passenger capacity, the overall adjustment and optimisation algorithm is employed.

5. Conclusions

This study established a methodology based on related ineffective general cost minimisation for the assignment of departure stations to highway passenger bus lines. The divergence of passenger flow characteristics was taken into consideration, and a detailed method for model parameter estimation was provided. The lines were divided into two types: single-station hub lines and multi-station hub lines. The line type was determined by analysing the characteristics of the line’s passenger flow demand. According to the analysis of the service scope of highway passenger stations, the single-station hub line scheme was determined. Then, the departure station allocation model for multi-station hub lines was established. Based on the relative generalised travel cost, the location scheme of the starting stations was optimised, and the overall optimisation method for the route allocation scheme was proposed. After the departure station allocation process of each route was completed, the overall passenger demand of each station was checked, and the system was optimally adjusted.
The practical method proposed herein—which considers passengers’ travel times and costs, station allocation, and bus operation—can help management agencies and business operators to optimise highway passenger bus line departure station assignment and improve the service quality. In addition, a practical method of this type, which features a quantitative model, is valuable for policy making, government administration, and business operation. This study was an initial attempt to apply quantitative analysis to highway passenger bus line departure station assignment. The practical optimisation method presented herein is inevitably limited by some constraints, including administrative management rules, existing operation plans, passengers’ behavioural habits, data availability, etc. The model architecture and parameter estimation process could be enhanced in several ways, including the use of a random utility-based discrete model for determining the travel mode choice from the origin to the destination station and the use of big data and individual behaviour data to more accurately reflect the travel behaviours of passengers by considering various travel purposes and demands. Other possible improvements include the addition of macroscopic factors into the method and considering the influence of mobile internet, ride-hailing services, and urban–rural transport integration.

Author Contributions

Conceptualisation, X.D.; methodology, X.D.; software, X.D.; validation, J.C., Z.Z. and C.Q.; formal analysis, Z.Z.; investigation, X.G.; resources, X.G.; data curation, Z.Z.; writing—original draft preparation, X.D.; writing—review and editing, Z.Z.; visualisation, C.Q.; supervision, J.C.; project administration, X.D.; funding acquisition, X.D. All authors have read and agreed to the published version of the manuscript.

Funding

This research received no external funding.

Acknowledgments

Guo and the teachers of Southeast University are appreciated for providing helpful suggestions on this research. The anonymous referees whose comments on the earlier version led to significant improvements should also be appreciated.

Conflicts of Interest

The authors declare no conflict of interest.

References

  1. Liu, T.Y.; Chi-Wei, S.U.; Qin, M.; Zhang, X.Y. What came first, transportation or urbanization? Singap. Econ. Rev. 2020. [Google Scholar] [CrossRef]
  2. Ministry of Transport of the People’s Republic of China, Statistical Communique on the Development of the Transport Industry in 2019. Available online: http://xxgk.mot.gov.cn/jigou/zhghs/202005/t20200512_3374322.html (accessed on 10 June 2020).
  3. Zhang, R.J.; Wang, J.W.; Yuan, C.W. Design and Optimization of Passenger Line for Urban Passenger Transportation Hubs Based on BIM. Chongqing University of Posts and Telecommunications, Hubei ZhongKe Institute of Geology and Environment Technology. In Proceedings of the 6th International Symposium on Project Management, Chongqing, China, 21–23 July 2018; pp. 367–372. [Google Scholar]
  4. LeeKurt, K.K.T.; Schonfeld, P. Optimal slack time for timed transfers at a transit terminal. J. Adv. Transp. 1991, 25, 281–308. [Google Scholar]
  5. Solimanpur, M.; Vrat, P.; Shankar, R. An ant algorithm for the single row layout problem in flexible manufacturing systems. Comput. Oper. Res. 2005, 32, 583–598. [Google Scholar] [CrossRef]
  6. Kitti, S.; Prianka, N.S.; Heli, K.K. Cost-Based Space Estimation in Passenger Terminals. J. Transp. Eng. 2002, 128, 191–197. [Google Scholar]
  7. Li, X.J.; Liang, Y.; Cheng, Z.L. Research on Comprehensive Layout Method of Passenger Transport Hub System in Small and Medium Cities. Compr. Transp. 2019, 41, 42–46, 61. [Google Scholar]
  8. Xu, Y.; Kang, J.L.; Wu, W.J.; Hao, P. Comprehensive Passenger Transport Hub Layout Mode and Applicability Analysis. J. Jiangsu Univ. (Nat. Sci. Ed.) 2020, 41, 149–153. [Google Scholar]
  9. Borna, A.; Denis, Š.; Danijel, J. Organization of Integrated Passenger Transport on the Zagreb—Velika Gorica Route. Transp. Res. Procedia 2020, 44, 342–347. [Google Scholar] [CrossRef]
  10. Steve, P. Optimizing Melbourne’s bus routes for real-life travel patterns. Case Stud. Transp. Policy 2020. [Google Scholar] [CrossRef]
  11. Jishnu, N.; Oded, C.; Niels, V.O.; Serge, H. Integrated route choice and assignment model for fixed and flexible public transport systems. Transp. Res. Part C Emerg. Technol. 2020, 115, 102631. [Google Scholar] [CrossRef]
  12. Yakimov, M.; Trofimenko, Y. Developing an urban public passenger transport route network with account for natural resource limitations. Transp. Res. Procedia 2018, 36, 801–809. [Google Scholar] [CrossRef]
  13. Wang, S.; Zhang, W.; Bie, Y.; Wang, K.; Diabat, A. Mixed-integer second-order cone programming model for bus route clustering problem. Transp. Res. 2019, 102, 351–369. [Google Scholar] [CrossRef]
  14. Suman, H.K.; Bolia, N.B. Improvement in direct bus services through route planning. Transp. Policy 2019, 81, 263–274. [Google Scholar] [CrossRef]
  15. Katerina, V.; Katerina, K.; Ivetta, A.; Andrii, G. Designing Optimal Public Bus Route Networks in a Suburban Area. Transp. Res. Procedia 2019, 39, 554–564. [Google Scholar]
  16. Vlasov, V. Concept for Developing Digital Infrastructure for Regional Passenger Transportation Control Systems. Transp. Res. Procedia 2017, 20, 683–689. [Google Scholar] [CrossRef]
  17. Iliopoulou, C.; Kepaptsoglou, K. Integrated transit route network design and infrastructure planning for on-line electric vehicles. Transp. Res. Part D Transp. Environ. 2019, 77, 178–197. [Google Scholar] [CrossRef]
  18. He, M.; Xu, Z.H.; Dong, R. Highway Regular Passenger Transportation Intensification Development Problems from the Perspective of Interest Analysis. J. Kunming Univ. Sci. Technol. (Soc. Sci.) 2014, 3, 67–72. [Google Scholar]
  19. Zeng, Y.Y. Research on Transit Operation of Shenzhen-Guangdong Cross-border Passenger Line. Highw. Automot. Appl. 2012, 3, 69–71. [Google Scholar]
  20. Wang, S.Y. Influencing factors of macro allocation of road passenger transport lines. Commun. Sci. Technol. Heilongjiang 2013, 6, 162. [Google Scholar]
  21. Huang, H.N. A Study on the Allocation of Bus Lines in Highway Passenger Transport Hubs in Big Cities. Ph.D. Thesis, Southeast University, Nanjing, Jiangsu, China, 2009. [Google Scholar]
  22. Jin, L.; Fan, J.; Chen, S.Y. Preliminary Study on the Method of Organizing and Distributing Classes of Highway Passenger Transport Hub. J. Highw. Transp. Res. Dev. 2007, 11, 140–142. [Google Scholar]
  23. Bian, L.L.; Li, D.E.G.; Li, D.D. Capacity configuration of comprehensive transportation passenger hub. J. Transp. Eng. Inf. 2017, 3, 71–77. [Google Scholar]
Figure 1. Flowchart of the departure site configuration method.
Symmetry 12 01194 g001
Figure 2. Diagram of the highway passenger travel process.
Symmetry 12 01194 g002
Figure 3. Flowchart of the on-table method.
Symmetry 12 01194 g003
Figure 4. Flowchart of the departure site configuration optimisation of the whole line.
Symmetry 12 01194 g004
Figure 5. Layout of the highway passenger transport hub system of Nanjing, China.
Symmetry 12 01194 g005
Figure 6. Traffic zone distribution in the highway passenger transport hub system of Nanjing, China.
Symmetry 12 01194 g006
Table 1. Classification table for the hub lines.
High Passenger Flow DemandLow Passenger Flow Demand
Centralised demand distribution of passenger flowSingle-station hub lineSingle-station hub line
Scattered demand distribution of passenger flowMulti-station hub lineSingle-station hub line
Table 2. Passenger flow distribution.
Traffic ZonePassenger Hub
B1B2BnSum
A1x11x12x1na1
A2x21x22x2na2
Amxm1xm2x2nam
Sumb1b2bn-
Table 3. Planning indicators of the highway passenger transport hub system of Nanjing, China.
StationClassDesign Daily Delivery (10,000)Daily ShiftsScope of the Service
S1First class315002, 3, 4, 5, 8, 9, 10, 11, 12, 13, 14, 16, 17, 21, 22, 23, 24, 26, 29, 30, 31, 32, 33, 34, 35, 36, 37, 38, 39, 40
S2First class15002, 4, 5, 6, 7, 8, 9, 11, 12, 13, 23, 26, 27, 30, 21, 37, 39
S3Second class0.53001, 8, 9, 11, 22, 23, 24, 30, 31
S4Second class0.53002, 3, 4, 5, 8, 9, 10, 11, 12, 13, 14, 16, 17, 21, 22, 23, 26, 29
S5First class315002, 3, 4, 5, 8, 9, 10, 11, 12, 13, 14, 16, 17, 21, 22, 23, 26, 29, 30, 31, 32, 33, 34, 35, 36, 37, 38, 39, 40
S6First class1.57502, 3, 4, 5, 6, 7, 15, 16, 17, 18, 19, 20, 22, 23, 31, 36, 37, 39
S7Second class13002, 3, 5, 9
S8First class15006, 10, 25, 26, 38
Table 4. Single-station hub line scheduling scheme.
LinesSitesScope of the Line Service
SL1, SL2, SL3S532, 33, 34, 35, 39, 40
SL4, SL5, SL6, SL7, SL8S136, 37, 38
SL9S31, 15, 16
SL10S221, 22, 24, 28, 29, 30, 31
SL11, SL12S618, 19, 20
SL13, SL14S825
SL15S714
Table 5. Preliminary multiple-station hub line site configuration scheme.
LinesSet of Initial SitesScope of the Service
ML1S1, S4, S5, S6, S72, 3, 4, 5, 6, 7, 8, 12, 13, 17, 23, 26, 27
ML2S1, S4, S5, S6, S7, S82, 3, 4, 5, 7, 8, 10, 11, 12, 13, 17, 23, 26, 27
ML3S1, S4, S5, S87, 8, 10, 11, 12, 13, 17, 23
ML4S1, S2, S5, S85, 7, 8, 12, 23, 26, 27
ML5S1, S22, 3, 4, 5, 6, 7, 8, 9, 10, 11, 13
Table 6. Relative generalised travel cost table of ML1 (unit: CYN).
Passenger StationS1S4S5S6S7
Zone
R11.541.741.601.561.54
R21.581.751.631.641.60
R31.491.811.651.621.52
R41.451.821.701.661.58
R51.521.861.731.741.64
R61.681.691.571.601.67
R71.431.881.751.761.63
R81.651.761.591.621.67
R91.471.961.821.811.65
R101.751.801.691.711.77
R111.871.911.821.831.89
S5 transfer--1--
S1 transfer1----
Table 7. Shared passenger volume at each site of ML1.
Passenger StationS1S4S5S6S7 a i
Zone
R10000206206
R22560000256
R32350000235
R465000065
R557000057
R60010700107
R792000092
R80012200122
R92980000298
R100014500145
R110020000200
S5 transfer0012600126
S1 transfer1890000189
b j 1194070002062100
Table 8. Initial results of the departure station configuration scheme of the multiple-station hub line.
Passenger StationS1S2S3S4S5S6S7S8
Zones
2433--0160802774-
10984--01711--1549
9890--01169--1772
61037--0226906-1591
11230--018370-490
7117--018140-484
262121493--141--508
41530--076800-
8563--07300-740
51136--06660196-
31318--066200-
238588470-109---
121560--15800--
271530--15490--
17685-485-88770-
13110--011170--
Sum10 5202340485015 76798329717134
Ratio26.2%5.8%1.2%0.0%39.2%2.4%7.4%17.7%
Note: the grey shading indicates that the passenger volume of the site in the initial scheme was 0.

