Article

Corn Classification System based on Computer Vision

Department of Computer Science and Technology, Northeast Agricultural University, Harbin 150030, China
*
Author to whom correspondence should be addressed.
Symmetry 2019, 11(4), 591; https://doi.org/10.3390/sym11040591
Submission received: 5 March 2019 / Revised: 19 April 2019 / Accepted: 22 April 2019 / Published: 24 April 2019

Abstract

:
Automated classification of corn is important for corn sorting in intelligent agriculture. This paper presents a reliable corn classification method based on techniques of computer vision and machine learning. To discriminate different damaged types of corns, a line profile segmentation method is firstly used to segment and separate a group of touching corns. Then, twelve color features and five shape features are extracted for each individual corn object. Finally, a maximum likelihood estimator is trained to classify normal and damaged corns. To evaluate the performance of the proposed method, a private dataset consisting of images of normal corn and six kinds of damage corns, including heat-damaged, germ-damaged, cob-rot-damaged, blue eye mold-damaged, insect-damaged, and surface mold-damaged, were collected in this work. The proposed method achieved an accuracy of 96.67% for the classification between normal corns and the first four common damaged corns, and an accuracy of 74.76% was achieved for the classification between normal corns and six kinds of damaged corns. The experimental results demonstrated the effectiveness of the proposed corn classification system.

1. Introduction

Corn is one of the most important foods and the most widely produced feed grain in the world. It also can be processed into a wide range of industrial products. Production of corn in the United States is 984.37 million metric tons produced in 2014 [1]. Due to the effects of corn quality in the price and end usage of the corn, grain-grading standards were developed by the U.S. Grain Standards Act of 1916 [2]. The grain-grading standards are updated and managed by the Federal Grain Inspection Service (FGIS) of the United States Department of Agriculture (USDA). The standards explicitly provided damaged types of corn. Both sellers and buyers now use the standards as a common and worldwide commercial language to decide the type and quality of the corn.
According to the grain-grading standards, corn is classified by moisture, weight, color, shape, odor, and damage [3]. Among these criteria, the moisture, weight, and odor of corn can be evaluated by special instruments such as an electronic analyzer [4]. For the criteria about color, shape, and damage, corn grading is generally observed with the naked eye. It is repetitive and tiring, and, consequently, errors can be made. A plausible way to classify corn is using computer vision to classify corn automatically.
Previous studies have demonstrated that computer vision could be a significant way to analyze grains. Zayas et al. used image processing and pattern recognition to identify whole and broken corn kernels [5]. Ni et al. developed a prototype system to classify whole and broken kernels [6], corn kernels based on their crown shape [7], and grade corn based on their size [8]. Luo et al. used computer vision technology to separate six types of wheat kernels based on their color features [9]. Steenhoek et al. devised a computer vision system to classify corn based on their damage type [10]. Dana and Ivo used image processing to categorize flax cultivar based on seed shape and color [11]. Chen et al combined machine vision and pattern recognition to classify five types of corn based on their shape, color, and geometric features [12]. Arribas et al. presented an automatic leaf image classification system for sunflower crops using neural networks [13]. Gao et al. designed a rapid corn sorting algorithm based on machine vision. The proposed corn classification had a speed of 30 ears/min with a 1280 × 1024 pixel CCD camera [14]. Valiente-Gonzalez et al. devised a computer vision system to automatically evaluate the quality of corn lots by identifying damaged kernels that combined algorithm-based computer vision techniques and principal component analysis (PCA) [15]. Liu et al. proposed an efficient image processing algorithm to detect parameters such as the length, the number of ear rows, and the quantity of kernels in an ear of corn based on a machine vision [16]. Mohammad et al. designed an expert system with ant colony optimization (ACO) to automatically recognize different plant species through their leaf images [17]. Gao et al. designed an automatic detection and classification algorithm for corn product quality and equipment [18]. The algorithm firstly calculated texture features of fresh corn images through wavelet analysis and then measured the separation degree of texture features by the maximum visual entropy function. Finally, according to the texture features and entropy criterion, the fresh corn products were classified. Sun et al. identified and classified damaged corn kernels including undamaged, insect-damaged, and mildew-damaged by using impact acoustic multi-domain patterns [19]. Zhang et al. classified three different degrees of freeze-damage in corn seeds using a VIS/NIR hyperspectral imaging system [20]. Chouhan et al. used computer vision and soft computing methods to identify and classify diseases of the leaf for the plant [21]. Sajad et al. developed a computer vision algorithm that combined color features and a classifier based on ANN with genetic algorithms for detecting existing fruits in aerial images of an apple cultivar and estimating their ripeness stage [22]. These proposed systems mainly focused on algorithms, but the research on classification of damaged corn is less and has paid little attention to the design of corn image capture platforms. In addition, most of them worked well for a small scale of corn, however, since touching corn could not be segmented accurately, their performance may be degraded if the number of corns is increased.
This paper proposed a new corn classification method to classify normal and damaged corn. The main contributions of this work are: (a) a set of images of normal corn and six kinds of different damage corns were collected; (b) color and shape features of corn were fused to train a corn classification model; (c) the performances of corn classification conducted on different test sets were evaluated.
The rest of this paper is organized as follows. The experiment data is described in Section 2, while the proposed classification scheme is present in Section 3. Experimental results are reported and analyzed in Section 4. Finally, this paper is concluded in Section 5.

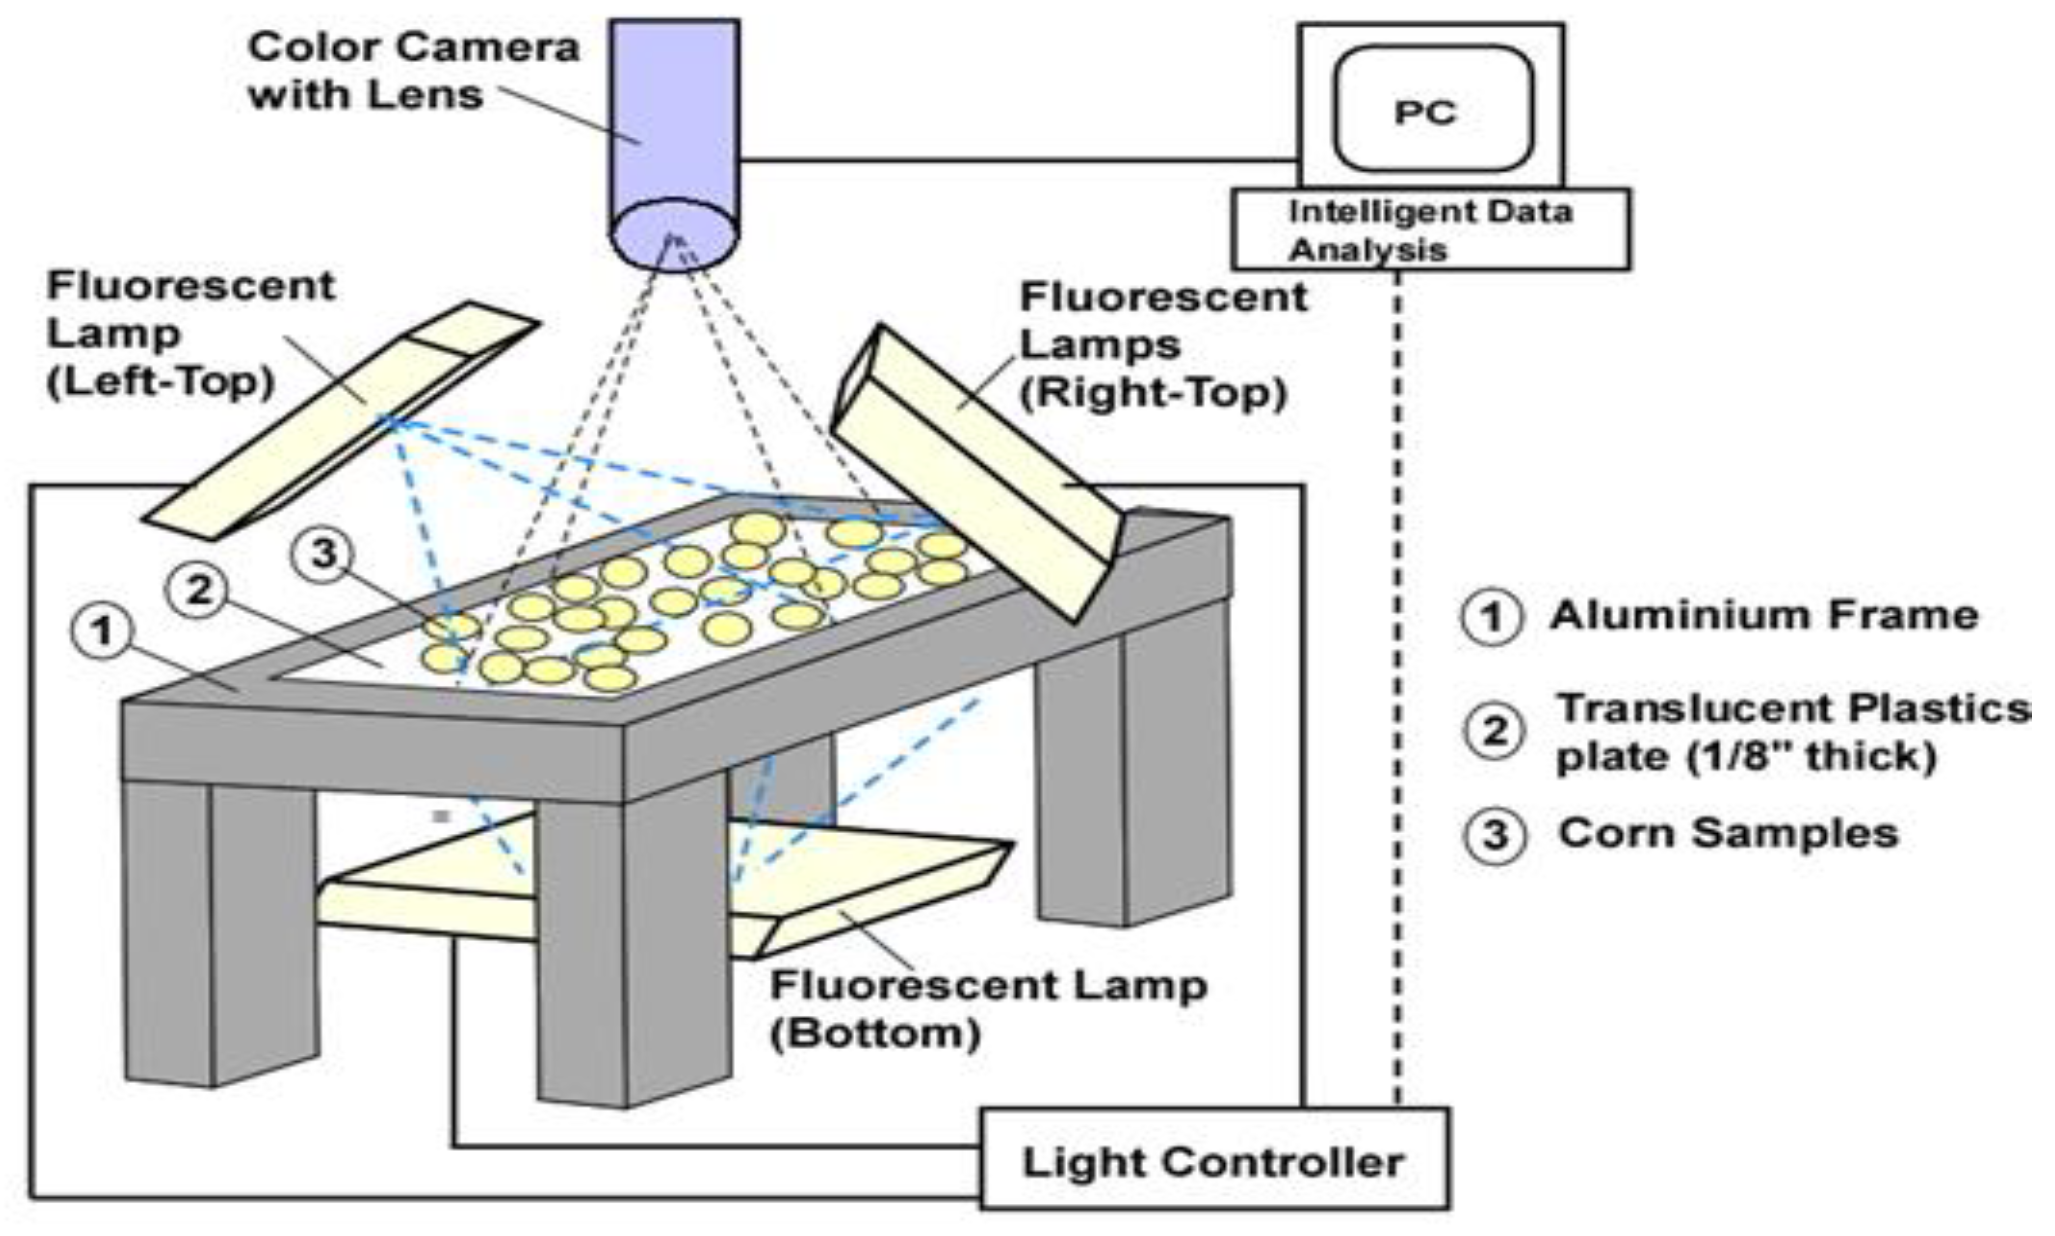
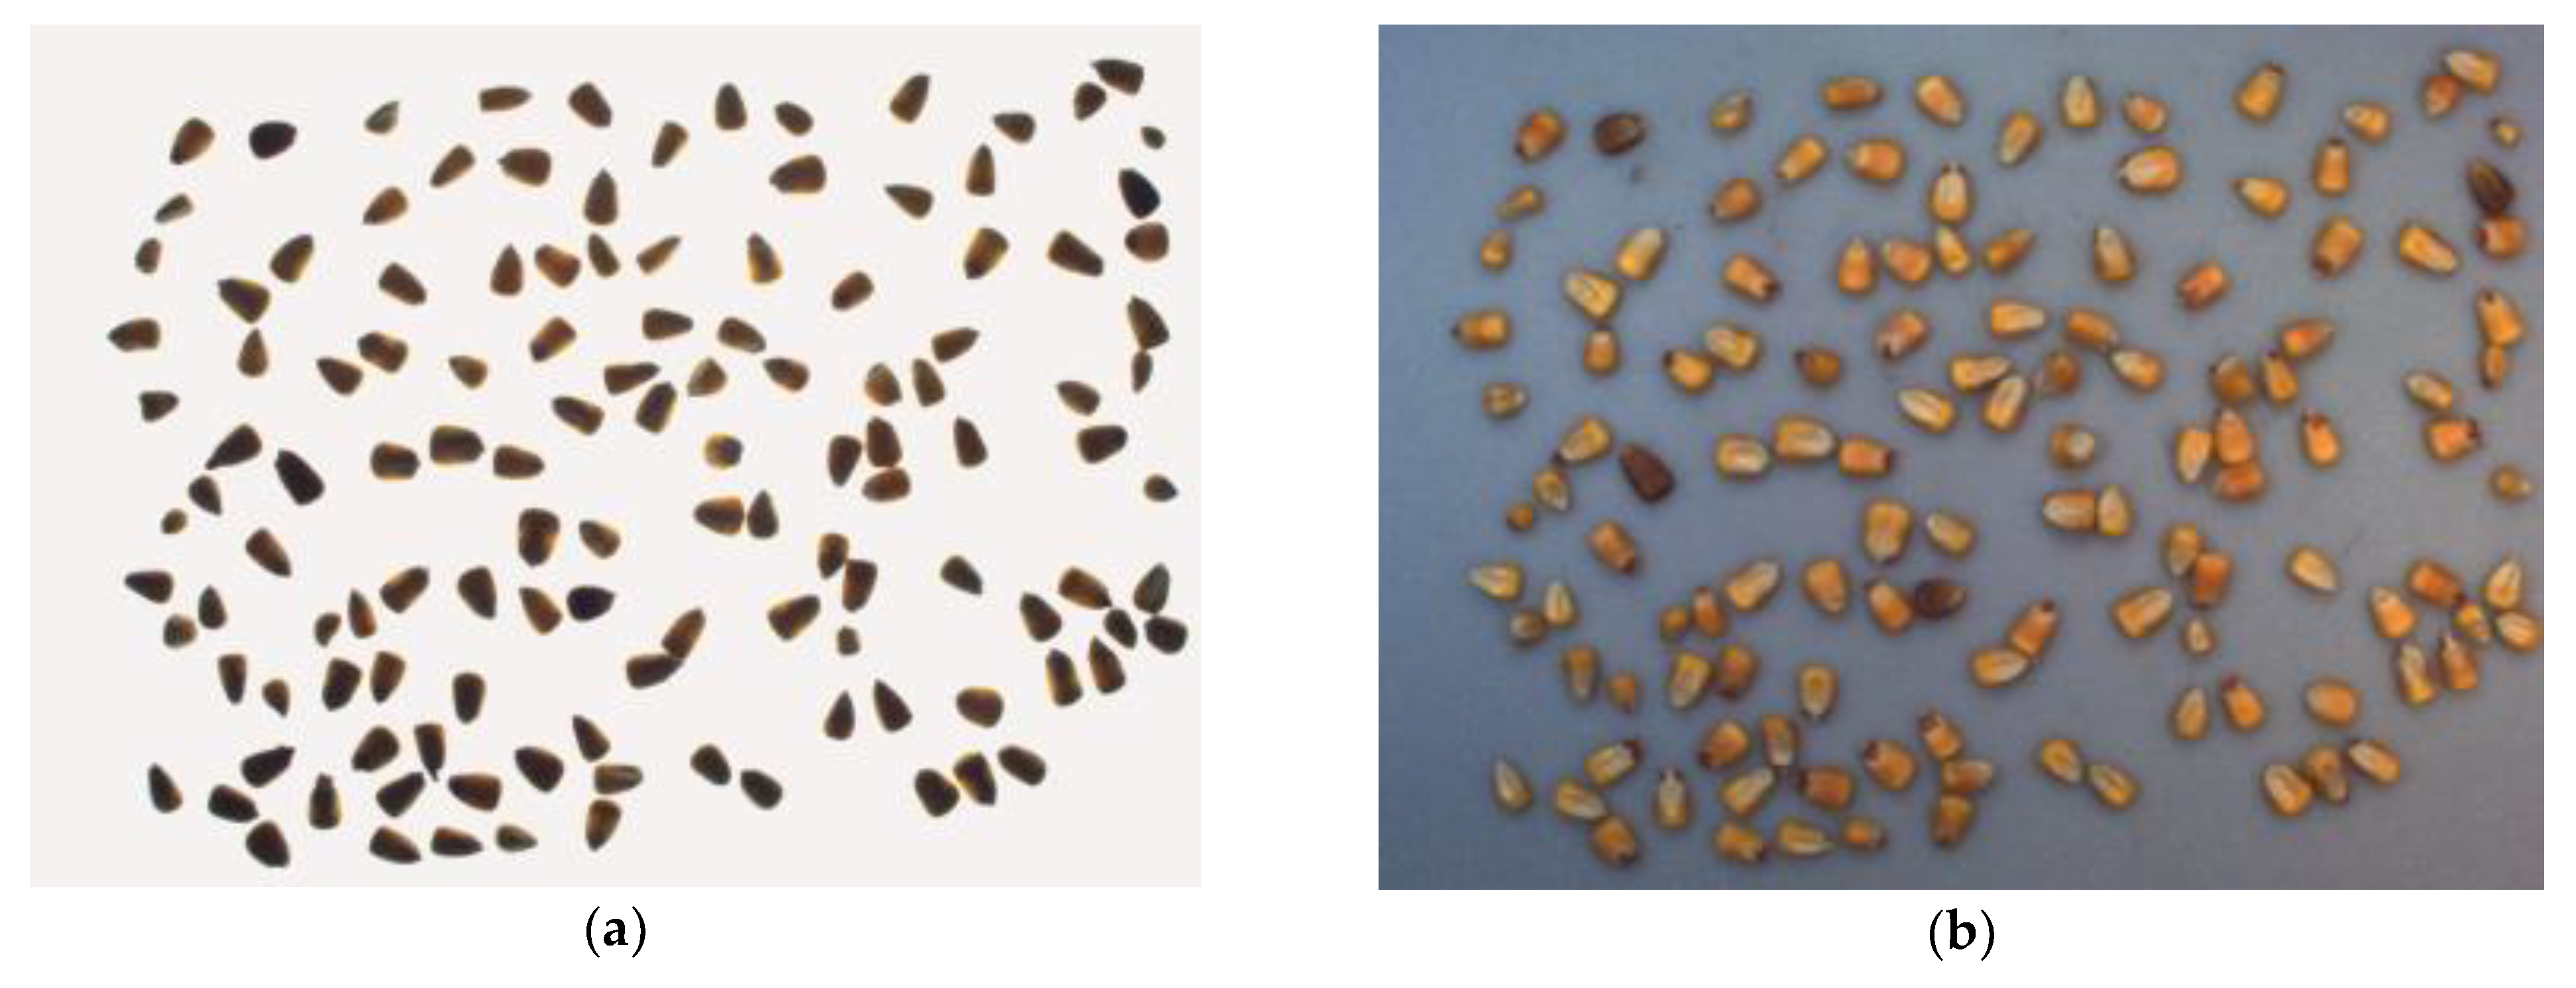
2. Experimental Data

The corn used in this work were collected at the experimental farm of Southern Illinois University Carbondale (SIUC). Seven kinds of corns were considered in this paper, including normal, heat-damaged, germ-damaged, cob rot-damaged, blue eye mold-damaged, insect-damaged, and surface mold-damaged. As shown in Figure 1, the image of corn was acquired using an optical image collection system that consisted of an imaging table, a color camera, a two-way lighting system, and a computer. The imaging table contained an aluminum frame and a transparent, plastic plate. Corns were arranged on the plastic plate and the plate slides in the aluminum frame. The camera was setup vertically to take top-view images of the corn. The lighting system consisted of upper fluorescent lamps and lower fluorescent lamps. The corn images captured by this platform with a different lighting system are shown in Figure 2. In this work, the corn image captured using upper fluorescent lamps was used in our experiments. The upper fluorescent lamps provided uniform lighting, and the images captured with these lamps were used to extracted color features of the corn. The lower fluorescent lamps placed under the transparent plastic plate provided an overexposure of the image, which was used to extract shape features of the corn. Experimental images were acquired by a DFK 72BUC02 color camera (2592 × 1944) with a M12VM412 lens and saved into a computer (including an Intel Core 5i 3.10GHz, 4GB RAM) connected to the camera.
During image collection, each time there were about 150 corns selected and arranged on the plate. Images collected by this collection system had a resolution ratio of 2592 × 1944 and were saved in BMP format. After collection, normal corns and damaged corns in the image were manually labeled by agronomy experts from Southern Illinois University.

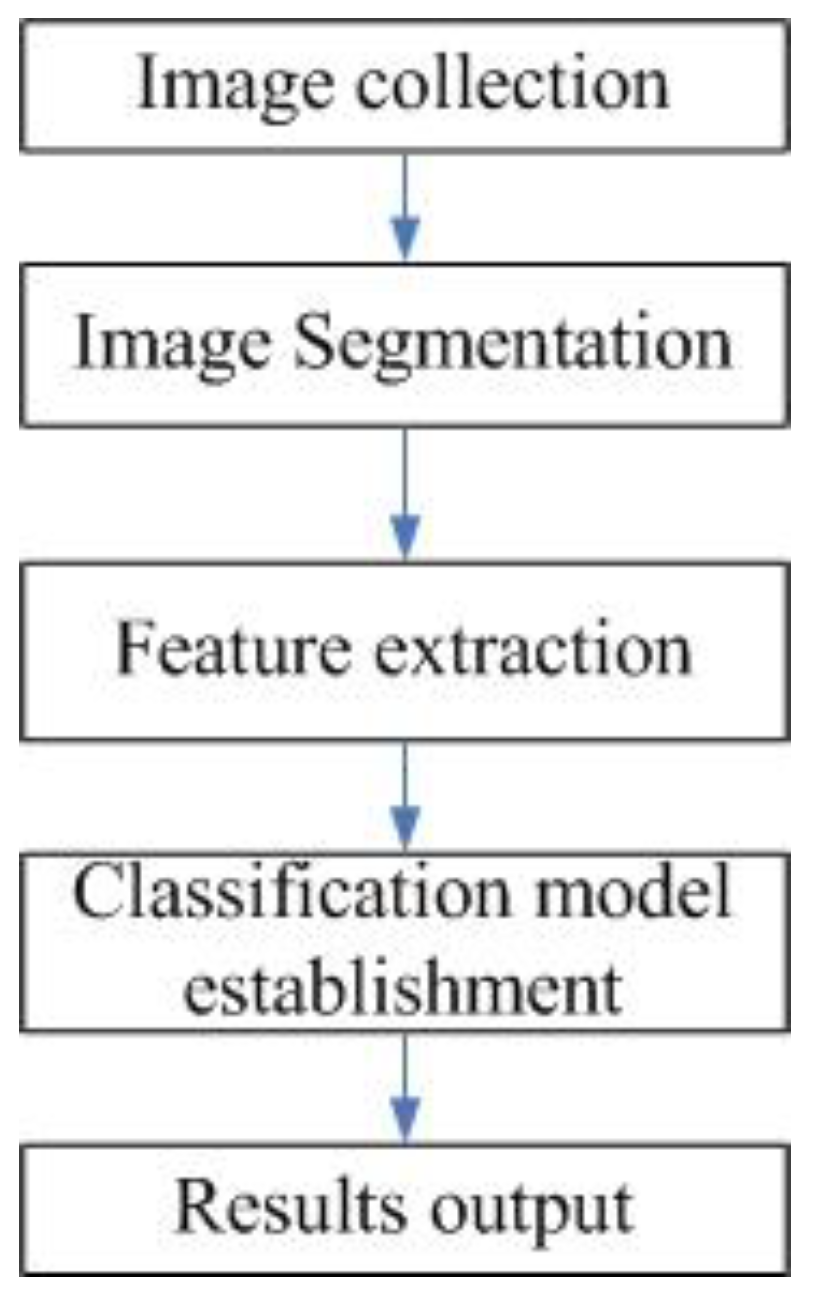
3. Methodology for Corn Classification

The process of corn classification is described in Figure 3 in detail.

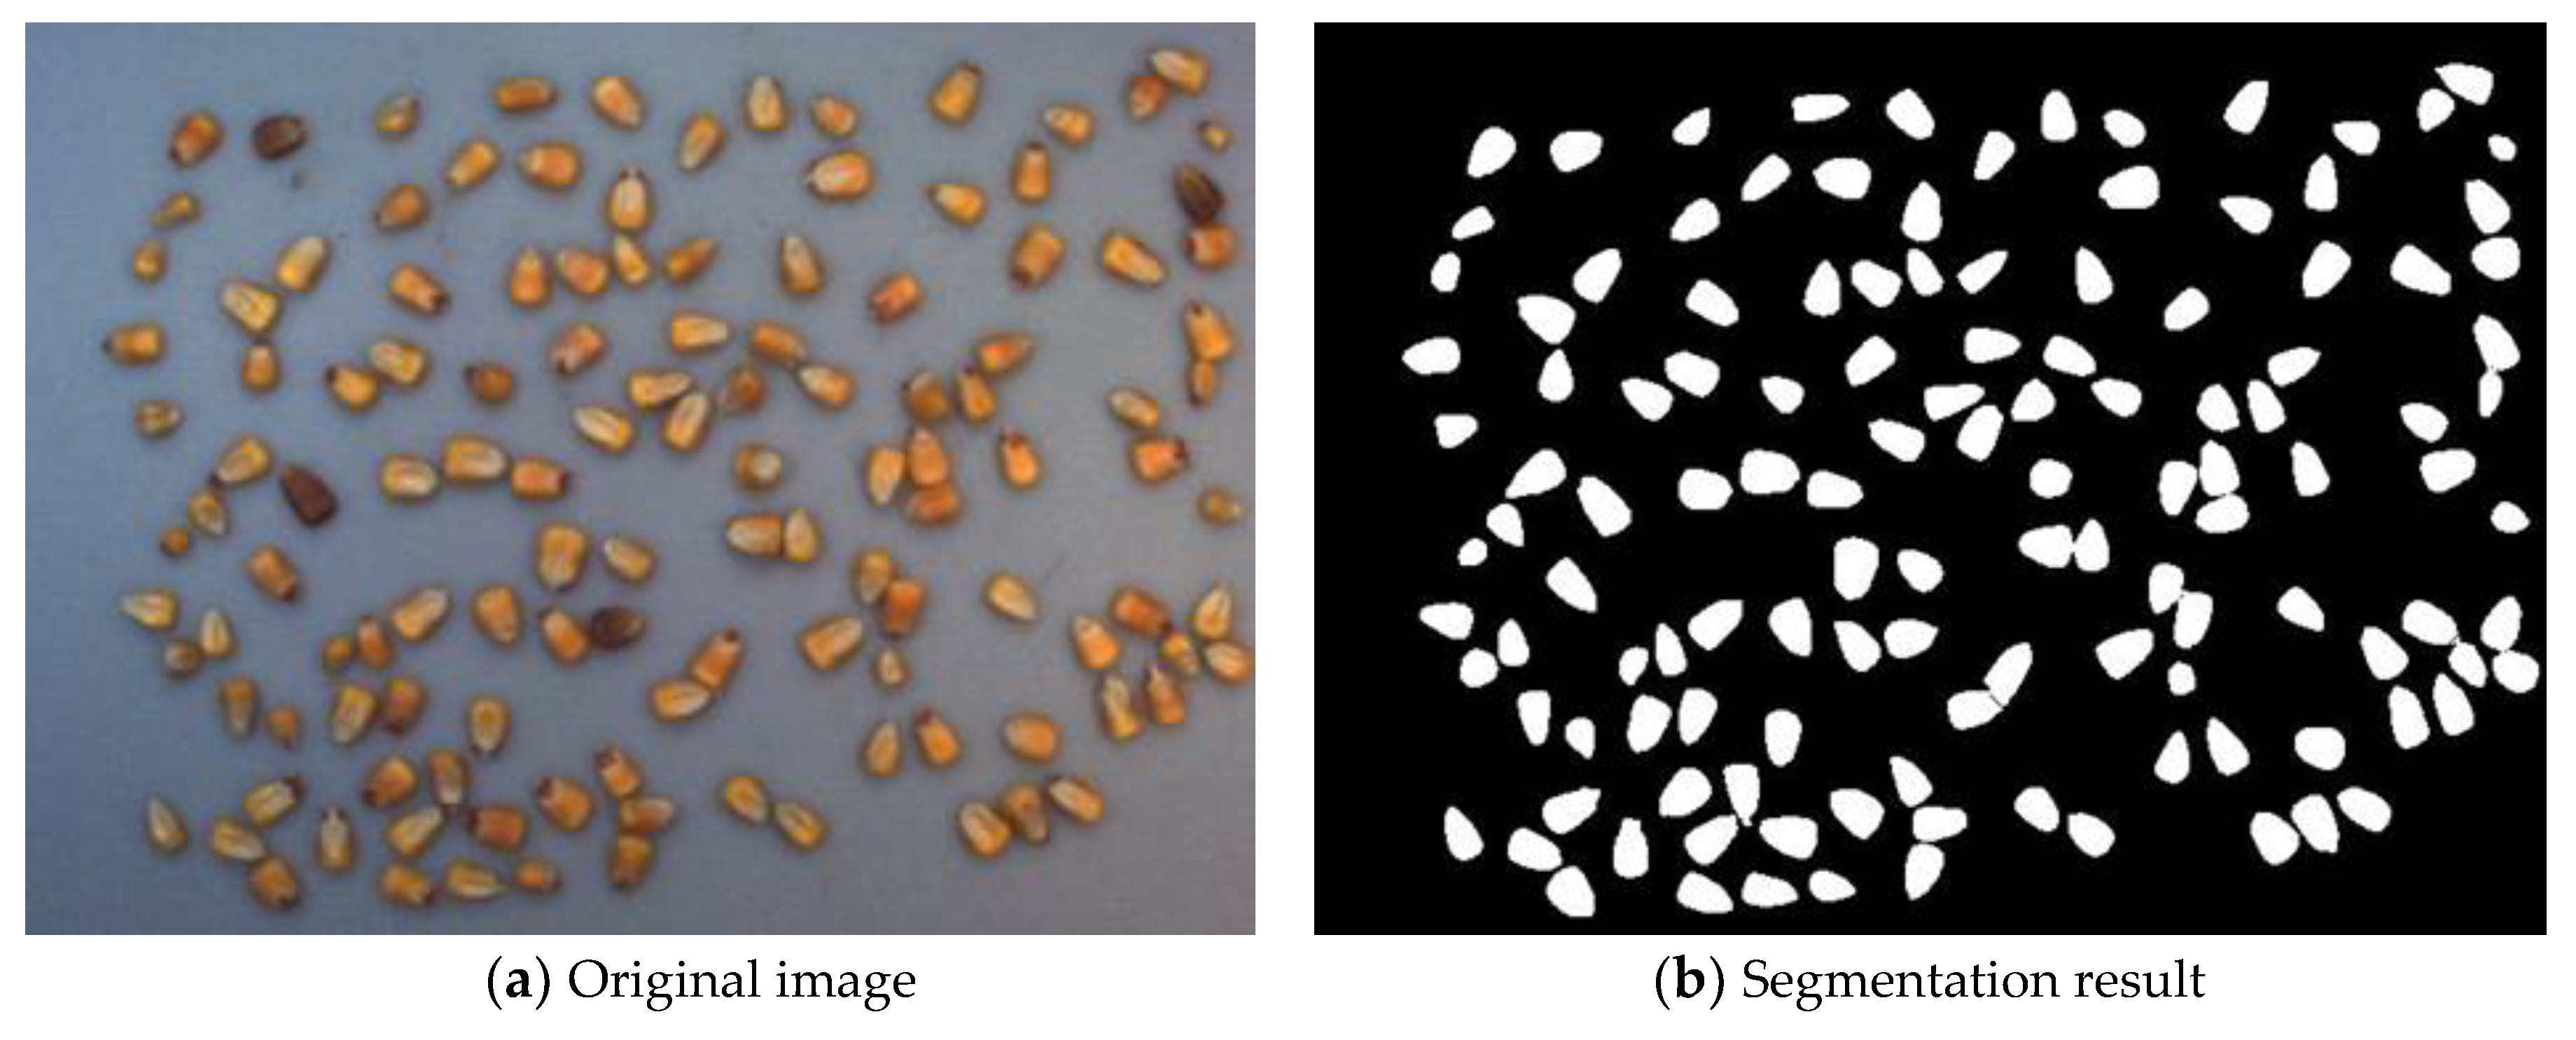
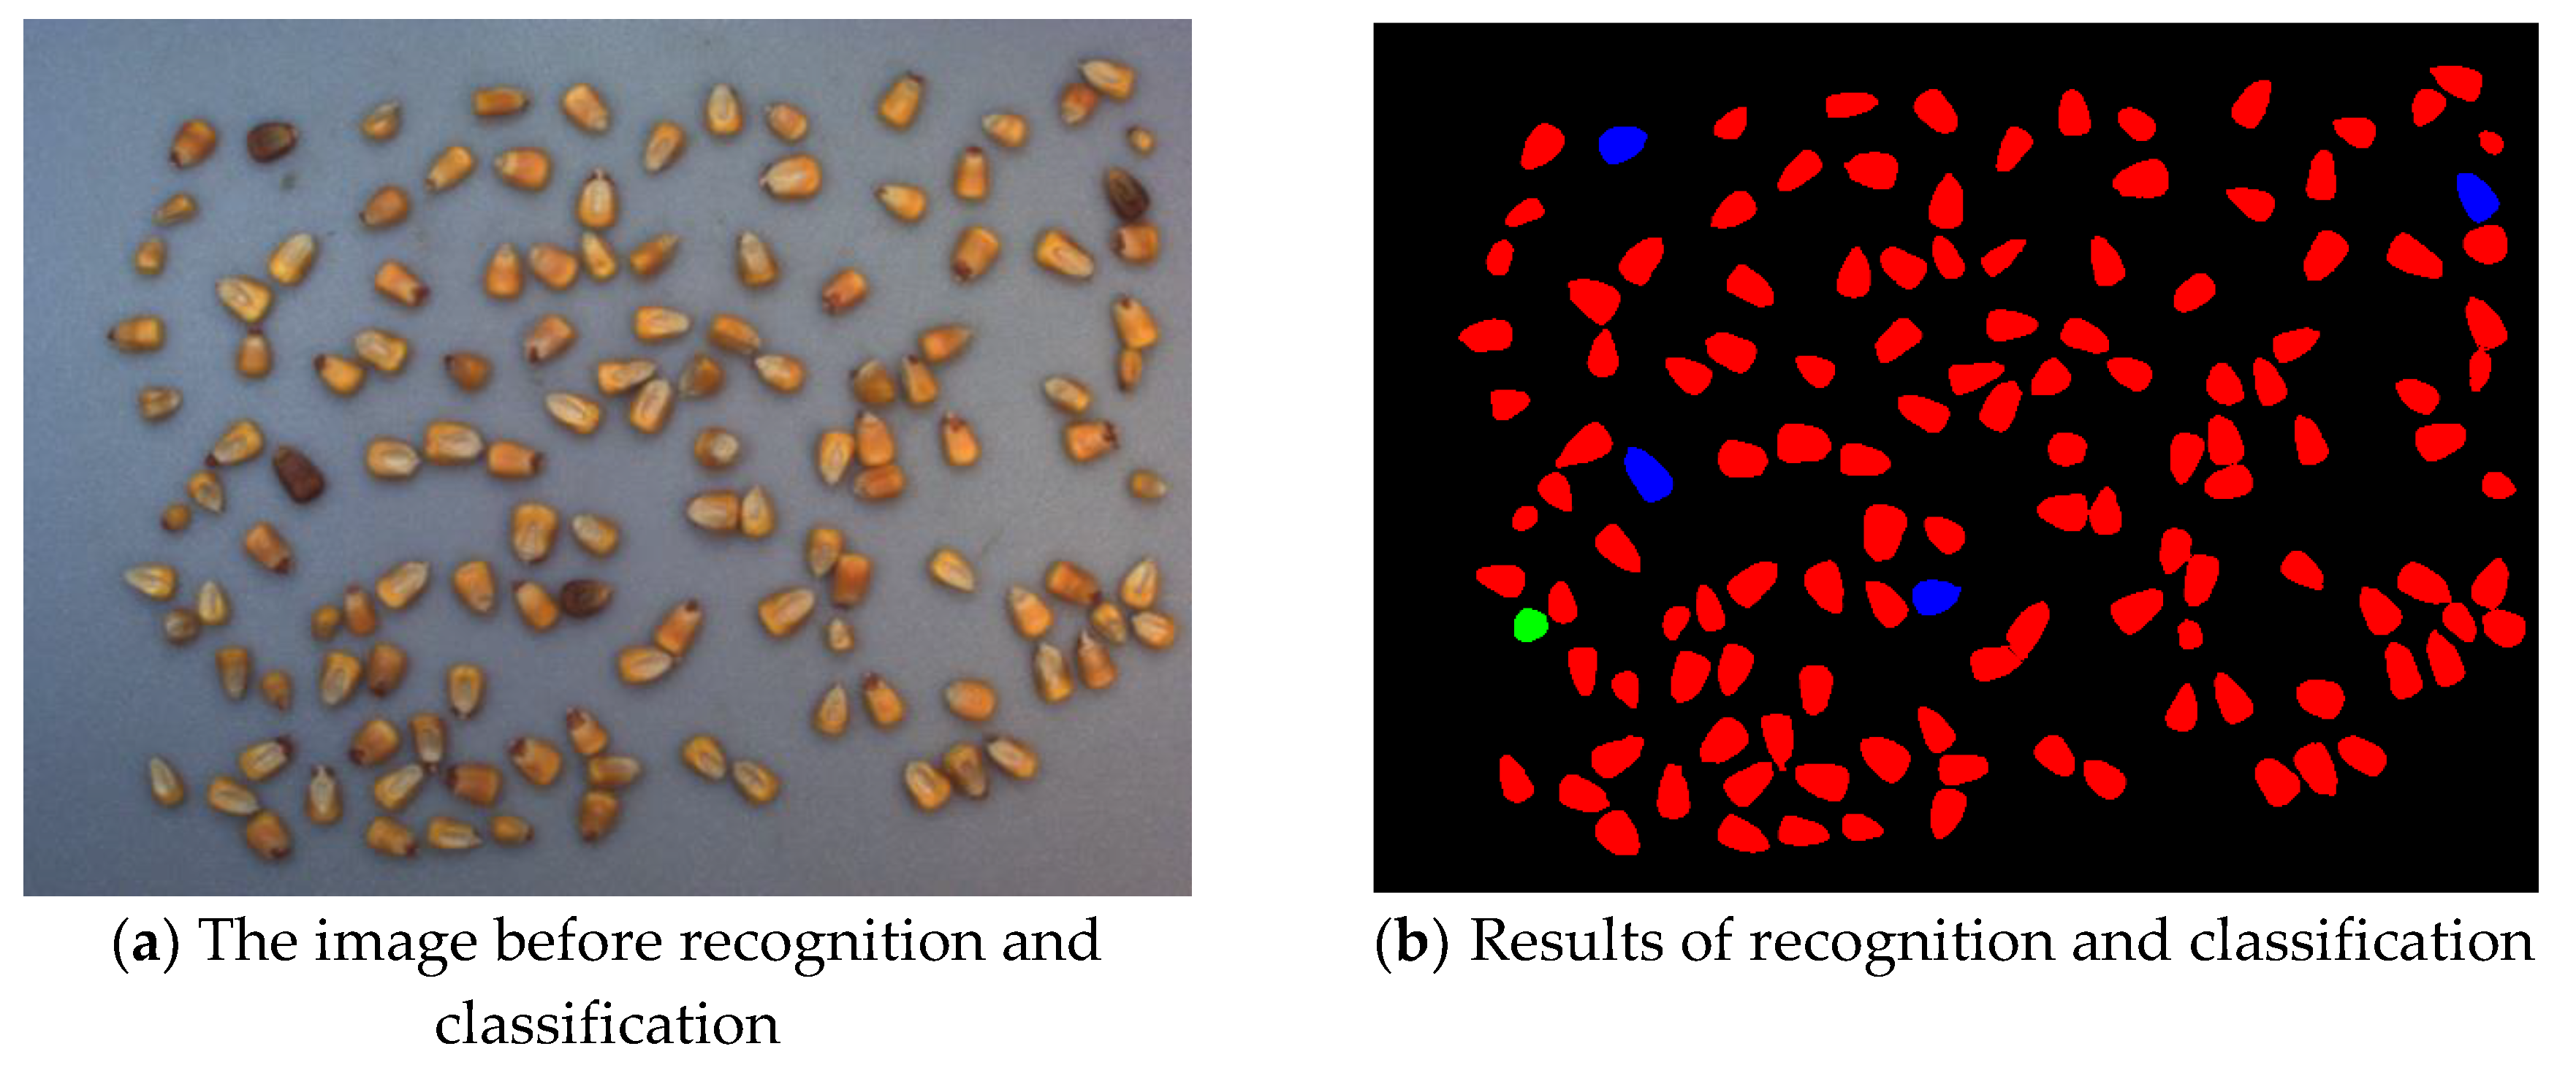
3.1. Image Segmentation

To address the problem of touching corn in corn classification, individual corns in the captured image should be accurately segmented first. This paper employed a line profile-based segmentation algorithm (denoted as LPSA) proposed in the work of [23]. Figure 4 describes the segmentation algorithm in detail. The LPSA is usually used to separate touching corn kernels. First, the input corn image was binarized by Otsu’s [24] method to separate corn from the background. Then, LPSA determined the coordinates of the centroid in the object image and created an axis line through the centroid, then it equidistantly created perpendicular lines in the axis line. Pixels that fell on a perpendicular line were summed, and a single value for every perpendicular line was obtained; the resulting vector was called a profile. The axis line rotated, and profiles were generated from other angles. The angle increment was constant. A corn kernel was represented as one nodule in the profile. Two touching corn kernels were presented as two nodules in the profile. The minimum point between the nodules was the touching between the corns. Profiles of a corn object were generated from various angles to find the ultimate angle to draw the split line that separated the touching corn. A result of corn segmentation with LPSA is shown in Figure 5, in which touching corns have been separated effectively.

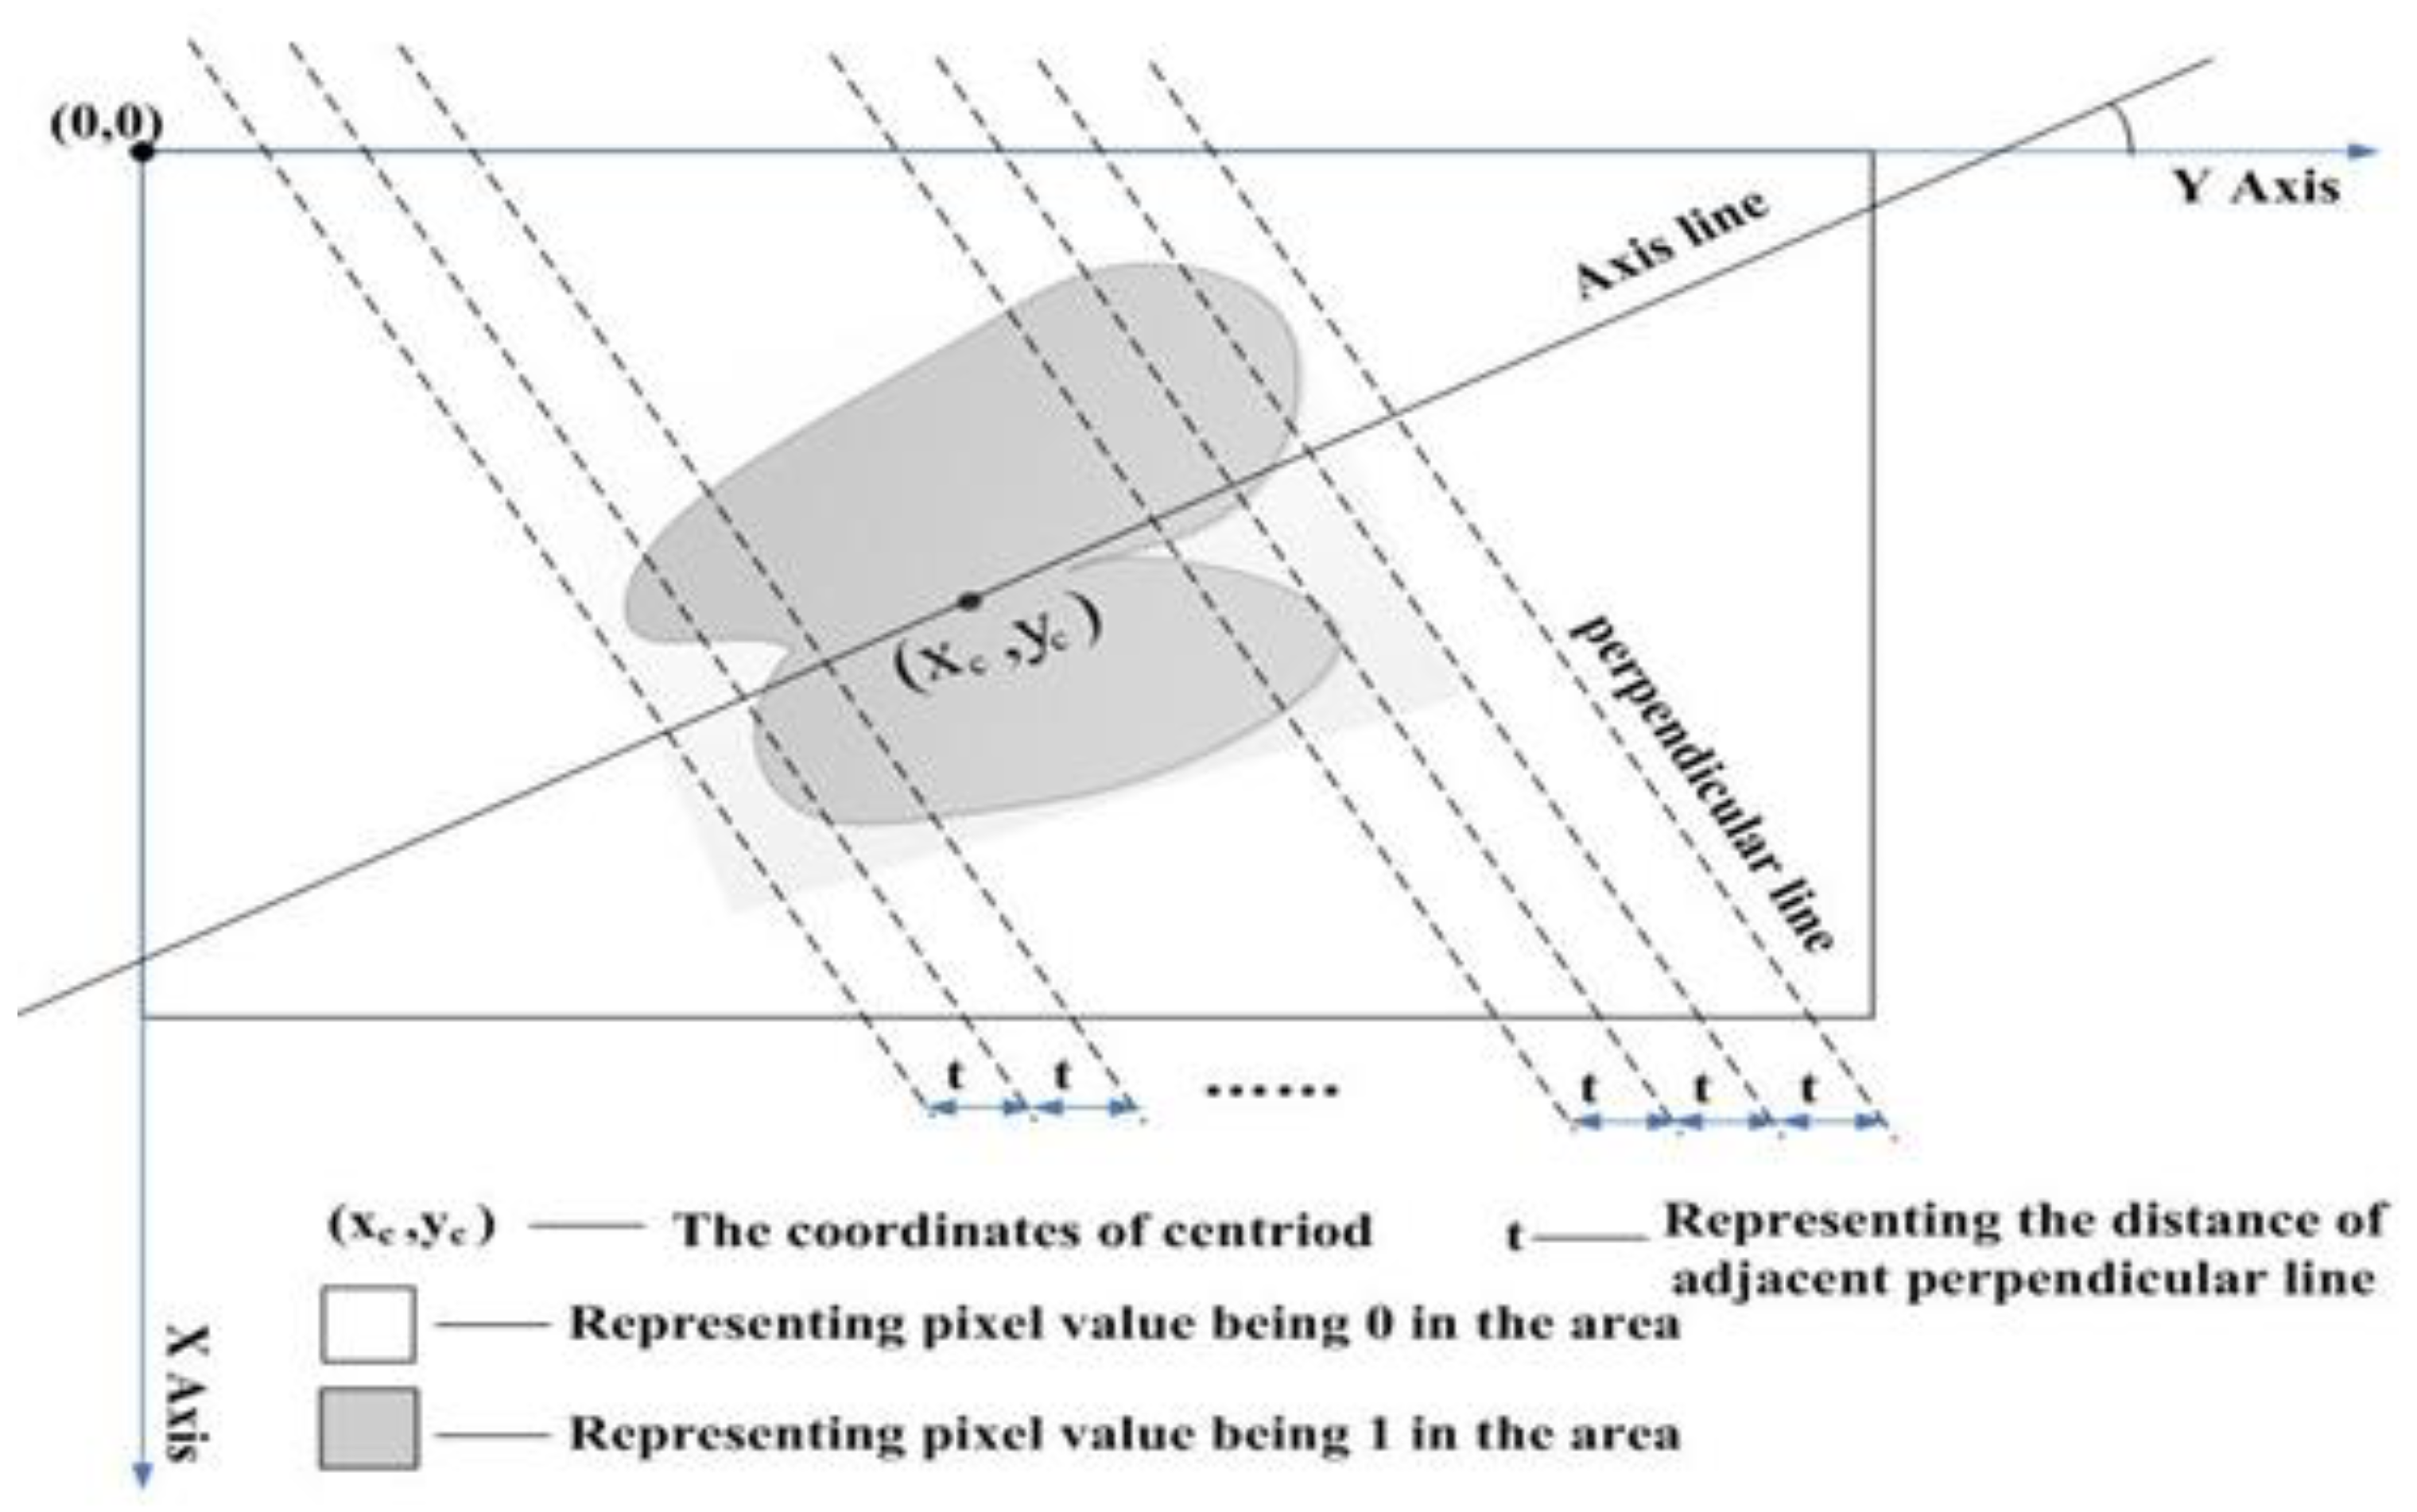
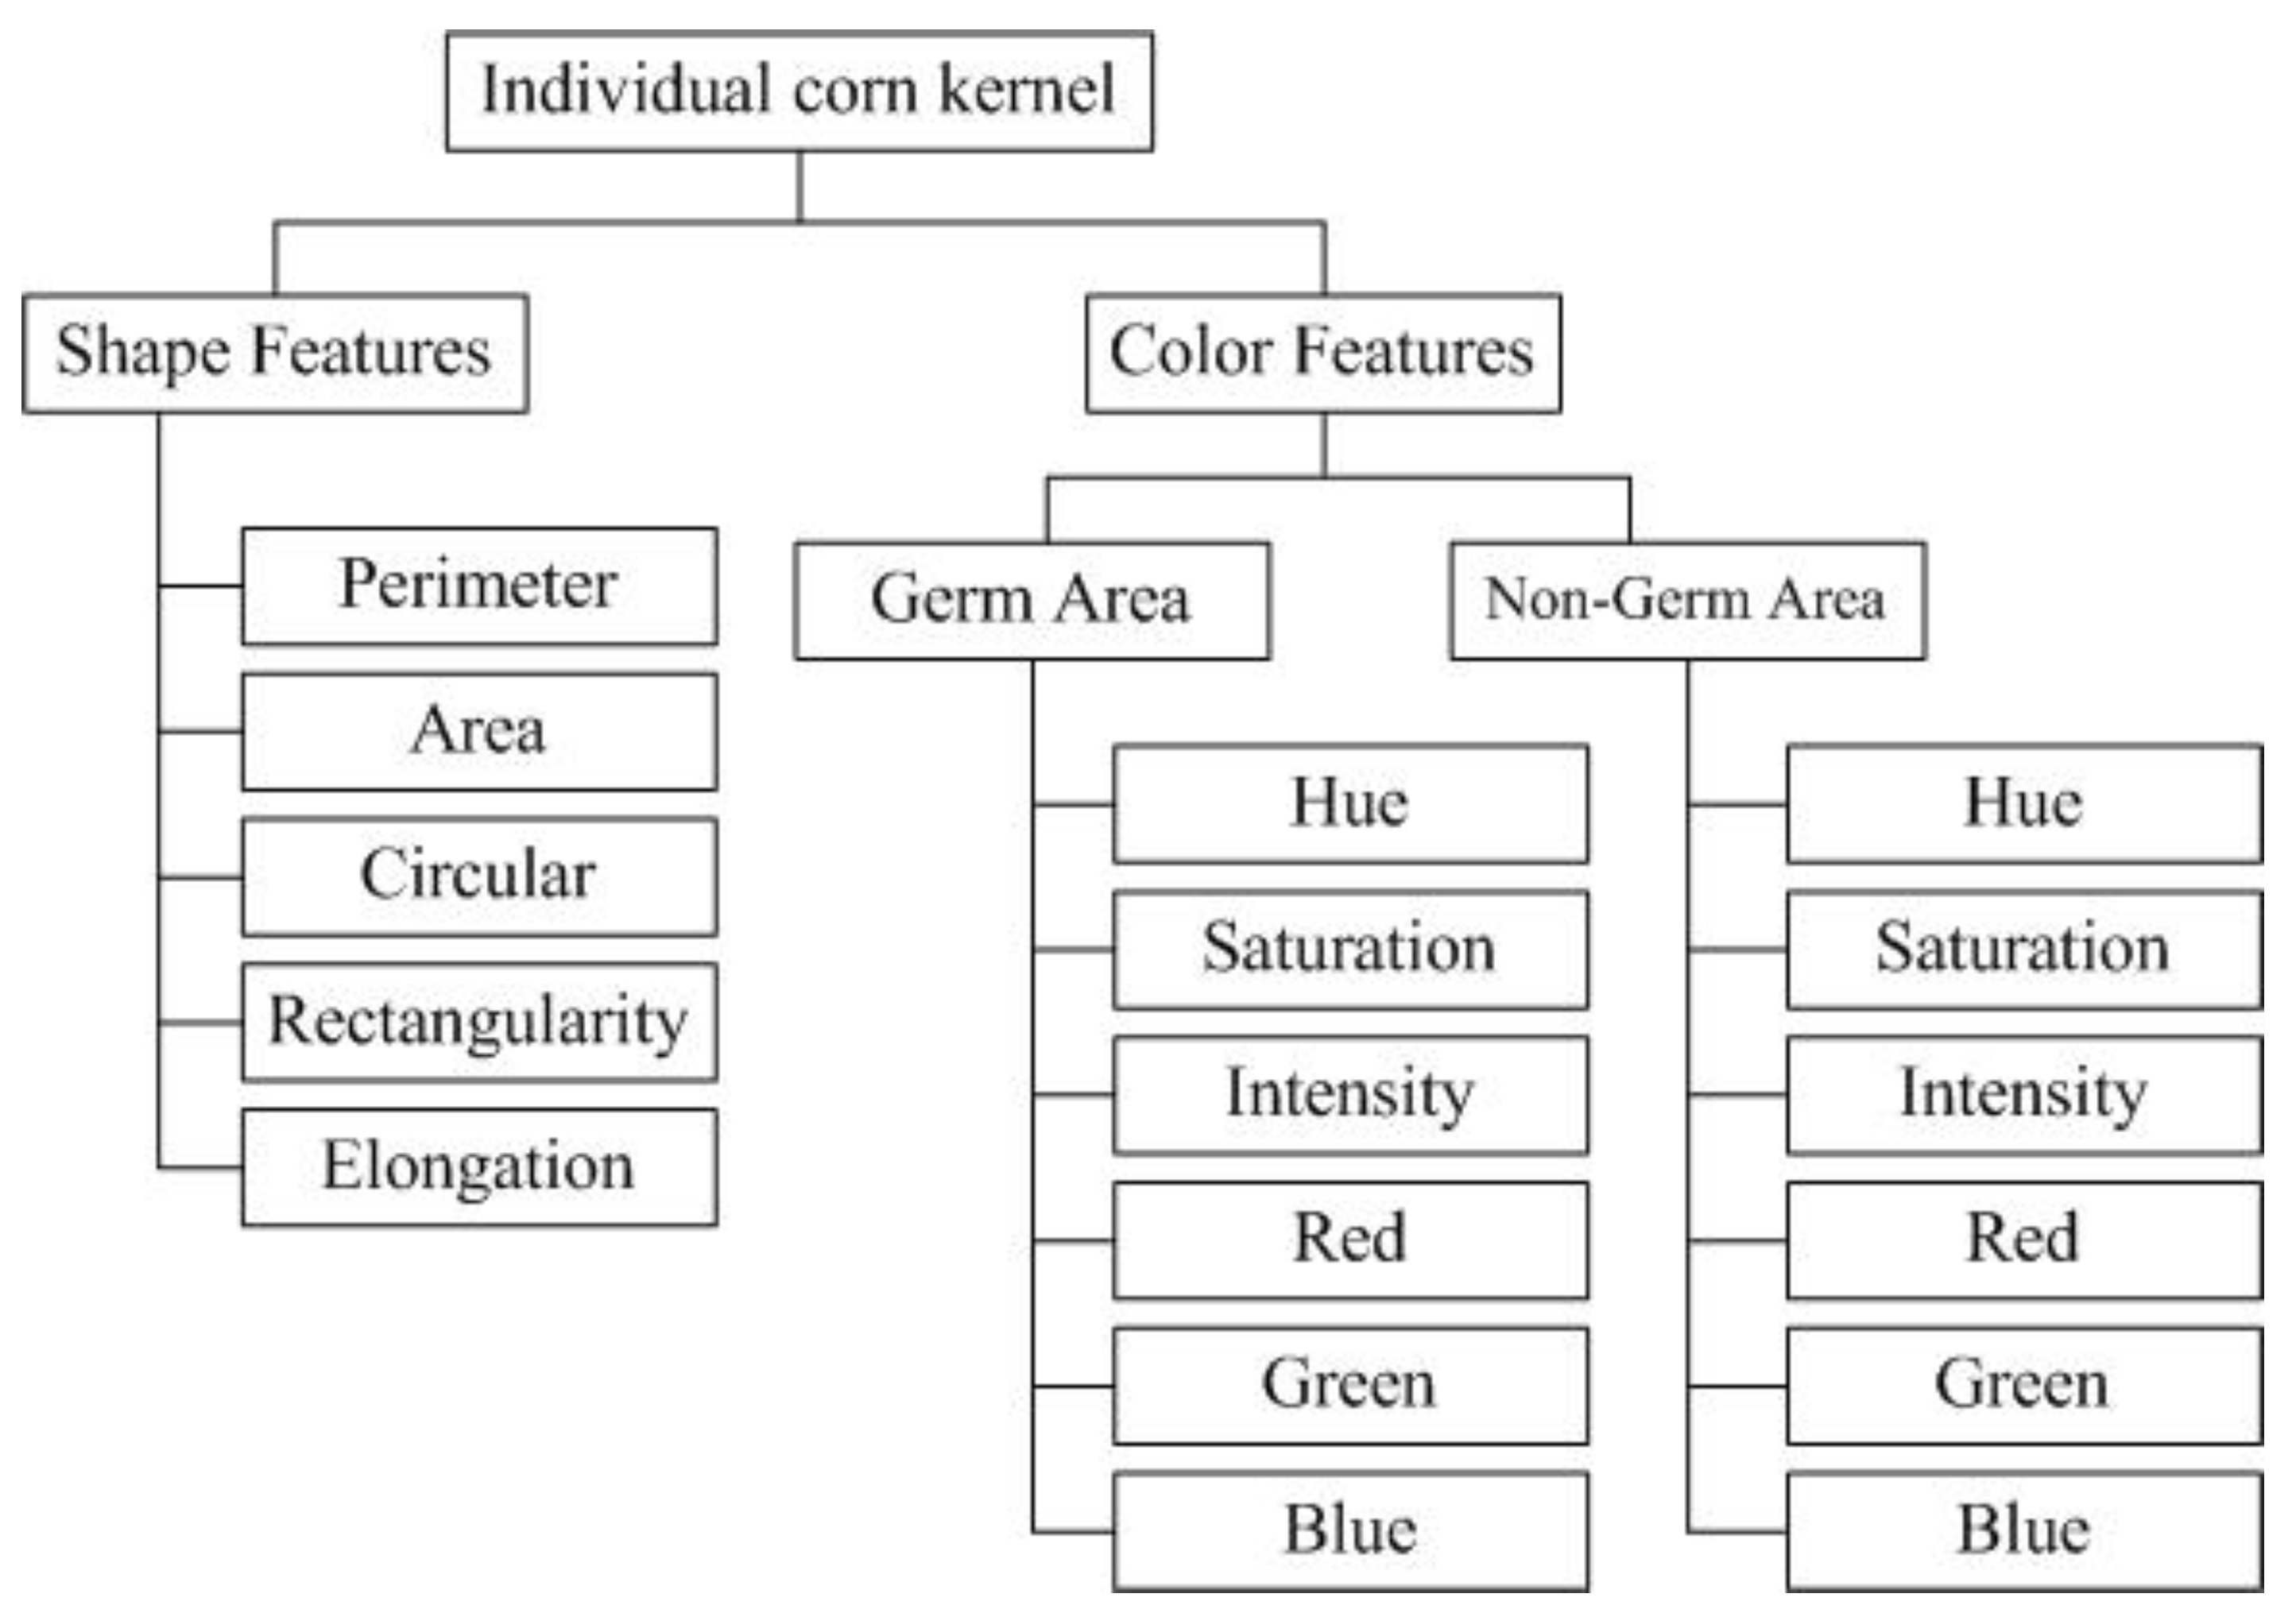
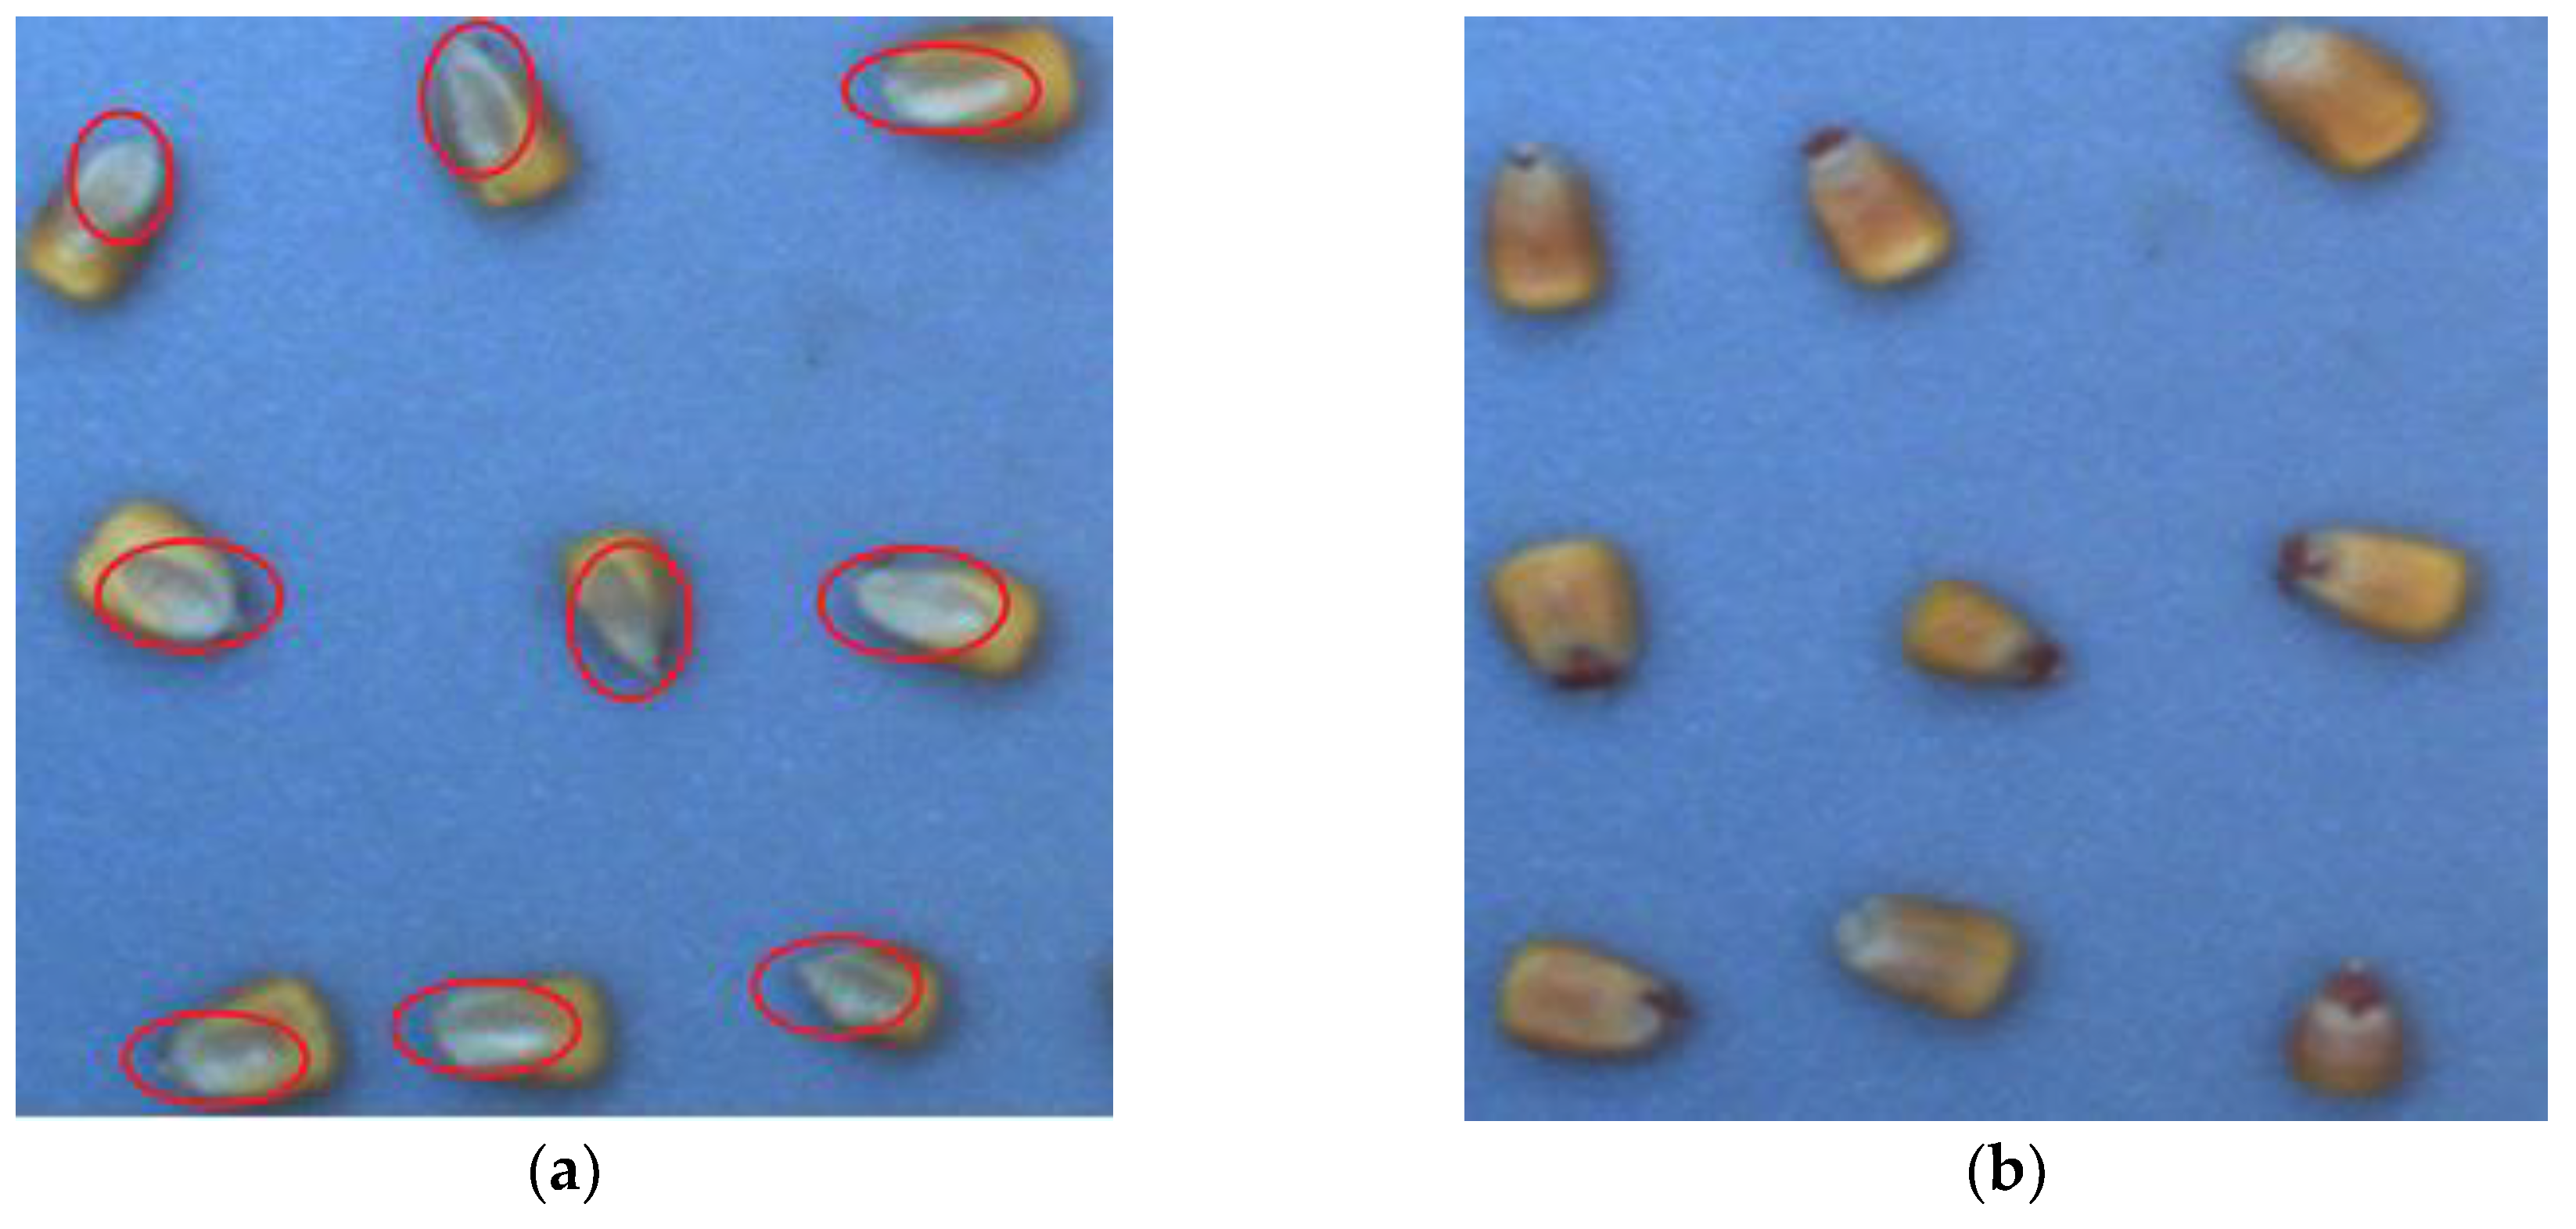
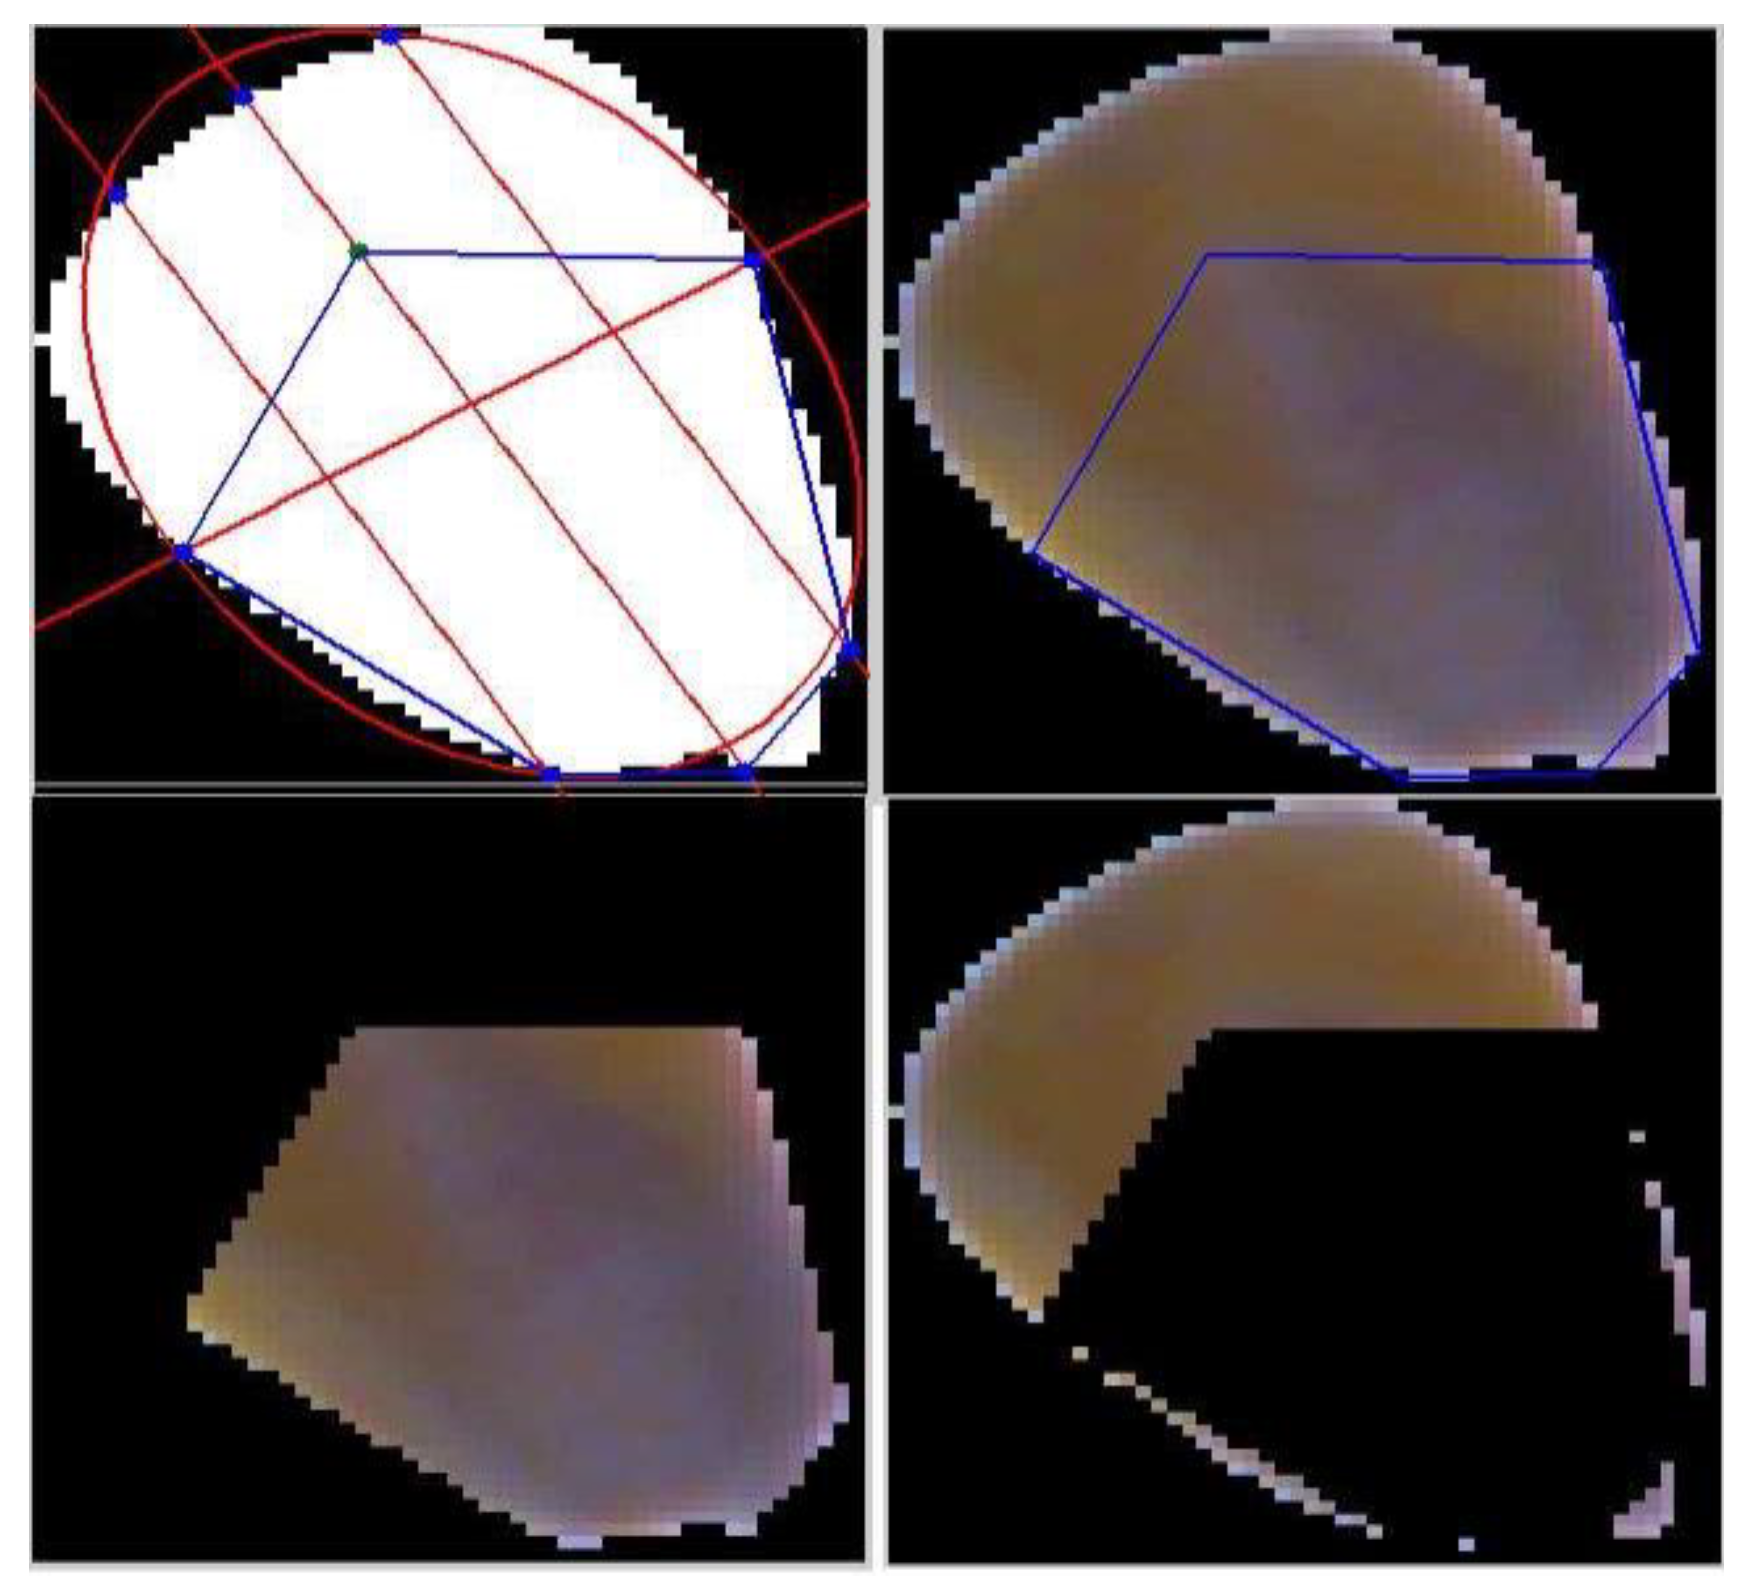
3.2. Feature Extraction

To distinguish different grades of the corn segmented by LPSA, features about color and shape are extracted in this section, as shown in Figure 6. Particularly, shape features were extracted from the segmented corn area, while color features were extracted from the corresponding corn area in the upper image, in which corns had a uniform illumination. The details of the features are described as follows.
Corn is predominantly white, yellow, and mixed. Most corns are white or yellow. In the market, white corn is more expensive than yellow corn [25]. Therefore, color is an important feature. Corn has two faces, they are: face up and face down. As shown in Figure 7, face up is the side of the corn that contains the germ area, and face down is the side of the corn that does not have a germ area. The germ area is usually white. We used a well-designed method to separate the germ area from corn [26]. As shown in Figure 8, a polygon is used to estimate the germ area. The mean intensity of the germ area calculated from each channel of RGB and HIS color space are then used as the color feature.
For shape features, we extracted five dimensional measurements of segmented corn, i.e., perimeter, area, circularity, rectangularity, and elongation, which were adjusted from the work of Zheng (2008) used for categorizing maize seed [27].
Perimeter was calculated by the method of eight connected chain codes:
P = sqrt ( 2 ) × ND + NX + NY
where P represents the perimeter of the corn kernel, ND is the number of odd chain codes, NX is the number of pixels in the horizontal direction, and NY is the number of pixels in the vertical direction. NX + NY is the number of even chain codes.
Area was calculated by counting the number of pixels in the corn image contour:
A = ( x , y ) S 1
where A represents the area of the corn kernel, S is the corn kernel region of image, (x, y) is the coordinate of a pixel inside S, and a pixel value of 1 was assumed in this study.
Circularity was defined as:
C = 4 π A / P 2
where C represents the circularity of the corn kernel, P is the perimeter of the corn kernel, and A is the area of the corn kernel.
Rectangularity was defined as:
R = A / ( H × W )
where R represents the rectangularity of the corn kernel, A is the area of the corn kernel, H is the long axis of the corn kernel, and W is the short axis of the corn kernel.
Elongation was defined as:
E = min ( H , W ) / max ( H , W )
where E represents elongation of the corn kernel, H is the height of the corn kernel, and W is the width of corn kernel.
Examples of five shape features extracted from three samples of normal and damaged corn kernels are listed in Table 1. The unit of perimeter and area was pixel (px), and in coordinates of the plane where corn images were captured, the width/length of each pixel was equal to about 0.09 mm.

3.3. Classification

After extracting color and shape features for each corn, we next used a maximum likelihood classifier to classify the grades of corn. Specially, classification of the corn consisted of two steps: training and testing. In the training step, every class of corn and image were captured, and features were extracted for every corn kernel in that class. Mean value and covariance of all corn in the image were obtained for every feature. In the testing step, a maximum likelihood estimator was implemented to classify corn [28]. Images of random classes of corn were captured, segmented, and features were extracted. Li and Yan developed a Bayesian decision rule to minimize misclassifications [29]. The classification formula used in this study is as follows:
d i ( x ) = ln P ( ω i ) n 2 ln ( 2 π ) 1 2 ln | C i | 1 2 [ ( x m i ) T C i 1 ( x m i ) ]
where P ( ω i ) is the probability of the class to occur, C i is the covariance matrix of the training feature, m i is the mean value of the training feature, x is the ith feature of every corn kernel, and d is the decision rule.

4. Experiments and Results

4.1. Experiment Settings

In our experiments there were seven kinds of corn, including normal corn and six kinds of damaged corn. For each group, 100 corns were selected to evaluate the proposed method. The ratio between training and testing was generally set to 7 to 3. The sample numbers of training sets and testing sets are shown in Table 2. Considering that heat damage, germ damage, and cob rot damage are three relative common damages of corn, a subset of normal corn and these three kinds of damaged corn was specially selected. The proposed method was firstly conducted on this subset, and then it was conducted on the whole set.

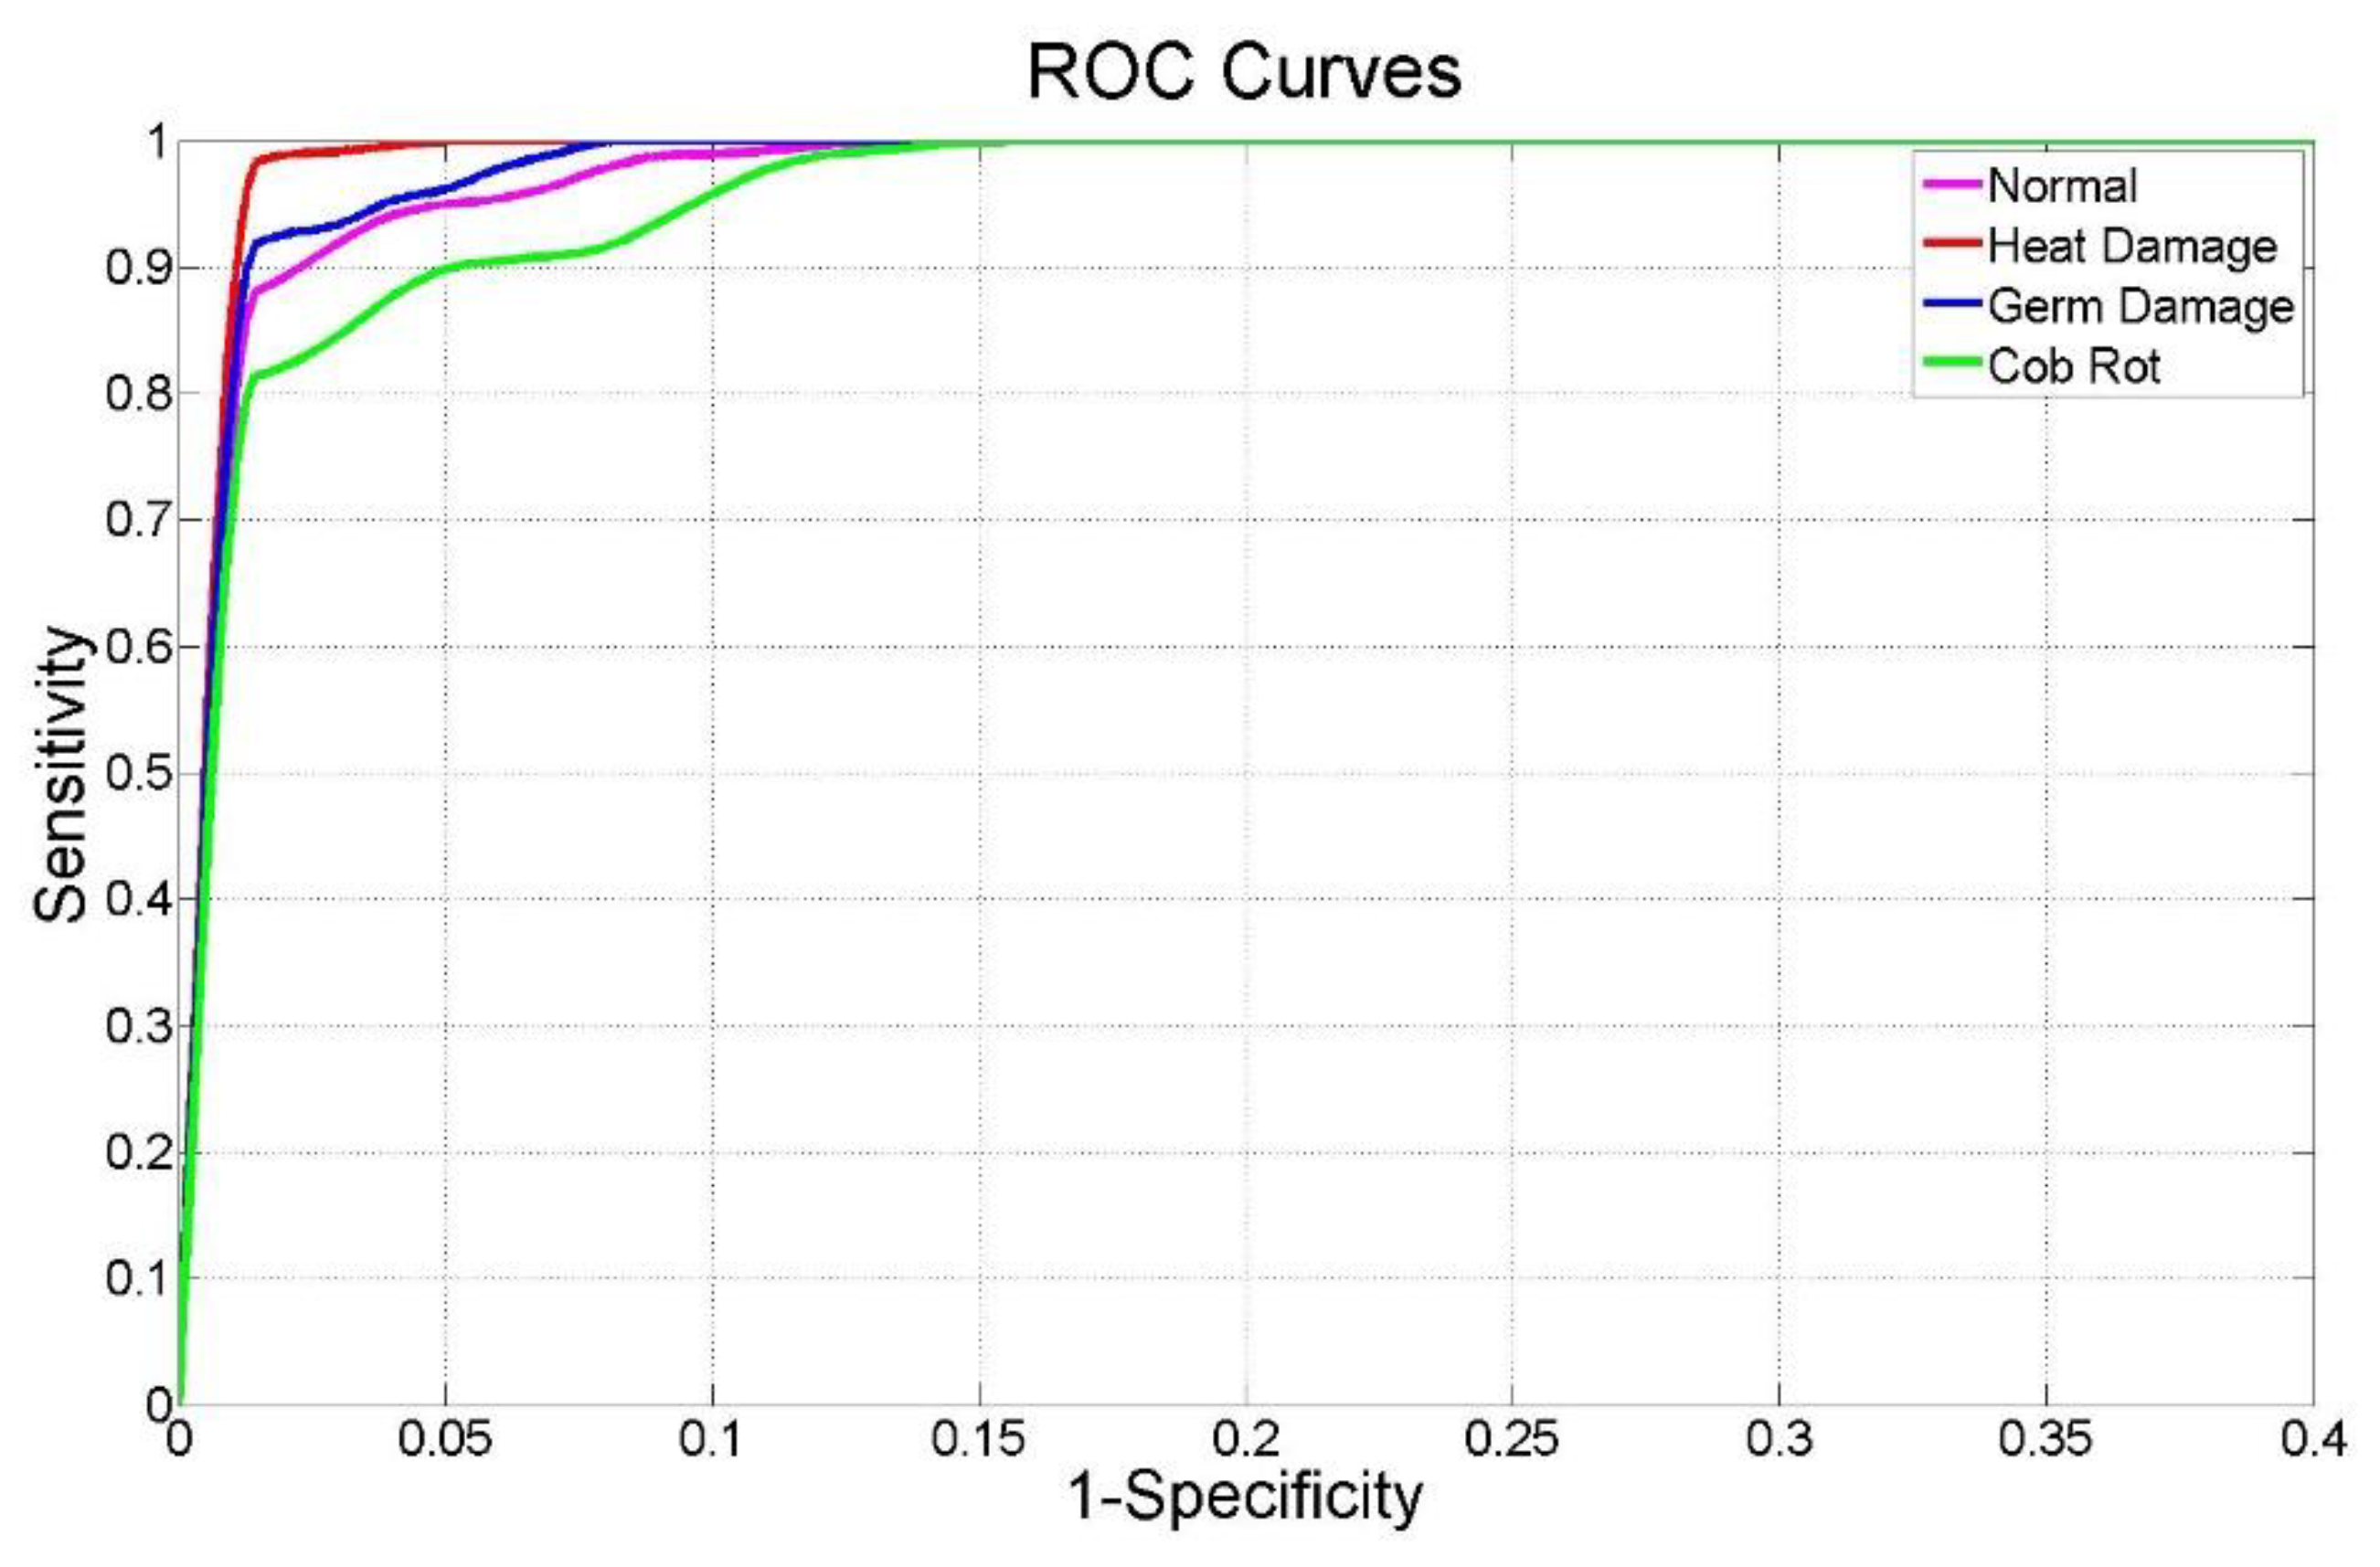
4.2. Results for Three Damaged and Normal Corns

This section demonstrates the classification results for four different corn types (i.e., three types of common damaged corn and normal corn). To evaluate the performance of our method, five different groups of training and testing sets were randomly selected from the whole dataset, and in each group there were 280 samples for training and 120 samples for testing. The proposed method achieved an average classification accuracy of 90.67% with a standard deviation of 4.35%. Table 3 shows the best classification results accompanied by the confusion matrix.
The system correctly classified 29 out of the 30 samples belonging to class 1 (96.67% accuracy), meanwhile, the classification error rate of class 2 and class 3 was 0.00, and this was a perfect state. On the other hand, the highest misclassification rate was in the cob rot class with a 10% error. Analyzing these errors, three samples of class 4 were misclassified in class 1. This meant that samples in class 4 had similar properties with samples in class 1.
Figure 9 depicts the ROC curves of the developed corn classification system for the four defined classes. On the other hand, Table 4 shows the performance results of the classification method using sensitivity, accuracy, and specificity and the area under the ROC curve (AUC) for each class.
The maximum value of sensitivity (100%) was reached in the heat-damaged and germ-damaged classes. Table 3 proved this fact, since classification error of the two classes was 0. The maximum value of specificity (100%) was given in class 3. Maximum accuracy was given in the heat-damaged class at 100%, and it had the highest sensitivity. In general, all the classes obtained very similar results, so the system would be able to work for corn sorting in intelligent agriculture. For each type, the proposed method achieved an AUC value greater than 0.98. This proved that the proposed classification method was not only accurate but also robust in relation to its parameters. Only class 4 presented a lower AUC value, indicating slight confusion with class 1.
Figure 10 shows a representative image of the classification results from the developed corn classification system. The red, green, white, and blue regions were used to indicate different types of classified corns, including normal corn, cob-rot and heat-damaged, and germ-damaged corn.
Figure 10a is the image before recognition and classification. There were 126 corns including 4 germ-damaged corns and 122 normal corns. Figure 10b is the result from the developed corn classification system. A normal corn was misidentified as cob-rot corn. Its accuracy was 99.2%.

4.3. Results and Discussion for Six Damaged and Normal Corns

On the basis of the above-mentioned classification of four types of corns, the classification experiments of seven types of corns, i.e., six damaged corns and normal corn, were further carried out. Similarly, five different groups of training and testing sets were randomly selected and formed, and in each group there were 490 samples for training and 210 samples for testing. The proposed method achieved an average classification accuracy of 67.48% with a standard deviation of 7.79%. Table 5 shows the best classification results for six different types of damaged corns and normal corn accompanied by the confusion matrix.
Notably, the results of the seven classifications using the above-mentioned classification method were unsatisfactory. Table 5 shows that the maximum misclassification rate was in classes 5 and 6 with a 46.67% error, and the misclassification rate of class 7 was 40%. Analyzing these errors, it was found that these errors mainly came from the three newly added categories: blue eye mold (class 5), insect damage (class 6), and surface mold (class 7). Class 5 was mainly misclassified in class 3 and class 4. Class 6 was mainly misclassified in class 2 and class 3. Class 7 was mainly misclassified in class 2 and class 6. This meant that samples in class 5 had very similar properties with samples in class 3 and class 4, and samples in class 6 had very similar properties with samples in class 2 and class 3, and samples in class 7 had very similar properties with samples in class 2 and class 6.
According to this case, some aspects should be improved in further research work. For example, classification methods should be improved using deep-learning, and feature selection should be optimized through adding texture features. In addition, the image collection system can be optimized, where the lighting system can become more uniform to ensure preserving true color of the corn and a more accurate feature calculation. Fresh corn can be harvested from the field to perform the official classification test using computer vision technology. Since these were preliminary results, more damage samples could be studied, including sprout-damaged samples. The repeatability of the system can be tested. For example, two damaged sample groups can be selected with 140 normal corns and 20 damaged corns in each group. This can be repeated to capture 10 images of each group to evaluate the repeatability of the system.

5. Conclusions

A corn classification system based on computer vision was developed to provide an alternative solution to the traditional classification test. Images were acquired using an image collection system, which consisted of an imaging table, two-way lighting system, a camera, and a computer. A line profile segmentation algorithm was adopted to segment groups of touching corns to individual corn images. Twelve color features and five shape features were extracted from the segmented individual corn images. A maximum likelihood estimator was used to classify corns to normal, cob-rot, germ-damaged, heat-damaged, and other damage types. To validate the corn classification system, four and seven groups of corns were tested including normal samples and different types of damaged samples. This classification method achieved better performances in four classifications for corn images. The results showed that the corn classification system provided accurate classification of the corns into four classifications. In general, a corn classification system based on computer vision can be used to offer considerable advantages for the detection of small touching objects.

Author Contributions

Data curation, X.L.; funding acquisition, X.L.; methodology, X.L. and W.L.; supervision, B.D. and H.S.; writing—original draft, X.L. and W.L.; writing—review & editing, B.D. and H.S.

Funding

This research was funded by Natural Science Foundation of Heilongjiang Province of China, grant number F2017002.

Acknowledgments

The authors would highly appreciate the kind supports of Jun Qin for experimental materials.

Conflicts of Interest

The authors declare no conflict of interest.

References

  1. USDA. World Agricultural Supply and Demand Estimates. Available online: https://www.usda.gov/oce/commodity/wasde/ (accessed on 1 March 2019).
  2. Hill, L.D. Grain Grades and Standards: Historical Issues Shaping the Future; University of Illinois Press: Champaign, IL, USA, 1990. [Google Scholar]
  3. Rendleman, M.; Legacy, J. Grain Grading and Handling. Available online: https://eric.ed.gov/?id=ED208230 (accessed on 1 March 2019).
  4. U.S. Department of Agriculture; Grain Inspection, Packers and Stockyards Administration; Federal Grain Inspection Service. Grain Inspection Handbook, Book II, Chapter 4: Corn; U.S. Department of Agriculture: Washington, DC, USA, 2007.
  5. Zayas, I.; Converse, H.; Steele, J. Discrimination of Whole from Broken Corn Kernels with Image Analysis. Transac. ASAE 1990, 33, 1642–1646. [Google Scholar]
  6. Ni, B.; Paulsen, M.R.; Liao, K.; Reid, J.F. Design of an automated corn kernel inspection system for machine vision. Trans. ASAE 1997, 40, 491–497. [Google Scholar]
  7. Ni, B.; Paulsen, M.R.; Reid, J.F. Corn kernel crown shape identification using image processing. Trans. ASAE 1997, 40, 833–838. [Google Scholar] [CrossRef]
  8. Ni, B.; Paulsen, M.R.; Reid, J.F. Size Grading of Corn Kernels with Machine Vision. Am. Soc. Agric. Eng. 1998, 17, 567–571. [Google Scholar] [CrossRef]
  9. Luo, X.; Jayas, D.S.; Symons, S.J. Identification of Damaged Kernels in Wheat using a Colour Machine Vision System. J. Cereal Sci. 1998, 30, 49–59. [Google Scholar] [CrossRef]
  10. Steenhoek, L.W.; Misra, M.K.; Hurburgh, R.H., Jr.; Bern, C.J. Implementing a Computer Vision System for Corn Kernel Damage Evaluation. Am. Soc. Agric. Eng. 2001, 17, 235–240. [Google Scholar] [CrossRef]
  11. Dana, W.; Ivo, W. Computer image analysis of seed shape and seed color for flax cultivar description. Comput. Electron. Agric. 2008, 61, 126–135. [Google Scholar] [CrossRef]
  12. Chen, X.; Xun, Y.; Li, W.; Zhang, J.X. Combining discriminant analysis and neural networks for corn variety identification. Comput. Electron. Agric. 2010, 71, 48–53. [Google Scholar] [CrossRef]
  13. Arribas, J.I.; Gonzalo, V.; Sánchez-Ferrero, R.-R.G. Leaf classification in sunflower crops by computer vision and neural networks. Comput. Electron. Agric. 2011, 78, 9–18. [Google Scholar] [CrossRef]
  14. Gao, J.G.; Zhang, S. A rapid corn sorting algorithm based on machine vision. J. Theor. Appli. Inf. Technol. 2012, 45, 315–319. [Google Scholar]
  15. Valiente-González, J.M. Automatic corn (Zea mays) kernel inspection system using novelty detection based on principal component analysis. Biosys. Eng. 2014, 117, 94–103. [Google Scholar] [CrossRef]
  16. Liu, C.Q.; Chen, B.Q. Method of image detection for ear of corn based on computer vision. Transac. Chin. Soc. Agric. Eng. 2014, 30, 131–138. [Google Scholar]
  17. Mohammad, A.J.G.; Khamis, S.; Mohammad, F. Feature decision-making ant colony optimization system for an automated recognition of plant species. Exp. Syst. Appl. 2015, 42, 2361–2370. [Google Scholar]
  18. Gao, X.H.; Liu, B. Design and experiment of fresh corn quality detection classifier based on machine vision. Transac. Chin. Soc. Agric. Eng. 2016, 32, 298–303. [Google Scholar]
  19. Sun, X.; Guo, M.; Ma, M. Identification and classification of damaged corn kernels with impact acoustics multi-domain patterns. Comput. Electron. Agric. 2018, 150, 152–161. [Google Scholar] [CrossRef]
  20. Zhang, J.; Dai, L.M.; Cheng, F. Classification of Frozen Corn Seeds Using Hyperspectral VIS/NIR Reflectence Imaging. Molecules 2019, 24, 149. [Google Scholar] [CrossRef] [PubMed]
  21. Chouhan, S.S.; Singh, U.P.; Jain, S. Applications of Computer Vision in Plant Pathology: A Survey. Arch. Comput. Methods Eng. 2019, 2, 1–22. [Google Scholar] [CrossRef]
  22. Sabzi, S.; Abbaspour-Gilandeh, Y.; García-Mateos, G.; Ruiz-Canales, A.; Molina-Martínez, J.M.; Arribas, J.I. An Automatic Non-Destructive Method for the Classification of the Ripeness Stage of Red Delicious Apples in Orchards Using Aerial Video. Agronomy 2019, 9, 84. [Google Scholar] [CrossRef]
  23. Mahdi, A.; Qin, J. Line Profile Based Segmentation Algorithm for Touching Corn Kernels. Available online: https://arxiv.org/pdf/1706.00396 (accessed on 1 March 2019).
  24. Gonzalez, R.C.; Woods, R.E. Digital Image Processing, 3rd ed.; Pearson: London, UK, 2007. [Google Scholar]
  25. White, P.J.; Johnson, L.A. Corn: Chemistry and Technology, 2nd ed.; American Association of Cereal Chemists: Eagan, MN, USA, 2003. [Google Scholar]
  26. Liu, J.; Paulsen, M.R. Corn Whiteness Measurement and Classification Using Machine Vision. Trans. ASAE 2000, 43, 757–763. [Google Scholar] [CrossRef]
  27. Zheng, M.J.; Huang, X.F. The image of maize seeds’ modal characteristics extraction. Sci. Pap. Online 2008, 3, 1–5. [Google Scholar]
  28. Duda, R.O.; Hart, P.E.; Stork, D.G. Pattern Classification, 2nd ed.; Wiley: Hoboken, NJ, USA, 2012. [Google Scholar]
  29. Li, T.F.; Yen, T. A Bayes Empirical Bayes Decision Rule for Classification. Commun. Stat. 2005, 34, 1137–1149. [Google Scholar] [CrossRef]
Figure 1. Corn image collection system.
Symmetry 11 00591 g001
Figure 2. Illustrations of images captured with different lighting systems. (a) corn image captured using lower fluorescent lamps, and (b) corn image captured using upper fluorescent lamps.
Symmetry 11 00591 g002
Figure 3. Flowchart of the proposed corn classification method.
Symmetry 11 00591 g003
Figure 4. Schematic diagram of the line profile-based segmentation algorithm.
Symmetry 11 00591 g004
Figure 5. Corn segmentation results with the line profile-based segmentation algorithm.
Symmetry 11 00591 g005
Figure 6. The feature extraction tree for each corn kernel.
Symmetry 11 00591 g006
Figure 7. Illustration of two faces of corn. (a) the face up of corn and (b) the face down of corn.
Symmetry 11 00591 g007
Figure 8. Illustration of germ area detection.
Symmetry 11 00591 g008
Figure 9. ROC curves for classification results of three types of damaged corns and normal corn.
Symmetry 11 00591 g009
Figure 10. Classification results for a group of corns.
Symmetry 11 00591 g010
Table 1. Examples of five shape features for three samples of normal and six kinds of damaged corns.
NamePerimeter (px)Area (px)CircularityRectangularityElongation
Category
Blue eye mold306.149362390.83650.72940.9681
273.078245560.76770.65370.9647
338.634673200.80220.72530.7500
Cob Rot335.806176910.85710.769870.8108
366.960581930.76460.64170.9825
318.634666840.82730.71930.9109
Germ damage289.391950020.75060.70610.8366
300.651859180.822730.81890.7374
284.350358680.91200.81620.8681
Heat damage323.521971310.85620.81780.7339
358.977783890.81810.76880.7097
335.764566190.73780.75800.6271
Insect damage358.492481480.79670.77600.6720
359.433561710.60020.61280.8962
337.764573000.80410.78650.6555
Surface mold312.492462400.80300.72120.8155
310.793962440.81230.80300.6667
322.007170610.85570.79300.7925
Normal349.019377590.80040.70700.7881
350.333080580.82500.7040.8220
332.521974590.84770.82220.7232
Table 2. Sample numbers of training sets and testing sets in validation experiments.
No.CategoryNumbers of Training SetsNumbers of Testing Sets
1Blue eye mold7030
2Cob rot7030
3Germ damage7030
4Heat damage7030
5Insect damage7030
6Surface mold7030
7Normal7030
Table 3. Confusion matrix for four kinds of classification results. Classes: 1. Normal; 2. Heat-damaged; 3. Germ-damaged; and 4. Cob-rot.
Predicted/Real Class1234All DataClassification Error by Class (%)Classification Accuracy (%)
129010303.3396.67
203000300.00
300300300.00
4300273010.00
Table 4. Performance results using different criteria: sensitivity, accuracy, and specificity, and area under the ROC curve (AUC). Classes: 1. Normal; 2. Heat-damaged; 3. Germ-damaged; and 4. Cob-rot.
ClassSensitivity (%)Accuracy (%)Specificity (%)AUC
196.6796.6798.860.9884
2100.00100.0098.850.9945
3100.0099.17100.000.9915
490.0097.5096.740.9833
Table 5. Confusion matrix of seven kinds of classification results. Classes: 1. Normal; 2. Heat-damaged; 3. Germ-damaged; 4. Cob-rot; 5. Blue eye mold; 6. Insect-damaged; and 7. Surface mold.
Predicted/Real Class1234567All DataClassification Error by Class (%)Classification Accuracy (%)
1270002103010.0074.76
2027000213010.00
3022610013013.33
4011270103010.00
5026516103046.67
6164101623046.67
7041115183040.00

