Impacts of Climate Change and Human Activity on the Runoff Changes in the Guishui River Basin

Abstract
:
1. Introduction
2. Materials and Methods
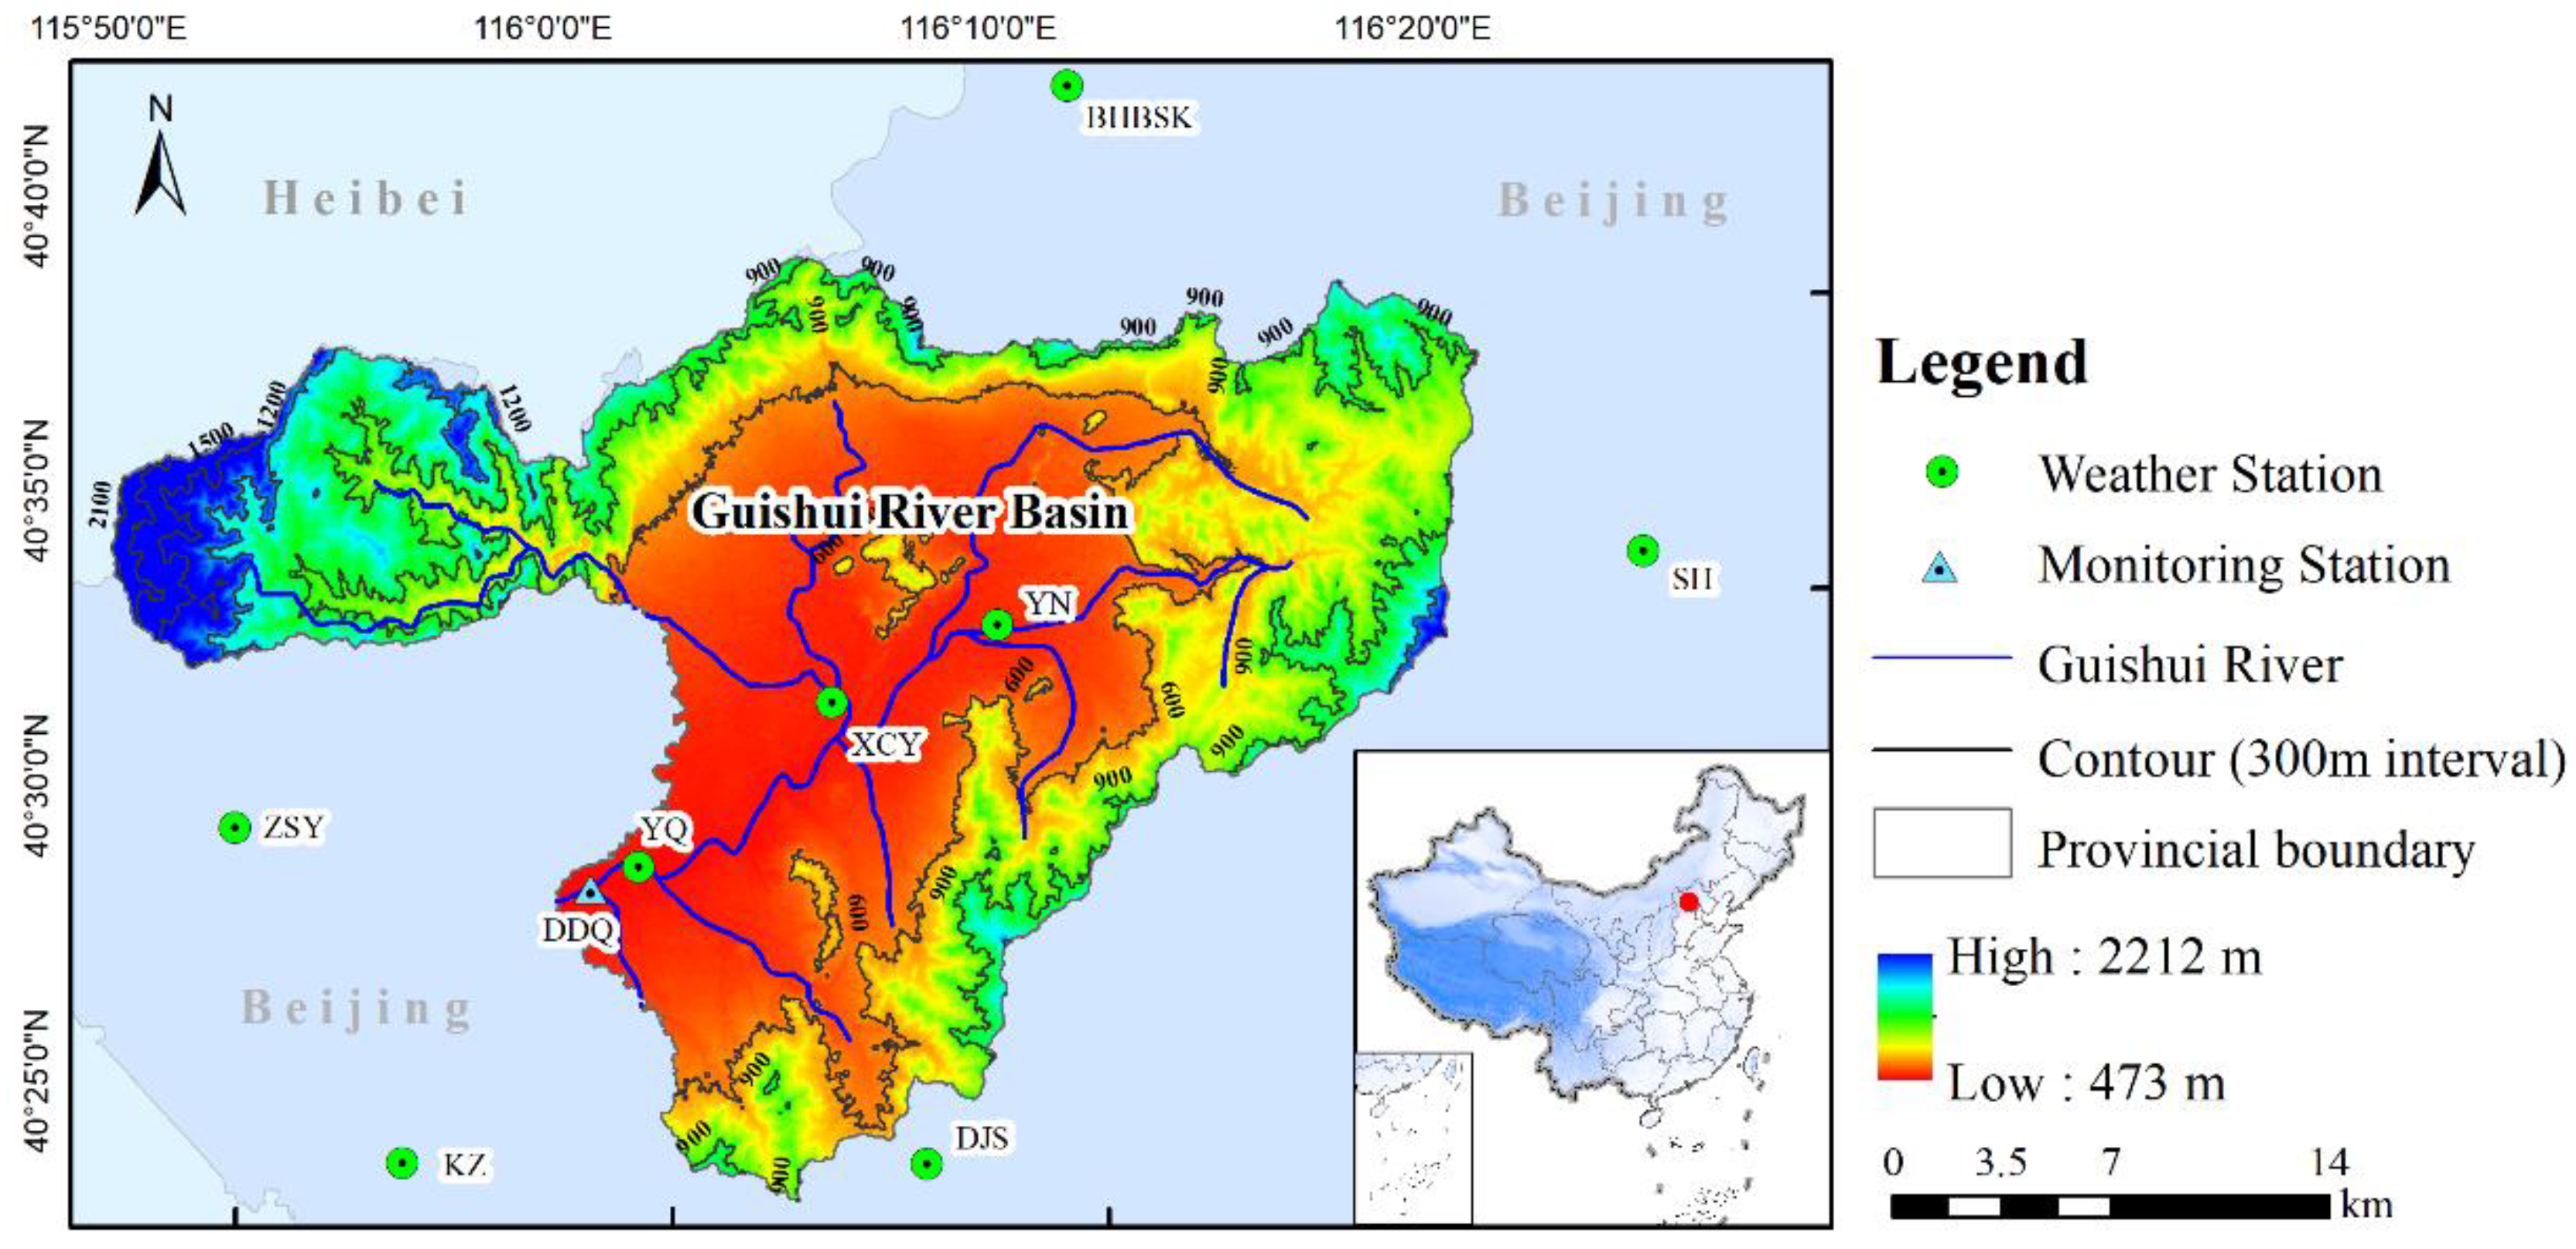
2.1. Study Area
2.2. Data Sources and Processing
2.3. Methodology
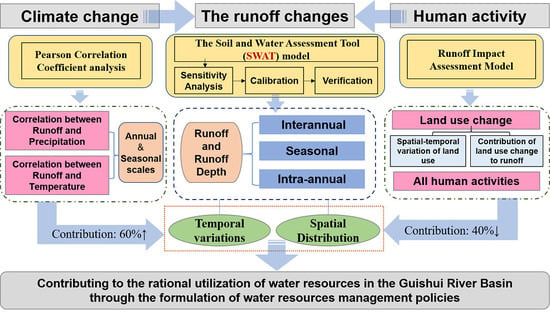
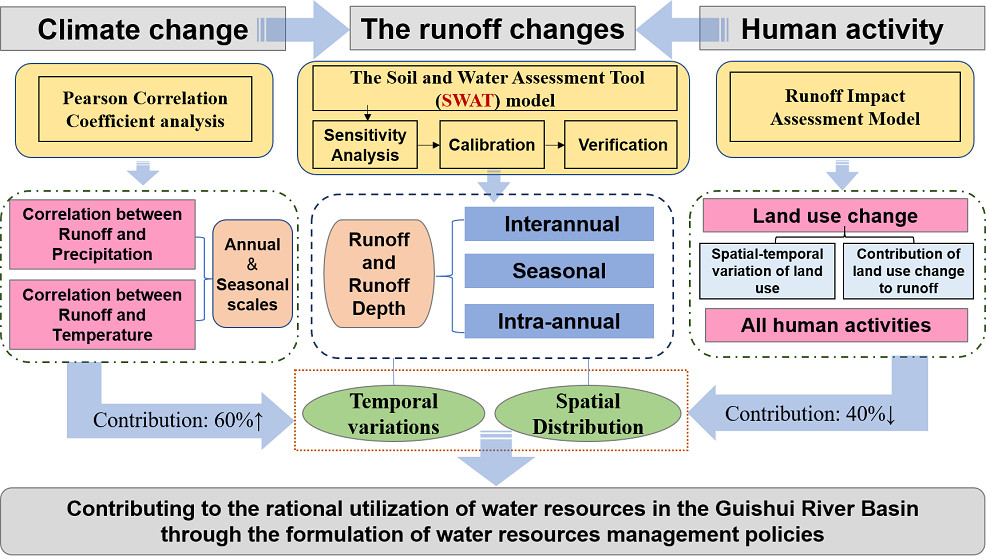
2.3.1. SWAT Model
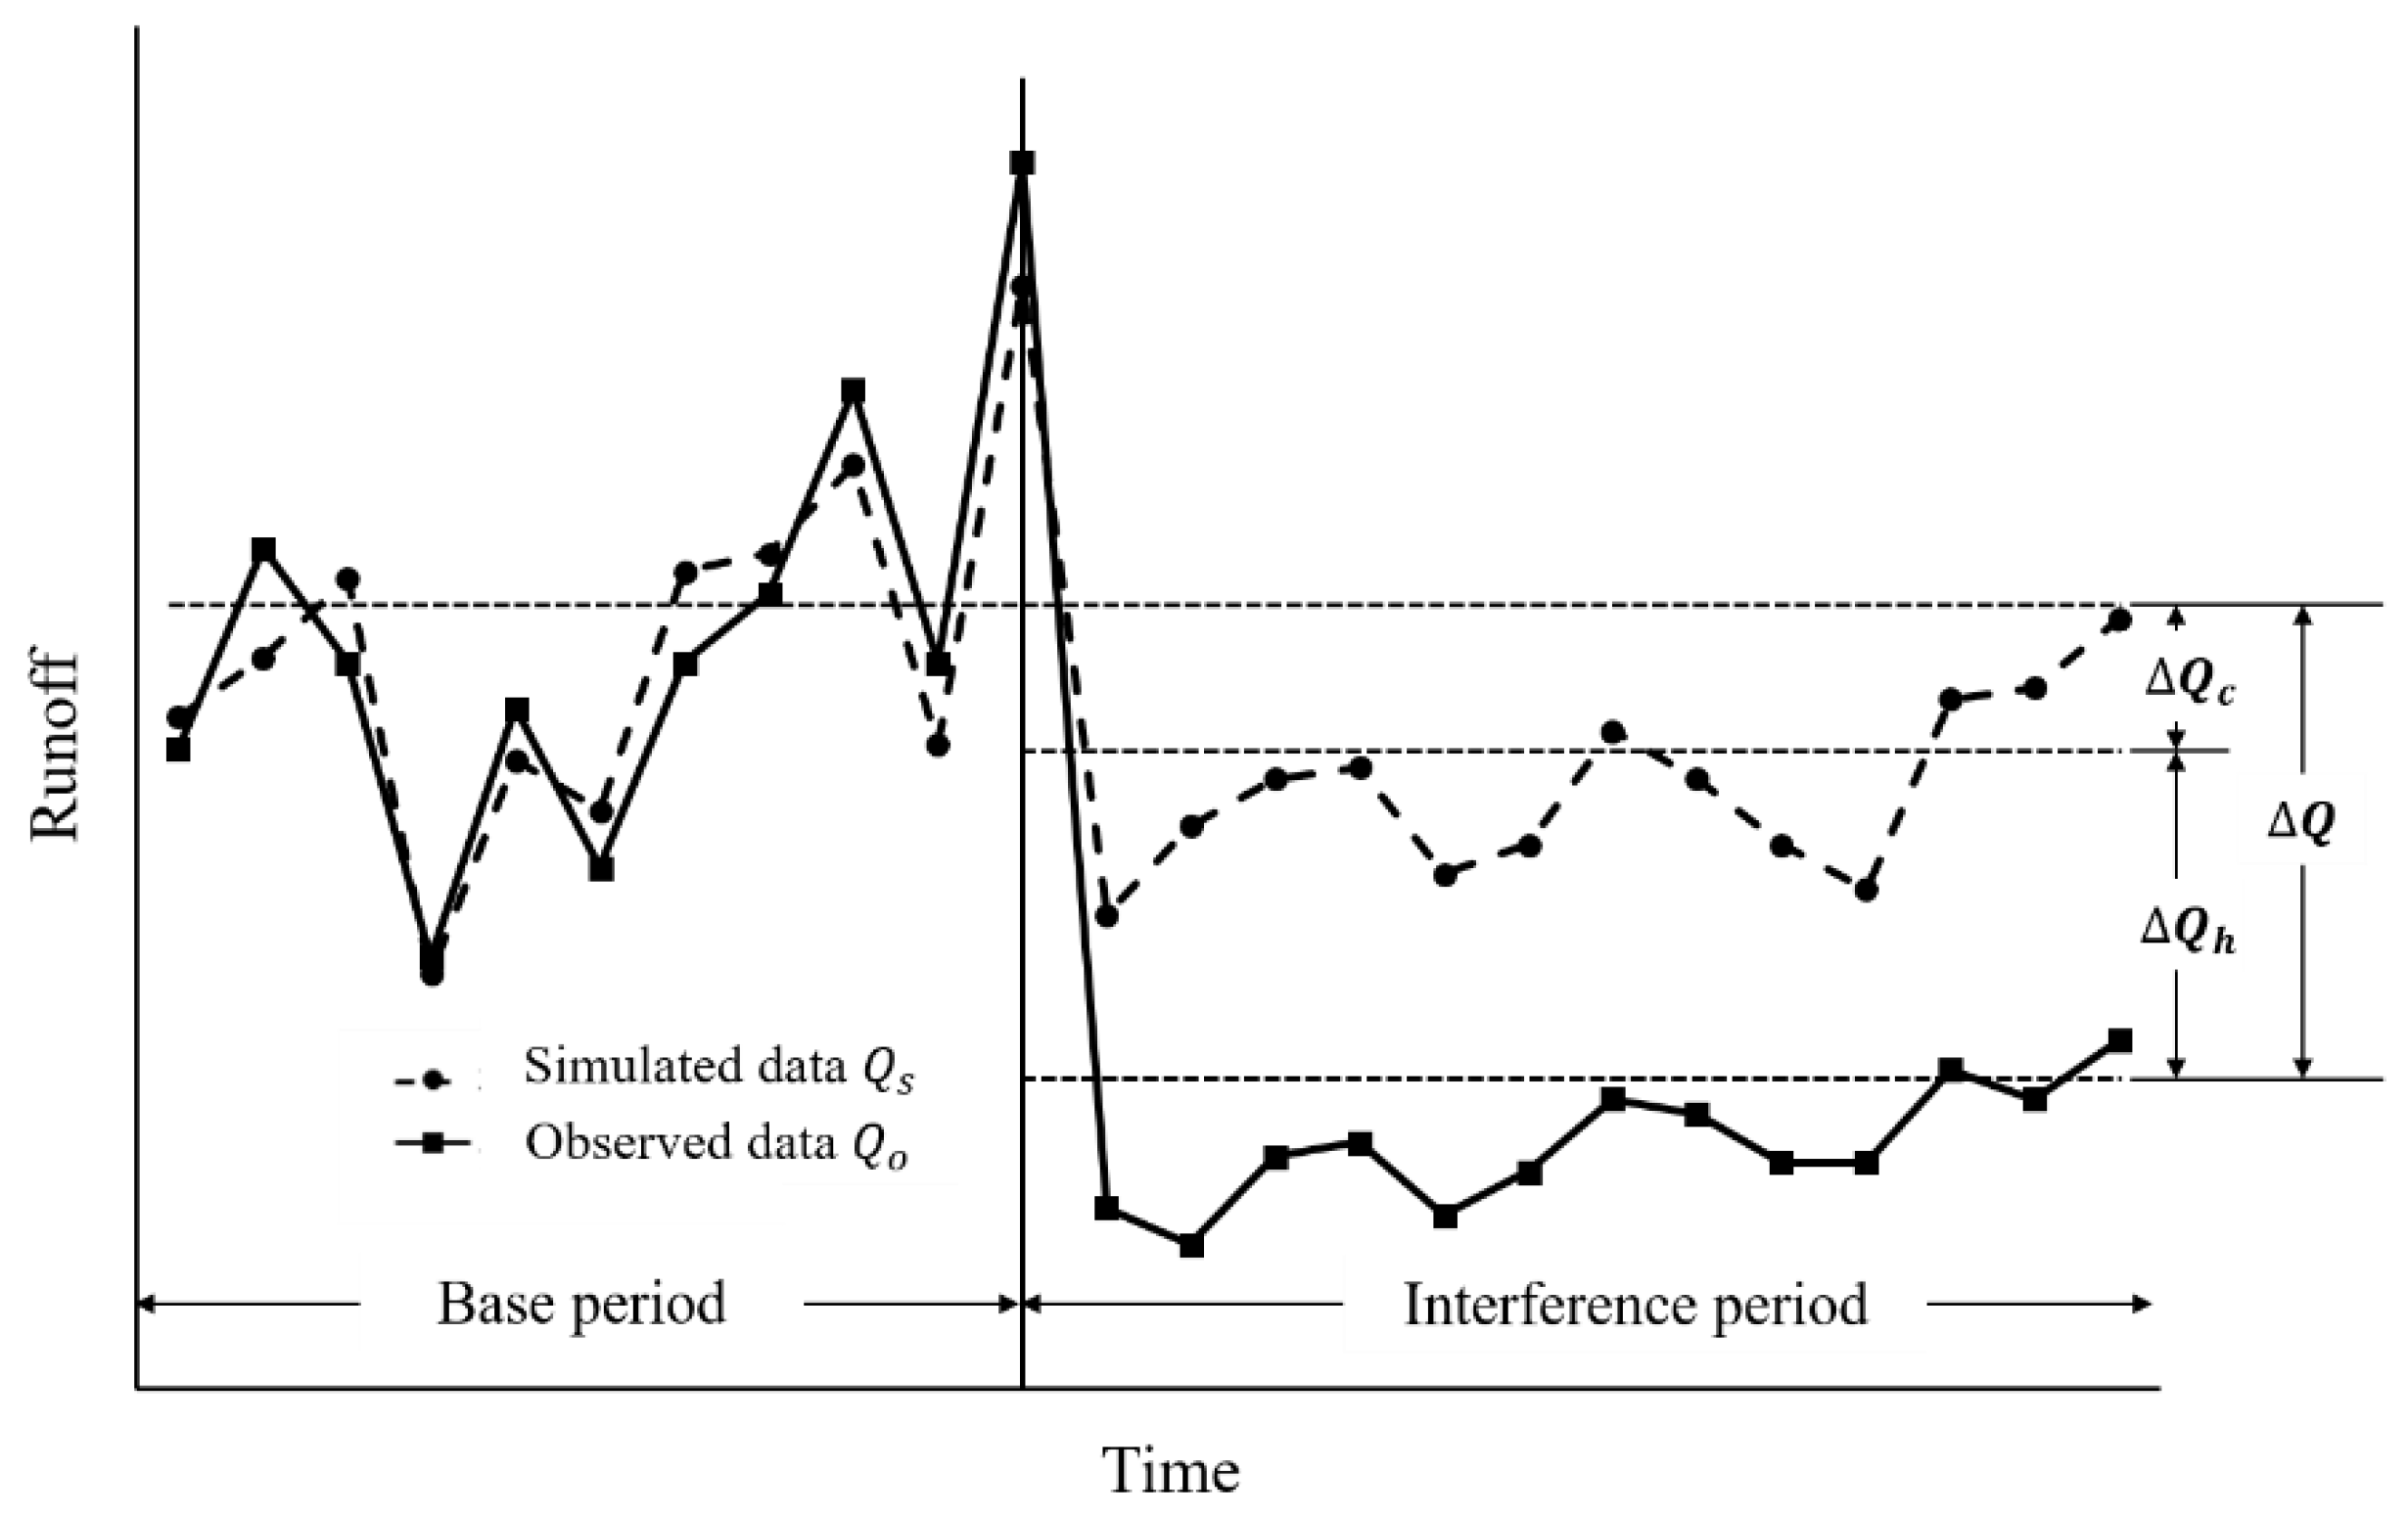
2.3.2. Runoff Impact Assessment Model
2.3.3. The Runoff-Concentration Degree and Runoff-Concentration Period
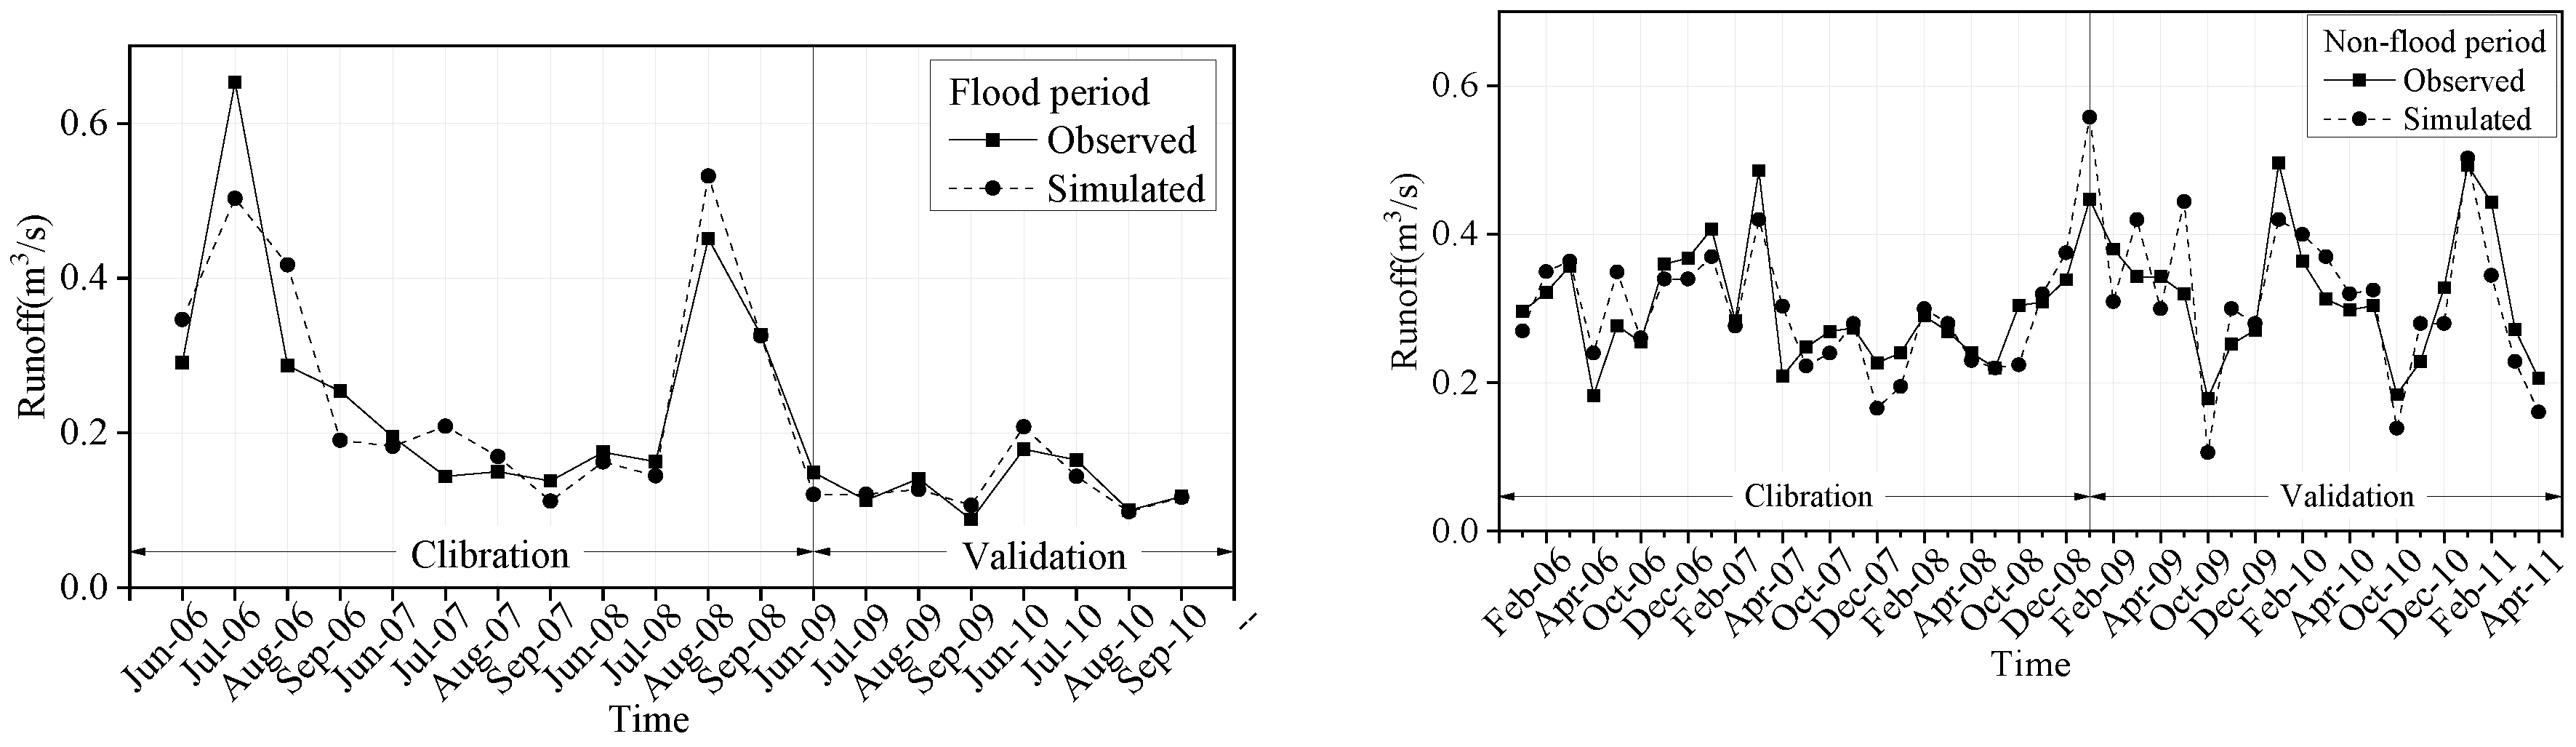
2.4. Calibration and Verification of the SWAT Model
3. Results
3.1. Spatio-Temporal Evolution of the Runoff in the Guishui River Basin Under a Changing Environment
3.1.1. Interannual Variations and Spatial Distribution of the Runoff in the Guishui River Basin
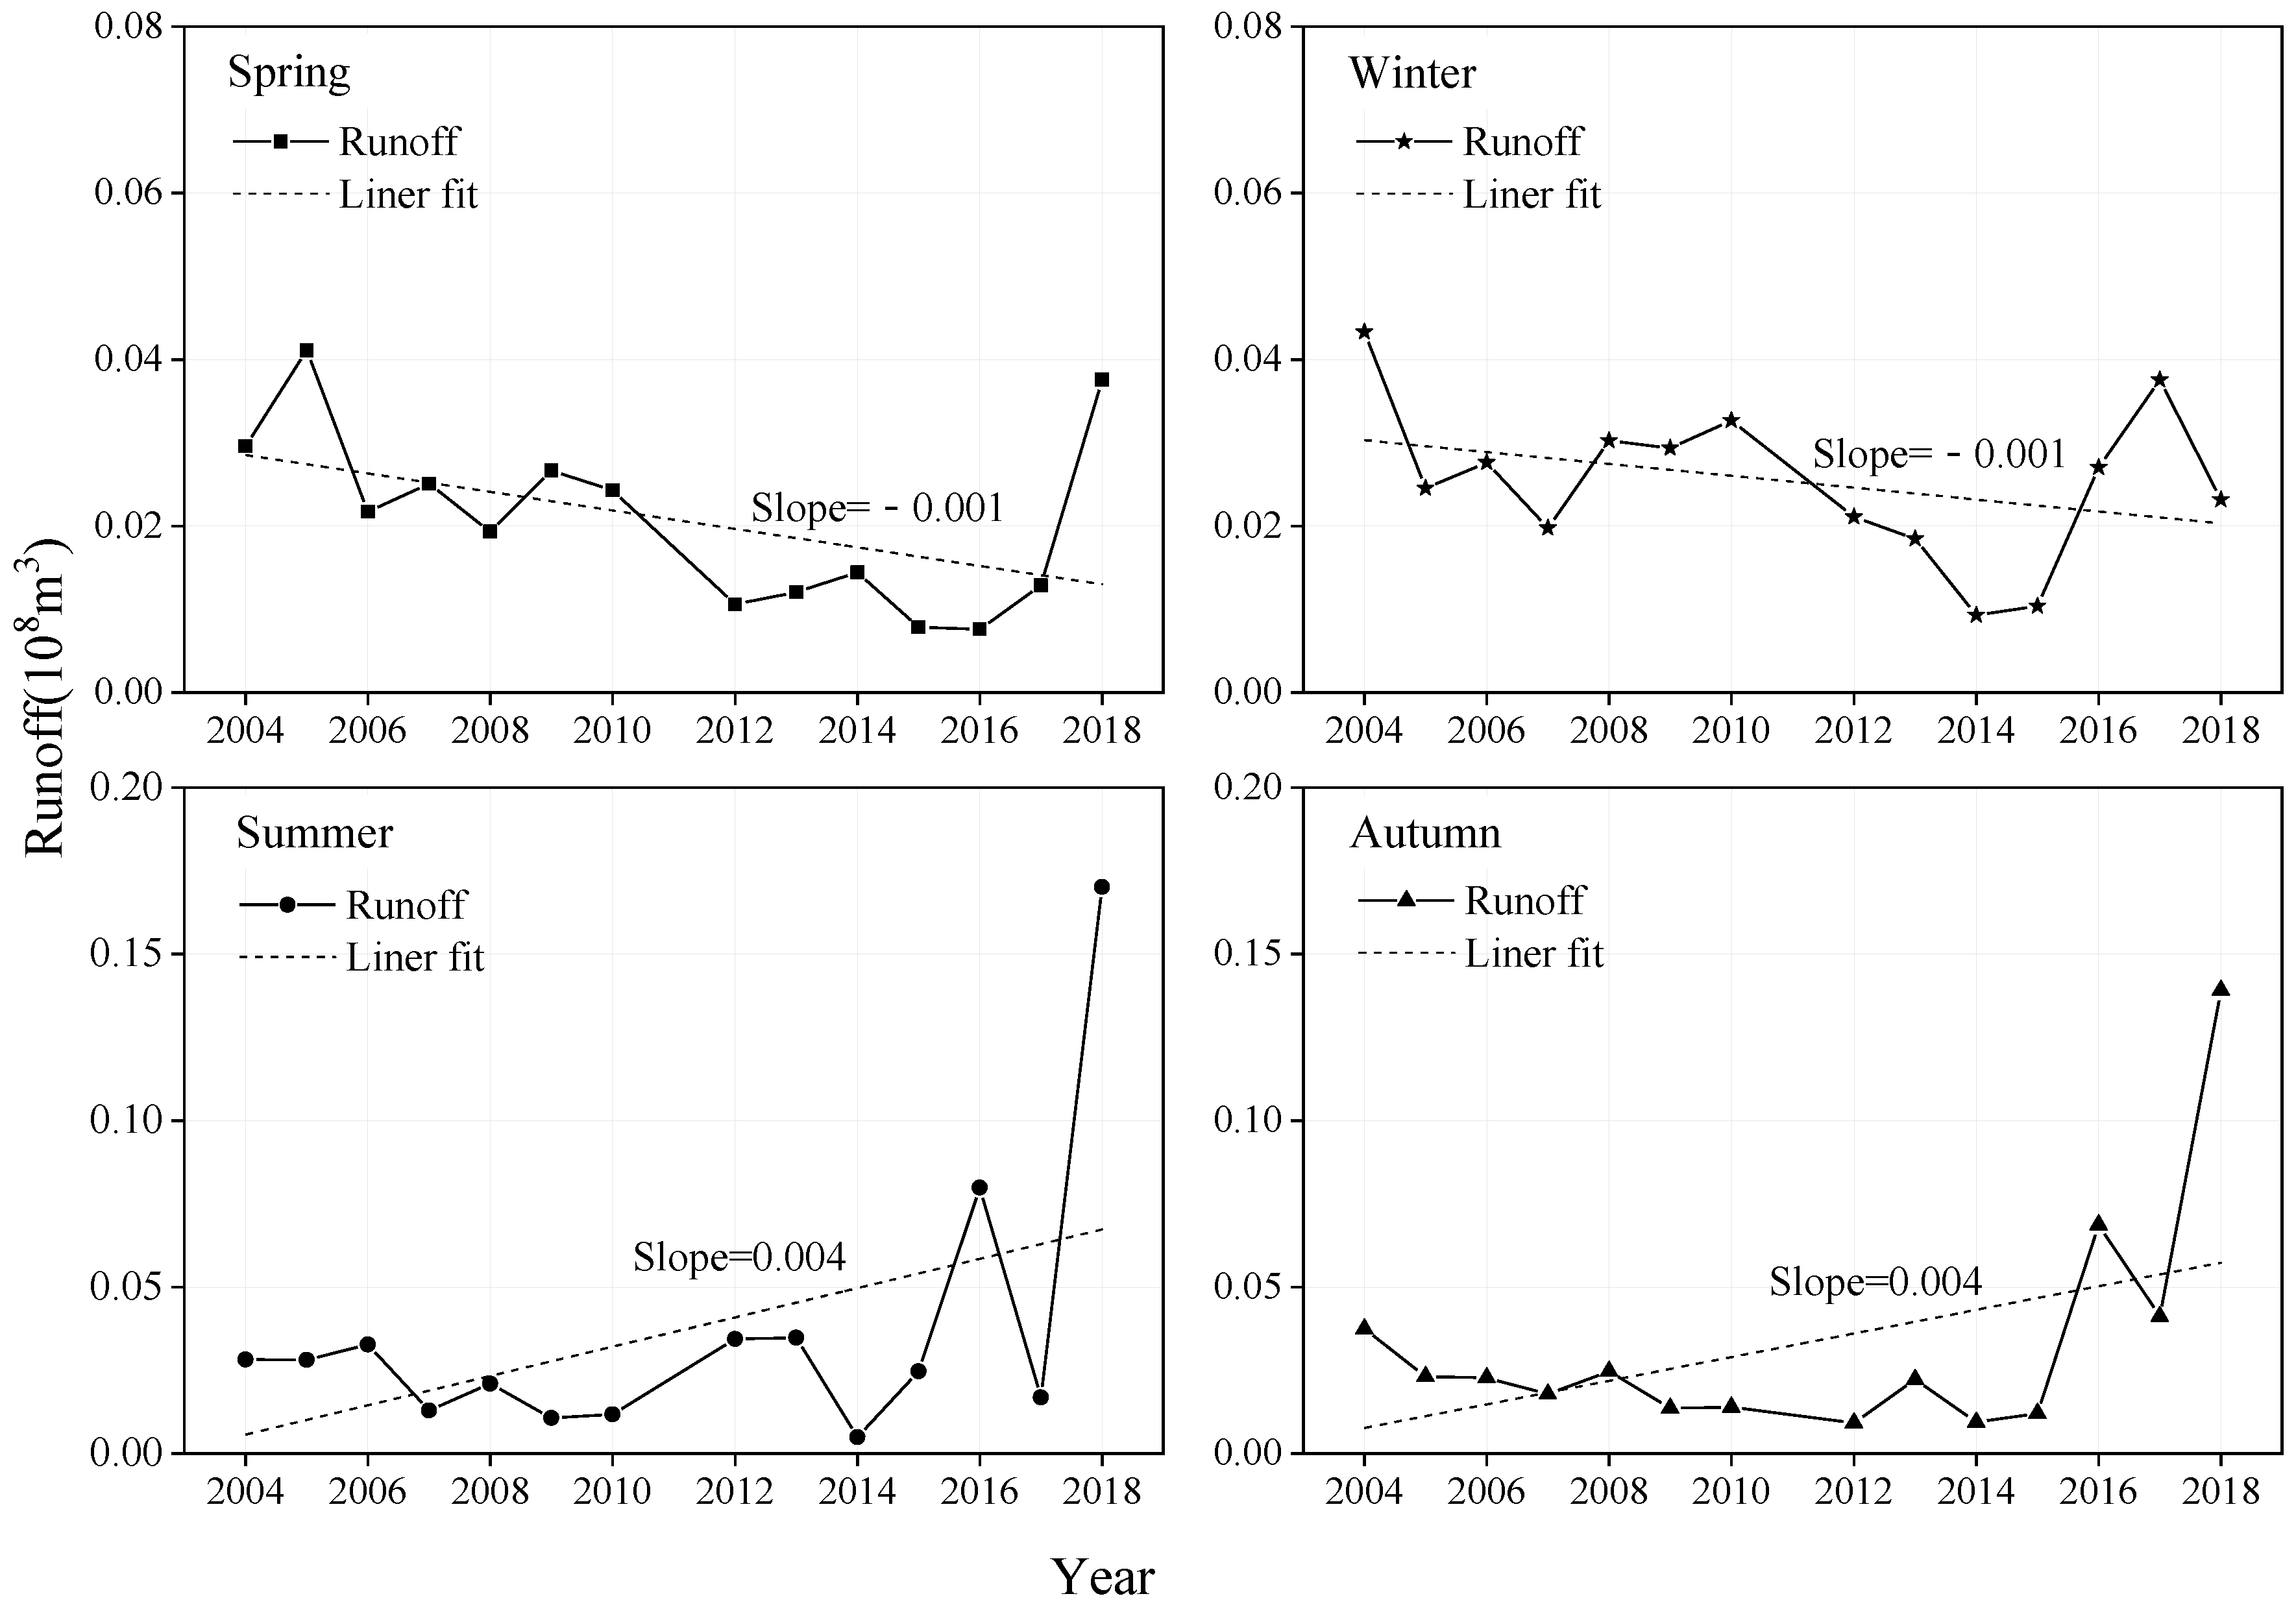
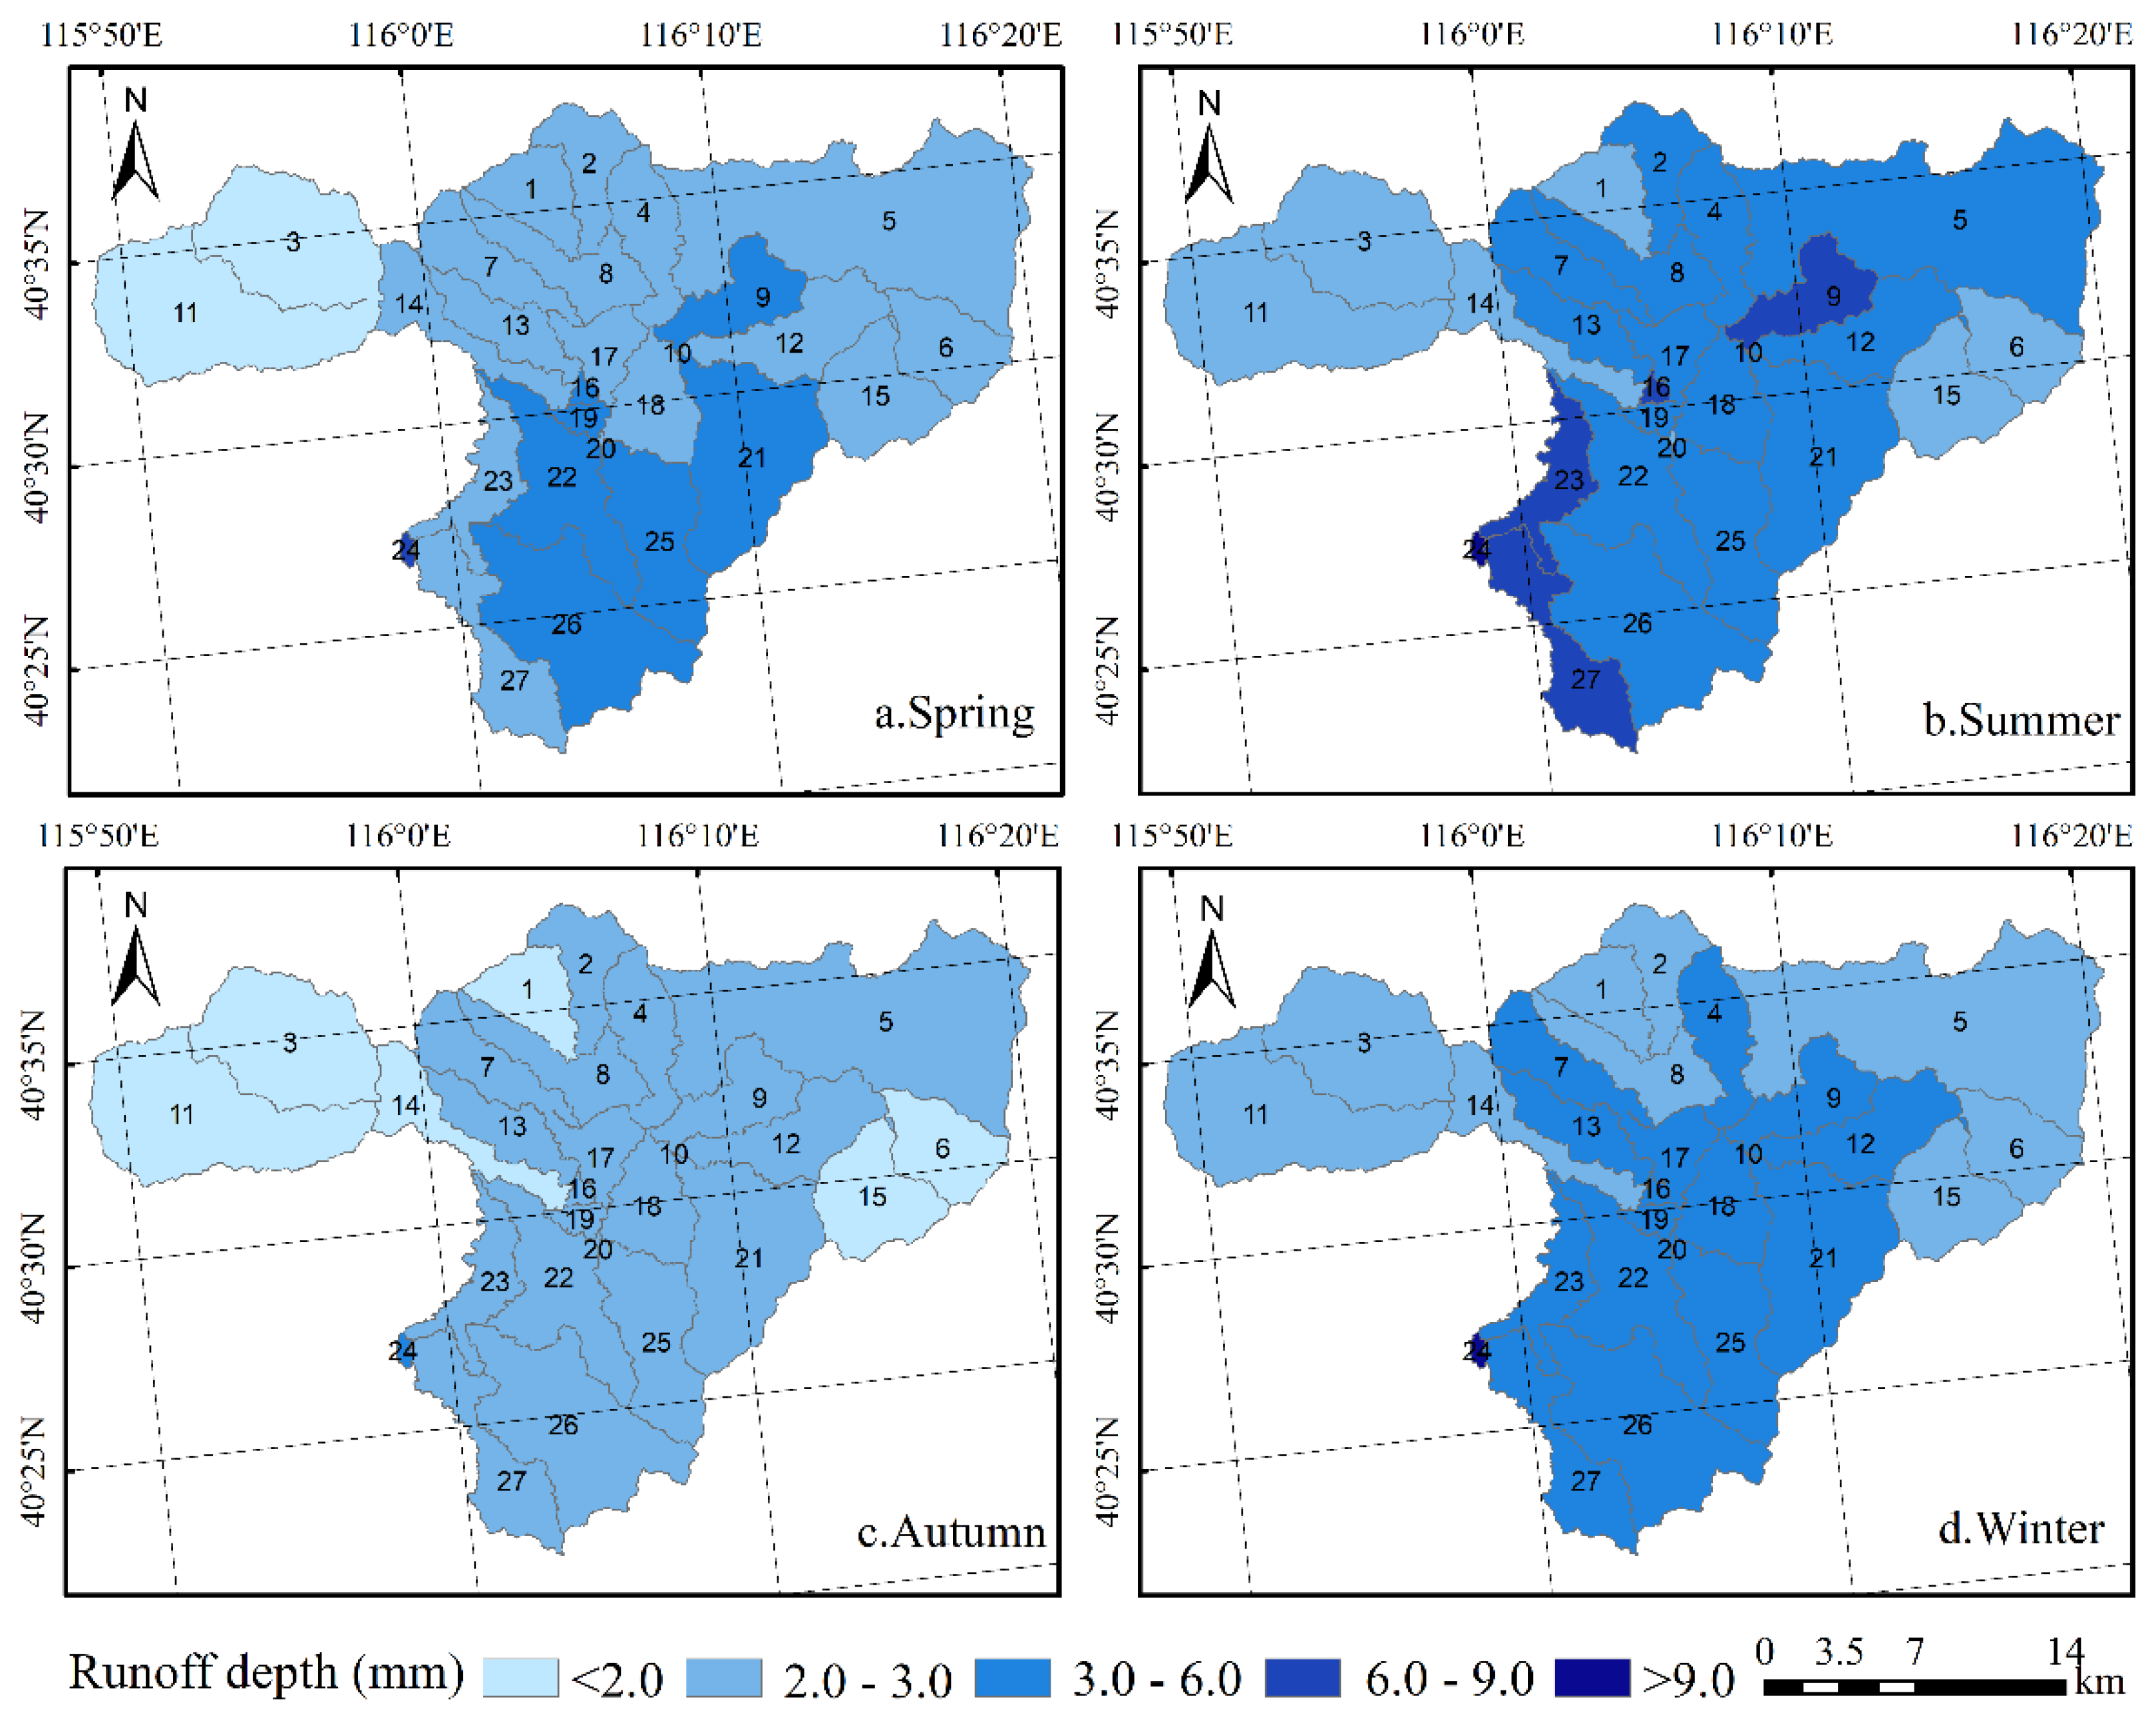
3.1.2. Seasonal Variations of the Runoff in the Guishui River Basin
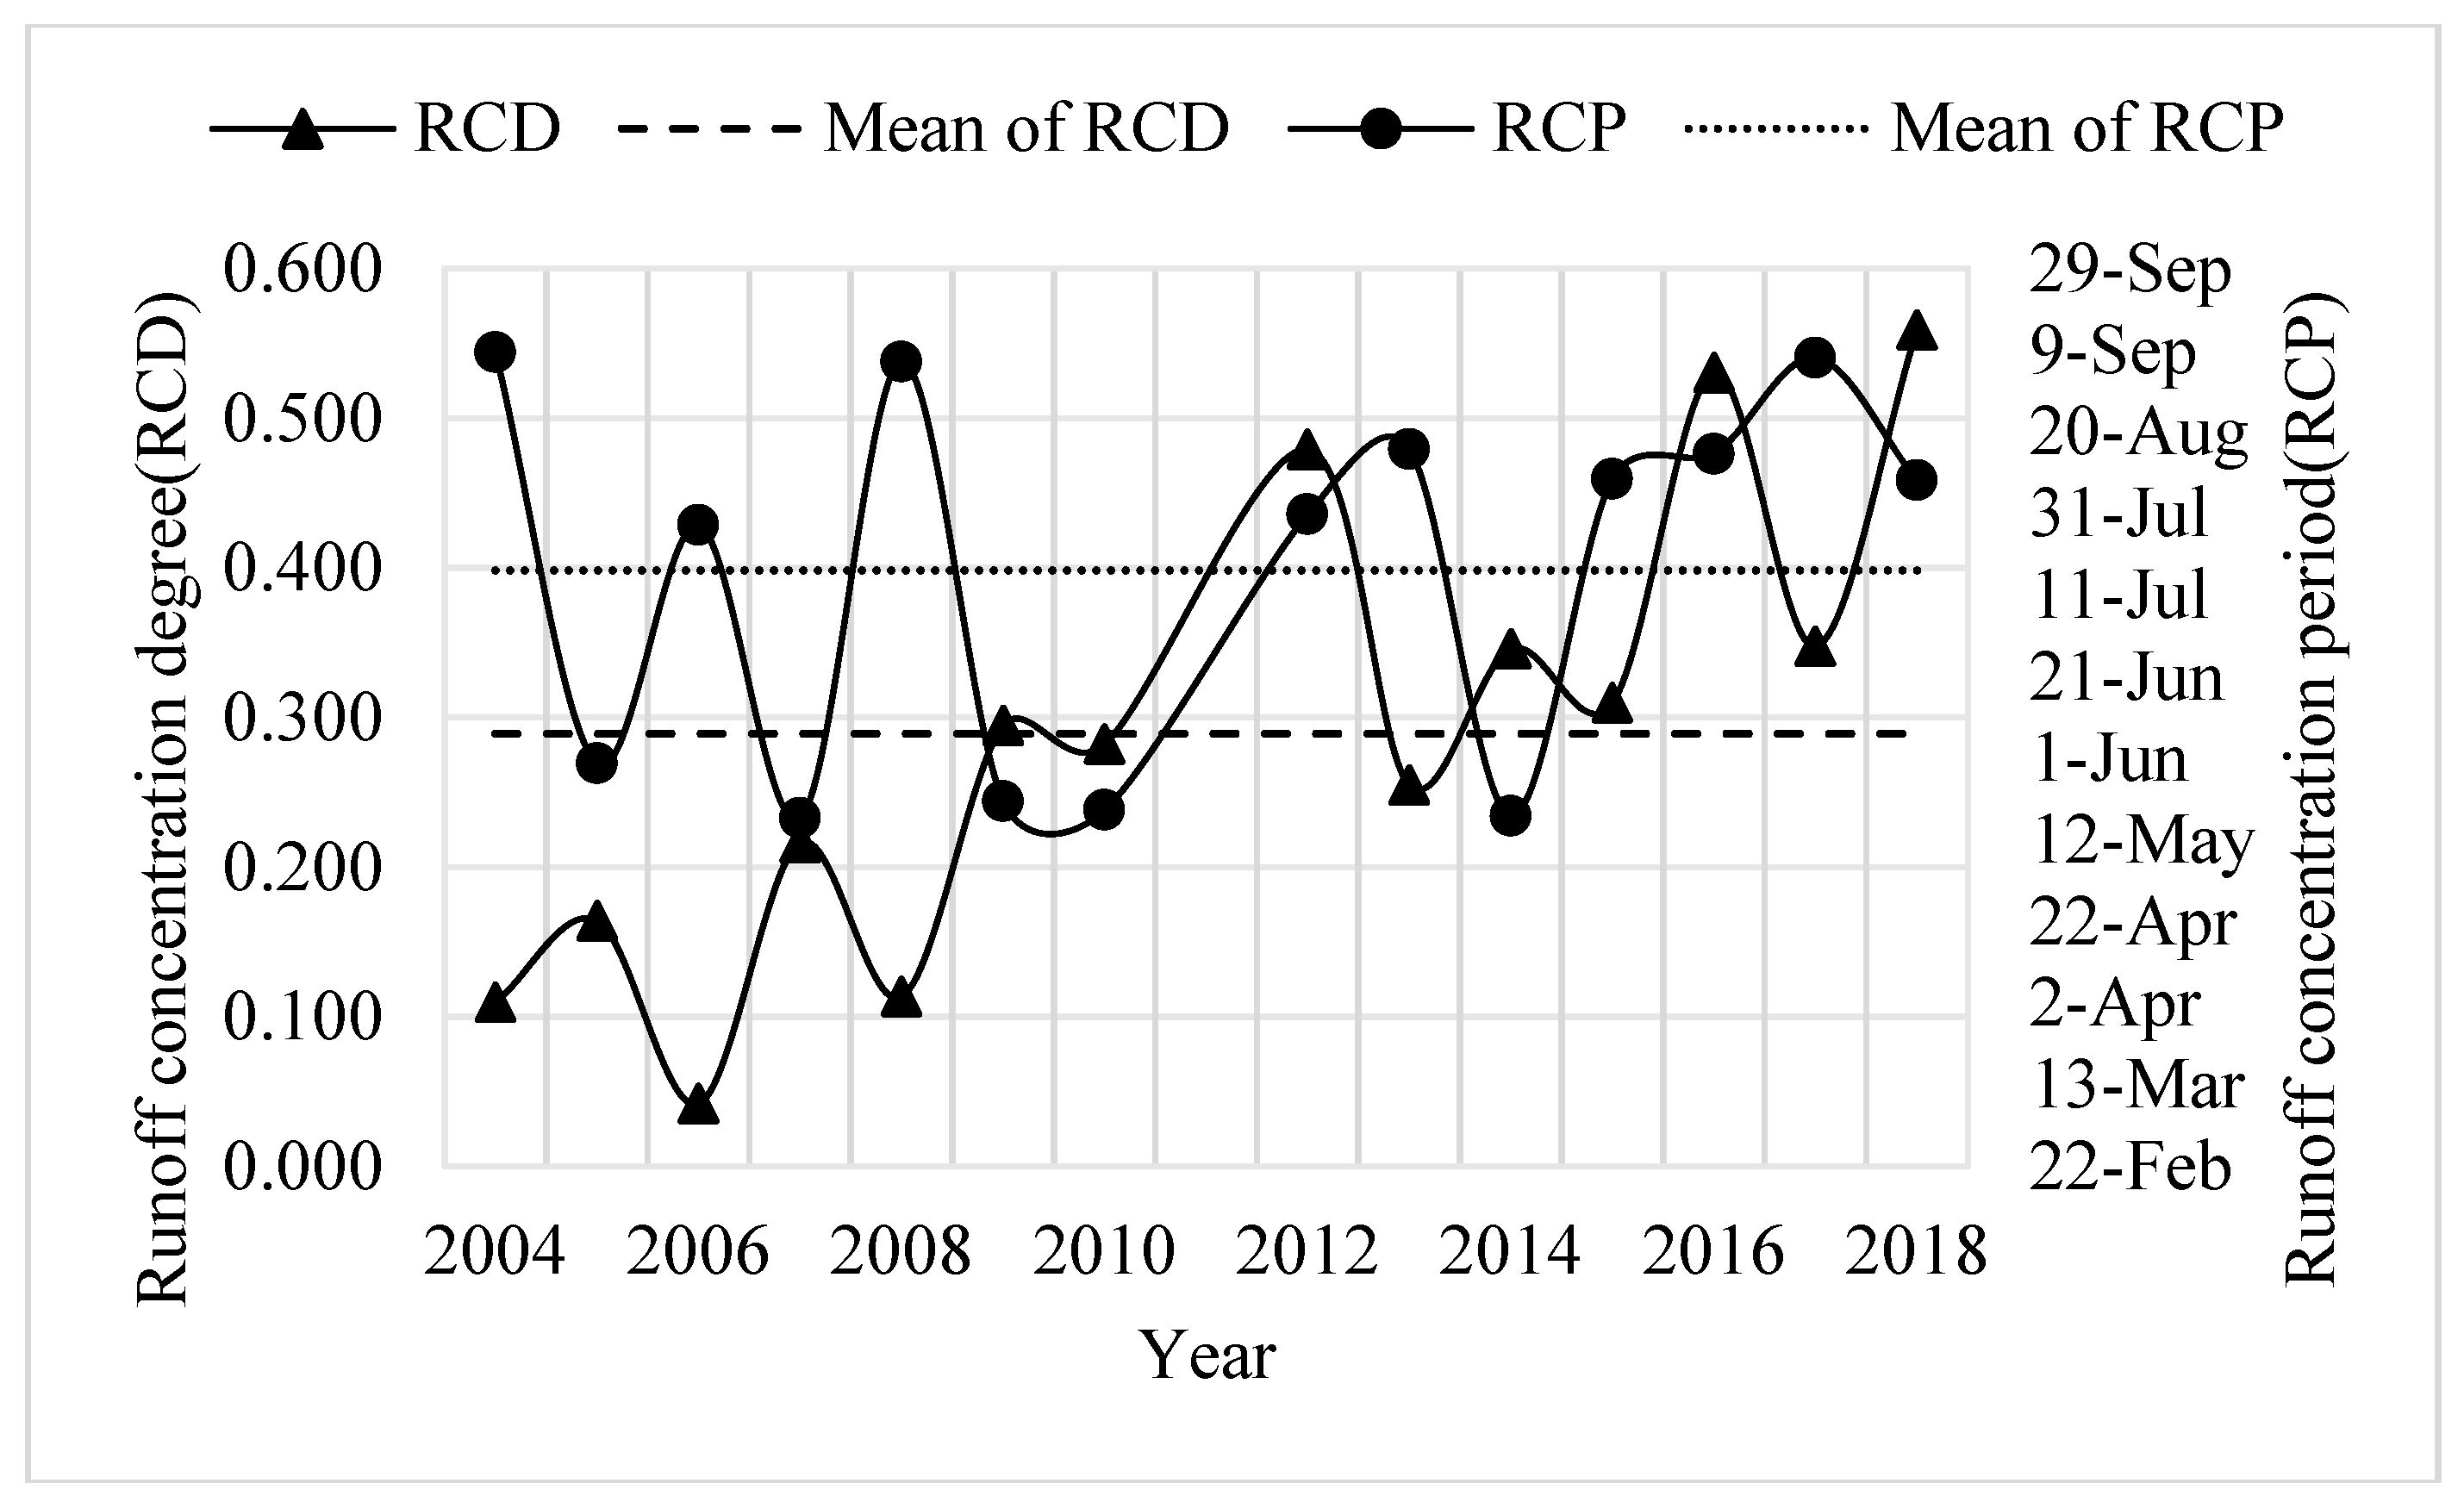
3.1.3. Intra-annual Variation of the Runoff in the Guishui River Basin
3.2. Impact of Climate Change and Human Activities on the Runoff inf the Guishui River Basin
3.2.1. Identification and Evaluation of the Factors Influencing the Runoff in the Guishui River Basin
3.2.2. Impact of Climate Change on the Runoff in the Guishui River Basin
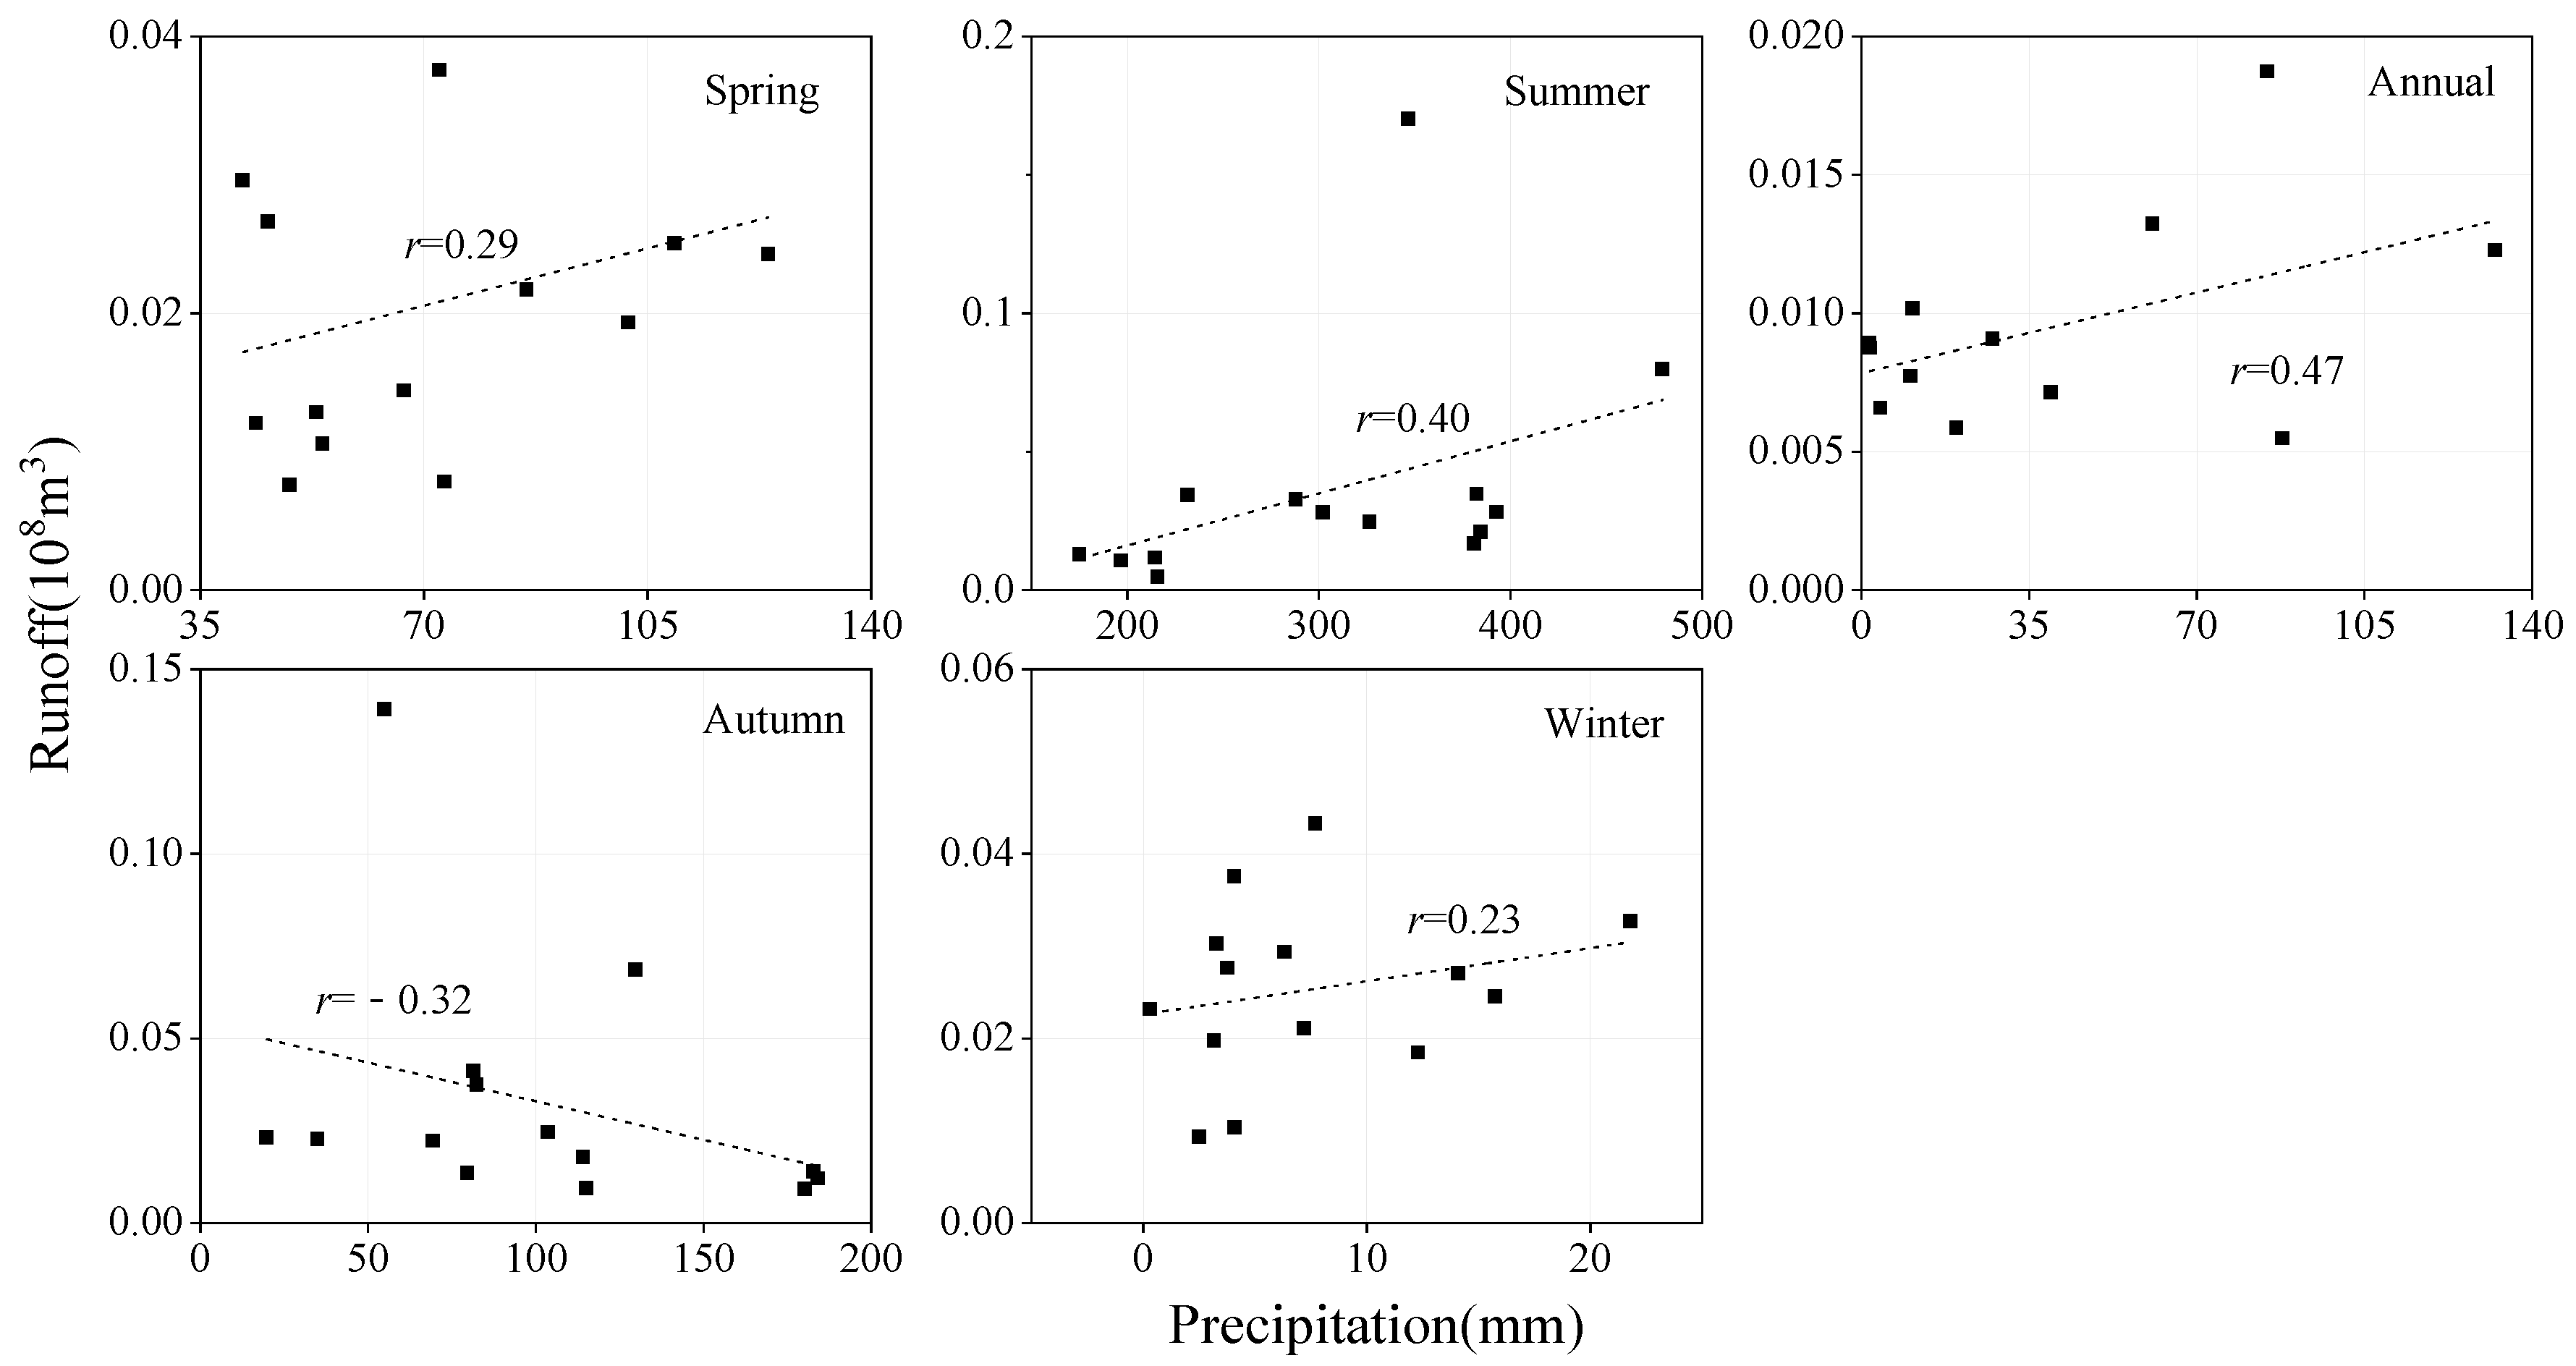
Correlation Analysis between Precipitation and Runoff
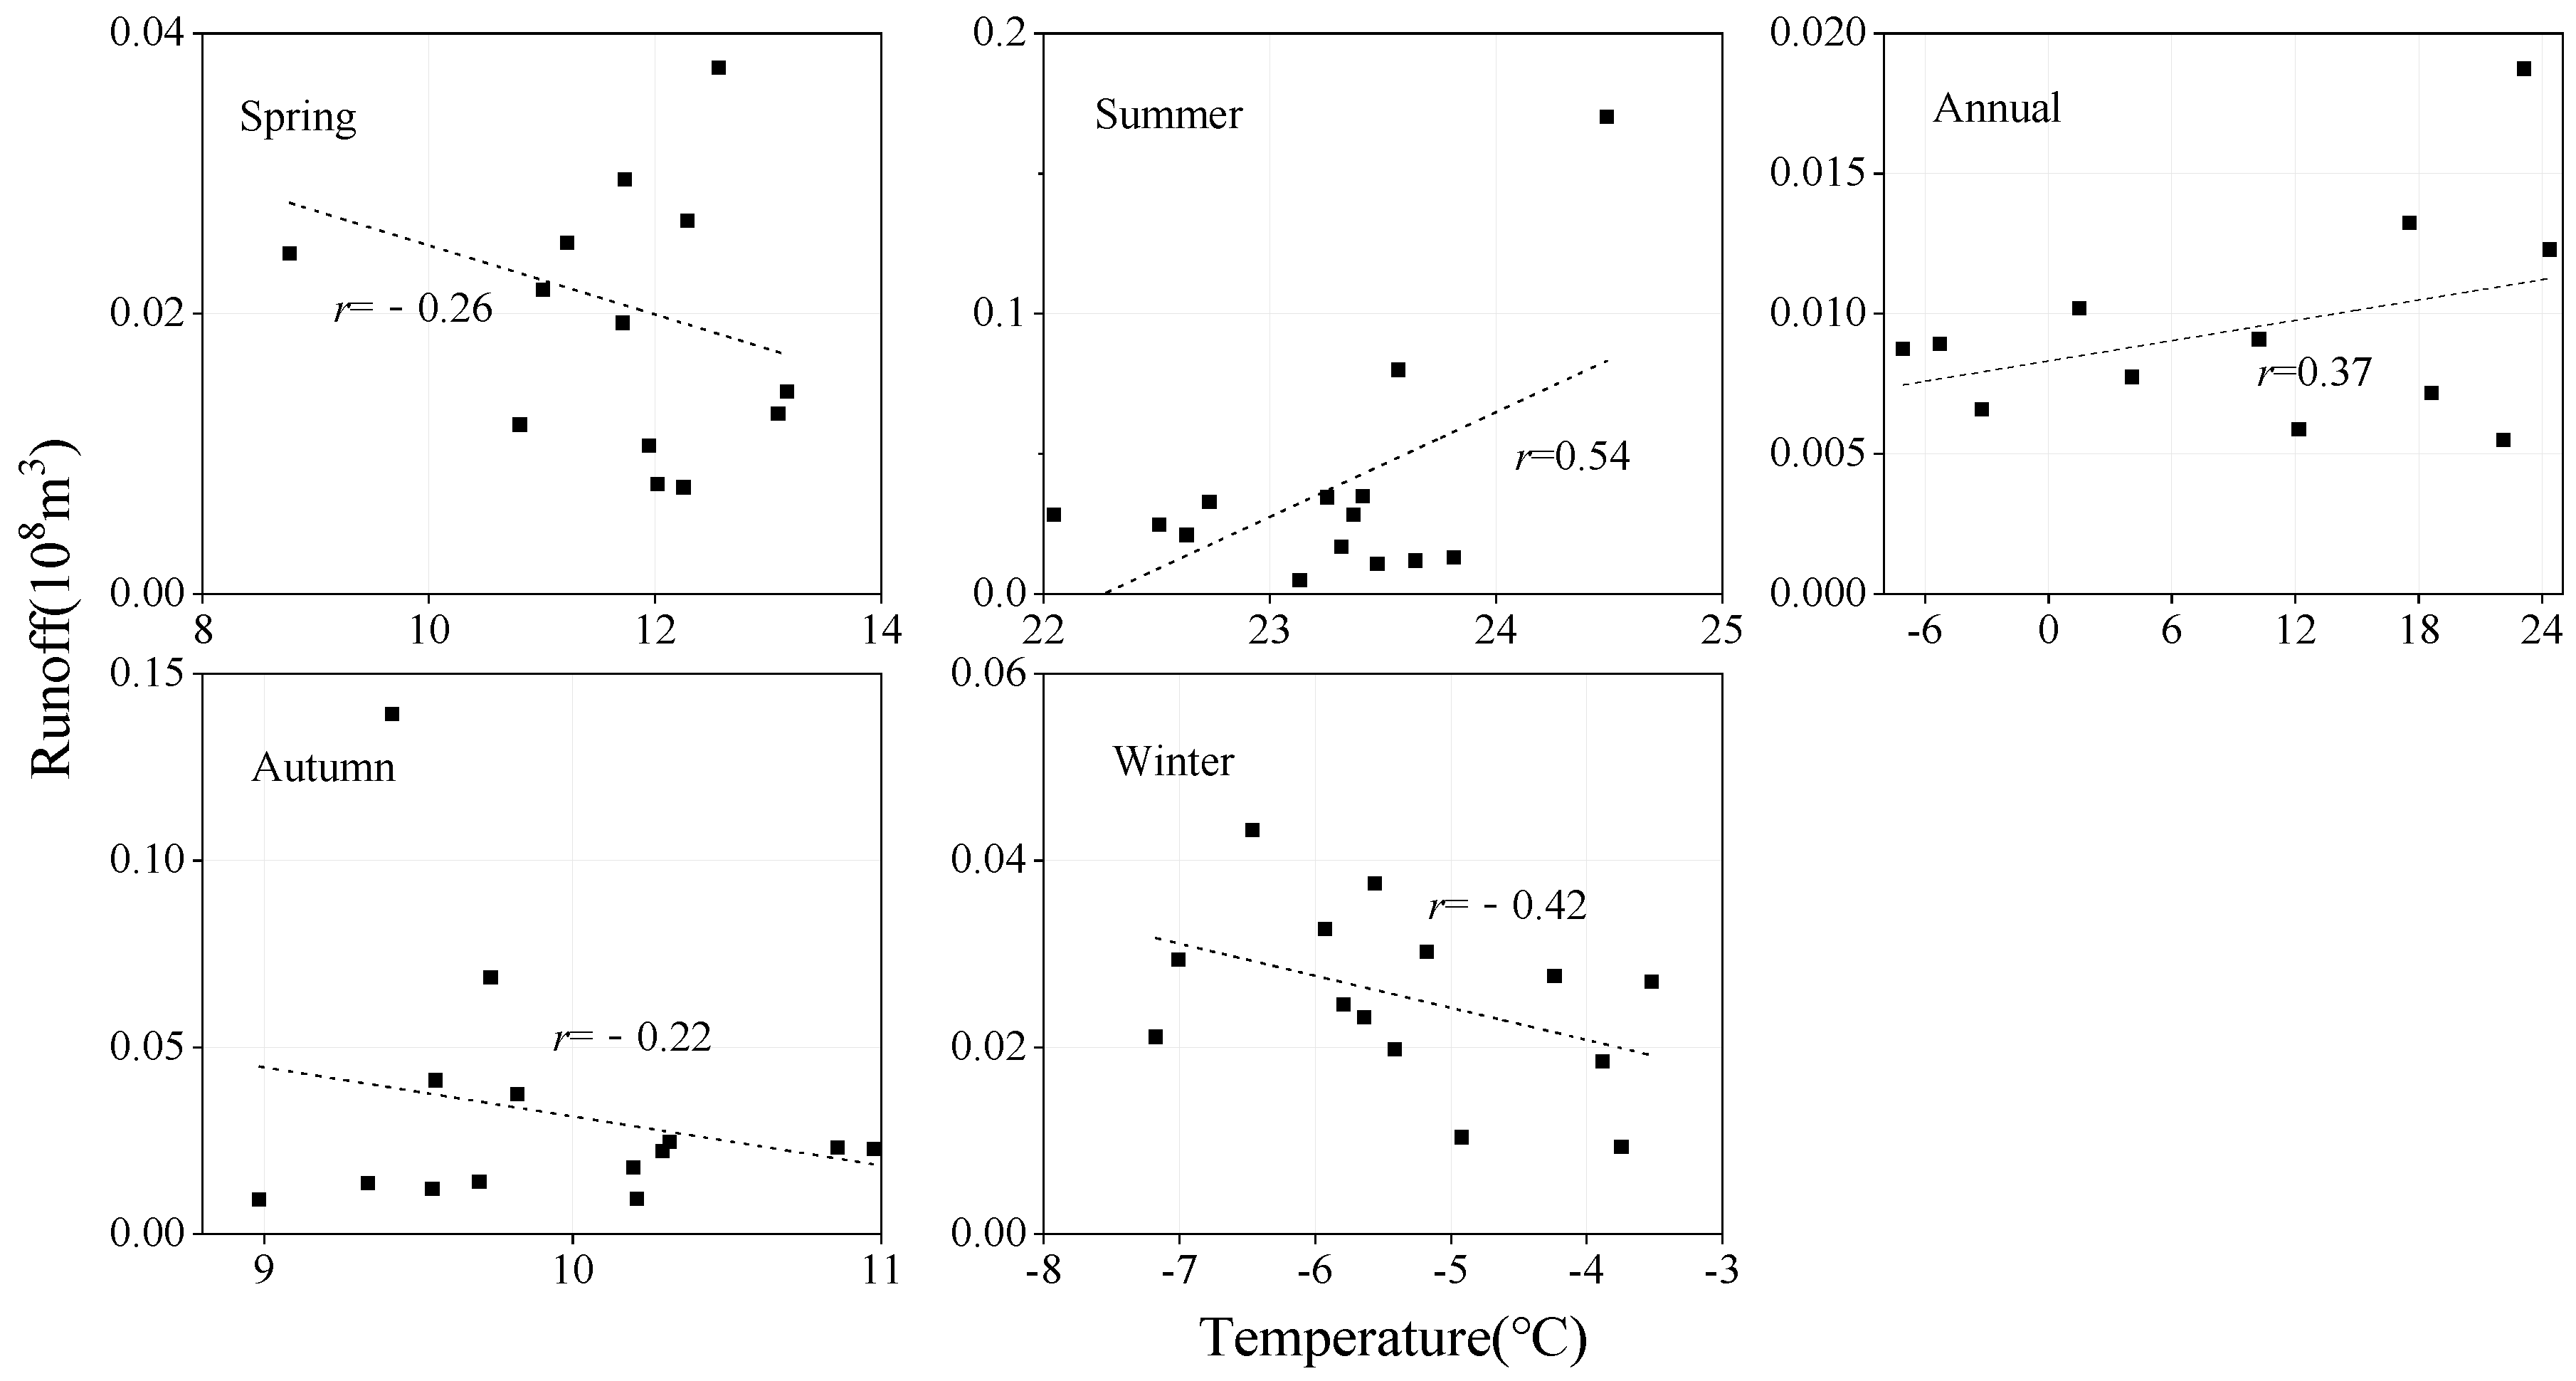
Correlation Analysis between Temperature and Runoff
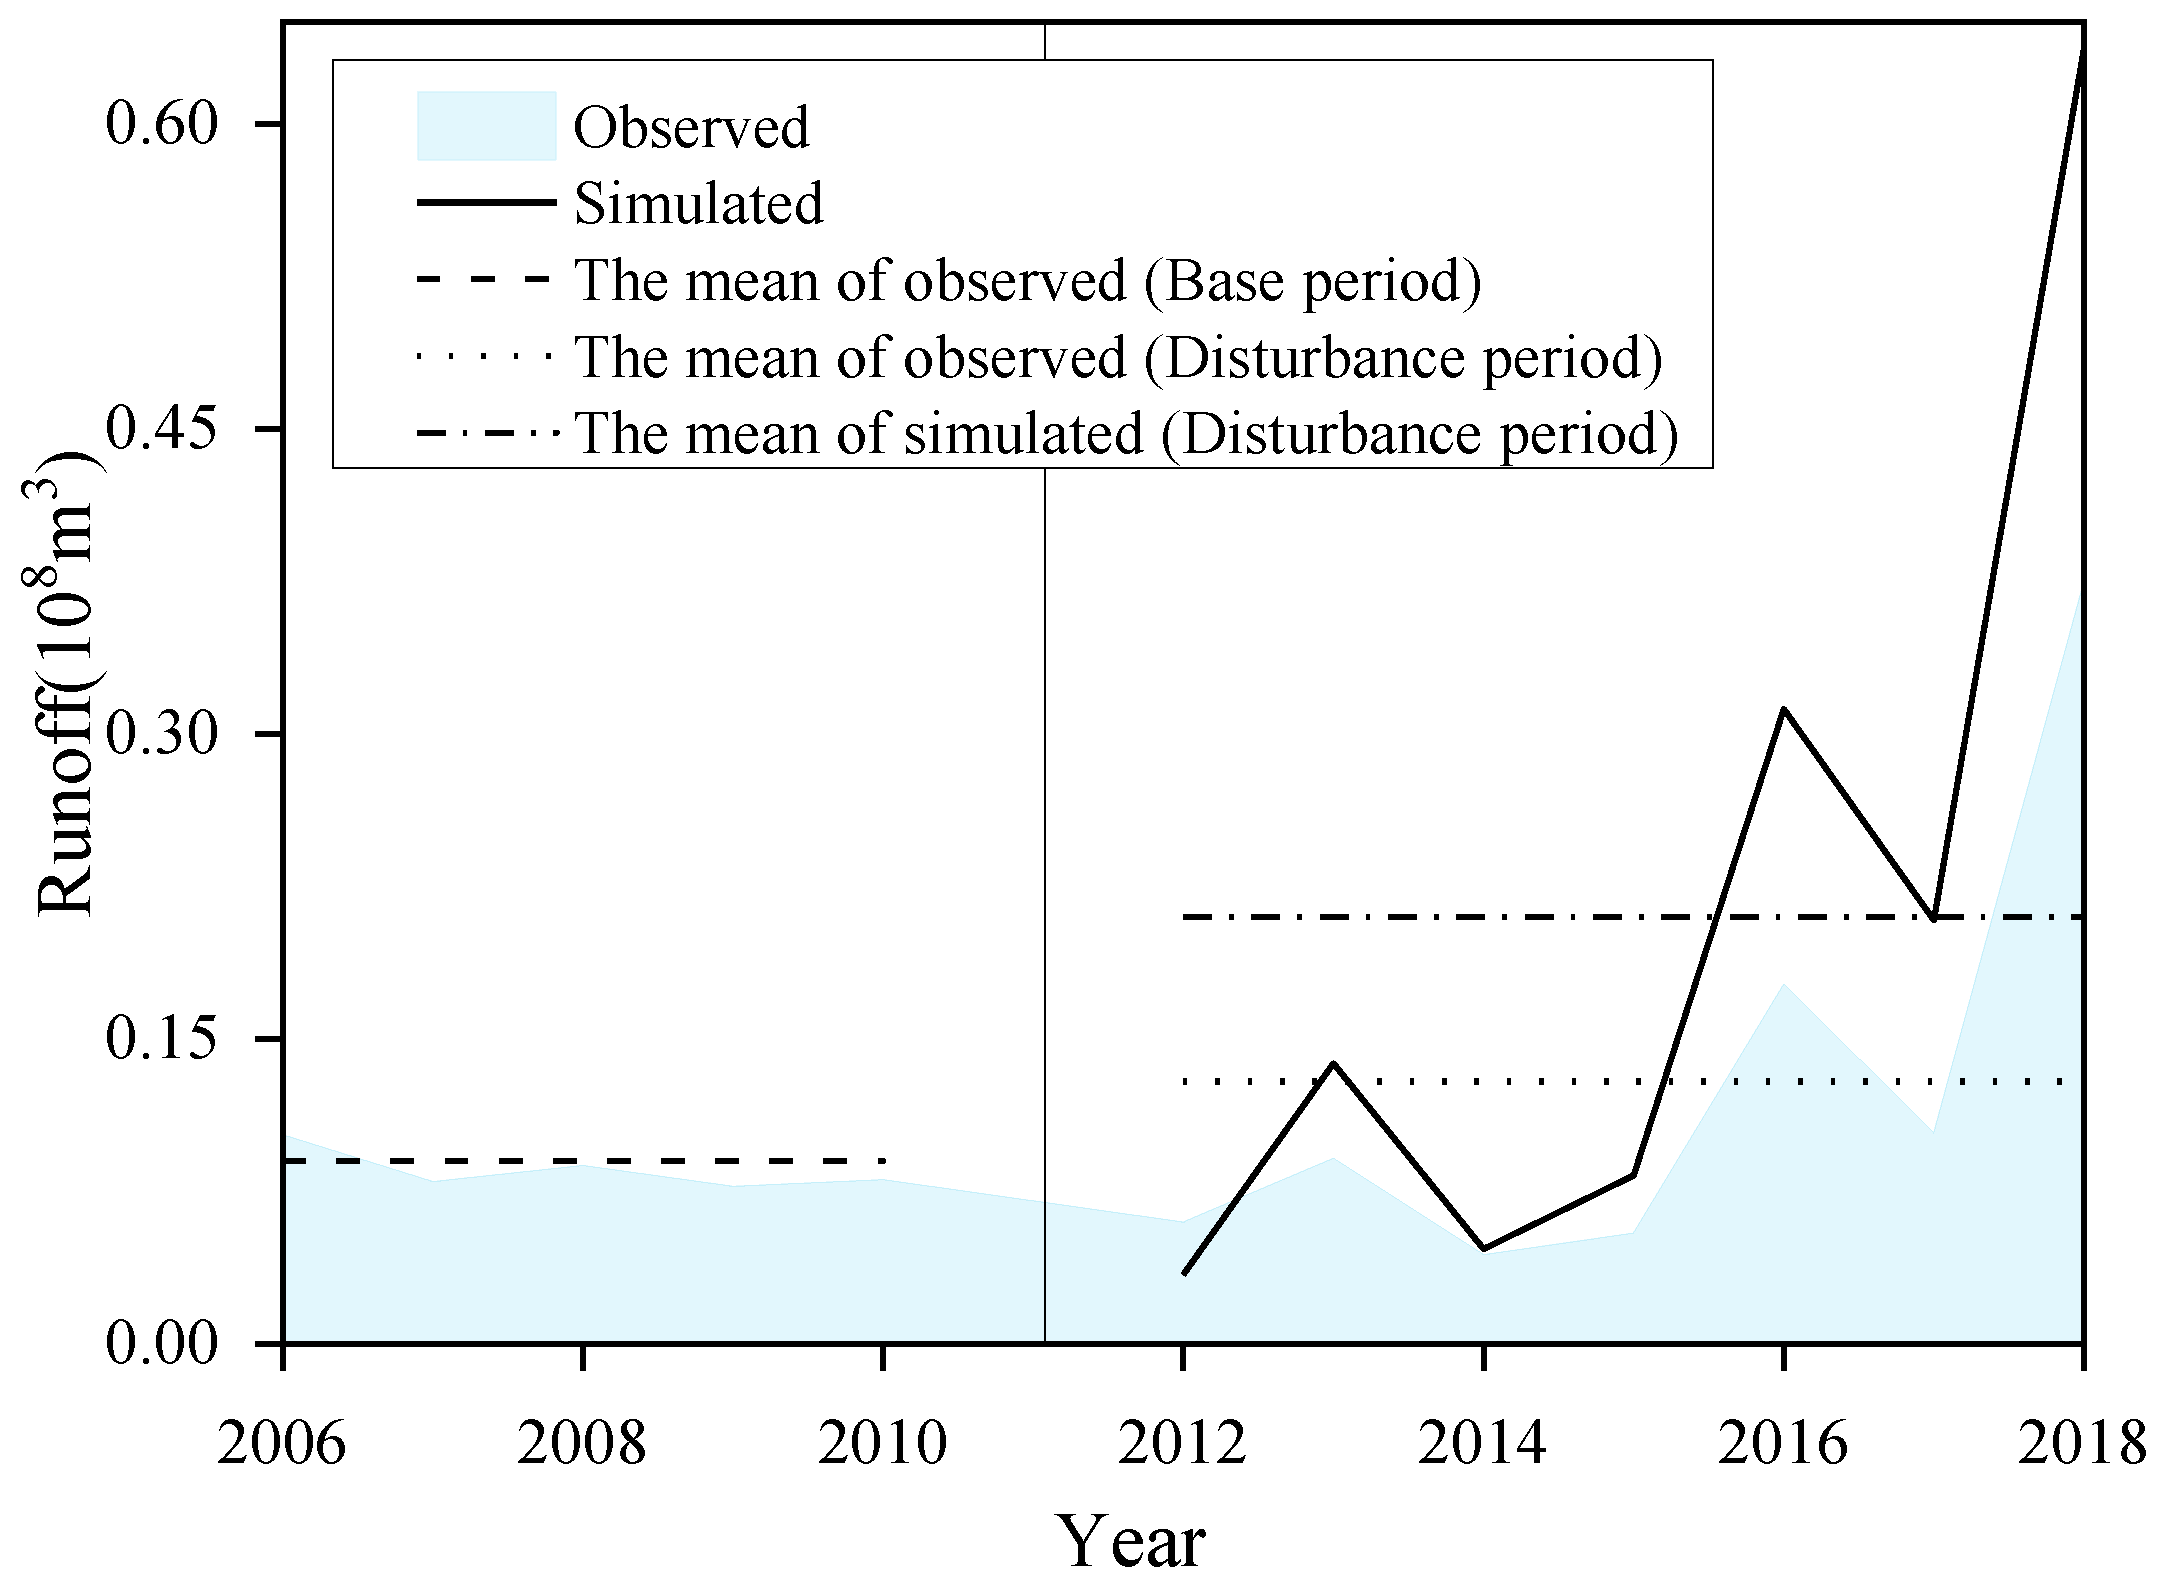
3.2.3. Impact of Human Activities on the Runoff in the Guishui River Basin
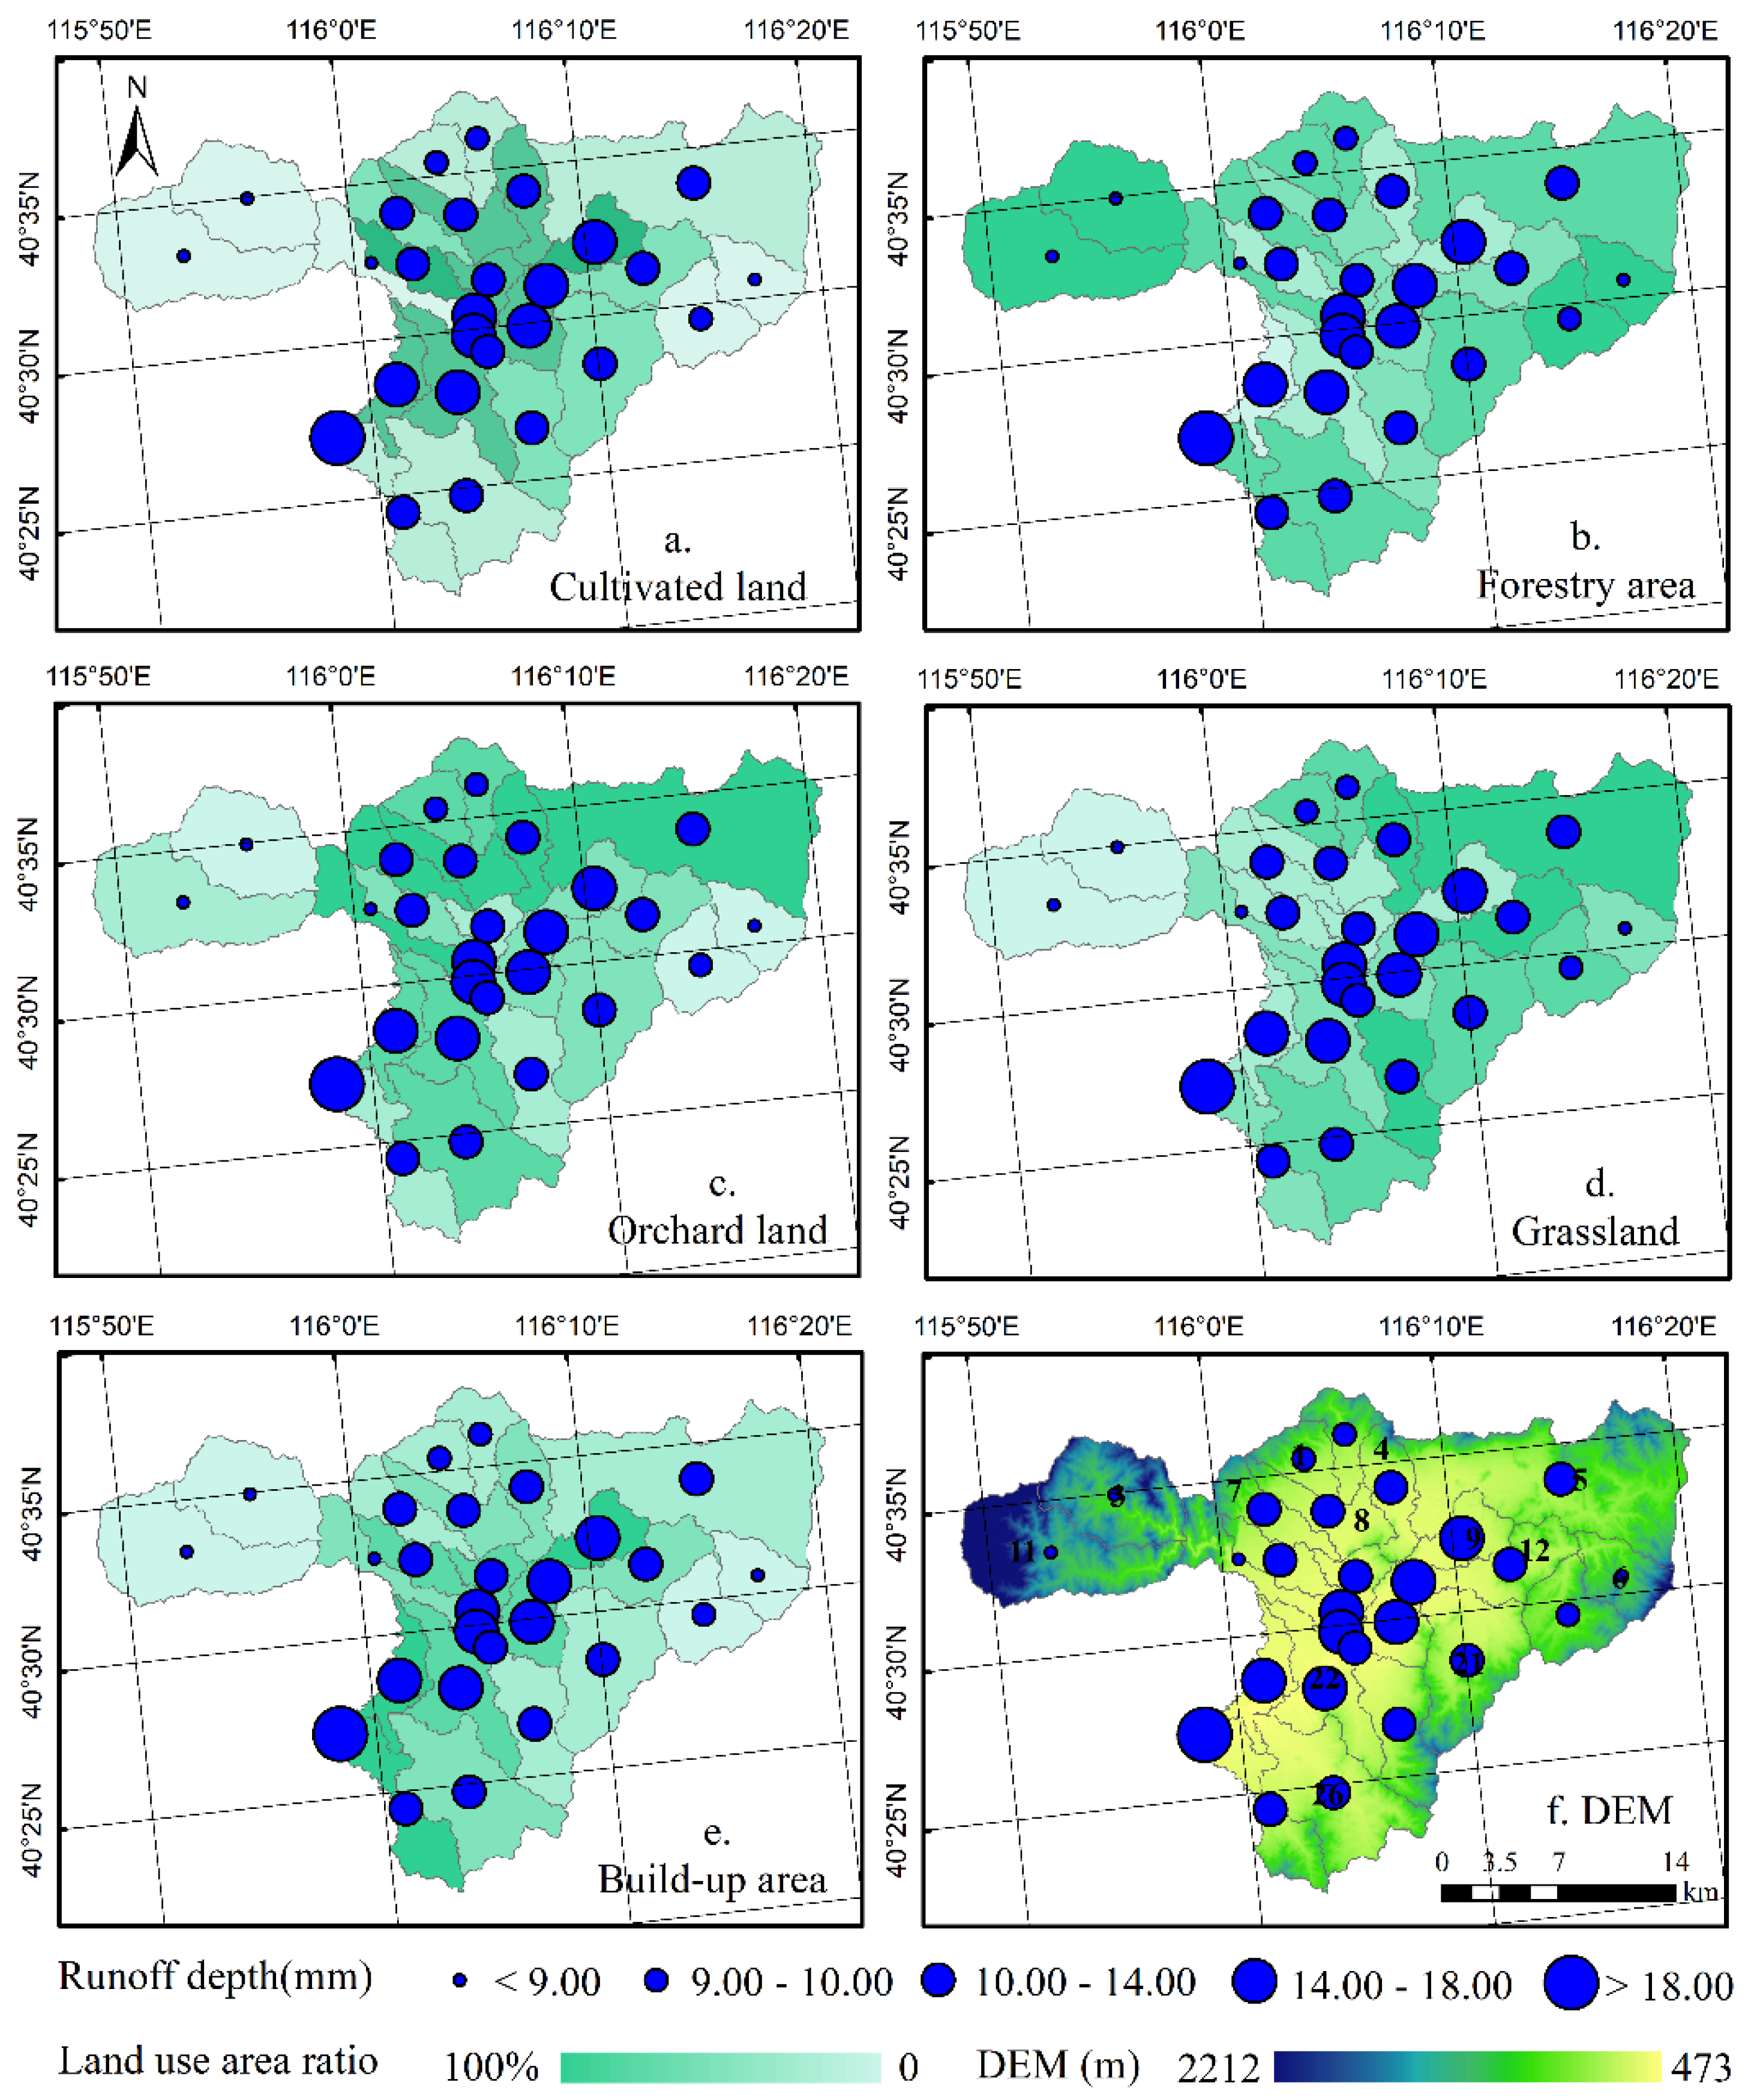
Spatial-Temporal Variation of Land Use in the Guishui River Basin
Impacts of Land Use Change on the runoff in the Guishui River Basin
4. Discussion
5. Conclusions
Author Contributions
Funding
Acknowledgments
Conflicts of Interest
References
- Wang, Q.; Xu, Y.P.; Wang, Y.F.; Zhang, Y.Q.; Xiang, J.; Xu, Y.; Wang, J. Individual and combined impacts of future land-use and climate conditions on extreme hydrological events in a representative basin of the Yangtze River Delta; China. Atmos. Res. 2020, 236. [Google Scholar] [CrossRef]
- Peng, H.; Jia, Y.W.; Qiu, Y.Q.; Niu, C.W.; Ding, X.Y. Assessing climate change impacts on the ecohydrology of the Jinghe River basin in the Loess Plateau, China. Hydrol. Sci. J. 2013, 58, 651–670. [Google Scholar] [CrossRef]
- Piyush, D.; Madan, L.S.; Jeeban, P.; Dhiraj, P. Modeling the future impacts of climate change on water availability in the Karnali River Basin of Nepal Himalaya. Environ. Res. 2020, 185. [Google Scholar] [CrossRef]
- Zhou, Y.L. Quantitative evaluation of the impact of climate change and human activity on runoff change in the Dongjiang River Basin; China. Water 2018, 10, 571. [Google Scholar] [CrossRef] [Green Version]
- Chu, H.B.; Wei, J.H.; Qiu, J.; Li, Q.; Wang, G.Q. Identification of the impact of climate change and human activities on rainfall-runoff relationship variation in the Three-River Headwaters region. Ecol. Ind. 2019, 106. [Google Scholar] [CrossRef]
- Huo, A.D.; Wang, X.F.; Cheng, Y.X.; Zheng, C.L. Impact of future climate change (2020–2059) on the hydrological regime in the heihe river basin in shanxi province; China. Int. J. Big Data Min. Glob. Warm. 2019, 1, 1950003. [Google Scholar] [CrossRef] [Green Version]
- Guo, S.S.; Zhu, Z.R.; Lyu, L. Effects of climate change and human activities on soil erosion in the Xihe River Basin; China. Water 2018, 10, 1085. [Google Scholar] [CrossRef] [Green Version]
- Qiu, J.L.; Shen, Z.Y.; Hou, X.S.; Xie, H.; Leng, G.Y. Evaluating the performance of conservation practices under climate change scenarios in the Miyun Reservoir Watershed; China. Ecol. Eng. 2020, 143. [Google Scholar] [CrossRef]
- Sarma, A.K.; Saharia, A.M. Future climate change impact evaluation on hydrologic processes in the Bharalu and Basistha basins using SWAT model. Nat. Hazards 2018, 92, 1463–1488. [Google Scholar] [CrossRef]
- Jiang, C.; Xiong, L.H.; Wang, D.B.; Liu, P.; Guo, S.L.; Xu, C.Y. Separating the impacts of climate change and human activities on runoff using the Budyko-type equations with time-varying parameters. J. Hydrol. 2015, 522, 326–338. [Google Scholar] [CrossRef]
- Wang, J.F.; Gao, Y.C.; Wang, S. Assessing the response of runoff to climate change and human activities for a typical basin in the Northern Taihang Mountain; China. J. Earth Syst. Sci. 2018, 127. [Google Scholar] [CrossRef] [Green Version]
- Abbas, S.A.; Xuan, Y. Impact of precipitation pre-processing methods on hydrological model performance using high-resolution gridded dataset. Water 2020, 12, 840. [Google Scholar] [CrossRef] [Green Version]
- Hilo, A.N.; Saeed, F.H.; Al-Ansari, N. Impact of climate change on water resources of Dokan Dam Watershed. Engineering 2019, 11, 464–474. [Google Scholar] [CrossRef] [Green Version]
- Yin, J.; He, F.; Xiong, Y.J.; Qiu, G.Y. Effects of land use/land cover and climate changes on surface runoff in a semi-humid and semi-arid transition zone in northwest China. Hydrol. Earth Syst. Sci. 2017, 21, 183–196. [Google Scholar] [CrossRef] [Green Version]
- Yang, Q.L.; Luo, S.S.; Wu, H.C.; Wang, G.Q.; Han, D.W.; Lü, H.S.; Shao, J.M. Attribution analysis for runoff change on multiple scales in a humid subtropical basin dominated by forest; east China. Forests 2019, 10, 184. [Google Scholar] [CrossRef] [Green Version]
- Opp, C.; He, X.; Lotz, T. Factors of runoff generation in the Dongting Lake basin based on a SWAT model and implications of recent land cover change. Quat. Int. 2018, 475, 54–62. [Google Scholar] [CrossRef]
- Deng, X.Z.; Zhang, F.; Wang, Z.; Li, X.; Zhang, T. An extended input output table compiled for analyzing water demand and consumption at county level in China. Sustainability 2014, 6, 3301–3320. [Google Scholar] [CrossRef] [Green Version]
- Omer, A.; Wang, W.; Basheer, A.K.; Yong, B. Integrated assessment of the impacts of climate variability and anthropogenic activities on river runoff: A case study in the Hutuo River Basin; China. Hydrol. Res. 2017, 48, 416–430. [Google Scholar] [CrossRef] [Green Version]
- Dosdogru, F.; Kalin, L.; Wang, R.Y.; Yen, H. Potential impacts of land use/cover and climate changes on ecologically relevant flows. J. Hydrol. 2020, 584. [Google Scholar] [CrossRef]
- Nash, L.; Gleick, P.H. Sensitivity of streamflow in the Colorado basin to climatic changes. J. Hydrol. 1991, 125, 221–241. [Google Scholar] [CrossRef]
- Bewket, W.; Sterk, G. Dynamics in land cover and its effect on stream flow in the Chemoga watershed, Blue Nile basin, Ethiopia. Hydrol. Process. Int. J. 2005, 19, 445–458. [Google Scholar] [CrossRef]
- Koo, H.; Chen, M.; Jakeman, A.J.; Zhang, F.Y. A global sensitivity analysis approach for identifying critical sources of uncertainty in non-identifiable; spatially distributed environmental models: A holistic analysis applied to SWAT for input datasets and model parameters. Environ. Model. Softw. 2020, 127. [Google Scholar] [CrossRef]
- Miller, S.N.; Baker, T.J. Using the Soil and Water Assessment Tool (SWAT) to assess land use impact on water resources in an East African watershed. J. Hydrol. 2013, 486, 100–111. [Google Scholar] [CrossRef]
- Jayakrishnan, R.; Srinivasan, R.; Santhi, C.; Arnold, J.G. Advances in the application of the SWAT model for water resources management. Hydrol. Process. 2005, 19, 749–762. [Google Scholar] [CrossRef]
- Fukunaga, D.C.; Cecílio, R.A.; Zanetti, S.S.; Oliveira, L.T.; Caiado, M.A.C. Application of the SWAT hydrologic model to a tropical watershed at Brazil. Catena 2015, 125, 206–213. [Google Scholar] [CrossRef]
- Jakada, H.; Chen, Z. An approach to runoff modelling in small karst watersheds using the SWAT model. Arab. J. Geosci. 2020, 13. [Google Scholar] [CrossRef]
- Yu, Y.D.; Liu, J.H.; Yang, Z.Y.; Cao, Y.Q.; Chang, J.; Mei, C. Effect of climate change on water resources in the Yuanshui River Basin: A SWAT model assessment. Arab. J. Geosci. 2018, 11, 1–9. [Google Scholar] [CrossRef]
- Hu, J.; Ma, J.; Nie, C.; Xue, L.Q.; Zhang, Y.; Ni, F.Q.; Deng, Y.; Liu, J.S.; Zhou, D.K.; Li, L.H.; et al. Attribution analysis of runoff change in Min-Tuo River Basin based on SWAT model simulations; China. Sci. Rep. 2020, 10. [Google Scholar] [CrossRef] [Green Version]
- Yan, X.M.; Lu, W.X.; An, Y.K.; Chang, Z.B. Uncertainty analysis of parameters in non-point source pollution simulation: Case study of the application of the Soil and Water Assessment Tool model to Yitong River watershed in northeast China. Water. Environ. J. 2019, 33, 390–400. [Google Scholar] [CrossRef]
- Tian, P.; Zhang, C. Simulation analysis of jiujiang river basin runoff based on swat model. IOP Conf. Ser. Earth Environ. Sci. 2017, 64, 012005. [Google Scholar] [CrossRef]
- Jones, R.N.; Chiew, F.H.S.; Boughton, W.C.; Zhang, L. Estimating the sensitivity of mean annual runoff to climate change using selected hydrological models. Adv. Water. Resour. 2006, 29, 1419–1429. [Google Scholar] [CrossRef] [Green Version]
- Abbaspour, K.C. User Manual for SWAT-CUP, SWAT Calibration and Uncertainty Analysis Programs; Swiss Federal Institute of Aquatic Science and Technology, Eawag: Duebendorf, Switzerland, 2007; Volume 93. [Google Scholar]
- Savage, M.J.; Thavhana, M.P.; Moeletsi, M.E. SWAT model uncertainty analysis; calibration and validation for runoff simulation in the Luvuvhu River catchment; South Africa. Phys. Chem. Earth 2018, 105, 115–124. [Google Scholar] [CrossRef]
- Liew, M.W.; Garbrecht, J. Hydrologic simulation of the little Washita River experimental watershed using SWAT. J. Am. Water. Resour. Assoc. 2003, 39, 14. [Google Scholar] [CrossRef]
- Moriasi, D.; Arnold, J.; Liew, M.W.V.; Bingner, R.L.; Harmel, R.D.; Veith, T.L. Model evaluation guidelines for systematic quantification of accuracy in watershed simulations. Trans. ASABE 2007, 50, 885–899. [Google Scholar] [CrossRef]
- Jia, X.Q.; Fu, B.J.; Feng, X.M.; Hou, G.H.; Liu, Y.; Wang, X.F. The tradeoff and synergy between ecosystem services in the grain-for-green areas in Northern Shaanxi, China. Ecol. Indic. 2014, 43, 103–113. [Google Scholar] [CrossRef]
- Yang, Z.Y.; Yu, Y.D.; Wang, J.H.; Yan, D.H. Climate change and its impact on water resources in Yixun River basin. Adv. Water Sci. 2011, 22, 175–181. [Google Scholar] [CrossRef]
- Gao, J.; Li, F.; Gao, H.; Zhou, C.B.; Zhang, X.L. The impact of land-use change on water-related ecosystem services: A study of the Guishui River Basin, Beijing, China. J. Clean. Prod. 2016. [Google Scholar] [CrossRef]
- Deng, X.Z.; Jiang, Q.O.; Zhan, J.Y.; He, J.Y.; Lin, Y.Z. Simulation on the dynamics of forest area changes in Northeast China. J. Geogr. Sci. 2010, 20. [Google Scholar] [CrossRef]
- Wen, X.; Deng, X.Z.; Zhang, F. Scale effects of vegetation restoration on soil and water conservation in a semi-arid region in China: Resources conservation and sustainable management. Resour. Conserv. Recycl. 2019, 151. [Google Scholar] [CrossRef]
- Borjesson, P.; Tufvesson, L.M. Agricultural crop-based biofuels-resource efficiency and environmental performance including direct land use changes. J. Clean. Prod. 2011, 19, 108–120. [Google Scholar] [CrossRef]
- Gong, H.L.; Yun, P.; Xu, Y.X. Spatio-temporal variation of groundwater recharge in response to variability in precipitation, land use and soil in Yanqing Basin, Beijing, China. Hydrogeol. J. 2012, 20. [Google Scholar] [CrossRef]
- Guo, B.B.; Zhang, J.; Gong, H.L.; Cheng, X.G. Future climate change impacts on the ecohydrology of Guishui River Basin, China. Ecohydrol. Hydrobiol. 2014, 14. [Google Scholar] [CrossRef]
- Kato, Y.; Okami, M.; Katsura, K. Yield potential and water use efficiency of aerobic rice (Oryza sativa L.) in Japan. Field Crops Res. 2009, 113, 328–334. [Google Scholar] [CrossRef]
- Liao, N.; Gu, X.C.; Wang, Y.J.; Xu, H.L.; Fan, Z.L. Analyzing Macro-Level Ecological Change and Micro-Level Farmer Behavior in Manas River Basin, China. Land 2020, 9, 250. [Google Scholar] [CrossRef]
- Wang, C.L.; Jiang, Q.O.; Shao, Y.Q.; Sun, S.Y.; Xiao, L.; Guo, J.B. Ecological environment assessment based on land use simulation: A case study in the Heihe River Basin. Sci. Total Environ. 2019, 697. [Google Scholar] [CrossRef]
- Oziransky, Y.; Kalmakova, A.G.; Margolina, I.L. Integrated scarce water resource management for a sustainable water supply in arid regions (the experience of the state of Israel). Arid Ecosyst 2014, 4, 270–276. [Google Scholar] [CrossRef]
- Dragonetti, G.; Khadra, R.; Daccache, A.; Oubelkacem, A.; Choukrallah, R.; Lamaddalena, N. Development and application of a predictive model for treated wastewater irrigation management in a semi-arid area. Integr. Environ. Assess. Manag. 2020. [Google Scholar] [CrossRef]
- Li, J.S.; Fei, L.J.; Li, S.; Xue, C.; Shi, Z.X.; Hinkelmann, R. Development of “water-suitable” agriculture based on a statistical analysis of factors affecting irrigation water demand. Sci. Total Environ. 2020, 744. [Google Scholar] [CrossRef]


| Period | Rank | Parameters | Definition | t-Stat | p-Value |
|---|---|---|---|---|---|
| Flood season | 1 | SOL_K | Saturated hydraulic conductivity | 16.07 | 0.00 |
| 2 | CANMX | Maximum canopy storage | 6.52 | 0.00 | |
| 3 | CN2 | SCS runoff curve number | 2.38 | 0.02 | |
| 4 | SLSUBBSN | Average slope length | 2.15 | 0.03 | |
| 5 | ESCO | Soil evaporation compensation factor | −1.91 | 0.06 | |
| 6 | GW_REVAP | Groundwater "revap" coefficient | 1.56 | 0.12 | |
| 7 | HRU_SLP | Average slope steepness | −1.44 | 0.15 | |
| 8 | CH_K1 | Effective hydraulic conductivity in tributary channel alluvium | 1.28 | 0.20 | |
| 9 | CH_N2 | Manning’s "n" value for the main channel | 1.25 | 0.21 | |
| 10 | ALPHA_BF | Baseflow alpha factor | −0.94 | 0.35 | |
| Non-flood season | 1 | GWQMN | Treshold depth of water in the shallow aquifer required for return flow to occur | 11.39 | 0.00 |
| 2 | SOL_AWC | Available water capacity of the soil layer | 4.14 | 0.00 | |
| 3 | CANMX | Maximum canopy storage | 2.56 | 0.01 | |
| 4 | ESCO | Soil evaporation compensation factor | −2.11 | 0.04 | |
| 5 | HRU_SLP | Average slope steepness | −1.89 | 0.06 | |
| 6 | GW_DELAY | Groundwater delay | −1.57 | 0.12 | |
| 7 | RCHRG_DP | Deep aquifer percolation fraction | −1.57 | 0.12 | |
| 8 | CH_K1 | Effective hydraulic conductivity in tributary channel alluvium | −1.54 | 0.13 | |
| 9 | SFTMP | Snowfall temperature | −1.47 | 0.14 | |
| 10 | SURLAG | Surface runoff lag time | 1.32 | 0.19 |
| Evaluation Index | Runoff Characteristics(m³/s) | |||||
|---|---|---|---|---|---|---|
| R2 | NSE | PBIAS | Simulated Mean | Observed Mean | ||
| Flood season | Calibration period | 0.78 | 0.77 | −2.1 | 0.275 | 0.269 |
| Validation period | 0.68 | 0.62 | 1 | 0.130 | 0.132 | |
| Non-flood season | Calibration period | 0.64 | 0.62 | 1.4 | 0.289 | 0.293 |
| Validation period | 0.68 | 0.52 | −0.4 | 0.324 | 0.323 | |
© 2020 by the authors. Licensee MDPI, Basel, Switzerland. This article is an open access article distributed under the terms and conditions of the Creative Commons Attribution (CC BY) license (http://creativecommons.org/licenses/by/4.0/).
Share and Cite
Wang, M.; Shao, Y.; Jiang, Q.; Xiao, L.; Yan, H.; Gao, X.; Wang, L.; Liu, P. Impacts of Climate Change and Human Activity on the Runoff Changes in the Guishui River Basin. Land 2020, 9, 291. https://doi.org/10.3390/land9090291
Wang M, Shao Y, Jiang Q, Xiao L, Yan H, Gao X, Wang L, Liu P. Impacts of Climate Change and Human Activity on the Runoff Changes in the Guishui River Basin. Land. 2020; 9(9):291. https://doi.org/10.3390/land9090291
Chicago/Turabian StyleWang, Meilin, Yaqi Shao, Qun’ou Jiang, Ling Xiao, Haiming Yan, Xiaowei Gao, Lijun Wang, and Peibin Liu. 2020. "Impacts of Climate Change and Human Activity on the Runoff Changes in the Guishui River Basin" Land 9, no. 9: 291. https://doi.org/10.3390/land9090291