Article

Tracking the Effects of Mangrove Changes and Spartina alterniflora Invasion on Soil Carbon Storage: A Case Study of the Beibu Gulf of Guangxi, China

1
School of Resources, Environment and Materials, Guangxi University, Nanning 530004, China
2
Key Laboratory of Environmental Protection (Guangxi University), Education Department of Guangxi Zhuang Autonomous Region, Nanning 530004, China
3
Guangxi Key Laboratory of Emerging Contaminants Monitoring, Early Warning and Environmental Health Risk Assessment, Nanning 530004, China
*
Author to whom correspondence should be addressed.
Land 2024, 13(3), 392; https://doi.org/10.3390/land13030392
Submission received: 18 February 2024 / Revised: 13 March 2024 / Accepted: 15 March 2024 / Published: 20 March 2024
(This article belongs to the Special Issue Monitoring and Simulation of Wetland Ecological Processes)

Abstract

:
In order to clarify the long-term changes in mangroves in the Beibu Gulf of Guangxi and the carbon storage changes after the invasion of Spartina alterniflora (S. alterniflora) in the Dandou Sea area, the Continuous Change Detection and Classification (CCDC) algorithm combined with feature indices was first used to track the changes. Subsequently, the random forest algorithm was applied to classify each change segment, and then sampling was conducted based on the distribution of S. alterniflora in different invasion years. The results showed that the Kappa coefficient of the classification result of the latest change segment was 0.78. The rapid expansion of S. alterniflora, aquaculture pond construction, and land reclamation activities have led to changes in mangroves, causing a decrease in the area of the mangrove region. A total of 814.57 hectares of mangroves has been converted into other land-cover types, with most pixels undergoing one to two changes, and many of these changes were expected to continue until 2022. An analysis of the distribution characteristics and influencing factors of soil organic carbon (SOC) and soil organic carbon storage (SOCS) at different invasion stages revealed that SOC and SOCS were mainly influenced by soil bulk density, soil moisture content, and electrical conductivity. It was found that S. alterniflora had higher SOC content compared to the mudflats. With the increase in invasion years, S. alterniflora continuously increased the SOC and SOCS content in coastal wetlands.

1. Introduction

As an important component of marine “blue carbon” ecosystems, mangroves are not only one of the vegetation ecosystems with the highest carbon density globally [1]; they also make significant contributions to maintaining biodiversity and purifying seawater [2], playing a crucial role in mitigating global climate change by carbon sequestration [3]. Mangrove changes are typically caused by rapid urbanization [4], the expansion of aquaculture [5], and the invasion of alien species, making it crucial to detect mangrove changes rapidly and accurately for their conservation. In addition, coastal wetland soil is an important carbon pool of the earth, and its soil carbon sequestration capacity is dynamic. The soil carbon pool is not only affected by native vegetation but is also threatened by the invasion of alien species and the impact of global climate change [6]. Therefore, understanding the dynamic response mechanism of soil organic carbon (SOC) under the invasion of S. alterniflora is of great significance.
Many studies have aimed to monitor the long-term changes in mangrove ecosystems, primarily focusing on the identification of individual or synthesized images. In recent years, mangrove monitoring has moved in the direction of utilizing all available observational data. The Landsat satellite series, launched in 1972, has provided continuous observations of remote sensing images over many years [7]. The long time series of Landsat images means the vegetation growth trends can be tracked and monitored long-term ecosystem changes. The Continuous Change Detection and Classification (CCDC) algorithm was developed based on this, relying on pixel fitting to capture changes in land cover, reducing the demand for cloud-free images and proving advantageous for monitoring mangrove ecosystems [8]. Compared with other algorithms, the CCDC algorithm can more quickly and efficiently detect multiple change processes and study “sudden changes” in land features, and it has the potential to detect gradual disturbances such as biological invasions or sudden disturbances such as storms and logging [9,10]. The CCDC algorithm could be used to obtain information on mangrove damage and recovery in the Sundarbans region after storms, which is important for monitoring annual mangrove loss and recovery [11]. Some researchers used the CCDC algorithm to track the loss and recovery of mangroves in six natural reserves in the Guangdong–Hong Kong–Macao Greater Bay Area, proposing a mangrove-protection evaluation system [12]. Due to the extensive data storage and complexity of the algorithm, the emergence of remote sensing cloud platforms has provided new research perspectives for addressing these challenges [13]. Google Earth Engine (GEE) is a free and open cloud platform capable of processing geospatial big data [14]. The implementation of the CCDC algorithm on GEE reduces the time consumed in processing temporal stacks, providing new research ideas for monitoring mangrove changes.
S. alterniflora is a perennial herbaceous plant that was introduced to China’s coastal areas around 1979 to promote sediment deposition, reduce wave erosion, and protect coastal mudflats. Subsequently, S. alterniflora rapidly spread and proliferated along coastal regions, quickly displacing indigenous vegetation due to its strong adaptability and competitiveness. The strong adaptability, salt tolerance, and submergence tolerance of S. alterniflora have led to its rapid growth and spread on coastal mudflats [15]. Its extensive expansion poses a threat to the biodiversity of native vegetation ecosystems [16,17]. Extensive research has been conducted to understand the impact of S. alterniflora invasion on soil carbon content in coastal wetlands, indicating that S. alterniflora invasion increases soil carbon content and consequently enhances soil organic carbon storage (SOCS) [18]. One of the main reasons for this is the influence of S. alterniflora biomass input and salt-marsh deposition rates associated with organic carbon accumulation in the soil [19,20]. Previous studies have shown that soil physicochemical properties such as soil bulk density (BD), moisture content (MC), and pH can affect surface SOC [21]. However, the response mechanism of SOC distribution to S. alterniflora invasion is different and complex; thus, exploring the driving mechanisms of SOC changes at different soil depths is essential to understanding the impact of S. alterniflora invasion on SOC.
This study aims to investigate changes in mangrove ecosystems along the coast of Guangxi and to examine alterations in wetland soil following the invasion of S. alterniflora. The main objectives are as follows: (1) to track changes in mangrove ecosystems along the coast of Guangxi from 1990 to 2022; (2) to understand variations in surface and subsurface soil SOC and SOCS in response to different invasion periods of S. alterniflora; and (3) to explore the impact of soil physicochemical properties associated with different invasion periods of S. alterniflora on SOC and SOCS.

2. Materials and Methods

2.1. Study Area

The Beibu Gulf of Guangxi (107°57′ E~109°48′ E, 21°00′ N~22°15′ N) is characterized by a subtropical marine monsoon climate, with a marine area of approximately 128,000 square kilometers and a coastline length of about 1628.59 km. Along the coast, there are mangrove forests such as Avicennia marina, Aegiceras corniculatum, Kandelia obovate, and so on, primarily distributed in locations such as those near the Dandou Sea, the Nanliu River, and the Dafeng River, making it one of the most important mangrove distribution areas in China. The study area covers the region along the Guangxi coast, where mangroves have grown from 1990 to 2022.
The Landsat 5/7/8 (Landsat TM/ETM+/OLI) surface reflectance dataset was accessed for the years 1990 to 2022 on the Google Earth Engine (GEE) cloud platform (LANDSAT/LT05/C02/T1_L2, LANDSAT/LE07/C02/T1_L2, LANDSAT/LC08/C02/T1_L2). This dataset has undergone atmospheric correction using the surface reflectance code algorithm, followed by cloud masking using the QA band (qa_pixel). The spectral differences were demonstrated between the various sensors of the Landsat satellite series [22]. To enhance coherence among image collections from different sensors for long-term analysis, the ordinary least-squares method was employed to harmonize the spectral reflectance of the TM and ETM+ sensors with that of the OLI sensor, thereby creating a consolidated image collection for long-term analysis.
The mangrove growth range data for the Beibu Gulf of Guangxi were obtained from the STDFT_Mangrove dataset [23]. This dataset integrates all available Landsat image collections, calculates various classification feature values, and improves detection frequency by adding phenological change indicators. Ultimately, a method based on spatiotemporal detection frequency thresholds was proposed for mangrove identification using remote sensing, with an overall classification accuracy exceeding 90% and Kappa coefficients exceeding 0.9. From this dataset, the area where mangroves grew in the Beibu Gulf of Guangxi was proposed. After an accuracy evaluation, we found that the overall accuracy was more than 90%. The distribution of mangroves in the Beibu Gulf of Guangxi from 1990 to 2022 is shown in Figure 1. The dataset can be reproduced with the following GEE script: https://code.earthengine.google.com/9e0404a09772300b212dd35302ec937b (accessed on 2 August 2023) [23].

2.2. Continuous Change Detection and Classification Algorithm

The CCDC algorithm can capture surface changes caused by vegetation phenology and urbanization-induced abrupt changes [8,24], making it advantageous for monitoring long-term mangrove changes. The CCDC algorithm is mainly used to fit the characteristic observations by using the harmonic-like fitting method (Equation (1)) on the spectral time series, eliminating clouds and other occlusions.
ρ ^ ( i , x ) OLS = α 0 , i + α 1 , i x + α 2 , i cos ( 2 π T x ) + α 3 , i sin ( 2 π T x ) + α 4 , i cos ( 2 π 2 T x ) + α 5 , i sin 2 π 2 T x + α 6 , i cos ( 2 π 4 T x ) + α 7 , i sin ( 2 π 4 T x ) ,   τ k 1 * x τ k *
where x represents the time; i represents the i-th band in the image; T represents the total number of days in one year; α represents the fitting parameter; τ k * represents the k-th change; and ρ ^ ( i , x ) O L S represents the fitting value.
If a pixel is observed to change in multiple consecutive images, it may be due to changes in land-use types. If only one to two consecutive changes are observed, it is considered a “possible change”; if a third consecutive change occurs, the pixel is labeled as “change detected.” The time-series model used in the CCDC algorithm consists of three components: seasonal, trend, and abrupt change (Equation (2)), recording intra-annual and inter-annual changes and breakpoint information. If a land-cover pixel undergoes no change, its CCDC fitting curve will consist of only one segment; if a change occurs once, the CCDC algorithm will detect a breakpoint in the curve, dividing it into two segments, and two change sections will be obtained. Each change segment has a start and end time, which can be classified independently. The CCDC algorithm does not classify Landsat original images but uses time-series model coefficients as input for land classification. After change detection, each pixel has time-series models before and after the change. By classifying the time-series model coefficients, different land-use types of different change segments within the study period can be obtained.
ρ ( ix ) = a 0 , j + a 1 , i cos 2 π x T + b 1 , i sin 2 π x T + c 1 , j x
where i represents the fitted value of the spectral index; x represents the day of the year (1–365); T has a value of 365; a 1 , i and b 1 , i represent the seasonal change coefficients; c 1 , j   represents the annual change coefficient; and a 0 , j represents the error value of the fitting.

2.3. Characteristic Index

The normalized difference vegetation index (NDVI) [25] is a remote sensing index used to reflect the growth status of vegetation (Equation), and it can be used to distinguish different land-cover types. S. alterniflora is an exotic invasive plant in the coastal zone of Guangxi, which has encroached upon the habitat of mangroves. Due to the distinct growth cycle of S. alterniflora, including growth and senescence periods [26], while mangroves are evergreen vegetation, the NDVI time-series curves can clearly differentiate between the two types of vegetation [27].
A new Mangrove Vegetation Index (MVI) was developed [28], which can effectively identify mangroves (Equation (3)). Incorporating this index into the CCDC algorithm as a band for detecting mangrove changes can improve the identification results of the algorithm.
NDVI = ρ NIR ρ Red ρ NIR + ρ Red
MVI = ρ NIR ρ Green ρ SWIR 1 + ρ Green
where ρ Green , ρ Red , ρ NIR , and ρ SWIR 1 represent the reflectance values of Landsat images in the green, red, near-infrared, and shortwave infrared bands, respectively.

2.4. Random Forest

Random forest is a machine learning algorithm based on ensemble learning [29] that can be used for land-cover classification [30] and inversion [31]. Each decision tree in a random forest is a classifier, so the random forest adopts the idea of combining multiple weak classifiers into a strong classifier, thereby improving the overall performance and robustness of the model by integrating the results of multiple decision trees. In this study, the input features used to train the classifier consist of the eight parameters obtained from the temporal fitting results of the CCDC algorithm in the latest change segment (Equation (1)). These features are applied to the images of other change segments to achieve land-cover classification. In this study, when pixels identified as mangroves were detected that underwent a change and were no longer identified as mangroves, but were instead classified as S. alterniflora, ponds, or other land-cover types, mangroves underwent a change.
For change segment images, the change time of each pixel was different. Therefore, the land-cover samples in this area were selected with reference to the 2022 image, which represents the “latest” land-cover classification. Since mangroves are affected by invasive species and human activities, the changed pixels were divided into four categories in this study: mangroves, S. alterniflora, ponds, and other land-cover types including mudflats, impervious surfaces, etc. Moreover, 658 mangrove sample points, 300 S. alterniflora sample points, 400 pond sample points, and 300 sample points of other land-cover types (including mudflats, impervious surfaces, bare land, etc.) were visually interpreted. All the sample points were quoted from the high-resolution Google Earth imagery in 2022 with a spatial resolution of 2 m. A total of 1658 training samples were obtained as a training sample dataset, which was used in random forest classification. In order to increase the heterogeneity of the sample points, typical land-cover sample points with S. alterniflora, stable ponds, bare land and impervious surfaces growing in the northern part of the Beibu Gulf were also selected and added to the analysis.

2.5. Sediment Sampling and Sample Treatment

Since S. alterniflora was first introduced to the Dandou Sea area and continued to expand, this study selected S. alterniflora wetlands at different invasion ages in the Dandou Sea and Tieshan Port areas, and sampling points were selected based on the results obtained from Google Earth imagery, Landsat imagery data, and the CCDC algorithm results, as shown in Figure 2.
Field sampling was conducted in July 2023. The plots of SA3, SA6, SA8, SA12, and SA18–21 represent the area invaded by S. alterniflora for 3a, 6a, 8a, 12a, and 18–21a, respectively. Five sampling plots of 0.25 m2 were established at each sampling point. In each plot, a five-point sampling method was employed in collecting soil columns from 0–60 cm with a soil sampler, including samples from 0–20 cm, 20–40 cm, and 40–60 cm. After removing soil impurities, the samples were placed in sealed polyethylene bags and immediately transported to the laboratory. Subsequently, the samples were dried in a cool and ventilated indoor area. When the soil moisture was reduced enough to put into the oven, the soil sample was dried to a constant weight and then analyzed for SOC, soil physical and chemical factors, and other indicators.
The content of SOC was determined using the potassium dichromate external heating oxidation method [32]. Easily oxidized organic carbon (EOC) was measured using the potassium permanganate method. Dissolved organic carbon (DOC) was determined by using the same method as SOC after the centrifugal filtration of the soil samples. In each experiment, three groups of parallel experiments were carried out to calculate the average value, the standard deviation, and so on.

2.6. Data Analysis

Moisture content (MC) is expressed as:
MC = FW DW FW × 100
where FW denotes the soil fresh weight and DW denotes the soil dry weight.
Soil bulk density (g/cm3) is expressed as:
BD = g   ×   100 v   ×   ( 100   + MC )
where g denotes the fresh weight of ring knife soil (g) and v denotes the ring knife volume (100 cm3).
SOCS (t/ha) is expressed as:
SOCS = i n   C i   ×   D i × E i × 0.1
where C i denotes carbon mass fraction in i soil depth (g/kg); D i denotes the soil BD in i soil depth (g/cm3); E i denotes thickness of soil in i soil depth (cm); n denotes the number of soil depth layers; and 0.1 denotes the coefficient of g/kg converted to t/ha.

3. Results

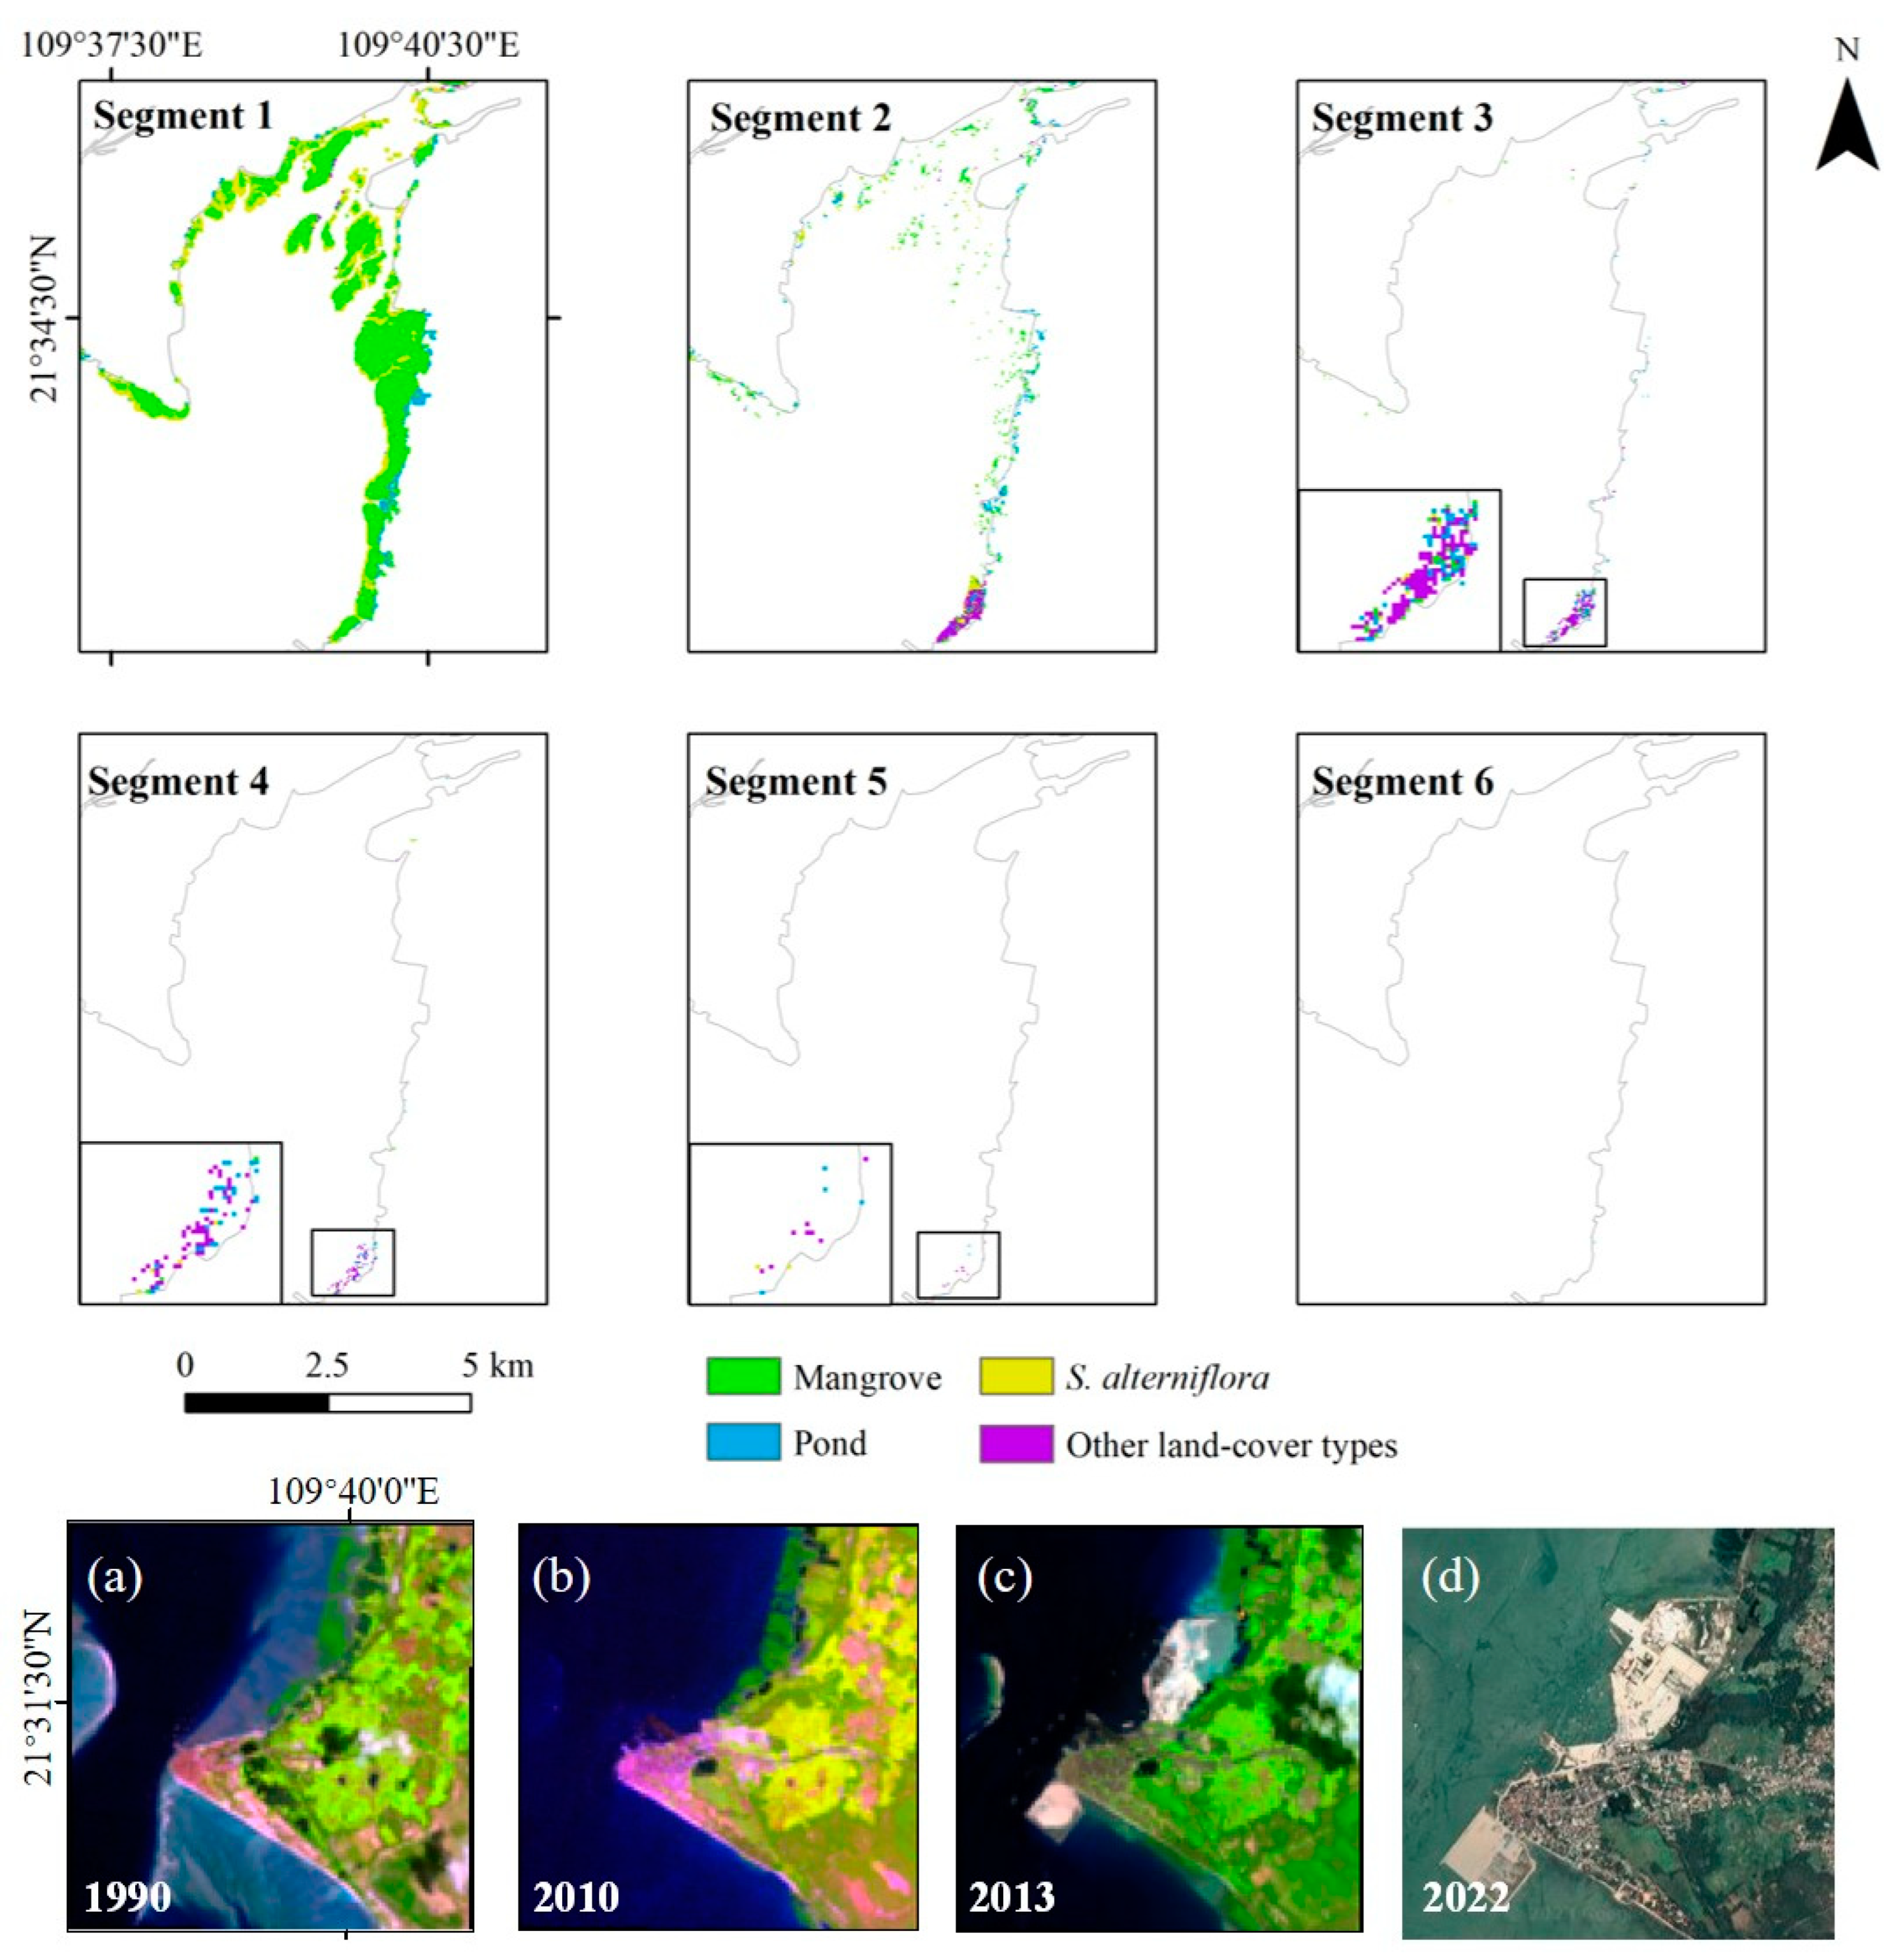
3.1. Change Segment Classification Results and Accuracy Evaluation

The results of the CCDC algorithm were presented in “change segments”. Due to the varying times of change in different pixels within the “change segments”, it was difficult to evaluate the accuracy of classification results year by year, as is typical in common classification methods. From 1990 to 2022, the accuracy evaluation was conducted every 5 years. The accuracy evaluation of the corresponding year is shown in Table A1. The result of 2022 was the closest to the actual situation, so the latest land-cover classification in 2022 was taken as an example for discussion. Validation sample points (300 for mangroves, 100 for S. alterniflora, 200 for ponds, and 100 for other land classes) were selected on the Google Earth 2022 image to verify the final change segment, i.e., the latest land-cover classification accuracy. The confusion matrix obtained is shown in Table 1, with an overall accuracy (OA) of 85% and a Kappa coefficient of 0.78. Table A1 shows that the Kappa coefficients of these years were 0.74–0.78, and the OA was 82.29–85%. This accuracy is the best result that can be achieved at present.
The classification results obtained by the CCDC algorithm represent the land-cover classification results for each change segment. From 1990 to 2022, most land-cover types in the study area had only one change segment, indicating no change, which was consistent with the results of other scholars’ research. Table 2 summarizes the areas of different change segments, showing that most of the land-cover types that experienced changes went through one to two change segments.
The change pixels identified as mangroves consistently ranked first, with proportions exceeding 50% in change segments 2, 3, and 4. This indicated that the relevant policies enacted in Guangxi after 2000 had effectively protected the mangroves, and active measures such as artificial restoration and natural recovery [33] had actively promoted the expansion of mangrove forests. Additionally, in the second change segment, the proportion of pixels converted to ponds ranked second (21%), suggesting that pond aquaculture activities were prevalent in the coastal areas of Guangxi in the 1990s, until they reached saturation. In subsequent change segments, the number of changing pixels decreased, indicating a reduction in the encroachment of ponds on mangroves. Although S. alterniflora rapidly expanded in the Dandou Sea and Nanliu River regions of Guangxi, squeezing into the margins of the mangrove growth area, there were still significant areas unaffected by S. alterniflora invasion. Therefore, the proportion of pixels identified as S. alterniflora was the smallest.
The classification results of change segments in the Dandou Sea region are shown in Figure 3. Most change pixels only underwent one to two changes, with the fifth and sixth change segments having fewer change pixels, accounting for only 0.35%. In the Dandou Sea region, the area of mangrove changes was relatively small, with pixels identified as mangroves undergoing one to two changes, accounting for 53.82% and 26.45%, respectively. This was mainly due to the establishment of the Shankou Mangrove National Nature Reserve in 1990 in China, which provided a favorable protection environment for mangroves. According to literature records, S. alterniflora was introduced to the Dandou Sea area in 1979, initially to provide favorable conditions for the seaward expansion of mangroves by utilizing its sediment-retention ability. However, after 2005 [34], S. alterniflora expanded to the edge of the mangroves and began to compete with mangroves for living space. Pixels identified as S. alterniflora in the second change segment mainly concentrated on the edge of the protected area mangroves, covering an area of 22.57 hectares. The encroachment of aquaculture ponds on mangroves mostly occurred on the landward side of the mangrove reserve, with scattered change pixels, and did not appear in subsequent change segments, indicating irreversible changes to mangroves caused by the expansion of aquaculture ponds. Additionally, the most significant human activity impact in the Dandou Sea area was the construction of the Shatian Port, which caused some mangroves to disappear and become impervious surfaces. The black box indicated that the part of the Shatian Port was enlarged in Figure 3.
The Nanliu River region was relatively vast and susceptible to natural factors (Figure 4). Before 2005, only small patches of mangroves grew, with mudflats being the main land-cover type in the study area. Therefore, most land-use classifications in the first change segment were categorized as other land types. Over time, in the second change segment, the area identified as mangroves reached 1077.8 hectares, indicating that under the impetus of national policies, the area of mangroves continued to increase due to natural growth and artificial planting trends [35], showing a trend of growth from land to sea. Due to the favorable temperature and abundant growth space in the Nanliu River region, S. alterniflora began to rapidly spread and grow on the mudflats until it began to compete with mangroves for living space. Areas identified as S. alterniflora in the second change segment were approximately 39.06 hectares, with fewer subsequent change pixels, indicating that S. alterniflora growth had approached saturation. Although human activities had a relatively minor impact on mangroves in the Nanliu River region, before the enactment of laws protecting mangroves in China, there were cases of mangrove deforestation and the construction of ponds. The area selected in the image remained mangroves in 1991; however, in 1993, due to the promotion of the aquaculture industry, mangroves were artificially deforested, and ponds covering an area of approximately 46.47 hectares were constructed, consistent with the situation identified as ponds in the second change segment. Most pixels did not undergo subsequent changes thereafter, consistent with the results obtained from the imagery, indicating that the damage caused by artificial pond excavation and aquaculture activities to mangroves was permanent and irreversible. The black box indicated that part of the area in Figure 4 were enlarged. Figure A1, Figure A2 and Figure A3 of Appendix A contained further data regarding other areas.

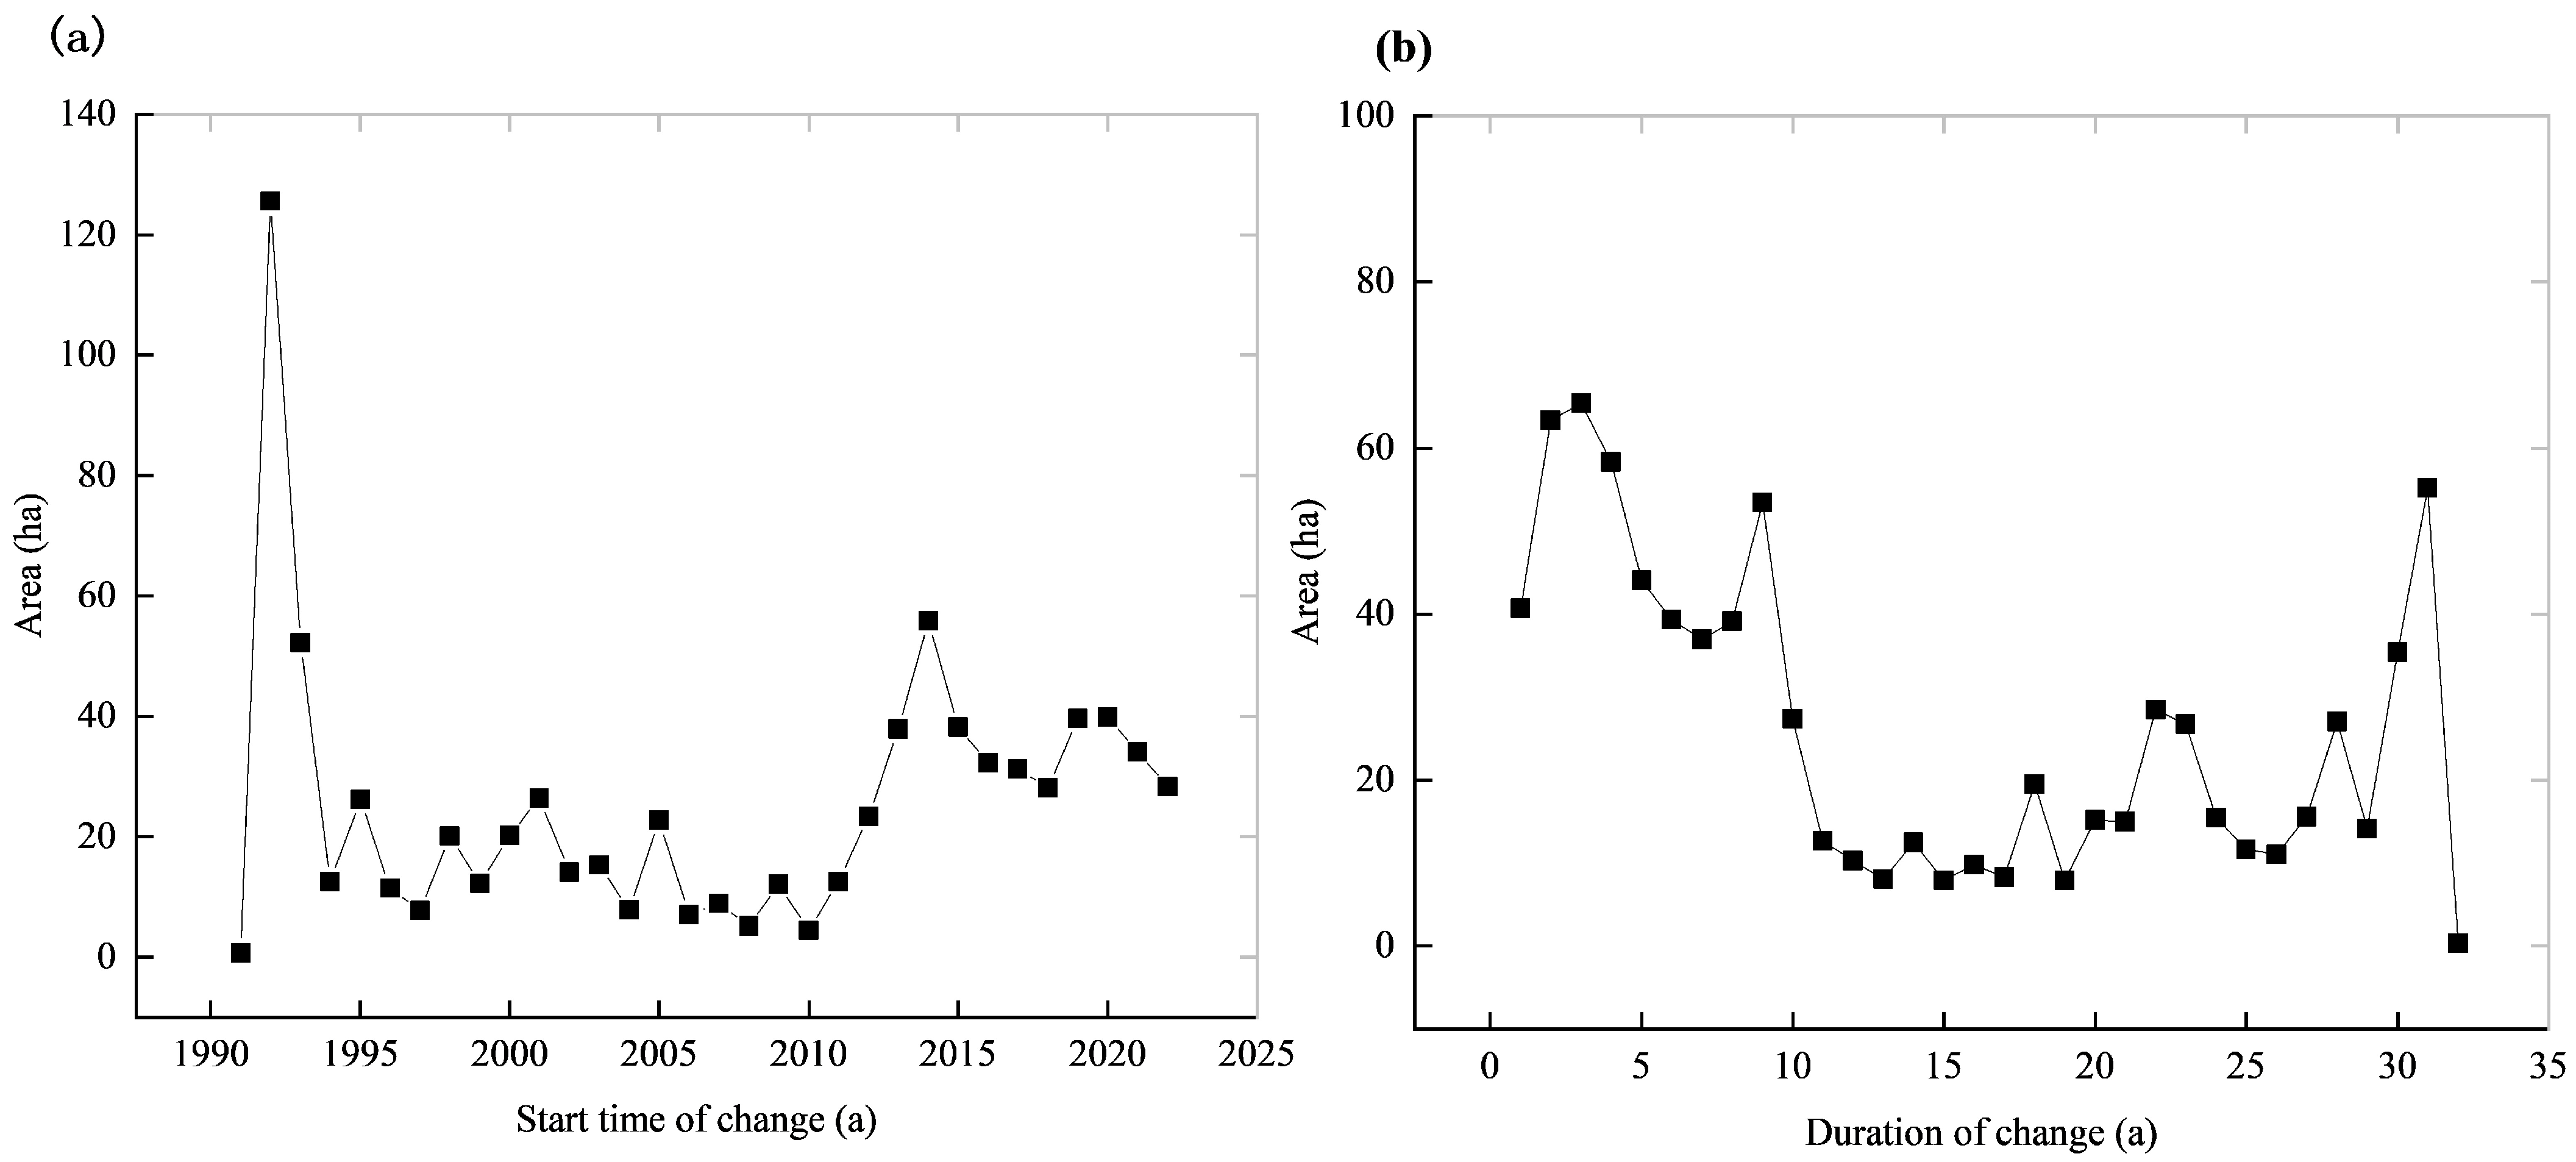
3.2. Mangrove Change Duration

In the results, some pixels exhibited change durations exceeding 30 years, reaching 31 and even 32 years. Because the CCDC algorithm extracts change features directly from the NDVI and MVI time-series curves. It initialized fitting of change trends with values from a certain period, resulting in a certain time interval. The change outcomes of different change segments were considered to be genuine. However, due to the direct extraction of change segments from the time series, it led to instances where the duration of mangrove change exceeded 31 or even 32 years. For example, a mangrove change might have occurred in a certain month of 1990, and the final calculation would label this period as 32 years.
From 1990 to 2022, the area of mangrove change in the northern part of the Beibu Gulf of Guangxi amounted to 814.57 hectares. There was a significant variation in the area covered by mangrove change over different durations, as depicted in Figure 5, showing a “high at both ends” trend. The largest area of mangrove change occurred in 1992, reaching 125.53 hectares, followed by a trend of decreasing and increasing change areas over subsequent years. The largest area, with a duration of 3 years, accounted for 65.37 hectares, followed by 2-year change areas covering 63.36 hectares. Additionally, the area with a change duration of 31 years reached 55.15 hectares. In summary, mangrove changes primarily occurred as short-term changes (1–4 years) or as permanent transitions.

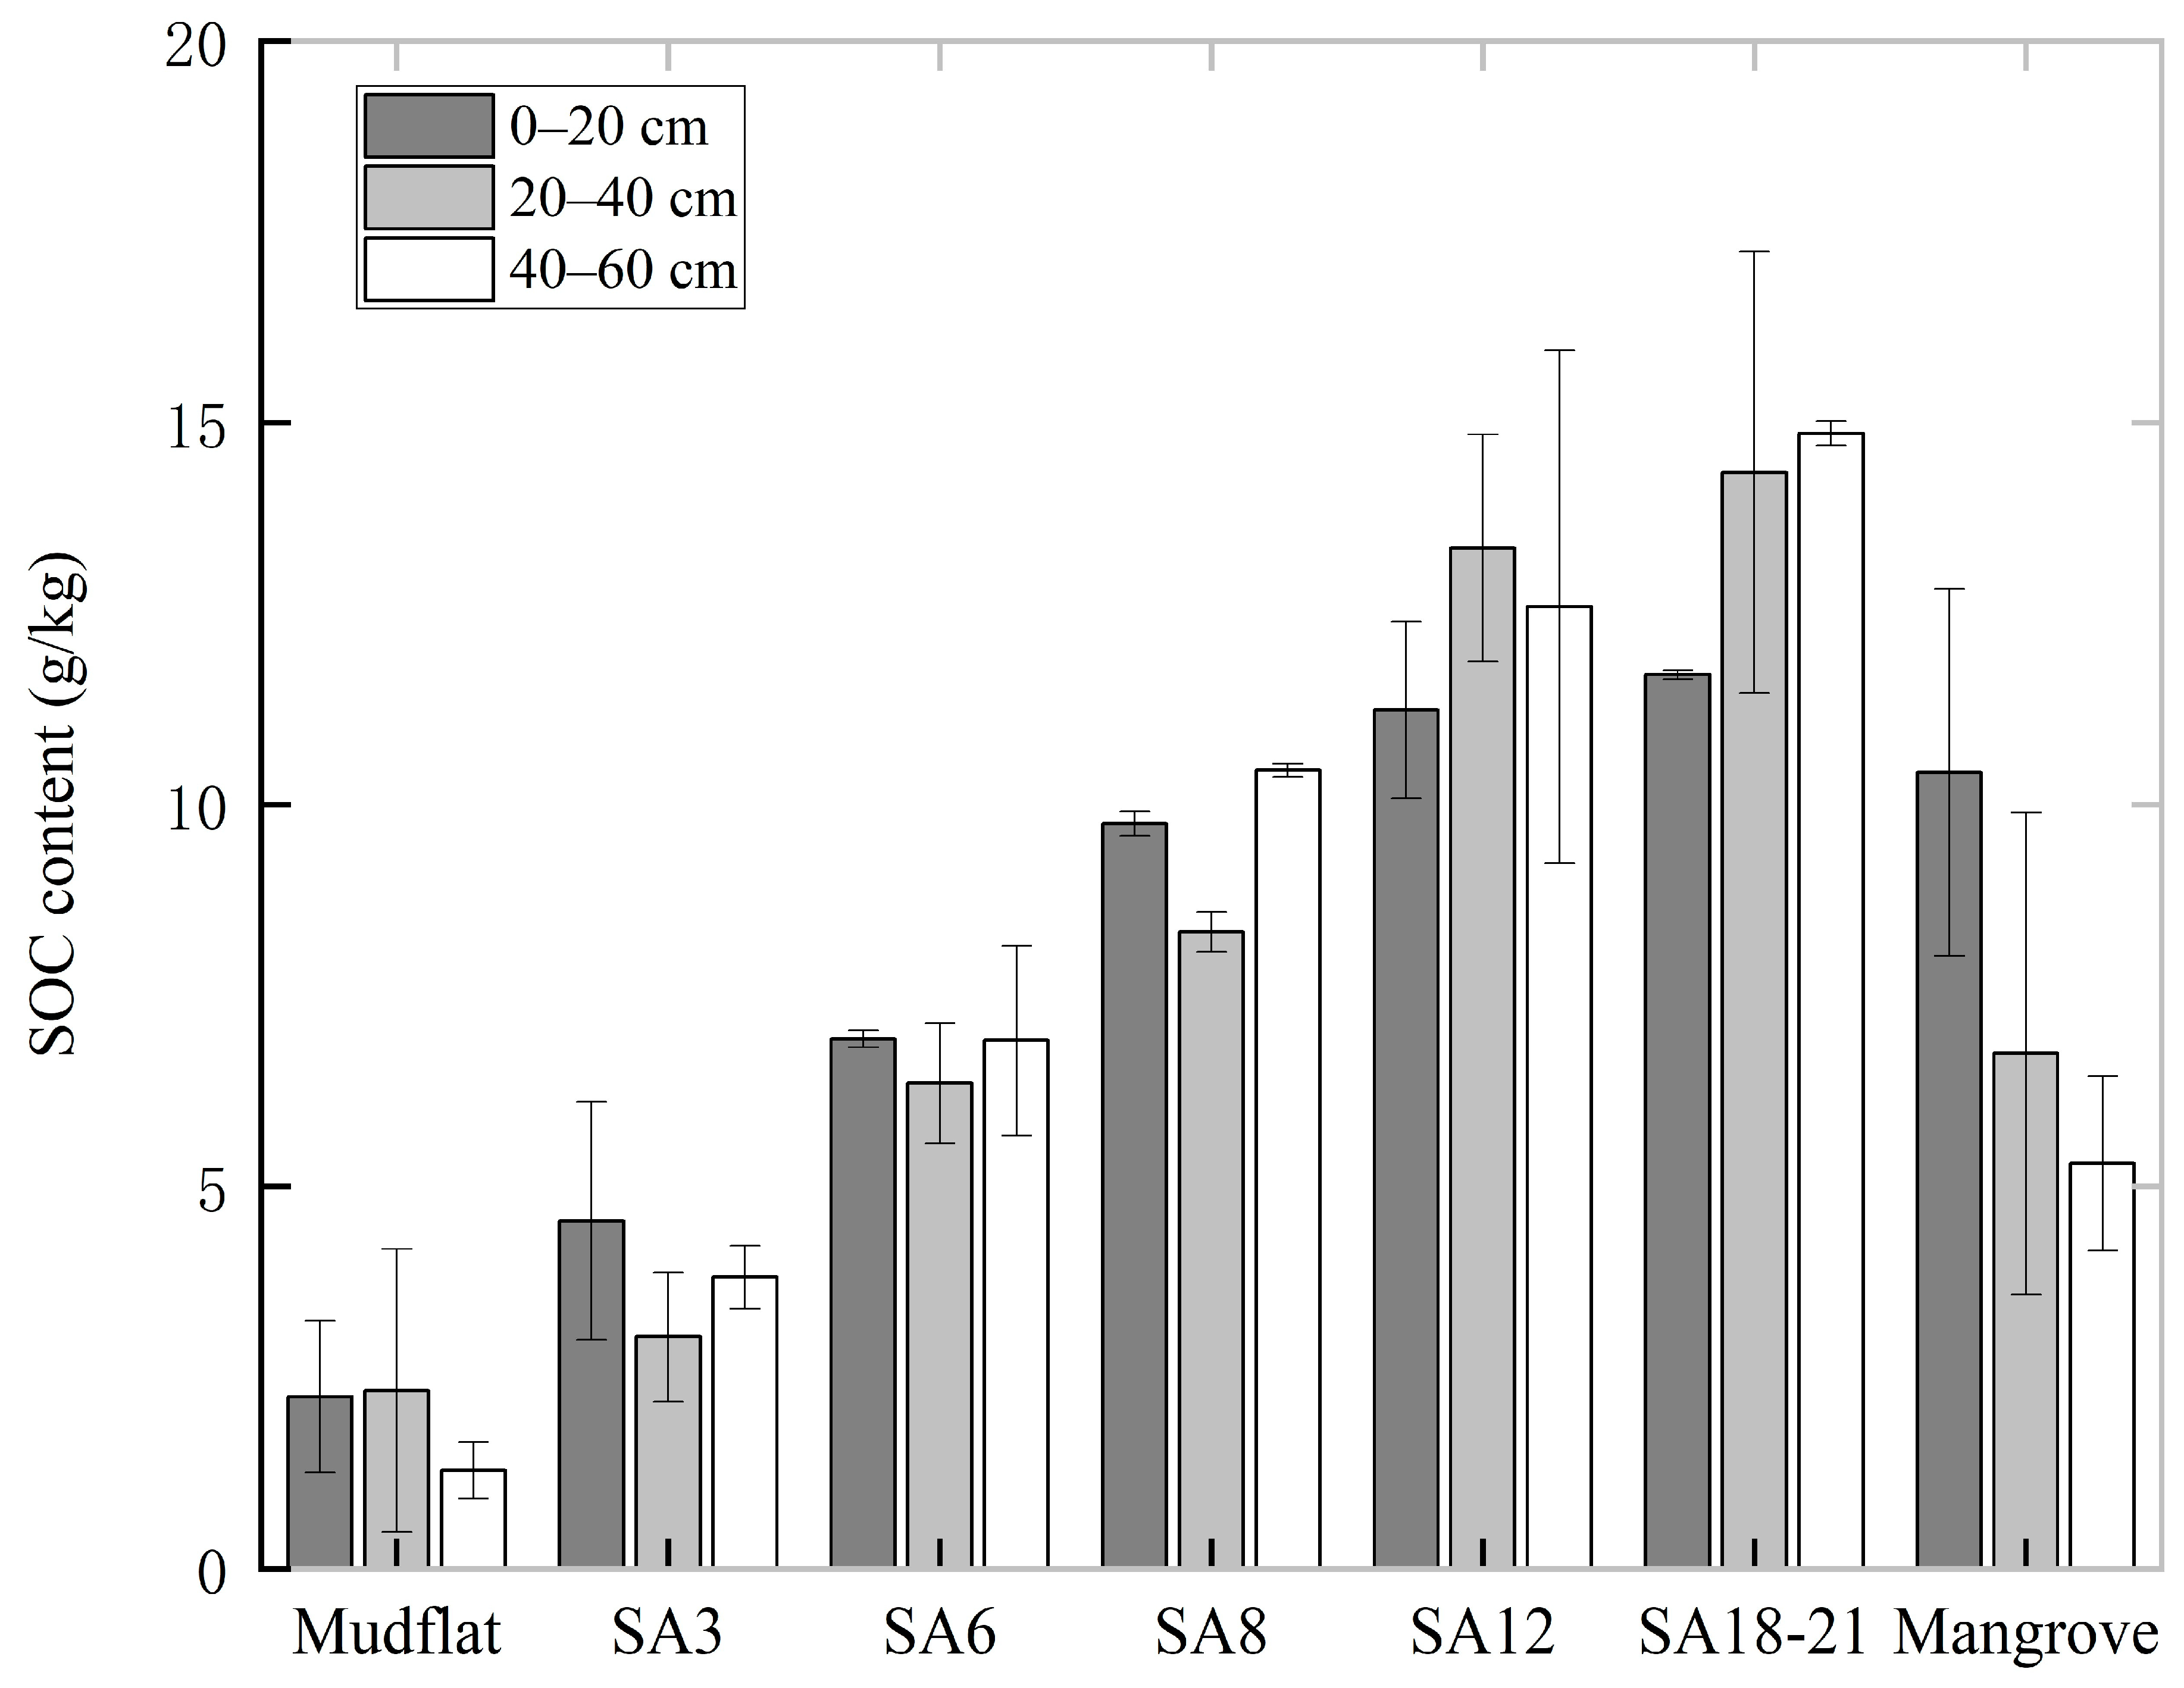
3.3. SOC and SOCS Content of S. alterniflora with Different Invasion Years

As shown in Figure 6, the SOC content of S. alterniflora was higher than that of the mudflat for all years, and the SOC content of each soil layer increases with the duration of S. alterniflora invasion. Even after 18–21 years, the soil SOC content had not reached saturation. The SOC content in the 20–40 cm soil layer was always lower than that in the other two soil layers, and it was slightly higher than that in the deep soil after 12 years of invasion. The SOC content of the 40–60 cm soil layer accumulated noticeably with increasing years. Since the invasion of S. alterniflora 8 years ago, the SOC content had been comparable to that of the mangrove wetland, and the SOC content of the deep soil exceeded that of the mangrove wetland.
Since the invasion of S. alterniflora, the total SOCS of S. alterniflora at five different invasion periods were significantly higher than those of the mudflat, with the increase in carbon storage increasing with the invasion period. The highest increase was observed at 18–21 years, reaching approximately 6.05 times higher than the mudflat (Figure 7). After 6 years of S. alterniflora invasion, the content of SOCS in the 40–60 cm soil layer was higher than mangrove wetland, while the surface soil content remained lower than in the mangrove wetland. However, after 8 years of S. alterniflora invasion, the SOCS content of the 0–20 cm and 20–40 cm soil layers had reached parity with the mangrove wetland. After 12 years of invasion, there was a noticeable accumulation trend of SOCS in the soil layer of 20–40 cm. The highest SOCS at 40–60 cm was observed after 18–21 years of invasion, followed by the surface soil of the same invasion period.

3.4. The Correlation between Soil Physical and Chemical Factors and SOC, SOCS in S. alterniflora Wetland

The statistical results of soil physicochemical properties for S. alterniflora, mangrove, and mudflat are presented in Table 3, while Table 4 shows the correlation between soil physicochemical properties after S. alterniflora invasion and SOC, as well as SOCS. The SOC of S. alterniflora was significantly positively correlated with electrical conductivity (EC), MC, SOCS, EOC, POC, and DOC, with the highest correlation with POC and SOCS, of 0.975 and 0.963, respectively. SOC was significantly negatively correlated with BD. SOCS was significantly positively correlated with EC, SOC, EOC, POC, and DOC, with the highest correlation with SOC and POC, of 0.963 and 0.962, respectively. SOCS was significantly negatively correlated with BD.

4. Discussion

4.1. Change Detection of Mangrove by Using CCDC

Before 2000, China’s mangrove loss rate had reached 62% [36], with an area reduction of over 20,000 hectares. Common disturbances to mangroves included conversion to aquaculture ponds, bare land, and urban surfaces, or invasion by alien species. Over the past thirty years, urbanization and industrialization trends in the coastal areas of the Beibu Gulf of Guangxi have accelerated, intensifying the exploitation and utilization of the ocean. The number of land reclamation projects for port terminals, industrial bases, and other purposes significantly increased. Before national mangrove-protection policies were enacted, these projects caused irreversible losses to mangroves. As the world’s largest aquaculture country, China’s coastal aquaculture development has led to significant loss and fragmentation of mangrove habitats on the landward side [5,37]. Additionally, the rapid expansion of the alien species S. alterniflora on the mudflats of the northern Gulf of Guangxi encroached on the edges of mangroves, competing for living space and causing partial mangrove losses.
The CCDC algorithm has good results in change detection, which shows that it can provide some simple solutions for quantifying high-dynamic-change areas [11]. Using land-cover transition matrices to study the process and patterns of land-type changes is a common strategy. However, this approach only provides information about changes in land-cover types without specific details about when mangroves have changed. For example, in the Dandou Sea area, the Shankou Mangrove National Nature Reserve was established in 1990, providing a favorable protection environment for mangroves. The construction of the Shatian Port has resulted in a decrease in the area of mangroves. Through the CCDC algorithm, it was possible to quickly determine the year in which the mangrove pixels underwent changes, to obtain the required information.
The limitation of this study lies in the lack of an independent dataset for validation. The occlusion of clouds and fog, the stripe problem of Landsat 7 satellite sensors, and tidal inundation have a certain impact on long-term observation. Other scholars have similar accuracy with this study, and the Kappa coefficient is 0.70–0.78 [38,39]. However, it cannot be denied that the CCDC algorithm is fully automated and can quickly provide temporal information on mangrove changes. This study observed the changes in mangroves in the Beibu Gulf of Guangxi using the CCDC algorithm, providing a fundamental method for other researchers interested in studying mangrove changes. To improve the spatial resolution of mangroves or other land-cover observations, image fusion techniques can be used to increase the spatial resolution of Landsat series images to 10 m. For example, Sentinel-2 series images can be fused to improve resolution. Furthermore, if the striping issue of the Landsat 7 sensor can be rectified, it will further enhance the accuracy of mangroves or other land-cover change observations.

4.2. Effects of S. alterniflora Invasion on SOC and SOCS

Compared to studies by other researchers, the SOC content in S. alterniflora wetlands in this study was significantly higher than that in Yancheng City and the Yellow River Delta [40,41] but lower than that in the Minjiang River Estuary [42]. In similar invasion periods, the SOC content in the 0–20 cm soil layer was close to that in Yingpan Port, Beihai City, while the content in the two soil layers of 20–40 cm and 40–60 cm was higher than those in Yingpan Port [43].
The invasion of S. alterniflora alters the carbon cycling processes in coastal wetland soils [6]. In this study, the SOCS in S. alterniflora-invaded areas reached 6.05 times that of the mudflat after 18–21 years, while the SOCS content in mangrove areas was 4.11 times that of the mudflat, indicating the strong carbon sequestration capacity of S. alterniflora. The total SOCS storage showed an accumulation effect with increasing invasion years, similar to results from Yingpan Port in Beihai [43] and the Yellow River Delta [41]. The results of this study indicate that the SOCS content increased with increasing invasion years, maintaining an upward trend—similar to findings from other researchers [44]. The time required for SOCS to accumulate to saturation varies in different regions. Since SOCS showed a continuous increasing trend in this study, although it reached its highest value in 18–21 years, saturation was still not achieved.
Surface soil SOC accumulation is primarily associated with the invasion duration of S. alterniflora and is susceptible to human activities, whereas deep-soil SOC is less influenced by external disturbances and can better reflect the accumulation characteristics of SOC with S. alterniflora invasion duration [45]. In this study, during the early stages of invasion, SOCS initially decreased and then increased with increasing soil depth. After 12 years of invasion, SOCS in 20–40 cm soil layer was higher than that in 0–20 cm soil layer. After 18–21 years of invasion, the SOCS in the 40–60 cm soil layer exceeded that of the surface soil. The root distribution of S.alterniflora can reach the depth of 100 cm of soil, which provides a source of SOC for deep soil. In addition, with the increase of soil depth, the oxygen content in deep soil decreased, which reduced the decomposition of SOC by aerobic microorganisms and promoted the fixation and storage of carbon.
Soil physicochemical factors can impact SOCS. Influenced by tides, the MC of coastal wetland soil is typically higher than general soil. In this study, the MC of wetland soil increased with the duration of S. alterniflora invasion. The deep-soil moisture content of invasion 18–21a increased significantly. High MC inhibits the activity of aerobic microorganisms, reducing the consumption of SOC and promoting its accumulation [46,47]. BD represents soil compaction and is also one of the parameters used in SOCS calculation. When BD is low, it indicates that the soil structure is loose with good permeability, which is conducive to the decomposition and deposition of organic matter, thereby affecting SOC content [48]. In this study, the BD of the 20–40 cm and 40–60 cm soil layers at 18–21a of invasion was low, while the moisture content was high, and the SOC content was higher compared to other invasion durations, indicating that soil physicochemical factors have an influence on SOC content.
The invasion of S. alterniflora has increased both SOC and SOCS in wetland soils. Compared with other studies, it is found that the carbon sequestration capacity of S. alterniflora is still lower than that of mature mangroves [49]. This could be attributed to the higher productivity of mature mangroves. In this study, the SOCS values of mangroves were lower than that of S. alterniflora with long invasion years, possibly because the sampling points for mangroves were chosen at the boundary between S. alterniflora and mangroves, rather than in mature mangrove areas. Therefore, efforts should be made to strengthen the protection of mangroves and enhance the control measures against S. alterniflora in the Beibu Gulf of Guangxi.

5. Conclusions

The present study employed the CCDC algorithm combined with random forest segmentation classification to track the changes in mangroves in the Beibu Gulf of Guangxi from 1990 to 2022. The results indicated that a total of 814.57 hectares of mangroves were converted to other land-cover types, primarily undergoing one to two changes, with the majority persisting until 2022. During this period, S. alterniflora in the Dandou Sea and Nanliu River regions rapidly spread to the edges of mangroves on the mudflats, encroaching on the living space of mangroves. Additionally, the unbridled expansion of aquaculture ponds, coastal urbanization and land reclamation projects, and port construction activities have had irreversible and permanent impacts on mangroves on the landward side. By using a spatial approach instead of a temporal one on the classified results, the changes of wetland SOC and SOCS in different invasion periods of S. alterniflora were studied. SOC and SOCS increased with the duration of S. alterniflora invasion and have not yet reached saturation, indicating that the invasion of S. alterniflora can enhance the carbon content of wetland soils. In our results, some soil physicochemical factors, such as BD and MC, were identified as driving factors affecting SOC and SOCS in S. alterniflora wetlands.

Author Contributions

Methodology, Z.H. and M.Z.; Investigation, M.W., Y.L. and J.Q.; Data curation, Z.H.; Writing—original draft, Z.H.; Writing—review & editing, H.Y., M.W. and M.C.; Visualization, Y.L., M.C., M.Z. and J.Q.; Supervision, H.Y. All authors have read and agreed to the published version of the manuscript.

Funding

This research was supported by the Guangxi Science and Technology Major Program (GUIKEAA23062054).

Data Availability Statement

The STDFT_Mangrove dataset can be reproduced with the following GEE script: https://code.earthengine.google.com/9e0404a09772300b212dd35302ec937b (accessed on 2 August 2023).

Acknowledgments

The authors thank the anonymous reviewers and editors for their constructive comments.

Conflicts of Interest

The authors declare no conflicts of interest.

Appendix A

Land-use classification results for each change segment in Maowei Sea, Dafeng River, and Beilun River Estuary (1990–2022) can be found in Figure A1, Figure A2 and Figure A3. The black boxes indicate that parts of the area in the figures are enlarged.
Figure A1. Land-use classification results for each change segment in Maowei Sea region (1990–2022).
Land 13 00392 g0a1
Figure A2. Land-use classification results for each change segment in Dafeng River area (1990–2022).
Land 13 00392 g0a2
Figure A3. Land-use classification results for each change segment in Beilun River Estuary (1990–2022).
Land 13 00392 g0a3
Table A1. The accuracy of CCDC segments.
YearKappaOA (%)
19950.7482.29
20000.7582.86
20050.7683.71
20090.7884.76
20150.7784.14
20220.7885.00

References

  1. Simard, M.; Fatoyinbo, L.; Smetanka, C.; Rivera-Monroy, V.H.; Castaneda-Moya, E.; Thomas, N.; Van der Stocken, T. Mangrove canopy height globally related to precipitation, temperature and cyclone frequency. Nat. Geosci. 2019, 12, 40. [Google Scholar] [CrossRef]
  2. Wang, L.; Jia, M.; Yin, D.; Tian, J. A review of remote sensing for mangrove forests: 1956-2018. Remote Sens. Environ. 2019, 231, 111223. [Google Scholar] [CrossRef]
  3. Zeng, Y.; Friess, D.A.; Sarira, T.V.; Siman, K.; Koh, L.P. Global potential and limits of mangrove blue carbon for climate change mitigation. Curr. Biol. 2021, 31, 1737. [Google Scholar] [CrossRef]
  4. Murray, N.J.; Worthington, T.A.; Bunting, P.; Duce, S.; Hagger, V.; Lovelock, C.E.; Lucas, R.; Saunders, M.I.; Sheaves, M.; Spalding, M.; et al. High-resolution mapping of losses and gains of Earth’s tidal wetlands. Science 2022, 376, 744. [Google Scholar] [CrossRef] [PubMed]
  5. Naylor, R.L.; Hardy, R.W.; Buschmann, A.H.; Bush, S.R.; Cao, L.; Klinger, D.H.; Little, D.C.; Lubchenco, J.; Shumway, S.E.; Troell, M. A 20-year retrospective review of global aquaculture. Nature 2021, 591, 551. [Google Scholar] [CrossRef]
  6. Yang, R. Mechanisms of soil organic carbon storage response to Spartina altemiflora invasion and climate change. Sci. Total Environ. 2019, 690, 7–15. [Google Scholar] [CrossRef]
  7. Wulder, M.A.; Roy, D.P.; Radeloff, V.C.; Loveland, T.R.; Anderson, M.C.; Johnson, D.M.; Healey, S.; Zhu, Z.; Scambos, T.A.; Pahlevan, N.; et al. Fifty years of Landsat science and impacts. Remote Sens. Environ. 2022, 280, 113195. [Google Scholar] [CrossRef]
  8. Zhu, Z.; Woodcock, C.E. Continuous change detection and classification of land cover using all available Landsat data. Remote Sens. Environ. 2014, 144, 152–171. [Google Scholar] [CrossRef]
  9. Pasquarella, V.J.; Arévalo, P.; Bratley, K.H.; Bullock, E.L.; Gorelick, L.; Yang, Z.; Kennedy, R.E. Demystifying LandTrendr and CCDC temporal segmentation. Int. J. Appl. Earth Obs. Geoinf. 2022, 110, 102806. [Google Scholar] [CrossRef]
  10. Zhu, Z.; Gallant, A.L.; Woodcock, C.E.; Pengra, B.; Olofsson, P.; Loveland, T.R.; Jin, S.; Dahal, D.; Yang, L.; Auch, R.F. Optimizing selection of training and auxiliary data for operational land cover classification for the LCMAP initiative. ISPRS J. Photogramm. Remote Sens. 2016, 122, 206–221. [Google Scholar] [CrossRef]
  11. Awty-Carroll, K.; Bunting, P.; Hardy, A.; Bell, G. Using Continuous Change Detection and Classification of Landsat Data to Investigate Long-Term Mangrove Dynamics in the Sundarbans Region. Remote Sens. 2019, 11, 2833. [Google Scholar] [CrossRef]
  12. He, T.; Fu, Y.; Ding, H.; Zheng, W.; Huang, X.; Li, R.; Wu, S. Evaluation of Mangrove Wetlands Protection Patterns in the Guangdong–Hong Kong–Macao Greater Bay Area Using Time-Series Landsat Imageries. Remote Sens. 2022, 14, 6026. [Google Scholar] [CrossRef]
  13. Velastegui-Montoya, A.; Montalván-Burbano, N.; Carrión-Mero, P.; Rivera-Torres, H.; Sadeck, L.; Adami, M. Google Earth Engine: A Global Analysis and Future Trends. Remote Sens. 2023, 15, 3675. [Google Scholar] [CrossRef]
  14. Gorelick, N.; Hancher, M.; Dixon, M.; Ilyushchenko, S.; Thau, D.; Moore, R. Google Earth Engine: Planetary-scale geospatial analysis for everyone. Remote Sens. Environ. 2017, 202, 18–27. [Google Scholar] [CrossRef]
  15. Liu, W.; Chen, X.; Strong, D.R.; Pennings, S.C.; Kirwan, M.L.; Chen, X.; Zhang, Y. Climate and geographic adaptation drive latitudinal clines in biomass of a widespread saltmarsh plant in its native and introduced ranges. Limnol. Oceanogr. 2020, 65, 1399–1409. [Google Scholar] [CrossRef]
  16. Li, B.; Liao, C.; Zhang, X.; Chen, H.; Wang, Q.; Chen, Z.; Gan, X.; Wu, J.; Zhao, B.; Ma, Z.; et al. Spartina alterniflora invasions in the Yangtze River estuary, China: An overview of current status and ecosystem effects. Ecol. Eng. 2009, 35, 511–520. [Google Scholar] [CrossRef]
  17. Wan, H.; Wang, Q.; Jiang, D.; Fu, J.; Yang, Y.; Liu, X.; Tóthmérész, B. Monitoring the Invasion of Spartina alterniflora Using Very High Resolution Unmanned Aerial Vehicle Imagery in Beihai, Guangxi (China). Sci. World J. 2014, 2014, 638296. [Google Scholar] [CrossRef] [PubMed]
  18. Huang, R.; He, J.; Wang, N.; Christakos, G.; Gu, J.; Song, L.; Luo, J.; Agusti, S.; Duarte, C.M.; Wu, J. Carbon sequestration potential of transplanted mangroves and exotic saltmarsh plants in the sediments of subtropical wetlands. Sci. Total Environ. 2023, 904, 166185. [Google Scholar] [CrossRef] [PubMed]
  19. Negrin, V.L.; Spetter, C.V.; Asteasuain, R.O.; Perillo, G.; Marcovecchio, J.E. Influence of flooding and vegetation on carbon, nitrogen, and phosphorus dynamics in the pore water of a Spartina alterniflora salt marsh. J. Environ. Sci. 2011, 23, 212–221. [Google Scholar] [CrossRef] [PubMed]
  20. Snedden, G.A.; Cretini, K.; Patton, B. Inundation and salinity impacts to above- and belowground productivity in Spartina patens and Spartina alterniflora in the Mississippi River deltaic plain: Implications for using river diversions as restoration tools. Ecol. Eng. 2015, 81, 133–139. [Google Scholar] [CrossRef]
  21. Yang, R.; Guo, W. Exotic Spartina alterniflora Enhances the Soil Functions of a Coastal Ecosystem. Soil Sci. Soc. Am. J. 2018, 82, 901–909. [Google Scholar] [CrossRef]
  22. Roy, D.P.; Kovalskyy, V.; Zhang, H.K.; Vermote, E.F.; Yan, L.; Kumar, S.S.; Egorov, A. Characterization of Landsat-7 to Landsat-8 reflective wavelength and normalized difference vegetation index continuity. Remote Sens. Environ. 2016, 185, 57–70. [Google Scholar] [CrossRef] [PubMed]
  23. Wen, K.; Yao, H.; Wang, M.; Huang, Y.; Huangzeng, S.; Liao, P.; Chen, H.; Liu, Y. Monitoring China’s Mangrove Forest Change from 1990 to 2020: A New Algorithm Based on Spatio-temporal Detection Frequency Threshold. In 2023 the 7th International Conference on Energy and Environmental Science, Proceedings of International Conference on Energy and Environmental Science, Changsha, China, 6–8 January 2023; Springer: Cham, Switzerland, 2023; pp. 91–107. [Google Scholar]
  24. Zhu, Z. Change detection using landsat time series: A review of frequencies, preprocessing, algorithms, and applications. ISPRS J. Photogramm. Remote Sens. 2017, 130, 370–384. [Google Scholar] [CrossRef]
  25. Tucker, C.J. Red and photographic infrared linear combinations for monitoring vegetation. Remote Sens. Environ. 1979, 8, 127–150. [Google Scholar] [CrossRef]
  26. Zhang, X.; Xiao, X.; Qiu, S.; Xu, X.; Wang, X.; Chang, Q.; Wu, J.; Li, B. Quantifying latitudinal variation in land surface phenology of Spartina alterniflora saltmarshes across coastal wetlands in China by Landsat 7/8 and Sentinel-2 images. Remote Sens. Environ. 2022, 269, 112810. [Google Scholar] [CrossRef]
  27. Sun, C.; Li, J.; Liu, Y.; Liu, Y.; Liu, R. Plant species classification in salt marshes using phenological parameters derived from Sentinel-2 pixel-differential time-series. Remote Sens. Environ. 2021, 256, 112320. [Google Scholar] [CrossRef]
  28. Baloloy, A.B.; Blanco, A.C.; Ana, R.R.C.S.; Nadaoka, K. Development and application of a new mangrove vegetation index (MVI) for rapid and accurate mangrove mapping. ISPRS J. Photogramm. Remote Sens. 2020, 166, 95–117. [Google Scholar] [CrossRef]
  29. Breiman, L. Random forests. Mach. Learn. 2001, 45, 5–32. [Google Scholar] [CrossRef]
  30. Zhao, Y.; Zhu, W.; Wei, P.; Fang, P.; Zhang, X.; Yan, N.; Liu, W.; Zhao, H.; Wu, Q. Classification of Zambian grasslands using random forest feature importance selection during the optimal phenological period. Ecol. Indic. 2022, 135, 108529. [Google Scholar] [CrossRef]
  31. Yang, J.W.; Jiang, L.M.; Lemmetyinen, J.; Pan, J.M.; Luojus, K.; Takala, M. Improving snow depth estimation by coupling HUT-optimized effective snow grain size parameters with the random forest approach. Remote Sens. Environ. 2021, 264, 112630. [Google Scholar] [CrossRef]
  32. Ministry of Agriculture and Rural Affairs of the People’s Republic of China. Soil Testing Part 6: Method for determination of soil organic matter. Available online: https://www.cnemc.cn/jcgf/trhj/201711/t20171107_647331.shtml (accessed on 20 July 2023).
  33. Fan, H.; Mo, Z. The History, Achievements and Lessons Learnt for Mangrove Restoration in Guangxi, China. Guangxi Sci. 2018, 25, 363–371. [Google Scholar] [CrossRef]
  34. Shen, H.; Zhao, B.; Chen, M.; Huang, R.; Yu, K.; Liang, W. Changes of the area of Spartina alterniflora and mangroves in Guangxi Shankou Mangrove National Nature Reserve from 1995 to 2019. Chin. J. Appl. Ecol. 2022, 33, 397–404. [Google Scholar] [CrossRef]
  35. Li, L.; Liu, W. Dynamic changes of mangrove wetland landscape pattern in Lianzhou gulf of Guangxi and its causes. J. For. Environ. 2018, 38, 171–177. [Google Scholar] [CrossRef]
  36. Jia, M.; Wang, Z.; Mao, D.; Huang, C.; Lu, C. Spatial-temporal changes of China’s mangrove forests over the past 50 years: An analysis towards the Sustainable Development Goal (SDGs). Chin. Sci. Bull. 2021, 66, 3886–3901. [Google Scholar] [CrossRef]
  37. Ren, C.; Wang, Z.; Zhang, Y.; Zhang, B.; Chen, L.; Xi, Y.; Xiao, X.; Doughty, R.B.; Liu, M.; Jia, M.; et al. Rapid expansion of coastal aquaculture ponds in China from Landsat observations during 1984-2016. Int. J. Appl. Earth Obs. Geoinf. 2019, 82, 101912. [Google Scholar] [CrossRef]
  38. Ding, N.; Li, M. Mapping Forest Abrupt Disturbance Events in Southeastern China—Comparisons and Tradeoffs of Landsat Time Series Analysis Algorithms. Remote Sens. 2023, 15, 5408. [Google Scholar] [CrossRef]
  39. Xu, S.; Xiao, W.; Yu, C.; Chen, H.; Tan, Y. Mapping Cropland Abandonment in Mountainous Areas in China Using the Google Earth Engine Platform. Remote Sens. 2023, 15, 1145. [Google Scholar] [CrossRef]
  40. Sheng, Y.; Luan, Z.; Yan, D.; Li, J.; Xie, S.; Liu, Y.; Chen, L.; Li, M.; Wu, C. Effects of Spartina alterniflora Invasion on Soil Carbon, Nitrogen and Phosphorus in Yancheng Coastal Wetlands. Land 2022, 11, 2218. [Google Scholar] [CrossRef]
  41. Zhang, X.; Zhang, Z.; Li, Z.; Li, M.; Wu, H.; Jiang, M. Impacts of Spartina alterniflora invasion on soil carbon contents and stability in the Yellow River Delta, China. Sci. Total Environ. 2021, 775, 145188. [Google Scholar] [CrossRef]
  42. Jin, B.; Gao, D.; Yang, P.; Wang, W.; Zeng, C. Change of Soil Organic Carbon with Different Years of Spartina alterniflora Invasion in Wetlands of Minjiang River Estuary. J. Nat. Resour. 2016, 31, 608–619. [Google Scholar] [CrossRef]
  43. Huang, X.; Duan, Y.; Tao, Y.; Wang, X.; Long, H.; Luo, C.; Lai, Y. Effects of Spartina alterniflora Invasion on Soil Organic Carbon Storage in the Beihai Coastal Wetlands of China. Front. Mar. Sci. 2022, 9, 890811. [Google Scholar] [CrossRef]
  44. Zhang, G.; Bai, J.; Zhao, Q.; Jia, J.; Wang, X.; Wang, W.; Wang, X. Soil carbon storage and carbon sources under different Spartina alterniflora invasion periods in a salt marsh ecosystem. Catena 2021, 196, 104831. [Google Scholar] [CrossRef]
  45. Liu, J.; Han, M.; Su, H.; Wu, Y.; Zhang, M.; Richardson, C.J.; Wang, G. Effects of exotic Spartina alterniflora on vertical soil organic carbon distribution and storage amount in coastal salt marshes in Jiangsu, China. Ecol. Eng. 2017, 106, 132–139. [Google Scholar] [CrossRef]
  46. Zhao, Q.; Bai, J.; Zhang, G.; Jia, J.; Wang, W.; Wang, X. Effects of water and salinity regulation measures on soil carbon sequestration in coastal wetlands of the Yellow River Delta. Geoderma 2018, 319, 219–229. [Google Scholar] [CrossRef]
  47. Ren, Q.; Yuan, J.; Wang, J.; Liu, X.; Ma, S.; Zhou, L.; Miao, L.; Zhang, J. Water Level Has Higher Influence on Soil Organic Carbon and Microbial Community in Poyang Lake Wetland Than Vegetation Type. Microorganisms 2022, 10, 131. [Google Scholar] [CrossRef]
  48. Ming, J.; Zhao, Y.E.; Sun, Y.Y.; Liu, Z. Biocrusts impact soil properties and ecological stoichiometry characteristics in frozen ground regions on the Qinghai-Tibet Plateau. Soil Ecol. Lett. 2024, 6, 230212. [Google Scholar] [CrossRef]
  49. Xu, X.; Wei, S.; Chen, H.; Li, B.; Nie, M. Effects of Spartina invasion on the soil organic carbon content in salt marsh and mangrove ecosystems in China. J. Appl. Ecol. 2022, 59, 1937–1946. [Google Scholar] [CrossRef]
Figure 1. The growth range of mangrove forest in the Beibu Gulf of Guangxi from 1990 to 2022 (a) Beilun River Estuary; (b) Maowei Sea; (c) Dafeng River and Nanliu River; (d) Dandou Sea; (eg) mangrove field photos.
Land 13 00392 g001
Figure 2. Locations of sampling areas (a) in the Mangrove wetlands and Mudflat; (b) in the S. alterniflora wetlands (SA means S. alterniflora, the number behind SA means the invasion ages).
Land 13 00392 g002
Figure 3. Land-use classification results for each change segment in the Dandou Sea area (1990–2022) and images of the changes in Shatian Port construction, (a) Landsat image of Shatian Port in 1990; (b) Landsat image of Shatian Port in 2010; (c) Landsat image of Shatian Port in 2013; (d) Google Earth image of Shatian Port in 2022.
Land 13 00392 g003
Figure 4. Land-use classification results for each change segment in the Nanliu River area (1990–2022).
Land 13 00392 g004
Figure 5. (a) The area of mangrove forest at different start time of change; (b) the area of different change duration of mangroves.
Land 13 00392 g005
Figure 6. The distribution characteristics of soil organic carbon content from S. alterniflora with different invasion years, mangrove and mudflat.
Land 13 00392 g006
Figure 7. The distribution characteristics of soil organic carbon storage from S. alterniflora with different invasion years, mangrove and mudflat.
Land 13 00392 g007
Table 1. Confusion matrix for CCDC algorithm classification results.
TypeMangroveS. alternifloraPondOther Land-Cover Types
Mangrove284385
S. alterniflora147952
Pond2351648
Other land-cover types1231768
Table 2. The statistics of different segments’ classification.
Segment 2Segment 3Segment 4Segment 5Segment 6
Mangrove (ha)2944.44752.85105.9115.623.79
S. alterniflora (ha)133.4321.572.220.43/
Pond (ha)940.75221.0543.2410.712.92
Other land-cover types (ha)514.57222.3562.2514.445.96
Table 3. Statistical results (mean ± standard deviation) of soil physical and chemical properties of S. alterniflora with different invasion ages and soil depths.
TypeInvasive
Ages (a)
Sediment
Depth (cm)
BD
(g/cm3)
MC
(%)
pHEC
(μs/cm)
EOC
(g/kg)
POC
(g/kg)
DOC
(g/kg)
S. alterniflora3a0–20 cm1.45 ± 0.1632.92 ± 10.887.06 ± 0.422.96 ± 0.710.57 ± 0.833.98 ± 1.470.2 ± 0.17
20–40 cm1.48 ± 0.1129.86 ± 10.276.95 ± 1.22.72 ± 0.490.52 ± 0.22.51 ± 0.650.1 ± 0.06
40–60 cm1.4 ± 0.0438.16 ± 5.035.99 ± 0.112.09 ± 0.080.63 ± 0.073.18 ± 0.340.19 ± 0.04
6a0–20 cm1.16 ± 0.1947.01 ± 17.715 ± 2.063.34 ± 0.161.04 ± 1.383.15 ± 2.490.19 ± 0.22
20–40 cm1.46 ± 0.2332.23 ± 5.354.23 ± 0.183.25 ± 0.121.17 ± 0.445.18 ± 0.350.11 ± 0.03
40–60 cm1.5 ± 0.1828.67 ± 0.444.11 ± 0.163.29 ± 0.471.59 ± 1.265.32 ± 0.010.1 ± 0
8a0–20 cm1.34 ± 0.1425.68 ± 3.066.69 ± 0.333.05 ± 0.561.98 ± 1.247.77 ± 1.40.13 ± 0.02
20–40 cm1.43 ± 0.2222.47 ± 0.646.91 ± 0.083.12 ± 0.151.36 ± 0.646.97 ± 0.90.11 ± 0.01
40–60 cm1.12 ± 0.137.67 ± 0.267.01 ± 0.083.42 ± 0.451.09 ± 0.359.36 ± 0.260.14 ± 0.04
12a0–20 cm1.29 ± 0.0337.22 ± 2.635.66 ± 0.252.94 ± 0.221.55 ± 1.089.69 ± 0.080.23 ± 0.21
20–40 cm1.27 ± 0.137.74 ± 15.034.31 ± 0.763.49 ± 0.033.3 ± 0.0510.06 ± 1.540.29 ± 0.29
40–60 cm1.33 ± 0.1436.23 ± 12.885.04 ± 0.354.47 ± 0.912.36 ± 0.3210.23 ± 3.680.18 ± 0.12
18–21a0–20 cm1.22 ± 0.0148.5 ± 4.466.5 ± 0.223.47 ± 0.51.61 ± 0.7410.27 ± 0.940.28 ± 0.02
20–40 cm1.05 ± 0.2171.38 ± 5.026.31 ± 0.213.73 ± 0.372.89 ± 0.6311.46 ± 3.520.1 ± 0.01
40–60 cm1.08 ± 0.2272.22 ± 3.675.58 ± 1.113.97 ± 0.212.82 ± 0.9712.04 ± 1.130.36 ± 0.14
Mangrove/0–20 cm1.26 ± 0.1342.16 ± 9.266.32 ± 0.553.04 ± 0.482.13 ± 17.76 ± 1.260.21 ± 0.21
20–40 cm1.31 ± 0.237.19 ± 12.25.33 ± 2.12.61 ± 1.11.48 ± 0.895.26 ± 2.410.41 ± 0.72
40–60 cm1.16 ± 0.1848.04 ± 2.576.27 ± 0.192.58 ± 0.041.6 ± 0.093.71 ± 1.060.07 ± 0.03
Mudflat/0–20 cm1.49 ± 0.1126.97 ± 8.586.55 ± 0.622.99 ± 0.830.33 ± 0.341.92 ± 0.660.08 ± 0.02
20–40 cm1.56 ± 0.1626.71 ± 4.317.01 ± 0.793.26 ± 0.421.08 ± 0.623.39 ± 2.450.16 ± 0.09
40–60 cm1.35 ± 0.0231.63 ± 0.636.61 ± 0.213.33 ± 0.410.14 ± 0.081.14 ± 0.450.04 ± 0.03
Table 4. The correlation matrix between SOC, SOCS and soil physical and chemical properties of S. alterniflora.
BDMCpHECSOCSOCSEOCPOCDOC
BD1
MC−0.834 **1
pH0.043−0.1171
EC−0.3340.353−0.2541
SOC−0.684 **0.601 **−0.2950.608 **1
SOCS−0.499 *0.408−0.3280.557 **0.963 **1
EOC−0.552 **0.558 **−0.4120.539*0.883 **0.868 **1
POC−0.609 **0.546 *−0.1870.609 **0.975 **0.962 **0.837 **1
DOC−0.3040.357−0.2780.0900.470*0.460 *0.434*0.459 *1
** p < 0.01; * p < 0.05
Disclaimer/Publisher’s Note: The statements, opinions and data contained in all publications are solely those of the individual author(s) and contributor(s) and not of MDPI and/or the editor(s). MDPI and/or the editor(s) disclaim responsibility for any injury to people or property resulting from any ideas, methods, instructions or products referred to in the content.

