Article

Characteristics Analysis and Prediction of Land Use Evolution in the Source Region of the Yangtze River and Yellow River Based on Improved FLUS Model

1
State Key Laboratory of Simulation and Regulation of Water Cycle in River Basin, China Institute of Water Resources and Hydropower Research, Beijing 100038, China
2
Hebei Province Key Laboratory of Wisdom Water Conservancy, Hebei University of Engineering, Handan 056038, China
3
State Key Laboratory of Hydrology and Water Resources and Hydraulic Engineering, Hohai University, Nanjing 210098, China
*
Author to whom correspondence should be addressed.
Land 2024, 13(3), 393; https://doi.org/10.3390/land13030393
Submission received: 2 February 2024 / Revised: 11 March 2024 / Accepted: 17 March 2024 / Published: 20 March 2024

Abstract

:
Climate change profoundly alters land use in alpine regions, and delving into the evolutionary characteristics of these changes is crucial for the sustainable development of regional land resources and the gradual enhancement of the ecological environment. Taking the source region of the Yangtze and Yellow River (SRYAYE) as a case study, we integrate permafrost and snowfall data into the Future Land Use Simulation model (FLUS). Analyzing historical land use, we predict and simulate the land use scenarios for 2030, 2035, and 2060 under SSP1-2.6, SSP2-4.5, SSP3-7.0, and SSP5-8.5 climates, and conduct a detailed analysis of the scale, composition, and pattern of land use in this area. Scale. The results showed that ① the Kappa coefficient of the improved FLUS model was higher than 0.927, and that the overall accuracy of the simulation was increased by 2.64%; ② the area of forest land and the high-coverage grassland will increase in the future and the center of gravity will migrate to the west, and that the area of moderate and low-coverage grassland will slightly decrease but tend to become green to the west; and ③ the fragmentation degree of the SRYAYE is decreasing, and the influence of human activities on the landscape pattern is weaker than in the past.

1. Introduction

Land resources serve as a crucial material foundation for human survival and societal development [1,2,3]. Global land use has witnessed substantial transformations attributable to the interplay of climate change and anthropogenic activities [4,5]. The Source Region of the Yangtze and Yellow Rivers (SRYAYE) lies on the eastern periphery of the Qinghai–Tibet Plateau (QTP), constituting a paradigmatic climate-sensitive and ecologically delicate region in China [6]. In the last 60 years, the annual average temperature and annual precipitation in this area have increased at the rate of 0.036 °C/a and 0.677 mm/a, respectively. Concurrently, the area has undergone significant alterations, such as pasture degradation and recovery [7], permafrost thawing [8], glacier retreat [9], and lake area expansion and contraction [10]; these have led to dynamic land use processes, such as grassland degradation to increased coverage, the conversion of unutilized land to grassland and water bodies, and an increase in glacier-reduced waters [11]. The unequivocal manifestation of climate change, characterized by rapid warming and heightened precipitation, is incontestable. Climatic warming is anticipated to elevate internal glacier and permafrost temperatures [12], instigating glacier melt and permafrost retreat, and induce soil surface desiccation that may impede vegetation growth, leading to grassland degradation dominated by shallow-rooted species [13]. Concurrently, rising temperatures will spur the expansion of vegetation to high-altitude zones, augmenting the Normalized Difference Vegetation Index (NDVI) and prompting the migration of vegetation to elevated and polar latitudes [14]. Augmented precipitation directly benefits grass growth [15], subsequently enhancing the Net Primary Productivity (NPP) and improving the overall quality of vegetation growth [16]. Consequently, the SRYAYE is poised to undergo a transformative change in land use wherein the extent of permanent glacier snowpack will diminish gradually, the area of water will expands continually, and both the quantity and quality of vegetation will augment.
The simulation model of land use change is an effective tool to predict the future land use situation in the region [17]. Currently, widely utilized models include the Markov Model [18], Cellular Automata Model (CA) [19], Conversion of Land Use and its Effects at Small Regional Extent Model (CLUE-S) [20], the Agent-Based Model (ABM) [21], the Future Land Use Simulation Model (FLUS) [22], and their coupled variants [23,24,25]. The FLUS model stands out for its computational efficiency and extensive simulation capabilities, making it a popular choice for land use simulation [26,27]. Previous studies have predominantly focused on the urban areas impacted by human activities [28,29]. The model optimization strategies used have encompassed considerations like integrating Point of Interest (POI) data [30], incorporating spatial autocorrelation [31]. However, research on land use simulation in climate-sensitive regions has been relatively limited [32].
Building upon the aforementioned scientific assumptions and research advancements, this study delineates the following research objectives: (1) Enhancing a land use prediction model tailored to alpine plateau climate regions by integrating permafrost and snowfall data into the FLUS model, utilizing the SRYAYE as a case study. (2) Employing the refined model to simulate the spatial land use patterns under the four climate scenarios of SSP1-2.6, SSP2-4.5, SSP3-7.0, and SSP5-8.5 for the years 2030, 2035, and 2060. (3) Analyzing the simulation outcomes to discuss the future evolution of land use composition, scale, and pattern characteristics in the SRYAYE. This study’s findings not only contribute to a more informed perspective on land resource planning but also provide scientific guidance for spatial land planning and ecological environment management.

2. Materials and Methods

2.1. Study Area

The SRYAYE, delimited by coordinates 90.55° E~103.41° E and 32.16° N~36.12° N, is situated on the eastern periphery of the Qinghai–Tibet Plateau (QTP). Encompassing an area of approximately 26.44 × 10⁴ km2 and characterized by elevations ranging from 2675 m to 6575 m, the topography exhibits higher terrain in the west and lower terrain in the east, as depicted in Figure 1. The region predominantly features alpine plateaus, falling within the classification of a plateau alpine climate area. Over the temporal span of 1980–2020, the average annual precipitation recorded was 426.7 mm, while the average annual temperature stood at −2.91 °C. In 2020, grassland covered 76.3% of the total area, with unused lands, including sandy land and bare soil, constituting 15.5%. Forest land and water exhibited comparable coverage, followed by permanent glacier snow land; meanwhile, arable land and urban land comprised the two land use types with the smallest coverage in the region. The distinctive land use configuration and the fragile ecological milieu render SRYAYE the most profoundly influential ecological functional area in China.

2.2. Data Sources

The data used in this study include land use data, topographic data, meteorological data, permafrost distribution data, socio-economic data, snowline height data, and vegetation data. Information about the data and their sources are shown in Table 1.

2.3. Methods

In alignment with the research objectives outlined in this paper, a comprehensive technical approach has been delineated, as illustrated in Figure 2. Initially, historical land use data were utilized to forecast the various land use types for 2030, 2035, and 2060 by employing the Markov model. Subsequently, by employing the forecasted data as a reference, the FLUS model was applied to ascertain the spatial pattern of future land use under diverse climate scenarios (SSP1-2.6, SSP2-4.5, SSP3-7.0, SSP5-8.5) in the simulation process. Notably, given that nearly 50% of the annual precipitation in the SRYAYE manifests as snowfall, and recognizing permafrost as a distinctive soil condition in the region, both exert a discernible influence on the dynamics of land use change. Consequently, the FLUS model was improved by incorporating permafrost and snowfall data. Ultimately, the simulation results form the basis of an in-depth analysis of the scale, composition, and patterns characterizing both historical and prospective land use.

2.3.1. Prediction of Land Use Scale in Different Periods in the Future

The magnitude of land use exhibits notable variations across distinct temporal epochs, necessitating the incorporation of the projected quantitative distribution of each land use category as the target parameter in subsequent spatial evolution simulations. To facilitate this, the initial step involves prognostications regarding the scale of land use for discrete timeframes in the future. The Markov model, a tool frequently employed for predicting the likelihood of geographical events devoid of posterior characteristics, proves ubiquitous in forecasting the future distribution of land use types [37,38]. This study adopts the Markov model to anticipate the quantitative structure of land use in the years 2030, 2035, and 2060.

2.3.2. Different Simulation Scenario Settings

The latest iteration of the Coupled Model Intercomparison Project Phase 6 (CMIP6) has innovatively integrated the Shared Socioeconomic Pathways (SSPs) with the Representative Concentration Pathways (RCPs), enhancing the depth of global climate change predictions. In accordance with the established historical trajectory of land use development, and with the aim of accurately capturing the evolving interplay between land use and climate in the Source Region of the Yangtze and Yellow Rivers (SRYAYE), we initialized the analysis using the land use conditions in 2020. Subsequently, the study delineates targets for 2030, 2035, and 2060, employing the four SSP scenarios (SSP1-2.6, SSP2-4.5, SSP3-7.0, and SSP5-8.5) within the CMIP6 climate model framework. Following a downscaling process, these scenarios are integrated into the land use suitability probability calculations as driving factors for simulation in the specified future periods.

2.3.3. FLUS Model Mechanism

The FLUS model serves as a comprehensive tool designed for simulating land use changes, encompassing both human activities and natural influences, as well as forecasting future land use scenarios. This model comprises two integral modules: the ANN-based Suitability Probability Estimation (ANN) and the Self-Adaptive Inertia and Competition Mechanism (CA) [22]. The synergistic coupling of these modules imparts the FLUS model with remarkable simulation accuracy, enabling it to yield results closely mirroring real land use distributions.
The ANN calculation necessitates inputting the 2020 land use data for the SRYAYE and diverse driver data encompassing natural terrain factors (DEM, Slope, Aspect), meteorological factors (rainfall, snowfall, air temperature), permafrost distribution (seasonal frozen soil, permafrost), and socio-economic indicators (POP, GDP), totaling 10 items (Figure 3). These data are resampled to a spatial resolution of 500 m using ArcGIS and normalized to a 2320 × 920 row–column format, creating a tiff raster image file that is employed as the model input (utilizing the Krasovsky_1940_Albers projected coordinate system). This study opts for the random sampling mode, with a parameter set of 50 and 13 hidden layers in the neural network after multiple simulation adjustments.
The CA module requires the input of initial-year land use data, with the future land use types used as simulation targets. Considering the conversion cost, neighborhood conditions, and inter-type competition, the model parameters are refined through multiple experiments; the determined model specifications include 300 iterations, a neighborhood size of 3, and an acceleration factor of 0.1 for more precise calculations of the land use type conversion probabilities.
It is important to note that, to ascertain the applicability of the improved FLUS model, which integrates permafrost distribution data and precipitation variables (rainfall and snowfall) independently as driving factors, within the context of land use studies in the Source Regions of the Yangtze and Yellow Rivers (SRYAYE), we conducted simulations using the 2010 dataset for the region to validate the 2020 land use data. The observed values for the year 2020 served as the target values for the simulation. Two distinct simulation processes were implemented: firstly, snowfall data and permafrost distribution data were incorporated as the driving factors for meteorological and soil attributes, respectively, constituting an improved model; secondly, the rainfall and snowfall data were amalgamated into precipitation variables and the permafrost distribution data were excluded as a driving factor, resulting in an ordinary model. Parameters pertaining to other topographical factors, socioeconomic conditions, etc., were maintained at uniform settings throughout the simulations.

2.3.4. Gravity Center Migration

In order to elucidate the intricacies of land use pattern alterations within the Source Region of the Yangtze and Yellow Rivers (SRYAYE), we employed methodologies outlined in other scholarly works [3,39]. Specifically, we calculated the centroids of each land use type within the SRYAYE, drawing from literature-based methodologies. The migration distances of these centroids were then computed over the temporal span from 2000 to 2060. This analytical approach was designed to discern the spatial and temporal characteristics of each land use type, ascertain the extent of changes, and delineate spatial differentials. Such an investigation is crucial for a nuanced understanding of the influences exerted by climate variations and human activities on land use transformations at spatial scales.

2.3.5. Landscape Pattern

The SRYAYE resides within a quintessential ecologically fragile zone, thereby rendering the analysis of fragmentation particularly pivotal when viewed through the prism of patches. We leveraged the Fragstats 4.2.1 software platform to scrutinize the landscape pattern derived from the land use data. This analysis encompassed the patch level, patch type level, and landscape level, integrating eight core indicators: number of patches (NP), edge density (ED), largest patch index (LPI), mean patch size (AREA_MN), area-weighted mean patch fractal dimension (AR-EA_MN), landscape-level size (AREA_MN), area-weighted mean patch fractal dimension (FRAC_AM), Shannon’s Diversity Index (SHDI), Shannon’s Evenness Index (SHEI), and Contagion (CONTAG). These indicators were judiciously selected to articulate the nuances in the landscape pattern changes within the study area, providing a comprehensive perspective on ecological transformations.

3. Results

3.1. Improved Model Accuracy Validation

By calculating the Kappa coefficient of the simulation results, it was found that the coefficients before and after the improvement were 0.892 and 0.927, respectively, and that the overall accuracy was 92.01% and 94.65%, respectively. The overall accuracy improved from 92.01% to 94.65%. Notably, the simulation accuracy for forest land, grassland, and urban areas experienced significant enhancements, with the most notable increase being 7.88%. Subsequently, the improved model’s simulation results were compared with the actual spatial distribution of land use in 2020. Employing eight local zooms, the comparison revealed a pronounced congruence between the improved simulation outcomes and the real spatial pattern (Figure 4). This underscores that the improved model’s simulation results closely align with the actual scenario, thereby affirming its utility for future land use predictions.

3.2. Temporal and Spatial Evolution of Historical Land Use

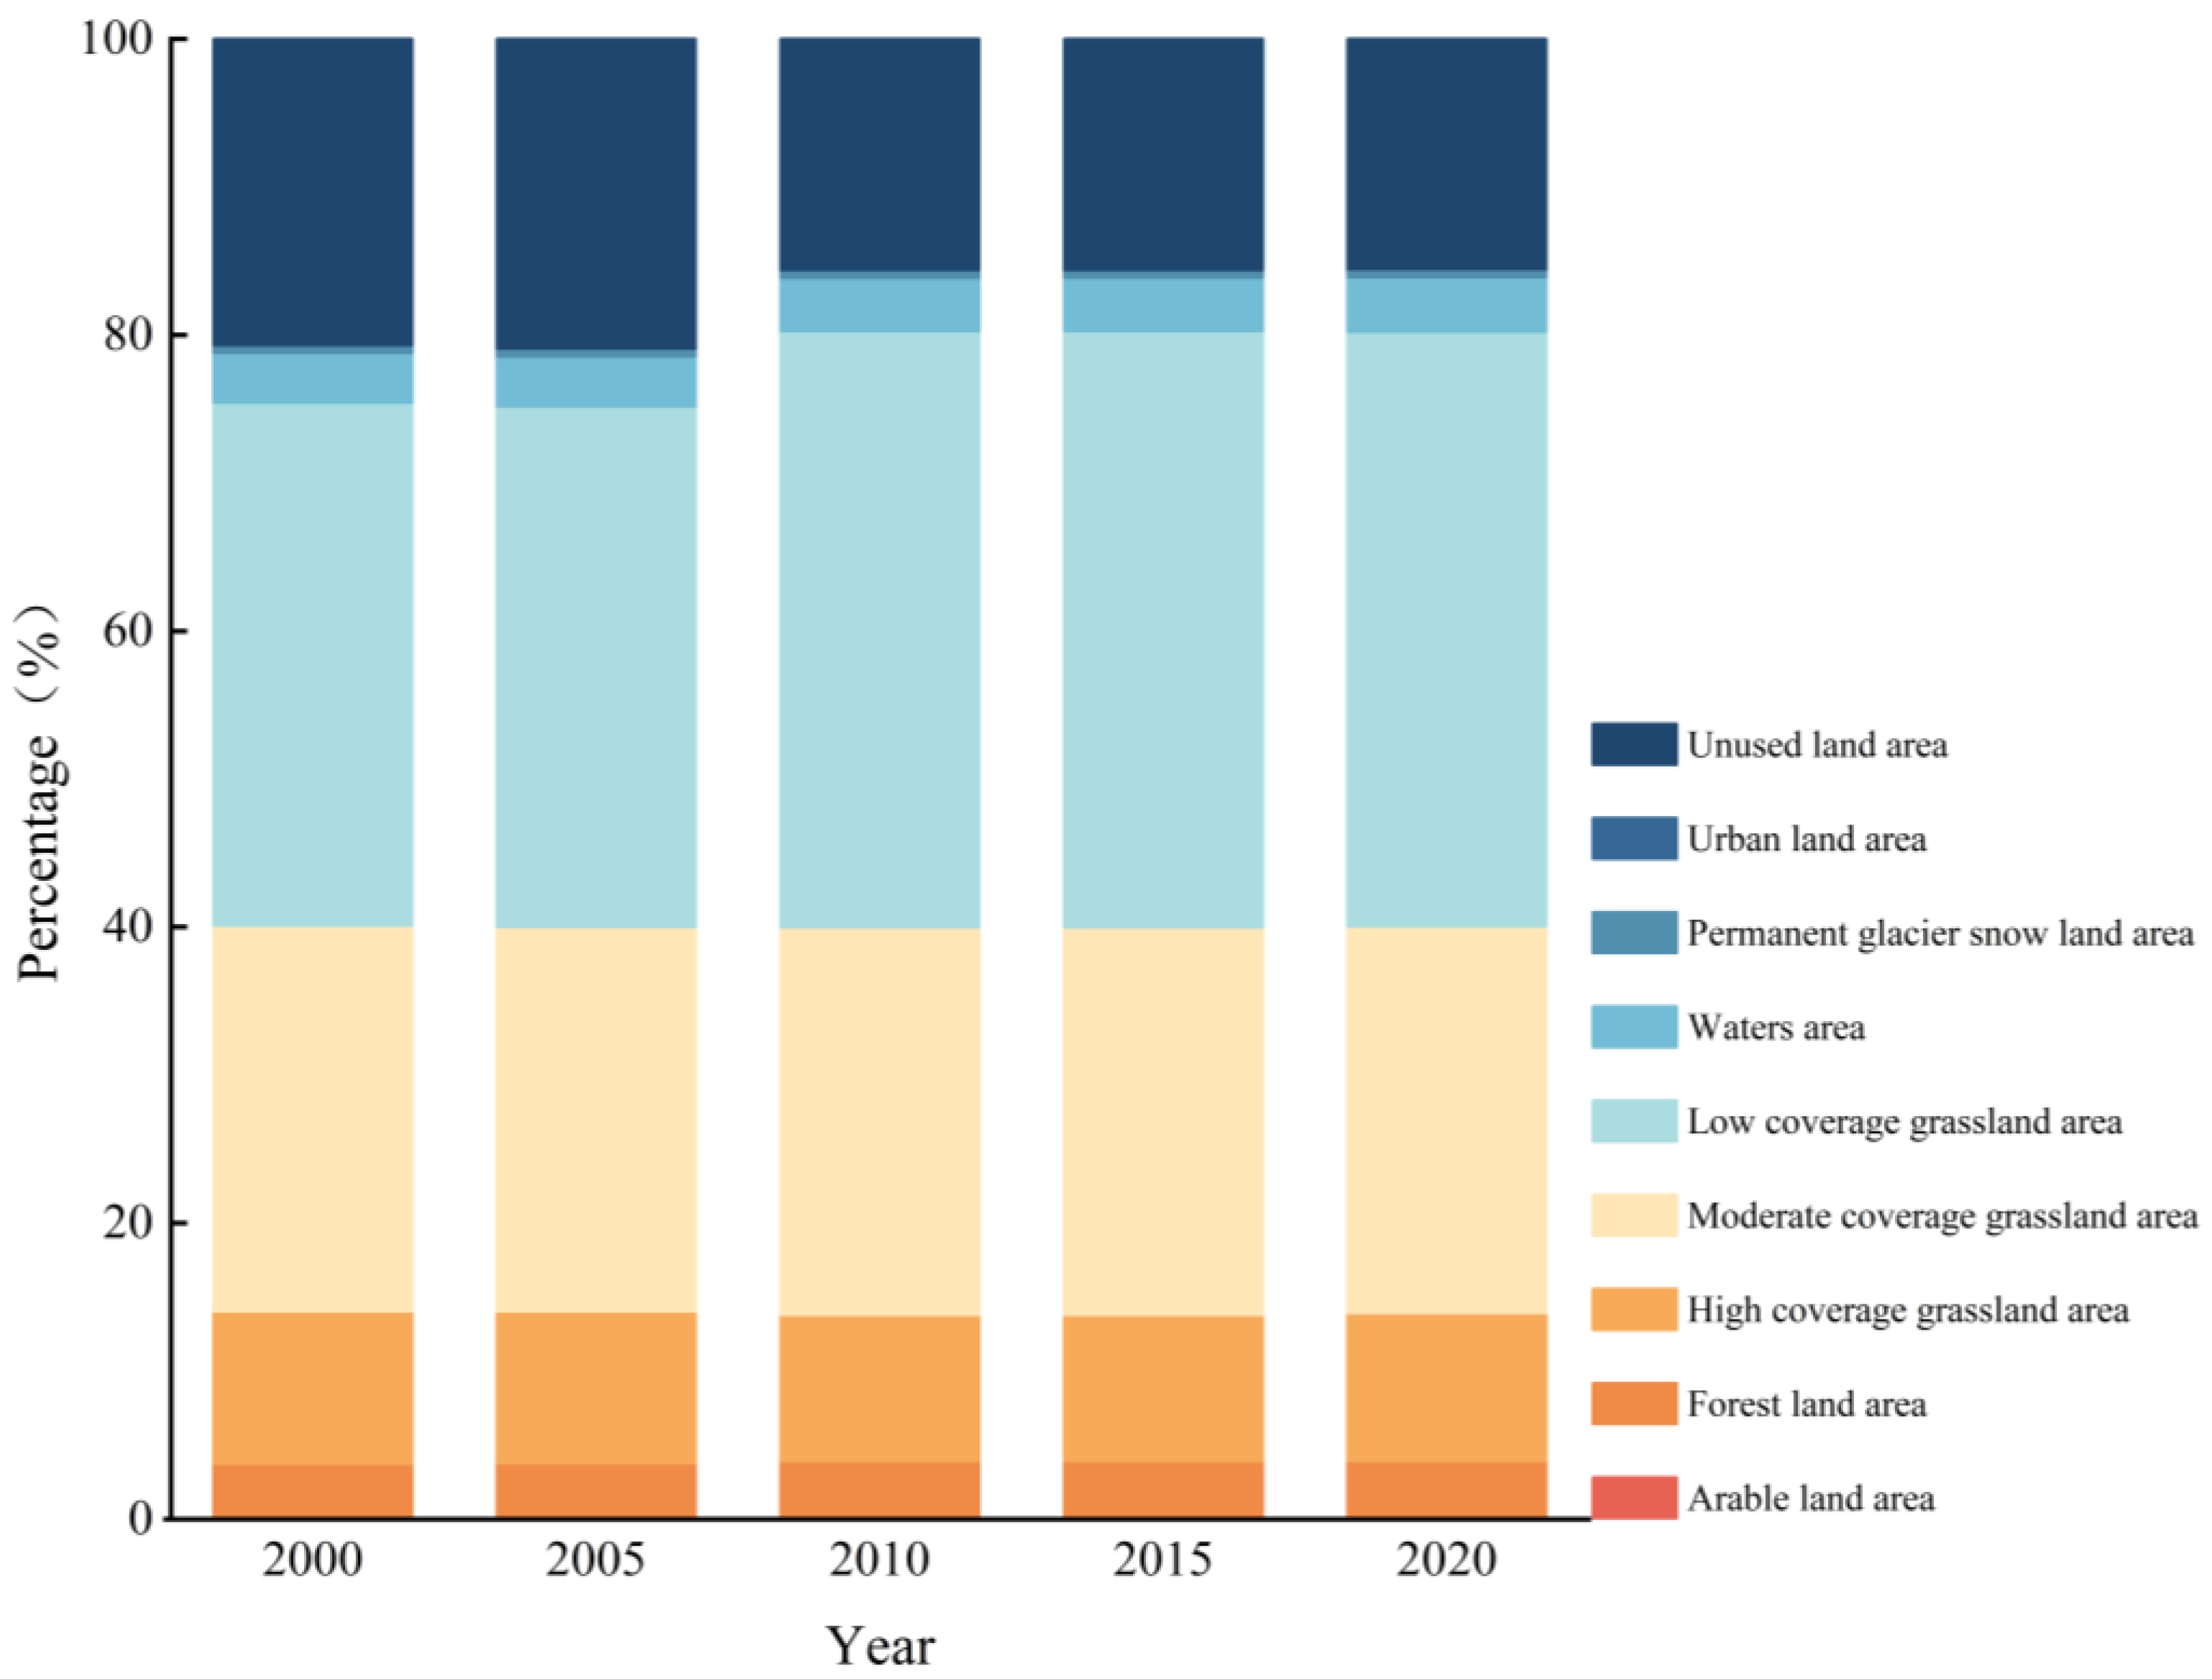
3.2.1. Historical Land Use Composition and Scale

Over the preceding two decades (2000–2020), six distinct land use categories, namely arable land, forest land, moderate-coverage grassland, low-coverage grassland, waters, and urban land, exhibited varying growth rates, while high-coverage grassland, permanent glacier snow land, and unused land experienced a diminishing trend (Figure 5). Collectively, the grassland area demonstrated an overall increasing trajectory. Significant changes in area, ranked in descending order, were observed in urban land, unused land, arable land, low-coverage grassland, and waters, with variations exceeding 5%. Specifically, urban land exhibited a steep increase from 66.91 km2 in 2000 to 169.15 km2 in 2020, marking a remarkable surge of 152.79%. Both arable land and urban land witnessed a nearly 20% increase. Low-coverage grassland displayed a growth rate of 3907.4 km2/5a, surpassing 100,000 km2 in 2010, while waters continued to expand, reaching nearly 10,000 km2 in 2020, denoting a 9% increase compared to 2000. Unused land underwent extensive development and utilization, resulting in a 24.98% reduction in its area.

3.2.2. Historical Land Use Pattern

  • Spatial pattern
Over the past two decades, there has been a significant transformation in the spatial pattern of land use in the Source Region of the Yangtze and Yellow Rivers (SRYAYE), as depicted in Figure 6. The most notable change occurred during the period from 2000 to 2010, wherein previously unused areas such as the Gobi Desert underwent development and utilization, resulting in an overall disappearance of nearly 25%. In particular, in the Gyaring Lake and Ngoring Lake area of the source region of the Yellow River (SRYE) and the eastern and northern parts of the source region of the Yangtze River (SRYA), such lands were effectively converted into moderate- and low-coverage grasslands. During this period, the area of low-coverage grassland in the SRYAYE surpassed 100,000 km2, revealing a dynamic process reflecting the expansion of vegetation coverage towards higher latitudes and elevations.
From 2010 to 2020, the overall spatial distribution exhibited minor differences. Forest land and high-coverage grassland were concentrated in the eastern part of the SRYE, with a limited portion of northern grassland transitioning from low to high coverage. Unused land were in the form of swamps in the Zoige wetland area and saline–alkali land in the northern part of the SRYA. Waters were concentrated in the two lakes and the western network water system. Moderate- and low-coverage grasslands were intricately interwoven throughout the entire study area.
2.
Gravity center migration
Alterations in the centroid of land use types serve as indicators of shifts in the spatial configuration of diverse land categories. In accordance with the methodology outlined in Section 2.3.4, we computed the historical land use centroids in the SRYAYE. The results depicted in Figure 7 reveal that from 2000 to 2020, the centroids of arable land and low-coverage grassland experienced a northeastward shift, while the centroids of forest land, waters, and urban land shifted southeastward. The centroid of high-coverage grassland shifted to the northwest, and the centroids of moderate-coverage grassland, permanent glacier snow, and unused land shifted southwestward.
3.
Landscape pattern
In the past two decades, the spatial distribution of land use in the source area of the Yangtze River and the Yellow River has gradually decreased in fragmentation (NP, ED, AREA_MN index); the interaction between different types of patches is weak, the influence of human activities on the landscape pattern has increased, the distribution of patches tends to be regular and centralized, and the overall complexity of patches continues to decline (LPI index); the spatial continuity of the landscape pattern is on the rise as a whole (CONTAG index); and the richness of landscape types has decreased, the dominance of the landscape has continued to increase, and the control function of grassland on the whole landscape has increased, indicating that grassland has experienced the process of degradation to recovery and has become the main landscape type (SHDI index, SHEI index) (Table 2).

3.3. Temporal and Spatial Evolution of the Future Land Use

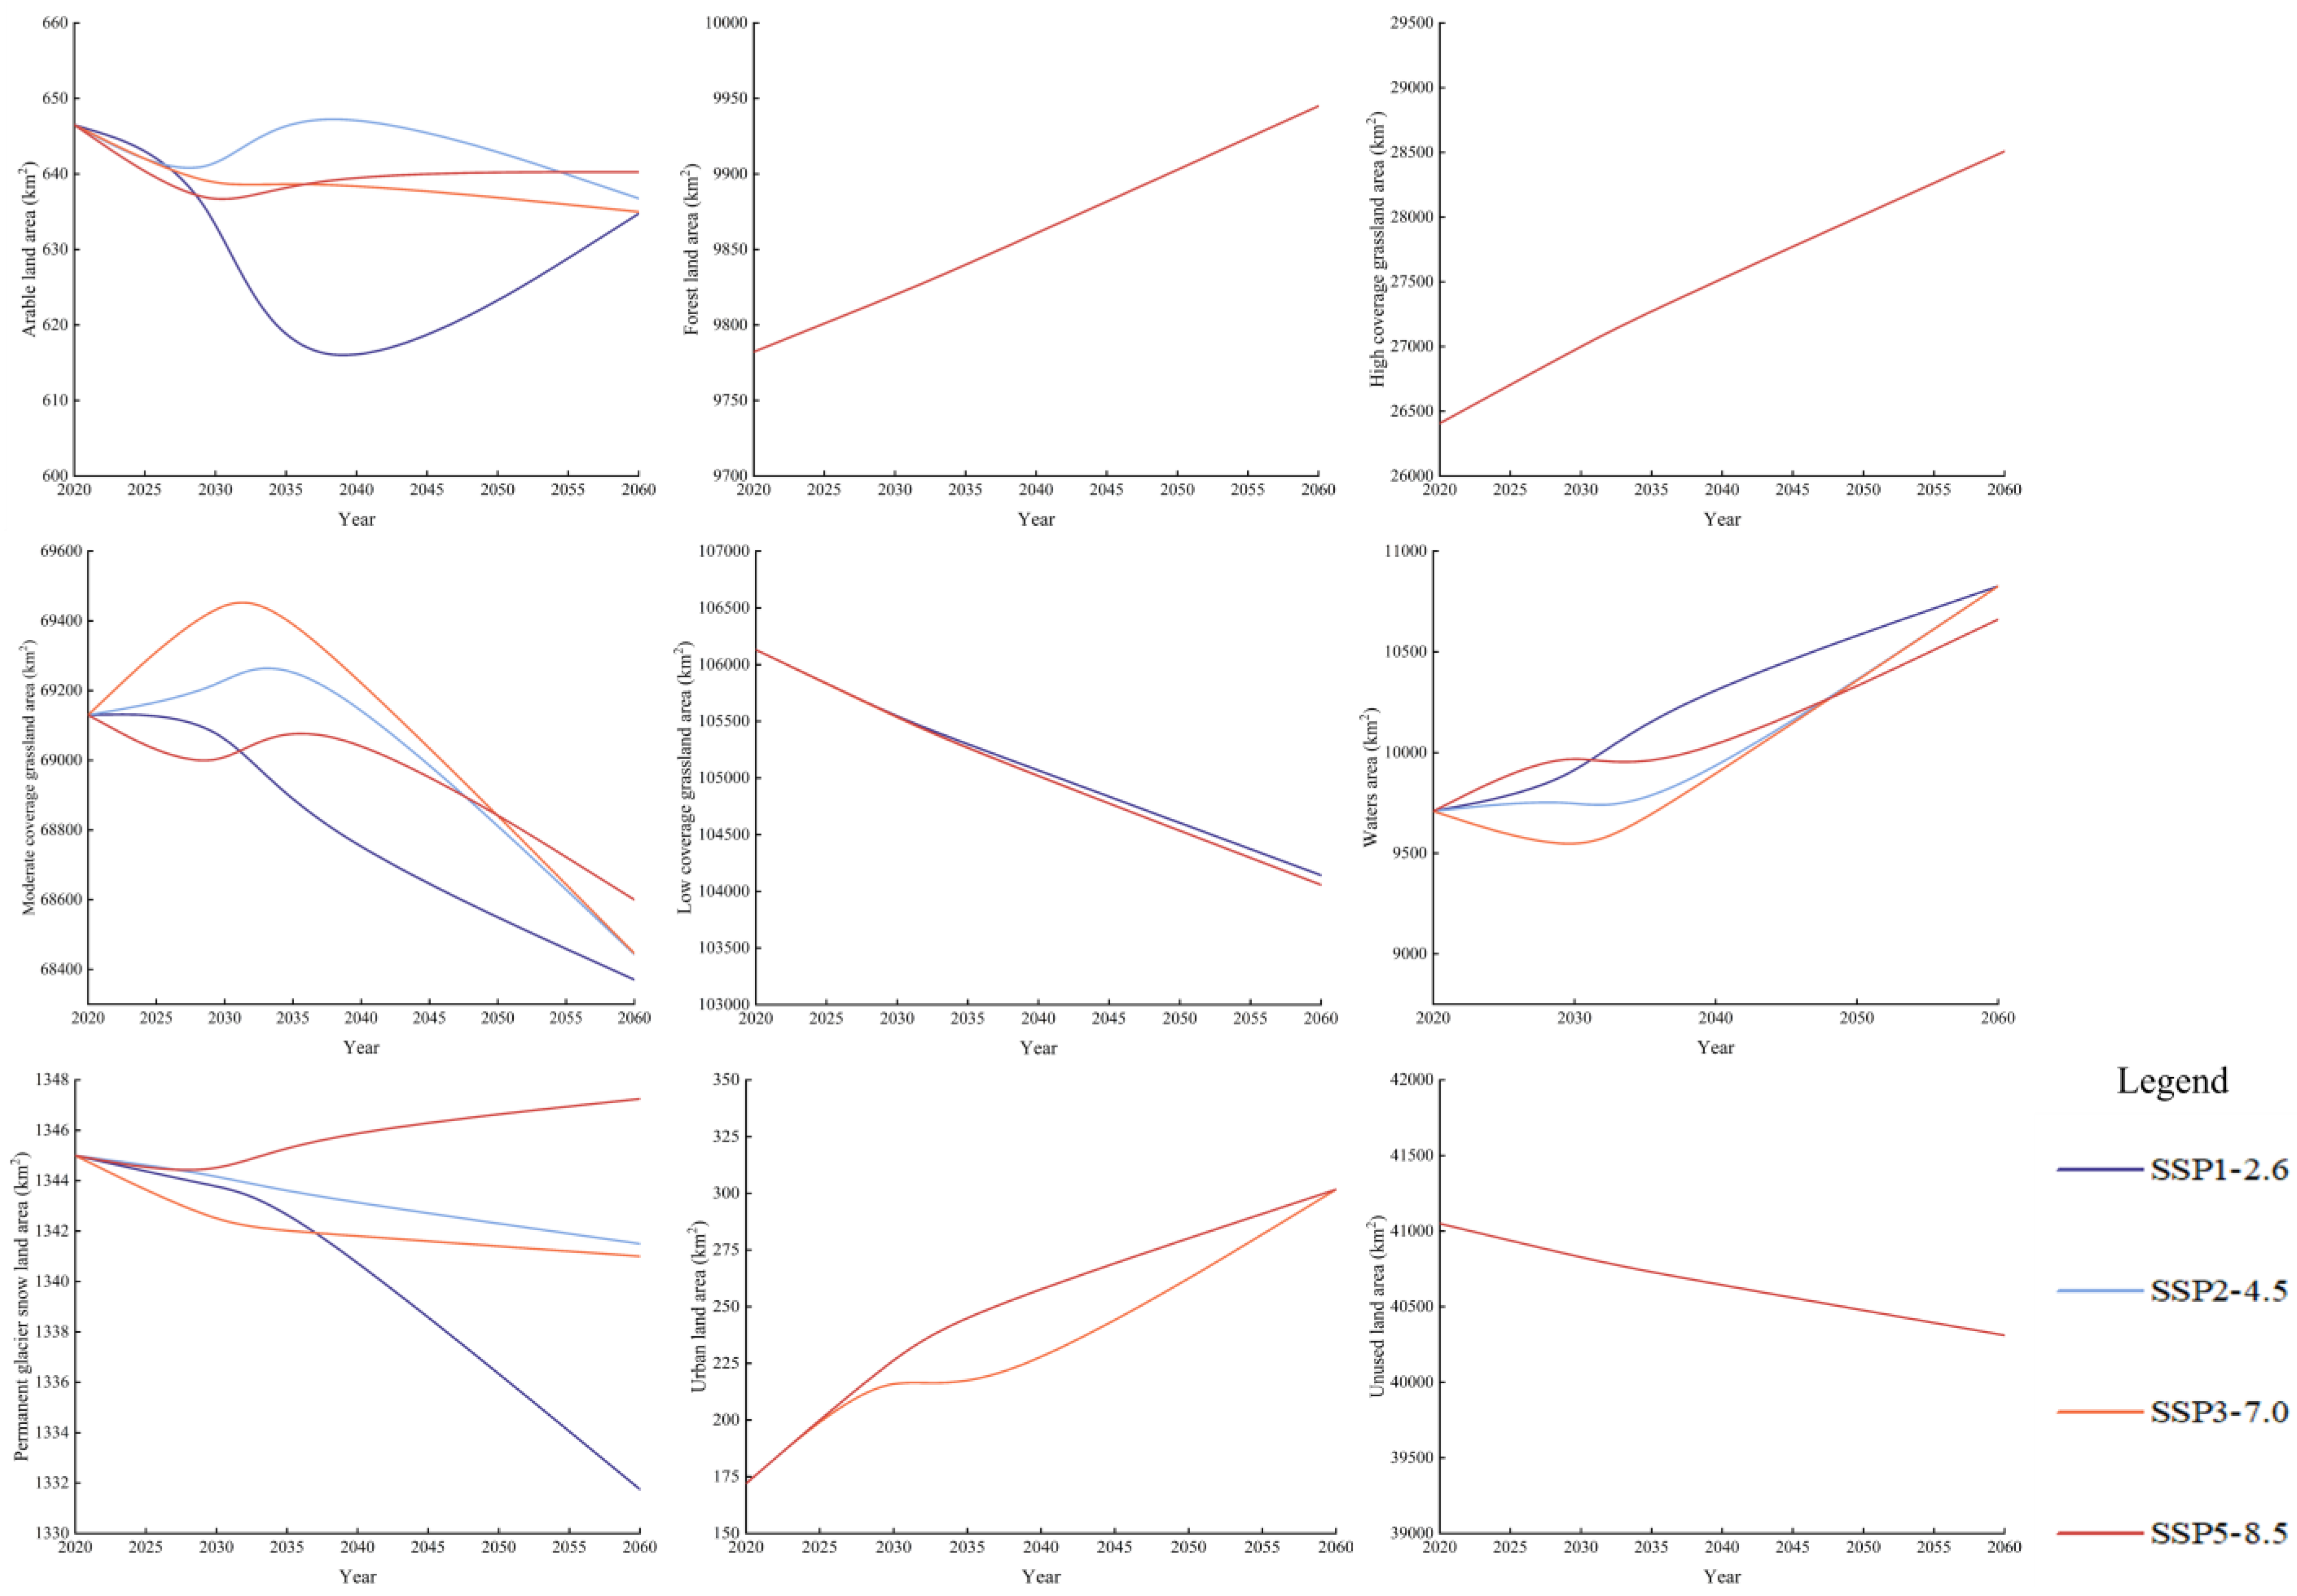
3.3.1. Future Land Use Composition and Scale

Based on the scenarios set up and methodology described in Chapter 2, the land use results under the four climate scenarios SSP1-2.6, SSP2-4.5, SSP3-7.0, and SSP5-8.5 were derived for 2030, 2035, and 2060, respectively (Figure 8).
Regarding the overall composition, the forthcoming distribution of land types within the SRYAYE shows a predominant share of grassland, encompassing more than 76% of the total area. Subsequently, unused land constitutes the second-largest category, covering approximately 15% of the total area. Forest land and waters exhibit equivalent proportions, with the area of water fluctuating between 4.78% and 5.39%, and forest land representing around 3.73% of the total area. Permanent glacier and snow areas rank fifth, comprising 0.51% of the total area. Arable land and urban land consistently occupy the lowest positions, constituting 0.24% and 0.10%, respectively.
Analyzing the trajectory of changes in land use quantities, the future outlook suggests a stabilization in the area of arable land. Forest land is anticipated to experience a modest increase, rising from 9787.03 km2 in 2020 to approximately 9945 km2 in 2060, marking an increment of around 2.00%. High-coverage grassland is projected to expand significantly, reaching 28,508.25 km2 by 2060, reflecting an approximate 8.0% increase compared to 2020. The areas of grassland with moderate and low coverage exhibit similar characteristics, showing a marginal decline, yet their combined total consistently remains above 50% of the study area, surpassing 170,000 km2. Waters are undergoing rapid expansion, with their potential area reaching 10,826.25 km2 by 2060. Permanent glacier snow is undergoing ablation degradation, aligning with the gradual rise in the snowline height in the statistical study area (Figure 9). Urban land stands out as the most dynamic change among all land use types, witnessing a doubling of its area from 2020 to 301.75 km2 in 2060, with no discernible decrease during the specified period. Unused land is projected to reduce to 40,311 km2 by 2060 through moderate development and utilization.

3.3.2. Future Land Use Pattern

  • Spatial pattern
The spatial distribution results of the SRYAYE in 2030, 2035, and 2060 under the four climate scenarios SSP1-2.6, SSP2-4.5, SSP3-7.0, and SSP5-8.5 are depicted in Figure 10. It is evident that the spatial distribution patterns of various land use types in the SRYAYE are generally consistent with historical trends. Arable and forest lands exhibit a concentrated distribution in the northeast, high-coverage grasslands predominantly occupy the eastern part of the source region, while moderate- and low-coverage grasslands are interlaced and scattered throughout the central and western areas of the study region. Water bodies are predominantly represented by the Gyaring Lake and Ngoring Lake and the western braided river network. Permanent glacial and snowy areas are centralized around the Anyêmaqên Mountains and the Geladandong Glacier. Urban areas are sporadically distributed, and unused land is mainly situated in the northwest and southeast regions.
An analysis of Figure 10 reveals prominent changes in the spatial patterns of land use, particularly in the distribution of waters and high-coverage grassland. Under the same climate scenario, the western part of the river source region exhibits an increasingly evident reticulate structure in the waters over time, accompanied by a more pronounced interconnectedness of the water system. The expansion of river and lake shorelines results in the ecological degradation of surrounding grasslands. Even under conditions of increased water and temperature, the expansion of moderate- and low-coverage grasslands in this area is prone to causing on-site incidents of water bodies encroaching upon grasslands, leading to grassland degradation.
However, notable variations are observed among different climate scenarios, with SSP3-7.0 showing a less significant expansion of water bodies compared to the other three climate scenarios. Furthermore, in the southeastern part of the SRYE, near the Zoigê Wetland, the conversion of moderate- to low-coverage grasslands to high-coverage grasslands is observed, with a significant spreading trend compared to the year 2020. Simultaneously, there is a discernible increase in urban areas, exhibiting spatial heterogeneity; this is particularly concentrated in the eastern areas of the SRYE and is heavily influenced by human activities.
2.
Gravity center migration
The future direction of centroid migration for each type of land use is roughly the same under the four climate scenarios. The center of gravity for arable land continues to shift northeastward, with a maximum migration distance of 3.46 km under the SSP1-2.6 climate scenarios. The center of gravity for forest land undergoes a gradual northwestward migration. In the case of high-coverage grassland, the center of gravity exhibits westward migration under extreme scenarios (SSP1-2.6 and SSP5-8.5), while other scenarios demonstrate northeastward migration. Both moderate- and low-coverage grasslands show a tendency toward west–northwest or west–southwest displacement. The findings suggest that, in the context of future climate change, the vegetation growth conditions in the source region, particularly the vegetation coverage in the west, will show positive effects. The center of gravity for water bodies undergoes a more pronounced southwestward migration, reaching a maximum distance of 31.57 km under the SSP1-2.6 scenario. The center of gravity for permanent glacier snow gradually shifts northeastward. The center of gravity for urban areas is subjectively influenced by human activities, resulting in northwestward (SSP1-2.6 and SSP2-4.5) and southeastward (SSP1-2.6 and SSP2-4.5) shifts; meanwhile, the center of gravity for unused land primarily shifts to the northwest.
3.
Landscape pattern
The future landscape pattern of the SRYAYE is shown in Table 3. There is no significant difference in the landscape pattern index between different climate scenarios. Overall, the future spatial distribution of land use in the SRYAYE shows a decrease in the degree of fragmentation (NP, ED, AREA_MN). The interaction between different types of patches is weak, and the influence of human activities on the landscape pattern is gradually weakening, with the distribution of patches tending to be regularized and centralized; in addition, the patches tend to be more complex in general (LPI). The spatial continuity of the landscape pattern is slightly decreased (CONTAG). In the future, the richness of landscape types will decrease, and the dominance of landscape and its control effect on the whole landscape will not increase significantly (SHDI, SHEI).

4. Discussion

4.1. Rationality Analysis of the Improved Model

In this paper, we fully consider the particularity of the SRYAYE in the core area of the cryosphere in China and decompose the precipitation data into two types: snowfall data and rainfall data. At the same time, data regarding the distribution of permafrost and seasonal frozen soil are included as driving factors in order to characterize the soil properties and improve the model. Snowfall is a major form of precipitation in the SRYAYE, resulting in the accumulation of sufficient snow resources in the region. Snow and frozen soil are important components of the cryosphere [40], and can affect the surface energy balance, water exchange, and hydrological processes [41,42,43]. This further affects the growth of terrestrial vegetation and the effective utilization of water resources, thus changing the coverage of land use [44].
It has been shown that the snowpack changes in the eastern part of the QTP are the most significant and have a dominant effect on the snowpack changes in the whole QTP [45]; here, the snow accumulation period in the SRYE is concentrated from November to April, and the source as well as the high mountainous areas in the northwest have earlier first days and later final days of snow accumulation. This is also the area with a high annual average snow depth and longer snow accumulation days [46]. Wang et al. [47] found that the effect of snow cover on the growth of alpine vegetation can be expressed as the soil moisture effect of snow cover (more snow, more water, better vegetation; positive promotion effect) and the effect of snow cover on the phenological period (more snow cover leads to delayed spring phenology, which leads to poor vegetation; negative inhibition effect), which in turn leads to the expansion or reduction in vegetation coverage and the improvement or degradation of the vegetation growth quality. At the same time, Sheng et al. [48] predicted that by the mid-century, under the climate scenarios of RCP2.6, RCP6.0 and RCP8.5, the area of permanent permafrost degradation in the two lakes in the SRYE will increase gradually, with a maximum degraded area of up to 2559 km2, and that the thickness of the active layer of permafrost will increase significantly, leading to changes in water and heat conditions, the deterioration of alpine vegetation habitats, and the degradation of pastures; this will lead to a decrease in vegetation cover and ultimately affect the land cover [49,50].
The above research proves that the relationship between snow and permafrost and land use change is very complex, so it is necessary to explore the driving effect of the two on land use. By comparing the Kappa coefficient of 0.752 with that of the same study in the same region without improvement [51], the accuracy of the model is significantly improved by 23.3%, and the Kappa coefficients also show a clear advantage over other studies from different regions [52,53]; this indicates that it is feasible and reasonable to utilize the improved FLUS model to simulate the land use change in the SRYAYE in the future and that the roles of snow and permafrost in driving land use change in the plateau and alpine area should not be underestimated.

4.2. Analysis of Land Use Change Characteristics

From the perspective of land use scale change, one significant change is the increase in the area of forest land, high-coverage grassland, waters, and urban land in the region, and the decrease in the area of moderate- and low-coverage grassland, permanent glacier snow and unused land; this has occured firstly because China has established the Sanjiangyuan Nature Reserve, increased the implementation of ecological protection and restoration projects, implemented the Black Soil Bank treatment, degraded grassland replanting, and enacted other measures to improve the source area [54]. According to statistics, the average grassland coverage and grass production in the Sanjiangyuan area have increased by more than 11% and 30%, respectively, compared with 10 years ago; meanwhile, the manageable sandy land treatment rate has increased from 45% to 47%, and the area of lakes has expanded, with an average increase of more than 70 km2/a. Secondly, the global climate is warming up, and glacier ablation is accelerating. Some studies have shown that the glaciers in the SRYA, namely the Geladandong Glacier and the Dunkermaddy Glacier, and the Animaqing Mountains in the SRYE have continued to shrink [55,56]. The area of the Geladandong Glacier decreased by 92.06 km2 during 1986–2015, with a reduction rate of 0.33%/a [57]; the Dunkermaddy Glacier contracted significantly during 1976–2013, with a linear retreat rate of −0.31 ± 0.04 km2/a [58]; and the area of the Animation Glacier decreased by 29.4 km2 during 1985–2017 [59]. As a result, the runoff in the glacier meltwater runoff area has increased, resulting in the expansion of the water area [60]. In addition, the results of this paper regarding the changes in glaciers and watersheds are consistent with international conclusions on the accelerated recharge of alpine glaciers in the face of global warming and ablation [61,62].
From the point of view of land use patterns, the obvious changes are, respectively, the expansion of waters in the west leading to the remarkable braided river channel, the extensive spread of high-coverage grassland in the southeastern Zoige area, and the expansion of the urban land in the SRYE. Some studies have shown that in the past three decades, the area of the Geladandong Glacier has decreased by 16.4%, ice reserves have decreased by 29.5% [63], and that the loss of glacier mass in the SRYA is about 0.343 Gt/yr [64]; in addition, Gao et al. [65] have confirmed that glacier meltwater is an important source of recharge for the lakes in the SRYA, which leads to a clear increase in the area of these lakes [66]. In the last three decades, the area of lakes in the SRYA has increased by 29% [67], and the external expansion of lake shorelines in some relatively independent lakes has led to the formation of new rivers that connect to the water system; this has resulted in the extensive development of braided channels, which are very likely to form a large braided river group. These results are consistent with the findings of Li et al. [68]. In the future, grassland in the Zoige area will increase; this is in agreement with the conclusion of Chen et al. [69], who found that grassland in the area has increased in the past 15 years. This is due to the large area of shrub and forest land in this area, and the implementation of ecological restoration projects such as returning grazing to grass and returning farmland to grass. The spatial heterogeneity of the construction site in the SRYAYE reflects the different dominant factors driving land use change in the two source areas. The SRYA is greatly affected by climate change, while the SRYE is greatly affected by human activities.

4.3. Analysis of the Impact of Different Scenarios on Land Use

In this study, it is intuitively clear that the areas of arable land, moderate-coverage grassland, waters, and permanent glacier snow land in the same year vary under different climate scenarios. Among them, the difference in arable land under different climate scenarios is not significant because the change in the area of arable land is mainly affected by human demand for food crops [70], and the effect of climate change on the area of arable land produced is negligible, but it may be unfavorable to food security [71]. Moderate-coverage grassland in the alpine zone is sensitive to climate change, especially to precipitation [72], and changes in precipitation cause significant heterogeneity in plant water availability in time and space, thus showing more pronounced differences in the face of different climate scenarios [73]. The change in the area of permanent glacier snow cover and waters is the embodiment of the comprehensive response to temperature and precipitation [74], and there are obvious seasonal differences. Among them, the change in glaciers is largely attributed to the combination of winter snowfall and the summer temperature [75], and the rise in temperature is the decisive reason for the retreat of permanent glacier snow [76].
Further, the climate scenarios data for the SRYAYE show that the difference between the future climate scenarios is the difference between temperature and precipitation, and the average temperature and precipitation in the region show a double-increasing trend. The temperature in each climate scenario increases with the increase in time and RCPs, that is, the average temperature in 2020–2030 under the SSP1-2.6 scenario is as low as −0.69 °C, and the average temperature in 2020–2060 under the SSP5-8.5 exceeds a maximum of 0 °C and reaches 0.28 °C; the differences in precipitation under the different climate scenarios are more significant and increase with time, with the average precipitation being as high as 0.28 °C. The average precipitation can reach up to 582.92 mm (SSP1-2.6 scenario in 2020–2060), and the lowest level of this value in different target years is in the SSP3-7.0. The small amount of water resources recharged by precipitation is also one of the reasons why the expansion of waters in the SSP3-7.0 is not significant compared to the other three climate scenarios. However, current studies also point out that the results of current climate scenario simulations overestimate the magnitude of future climate change [77,78], and there is still uncertainty in the projections of future climate change. Therefore, it is necessary to explore the difference in land use under the background of climate change in the future.

4.4. Limitations of the Study

Based on the above research results, we found that two factors, permafrost and snowfall, have a significant driving effect on land use change in the source area of the Yangtze and Yellow Rivers; however, due to the limited data, we cannot predict the distribution of permafrost in the future, so exploring the mechanism influencing how these two factors specifically affect land use change is still a great challenge for us. In addition, as climate warming and humidification become more pronounced, our future research could quantify the impacts of these two meteorological factors on land use change in terms of precipitation and temperature, which could help to provide a basis for the development, utilization, and ecological protection of land resources in climate change-sensitive areas.

5. Conclusions

This paper focuses on the SRYAYE as the study area. Building upon an analysis of the spatiotemporal evolution characteristics of historical land use patterns, we enhance the FLUS model and utilize it to predict land use scenarios for the years 2030, 2035, and 2060 under four climate scenarios: SSP1-2.6, SSP2-4.5, SSP3-7.0, and SSP5-8.5. Based on the simulation results, we analyze the scale, composition, and spatiotemporal evolution characteristics of land use. The main conclusions are as follows:
(1)
Considering the characteristics of soil and precipitation forms in the alpine plateau area, the FLUS model is improved by incorporating frozen soil distribution data and snowfall data. Through verification and application, it is proved that the improved FLUS is suitable for the prediction of land use in the alpine plateau area.
(2)
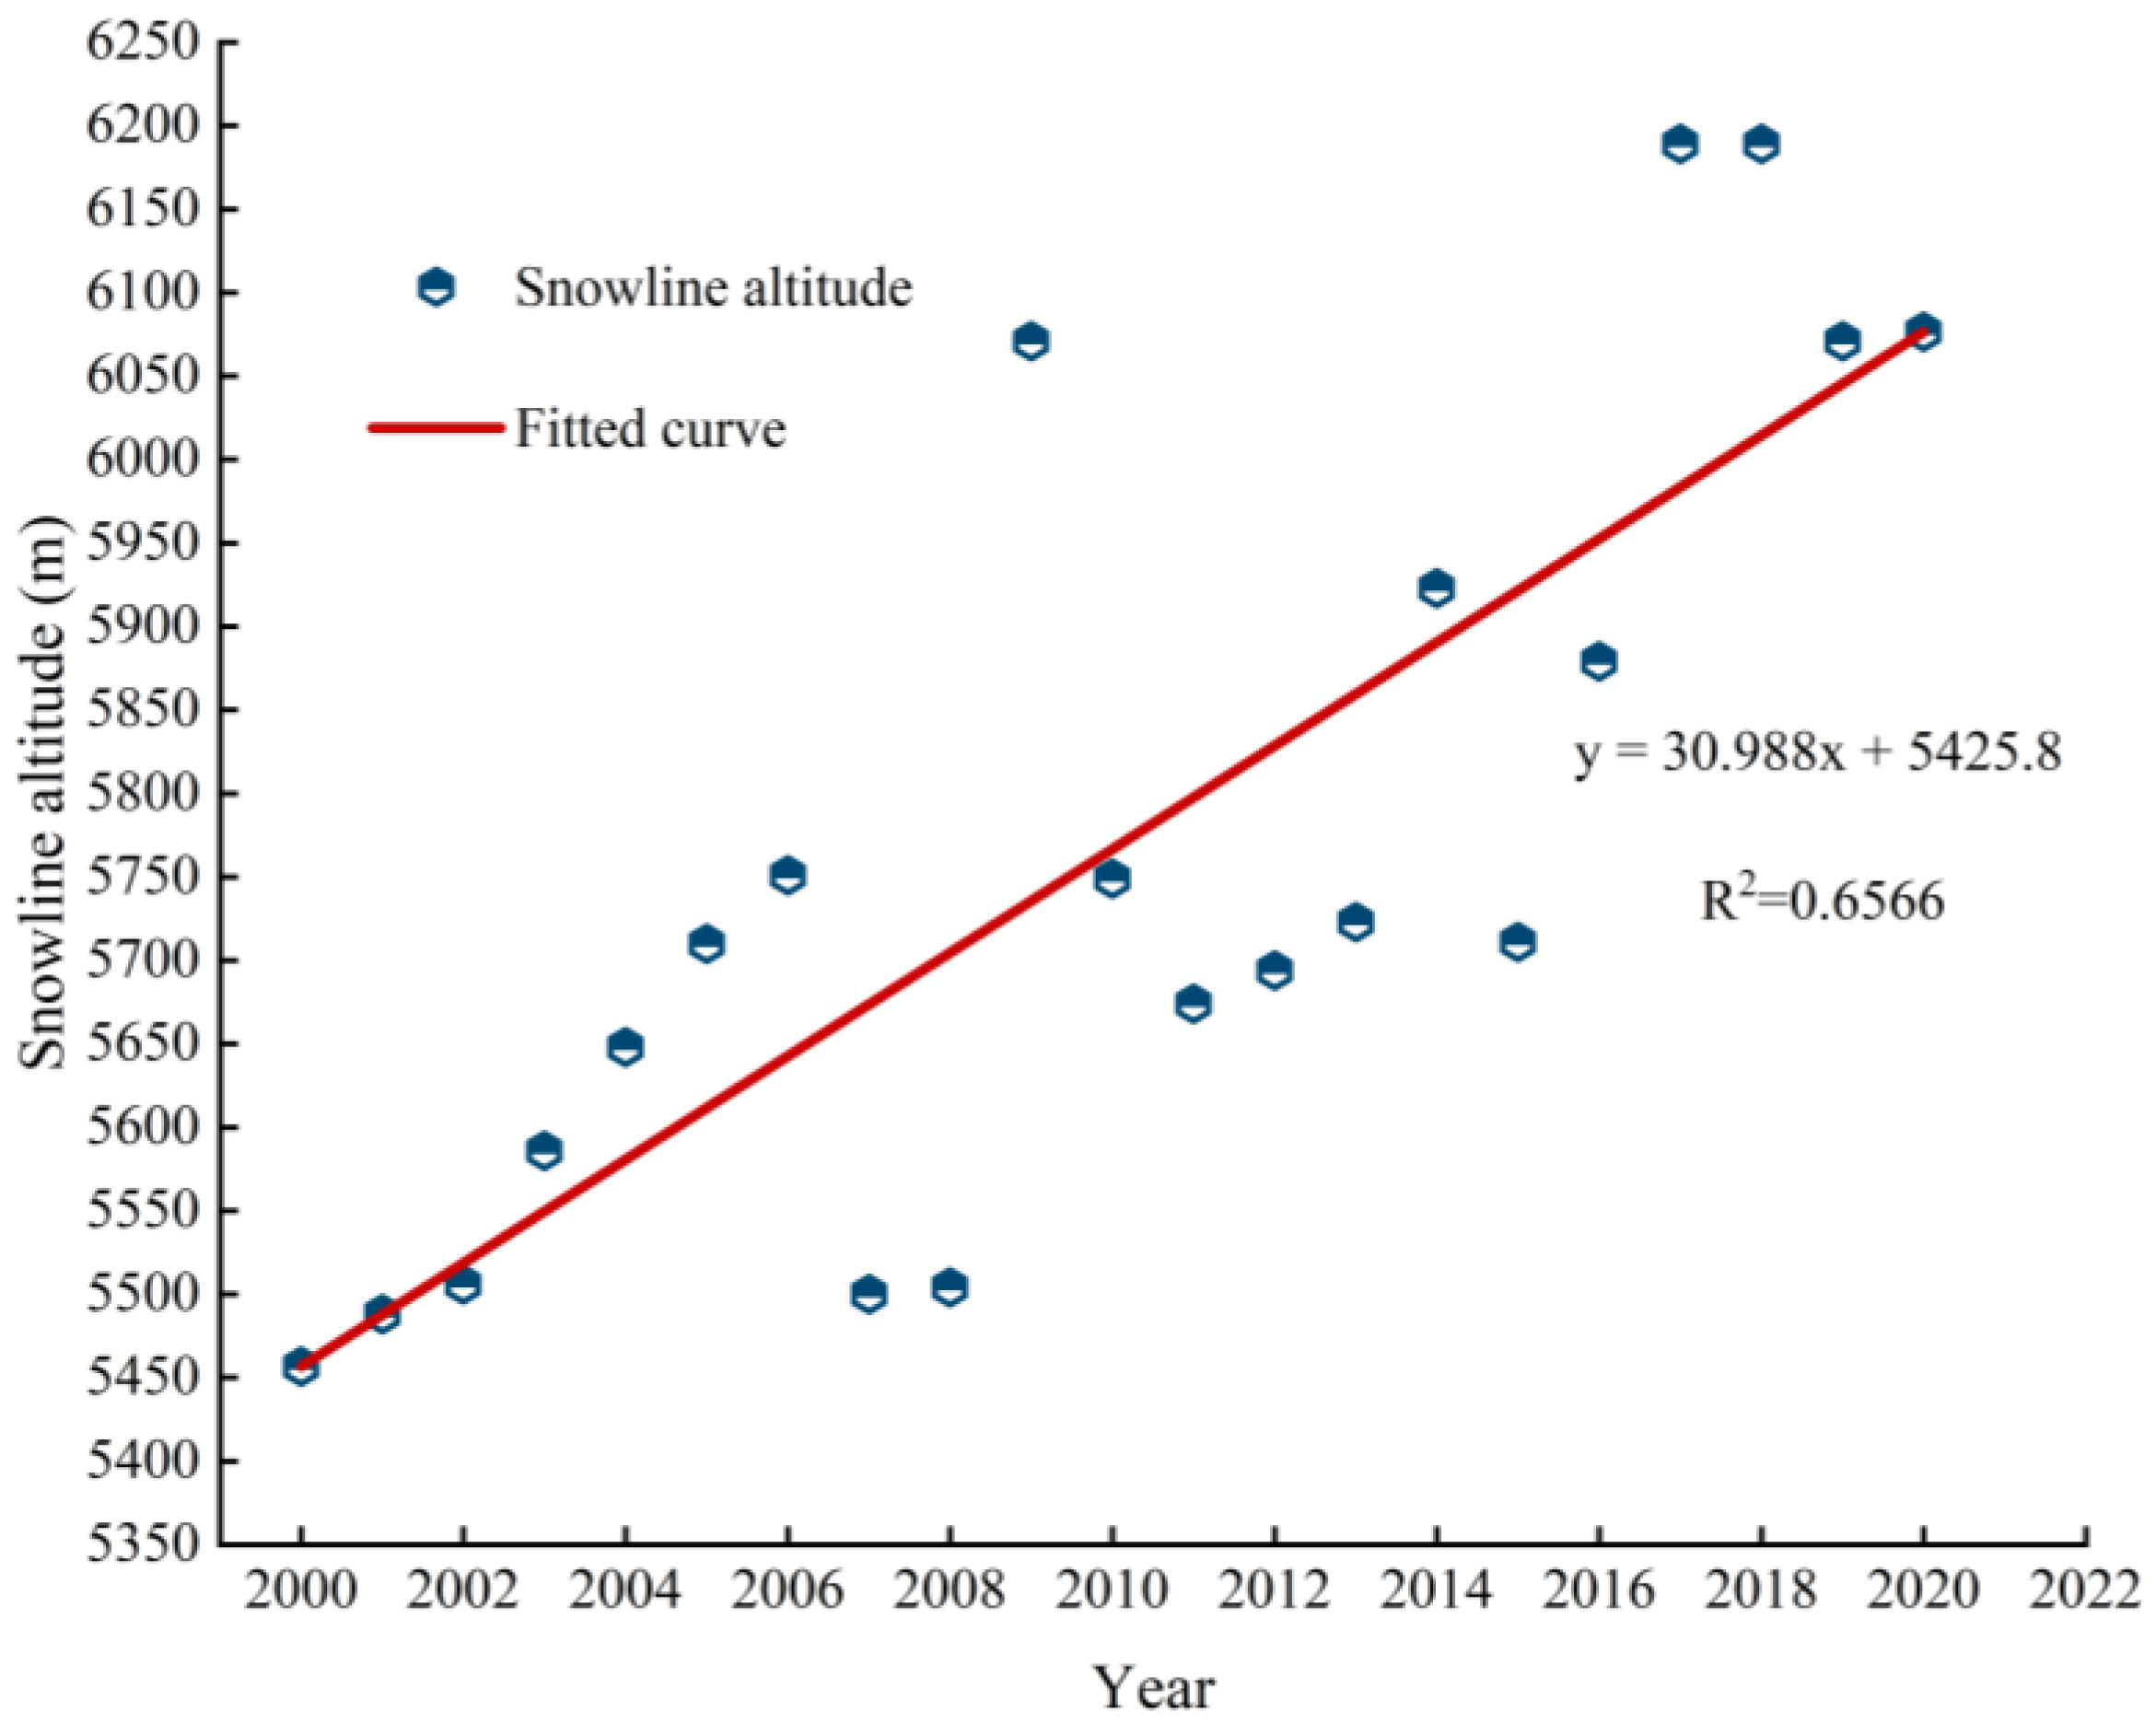
The difference in land use scale change between 2000 and 2020 and 2020 and 2060 is mainly reflected in the decrease to increase in high-coverage grassland, and the opposite is true for moderate- and low-coverage grassland. This indicates that the conditions of warming and water increase in the future and the advancement of engineering construction will improve the quality of grassland. In addition, the snow line of the SRYAYE is on the rise; by 2060, the glacier will retreat but not disappear, and the composition of land use will remain unchanged.
(3)
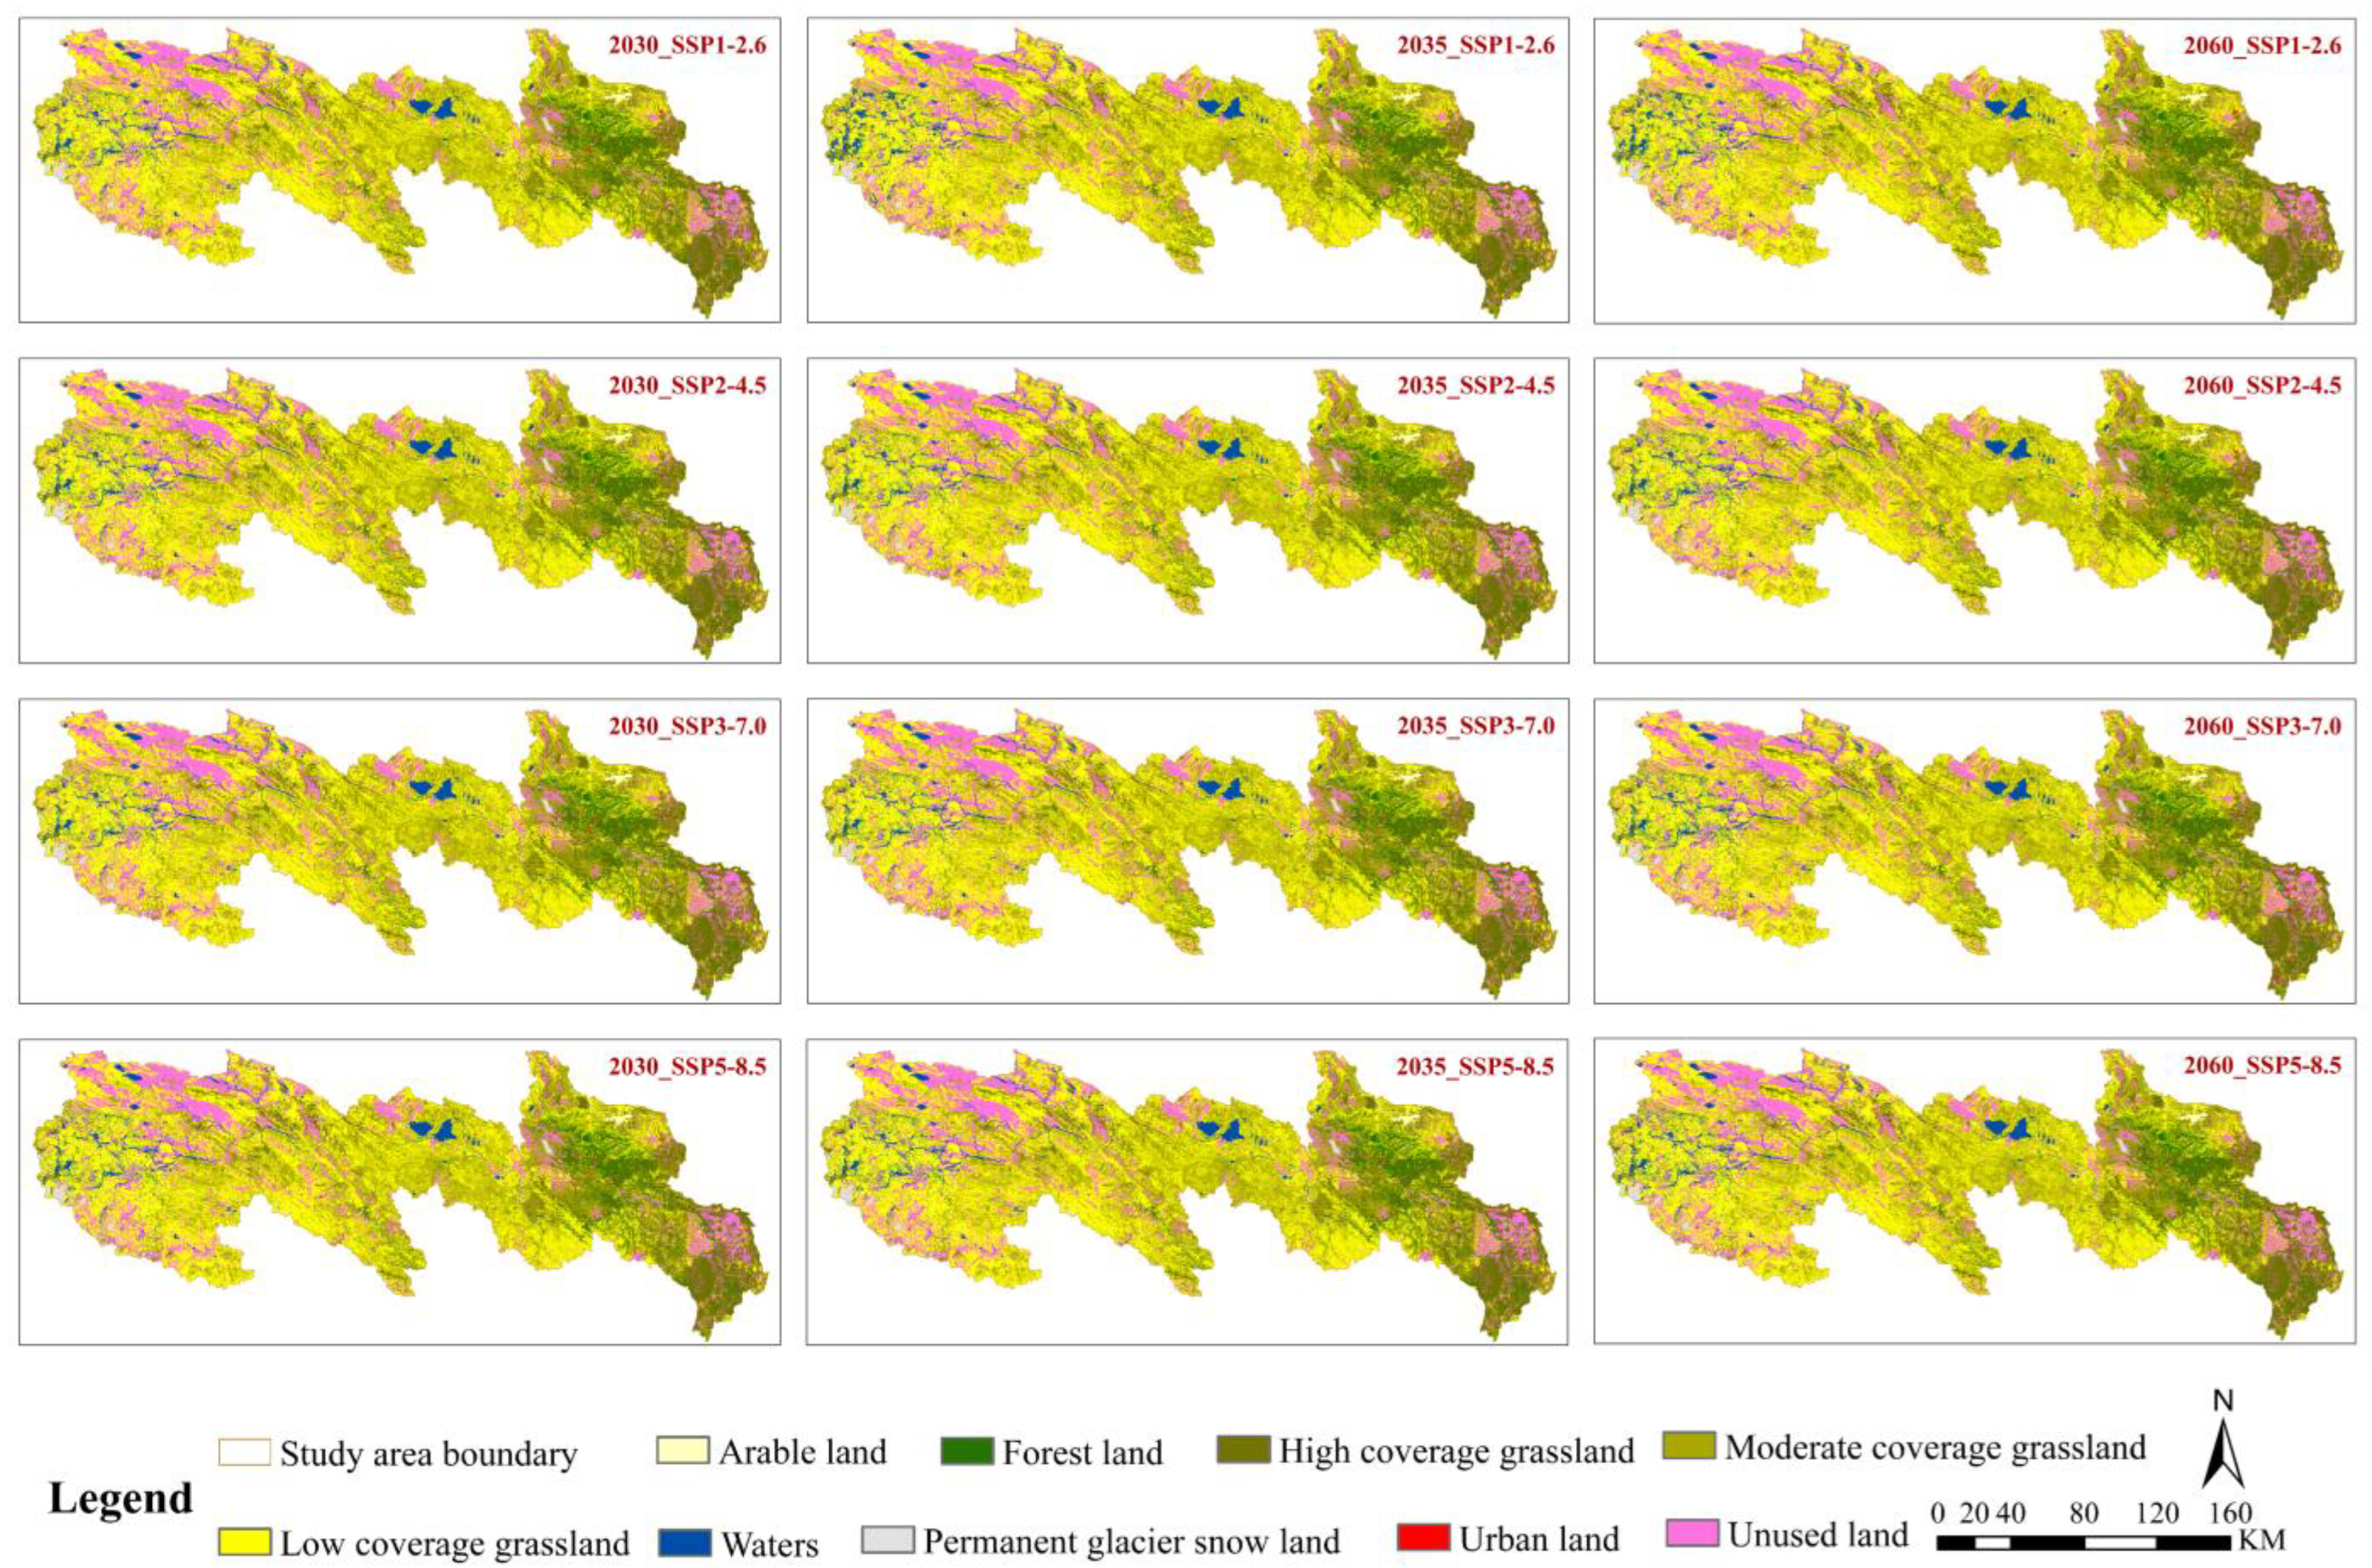
The future spatial pattern as a whole remains largely consistent with the current situation. Localized changes are notable in the expansion of waters in the west, resulting in obvious braided river channels; the spread of high-coverage grassland in the southeastern Zoige region is distinctive, and the urban land expands within the SRYE. This shows that climate change and human activities are the influencing factors driving land use change.
(4)
The degree of fragmentation in the SRYAYE is continually weakening, the degree of influence of human activities on the landscape pattern will be reduced in the future, and the dominance and continuity of grassland, as the most important type of landscape, is constantly being strengthened. The ecological environment of the source area is gradually improving. The results of the study will aid in the future planning of land resources and provide scientific support for the construction of ecological civilization in SRYAYE.

Author Contributions

Conceptualization, H.G., T.Q., Q.L. and J.F.; methodology, H.G.; software, H.G., Q.L., J.F. and X.Z.; validation, H.G., Y.Y. and S.X.; formal analysis, H.G.; investigation, S.X. and J.L.; resources, Y.Y.; data curation, X.Z. and S.X.; writing—original draft preparation, H.G.; writing—review and editing, Q.L., J.F., X.Z. and Y.Y.; visualization, H.G. and J.F.; supervision, T.Q.; project administration, T.Q.; funding acquisition, T.Q. All authors have read and agreed to the published version of the manuscript.

Funding

This research was funded by the National Key Research and Development Project (Grant No. 2022YFC3201705), the National Science Fund Project (Grant No. 52130907), the Five Major Excellent Talent Programs of IWHR (WR0199A012021) and the National Science Fund Project (Grant No. 52342905).

Data Availability Statement

The land use data and the socio-economic data were obtained from the CAS (https://www.resdc.cn/), and the topographic data were obtained from NASADEM (https://www.earthdata.nasa.gov/esds/competitive-programs/measures/nasadem). The meteorological data were obtained from CMA (http://data.cma.cn/), WCRP CMIP6 (cmip6–Home|ESGF-CoG (llnl.gov)), and FLDAS (https://disc.gsfc.nasa.gov/). The permafrost distribution data were obtained from Reference 32 (https://doi.org/10.1016/j.scitotenv.2022.158564), and the snowline height data were obtained from A Big Earth Data Platform for Three Poles (https://poles.tpdc.ac.cn/zh-hans/data/0cb6baaf-d43a-4d6b-84db-a7c5aa1c8e73/).

Acknowledgments

The authors are grateful to the CAS for providing the land use and the socioeconomic data dataset, to NASA for providing the DEM dataset and the CMA for providing the meteorological dataset, FLDAS and the WCRP CMIP6. The authors thank the anonymous reviewers for their valuable comments.

Conflicts of Interest

The authors declare no conflicts of interest.

References

  1. Lilburne, L.; Eger, A.; Mudge, P.; Ausseil, A.-G.; Stevenson, B.; Herzig, A.; Beare, M. The Land Resource Circle: Supporting Land-use Decision Making With an Ecosystem-service-based Framework of Soil Functions. Geoderma 2020, 363, 113134–113147. [Google Scholar] [CrossRef]
  2. Zhang, Q.; Yue, D.; Fang, M.; Yu, Q.; Huang, Y.; Su, K.; Ma, H.; Wang, Y. Study on Sustainability of Land Resources in Dengkou County Based on Emergy Analysis. J. Clean. Prod. 2018, 171, 580–591. [Google Scholar] [CrossRef]
  3. Chen, H.X.; Chen, C. Transfer Analysis of Land-use Type Gravity Center Based on Landsat data—A case Study of Zhoushan, China. In Proceedings of the 3rd International Forum on Geoscience and Geodesy (IFGG), Electr Network, Shenyang, China, 13–15 November 2020. [Google Scholar]
  4. Winkler, K.; Fuchs, R.; Rounsevell, M.; Herold, M. Global Land Use Changes Are Four Times Greater than Previously Estimated. Nat. Commun. 2021, 12, 2501. [Google Scholar] [CrossRef]
  5. Cao, M.; Zhu, Y.H.; Quan, J.L.; Zhou, S.; Lue, G.; Chen, M.; Huang, M.X. Spatial Sequential Modeling and Predication of Global Land Use and Land Cover Changes by Integrating a Global Change Assessment Model and Cellular Automata. Earth Future 2019, 7, 1102–1116. [Google Scholar] [CrossRef]
  6. Hou, Y.; Zhao, W.; Liu, Y.; Yang, S.; Hu, X.; Cherubini, F. Relationships of Multiple Landscape Services and Their Influencing Factors on the Qinghai–Tibet Plateau. Landsc. Ecol. 2020, 36, 1987–2005. [Google Scholar] [CrossRef]
  7. Li, G.; Li, X.; Chen, W.; Li, J.; Zhu, H.; Hu, X.; Zhou, H.; Sun, H. Effects of degradation severity on the physical, chemical and mechanical properties of topsoil in alpine meadow on the Qinghai-Tibet Plateau, west China. Catena 2020, 187, 104370–104379. [Google Scholar] [CrossRef]
  8. Cao, H.; Gao, B.; Gong, T.; Wang, B. Analyzing Changes in Frozen Soil in the Source Region of the Yellow River Using the MODIS Land Surface Temperature Products. Remote Sens. 2021, 13, 180. [Google Scholar] [CrossRef]
  9. Liu, J.; Milne, R.; Cadotte, M.; Wu, Z.; Provan, J.; Zhu, G.; Gao, L.; Li, D. Protect Third Pole’s fragile ecosystem. Science 2018, 362, 1368. [Google Scholar] [CrossRef]
  10. Meng, X.; Chen, H.; Li, Z.; Zhao, l.; Zhou, B.; Lv, S.; Deng, M.; Liu, Y.; Li, G. Review of Climate Change and Its Environmental Influence on the Three-River Regions. Plateau Meteorol. 2020, 39, 1133–1143. [Google Scholar] [CrossRef]
  11. Liu, L.; Cao, W.; Shao, Q. Different Characteristics of Land Cover Changes in Source Regions of the Yangtze River and the Yellow River in the Past 30 Years. Sci. Geogr. Sin. 2017, 37, 311–320. [Google Scholar] [CrossRef]
  12. Ding, Y.; Zhang, S.; Zhao, L.; Li, Z.; Kang, S. Global warming weakening the inherent stability of glaciers and permafrost. Sci. Bull. 2019, 64, 245–253. [Google Scholar] [CrossRef]
  13. Jin, X.; Jin, H.; Luo, D.; Sheng, Y.; Wu, Q.; Wu, J.; Wang, W.; Huang, S.; Li, X.; Liang, S.; et al. Impacts of Permafrost Degradation on Hydrology and Vegetation in the Source Area of the Yellow River on Northeastern Qinghai-Tibet Plateau, Southwest China. Front. Earth Sci. 2022, 10, 845824. [Google Scholar] [CrossRef]
  14. Wei, Y.Q.; Lu, H.Y.; Wang, J.N.; Wang, X.F.; Sun, J. Dual Influence of Climate Change and Anthropogenic Activities on the Spatiotemporal Vegetation Dynamics Over the Qinghai-Tibetan Plateau From 1981 to 2015. Earth Future 2022, 10, 23. [Google Scholar] [CrossRef]
  15. Zhang, X.; Wang, J.; Gao, Y.; Wu, L.; Ding, Y.; Bao, C. Responses of Vegetation Changes to Climatic Variations in Hulun Buir Sandy Grassland in the Past 15 Years. Acta Agrestia Sin. 2018, 26, 62–69. [Google Scholar] [CrossRef]
  16. Yang, A.; Zhang, H.; Yang, X.; Zhang, X. Quantitative analysis of the impact of climate change and human activities on vegetation NPP in the Qilian Mountain. Hum. Ecol. Risk Assess. Int. J. 2022, 29, 202–221. [Google Scholar] [CrossRef]
  17. Du, X.; Zhao, X.; Liang, S.; Zhao, J.; Xu, P.; Wu, D. Quantitatively Assessing and Attributing Land Use and Land Cover Changes on China’s Loess Plateau. Remote Sens. 2020, 12, 353. [Google Scholar] [CrossRef]
  18. Singh, V.G.; Singh, S.K.; Kumar, N.; Singh, R.P. Simulation of land use/land cover change at a basin scale using satellite data and markov chain model. Geocarto Int. 2022, 37, 11339–11364. [Google Scholar] [CrossRef]
  19. Abolhasani, S.; Taleai, M.; Karimi, M.; Rezaee Node, A. Simulating urban growth under planning policies through parcel-based cellular automata (ParCA) model. Int. J. Geogr. Inf. Sci. 2016, 30, 2276–2301. [Google Scholar] [CrossRef]
  20. Waiyasusri, K.; Yumuang, S.; Chotpantarat, S. Monitoring and predicting land use changes in the Huai Thap Salao Watershed area, Uthaithani Province, Thailand, using the CLUE-s model. Environ. Earth Sci. 2016, 75, 533. [Google Scholar] [CrossRef]
  21. Song, S.; Liang, X.; Chen, H.; Mao, Z. The Simulation of Cropland Abandonment Based on Multi-agent System and Land Transformation Model: A Case Study of Mizhi County, Shaanxi Province. J. Nat. Resour. 2018, 33, 515–525. [Google Scholar] [CrossRef]
  22. Liu, X.; Liang, X.; Li, X.; Xu, X.; Ou, J.; Chen, Y.; Li, S.; Wang, S.; Pei, F. A future land use simulation model (FLUS) for simulating multiple land use scenarios by coupling human and natural effects. Landsc. Urban Plan. 2017, 168, 94–116. [Google Scholar] [CrossRef]
  23. Degermenci, A.S. Spatio-temporal change analysis and prediction of land use and land cover changes using CA-ANN model. Environ. Monit. Assess. 2023, 195, 1229–1235. [Google Scholar] [CrossRef]
  24. Feng, H.; Lei, X.; Yu, G.; Changchun, Z. Spatio-temporal evolution and trend prediction of urban ecosystem service value based on CLUE-S and GM (1,1) compound model. Environ. Monit. Assess. 2023, 195, 1282–1305. [Google Scholar] [CrossRef]
  25. Chen, Z.; Huang, M.; Zhu, D.; Altan, O. Integrating Remote Sensing and a Markov-FLUS Model to Simulate Future Land Use Changes in Hokkaido, Japan. Remote Sens. 2021, 13, 2621. [Google Scholar] [CrossRef]
  26. Jin, H.; Li, H.; Lee, J.; Sun, W. Simulation analysis of rural land use using rate of change driven by population and economic dynamics—A case study of Huangguashan village in Chongqing, China. Ecol. Model. 2023, 475, 110204–110214. [Google Scholar] [CrossRef]
  27. Hu, S.; Chen, L.; Li, L.; Zhang, T.; Yuan, L.; Cheng, L.; Wang, J.; Wen, M. Simulation of Land Use Change and Ecosystem Service Value Dynamics under Ecological Constraints in Anhui Province, China. Int. J. Environ. Res. Public Health 2020, 17, 4228. [Google Scholar] [CrossRef]
  28. Chen, X.; He, X.; Wang, S. Simulated Validation and Prediction of Land Use under Multiple Scenarios in Daxing District, Beijing, China, Based on GeoSOS-FLUS Model. Sustainability 2022, 14, 11428. [Google Scholar] [CrossRef]
  29. Li, Y.; Liu, Z.; Li, S.; Li, X. Multi-Scenario Simulation Analysis of Land Use and Carbon Storage Changes in Changchun City Based on FLUS and InVEST Model. Land 2022, 11, 647. [Google Scholar] [CrossRef]
  30. Li, L.; Hu, R.; Li, S. Simulations of the low-carbon land use scenarios of Beijing based on the improved FLUS model. Remote Sens. Nat. Resour. 2023, 35, 81. [Google Scholar] [CrossRef]
  31. Zhang, J.; Mei, Z.; Lv, J.; Chen, J. Simulating multiple land use scenarios based on the FLUS model considering spatial autocorrelation. J. Geo-Inf. Sci. 2020, 32, 531–542. [Google Scholar] [CrossRef]
  32. Zhang, Y.L.; Liu, L.S.; Wang, Z.F.; Bai, W.; Ding, M.; Wang, X.; Yan, J.; Xu, E.; Wu, X.; Zhang, B.; et al. Spatial and temporal characteristics of land use and cover changes in the Tibetan Plateau. Chin. Sci. Bull. 2019, 67, 2865–2875. [Google Scholar] [CrossRef]
  33. Li, W.W.; Weng, B.S.; Yan, D.H.; Lai, Y.Q.; Li, M.; Wang, H. Underestimated permafrost degradation: Improving the TTOP model based on soil thermal conductivity. Sci. Total Environ. 2023, 854, 158564–158581. [Google Scholar] [CrossRef] [PubMed]
  34. Tang, Z.; Deng, G.; Wang, X. 30 km Gridded dataset of Snowline altitude in High Mountain Asia (2001–2019). 2020. Available online: https://poles.tpdc.ac.cn/en/data/0cb6baaf-d43a-4d6b-84db-a7c5aa1c8e73/ (accessed on 14 June 2023).
  35. Tang, Z.G.; Wang, X.R.; Deng, G.; Wang, X.; Jiang, Z.L.; Sang, G.Q. Spatiotemporal variation of snowline altitude at the end of melting season across High Mountain Asia, using MODIS snow cover product. Adv. Space Res. 2020, 66, 2629–2645. [Google Scholar] [CrossRef]
  36. Wang, X.; Tang, Z.; Wang, J.; Deng, G.; Wang, X.; Wei, J. Analysis of influencing factors of spatial difference of snowline altitude at the end of ablation season in the High Mountain Asia. J. Glaciol. Geocryol. 2019, 41. [Google Scholar] [CrossRef]
  37. Halmy, M.W.A.; Gessler, P.E.; Hicke, J.A.; Salem, B.B. Land use/land cover change detection and prediction in the north-western coastal desert of Egypt using Markov-CA. Appl. Geogr. 2015, 63, 101–112. [Google Scholar] [CrossRef]
  38. Mansour, S.; Al-Belushi, M.; Al-Awadhi, T. Monitoring land use and land cover changes in the mountainous cities of Oman using GIS and CA-Markov modelling techniques. Land Use Pol. 2020, 91, 15. [Google Scholar] [CrossRef]
  39. Wu, X.D.; Naegeli, K.; Premier, V.; Marin, C.; Ma, D.J.; Wang, J.P.; Wunderle, S. Evaluation of snow extent time series derived from Advanced Very High Resolution Radiometer global area coverage data (1982–2018) in the Hindu Kush Himalayas. Cryosphere 2021, 15, 4261–4279. [Google Scholar] [CrossRef]
  40. Liu, M.; Wang, B.; Zhong, J. Population-Economic-Grain Regional Difference and Spatial Pattern of Qinghai Province in the Past 30 Years. Northwest Popul. J. 2021, 42, 113–124. [Google Scholar] [CrossRef]
  41. Li, Y.; Liu, D.; Li, T.; Fu, Q.; Liu, D.; Hou, R.; Meng, F.; Li, M.; Li, Q. Responses of spring soil moisture of different land use types to snow cover in Northeast China under climate change background. J. Hydrol. 2022, 608, 127610–127625. [Google Scholar] [CrossRef]
  42. Liu, Y.; Li, W.; Liu, X.; Wang, X.; Fu, R.; Liu, P. Physics of the control of the Tibetan Plateau on regional energetic processes and global climate. Trans. Atmos. Sci. 2020, 43, 181–192. [Google Scholar] [CrossRef]
  43. Jiang, Y.; Li, D.; Zheng, R. Variation characteristics of snow cover and frozen soil and their relationships with vegetation inthe Tibetan Plateau from 1971 to 2016. Trans. Atmos. Sci. 2020, 43, 481–494. [Google Scholar] [CrossRef]
  44. Wang, H.; Liu, H.; Cao, G.; Ma, Z.; Li, Y.; Zhang, F.; Zhao, X.; Zhao, X.; Jiang, L.; Sanders, N.; et al. Alpine grassland plants grow earlier and faster but biomass remains unchanged over 35 years of climate change. Ecol. Lett. 2020, 23, 701–710. [Google Scholar] [CrossRef] [PubMed]
  45. Yang, Y.; Tang, Z.; Xing, D.; Hou, J. A dataset of MODIS gap-filled fractional snow cover in the source area of Yellow River during 2000–2021. China Sci. Data 2022, 7. [Google Scholar] [CrossRef]
  46. Guan, X.; Liu, C.; Bao, Z.; Jin, J.; Wang, G. Spatial-temporal variability of the snow over the Yellow River source region and its influencing climate factors. China Environ. Sci. 2021, 41, 1045–1054. [Google Scholar] [CrossRef]
  47. Wang, X.Y.; Wang, T.; Guo, H.; Liu, D.; Zhao, Y.T.; Zhang, T.T.; Liu, Q.; Piao, S.L. Disentangling the mechanisms behind winter snow impact on vegetation activity in northern ecosystems. Glob. Chang. Biol. 2018, 24, 1651–1662. [Google Scholar] [CrossRef]
  48. Sheng, Y.; Ma, S.; Cao, W.; Wu, J.C. Spatiotemporal changes of permafrost in the Headwater Area of the Yellow River under a changing climate. Land Degrad. Dev. 2020, 31, 133–152. [Google Scholar] [CrossRef]
  49. Wei, C.; Yu, S.; Jichun, W.; Yaling, C.; Erxing, P.; Leonid, G. Soil hydrological process and migration mode influenced by the freeze-thaw process in the activity layer of permafrost regions in Qinghai-Tibet Plateau. Cold Reg. Sci. Technol. 2021, 184, 103236–103250. [Google Scholar] [CrossRef]
  50. Ding, Y.; Yang, J.; Fang, Y.; Wang, S. Adaptation research of cryosphere change. J. Glaciol. Geocryol. 2020, 42, 11–22. [Google Scholar] [CrossRef]
  51. Hou, J.; Chen, J.; Zhang, K.; Zhou, G.; Long, H.; Han, X. Temporal and Spatial Variation Characteristics of Carbon Storage in the Source Region of the Yellow River Based on InVEST and GeoSoS-FLUS Models and Its Response to Different Future Scenarios. Environ. Sci. 2022, 43, 5253–5262. [Google Scholar] [CrossRef]
  52. Shao, Z.; Chen, C.; Liu, Y.; Cao, J.; Liao, G.; Lin, Z. Impact of Land Use Change on Carbon Storage Based on FLUS-InVEST Model: A Case Study of Chengdu–Chongqing Urban Agglomeration, China. Land 2023, 12, 1531. [Google Scholar] [CrossRef]
  53. Jin, Y.; Ding, J.; Chen, Y.; Zhang, C.; Hou, X.; Zhang, Q.; Liu, Q. Urban Land Expansion Simulation Considering the Increasing versus Decreasing Balance Policy: A Case Study in Fenghua, China. Land 2023, 12, 2099. [Google Scholar] [CrossRef]
  54. Lu, Z.; Song, Q.; Zhao, J. Evolution of Landscape Ecological Risk and Identification of Critical Areas in the Yellow River Source Area Based on LUCC. Sustainability 2023, 15, 9749. [Google Scholar] [CrossRef]
  55. Chao, N.; Wang, Z.; Hwang, C.; Jin, T.; Cheng, Y.-S. Decline of Geladandong Glacier Elevation in Yangtze River’s Source Region: Detection by ICESat and Assessment by Hydroclimatic Data. Remote Sens. 2017, 9, 75. [Google Scholar] [CrossRef]
  56. Huang, X.; Meng, Q.; Liu, H. Remote sensing monitoring of Anyemaqen glacier area based on GEE and preliminary analysis of potential hazards. J. Qinghai Univ. 2023, 41, 1–7. [Google Scholar] [CrossRef]
  57. Li, C.; Jing, Z.; He, X. Remote sensing monitoring of glacier variation in Geladandong source regions of the Yangtze River from1986 to 2015. J. Glaciol. Geocryol. 2021, 43, 405–416. [Google Scholar] [CrossRef]
  58. Ke, L.; Ding, X.; Li, W.; Qiu, B. Remote Sensing of Glacier Change in the Central Qinghai-Tibet Plateau and the Relationship with Changing Climate. Remote Sens. 2017, 9, 114. [Google Scholar] [CrossRef]
  59. Li, K.; Cao, B.; Guan, W.; Pan, B.; Shangguan, D. Reconstructed annual glacier surface mass balance in the anyemaqen Mountains, Yellow River source, based on snow line altitude. J. Mt. Sci. 2022, 19, 1070–1081. [Google Scholar] [CrossRef]
  60. He, Q.; Kuang, X.; Liang, S.; Jiao, J.; Feng, Y. Glacial meltwater variation in Dongkemadi River Basin of Yangtze River source from1966 to 2015 and its influence on runoff. Yangtze River 2020, 51, 77–85+130. [Google Scholar] [CrossRef]
  61. Gabbi, J.; Carenzo, M.; Pellicciotti, F.; Bauder, A.; Funk, M. A comparison of empirical and physically based glacier surface melt models for long-term simulations of glacier response. J. Glaciol. 2017, 60, 1140–1154. [Google Scholar] [CrossRef]
  62. Six, D.; Vincent, C. Sensitivity of mass balance and equilibrium-line altitude to climate change in the French Alps. J. Glaciol. 2017, 60, 867–878. [Google Scholar] [CrossRef]
  63. Han, S.; Liu, H.; Huang, X. Glacier variations in Geladandong and its impact on the runoff in recent 30 years. J. Qinghai Univ. 2020, 39, 9–17. [Google Scholar] [CrossRef]
  64. Liu, L.; Jiang, L.; Wang, H.; Ding, X.; Xu, H. Estimation of glacier mass loss and its contribution to river runoff in the source region of the Yangtze River during 2000–2018. J. Hydrol. 2020, 589. [Google Scholar] [CrossRef]
  65. Gao, M. Characteristics of Lake Changes in the Source Region of the Yangtze River Based on MODIS Data. Master’s Thesis, China University of Geosciences, Beijing, China, 2021. [Google Scholar]
  66. Liu, W.; Liu, H.; Li, Q.; Xie, C.; Zhang, Z.; Zhou, G.; Zhang, Q.; Zhao, Q. Extensive responses of lake dynamics to climate change on northeastern Tibetan Plateau. Front. Earth Sci. 2023, 10, 1007384–1007399. [Google Scholar] [CrossRef]
  67. Qi, C.; Ren, Y.; Peng, H.; Wei, J.; Wang, Y.; Li, Q. Extracting the Dynamic Change of Lake Area in the Three-River Headwaters Region Based on Google Earth Engine. J. Chang. River Sci. Res. Inst. 2023, 40, 179–185+190. [Google Scholar] [CrossRef]
  68. Li, Z.; Lu, H.; Gao, P.; You, Y.; Hu, X. Characterizing braided rivers in two nested watersheds in the Source Region of the Yangtze River on the Qinghai-Tibet Plateau. Geomorphology 2020, 351, 106945–106956. [Google Scholar] [CrossRef]
  69. Chen, X.; Sun, M.; Lv, Y.; Hu, J.; Yang, L.; Zhou, Q. Spatial-temporal Variability Characteristics and Its Driving Factors of Land Use in Zoige Plateau on the Eastern Edge of Qinghai-Tibetan Plateau, China. J. Ecol. Rural. Environ. 2023, 39, 306–315. [Google Scholar] [CrossRef]
  70. Fu, J. Land use function change and its driving force of the “production-living-ecological” space in Fenhe River Basin from1980 to 2020. Chin. J. Appl. Ecol. 2023, 34, 1901–1911. [Google Scholar] [CrossRef]
  71. Xue, L.; Sun, X.; Zhao, W. The impact of Climate Change and Economic Agglomeration on Agricultural Sustainability: A Case Study of Yunnan Province. Urban Environ. Stud. 2023, 3, 98–118. [Google Scholar]
  72. Hou, Q.; Yang, H.; Wu, J.; Yu, X. Carbon budget response to climate change varies with grassland type in Qilian Mountains, China. Glob. Ecol. Conserv. 2023, 47, e02670–e02686. [Google Scholar] [CrossRef]
  73. Lei, S.; Liao, L.; Wang, J.; Zhang, L.; Ye, Z.; Liu, G.; Zhang, C. The diversity-Godron stability relationship of alpine grassland and its environmental drivers. Acta Prataculturae Sin. 2023, 32, 1–12. [Google Scholar] [CrossRef]
  74. Liu, S.; Zhang, J.; Zhang, J.; Wang, K.; Wu, X.; Xu, L. Simulated glacier responses to temperature and precipitation trends in a snowmelt-dominated river basin. Ecol. Indic. 2019, 106, 105492–105504. [Google Scholar] [CrossRef]
  75. Li, J.; Xu, X. Glacier Change and Its Response to Climate Change in Western China. Land 2023, 12, 623. [Google Scholar] [CrossRef]
  76. Zhou, Z.; Han, N.; Liu, J.; Yan, Z.; Xu, C.; Cai, J.; Shang, Y.; Zhu, J. Glacier variations and their response to climate change in an arid inland river basin of Northwest China. J. Arid. Land 2020, 12, 357–373. [Google Scholar] [CrossRef]
  77. Hausfather, Z.; Marvel, K.; Schmidt, G.A.; Nielsen-Gammon, J.W.; Zelinka, M. Climate simulations: Recognize the ‘hot model’ problem. Nature 2022, 605, 26–29. [Google Scholar] [CrossRef]
  78. Chen, Z.M.; Zhou, T.J.; Chen, X.L.; Zhang, W.X.; Zhang, L.X.; Wu, M.N.; Zou, L.W. Observationally constrained projection of Afro-Asian monsoon precipitation. Nat. Commun. 2022, 13, 12. [Google Scholar] [CrossRef]
Figure 1. Geographical location of the study area (Description: (ah) are aerial photos of the field in-vestigation in the SRYAYE; (a) is arable land, (b) is forest land, (c) is high coverage grassland, (d) is moderate coverage grassland, (e) is coverage grassland, (f) is waters, (g) is permanent glacier snow land, (h) is urban land).
Land 13 00393 g001
Figure 2. Technical routes: (1) Quantitative land use forecasting; (2) FLUS model mechanism and improvement and simulation of the spatial layout of land use; (3) Analysis of the evolution of the scale, composition, and pattern of land use.
Land 13 00393 g002
Figure 3. Study of regional land use drivers (2020 as an example).
Land 13 00393 g003
Figure 4. Comparison between the improved simulation results of the model and the actual land use in 2020.
Land 13 00393 g004
Figure 5. Changes in land use scale of various types from 2000 to 2020.
Land 13 00393 g005
Figure 6. Spatial distribution of land use in the SRYAYE from 2000 to 2020.
Land 13 00393 g006
Figure 7. Historical land use centroid shifts.
Land 13 00393 g007
Figure 8. Scale of future land use under different climate scenarios.
Land 13 00393 g008
Figure 9. Variation trend of snow line height from 2000 to 2020 (taking the variation trend of snow line in the SRYE as an example).
Land 13 00393 g009
Figure 10. Spatial distribution of land use in different climate scenarios in the SRYAYE in 2030, 2035, and 2060.
Land 13 00393 g010
Table 1. Sources and descriptions of each type of data.
TypeDataDescriptionSource
Land Use DataLand use and land cover changeEight data sets of 2000, 2005, 2010, 2015 and 2020, with a spatial resolution of 30 mCAS (https://www.resdc.cn/, accessed on 14 June 2023)
Topographic DataDEMDigital elevation model with 30 m spatial resolutionNASADEM
(https://www.earthdata.nasa.gov/esds/competitive-programs/measures/nasadem, accessed on 14 June 2023)
Meteorological DataHistorical Rainfall DataThe spatial interpolation of 800 meteorological stations in China was carried out to obtain a rainfall dataset from 2000 to 2020 with a spatial resolution of 500 m.CMA
(http://data.cma.cn/, accessed on 14 June 2023)
Future Precipitation DataMonthly precipitation data for 2020–2060 under four CMIP6 climate scenarios (SSP1-2.6, SSP2-4.5, SSP3-7.0, SSP5-8.5) with a spatial resolution of 0.5° × 0.5°.WCRP CMIP6
(cmip6–Home|ESGF-CoG (llnl.gov, accessed on 14 June 2023))
Historical Temperature DataThe spatial interpolation of 800 meteorological stations in China was carried out to obtain a temperature dataset from 2000 to 2020 with a spatial resolution of 500 m.CMA
(http://data.cma.cn/, accessed on 14 June 2023)
Future Temperature DataMonthly temperature data for 2020–2060 under four CMIP6 climate scenarios (SSP1-2.6, SSP2-4.5, SSP3-7.0, SSP5-8.5) with a spatial resolution of 0.5° × 0.5°.WCRP CMIP6
cmip6–Home|ESGF-CoG (llnl.gov, accessed on 14 June 2023)
Historical Snowfall DataExtracted from the FLDAS datasets of 2000, 2005, 2010, 2015, and 2020, with a spatial resolution of 0.1° × 0.1°.FLDAS
https://disc.gsfc.nasa.gov/, accessed on 14 June 2023
Permafrost Distribution DataSeasonal Frozen Soil Distribution DataSix periods of shapefile data for seasonal frozen soil distribution in 2010, 2012, 2014, 2016, 2018 and 2020.Literature [33] https://doi.org/10.1016/j.scitotenv.2022.158564, accessed on 14 June 2023
Permafrost
Distribution Data
Six periods of shapefile data for permafrost
distribution in 2010, 2012, 2014, 2016, 2018 and 2020.
Socio-Economic Data GDPFive periods of raster data for GDP in 2000, 2005, 2010, 2015 and 2020, with a spatial resolution of 1 km.CAS (https://www.resdc.cn/, accessed on 14 June 2023)
POPFive periods of raster data for POP in 2000, 2005, 2010, 2015 and 2020, with a spatial resolution of 1 km.
Snowline Height Data30 km Gridded Dataset of Snowline Altitude in High Mountain Asia (2001–2019)Snowline height dataset of 30 km grid in high mountainous areas of Asia, 2001–2019, data format shapefile, data attribute table containing snowline heights for each year from 2001 to 2019, with a value of 0 indicating no snowline heights [34,35,36]A Big Earth Data Platform for Three Poles
https://poles.tpdc.ac.cn/zh-hans/data/0cb6baaf-d43a-4d6b-84db-a7c5aa1c8e73/, accessed on 14 June 2023
Table 2. Landscape pattern index from 2000 to 2020.
YearLandscape Pattern Index
NPLPIEDAREA_MNFRAC_AMCONTAGSHDISHEI
200041,33218.7813.60639.691.2540.371.550.71
200541,27818.7613.57640.521.2540.351.550.71
201039,63021.7013.28667.161.2641.761.520.69
201539,56822.4213.27668.211.2641.761.520.69
202039,86127.7413.29663.231.2641.621.530.69
Table 3. Landscape pattern index from 2020 to 2060.
YearLandscape Pattern Index
NPLPIEDAREA_MNFRAC_AMCONTAGSHDISHEI
SSP1-2.6
202039,86127.7413.29663.231.2641.621.530.69
203039,63227.4913.18667.071.2641.591.530.70
203539,08629.1013.01676.391.2641.731.540.70
206039,40228.2013.12670.961.2641.261.550.70
SSP2-4.5
202039,86127.7413.29663.231.2641.621.530.69
203039,76927.6613.18664.771.2641.601.530.70
203539,54927.3413.12668.471.2641.631.530.70
206039,08621.4413.15676.391.2541.211.550.70
SSP3-7.0
202039,86127.7413.29663.231.2641.621.530.69
203039,76827.5213.14664.791.2641.711.530.70
203539,57421.5713.15668.041.2541.641.530.70
206039,13720.2413.14675.501.2541.221.550.70
SSP5-8.5
202039,86127.7413.29663.231.2641.621.530.69
203039,50327.8613.13669.251.2641.591.530.70
203539,73827.6813.15665.291.2641.581.530.70
206039,20521.0313.16674.331.2541.231.550.70
Disclaimer/Publisher’s Note: The statements, opinions and data contained in all publications are solely those of the individual author(s) and contributor(s) and not of MDPI and/or the editor(s). MDPI and/or the editor(s) disclaim responsibility for any injury to people or property resulting from any ideas, methods, instructions or products referred to in the content.

