Article

Projections of Land Use Change and Water Supply–Demand Assessment Based on Climate Change and Socioeconomic Scenarios: A Case Study of Guizhou Province, China

1
School of Karst Science, Guizhou Normal University, Guiyang 550025, China
2
State Engineering Technology Institute for Karst Desertification Control, Guiyang 550025, China
3
School of Geography and Environmental Science, Guizhou Normal University, Guiyang 550025, China
*
Author to whom correspondence should be addressed.
Land 2024, 13(2), 194; https://doi.org/10.3390/land13020194
Submission received: 4 January 2024 / Revised: 26 January 2024 / Accepted: 31 January 2024 / Published: 5 February 2024
(This article belongs to the Special Issue Integrating Ecosystem Service Assessments into Land Use Decisions)

Abstract

:
Land use change and water supply–demand assessment are critical to achieving regional sustainable development and improving human wellbeing. In the context of complex climate change and socioeconomic development, there is an urgent need for systematic assessment and forecasting studies on how to combine physical, geographical, and socioeconomic factors to clarify patterns of change in the land use change and water supply–demand, as well as to respond appropriately to different climate and socioeconomic development scenarios in the future. Based on the Shared Socioeconomic Pathways-Representative Concentration Pathway (SSP-RCP) scenarios, a framework for simulating future land use change and assessing water supply–demand in the coupled SD-PLUS-InVEST model was constructed. The land use change in Guizhou Province from 2020 to 2050 was simulated using the SD-PLUS model, and the water supply–demand conditions were projected for 2030, 2040, and 2050 under multiple scenarios (SSP126, SSP245, and SSP585). The research results indicated that (1) The land use change in the study area has significant spatial heterogeneity. It showed similar trends in the land use change in the SSP126 and SSP245 scenarios, with both artificial surfaces and forest showing an expansion trend, but the expansion of forest was most typical in the southwestern region in the SSP126 scenario, and there is a significant increase in the northeastern region in the SSP245 scenario. Additionally, there is a rapid expansion of artificial surfaces in the central region in the SSP585 scenario, and a more rapid expansion of cultivated land in the southeastern region, with a significant increase in the area of water bodies. (2) The changes in water supply from 2020 to 2050 under the three scenarios show a smaller increase (5.22–11.88%), a significant increase in water demand (29.45–58.84%), and an increase in the area of water shortage by about 2708.94–9084.40 km2, with the extent of the shortage increasing by about 23.71–79.50%. (3) According to the results of the SSP-RCP scenario projections, socioeconomic development has a significant impact on the growth of water demand, and climate and land use change may exacerbate the spatiotemporal heterogeneity of water supply–demand in the karst region. The systematic study of land use change and water supply–demand in Guizhou can provide a scientific basis for the sustainable management of regional ecosystems and the rational allocation of land and water resources.

1. Introduction

The balance between supply and demand of water resources in the context of climate change is one of the key challenges for the achievement of the Sustainable Development Goals (SDGs), with profound impacts on regional or global ecosystems, human activities, and socioeconomic development [1,2,3,4,5]. Global or regional climate change and socioeconomic development influence land use changes [6,7,8]. At the same time, land use changes alter surface runoff and watershed hydrological processes, thereby significantly impacting the supply, demand, and spatial flow of water for production, livelihood, and ecological needs [9,10,11,12]. Climate change, socioeconomic development, and land use changes force changes in the current and future spatial-temporal patterns of water resources, thereby affecting water scarcity and the balance of water supply–demand. This leads to an exacerbation of the heterogeneity in the spatial-temporal distribution of available water resources and water demand, hindering sustainable development for both humans and the natural environment [13,14,15,16,17,18]. Therefore, the assessment of water supply–demand under climate change, socioeconomic development, and land use changes has become a hot topic.
Existing research has shown that climate change and socioeconomic development are the main factors influencing land use changes and water supply–demand changes [6,8,19,20]. The new round of the Coupled Model Intercomparison Project Phase 6 (CMIP6) includes the Shared Socioeconomic Pathways (SSPs) and Representative Concentration Pathways (RCPs). These scenarios, which use a lot of climate model data, give more accurate results and a wider range of possible future developments for climate change research [21,22]. Many scholars have used the SSP-RCP scenarios to predict changes in future water supply–demand [18,19,23]. For example, He et al. [18] utilized the scenario framework within the Scenario Model Intercomparison Project (ScenarioMIP) to quantify global urban water scarcity in 2016 and 2050 under four socioeconomic and climate change scenarios and explored potential solutions. Chen et al. [23] utilized population, dietary habits, and water supply–demand changes under different SSP-RCP scenarios to assess future food security risks, crop production, and water scarcity in China. Riddhi Singh et al. [19] used SSP-RCP scenarios to evaluate the impact of the climate and population on water resource availability in India at global warming levels of 1.5 °C, 2.0 °C, and 3.0 °C. However, due to the coarse resolution of the SSP-RCP scenario framework, most of these studies have focused on global or national-scale research on water supply–demand changes, making it difficult to effectively consider the consistent impact of local environmental variables such as regional-scale climate, population, economy, and land use changes to accurately predict the dynamic changes in regional water supply–demand [17]. Typically, dynamic simulations of land use changes under regional climate change and socioeconomic development scenarios are crucial for accurately assessing water supply–demand. In particular, land use changes, as important input parameters, can greatly influence the accuracy of hydrological model simulations of water yield as well as the precise estimation of spatial water demand [9,11,24,25]. However, previous models such as CLUE-S and CA-Markov, which have been used to simulate land use changes, cannot effectively identify socioeconomic development factors [25]. Therefore, researchers have proposed an integrated approach combining top–down system dynamics (SD) and bottom–up patch-generating land use simulation (PLUS) models for the dynamic simulation of land use changes [6].
The system dynamics (SD) model takes into account the non-linear relationships between climate, socioeconomic factors, and land use systems, allowing for better prediction of land use demands on different regional scales [8,26,27]. The land expansion analysis strategy (LEAS) model, which is based on random forests, and the cellular automaton model (CARS), which is based on multiple random patch seeds, are both part of the PLUS model. It demonstrates superiority in simulating the spatial distribution changes in various land uses at the patch scale [28]. It has also been shown that the InVEST Water Yield model is better than spatially explicit ecosystem service modelling tools like SWAT and ARIES when looking at scenarios of land use change. This model is commonly used in watershed or regional-scale water supply service studies [24,29,30]. Therefore, in order to comprehensively consider the impact of climate, socioeconomics, and land use on water supply–demand, this study selects consistent climate, population, and socioeconomic data under the SSP-RCP scenarios. The SD-PLUS-InVEST model is then integrated into a universal framework to simulate the dynamic changes in regional water supply–demand.
Guizhou Province is located in the largest, most typical, and ecologically fragile karst area in southern China, which is one of the world’s three major karst concentrated and contiguous regions. Due to the influence of factors such as monsoon climate, geological movements, and intense karst processes, the karst region in southern China has formed a binary three dimensional spatial structure on the surface and underground. This has resulted in spatial heterogeneity in land use changes and spatiotemporal heterogeneity in regional water resource distribution. The karst ecological environment in this area is characterized by slow soil formation rates, rugged terrain with steep slopes, severe soil erosion, and seasonal drought [31,32,33,34]. In recent decades, rapid economic development and urban expansion in the province, coupled with the implementation of karst ecological restoration and reconstruction projects such as desertification control, natural forest protection, and grain for green, have had a significant impact on the transformation of land use types such as built-up land, farmland, forestland, and grassland, as well as the distribution of water resources [35]. Therefore, the simulation of land use changes and quantitative assessment of water supply–demand are helpful in promoting regional ecological restoration and sustainable socioeconomic development.
This study takes Guizhou Province in China as an example and proposes a regional water supply–demand assessment framework based on climate change and socioeconomic development scenarios, integrating SSP-RCP scenarios, SD, PLUS, and InVEST models. This framework is of great value in clarifying regional land use changes and water supply–demand. The main research objectives are as follows: (1) Using the SD-PLUS model, with population, economy, and climate factors as variables, simulate land use changes in Guizhou Province from 2020 to 2050 under SSP126, SSP245, and SSP585 scenarios. (2) Utilize the InVEST Water Yield model and quota method, with climate change, socioeconomic development, and land use change under the SSP-RCP scenarios as input parameters, to predict water supply–demand under different scenarios. (3) Based on the assessment results of water supply–demand in Guizhou Province, provide policy suggestions for water resources’ management in karst areas to support sustainable development in the region.

2. Materials and Methods

2.1. Study Area

Guizhou Province (24°37′–29°13′ N, 103°36′–109°35′ E) is located in the hinterland of Southwest China, in the eastern part of the Yunnan–Guizhou Plateau. It is situated in the upper reaches of the Yangtze River and Pearl River basins. The province covers an area of 1.76 × 10⁵ km2 (Figure 1). The landforms in the province can be divided into three basic types: plateau mountains, hills, and basins. The terrain is higher in the west and lower in the east, with an average elevation of around 1100 m. Guizhou has a very typical karst landform development, with exposed carbonate rocks covering over 60% of the province’s area, earning it the moniker “Karst Province”. Guizhou Province has a subtropical humid monsoon climate, with an average annual temperature ranging from 14 to 16 °C and an average annual precipitation of 1100 to 1300 mm. The precipitation pattern is characterized by more precipitation in the southeast and less in the northwest [36,37]. According to the “Guizhou Province Water Resources Bulletin (2020)”, the total water resources in the province amounted to 1328.63 × 108 m3. The agricultural water usage accounted for 51.78 × 10⁸ m3, industrial usage accounted for 18.66 × 10⁸ m3, urban public usage accounted for 4.02 × 10⁸ m3, residential usage accounted for 13.97 × 10⁸ m3, and ecological environment usage accounted for 1.66 × 10⁸ m3. These figures correspond to 57.5%, 20.7%, 4.5%, 15.5%, and 1.8%, respectively, of the total water usage in the province.
As a typical ecologically fragile karst area in southern China, Guizhou Province, with its typical binary three-dimensional spatial structure of surface and subsurface and spatiotemporal heterogeneity of water resources, has experienced severe ecological degradation of rocky desertification in many places, which has severely hampered the sustainable development of its natural ecology and social economy, as well as directly threatened the ecological security of ecological barrier areas in the upper reaches of the Yangtze River and Pearl River basins. In recent years, Guizhou has experienced rapid social and economic development. As of 2020, the province’s population has reached 38.5621 million, and its GDP has reached 1782.656 billion yuan. As the economy and society of the entire province have been rapidly developing, significant changes have occurred in the land use and water supply–demand, posing daunting challenges to the process of sustainable development. Therefore, understanding how land use has changed, the spatiotemporal patterns, and the matching status of water supply–demand under the influence of climate change and socioeconomic development will provide a scientific basis for regional ecosystem management.

2.2. Data Sources

In this study, three scenarios from the SSP-RCP framework of CMIP6, namely SSP126, SSP245, and SSP585, were selected. Models such as SD, PLUS, and InVEST were used, along with various types of data, including physical geographic data and socioeconomic data. The detailed description and sources of the data are shown in Table 1.
(1)
The data used for the SSP-RCP scenarios include future climate, population, and GDP data. The latest version of the NASA Global Daily Downscaled Projections (NEX-GDDP-CMIP6) dataset is the data source for future climate change in this study. The downscaled products are generated using the Bias Correction and Spatial Disaggregation (BCSD) method at a spatial resolution of 0.25° × 0.25° [38]. The data required for calculating future potential evapotranspiration in water yield predictions include precipitation (pr), average temperature (tas), maximum temperature (tasmax), minimum temperature (tasmin), wind speed (sfcWind), shortwave solar radiation (rsds), and surface relative humidity (hurs). The consistency of the first variable level “r1i1p1f1” is ensured, and a total of 16 models are available, as detailed in Table 2. At the same time, in order to reduce the uncertainty from individual models, the equal-weighted average of the 16 models is used [25,39].
(2)
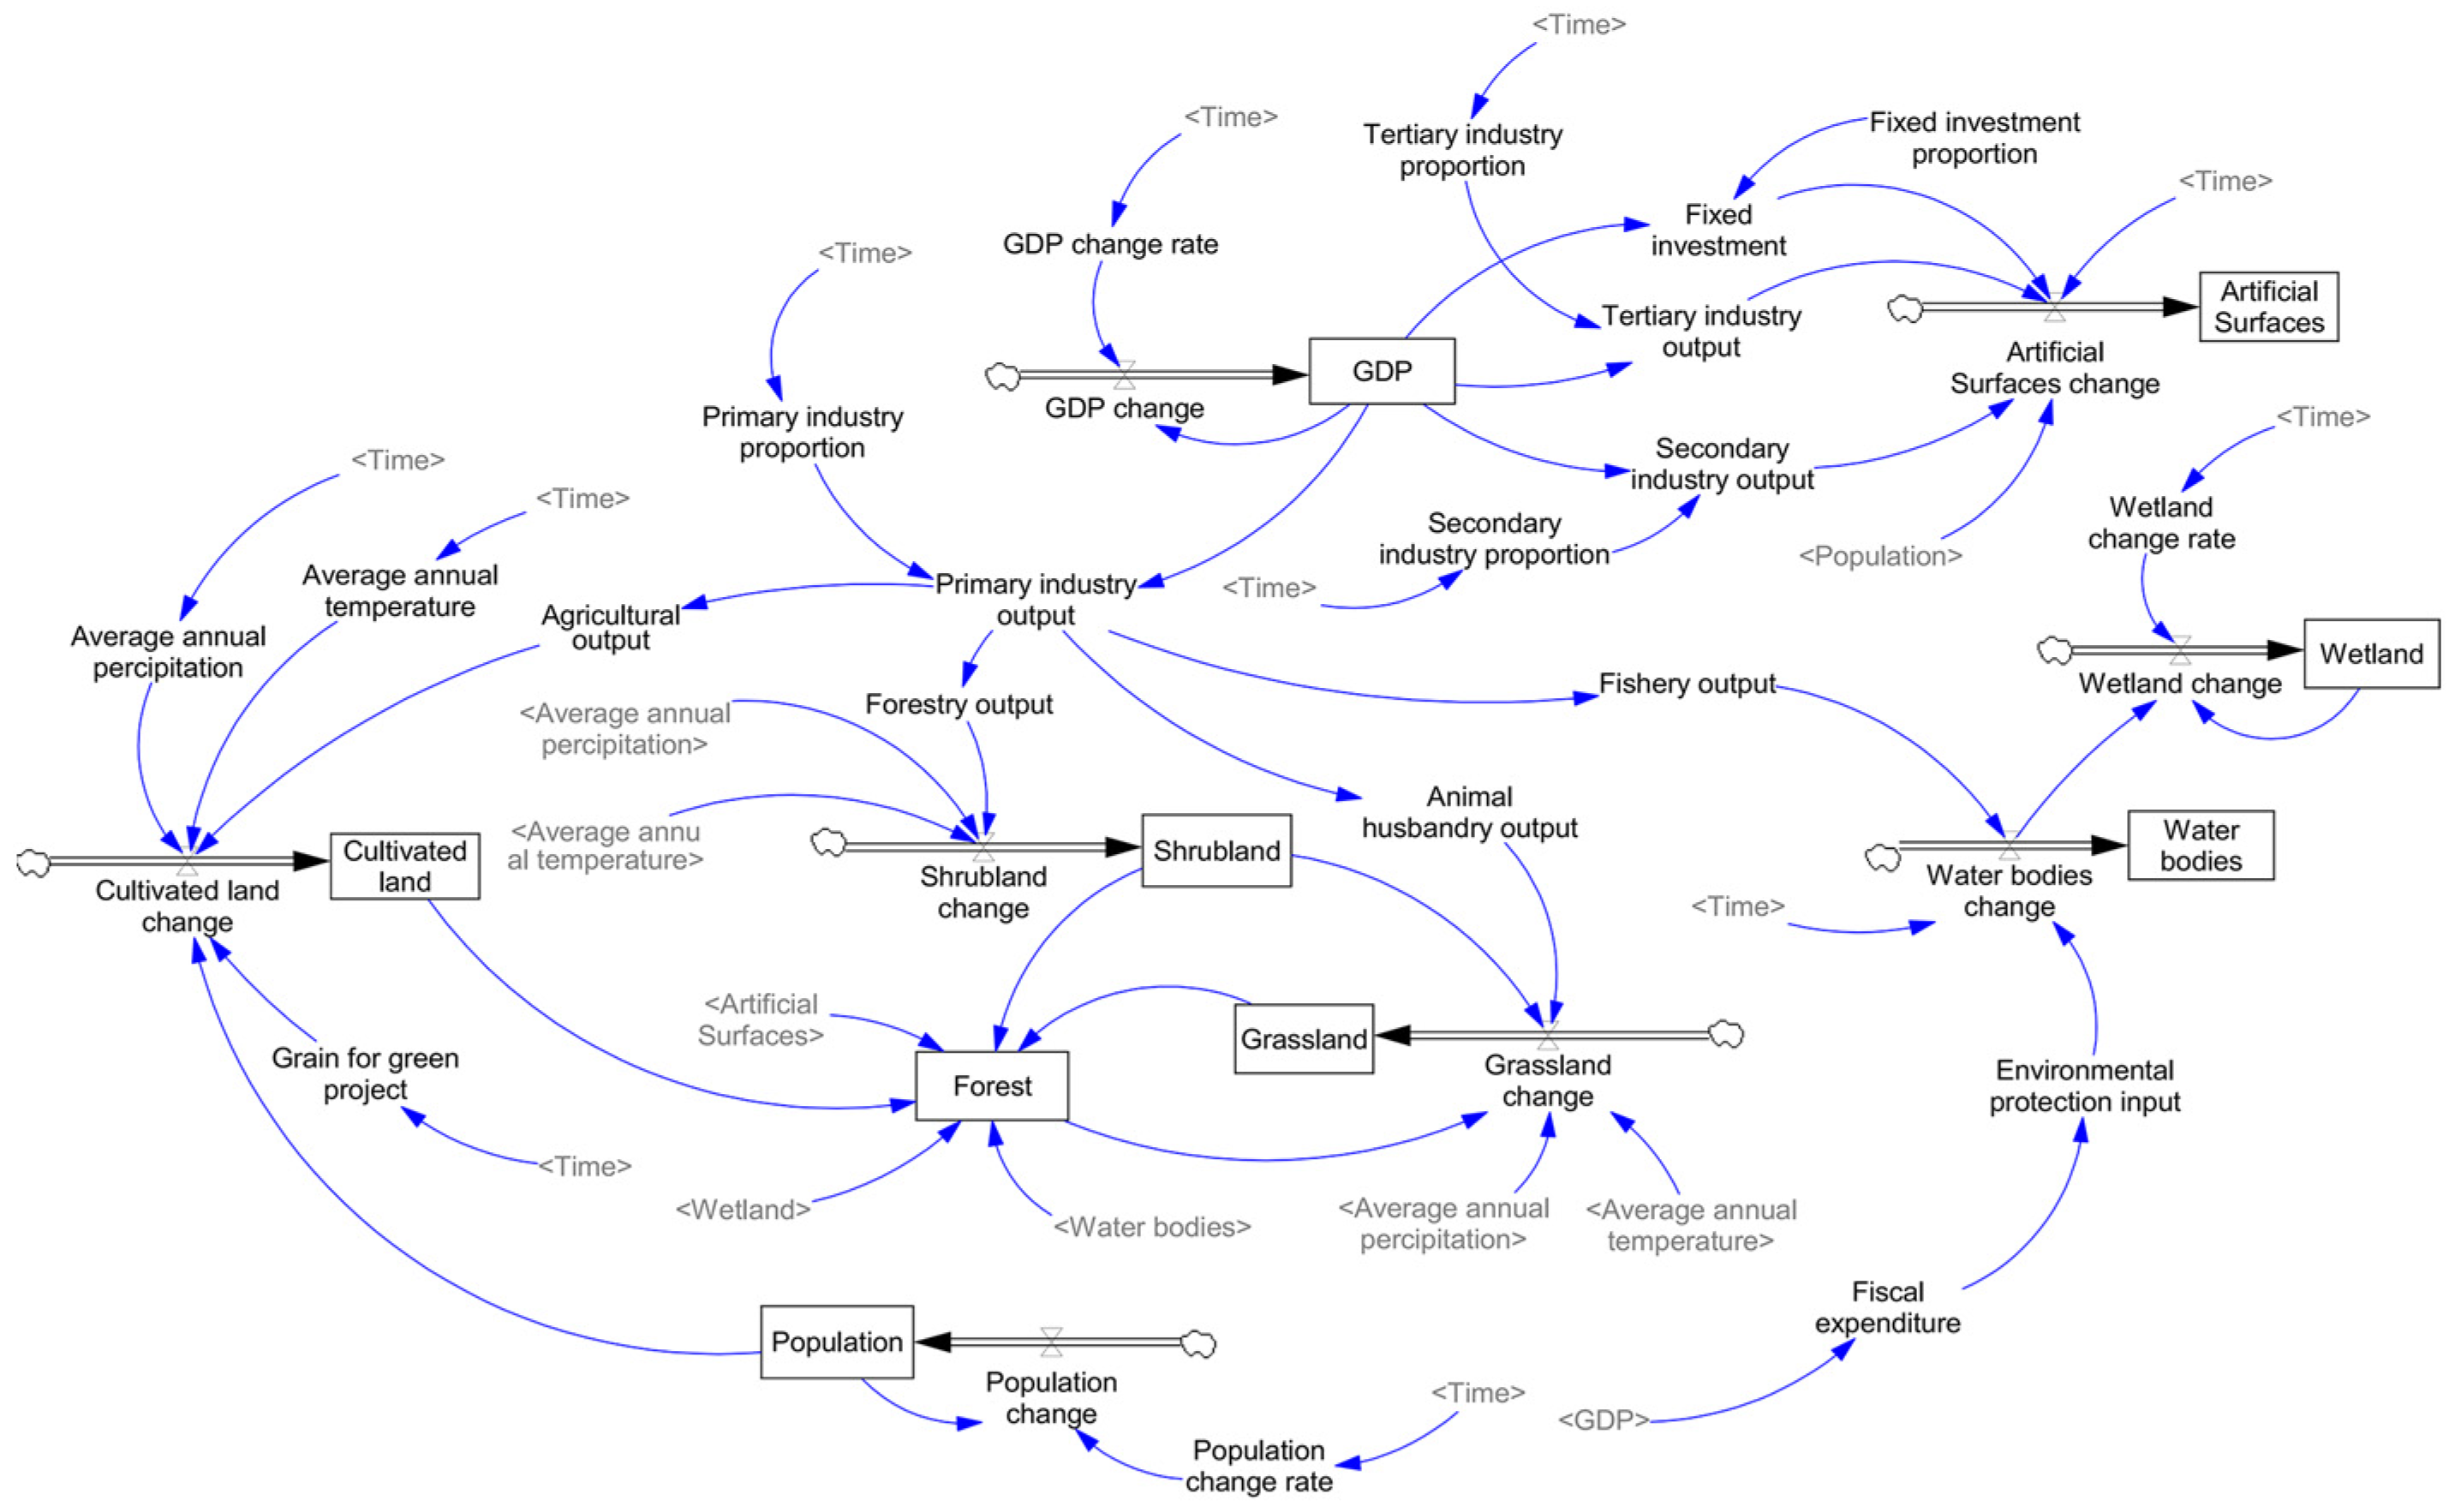
The data used in the SD model include land use data, socioeconomic data, and climate data.
(3)
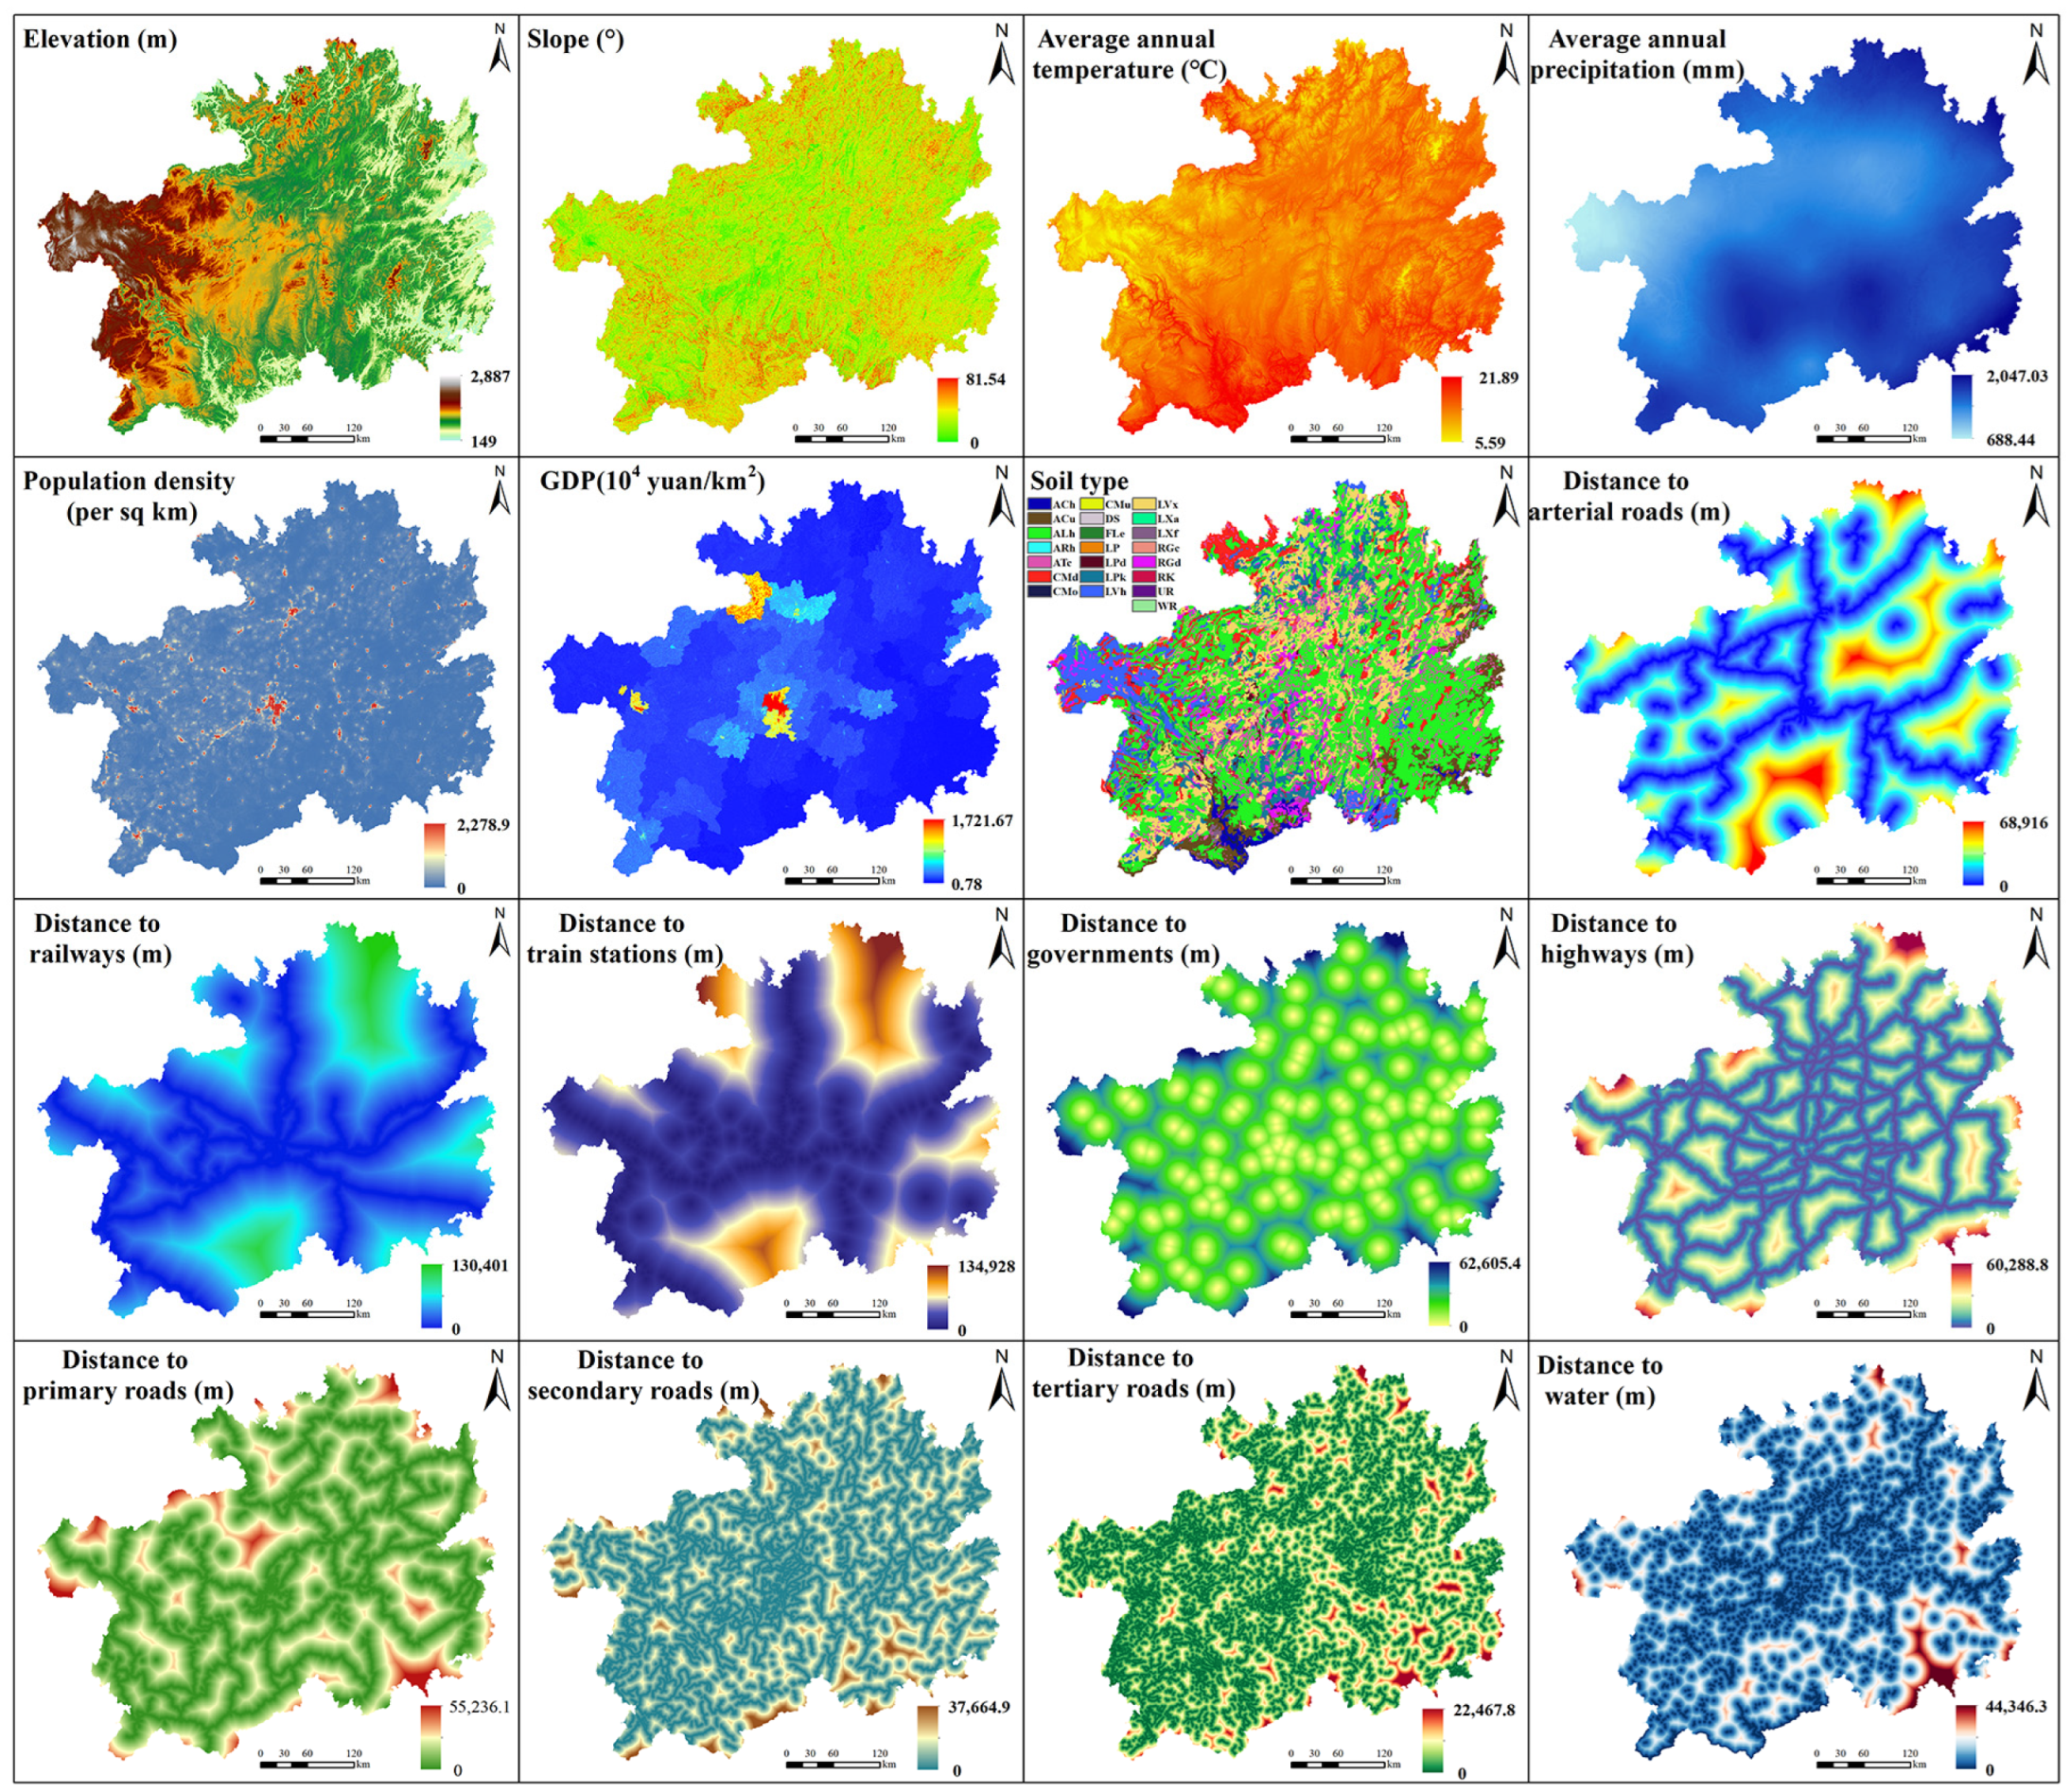
The data used in the PLUS model include land use data and driving factor data. This study utilized 16 land use change driving factors, including elevation, slope, average annual temperature, average annual precipitation, population density, GDP, soil type, distance to arterial roads, distance to railways, distance to train stations, distance to governments, distance to highways, distance to primary roads, distance to secondary roads, distance to tertiary roads, and distance to water.
(4)
The data used for water yield simulation and water demand calculation in the InVEST model include soil types, potential evapotranspiration, population, GDP, and water resource data. The soil type, population, and GDP data used are the same as those used in the PLUS model.
Table 1. Data sources and descriptions.
CategoryDataPeriodRources
Physical geographic dataLand use2000, 2010, 2020National Catalogue Service For Geographic Information (https://www.webmap.cn/mapDataAction.do?method=globalLandCover, accessed on 2 March 2023)
Digital elevation model (DEM)Geospatial Data Cloud (https://www.gscloud.cn/sources/index?pid=302, accessed on 2 March 2023)
Soil2013Food and Agriculture Organization of the United Nations Harmonized World Soil Database v 1.2 (https://www.fao.org/soils-portal/soil-survey/soil-maps-and-databases/harmonized-world-soil-database-v12/en/, accessed on 8 June 2022)
Distance to arterial roads2020OpenStreetMap (https://www.openstreetmap.org, accessed on 8 June 2022)
(https://download.geofabrik.de/, accessed on 15 October 2022)
Distance to railways2020
Distance to train stations2020
Distance to governments2020
Distance to highways2020
Distance to primary roads2020
Distance to secondary roads2020
Distance to tertiary roads2020
Distance to water2020
Meteorological factors2000~2020National Meteorological Science Data Center (http://data.cma.cn/, accessed on 5 January 2021)
Monthly potential evapotranspiration2000~2020National Earth System Science Data Center (http://www.geodata.cn, accessed on 5 January 2021)
NEX-GDDP-CMIP6 database2020~2050NASA Center for Climate Simulation (https://portal.nccs.nasa.gov/datashare/nexgddp_cmip6/, accessed on 17 December 2022)
Socioeconomic dataStatistical data (GDP&Population)2000~2020Guizhou Statistical Yearbook (https://www.guizhou.gov.cn/zwgk/zfsj/tjnj/, accessed on 7 July 2023)
Population projection2020~2050Provincial and gridded population projection for China under shared socioeconomic pathways from 2010 to 2100 [40]
GDP Projections2020~2050Gridded GDP Projections Compatible with the Five SSPs (Shared Socioeconomic Pathways) [41]
Population raster data2020WORLDPOP (https://www.worldpop.org/, accessed on 5 November 2023)
GDP raster data2019Resource and Environment Science and Data Center (https://www.resdc.cn/, accessed on 5 November 2023)
Per capita household water consumption2000~2020Guizhou Provincial Water Resources Bulletin (http://mwr.guizhou.gov.cn/, accessed on 7 July 2023)
Water consumption per 10,000 yuan GDP2000~2020
Per mu farmland irrigation consumption2000~2020
Table 2. List of the CMIP6 models from the NEX-GDDP-CMIP6 dataset used in this study.
ModelInstitution/CountryVariant
ACCESS-CM2CSIRO-ARCCSS/Australiar1i1p1f1
ACCESS-ESM1-5CSIRO/Australiar1i1p1f1
CanESM5CCCma/Canadar1i1p1f1
CMCC-ESM2CMCC/Italyr1i1p1f1
EC-Earth3EC-Earth-Consortium/European countriesr1i1p1f1
EC-Earth3-Veg-LREC-Earth-Consortium/European countriesr1i1p1f1
GFDL-ESM4NOAA-GFDL/USAr1i1p1f1
INM-CM4-8INM/Russiar1i1p1f1
INM-CM5-0INM/Russiar1i1p1f1
KACE-1-0-GNIMS-KMA/South Korear1i1p1f1
MPI-ESM1-2-HRMPI-M/Germanyr1i1p1f1
MPI-ESM1-2-LRMPI-M/Germanyr1i1p1f1
MRI-ESM2-0MRI/Japanr1i1p1f1
NorESM2-LMNCC/Norwayr1i1p1f1
NorESM2-MMNCC/Norwayr1i1p1f1
TaiESM1AS-RCEC/Taiwan, Chinar1i1p1f1

2.3. Methods

2.3.1. Research Framework

The research framework of this study is shown in Figure 2. Firstly, the required physical, geographical, and socioeconomic data are collected and processed based on the data requirements of each model. Secondly, scenario simulation parameters are set using climate and socioeconomic data under three future development scenarios of SSP126, SSP245, and SSP585 of SSP-RCP. The SD model is used to predict land use demand under different scenarios, while the PLUS model is used to simulate land use spatial patterns under different scenarios. Finally, the InVEST Water Yield model and the quota method are used to assess water supply–demand under future climate, socioeconomic development, and land use change scenarios.

2.3.2. SSP-RCP Scenarios

The latest SSP-RCP scenarios can better assess the impact of climate change policies by enhancing the coupling of socioeconomic factors, supporting integrated research in various fields, and deepening our understanding of the global interactions between climate and socioeconomic factors [21,42]. Common concentration pathways (RCPs) based on greenhouse gas emissions are combined with shared socioeconomic pathways (SSPs) that show how society and the economy will grow in the future as part of the Scenario Model Intercomparison Project (Scenario MIP). This is achieved through a set of SSP-RCP scenarios that represent the evolving socioeconomic and climate systems over time [21,42]. The study selected three typical scenarios, namely SSP126, SSP245, and SSP585, to simulate regional land use changes and evaluate water supply–demand under different climate change and socioeconomic scenarios.

2.3.3. SD Model

This study integrates the impacts of climate and socioeconomic factors on land use changes and constructs a dynamic model for the land use demand prediction system, which includes the economic subsystem, population subsystem, climate subsystem, and land use subsystem [6,8]. Based on land use, socioeconomic, and climate data from 2000 to 2020, this study analyzed the feedback and interactions among various subsystems and variables. Through multiple experiments, the changes in variables and their quantitative relationships were determined. Based on these results, a system dynamics model for land use change was constructed using Vensim PLE 8.1.0 software (Figure 3). The simulation period of the SD model is from 2000 to 2050, with a time step of 1 year. The accuracy of the simulation model was evaluated using historical data from 2020. The baseline year for the scenario simulation is 2021. By inputting population, GDP, temperature, and precipitation forecast data, the model simulates future land use demands under different scenarios. Among them, economic development will increase the inputs and outputs of construction, agriculture, forestry, animal husbandry, fishery, and environmental management, as well as promote the growth of artificial surfaces and changes in cultivated land, shrubland, grassland, and water bodies. Population growth often leads to an expansion of food demand and productive living space, indirectly affecting changes in the area of cultivated land and artificial surfaces. Long-term changes in climatic conditions such as temperature and precipitation affect vegetation growth, which in turn affects changes in cultivated land, forest, shrubland, and grassland. Each land use type change in the land use subsystem is influenced by a combination of socioeconomic and climatic conditions, as well as the competition between various land use types. For example, the expansion of artificial surfaces occupies cultivated land, forest, and grassland; the grain for green policy encourages the transformation of cultivated land into forest and grassland, and the ecological management project encourages the restoration of shrubland and grassland into forest.

2.3.4. PLUS Model

The PLUS model integrates a rule-mining framework based on a land expansion analysis strategy (LEAS) and a CA model based on multi-type random patch seeds (CARS) [30]. The model has been validated in the simulation of land use changes under multiple scenarios, and its results generally demonstrate high accuracy and reliability [24,43]. Using land use data from 2010 and 2020, this study picks 16 factors that cause land use change (Figure 4) and puts them into the PLUS model as predictive variables to find out how likely it is that different types of land use will develop. Then, using the land use data in 2010 as the simulation reference map, the PLUS model was run to obtain the simulation results of land use in 2020, and the simulation results were validated by using the Kappa coefficient (KC), Overall accuracy (OA), and Figure of merit (FoM) values, which can be calculated directly in the Validation module in the PLUS model and compared with the actual land use data in 2020. The KC, OA, and FoM values are continuous values between 0 and 1. When KC is greater than 0.75 and OA is close to 1, it indicates that the overall accuracy of the model simulation is high. The FoM value is generally small, which can be used to identify the accuracy of regional changes between the real land use pattern and the simulation results, and the larger the value is, the higher the consistency between the simulation results and the real land use pattern is. If the accuracy of the simulated results is sufficient, different scenarios of land use demand predicted by the SD model for 2030, 2040, and 2050 are inputted, and the PLUS model is run to predict the spatial changes in future land use.

2.3.5. InVEST Water Yield Model

In recent years, the InVEST model has been widely applied in studies on watershed or regional-scale water supply services [10,44]. In this study, the InVEST model’s water yield module was used to assess the regional water supply volume [45]. This module calculates the annual water yield for each grid unit based on the Budyko water–heat coupling equilibrium assumption and the annual average precipitation data. The calculation formula is as follows:
Y ( x ) = ( 1 A E T ( x ) P ( x ) ) × P ( x )
In the formula, Y ( x ) represents the annual water yield (mm) for the grid unit, A E T ( x ) represents the annual actual evapotranspiration (mm) for the grid unit, and P ( x ) represents the annual precipitation (mm) for the grid unit. The calculation formula for A E T ( x ) P ( x ) is as follows:
A E T ( x ) P ( x ) = 1 + P E T ( x ) P ( x ) 1 + ( P E T ( x ) P ( x ) ) w 1 / w
In the formula, P E T ( x ) represents the potential evapotranspiration (mm) for the grid unit and w ( x ) represents the non-physical parameter for the natural climate–soil properties [46]. The expression of w ( x ) proposed by Donohue et al. [47] is used as follows:
w ( x ) = Z A W C ( x ) P ( x ) + 1.25
In the formula, Z is an empirical constant, sometimes referred to as “seasonality factor”, representing hydrogeological characteristics and the seasonal distribution of precipitation, with typical values ranging from 1 to 30 [45,47]. This study calibrates the Z-value by comparing models and observations. A W C ( x ) is the volumetric (mm) plant’s available water content, and the calculation formula is as follows:
A W C ( x ) = M i n R e s t . l a y e r . d e p t h , r o o t . d e p t h · P A W C
In the formula, R e s t . l a y e r . d e p t h represents the soil depth at which root penetration is inhibited because of physical or chemical characteristics. R o o t . d e p t h often refers to the depth at which 95% of a vegetation type’s root biomass occurs. P A W C is the plant’s available water capacity, that is, the difference between the field capacity and the wilting point.
In addition, in the future, P E T will be calculated based on the NEX-GDDP-CMIP6 dataset using the Penman equation. Due to improvements in the physical calculation process, the Penman–Monteith equation is widely regarded as the most accurate method for the calculation of P E T [48]. Allen et al. (2006) [49] proposed the following form of the Penman–Monteith equation:
P E T = 0.408 Δ ( R n G ) + γ 900 T + 273 u 2 ( e s e a ) Δ + γ ( 1 + 0.34 u 2 )
where Δ is the slope of the saturation vapor pressure curve; T is the mean daily air temperature; e s is the saturation vapor pressure; R n is the net radiation; e a is the actual vapor pressure; G is the soil heat flux; γ is the psychrometric constant; and u 2 is the daily average wind speed at a 2 m height [49]. Use the equations described by Zotarelli et al. (2010) to obtain the parameter values required for the calculation of P E T based on the P-M formula [50].

2.3.6. Water Demand Calculation

Utilizing the quota method, it was possible to estimate the demand for water yield while accounting for resident demand, economic growth, and irrigation needs in agriculture [31,51,52]. The specific calculation formula is as follows:
W D ( i j ) = p o p ( i j ) × l i + g d p ( i j ) × m i + a g r ( i j ) × n i
p o p ( i j ) = p ( i j ) j = 1 n p ( i j ) × P O P i
g d p ( i j ) = g ( i j ) j = 1 n g ( i j ) × G D P i
In the formula, W D ( i j ) represents the water demand of the pixel in the i-th year and j-th element; p o p ( i j ) and g d p ( i j ) represents the calibrated population in the i-th year and j-th element, respectively; and a g r ( i j ) represents the cultivated land area in the i-th year and j-th element [24]. The future land layout is generated by simulating the PLUS model. l i , m i , and n i , respectively, represent the water consumption per capita in the i-th year, water consumption per 10,000 yuan GDP, and per mu farmland irrigation consumption. p ( i j ) and g ( i j ) represent the original population and GDP, respectively, of pixel j in the i-th year. P O P i and G D P i represent the annual population and GDP of the i-th year in the statistical yearbook and the forecast dataset, respectively.

2.3.7. Matching Relationship between Water Supply and Demand

In the analysis of the relationship between water supply and demand, the water supply–demand ratio ( W S D R ) is an important indicator for revealing the degree of their match [9]. In this study, due to significant differences in water resource availability among different watersheds, we use the logarithm of the water supply–demand ratio to reflect the spatial heterogeneity of the water supply–demand match [44]. The calculation is based on the equation:
W S D R = lg S x D x > 0 , s u r p l u s = 0 , b a l a n c e < 0 , s c a r c i t y
In the equation, S x and D x represent the water supply–demand of pixel x , respectively. When the value of W S D R is greater than 0, it indicates an excess supply of water that exceeds the demand. Conversely, when the value of W S D R is less than 0, it indicates insufficient water supply and a shortage of water resources. When the value of W S D R is 0, it represents a balance between water supply and demand.

3. Results

3.1. Land Use Change in the Study Area

Land use changes in Guizhou Province from 2000 to 2020 were shown in Table 3, with forest, cultivated land, and grassland dominating the land use types. From 2000 to 2010, the main changes in the land use change were characterized by a rapid increase in the area of wetland and artificial surfaces at an average annual rate of 2.5084% and 1.5784%, respectively, and a decrease in the area of cultivated land and water bodies at an average annual rate of 0.0722% and 1.2608%, respectively. Compared to the previous period, water bodies and artificial surfaces increased significantly from 2010 to 2020 with an average annual rate of 8.8791% and 26.9677%, respectively; wetland decreased rapidly at an average annual rate of 6.5182%; and forest, grassland, and shrubland decreased slightly. Overall, water bodies and artificial surfaces increased substantially from 2000 to 2020, wetland decreased at a faster rate, and the growth rates of cultivated land, forest, grassland, and shrubland decreased slightly. This suggests that the huge population movement and the rapid expansion of urban construction are important reasons for the significant increase in artificial surfaces and the decrease in arable land. The implementation of water resource management and watershed ecological management projects has contributed to the significant increase in water bodies.
In addition, the land use transition in Guizhou Province was also analyzed (Figure 5). The land use transition in Guizhou Province in 2000–2020 mainly manifested in the reciprocal transition between cultivated land, grassland, and forest. The transition from grassland to forest was the largest in 2000–2010 (164,283.75 hm2), followed by the transition from cultivated land to grassland (128,505.69 hm2) and from grassland to cultivated land (107,074.98 hm2) (Figure 5a). The area of grain for green was 71,423.28 hm2, of which 64,919.79 hm2 was transferred from cultivated land to forest, and 6503.49 hm2 was transferred from cultivated land to shrubland. The new wetland was mainly dominated by the conversion of cultivated land (822.42 hm2), followed by water bodies (653.49 hm2) and grassland (115.38 hm2); the new artificial surface area was mainly converted from cultivated land (10,724.67 hm2), grassland (7890.84 hm2), and forest (870.39 hm2). Furthermore, the decrease in water bodies was mainly due to the reciprocal transfer between water bodies and forest. The reduction in grassland area was mainly due to reciprocal transfers between grassland and forest and between grassland and cultivated land. Compared to 2000–2010, the land use transition in 2010–2020 was more drastic. The main feature was the drastic conversion between cultivated land, forest, and grassland, with the largest area of forest converted to cultivated land (449,714.88 hm2), followed closely by grain for green (282,529.98 hm2), forest converted to grassland (272,069.64 hm2), and grassland converted to forest (271,803.96 hm2) (Figure 5b). The area of grain for green in 2010–2020 (282,529.98 hm2) was about four times higher than in 2000–2010. The rapid increase in the area of artificial surfaces was mainly at the expense of the conversion of large areas of cultivated land (147,840.3 hm2), grassland (30,623.49 hm2), and forest (30,527.01 hm2). On the whole, the land use in the study area has changed rapidly, the contradiction between human and land is prominent, and the urbanization process is mainly characterized by the continuous decrease in cultivated land, grassland, and forest areas and their transfer to artificial surfaces. The implementation of karst desertification control and the grain for green project shows the characteristics of water bodies decreasing and then increasing, as well as the area of grain for green increasing rapidly.

3.2. Simulation of the Future Land Use Change

3.2.1. Accuracy Validation of SD-PLUS Model

Based on the land use area data from 2000 to 2020, the SD model was used to simulate the land use area in 2020. The simulated results of the land use area for each land use type in 2020 were compared with the actual data to verify the simulation accuracy of the SD model (Table 4). The results indicate that the simulated values of land use area for each land use type show small differences compared to the actual values, with a relative error of less than 3%. This suggests that the model has high simulation accuracy and can effectively simulate changes in the land use area.
Based on the land use data from 2010, the PLUS model was used to simulate the spatial layout of land use in 2020. The simulated results were compared with the actual data for 2020 (Figure 6). The results indicate that there is a high degree of consistency between the simulated and actual spatial distribution of land use, both overall and in the five selected areas. The overall simulation accuracy of the PLUS model is 89.06%, with a Kappa coefficient of 0.83 and a FoM value of 0.13. This suggests that the PLUS model has a high level of accuracy in simulating changes in the spatial layout of land use and can effectively capture such changes. Based on the SD-PLUS coupled model, the simulated results of land use area and spatial layout in the study area for the year 2020 effectively reflect the real dynamics of land use in the study area. The coupled model is suitable for simulating future land use changes in the study area.

3.2.2. Prediction of Land Use Demand and Simulation of the Future Distribution of Land Use

By incorporating appropriate parameters within the SD model under distinct climate change and socioeconomic scenarios, we can obtain projections for land use demand in 2030, 2040, and 2050 (Figure 7). The results show significant differences in future land use demand under different SSP scenarios. By 2050, cultivated land, shrubland, and grassland show a decreasing trend in all three SSP scenarios, while forest, wetland, water bodies, and artificial surfaces show an increasing trend. Cultivated land and shrubland decrease the most under the SSP585 scenario, while grassland decreases the most under the SSP126 scenario. By 2050, cultivated land, shrubland, and grassland will have maximum decreasing percentages of 5.01%, 0.96%, and 4.93%, respectively. Forest shows the highest growth under the SSP245 scenario, while wetland increases the most under the SSP126 scenario. Water bodies and artificial surfaces increase the most under the SSP585 scenario. By 2050, forest, wetland, water bodies, and artificial surfaces will have maximum increasing percentages of 3.68%, 17.96%, 91.53%, and 41.39%, respectively.
The predicted results of land use demand under different climate change and socioeconomic scenarios were inputted into the PLUS model. Based on the land use data from 2020, the spatial distribution of future land use under different scenarios in 2030, 2040, and 2050 was predicted (Figure 8). The results indicate that under the SSP126 scenario, there is a moderate expansion of artificial surfaces, which occupies cultivated land and shrubland. Grassland in the southwestern region of Guizhou has been converted into forest, leading to a significant reduction in grassland area. Under the SSP245 scenario, the expansion of artificial surfaces is relatively slow. Various measures, such as the conversion of cultivated land back into forested areas, have been implemented, leading to the transformation of cultivated land into forest. Forest has significantly increased, especially in the northeastern region of Guizhou. Under the SSP585 scenario, there is rapid expansion of artificial surfaces in the central region of Guizhou, leading to a decrease in cultivated land, shrubland, and grassland. Due to increased investment, a considerable portion of forest in the southeastern region of Guizhou has been converted into cultivated land, and the area of water bodies has significantly increased compared to the current situation.

3.3. Assessment of Water Supply–Demand under Future Scenarios

3.3.1. Water Supply and Spatiotemporal Changes

The Z-value is an important seasonal constant in the InVEST Water Yield model [24]. According to the “Guizhou Province Water Resources Bulletin” from 2000 to 2020, the annual average surface water resources in Guizhou Province were 1009.30 × 108 m3. In this study, when the Z-value was set to 7, the simulated water yield in Guizhou Province in 2020 derived from the InVEST Water Yield model was 1002.82 × 108 m3, which is close to the average surface water resources. Future climate change data and land use change simulation results were input into the InVEST model to assess the changes in water yield from 2020 to 2050 under different scenarios. As shown in Figure 9, the water yield varies under different scenarios. In the SSP126 and SSP585 scenarios, the water yield shows a continuous increasing trend. The water yield increases from 1002.82 × 108 m3 in 2020 to 1121.95 × 108 m3 (SSP126) and 1116.30 × 108 m3 (SSP585) in 2050, with an increase of 119.13 × 10⁸ m3 and 113.48 × 10⁸ m3, respectively. The increase in water yield by 2050 under the three scenarios ranges from approximately 5.22% to 11.88%. Compared to the SSP126 scenario, the increase in water yield under the SSP585 scenario is slightly lower. According to the SSP245 scenario, the water yield initially shows a decreasing trend before increasing. Compared to 2020, the water yield decreases by 65.59 × 10⁸ m3 in 2030 but increases by 52.30 × 10⁸ m3 by 2050. By comparing the predicted water yield graph with the 2020 data, the spatial differentiation of water yield changes under different scenarios can be explored (Figure 10 and Figure 11). As shown in Figure 10, under the SSP126, SSP245, and SSP585 scenarios, the high water yield areas are located in the southeastern part of Guizhou Province, while the low water yield areas are located in the northwestern part of Guizhou Province. The water yield changes under the SSP126 scenario are similar to those under the SSP585 scenario, while the increase in water yield under the SSP245 scenario is slightly smaller. In comparison, the water yield under the SSP585 scenario shows a significant increase. As shown in Figure 11, in future scenarios, the regions with an increased water yield are mainly concentrated in the northern and northwestern parts of Guizhou Province, while the regions with a decreased water yield are mainly concentrated in the central and southwestern parts of Guizhou Province. The water supply in the study area showed a decreasing trend from northeast to southwest, especially in the Guiyang-Anshun urban agglomeration and the Kaili-Duyun urban agglomeration, which formed two typical water supply decreasing areas. From the comparative analysis of the three scenarios, SSP126, SSP245, and SSP585, the change in water supply showed a drastic change under SSP126, a slow change under SSP585, and an intermediate situation under SSP245. Overall, the change in water supply was generally consistent with the changes in precipitation patterns.

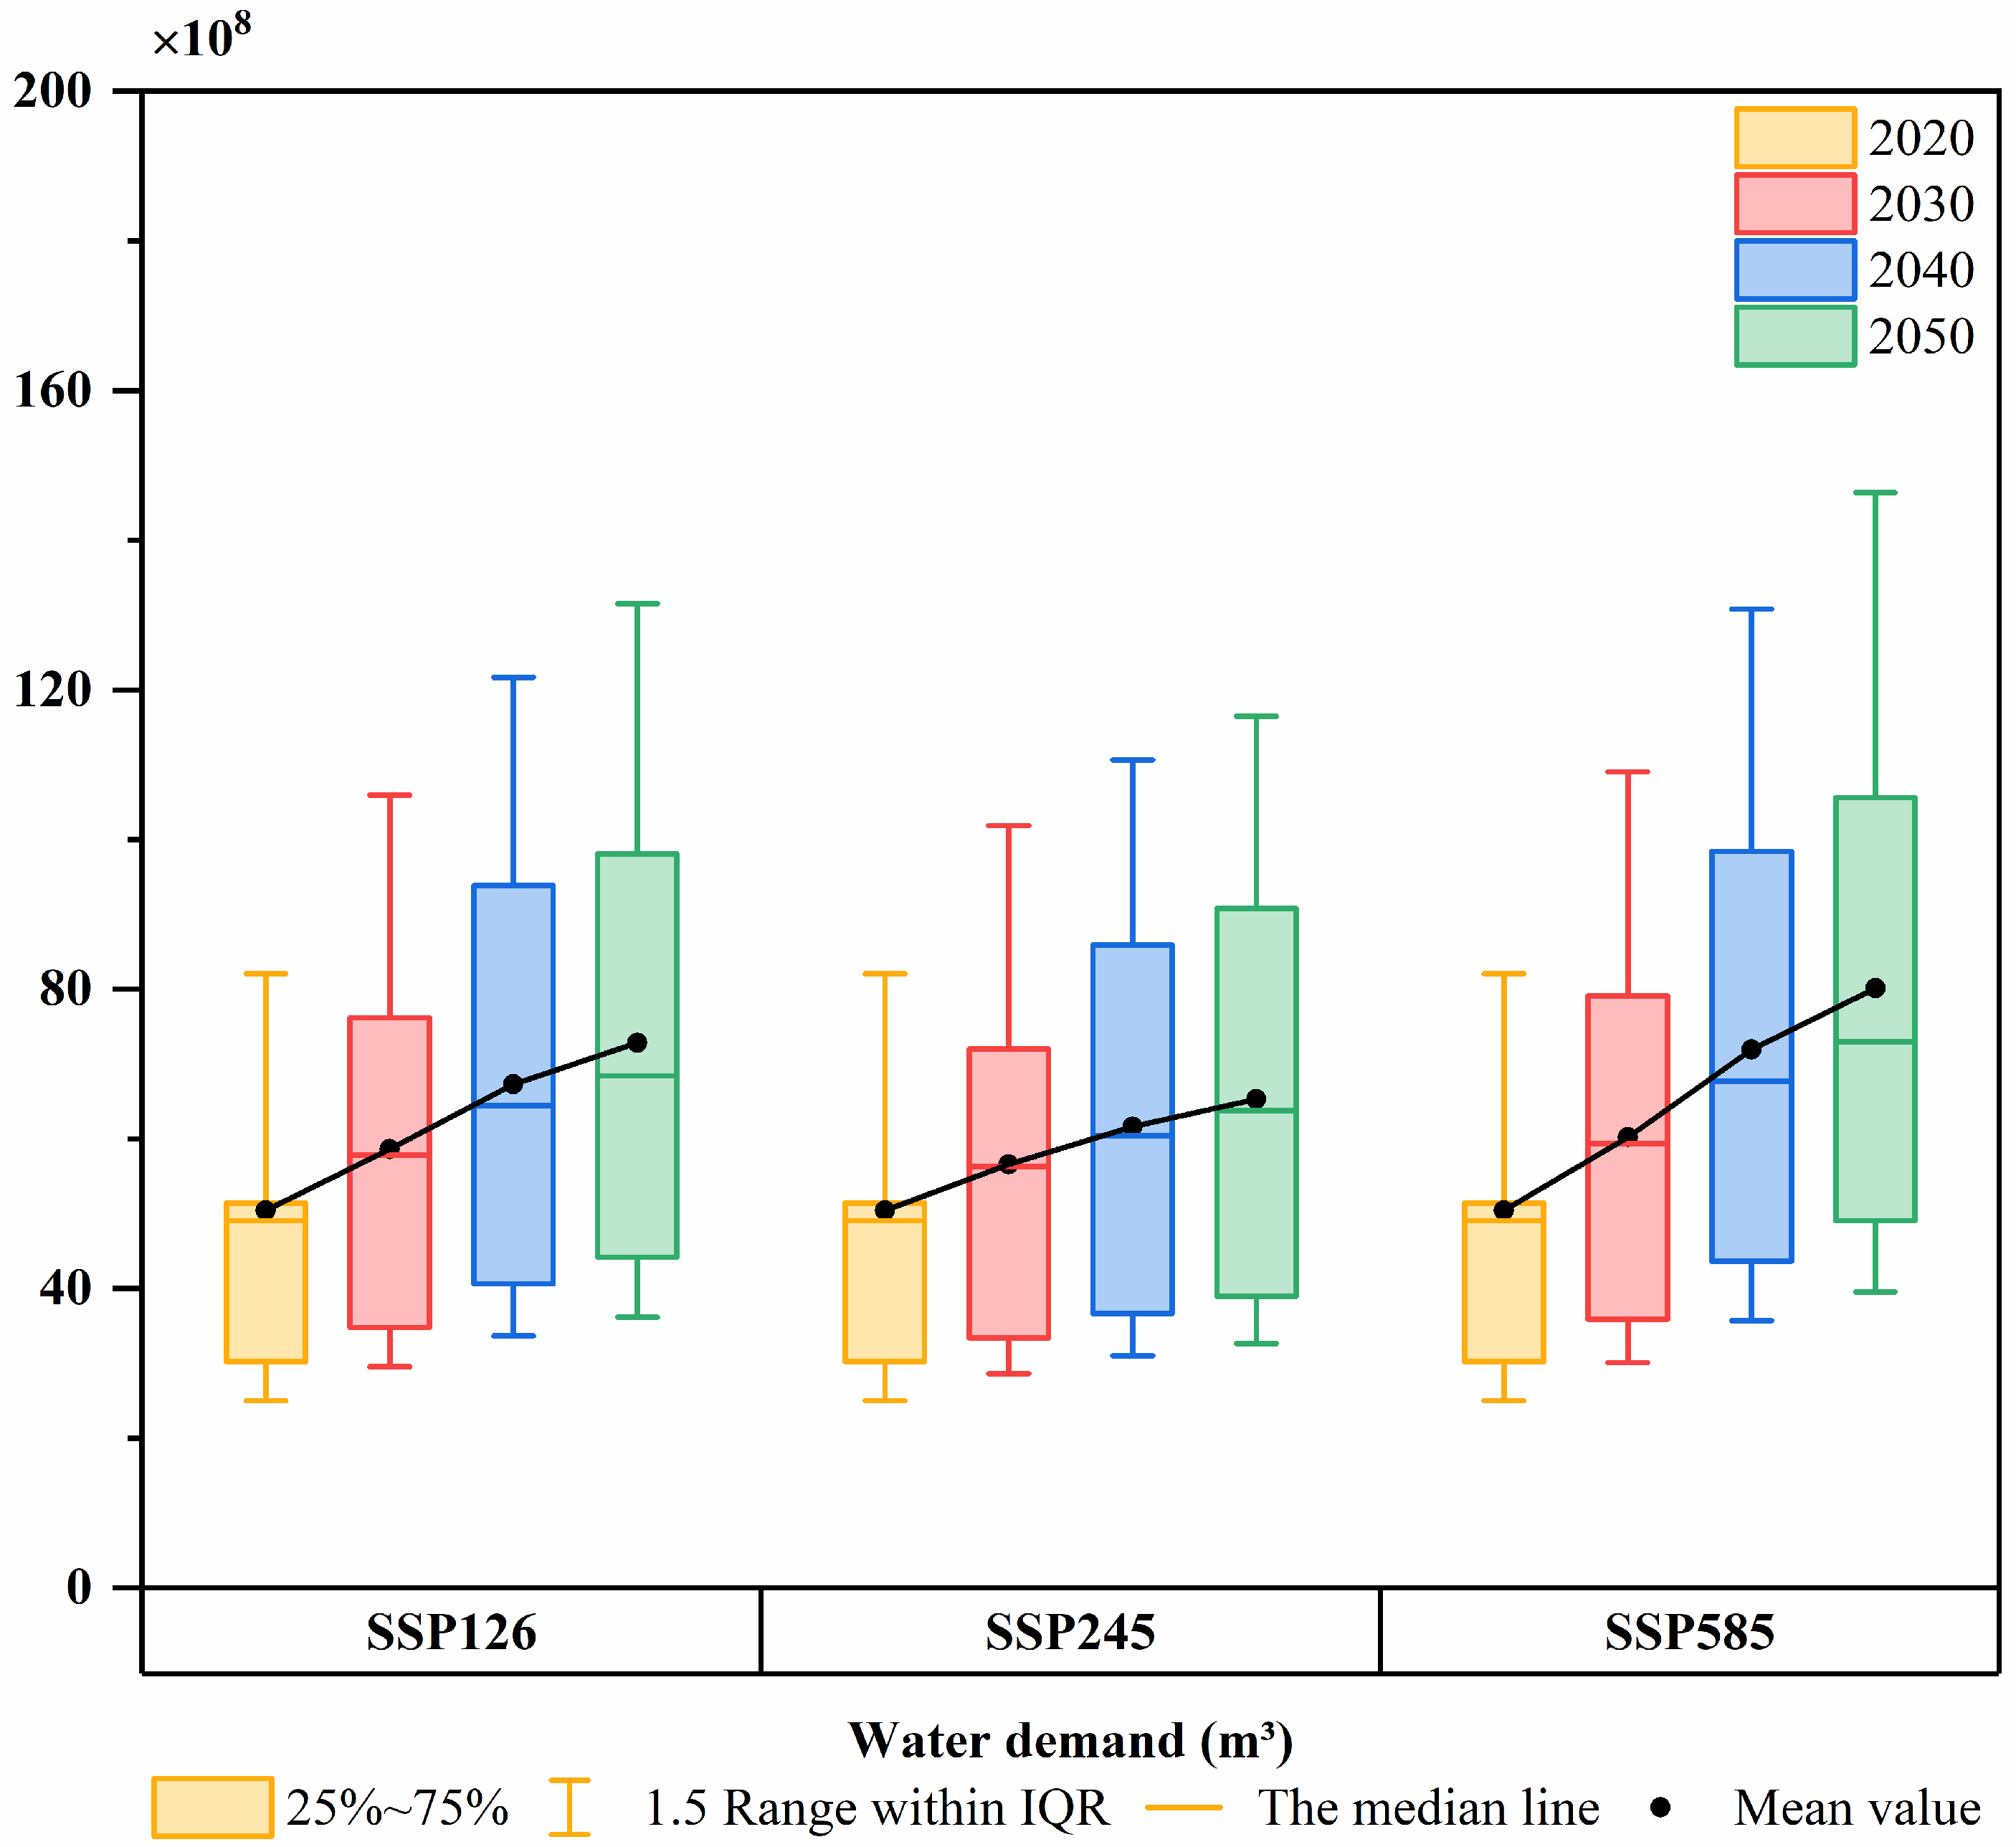
3.3.2. Water Demand and Spatiotemporal Changes

Based on future socioeconomic data and simulations of land use changes, the changes in water demand from 2020 to 2050 under different scenarios were evaluated. As shown in Figure 12, the water demand varies under different scenarios. In all three scenarios, the water demand shows a continuous, increasing trend. The water demand increases from 453.97 × 10⁸ m3 in 2020 to 655.43 × 10⁸ m3 (SSP126), 587.68 × 10⁸ m3 (SSP245), and 721.10 × 10⁸ m3 (SSP585) in 2050, representing an increase of 201.46 × 10⁸ m3, 133.71 × 10⁸ m3, and 267.13 × 10⁸ m3, respectively. The total water demand increases significantly by approximately 29.45–58.84%. Figure 13 shows the trends in water demand for different types of water use (agricultural irrigation, residential, and economic development) in the study area. The increasing trend in water demand due to socioeconomic development is evident, especially in the SSP585 scenario. By comparing the projected water demand with the data from 2020, the spatial variations in water demand changes under different scenarios are explored (Figure 14 and Figure 15). As shown in Figure 14, in the SSP126, SSP245, and SSP585 scenarios, high water demand areas are located in the built-up areas of the central Guizhou urban cluster and in regions with concentrated cultivated land distribution. Low-water-demand areas are located in the mountainous regions of eastern and southern Guizhou, which are predominantly covered by forests and grasslands. In contrast to the SSP126 and SSP245 scenarios, the SSP585 scenario exhibits a substantial surge in water demand. Nevertheless, this scenario also reveals an expansion in the areas experiencing a decrease in water demand, reflecting the unequal pattern of regional socioeconomic development. As shown in Figure 15, in future scenarios, the increase in water demand will be mainly concentrated in urban expansion areas and agricultural development areas in southeastern Guizhou. On the other hand, the decrease in water demand is mainly concentrated in ecological land areas such as forests and grasslands. The variation in water demand is significantly influenced by socioeconomic development. Changes in the land use, particularly the development of agricultural land and the implementation of ecological restoration projects such as afforestation, also contribute to the spatial and temporal patterns of water demand.

3.4. Matching Relationship between Supply and Demand

The spatial changes in the regional water supply–demand ratio (WSDR) is shown in Figure 16. In this study, the natural breakpoints method was used to categorize WSDR into four levels, namely severely imbalanced (Level I), slightly imbalanced (Level II), slightly surplus (Level III), and oversupply (Level IV) [29,44]. As shown in Figure 16 and Figure 17, the spatial distribution of WSDR overall exhibits a strong regularity, but there are local differences in different years and scenarios. There is a clear boundary between the western and northern regions of Guizhou and the eastern and southern regions, distinguishing areas with water scarcity from areas with surplus. The regions with severe imbalances between water supply and demand are concentrated in the built-up areas of Guiyang, Zunyi, and Liupanshui cities in the central urban circle of Guizhou. The regions with a slight imbalance are mainly distributed in the high-altitude areas of northwest Guizhou. The regions with surplus water resources are concentrated in the mountainous areas of eastern and southern Guizhou. Under the future scenarios from 2020 to 2050, the proportion of water scarcity areas is trending to expand. For example, under the SSP585 scenario, the proportion of severely imbalanced areas (Level I) increased from 1.48% to 3.40%, and the proportion of slightly imbalanced areas (Level II) increased from 5.02% to 8.24%. The proportion of regions with surplus water resources significantly decreased. For example, under the SSP585 scenario, the proportion of oversupplied areas (Level IV) decreased from 31.04% to 15.97%. As shown in Figure 17, compared to 2020, the water scarcity area in the study area is projected to increase by approximately 2708.94–9084.40 km2 in 2050, with the scarcity range expanding by approximately 23.71–79.50%. The regions with decreased water yield and increased water demand overlap, exacerbating the imbalance between water supply and demand. It is expected that more areas will face the risk of water scarcity.

4. Discussion

4.1. Changes in the Land Use and Water Supply–Demand under Different Future Scenarios

In this study, 16 driver factors of land use change were selected and, apart from physical geographic factors such as elevation, slope, temperature, precipitation, and soil type, the remaining 11 factors are related to human socioeconomic activities to varying degrees. From the land use changes in Guizhou Province from 2000 to 2020, socioeconomic factors play a major driving role, and socioeconomic factors are important factors affecting the land use of artificial surfaces in Guizhou, which is closely related to the continued substantial growth of artificial surfaces. Climatic factors such as temperature and precipitation play a crucial role in determining the amount of surface runoff in the study area, which influences the spatial distribution pattern of land use types such as cultivated land, forest, shrubland, grassland, wetland, and water bodies. It is therefore crucial to incorporate socioeconomic development and climate change factors into projections of future land use. The future land use changes in the study area under the three climate change and socioeconomic development scenarios of SSP126, SSP245, and SSP585 have significant spatial heterogeneity. Under the three scenarios, there are different changes in artificial surfaces, cultivated land, forest, and grassland. Upon comparing the fluctuations in artificial surfaces, cultivated land, forest, and grassland across the three scenarios, it becomes apparent that artificial surfaces’ expansion is primarily driven by socioeconomic development and population growth within the ambit of the economic growth scenario [6,8]. The decrease in cultivated land is mainly influenced by urbanization and ecological restoration, such as converting cultivated land back to forest [35]. The rise in forest can predominantly be ascribed to karst ecological restoration and reconstruction efforts, bolstered by a lower economic growth rate and stable climatic conditions that foster the flourishing of forested areas [6,35]. The main reasons for the decrease in grassland area are land occupation for cultivation and the increase in forest [35]. In conclusion, different scenarios of socioeconomic development have a profound impact on land use changes.
Under the future scenario, the spatial pattern of water supply is similar to the change trend of precipitation, showing a decreasing trend from northeast to southwest, and the water supply increases by about 5.22–11.88%. Climate change mainly affects regional water yield, which is consistent with previous research findings [19,29,53]. During the study period, population and economic growth have led to rapid urbanization expansion in Guizhou, especially under the SSP585 scenario. The rapid development of the social economy has significantly increased the demand for water in areas such as domestic, industrial, and agricultural sectors by approximately 29.45–58.84%. Socioeconomic development primarily affects regional water demand, and this has been confirmed by previous research [19,53,54]. Under future scenarios, as land use transitions from cultivated lands, forests, grasslands, etc., to artificial surfaces, regional water yield slightly increases, and the impact of land use change on water yield in the study area is not significant. However, land use change leads to a significant increase in water demand for industrial, agricultural, and domestic use, especially in urbanized areas where water demand growth far exceeds changes in water supply. This research finding aligns with prior studies [9,11,24,29]. Our research results further indicate that although water yield in Guizhou is projected to increase from 2020 to 2050 under different SSP scenarios, the significant growth in socioeconomic development leads to increased water demand. Climate and land use changes may exacerbate the spatiotemporal heterogeneity of water supply–demand in the karst mountainous region.

4.2. Water Supply–Demand Mismatch under Different Scenarios

Under different SSP scenarios, the water supply–demand in Guizhou Province exhibit complex spatiotemporal patterns. Water supply primarily originates from mountainous areas in eastern and southern Guizhou, while water demand is concentrated in urbanized and industrialized areas in central and northern Guizhou. This indicates a spatial mismatch between water supply and demand in Guizhou. This finding has been confirmed by numerous studies [24,29,44]. Under different climate models and socioeconomic pathways, there are significant differences in the future distribution patterns of land use in the study area, which further leads to a mismatch between water supply and demand. In the SSP126 ecological conservation scenario, with moderate population and economic growth, the expansion of artificial surfaces is slowed down, and the ecological restoration increases the area of forests and grasslands. The areas with water supply shortages are concentrated in the central urban areas. Under the SSP245 natural development and SSP585 economic growth scenarios, the population and economy in urban areas develop rapidly. The cultivated land in rural areas increases to meet the food demand of residents, which intensifies the mismatch between water supply and demand. The areas with excessive water supply in Qiandong and Qiannan decrease significantly, while the areas with water shortages in Qianzhong and Qianxinan show an expanding trend. The research results further affirm the conclusion that climate, socioeconomic development, and land use change collectively exacerbate the imbalance between water supply and demand. Even in water-rich regions like Guizhou, there is still a risk of localized water scarcity [20,44,54].

4.3. Suggestions of Water Resource Utilization and Management

As a typical karst mountainous region, Guizhou is one of China’s key ecological conservation areas. Its complex physical geographical features and socioeconomic activities make its fragile ecological environment prone to damage. Therefore, it is imperative to strategically plan socioeconomic development, optimize the structure of land use, and address the scarcity of water resources. This multifaceted approach will not only facilitate the restoration of the karst ecology, but also foster sustainable, economic, and social progress. The research results indicate that water scarcity in Guizhou Province will continue to worsen from 2020 to 2050 under all climate change and socioeconomic scenarios. By 2050, it is projected that 11.64% of the province’s land area and a majority of the urban population will be at risk of water scarcity. To mitigate the adverse impacts of water scarcity, it is necessary to implement diverse adaptation and mitigation measures. Firstly, in response to the increasing human water demand brought about by urbanization and industrialization, measures, such as promoting water conservation awareness, improving water use efficiency, controlling population growth, and optimizing water resource allocation, can help alleviate water scarcity in urban and industrial areas [18,54]. Secondly, we should coordinate the matching of water resources between cultivated land cultivation and ecological restoration in karst areas, adjust the type of land use in water shortage areas, reduce the demand of irrigation for cultivated land cultivation, and focus on the restoration of forest and grass vegetation. Measures such as developing water-saving ecological agriculture and adjusting agricultural planting structures in agricultural areas can also be taken to enhance vegetation diversity and conserve water sources [24,55]. Furthermore, given the distinctive hydrogeological characteristics, distribution, and variability of surface water resources in karst regions, it becomes imperative to prioritize the development of water infrastructure. This crucial step will address the engineering water scarcity challenges prevalent in karst areas. Implementing a series of techniques for surface water resource utilization, such as water collection, water conservation, and water storage, will increase the available water quantity and help alleviate water scarcity in karst regions [56].

4.4. Strengths and Limitations

This study utilized the coupled models of SD, PLUS, and InVEST to simulate the spatiotemporal transformations in the land use as well as the supply–demand of water. These simulations were conducted based on various SSP-RCP scenarios provided by CMIP6. It provides a new method for assessing water supply–demand under different climate, socioeconomic, and land use change scenarios in the future. To ensure the accuracy and relevance of our predictions, we relied on the latest NEX-GDDP-CMIP6 downscaled products. These, along with population and GDP forecast data, were utilized in accordance with the shared SSP socioeconomic pathways. As a result, we were able to generate meaningful projections regarding future land use demand and spatial distribution patterns. Based on this, we constructed a dataset of future climate (temperature, precipitation, and potential evapotranspiration), socioeconomic (population, GDP), and land use change suitable for localized SSP-RCP scenarios. This dataset was used for a coupled assessment of regional water supply–demand. These data and methods can more accurately predict the spatial and temporal distribution of regional future water supply–demand, providing a more reliable assessment of regional water supply–demand shortages.
This study also has certain limitations that need further improvement. Firstly, our research methodology for assessing water supply–demand is limited to annual time scales and fails to adequately consider time scales such as monthly and quarterly. For example, water availability (seasonal variations in precipitation) or water demand (crop irrigation periods) may ignore seasonal shortages in regional water supply–demand. It is necessary to adopt a more refined time scale in future research to evaluate seasonal water supply–demand conditions. Secondly, our water supply–demand assessment framework did not consider the flow of water supply services, which may affect the results of the water scarcity assessment. In future research, it is possible to further integrate water supply, demand, and spatial flow to make the simulation results of water supply–demand more realistic. Additionally, our study only examined three widely used and representative climate change and socioeconomic development scenarios: SSP126, SSP245, and SSP585. Future studies could consider more SSP-RCP scenarios and changes in water use efficiency across all sectors over time, as well as combine historical studies with multiple predictive models to improve the accuracy of water supply–demand assessment results for application to possible future scenarios in the region.

5. Conclusions

This paper proposes an integrated framework combining SD, PLUS, and InVEST models under the SSP-RCP scenarios and applies it to Guizhou Province. We use the coupled SD, PLUS, and InVEST models to first simulate regional future land use changes. Then, we put in future rules for climate, society, and land use change that apply to localized SSP-RCP scenarios and simulated future water supply–demand for the SSP126, SSP245, and SSP585 scenarios. We investigate the spatiotemporal characteristics of water supply–demand changes and the matching patterns in the region. The following research conclusions are obtained:
(1)
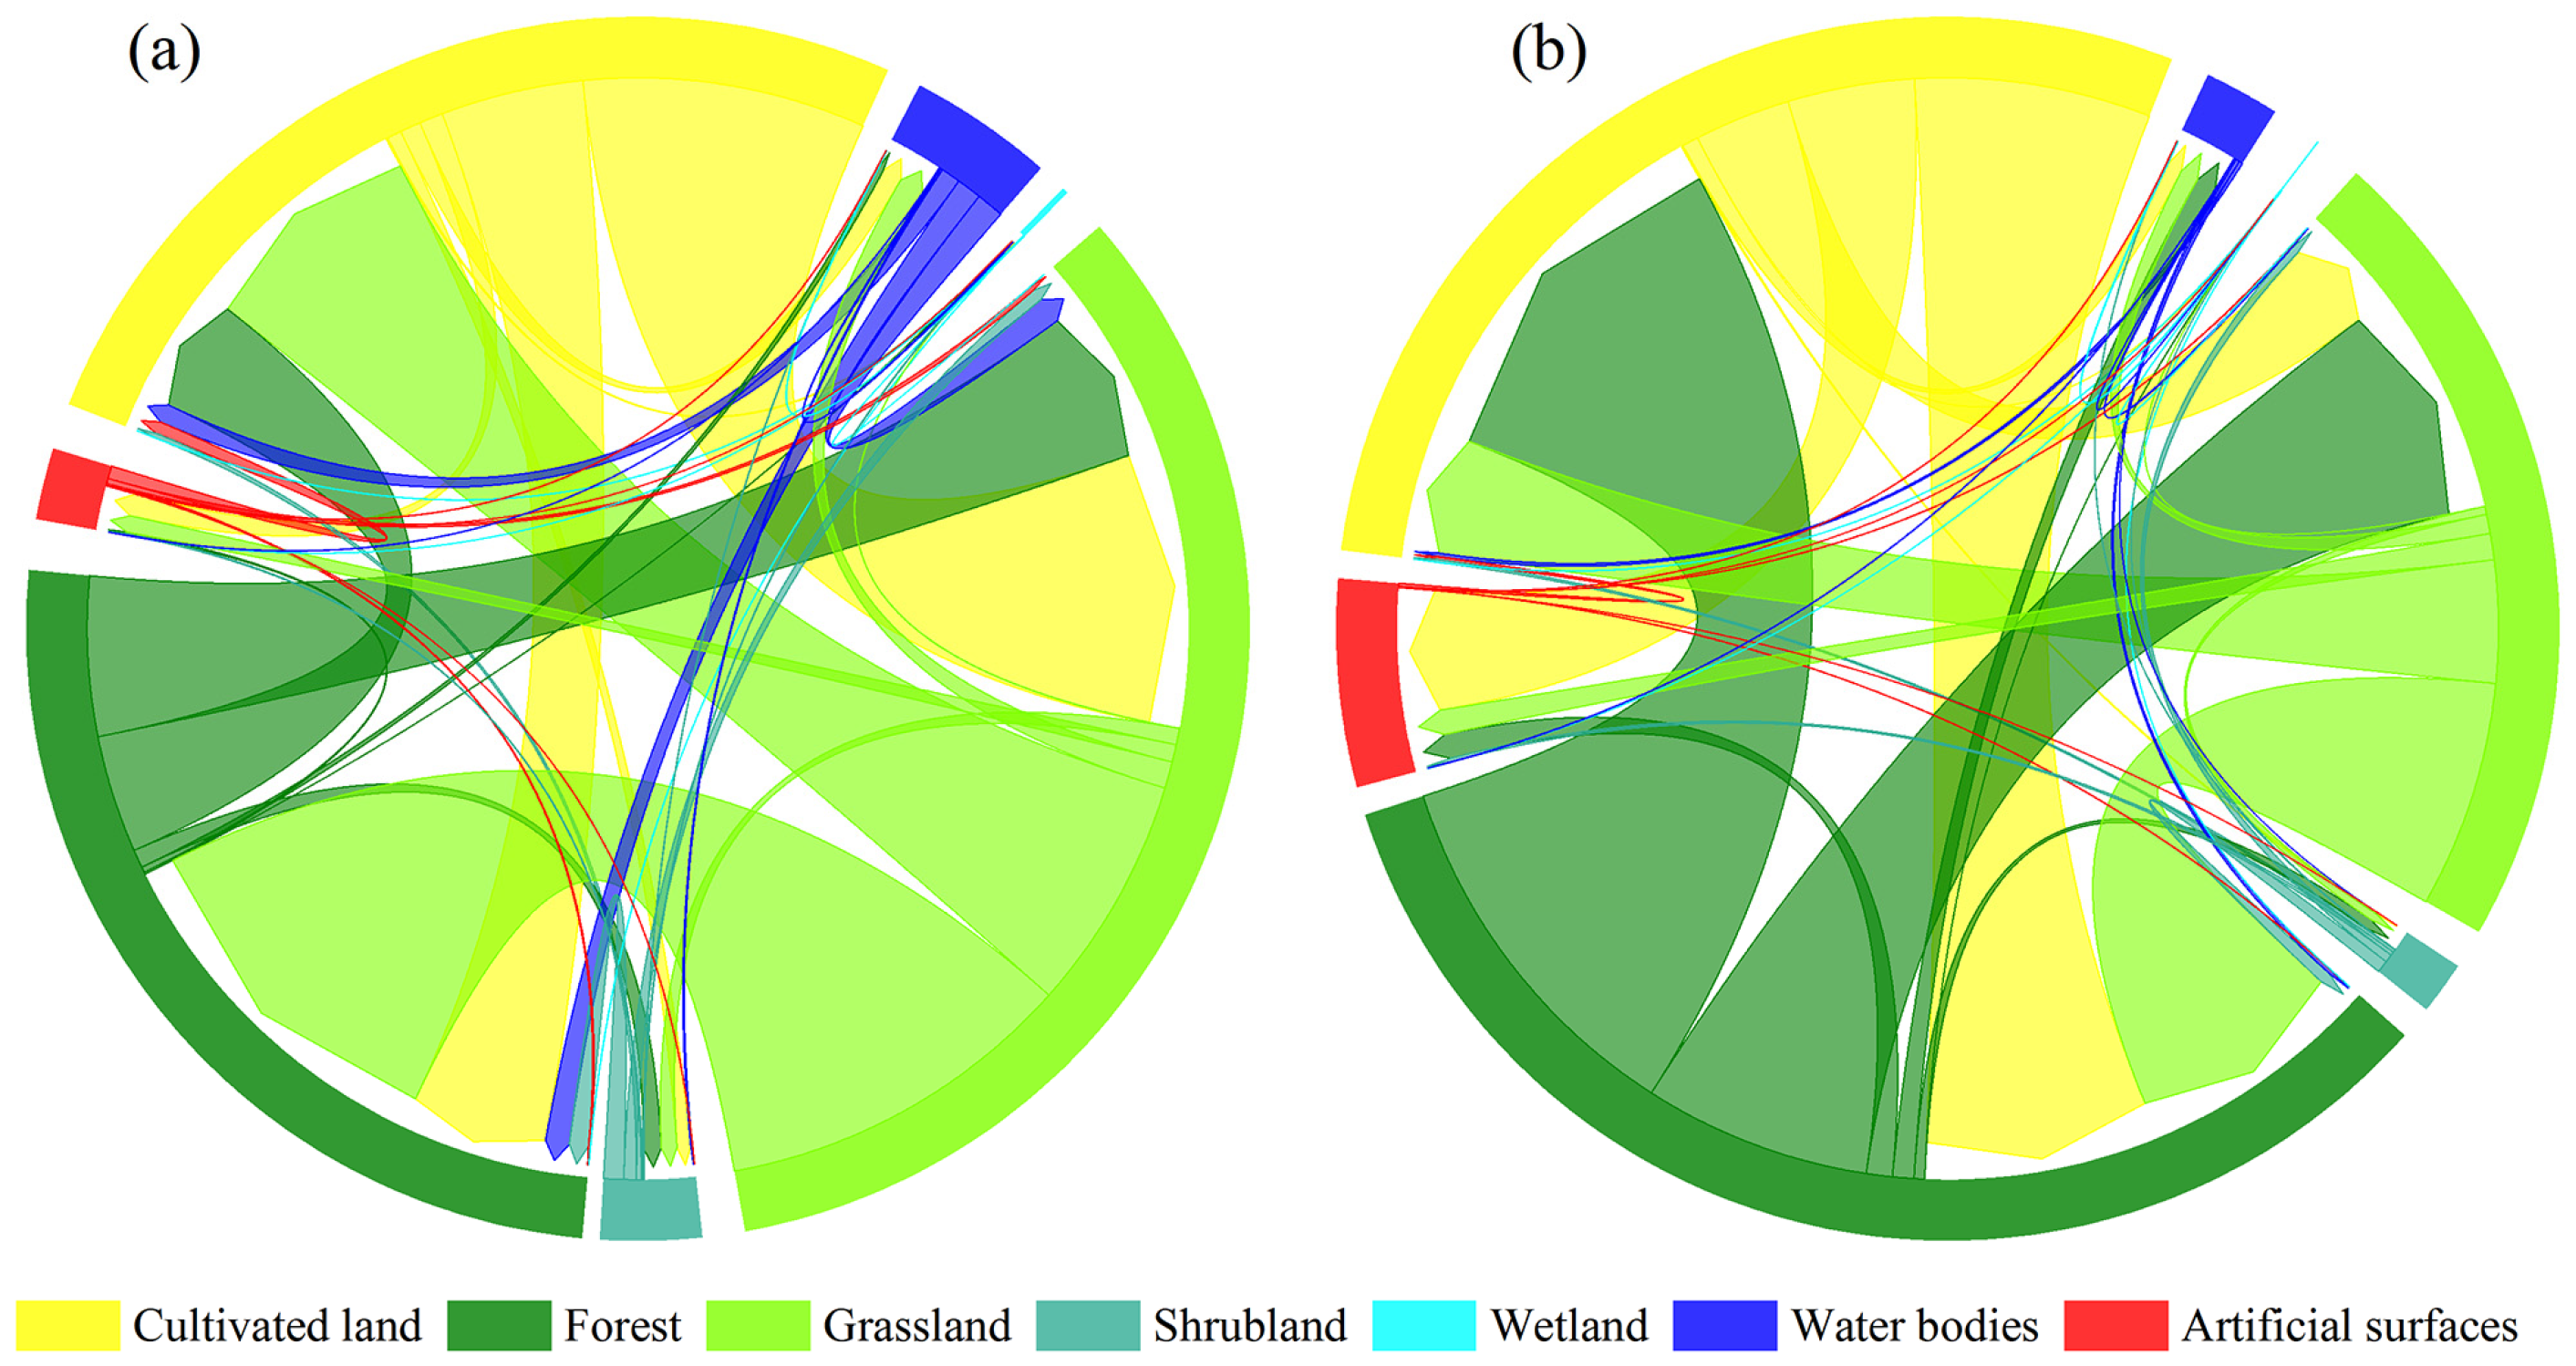
Over the past 20 years, the area of both artificial surfaces and water bodies in Guizhou Province has increased significantly; wetlands and grasslands have decreased significantly; and cultivated land, forest, and shrubland have decreased slightly. Due to the significant spatial heterogeneity in Guizhou Province, socioeconomic development and climate change are both influencing land use changes. Under the SSP126 scenario, the overall artificial surfaces in the study area expands towards cultivated land and shrubland, while the rapid expansion of forest towards grassland is mainly concentrated in the southwestern region. The trend of land use change in the SSP245 scenario is similar to that in the SSP126 scenario, but there is a significant increase in forest, especially in the northeastern region. Under the SSP585 scenario, the artificial surfaces in the central region rapidly expands towards cultivated land and grassland, while cultivated land in the southeastern region expands rapidly towards forest, and the water bodies also increases significantly compared to the current situation.
(2)
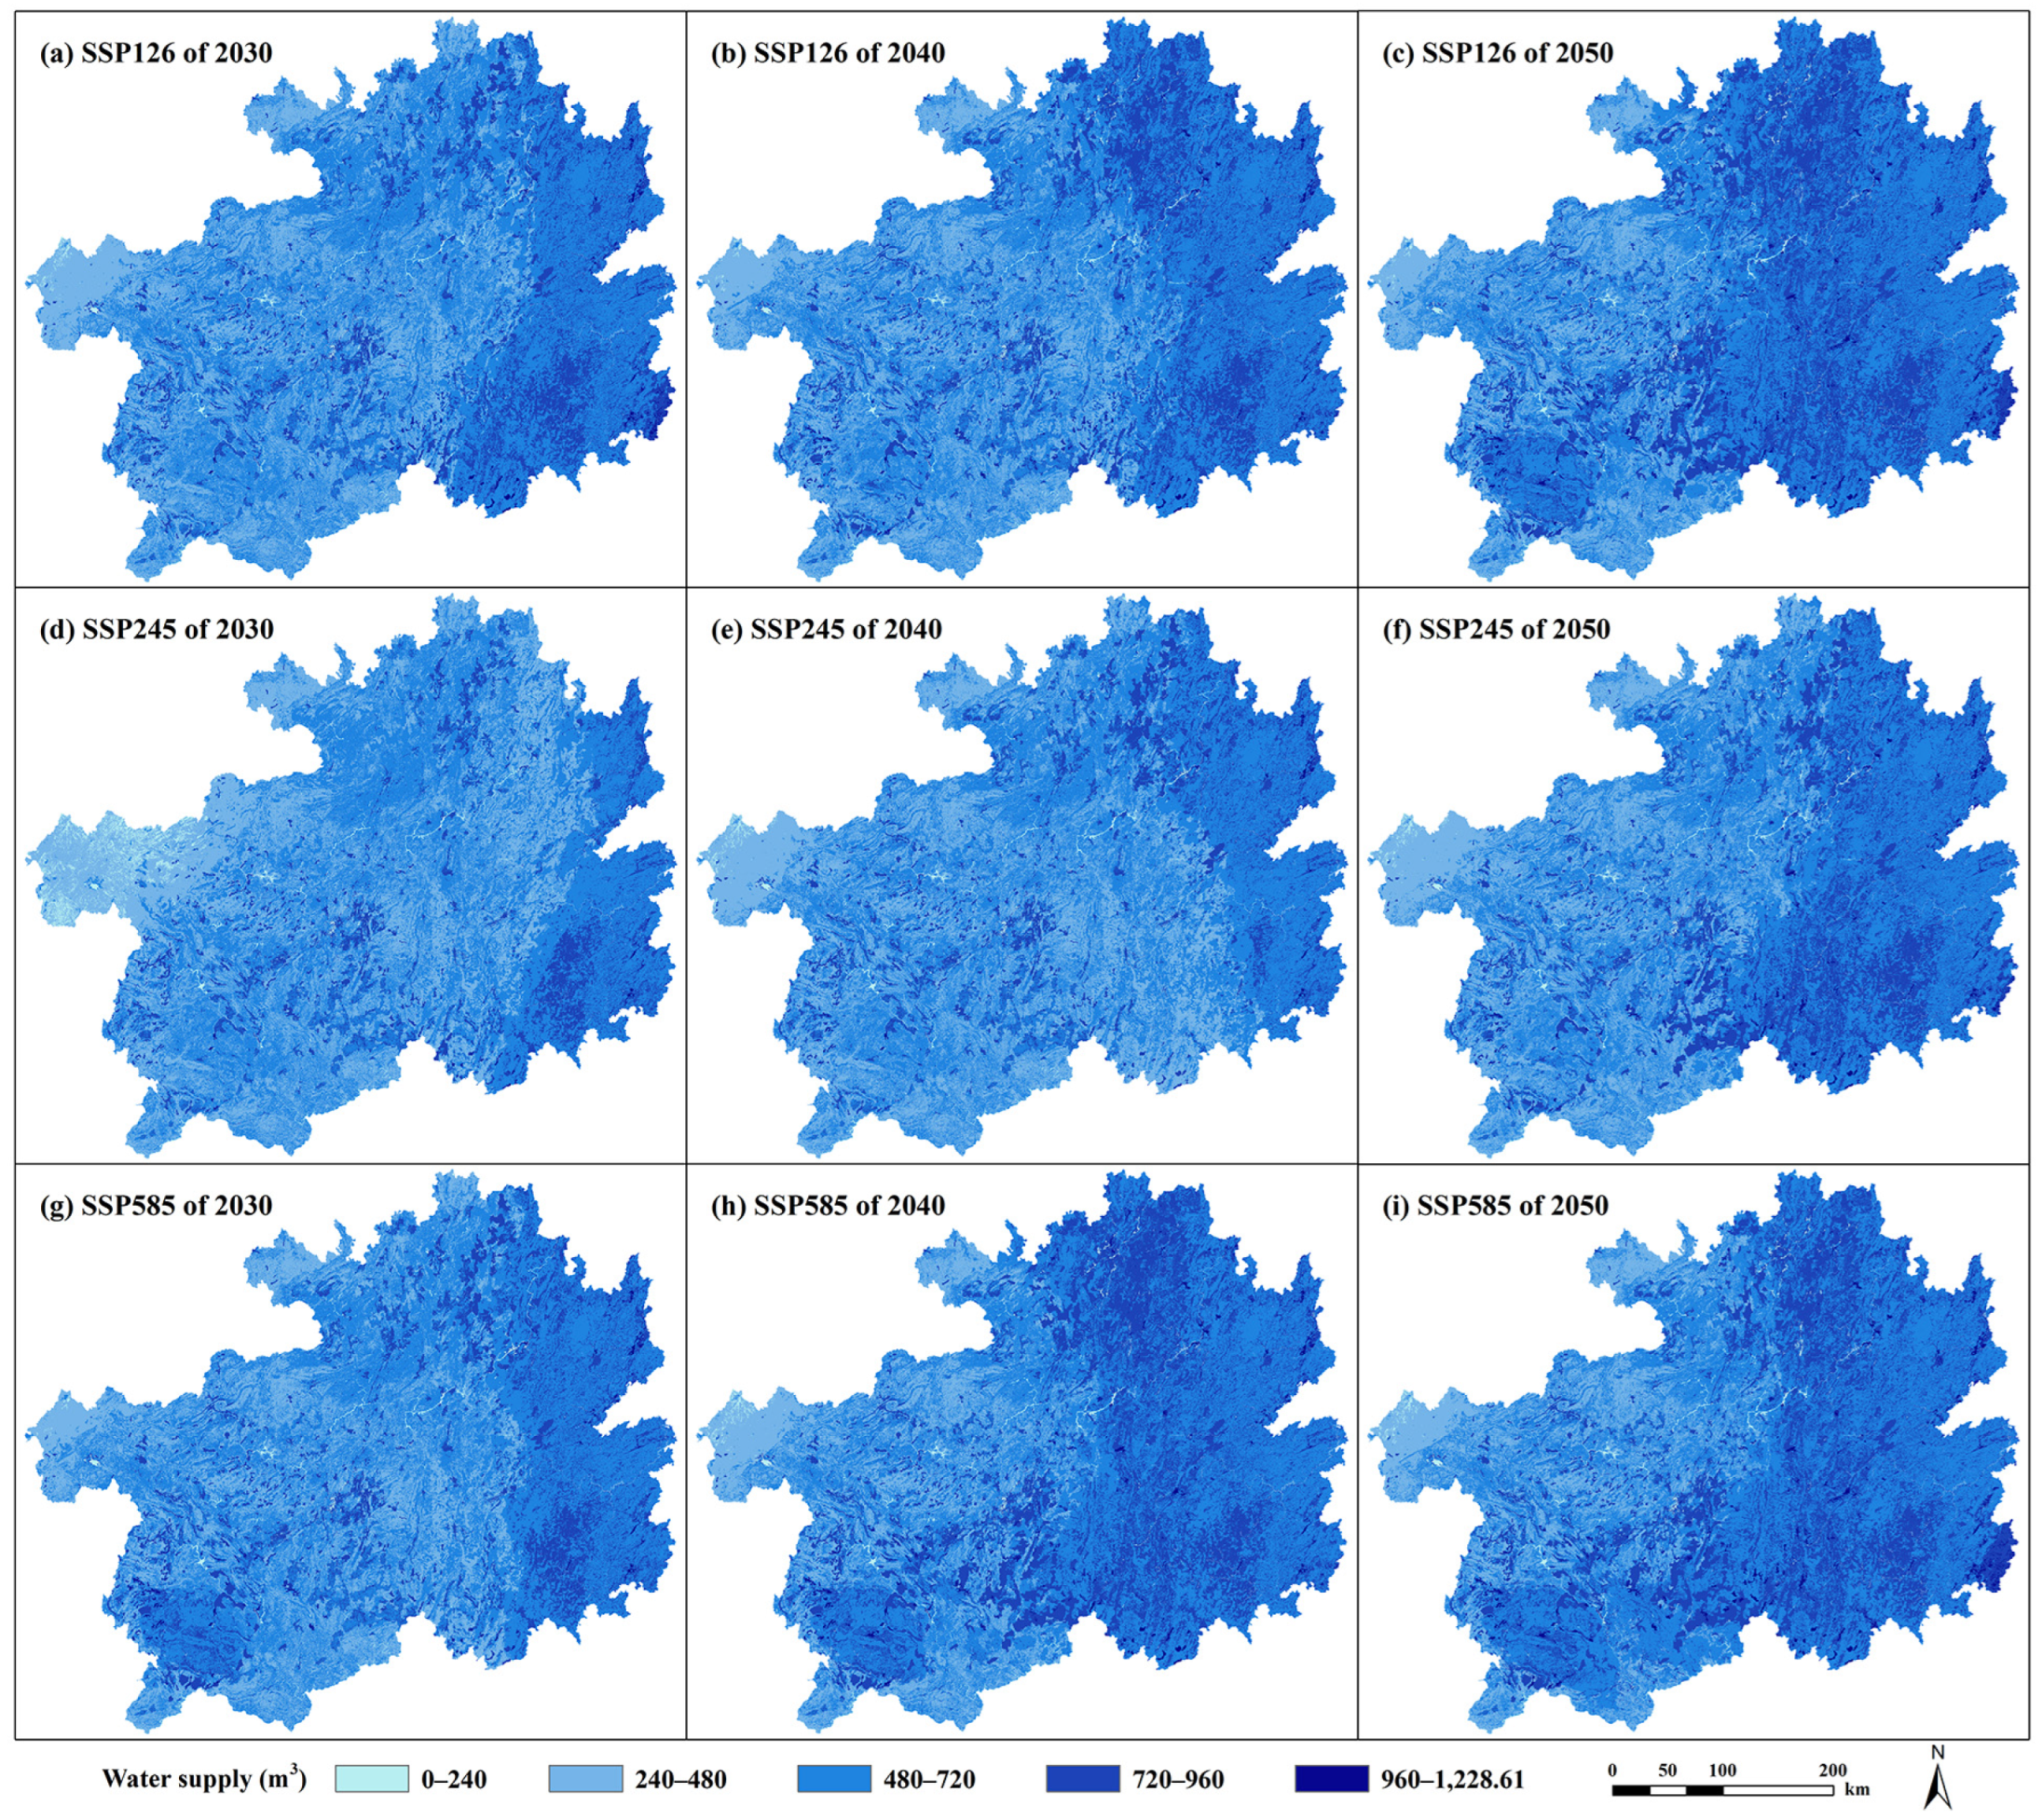
From 2020 to 2050, under the three scenarios, the water yield in Guizhou Province is expected to slightly increase by about 5.22–11.88%, while the water demand will significantly increase by about 29.45–58.84%. The water shortage area is projected to increase by approximately 2708.94–9084.40 km2, and the extent of the shortage will expand by about 23.71–79.50%. The impact of socioeconomic development on the growth of water demand is significant, and climate and land use changes may exacerbate the spatiotemporal heterogeneity of water supply–demand. Under different SSP scenarios, Guizhou Province exhibits complex spatiotemporal patterns in terms of water supply–demand, with a spatial mismatch between water supply and demand.
(3)
According to the predictions based on the SSP-RCP scenarios, future climate change, socioeconomic development, and land use changes collectively exacerbate the imbalance between water supply and demand. Even in the water-rich areas of Guizhou, there is still a risk of localized water scarcity. Based on the framework proposed in this study, future research should continue to refine methods and models for assessing supply and demand, as well as strengthen research in the area of climate change and socioeconomic development on land use and water supply–demand. In addition, in the context of rapid socioeconomic development, reasonable control of urban expansion and population growth, adjusting land use types, appropriately controlling the expansion of artificial surfaces, strengthening the intensive use of artificial surfaces in built-up areas, maintaining the area of cultivated land, and optimizing the spatial allocation of water resources are essential to effectively alleviate the shortage of water supply–demand in the province.

Author Contributions

Conceptualization, C.Y. and L.R.; methodology, Y.W.; software, C.Y.; validation, C.Y., K.X. and L.R.; formal analysis, Y.W.; investigation, C.Y.; resources, L.R.; data curation, K.X.; writing—original draft preparation, C.Y. and L.R; writing—review and editing, C.Y.; visualization, Y.W.; supervision, K.X.; project administration, L.R.; funding acquisition, L.R. All authors have read and agreed to the published version of the manuscript.

Funding

This research was funded by the key project of the “14th Five-Year” National Key R&D. Program “Typical Fragile Ecosystem Protection and Restoration”, grant number “2022YFF1300703”.

Data Availability Statement

The data presented in this study are available on request to the first author. The data have not been made public because the study has not been fully completed.

Acknowledgments

We are thankful for all of the helpful comments provided by the reviewers.

Conflicts of Interest

The authors declare no conflicts of interest.

References

  1. Yang, D.W.; Yang, Y.T.; Xia, J. Hydrological cycle and water resources in a changing world: A review. Geogr. Sustain. 2021, 2, 115–122. [Google Scholar] [CrossRef]
  2. Dolan, F.; Lamontagne, J.; Link, R.; Hejazi, M.; Reed, P.; Edmonds, J. Evaluating the economic impact of water scarcity in a changing world. Nat. Commun. 2021, 12, 1915. [Google Scholar] [CrossRef]
  3. Rodell, M.; Famiglietti, J.S.; Wiese, D.N.; Reager, J.T.; Beaudoing, H.K.; Landerer, F.W.; Lo, M.H. Emerging trends in global freshwater availability. Nature 2018, 557, 651–659. [Google Scholar] [CrossRef] [PubMed]
  4. Miralles-Wilhelm, F. Water is the middle child in global climate policy. Nat. Clim. Chang. 2021, 12, 110–112. [Google Scholar] [CrossRef]
  5. Yoon, J.; Klassert, C.; Selby, P.; Lachaut, T.; Knox, S.; Avisse, N.; Harou, J.; Tilmant, A.; Klauer, B.; Mustafa, D.; et al. A coupled human–natural system analysis of freshwater security under climate and population change. Proc. Natl. Acad. Sci. USA 2021, 118, 14. [Google Scholar] [CrossRef] [PubMed]
  6. Wang, Z.Y.; Li, X.; Mao, Y.T.; Li, L.; Wang, X.R.; Lin, Q. Dynamic simulation of land use change and assessment of carbon storage based on climate change scenarios at the city level: A case study of Bortala, China. Ecol. Indic. 2022, 134, 108499. [Google Scholar] [CrossRef]
  7. Tian, L.; Tao, Y.; Fu, W.X.; Li, T.; Ren, F.; Li, M.Y. Dynamic Simulation of Land Use/Cover Change and Assessment of Forest Ecosystem Carbon Storage under Climate Change Scenarios in Guangdong Province, China. Remote Sens. 2022, 14, 2330. [Google Scholar] [CrossRef]
  8. Wu, J.Y.; Luo, J.G.; Zhang, H.; Qin, S.; Yu, M.J. Projections of land use change and habitat quality assessment by coupling climate change and development patterns. Sci. Total Environ. 2022, 847, 157491. [Google Scholar] [CrossRef]
  9. Chen, D.S.; Li, J.; Yang, X.N.; Zhou, Z.X.; Pan, Y.Q.; Li, M.C. Quantifying water provision service supply, demand and spatial flow for land use optimization: A case study in the YanHe watershed. Ecosyst. Serv. 2020, 43, 101117. [Google Scholar] [CrossRef]
  10. Daneshi, A.; Brouwer, R.; Najafinejad, A.; Panahi, M.; Zarandian, A.; Maghsood, F.F. Modelling the impacts of climate and land use change on water security in a semi-arid forested watershed using InVEST. J. Hydrol. 2021, 593, 125621. [Google Scholar] [CrossRef]
  11. Lin, J.Y.; Huang, J.L.; Prell, C.; Bryan, B.A. Changes in supply and demand mediate the effects of land-use change on freshwater ecosystem services flows. Sci. Total Environ. 2021, 763, 143012. [Google Scholar] [CrossRef]
  12. Tian, J.; Guo, S.L.; Deng, L.L.; Yin, J.B.; Pan, Z.K.; He, S.K.; Li, Q.X. Adaptive optimal allocation of water resources response to future water availability and water demand in the Han River basin, China. Sci. Rep. 2021, 11, 7879. [Google Scholar] [CrossRef]
  13. Abungba, J.A.; Adjei, K.A.; Gyamfi, C.; Odai, S.N.; Pingale, S.M.; Khare, D. Implications of Land Use/Land Cover Changes and Climate Change on Black Volta Basin Future Water Resources in Ghana. Sustainability 2022, 14, 12383. [Google Scholar] [CrossRef]
  14. Li, L.; He, C.Y.; Li, J.W.; Zhang, J.X.; Li, J. The supply and demand of water-related ecosystem services in the Asian water tower and its downstream area. Sci. Total Environ. 2023, 887, 164205. [Google Scholar] [CrossRef] [PubMed]
  15. Gao, F.; Luo, Y.; Zhao, C.J. Effects of Climate and Land-Use Change on the Supply and Demand Relationship of Water Provision Services in the Yellow River Basin. Land 2023, 12, 2089. [Google Scholar] [CrossRef]
  16. Shammout, M.a.W. Calculation and Management of Water Supply and Demand under Land Use/Cover Changes in the Yarmouk River Basin Governorates in Jordan. Land 2023, 12, 1518. [Google Scholar] [CrossRef]
  17. Alizadeh, M.R.; Adamowski, J.; Inam, A. Integrated assessment of localized SSP–RCP narratives for climate change adaptation in coupled human-water systems. Sci. Total Environ. 2022, 823, 153660. [Google Scholar] [CrossRef] [PubMed]
  18. He, C.Y.; Liu, Z.F.; Wu, J.G.; Pan, X.H.; Fang, Z.H.; Li, J.W.; Bryan, B.A. Future global urban water scarcity and potential solutions. Nat. Commun. 2021, 12, 4667. [Google Scholar] [CrossRef] [PubMed]
  19. Singh, R.; Kumar, R. Climate versus demographic controls on water availability across India at 1.5 °C, 2.0 °C and 3.0 °C global warming levels. Glob. Planet. Chang. 2019, 177, 1–9. [Google Scholar] [CrossRef]
  20. Nicolaidis Lindqvist, A.; Fornell, R.; Prade, T.; Khalil, S.; Tufvesson, L.; Kopainsky, B. Impacts of future climate on local water supply and demand—A socio-hydrological case study in the Nordic region. J. Hydrol-Reg. Stud. 2022, 41, 101066. [Google Scholar] [CrossRef]
  21. O’Neill, B.C.; Tebaldi, C.; van Vuuren, D.P.; Eyring, V.; Friedlingstein, P.; Hurtt, G.; Knutti, R.; Kriegler, E.; Lamarque, J.-F.; Lowe, J.; et al. The Scenario Model Intercomparison Project (ScenarioMIP) for CMIP6. Geosci. Model Dev. 2016, 9, 3461–3482. [Google Scholar] [CrossRef]
  22. O’Neill, B.C.; Carter, T.R.; Ebi, K.; Harrison, P.A.; Kemp-Benedict, E.; Kok, K.; Kriegler, E.; Preston, B.L.; Riahi, K.; Sillmann, J.; et al. Achievements and needs for the climate change scenario framework. Nat. Clim. Chang. 2020, 10, 1074–1084. [Google Scholar] [CrossRef]
  23. Chen, L.; Chang, J.X.; Wang, Y.M.; Guo, A.J.; Liu, Y.Y.; Wang, Q.Q.; Zhu, Y.L.; Zhang, Y.; Xie, Z.Y. Disclosing the future food security risk of China based on crop production and water scarcity under diverse socioeconomic and climate scenarios. Sci. Total Environ. 2021, 790, 148110. [Google Scholar] [CrossRef]
  24. Liu, X.Q.; Liu, Y.S.; Wang, Y.S.; Liu, Z.J. Evaluating potential impacts of land use changes on water supply–demand under multiple development scenarios in dryland region. J. Hydrol. 2022, 610, 127811. [Google Scholar] [CrossRef]
  25. Xu, Z.P.; Li, Y.P.; Huang, G.H.; Wang, S.G.; Liu, Y.R. A multi-scenario ensemble streamflow forecast method for Amu Darya River Basin under considering climate and land-use changes. J. Hydrol. 2021, 598, 126276. [Google Scholar] [CrossRef]
  26. Liu, X.P.; Liang, X.; Li, X.; Xu, X.C.; Ou, J.P.; Chen, Y.M.; Li, S.Y.; Wang, S.J.; Pei, F.S. A future land use simulation model (FLUS) for simulating multiple land use scenarios by coupling human and natural effects. Landscape Urban Plan. 2017, 168, 94–116. [Google Scholar] [CrossRef]
  27. Zhang, P.; Liu, L.; Yang, L.W.; Zhao, J.; Li, Y.Y.; Qi, Y.T.; Ma, X.N.; Cao, L. Exploring the response of ecosystem service value to land use changes under multiple scenarios coupling a mixed-cell cellular automata model and system dynamics model in Xi’an, China. Ecol. Indic. 2023, 147, 110009. [Google Scholar] [CrossRef]
  28. Liang, X.; Guan, Q.F.; Clarke, K.C.; Liu, S.S.; Wang, B.Y.; Yao, Y. Understanding the drivers of sustainable land expansion using a patch-generating land use simulation (PLUS) model: A case study in Wuhan, China. Comput. Environ. Urban 2021, 85, 101569. [Google Scholar] [CrossRef]
  29. Li, D.L.; Wu, S.Y.; Liu, L.B.; Liang, Z.; Li, S.C. Evaluating regional water security through a freshwater ecosystem service flow model: A case study in Beijing-Tianjian-Hebei region, China. Ecol. Indic. 2017, 81, 159–170. [Google Scholar] [CrossRef]
  30. Pei, H.W.; Liu, M.Z.; Shen, Y.J.; Xu, K.; Zhang, H.J.; Li, Y.L.; Luo, J.M. Quantifying impacts of climate dynamics and land-use changes on water yield service in the agro-pastoral ecotone of northern China. Sci. Total Environ. 2022, 809, 151153. [Google Scholar] [CrossRef] [PubMed]
  31. Qiu, S.J.; Peng, J.; Dong, J.Q.; Wang, X.Y.; Ding, Z.H.; Zhang, H.B.; Mao, Q.; Liu, H.Y.; Quine, T.A.; Meersmans, J. Understanding the relationships between ecosystem services and associated social-ecological drivers in a karst region: A case study of Guizhou Province, China. Prog. Phys. Geog. 2020, 45, 98–114. [Google Scholar] [CrossRef]
  32. Chen, H.S.; Fu, Z.Y.; Zhang, W.; Nie, Y.P. Soil water processes and vegetation restoration in karst regions of southwest China. Chin. J. Nat. 2018, 40, 41–46. (In Chinese) [Google Scholar]
  33. Liu, Z.J.; Li, B.; Chen, M.Y.; Li, T. Evaluation on sustainability of water resource in karst area based on the emergy ecological footprint model and analysis of its driving factors: A case study of Guiyang city, China. Environ. Sci. Pollut. R. 2021, 28, 49232–49243. [Google Scholar] [CrossRef]
  34. Zhou, Z.Q.; Su, W.C.; Zheng, Q.W. Evolution characteristics of water resource ecological footprint of Guizhou province from 2007 to 2016. Bull. Soil Water Conserve. 2019, 39, 227–233. (In Chinese) [Google Scholar]
  35. Wang, Y.M.; Zhang, Z.X.; Chen, X. Spatiotemporal change in ecosystem service value in response to land use change in Guizhou Province, southwest China. Ecol. Indic. 2022, 144, 109514. [Google Scholar] [CrossRef]
  36. Cai, H.Y.; Yang, X.H.; Wang, K.J.; Xiao, L.L. Is Forest Restoration in the Southwest China Karst Promoted Mainly by Climate Change or Human-Induced Factors? Remote Sens. 2014, 6, 9895–9910. [Google Scholar] [CrossRef]
  37. Peng, J.; Tian, L.; Zhang, Z.M.; Zhao, Y.; Green, S.M.; Quine, T.A.; Liu, H.Y.; Meersmans, J. Distinguishing the impacts of land use and climate change on ecosystem services in a karst landscape in China. Ecosyst. Serv. 2020, 46, 1011199. [Google Scholar] [CrossRef]
  38. Thrasher, B.; Wang, W.L.; Michaelis, A.; Melton, F.; Lee, T.; Nemani, R. NASA Global Daily Downscaled Projections, CMIP6. Sci. Data 2022, 9, 262. [Google Scholar] [CrossRef] [PubMed]
  39. Zhao, Y.M.; Dong, N.P.; Li, Z.S.; Zhang, W.; Yang, M.X.; Wang, H. Future precipitation, hydrology and hydropower generation in the Yalong River Basin: Projections and analysis. J. Hydrol. 2021, 602, 126738. [Google Scholar] [CrossRef]
  40. Chen, Y.D.; Guo, F.; Wang, J.C.; Cai, W.J.; Wang, C.; Wang, K.C. Provincial and gridded population projection for China under shared socioeconomic pathways from 2010 to 2100. Sci. Data 2020, 7, 83. [Google Scholar] [CrossRef] [PubMed]
  41. Murakami, D.; Yoshida, T.; Yamagata, Y. Gridded GDP Projections Compatible with the Five SSPs (Shared Socioeconomic Pathways). Front. Built Environ. 2021, 7, 760306. [Google Scholar] [CrossRef]
  42. Stouffer, R.J.; Eyring, V.; Meehl, G.A.; Bony, S.; Senior, C.; Stevens, B.; Taylor, K.E. CMIP5 Scientific Gaps and Recommendations for CMIP6. Bull. Am. Meteorol. Soc. 2017, 98, 95–105. [Google Scholar] [CrossRef]
  43. Shi, M.J.; Wu, H.Q.; Jiang, P.A.; Zheng, K.; Liu, Z.; Dong, T.; He, P.X.; Fan, X. Food-water-land-ecosystem nexus in typical Chinese dryland under different future scenarios. Sci. Total Environ. 2023, 880, 163183. [Google Scholar] [CrossRef]
  44. Deng, C.X.; Zhu, D.M.; Nie, X.D.; Liu, C.C.; Zhang, G.Y.; Liu, Y.J.; Li, Z.W.; Wang, S.Y.; Ma, Y.C. Precipitation and urban expansion caused jointly the spatiotemporal dislocation between supply and demand of water provision service. J. Environ. Manag. 2021, 299, 113660. [Google Scholar] [CrossRef] [PubMed]
  45. Stanford University; University of Minnesota; Chinese Academy of Sciences; The Nature Conservancy; World Wildlife Fund; Stockholm Resilience Centre; the Royal Swedish Academy of Sciences. InVEST 3.14.1. Available online: https://naturalcapitalproject.stanford.edu/software/invest (accessed on 14 December 2023).
  46. Zhang, L.; Hickel, K.; Dawes, W.R.; Chiew, F.H.S.; Western, A.W.; Briggs, P.R. A rational function approach for estimating mean annual evapotranspiration. Water Resour. Res. 2004, 40, W02502. [Google Scholar] [CrossRef]
  47. Donohue, R.J.; Roderick, M.L.; McVicar, T.R. Roots, storms and soil pores: Incorporating key ecohydrological processes into Budyko’s hydrological model. J. Hydrol. 2012, 436–437, 35–50. [Google Scholar] [CrossRef]
  48. Gao, X.R.; Zhao, Q.; Zhao, X.N.; Wu, P.T.; Pan, W.X.; Gao, X.D.; Sun, M. Temporal and spatial evolution of the standardized precipitation evapotranspiration index (SPEI) in the Loess Plateau under climate change from 2001 to 2050. Sci. Total Environ. 2017, 595, 191–200. [Google Scholar] [CrossRef] [PubMed]
  49. Allen, R.G.; Pruitt, W.O.; Wright, J.L.; Howell, T.A.; Ventura, F.; Snyder, R.; Itenfisu, D.; Steduto, P.; Berengena, J.; Yrisarry, J.B.; et al. A recommendation on standardized surface resistance for hourly calculation of reference ETo by the FAO56 Penman-Monteith method. Agric. Water Manag. 2006, 81, 1–22. [Google Scholar] [CrossRef]
  50. Zotarelli, L.; Dukes, M.D.; Romero, C.C.; Migliaccio, K.W.; Morgan, K.T. Step by Step Calculation of the Penman-Monteith Evapotranspiration (FAO-56 Method); Institute of Food and Agricultural Sciences, University of Florida: Gainesville, FL, USA, 2010; p. 2. [Google Scholar]
  51. Xiang, H.X.; Zhang, J.; Mao, D.H.; Wang, Z.M.; Qiu, Z.Q.; Yan, H. Identifying spatial similarities and mismatches between supply and demand of ecosystem services for sustainable Northeast China. Ecol. Indic. 2022, 134, 108501. [Google Scholar] [CrossRef]
  52. Wu, J.S.; Fan, X.N.; Li, K.Y.; Wu, Y.W. Assessment of ecosystem service flow and optimization of spatial pattern of supply and demand matching in Pearl River Delta, China. Ecol. Indic. 2023, 153, 110452. [Google Scholar] [CrossRef]
  53. Zhang, X.; Zhang, G.S.; Long, X.; Zhang, Q.; Liu, D.S.; Wu, H.J.; Li, S. Identifying the drivers of water yield ecosystem service: A case study in the Yangtze River Basin, China. Ecol. Indic. 2021, 132, 108304. [Google Scholar] [CrossRef]
  54. Zhai, R.; Tao, F.L.; Chen, Y.; Dai, H.C.; Liu, Z.W.; Fu, B.J. Future water security in the major basins of China under the 1.5 °C and 2.0 °C global warming scenarios. Sci. Total Environ. 2022, 849, 157928. [Google Scholar] [CrossRef] [PubMed]
  55. Boithias, L.; Acuña, V.; Vergoñós, L.; Ziv, G.; Marcé, R.; Sabater, S. Assessment of the water supply: Demand ratios in a Mediterranean basin under different global change scenarios and mitigation alternatives. Sci. Total Environ. 2014, 470–471, 567–577. [Google Scholar] [CrossRef] [PubMed]
  56. Qin, L.Y.; Bai, X.Y.; Wang, S.J.; Zhou, D.Q.; Li, Y.; Peng, T.; Tian, Y.C.; Luo, G.J. Major problems and solutions on surface water resource utilisation in karst mountainous areas. Agric. Water Manag. 2015, 159, 55–65. [Google Scholar] [CrossRef]
Figure 1. Location map of study area and land cover types (2020). (a) is the location of the study area in China; (b) is the land use type map of the study area in 2020; (c) is the topographic map of the study area).
Land 13 00194 g001
Figure 2. LUCC modeling and water supply–demand assessment framework.
Land 13 00194 g002
Figure 3. SD model structure of land use demand change in Guizhou.
Land 13 00194 g003
Figure 4. Driving factors affecting LUCC.
Land 13 00194 g004
Figure 5. Land use transition (a) from 2000 to 2010 and (b) from 2010 to 2020.
Land 13 00194 g005
Figure 6. Comparison between actual and simulated land use types in typical areas in 2020. (a) is actual land use in 2020; (b) is simulated land use in 2020.
Land 13 00194 g006
Figure 7. Projection results of land use demand by the SD model under different scenarios.
Land 13 00194 g007
Figure 8. Prediction results of the land use spatial patterns in different scenarios.
Land 13 00194 g008
Figure 9. Water supply dynamic changes under different scenarios from 2020 to 2050.
Land 13 00194 g009
Figure 10. Spatial distribution of water supply under separate future scenarios.
Land 13 00194 g010
Figure 11. Distribution changes in water supply under each scenario compared with 2020.
Land 13 00194 g011
Figure 12. Water demand dynamic changes under different scenarios from 2020 to 2050.
Land 13 00194 g012
Figure 13. Changes in water demand structure under each scenario compared with 2020.
Land 13 00194 g013
Figure 14. Spatial distribution of water demand under separate future scenarios.
Land 13 00194 g014
Figure 15. Distribution changes in water demand under each scenario compared with 2020.
Land 13 00194 g015
Figure 16. Spatial changes of water supply–demand matching in Guizhou under different scenarios.
Land 13 00194 g016
Figure 17. Areas and percentage of WSDR in different grades under different scenarios. (ac represent scenarios SSP126, SSP245, and SSP585, respectively. Percentage of area and water supply–demand ratio under the four levels of severely imbalanced (Level I), slightly imbalanced (Level II), slightly surplus (Level III), and oversupply (Level IV)).
Land 13 00194 g017
Table 3. Statistical table of land use change in Guizhou Province from 2000 to 2020.
TypeArea (hm2)Dynamic Degree (%)
2000201020202000–20102010–20202000–2020
Cultivated land5,948,706.785,905,757.165,942,897.28−0.07220.0629−0.0049
Forest8,014,740.128,127,763.387,910,406.090.1410−0.2674−0.0651
Grassland3,324,575.343,247,354.983,164,876.19−0.2323−0.2540−0.2402
Shrubland184,335.12189,743.49181,699.650.2934−0.4239−0.0715
Wetland1804.052256.57785.72.5084−6.5182−2.8224
Water bodies75,463.8365,949.57124,507.08−1.26088.87913.2495
Artificial surfaces68,425.4779,225.56292,878.721.578426.967716.4013
Table 4. Accuracy test of land use demand simulation by SD in 2020.
Land Use TypesActual Value in 2020 (hm2)Predicted Value in 2020 (hm2)Relative Error (%)
Cultivated land5,942,897.285,821,780.00−2.04%
Forest7,910,406.098,001,714.931.15%
Grassland3,164,876.193,188,630.000.75%
Shrubland181,699.65182,694.000.55%
Wetland785.70787.780.26%
Water bodies124,507.08127,541.002.44%
Artifial surfaces292,878.72294,903.000.69%
Disclaimer/Publisher’s Note: The statements, opinions and data contained in all publications are solely those of the individual author(s) and contributor(s) and not of MDPI and/or the editor(s). MDPI and/or the editor(s) disclaim responsibility for any injury to people or property resulting from any ideas, methods, instructions or products referred to in the content.

